Estell Manor, NJ Map & Demographics
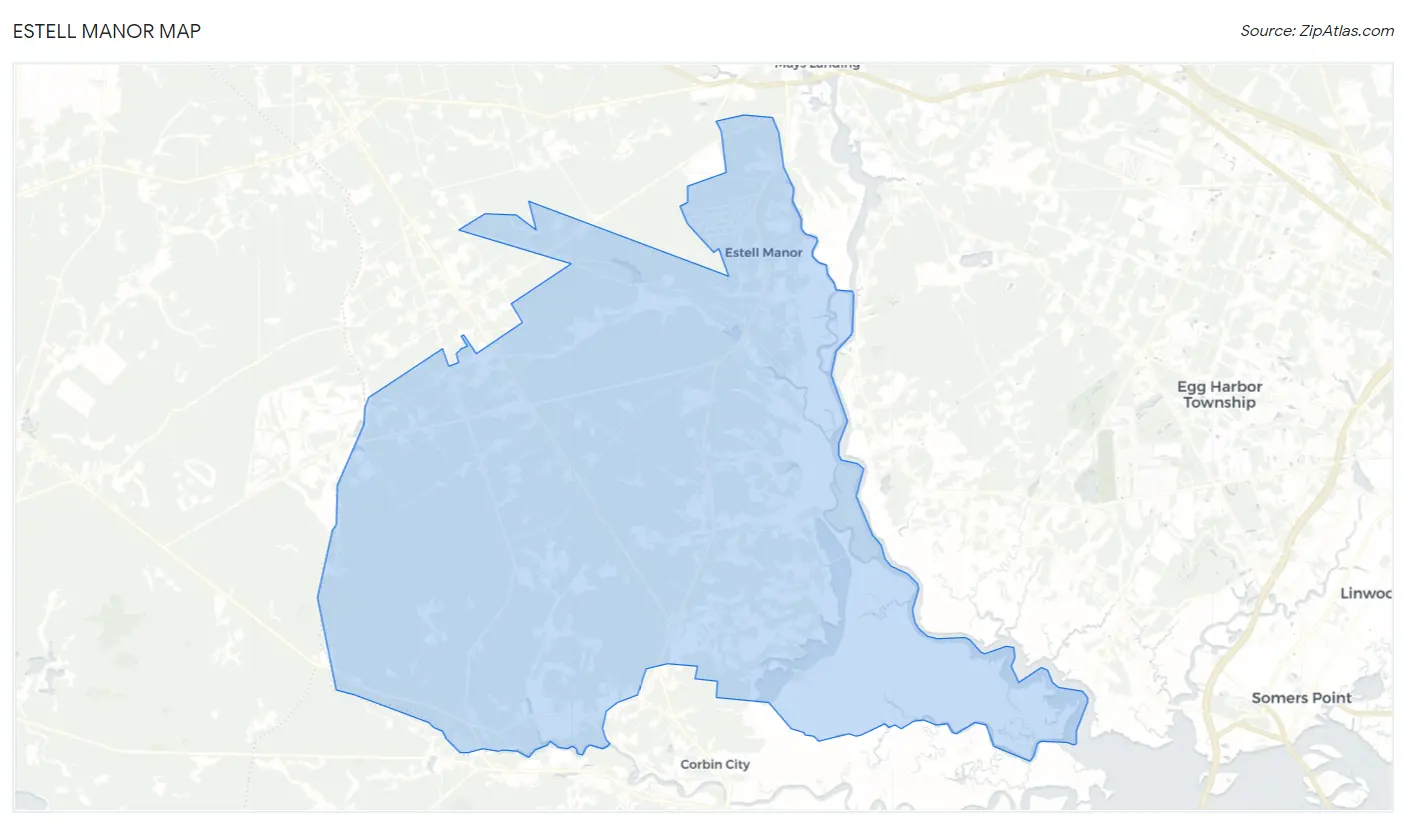
Estell Manor Map
Estell Manor Overview
$47,253
PER CAPITA INCOME
$127,750
AVG FAMILY INCOME
$114,091
AVG HOUSEHOLD INCOME
16.5%
WAGE / INCOME GAP [ % ]
83.5¢/ $1
WAGE / INCOME GAP [ $ ]
0.38
INEQUALITY / GINI INDEX
1,729
TOTAL POPULATION
896
MALE POPULATION
833
FEMALE POPULATION
107.56
MALES / 100 FEMALES
92.97
FEMALES / 100 MALES
40.3
MEDIAN AGE
3.1
AVG FAMILY SIZE
2.9
AVG HOUSEHOLD SIZE
885
LABOR FORCE [ PEOPLE ]
64.1%
PERCENT IN LABOR FORCE
3.7%
UNEMPLOYMENT RATE
Estell Manor Zip Codes
Income in Estell Manor
Income Overview in Estell Manor
Per Capita Income in Estell Manor is $47,253, while median incomes of families and households are $127,750 and $114,091 respectively.
| Characteristic | Number | Measure |
| Per Capita Income | 1,729 | $47,253 |
| Median Family Income | 524 | $127,750 |
| Mean Family Income | 524 | $149,779 |
| Median Household Income | 598 | $114,091 |
| Mean Household Income | 598 | $138,928 |
| Income Deficit | 524 | $0 |
| Wage / Income Gap (%) | 1,729 | 16.47% |
| Wage / Income Gap ($) | 1,729 | 83.53¢ per $1 |
| Gini / Inequality Index | 1,729 | 0.38 |
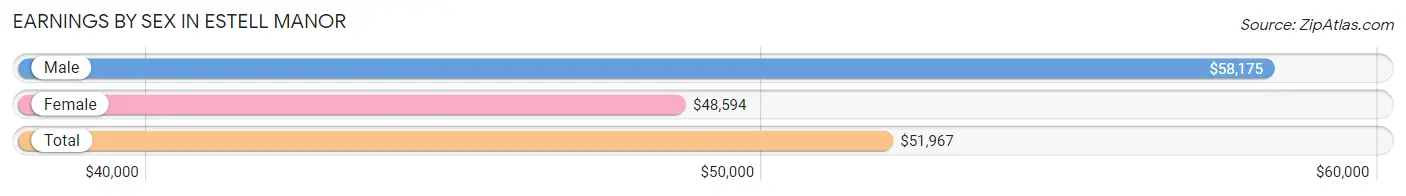
Earnings by Sex in Estell Manor
Average Earnings in Estell Manor are $51,967, $58,175 for men and $48,594 for women, a difference of 16.5%.
| Sex | Number | Average Earnings |
| Male | 547 (54.2%) | $58,175 |
| Female | 463 (45.8%) | $48,594 |
| Total | 1,010 (100.0%) | $51,967 |
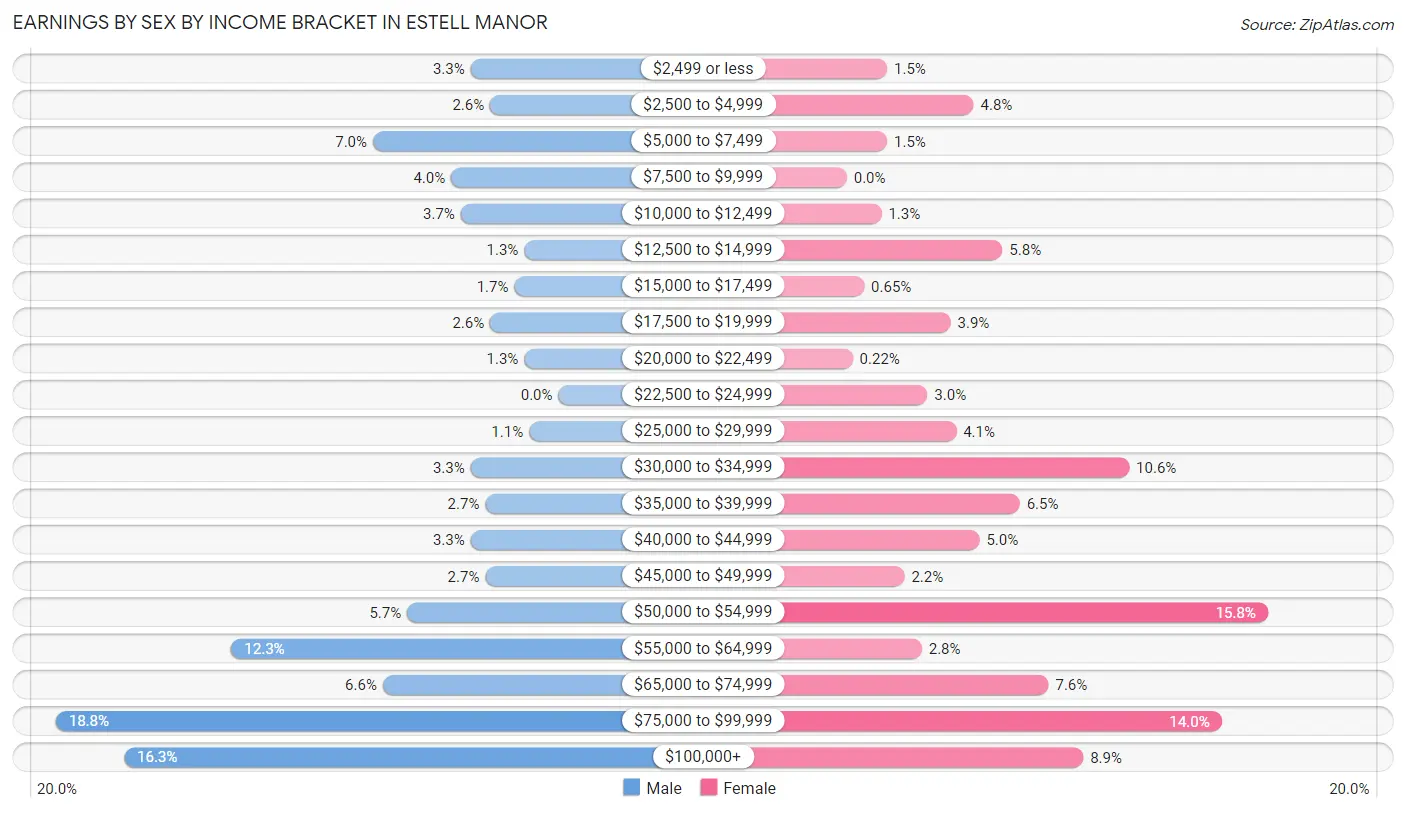
Earnings by Sex by Income Bracket in Estell Manor
The most common earnings brackets in Estell Manor are $75,000 to $99,999 for men (103 | 18.8%) and $50,000 to $54,999 for women (73 | 15.8%).
| Income | Male | Female |
| $2,499 or less | 18 (3.3%) | 7 (1.5%) |
| $2,500 to $4,999 | 14 (2.6%) | 22 (4.8%) |
| $5,000 to $7,499 | 38 (7.0%) | 7 (1.5%) |
| $7,500 to $9,999 | 22 (4.0%) | 0 (0.0%) |
| $10,000 to $12,499 | 20 (3.7%) | 6 (1.3%) |
| $12,500 to $14,999 | 7 (1.3%) | 27 (5.8%) |
| $15,000 to $17,499 | 9 (1.7%) | 3 (0.6%) |
| $17,500 to $19,999 | 14 (2.6%) | 18 (3.9%) |
| $20,000 to $22,499 | 7 (1.3%) | 1 (0.2%) |
| $22,500 to $24,999 | 0 (0.0%) | 14 (3.0%) |
| $25,000 to $29,999 | 6 (1.1%) | 19 (4.1%) |
| $30,000 to $34,999 | 18 (3.3%) | 49 (10.6%) |
| $35,000 to $39,999 | 15 (2.7%) | 30 (6.5%) |
| $40,000 to $44,999 | 18 (3.3%) | 23 (5.0%) |
| $45,000 to $49,999 | 15 (2.7%) | 10 (2.2%) |
| $50,000 to $54,999 | 31 (5.7%) | 73 (15.8%) |
| $55,000 to $64,999 | 67 (12.2%) | 13 (2.8%) |
| $65,000 to $74,999 | 36 (6.6%) | 35 (7.6%) |
| $75,000 to $99,999 | 103 (18.8%) | 65 (14.0%) |
| $100,000+ | 89 (16.3%) | 41 (8.9%) |
| Total | 547 (100.0%) | 463 (100.0%) |
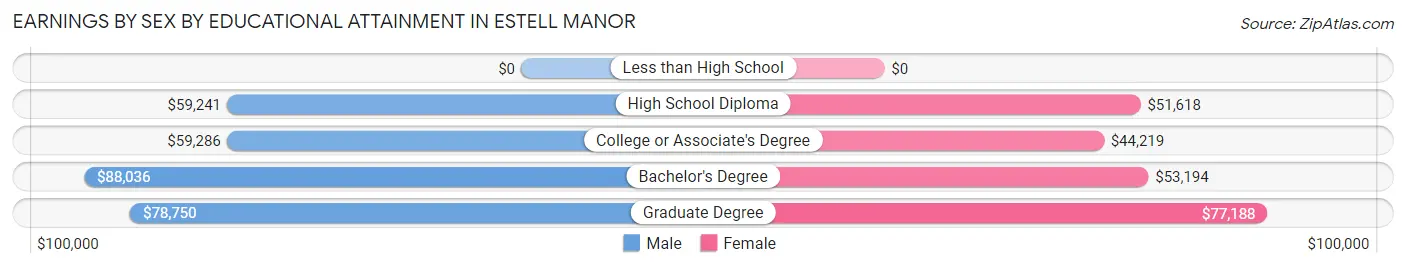
Earnings by Sex by Educational Attainment in Estell Manor
Average earnings in Estell Manor are $68,077 for men and $52,542 for women, a difference of 22.8%. Men with an educational attainment of bachelor's degree enjoy the highest average annual earnings of $88,036, while those with high school diploma education earn the least with $59,241. Women with an educational attainment of graduate degree earn the most with the average annual earnings of $77,188, while those with college or associate's degree education have the smallest earnings of $44,219.
| Educational Attainment | Male Income | Female Income |
| Less than High School | - | - |
| High School Diploma | $59,241 | $51,618 |
| College or Associate's Degree | $59,286 | $44,219 |
| Bachelor's Degree | $88,036 | $53,194 |
| Graduate Degree | $78,750 | $77,188 |
| Total | $68,077 | $52,542 |
Family Income in Estell Manor
Family Income Brackets in Estell Manor
According to the Estell Manor family income data, there are 161 families falling into the $100,000 to $149,999 income range, which is the most common income bracket and makes up 30.7% of all families.
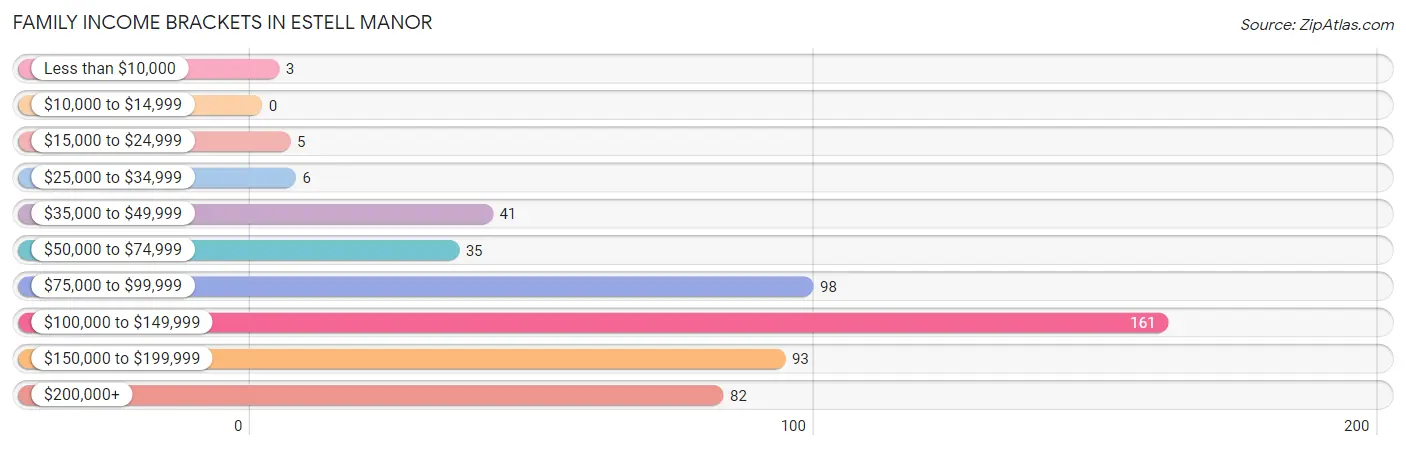
| Income Bracket | # Families | % Families |
| Less than $10,000 | 3 | 0.6% |
| $10,000 to $14,999 | 0 | 0.0% |
| $15,000 to $24,999 | 5 | 1.0% |
| $25,000 to $34,999 | 6 | 1.1% |
| $35,000 to $49,999 | 41 | 7.8% |
| $50,000 to $74,999 | 35 | 6.7% |
| $75,000 to $99,999 | 98 | 18.7% |
| $100,000 to $149,999 | 161 | 30.7% |
| $150,000 to $199,999 | 93 | 17.7% |
| $200,000+ | 82 | 15.6% |
Family Income by Famaliy Size in Estell Manor
6-person families (9 | 1.7%) account for the highest median family income in Estell Manor with $218,750 per family, while 2-person families (236 | 45.0%) have the highest median income of $55,469 per family member.
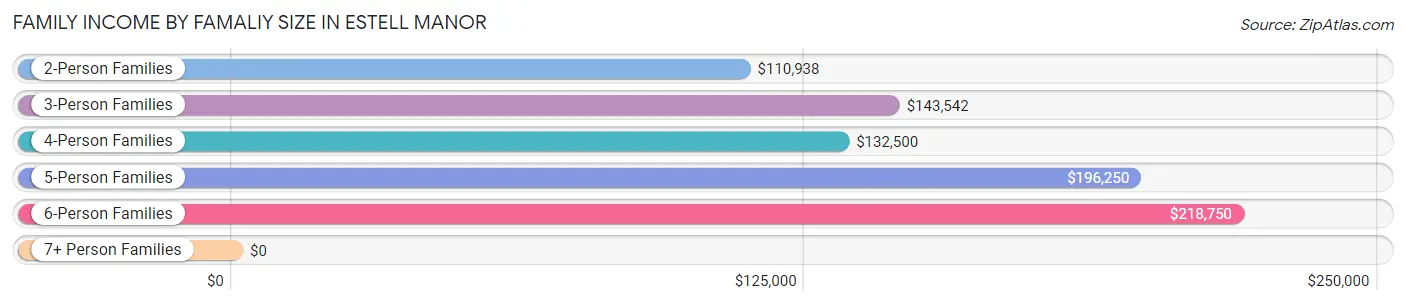
| Income Bracket | # Families | Median Income |
| 2-Person Families | 236 (45.0%) | $110,938 |
| 3-Person Families | 99 (18.9%) | $143,542 |
| 4-Person Families | 144 (27.5%) | $132,500 |
| 5-Person Families | 36 (6.9%) | $196,250 |
| 6-Person Families | 9 (1.7%) | $218,750 |
| 7+ Person Families | 0 (0.0%) | $0 |
| Total | 524 (100.0%) | $127,750 |
Family Income by Number of Earners in Estell Manor
The median family income in Estell Manor is $127,750, with families comprising 3+ earners (83) having the highest median family income of $184,583, while families with no earners (79) have the lowest median family income of $53,068, accounting for 15.8% and 15.1% of families, respectively.
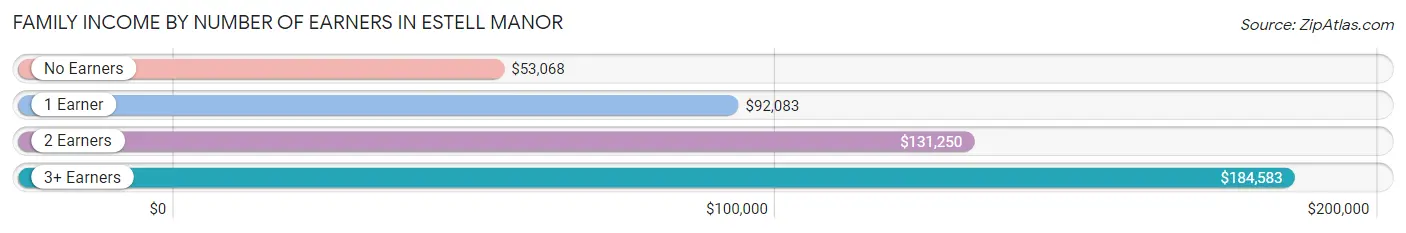
| Number of Earners | # Families | Median Income |
| No Earners | 79 (15.1%) | $53,068 |
| 1 Earner | 105 (20.0%) | $92,083 |
| 2 Earners | 257 (49.0%) | $131,250 |
| 3+ Earners | 83 (15.8%) | $184,583 |
| Total | 524 (100.0%) | $127,750 |
Household Income in Estell Manor
Household Income Brackets in Estell Manor
With 174 households falling in the category, the $100,000 to $149,999 income range is the most frequent in Estell Manor, accounting for 29.1% of all households.
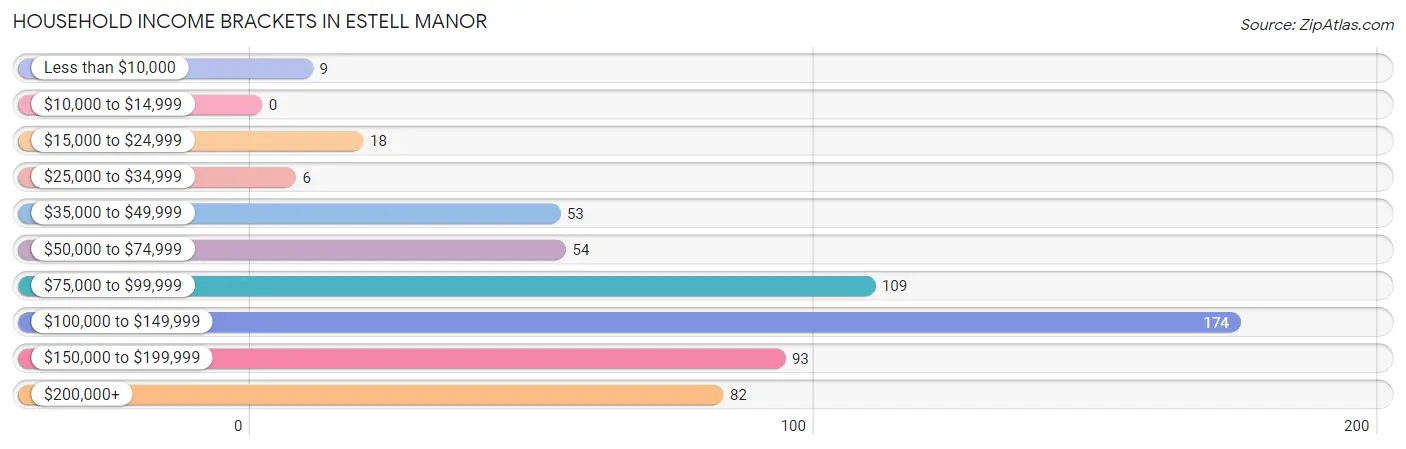
| Income Bracket | # Households | % Households |
| Less than $10,000 | 9 | 1.5% |
| $10,000 to $14,999 | 0 | 0.0% |
| $15,000 to $24,999 | 18 | 3.0% |
| $25,000 to $34,999 | 6 | 1.0% |
| $35,000 to $49,999 | 53 | 8.9% |
| $50,000 to $74,999 | 54 | 9.0% |
| $75,000 to $99,999 | 109 | 18.2% |
| $100,000 to $149,999 | 174 | 29.1% |
| $150,000 to $199,999 | 93 | 15.6% |
| $200,000+ | 82 | 13.7% |
Household Income by Householder Age in Estell Manor
The median household income in Estell Manor is $114,091, with the highest median household income of $135,625 found in the 25 to 44 years age bracket for the primary householder. A total of 157 households (26.3%) fall into this category.
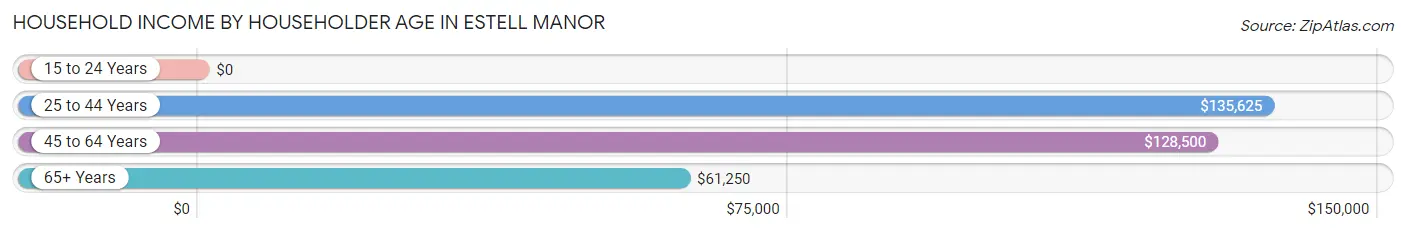
| Income Bracket | # Households | Median Income |
| 15 to 24 Years | 0 (0.0%) | $0 |
| 25 to 44 Years | 157 (26.3%) | $135,625 |
| 45 to 64 Years | 298 (49.8%) | $128,500 |
| 65+ Years | 143 (23.9%) | $61,250 |
| Total | 598 (100.0%) | $114,091 |
Poverty in Estell Manor
Income Below Poverty by Sex and Age in Estell Manor
With 1.7% poverty level for males and 1.8% for females among the residents of Estell Manor, 45 to 54 year old males and 75 year old and over females are the most vulnerable to poverty, with 11 males (7.8%) and 3 females (8.1%) in their respective age groups living below the poverty level.
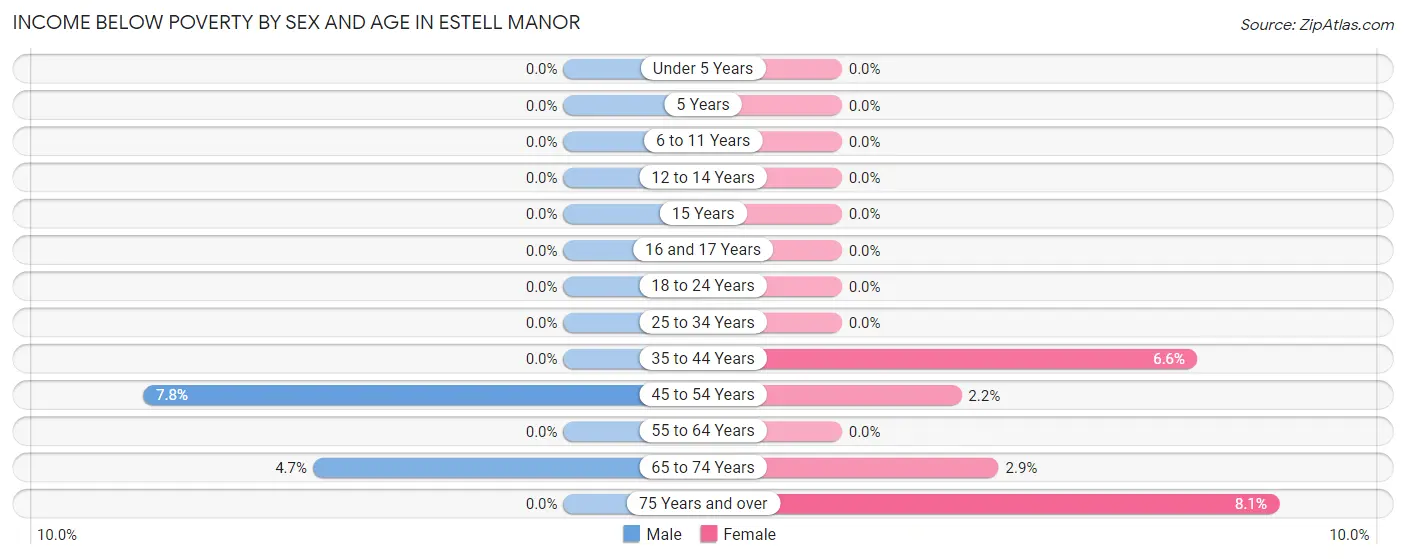
| Age Bracket | Male | Female |
| Under 5 Years | 0 (0.0%) | 0 (0.0%) |
| 5 Years | 0 (0.0%) | 0 (0.0%) |
| 6 to 11 Years | 0 (0.0%) | 0 (0.0%) |
| 12 to 14 Years | 0 (0.0%) | 0 (0.0%) |
| 15 Years | 0 (0.0%) | 0 (0.0%) |
| 16 and 17 Years | 0 (0.0%) | 0 (0.0%) |
| 18 to 24 Years | 0 (0.0%) | 0 (0.0%) |
| 25 to 34 Years | 0 (0.0%) | 0 (0.0%) |
| 35 to 44 Years | 0 (0.0%) | 6 (6.6%) |
| 45 to 54 Years | 11 (7.8%) | 3 (2.2%) |
| 55 to 64 Years | 0 (0.0%) | 0 (0.0%) |
| 65 to 74 Years | 4 (4.6%) | 3 (2.9%) |
| 75 Years and over | 0 (0.0%) | 3 (8.1%) |
| Total | 15 (1.7%) | 15 (1.8%) |
Income Above Poverty by Sex and Age in Estell Manor
According to the poverty statistics in Estell Manor, males aged under 5 years and females aged under 5 years are the age groups that are most secure financially, with 100.0% of males and 100.0% of females in these age groups living above the poverty line.
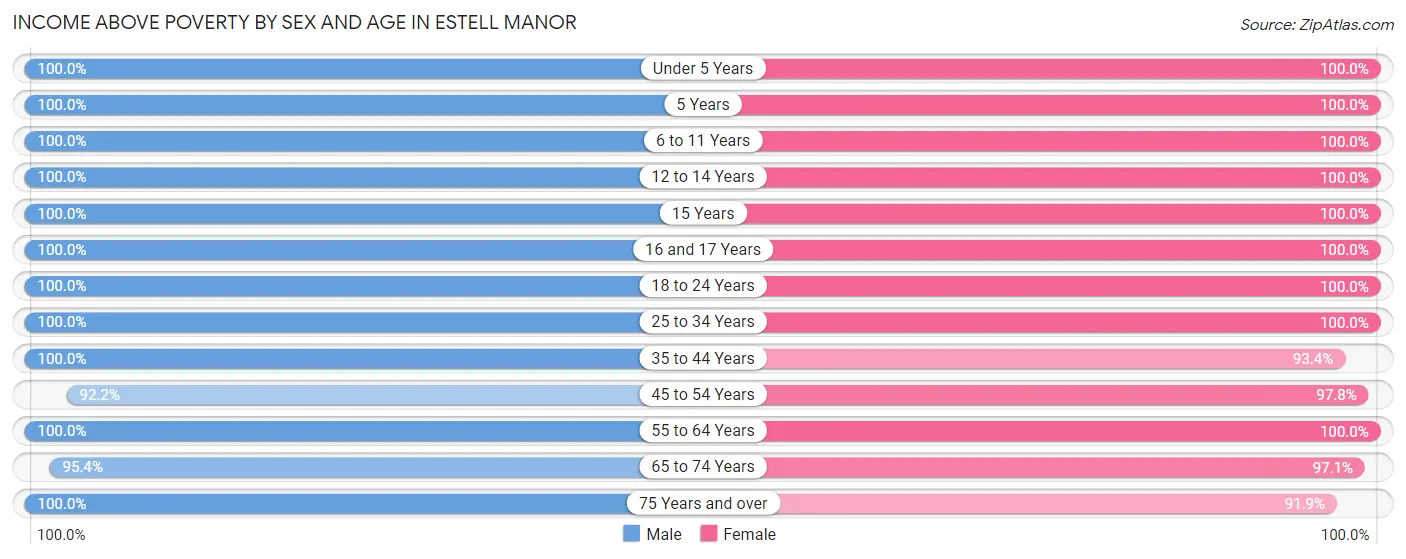
| Age Bracket | Male | Female |
| Under 5 Years | 69 (100.0%) | 33 (100.0%) |
| 5 Years | 6 (100.0%) | 6 (100.0%) |
| 6 to 11 Years | 55 (100.0%) | 17 (100.0%) |
| 12 to 14 Years | 59 (100.0%) | 31 (100.0%) |
| 15 Years | 6 (100.0%) | 66 (100.0%) |
| 16 and 17 Years | 27 (100.0%) | 8 (100.0%) |
| 18 to 24 Years | 96 (100.0%) | 96 (100.0%) |
| 25 to 34 Years | 90 (100.0%) | 103 (100.0%) |
| 35 to 44 Years | 103 (100.0%) | 85 (93.4%) |
| 45 to 54 Years | 130 (92.2%) | 132 (97.8%) |
| 55 to 64 Years | 128 (100.0%) | 106 (100.0%) |
| 65 to 74 Years | 82 (95.4%) | 100 (97.1%) |
| 75 Years and over | 30 (100.0%) | 34 (91.9%) |
| Total | 881 (98.3%) | 817 (98.2%) |
Income Below Poverty Among Married-Couple Families in Estell Manor
The poverty statistics for married-couple families in Estell Manor show that 1.1% or 5 of the total 463 families live below the poverty line. Families with no children have the highest poverty rate of 1.8%, comprising of 5 families. On the other hand, families with 1 or 2 children have the lowest poverty rate of 0.0%, which includes 0 families.
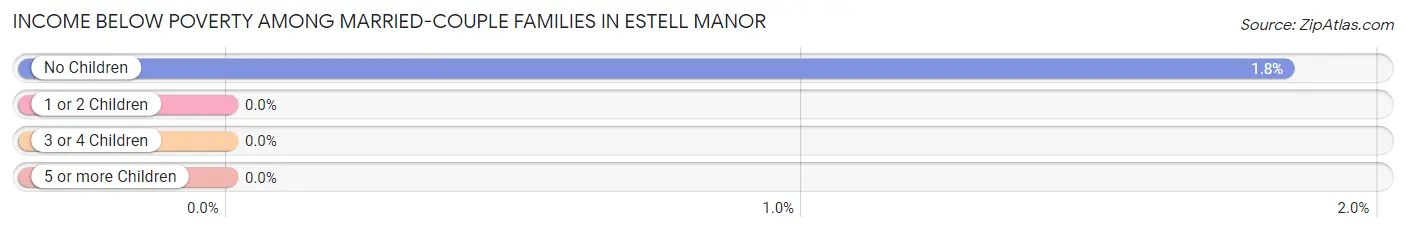
| Children | Above Poverty | Below Poverty |
| No Children | 267 (98.2%) | 5 (1.8%) |
| 1 or 2 Children | 185 (100.0%) | 0 (0.0%) |
| 3 or 4 Children | 6 (100.0%) | 0 (0.0%) |
| 5 or more Children | 0 (0.0%) | 0 (0.0%) |
| Total | 458 (98.9%) | 5 (1.1%) |
Income Below Poverty Among Single-Parent Households in Estell Manor
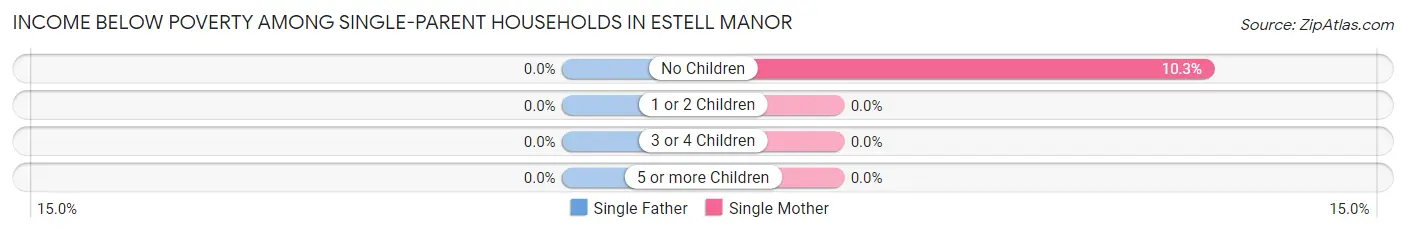
| Children | Single Father | Single Mother |
| No Children | 0 (0.0%) | 3 (10.3%) |
| 1 or 2 Children | 0 (0.0%) | 0 (0.0%) |
| 3 or 4 Children | 0 (0.0%) | 0 (0.0%) |
| 5 or more Children | 0 (0.0%) | 0 (0.0%) |
| Total | 0 (0.0%) | 3 (7.9%) |
Income Below Poverty Among Married-Couple vs Single-Parent Households in Estell Manor
The poverty data for Estell Manor shows that 5 of the married-couple family households (1.1%) and 3 of the single-parent households (4.9%) are living below the poverty level. Within the married-couple family households, those with no children have the highest poverty rate, with 5 households (1.8%) falling below the poverty line. Among the single-parent households, those with no children have the highest poverty rate, with 3 household (7.9%) living below poverty.
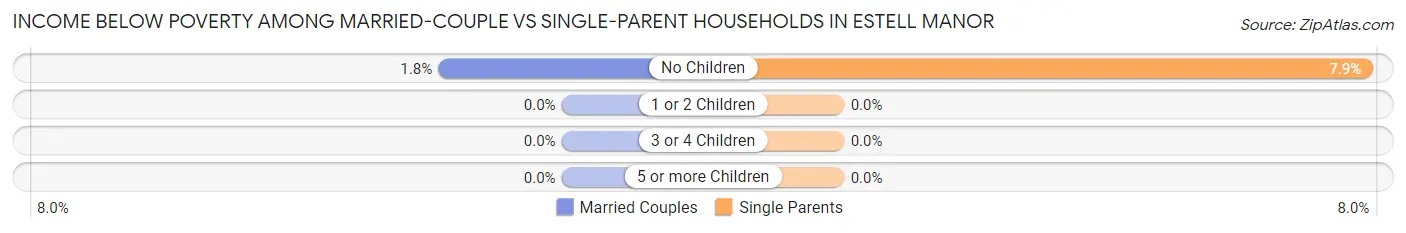
| Children | Married-Couple Families | Single-Parent Households |
| No Children | 5 (1.8%) | 3 (7.9%) |
| 1 or 2 Children | 0 (0.0%) | 0 (0.0%) |
| 3 or 4 Children | 0 (0.0%) | 0 (0.0%) |
| 5 or more Children | 0 (0.0%) | 0 (0.0%) |
| Total | 5 (1.1%) | 3 (4.9%) |
Race in Estell Manor
The most populous races in Estell Manor are White / Caucasian (1,572 | 90.9%), Two or more Races (58 | 3.4%), and Asian (41 | 2.4%).
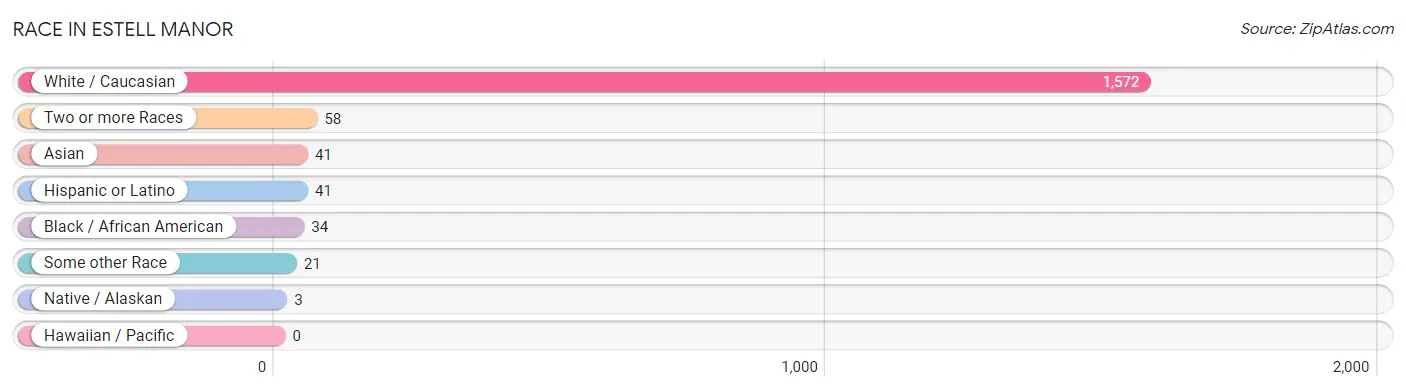
| Race | # Population | % Population |
| Asian | 41 | 2.4% |
| Black / African American | 34 | 2.0% |
| Hawaiian / Pacific | 0 | 0.0% |
| Hispanic or Latino | 41 | 2.4% |
| Native / Alaskan | 3 | 0.2% |
| White / Caucasian | 1,572 | 90.9% |
| Two or more Races | 58 | 3.4% |
| Some other Race | 21 | 1.2% |
| Total | 1,729 | 100.0% |
Ancestry in Estell Manor
The most populous ancestries reported in Estell Manor are German (678 | 39.2%), Italian (666 | 38.5%), Irish (377 | 21.8%), English (193 | 11.2%), and Ukrainian (55 | 3.2%), together accounting for 113.9% of all Estell Manor residents.
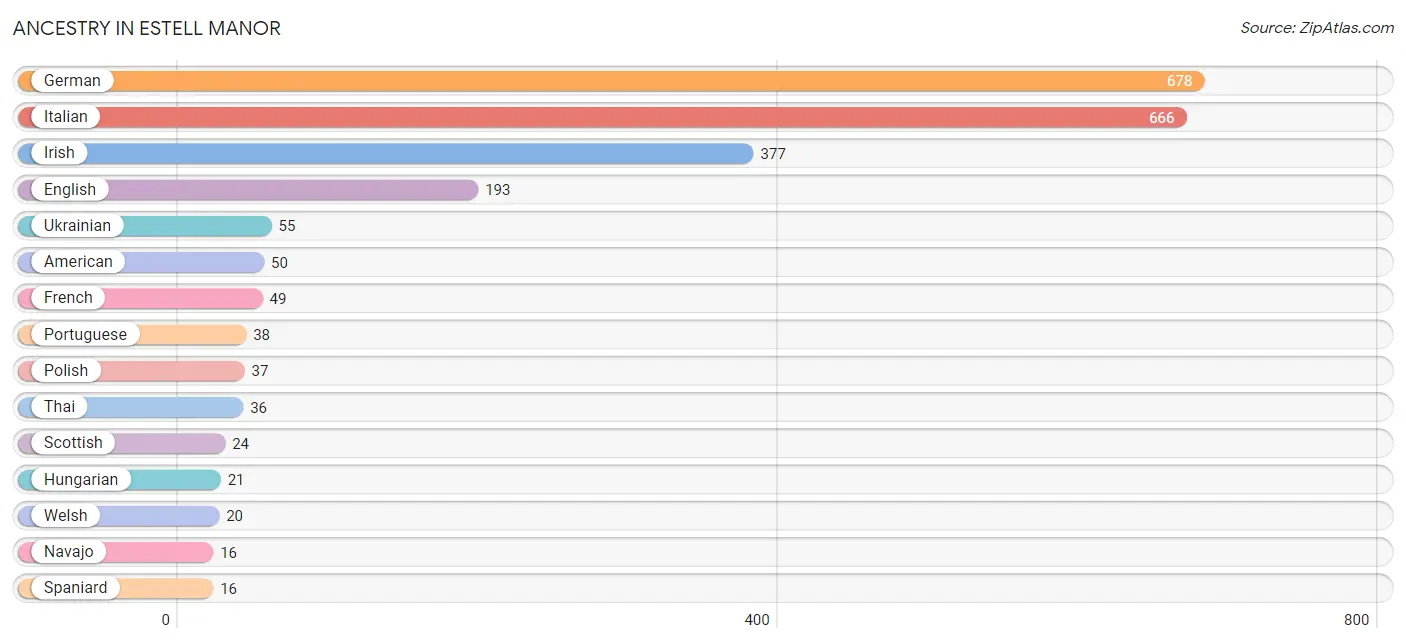
| Ancestry | # Population | % Population |
| African | 15 | 0.9% |
| American | 50 | 2.9% |
| Austrian | 10 | 0.6% |
| Bhutanese | 6 | 0.4% |
| Blackfeet | 1 | 0.1% |
| Brazilian | 2 | 0.1% |
| British | 14 | 0.8% |
| Canadian | 3 | 0.2% |
| Cherokee | 1 | 0.1% |
| Cuban | 4 | 0.2% |
| Czech | 6 | 0.4% |
| Delaware | 10 | 0.6% |
| Dominican | 3 | 0.2% |
| Dutch | 6 | 0.4% |
| Eastern European | 2 | 0.1% |
| English | 193 | 11.2% |
| Finnish | 3 | 0.2% |
| French | 49 | 2.8% |
| German | 678 | 39.2% |
| Hungarian | 21 | 1.2% |
| Irish | 377 | 21.8% |
| Italian | 666 | 38.5% |
| Korean | 5 | 0.3% |
| Mexican | 4 | 0.2% |
| Navajo | 16 | 0.9% |
| Polish | 37 | 2.1% |
| Portuguese | 38 | 2.2% |
| Puerto Rican | 8 | 0.5% |
| Russian | 13 | 0.7% |
| Scandinavian | 3 | 0.2% |
| Scottish | 24 | 1.4% |
| Slovak | 2 | 0.1% |
| Spaniard | 16 | 0.9% |
| Subsaharan African | 15 | 0.9% |
| Swedish | 8 | 0.5% |
| Thai | 36 | 2.1% |
| Ukrainian | 55 | 3.2% |
| Welsh | 20 | 1.2% |
| Yugoslavian | 3 | 0.2% | View All 39 Rows |
Immigrants in Estell Manor
The most numerous immigrant groups reported in Estell Manor came from Asia (41 | 2.4%), Europe (36 | 2.1%), India (36 | 2.1%), South Central Asia (36 | 2.1%), and Eastern Europe (13 | 0.7%), together accounting for 9.4% of all Estell Manor residents.
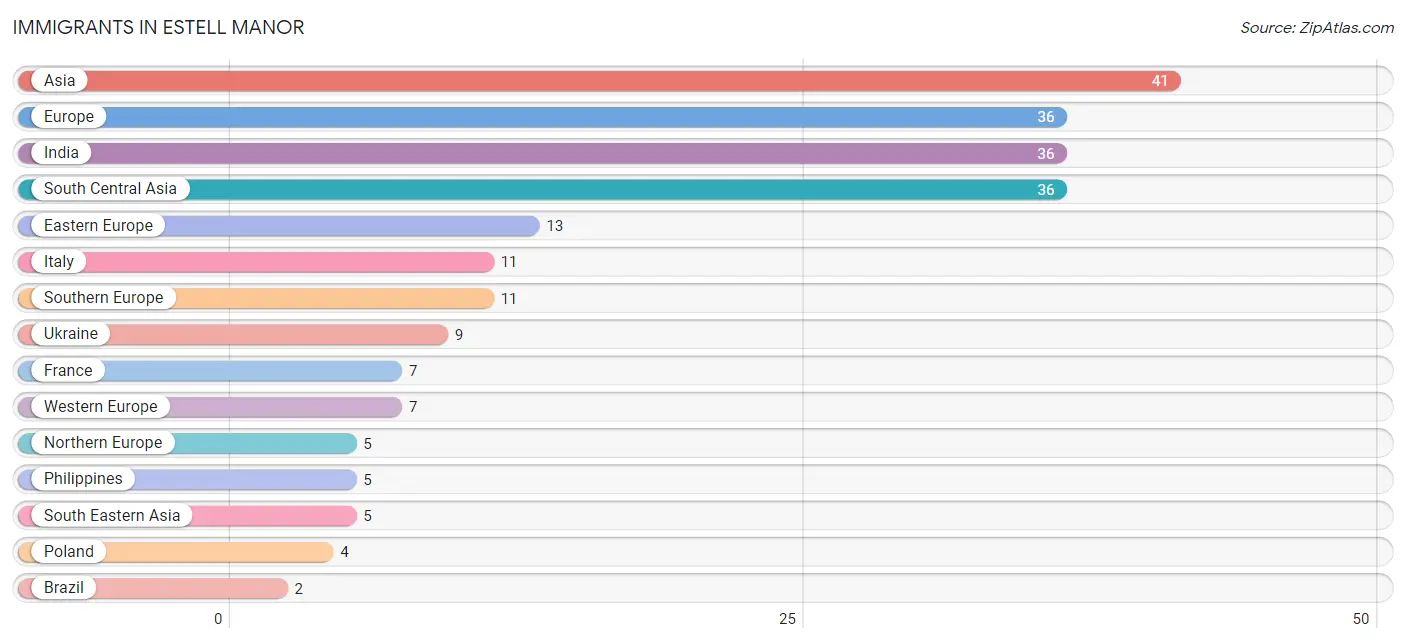
| Immigration Origin | # Population | % Population |
| Asia | 41 | 2.4% |
| Brazil | 2 | 0.1% |
| Eastern Europe | 13 | 0.7% |
| England | 2 | 0.1% |
| Europe | 36 | 2.1% |
| France | 7 | 0.4% |
| India | 36 | 2.1% |
| Italy | 11 | 0.6% |
| Latin America | 2 | 0.1% |
| Northern Europe | 5 | 0.3% |
| Philippines | 5 | 0.3% |
| Poland | 4 | 0.2% |
| South America | 2 | 0.1% |
| South Central Asia | 36 | 2.1% |
| South Eastern Asia | 5 | 0.3% |
| Southern Europe | 11 | 0.6% |
| Ukraine | 9 | 0.5% |
| Western Europe | 7 | 0.4% | View All 18 Rows |
Sex and Age in Estell Manor
Sex and Age in Estell Manor
The most populous age groups in Estell Manor are 50 to 54 Years (86 | 9.6%) for men and 20 to 24 Years (96 | 11.5%) for women.
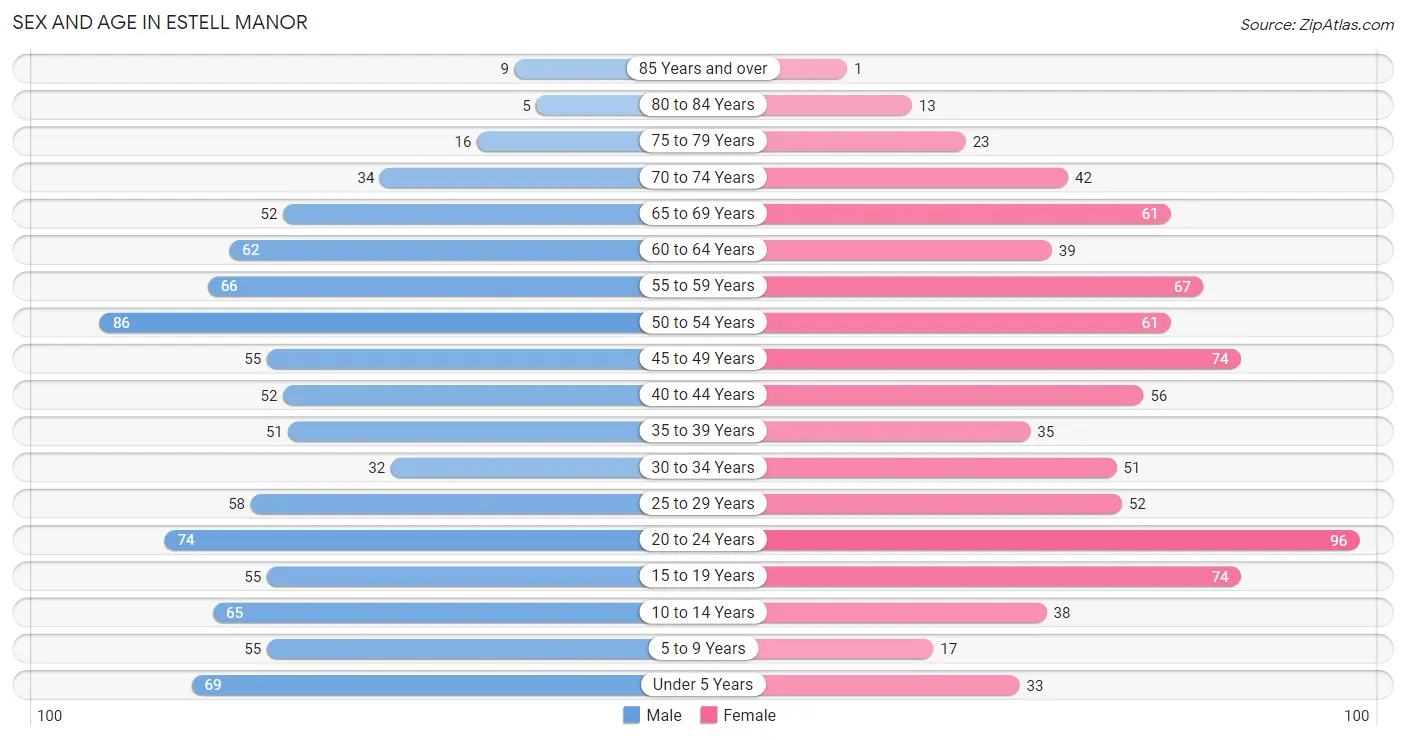
| Age Bracket | Male | Female |
| Under 5 Years | 69 (7.7%) | 33 (4.0%) |
| 5 to 9 Years | 55 (6.1%) | 17 (2.0%) |
| 10 to 14 Years | 65 (7.2%) | 38 (4.6%) |
| 15 to 19 Years | 55 (6.1%) | 74 (8.9%) |
| 20 to 24 Years | 74 (8.3%) | 96 (11.5%) |
| 25 to 29 Years | 58 (6.5%) | 52 (6.2%) |
| 30 to 34 Years | 32 (3.6%) | 51 (6.1%) |
| 35 to 39 Years | 51 (5.7%) | 35 (4.2%) |
| 40 to 44 Years | 52 (5.8%) | 56 (6.7%) |
| 45 to 49 Years | 55 (6.1%) | 74 (8.9%) |
| 50 to 54 Years | 86 (9.6%) | 61 (7.3%) |
| 55 to 59 Years | 66 (7.4%) | 67 (8.0%) |
| 60 to 64 Years | 62 (6.9%) | 39 (4.7%) |
| 65 to 69 Years | 52 (5.8%) | 61 (7.3%) |
| 70 to 74 Years | 34 (3.8%) | 42 (5.0%) |
| 75 to 79 Years | 16 (1.8%) | 23 (2.8%) |
| 80 to 84 Years | 5 (0.6%) | 13 (1.6%) |
| 85 Years and over | 9 (1.0%) | 1 (0.1%) |
| Total | 896 (100.0%) | 833 (100.0%) |
Families and Households in Estell Manor
Median Family Size in Estell Manor
The median family size in Estell Manor is 3.12 persons per family, with married-couple families (463 | 88.4%) accounting for the largest median family size of 3.18 persons per family. On the other hand, single female/mother families (38 | 7.2%) represent the smallest median family size with 2.53 persons per family.
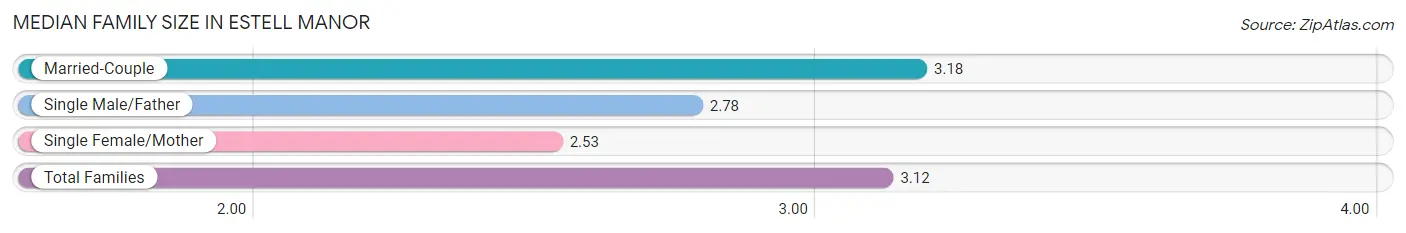
| Family Type | # Families | Family Size |
| Married-Couple | 463 (88.4%) | 3.18 |
| Single Male/Father | 23 (4.4%) | 2.78 |
| Single Female/Mother | 38 (7.2%) | 2.53 |
| Total Families | 524 (100.0%) | 3.12 |
Median Household Size in Estell Manor
The median household size in Estell Manor is 2.89 persons per household, with married-couple households (463 | 77.4%) accounting for the largest median household size of 3.19 persons per household. non-family households (74 | 12.4%) represent the smallest median household size with 1.23 persons per household.
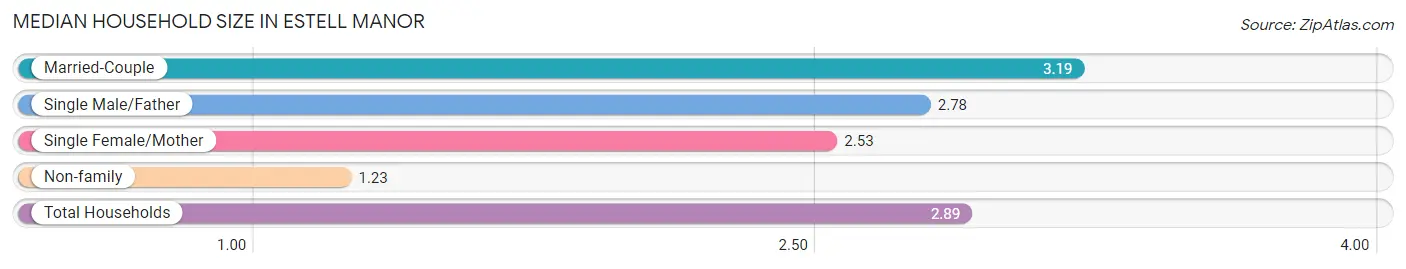
| Household Type | # Households | Household Size |
| Married-Couple | 463 (77.4%) | 3.19 |
| Single Male/Father | 23 (3.8%) | 2.78 |
| Single Female/Mother | 38 (6.4%) | 2.53 |
| Non-family | 74 (12.4%) | 1.23 |
| Total Households | 598 (100.0%) | 2.89 |
Household Size by Marriage Status in Estell Manor
Out of a total of 598 households in Estell Manor, 524 (87.6%) are family households, while 74 (12.4%) are nonfamily households. The most numerous type of family households are 2-person households, comprising 236, and the most common type of nonfamily households are 1-person households, comprising 62.
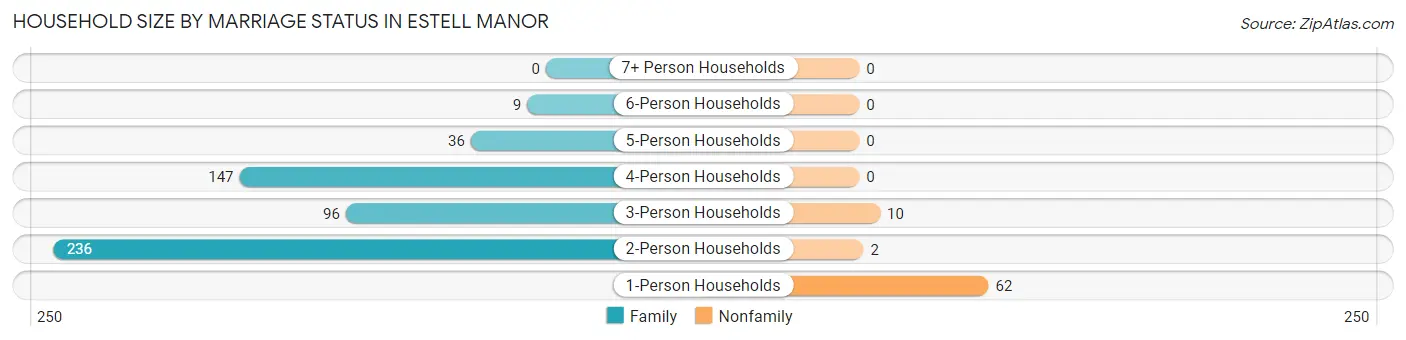
| Household Size | Family Households | Nonfamily Households |
| 1-Person Households | - | 62 (10.4%) |
| 2-Person Households | 236 (39.5%) | 2 (0.3%) |
| 3-Person Households | 96 (16.1%) | 10 (1.7%) |
| 4-Person Households | 147 (24.6%) | 0 (0.0%) |
| 5-Person Households | 36 (6.0%) | 0 (0.0%) |
| 6-Person Households | 9 (1.5%) | 0 (0.0%) |
| 7+ Person Households | 0 (0.0%) | 0 (0.0%) |
| Total | 524 (87.6%) | 74 (12.4%) |
Female Fertility in Estell Manor
Fertility by Age in Estell Manor
Average fertility rate in Estell Manor is 113.0 births per 1,000 women. Women in the age bracket of 20 to 34 years have the highest fertility rate with 196.0 births per 1,000 women. Women in the age bracket of 20 to 34 years acount for 76.5% of all women with births.
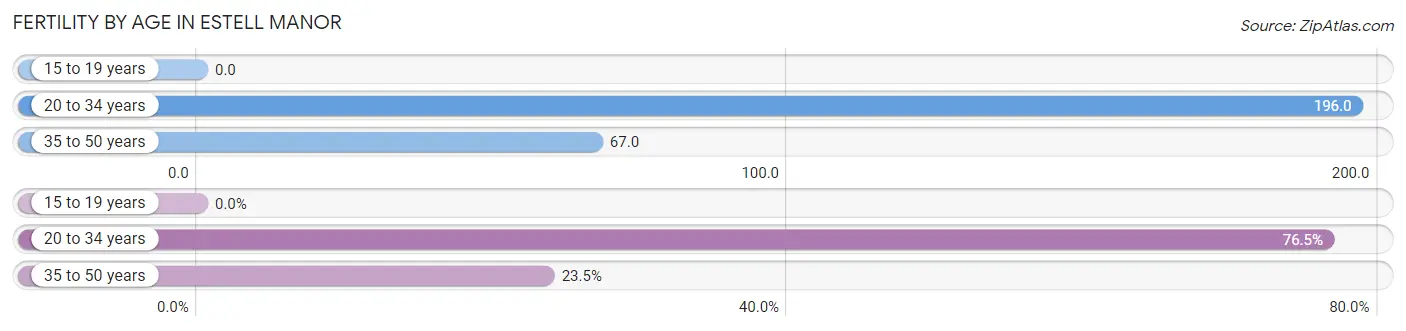
| Age Bracket | Women with Births | Births / 1,000 Women |
| 15 to 19 years | 0 (0.0%) | 0.0 |
| 20 to 34 years | 39 (76.5%) | 196.0 |
| 35 to 50 years | 12 (23.5%) | 67.0 |
| Total | 51 (100.0%) | 113.0 |
Fertility by Age by Marriage Status in Estell Manor
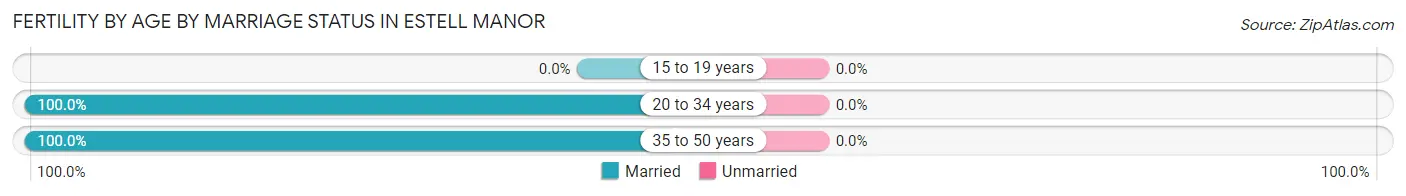
| Age Bracket | Married | Unmarried |
| 15 to 19 years | 0 (0.0%) | 0 (0.0%) |
| 20 to 34 years | 39 (100.0%) | 0 (0.0%) |
| 35 to 50 years | 12 (100.0%) | 0 (0.0%) |
| Total | 51 (100.0%) | 0 (0.0%) |
Fertility by Education in Estell Manor
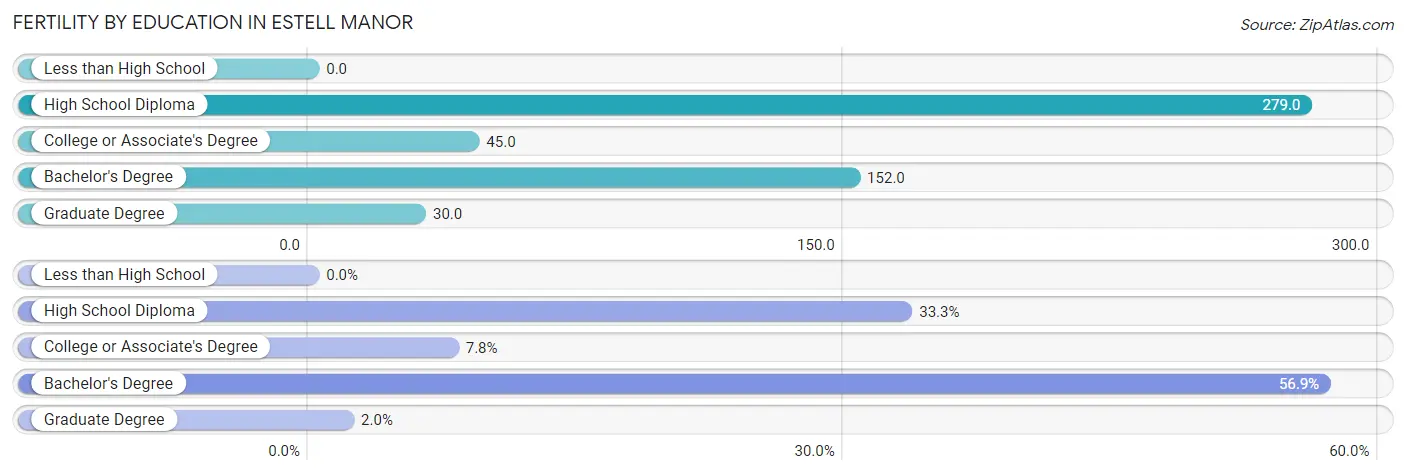
| Educational Attainment | Women with Births | Births / 1,000 Women |
| Less than High School | 0 (0.0%) | 0.0 |
| High School Diploma | 17 (33.3%) | 279.0 |
| College or Associate's Degree | 4 (7.8%) | 45.0 |
| Bachelor's Degree | 29 (56.9%) | 152.0 |
| Graduate Degree | 1 (2.0%) | 30.0 |
| Total | 51 (100.0%) | 113.0 |
Fertility by Education by Marriage Status in Estell Manor
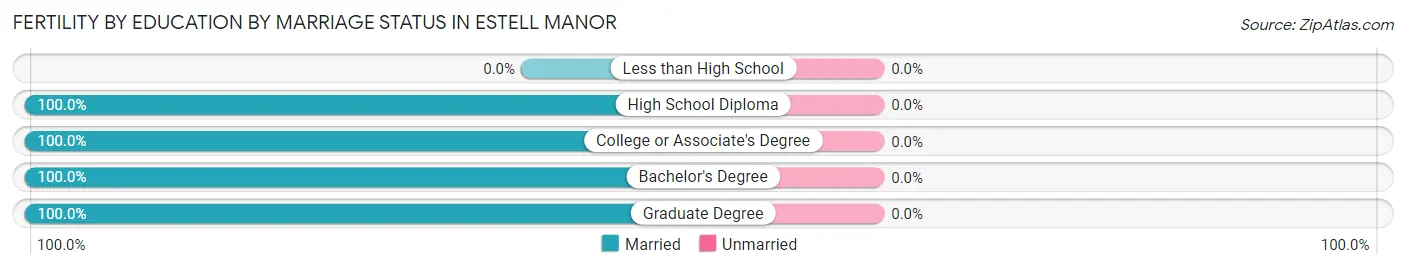
| Educational Attainment | Married | Unmarried |
| Less than High School | 0 (0.0%) | 0 (0.0%) |
| High School Diploma | 17 (100.0%) | 0 (0.0%) |
| College or Associate's Degree | 4 (100.0%) | 0 (0.0%) |
| Bachelor's Degree | 29 (100.0%) | 0 (0.0%) |
| Graduate Degree | 1 (100.0%) | 0 (0.0%) |
| Total | 51 (100.0%) | 0 (0.0%) |
Employment Characteristics in Estell Manor
Employment by Class of Employer in Estell Manor
Among the 842 employed individuals in Estell Manor, private company employees (504 | 59.9%), local government employees (118 | 14.0%), and state government employees (68 | 8.1%) make up the most common classes of employment.
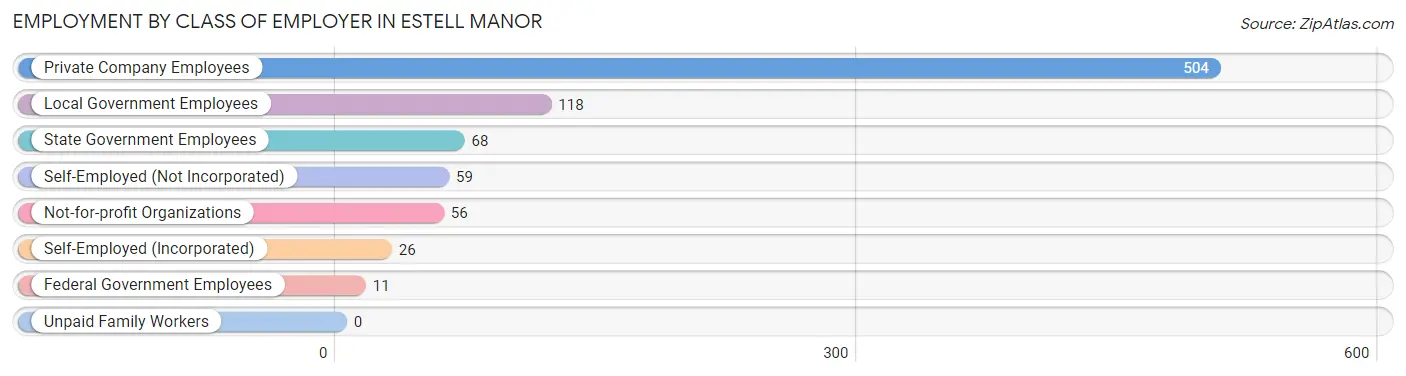
| Employer Class | # Employees | % Employees |
| Private Company Employees | 504 | 59.9% |
| Self-Employed (Incorporated) | 26 | 3.1% |
| Self-Employed (Not Incorporated) | 59 | 7.0% |
| Not-for-profit Organizations | 56 | 6.7% |
| Local Government Employees | 118 | 14.0% |
| State Government Employees | 68 | 8.1% |
| Federal Government Employees | 11 | 1.3% |
| Unpaid Family Workers | 0 | 0.0% |
| Total | 842 | 100.0% |
Employment Status by Age in Estell Manor
According to the labor force statistics for Estell Manor, out of the total population over 16 years of age (1,380), 64.1% or 885 individuals are in the labor force, with 3.7% or 33 of them unemployed. The age group with the highest labor force participation rate is 30 to 34 years, with 81.9% or 68 individuals in the labor force. Within the labor force, the 65 to 74 years age range has the highest percentage of unemployed individuals, with 12.5% or 6 of them being unemployed.
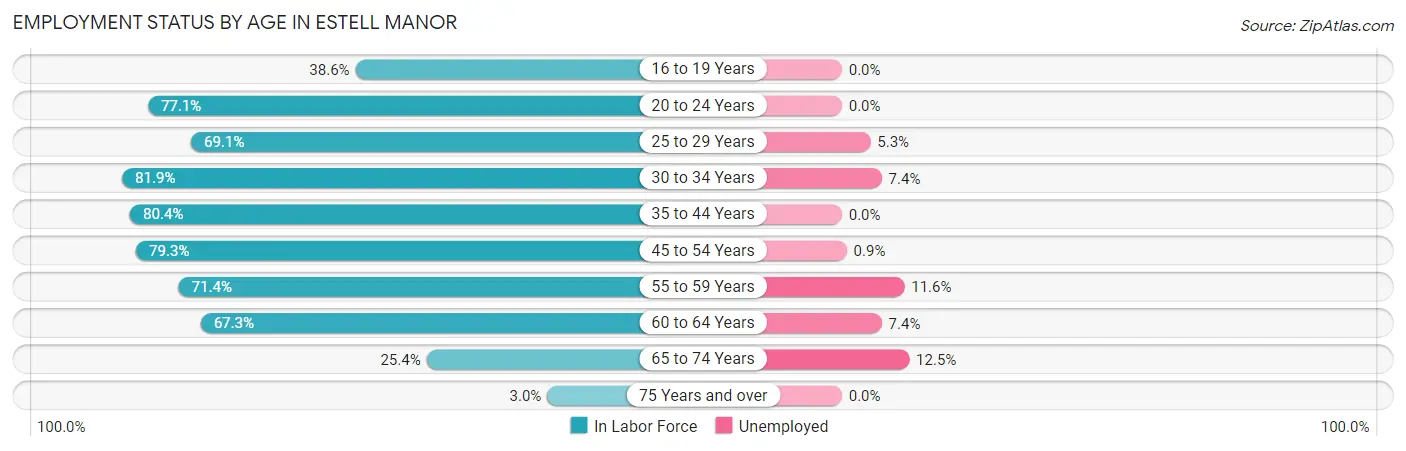
| Age Bracket | In Labor Force | Unemployed |
| 16 to 19 Years | 22 (38.6%) | 0 (0.0%) |
| 20 to 24 Years | 131 (77.1%) | 0 (0.0%) |
| 25 to 29 Years | 76 (69.1%) | 4 (5.3%) |
| 30 to 34 Years | 68 (81.9%) | 5 (7.4%) |
| 35 to 44 Years | 156 (80.4%) | 0 (0.0%) |
| 45 to 54 Years | 219 (79.3%) | 2 (0.9%) |
| 55 to 59 Years | 95 (71.4%) | 11 (11.6%) |
| 60 to 64 Years | 68 (67.3%) | 5 (7.4%) |
| 65 to 74 Years | 48 (25.4%) | 6 (12.5%) |
| 75 Years and over | 2 (3.0%) | 0 (0.0%) |
| Total | 885 (64.1%) | 33 (3.7%) |
Employment Status by Educational Attainment in Estell Manor
According to labor force statistics for Estell Manor, 76.0% of individuals (682) out of the total population between 25 and 64 years of age (897) are in the labor force, with 4.0% or 27 of them being unemployed. The group with the highest labor force participation rate are those with the educational attainment of less than high school, with 100.0% or 8 individuals in the labor force. Within the labor force, individuals with high school diploma education have the highest percentage of unemployment, with 7.8% or 17 of them being unemployed.

| Educational Attainment | In Labor Force | Unemployed |
| Less than High School | 8 (100.0%) | 0 (0.0%) |
| High School Diploma | 218 (70.8%) | 24 (7.8%) |
| College / Associate Degree | 184 (84.0%) | 0 (0.0%) |
| Bachelor's Degree or higher | 272 (75.1%) | 13 (3.7%) |
| Total | 682 (76.0%) | 36 (4.0%) |
Employment Occupations by Sex in Estell Manor
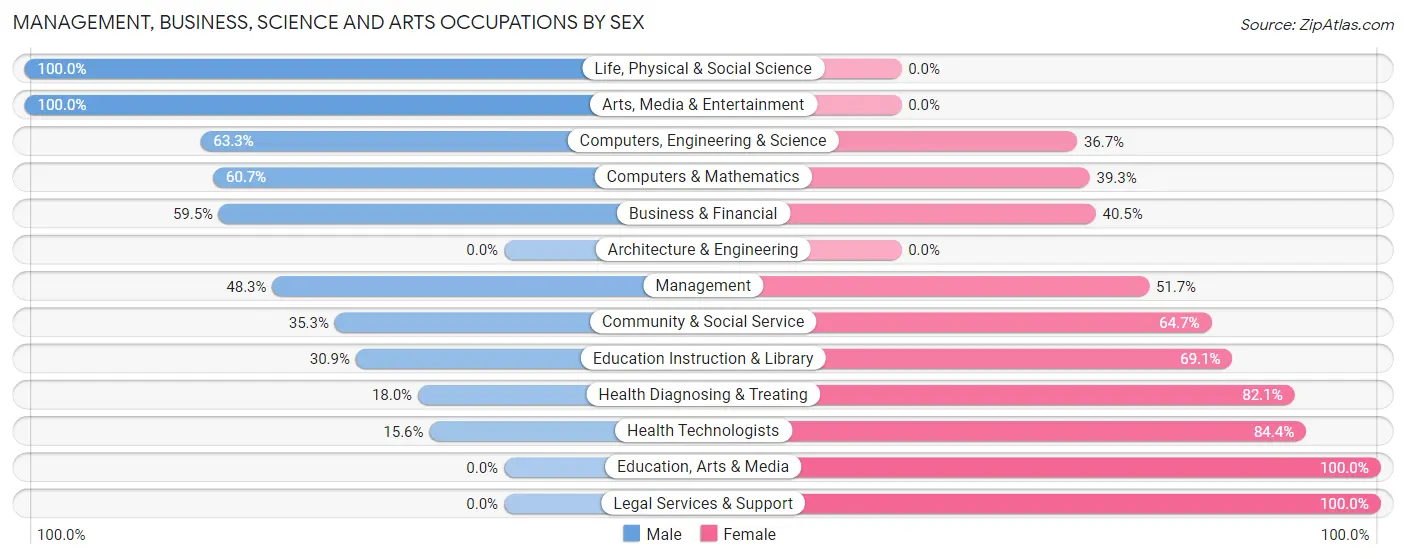
Management, Business, Science and Arts Occupations
The most common Management, Business, Science and Arts occupations in Estell Manor are Management (89 | 10.4%), Community & Social Service (85 | 10.0%), Health Diagnosing & Treating (78 | 9.1%), Education Instruction & Library (55 | 6.5%), and Health Technologists (45 | 5.3%).
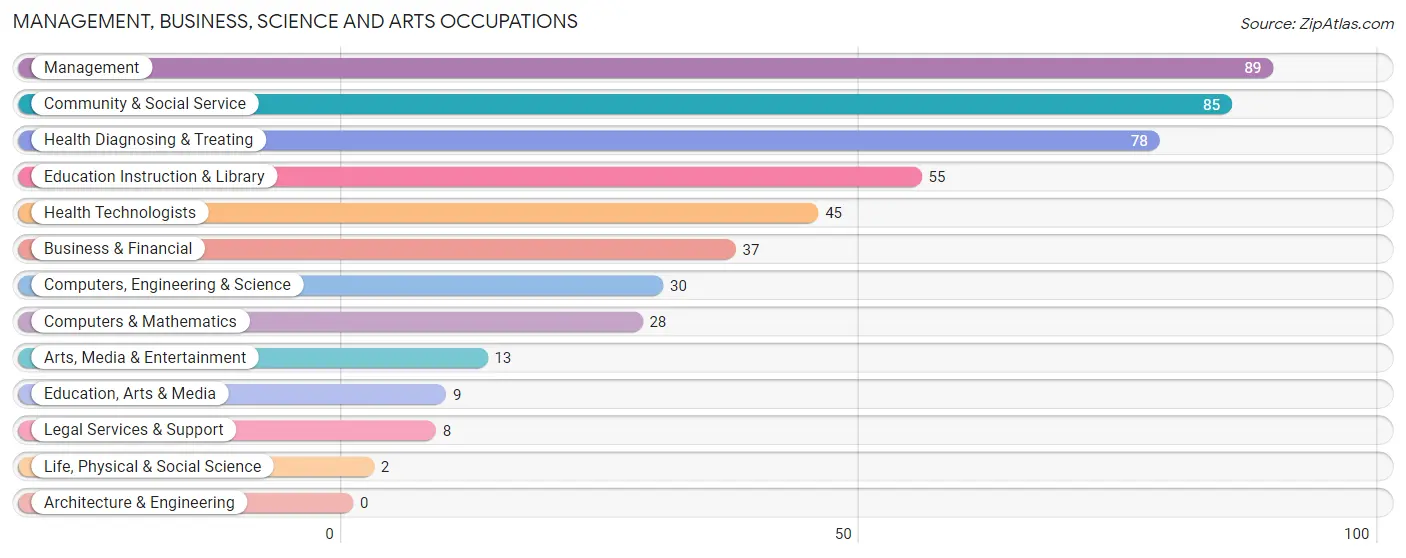
Management, Business, Science and Arts Occupations by Sex
Within the Management, Business, Science and Arts occupations in Estell Manor, the most male-oriented occupations are Life, Physical & Social Science (100.0%), Arts, Media & Entertainment (100.0%), and Computers, Engineering & Science (63.3%), while the most female-oriented occupations are Education, Arts & Media (100.0%), Legal Services & Support (100.0%), and Health Technologists (84.4%).
| Occupation | Male | Female |
| Management | 43 (48.3%) | 46 (51.7%) |
| Business & Financial | 22 (59.5%) | 15 (40.5%) |
| Computers, Engineering & Science | 19 (63.3%) | 11 (36.7%) |
| Computers & Mathematics | 17 (60.7%) | 11 (39.3%) |
| Architecture & Engineering | 0 (0.0%) | 0 (0.0%) |
| Life, Physical & Social Science | 2 (100.0%) | 0 (0.0%) |
| Community & Social Service | 30 (35.3%) | 55 (64.7%) |
| Education, Arts & Media | 0 (0.0%) | 9 (100.0%) |
| Legal Services & Support | 0 (0.0%) | 8 (100.0%) |
| Education Instruction & Library | 17 (30.9%) | 38 (69.1%) |
| Arts, Media & Entertainment | 13 (100.0%) | 0 (0.0%) |
| Health Diagnosing & Treating | 14 (17.9%) | 64 (82.1%) |
| Health Technologists | 7 (15.6%) | 38 (84.4%) |
| Total (Category) | 128 (40.1%) | 191 (59.9%) |
| Total (Overall) | 470 (55.2%) | 382 (44.8%) |
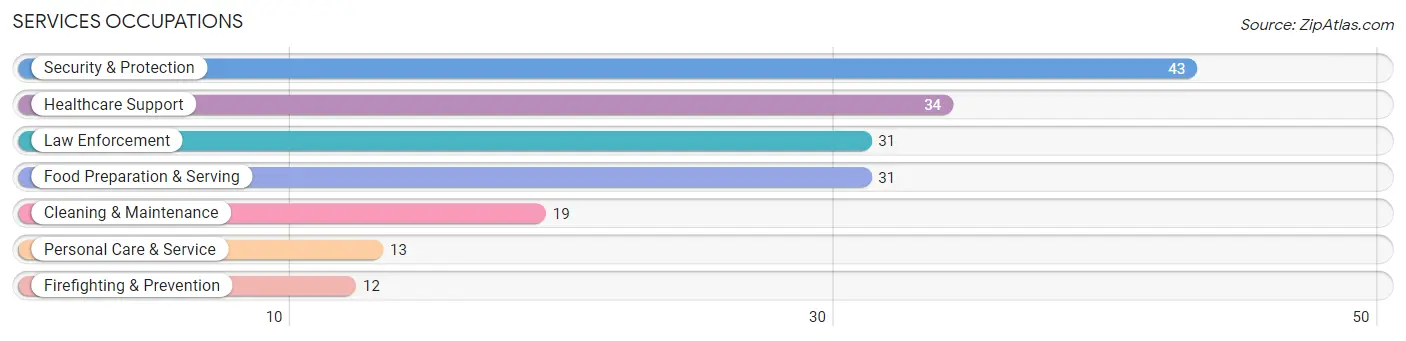
Services Occupations
The most common Services occupations in Estell Manor are Security & Protection (43 | 5.1%), Healthcare Support (34 | 4.0%), Law Enforcement (31 | 3.6%), Food Preparation & Serving (31 | 3.6%), and Cleaning & Maintenance (19 | 2.2%).
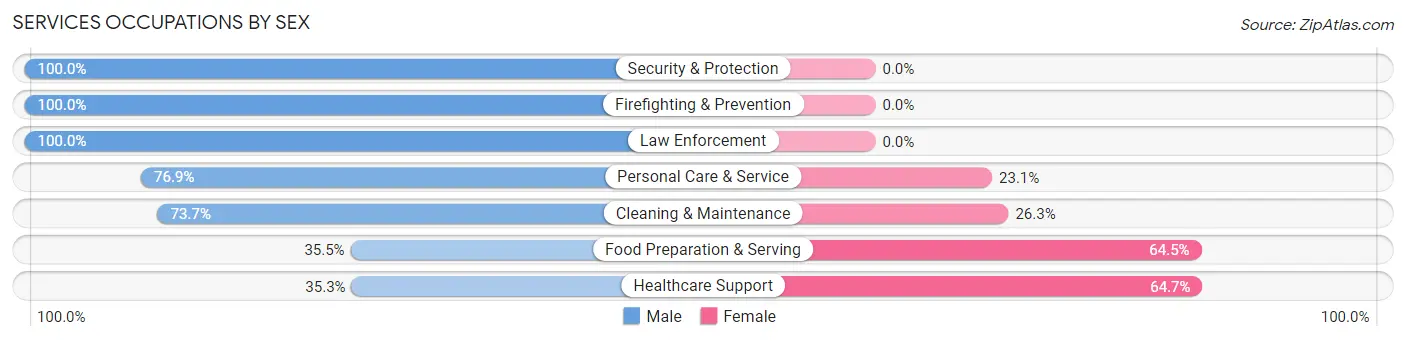
Services Occupations by Sex
Within the Services occupations in Estell Manor, the most male-oriented occupations are Security & Protection (100.0%), Firefighting & Prevention (100.0%), and Law Enforcement (100.0%), while the most female-oriented occupations are Healthcare Support (64.7%), Food Preparation & Serving (64.5%), and Cleaning & Maintenance (26.3%).
| Occupation | Male | Female |
| Healthcare Support | 12 (35.3%) | 22 (64.7%) |
| Security & Protection | 43 (100.0%) | 0 (0.0%) |
| Firefighting & Prevention | 12 (100.0%) | 0 (0.0%) |
| Law Enforcement | 31 (100.0%) | 0 (0.0%) |
| Food Preparation & Serving | 11 (35.5%) | 20 (64.5%) |
| Cleaning & Maintenance | 14 (73.7%) | 5 (26.3%) |
| Personal Care & Service | 10 (76.9%) | 3 (23.1%) |
| Total (Category) | 90 (64.3%) | 50 (35.7%) |
| Total (Overall) | 470 (55.2%) | 382 (44.8%) |
Sales and Office Occupations
The most common Sales and Office occupations in Estell Manor are Office & Administration (95 | 11.2%), and Sales & Related (87 | 10.2%).

Sales and Office Occupations by Sex

| Occupation | Male | Female |
| Sales & Related | 48 (55.2%) | 39 (44.8%) |
| Office & Administration | 9 (9.5%) | 86 (90.5%) |
| Total (Category) | 57 (31.3%) | 125 (68.7%) |
| Total (Overall) | 470 (55.2%) | 382 (44.8%) |
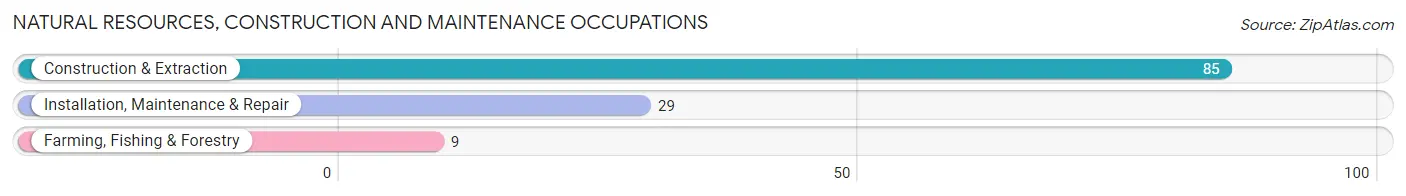
Natural Resources, Construction and Maintenance Occupations
The most common Natural Resources, Construction and Maintenance occupations in Estell Manor are Construction & Extraction (85 | 10.0%), Installation, Maintenance & Repair (29 | 3.4%), and Farming, Fishing & Forestry (9 | 1.1%).
Natural Resources, Construction and Maintenance Occupations by Sex

| Occupation | Male | Female |
| Farming, Fishing & Forestry | 9 (100.0%) | 0 (0.0%) |
| Construction & Extraction | 82 (96.5%) | 3 (3.5%) |
| Installation, Maintenance & Repair | 29 (100.0%) | 0 (0.0%) |
| Total (Category) | 120 (97.6%) | 3 (2.4%) |
| Total (Overall) | 470 (55.2%) | 382 (44.8%) |
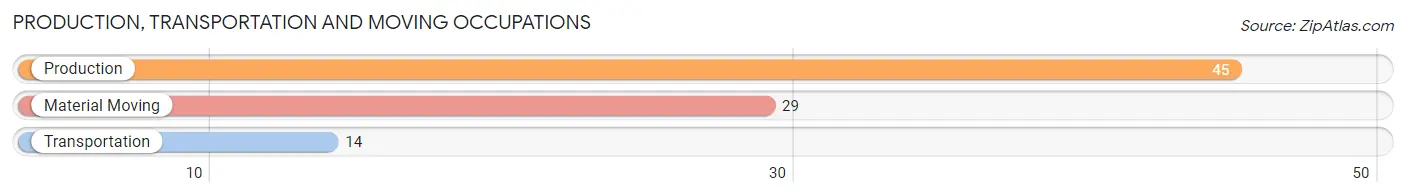
Production, Transportation and Moving Occupations
The most common Production, Transportation and Moving occupations in Estell Manor are Production (45 | 5.3%), Material Moving (29 | 3.4%), and Transportation (14 | 1.6%).
Production, Transportation and Moving Occupations by Sex

| Occupation | Male | Female |
| Production | 35 (77.8%) | 10 (22.2%) |
| Transportation | 14 (100.0%) | 0 (0.0%) |
| Material Moving | 26 (89.7%) | 3 (10.3%) |
| Total (Category) | 75 (85.2%) | 13 (14.8%) |
| Total (Overall) | 470 (55.2%) | 382 (44.8%) |
Employment Industries by Sex in Estell Manor
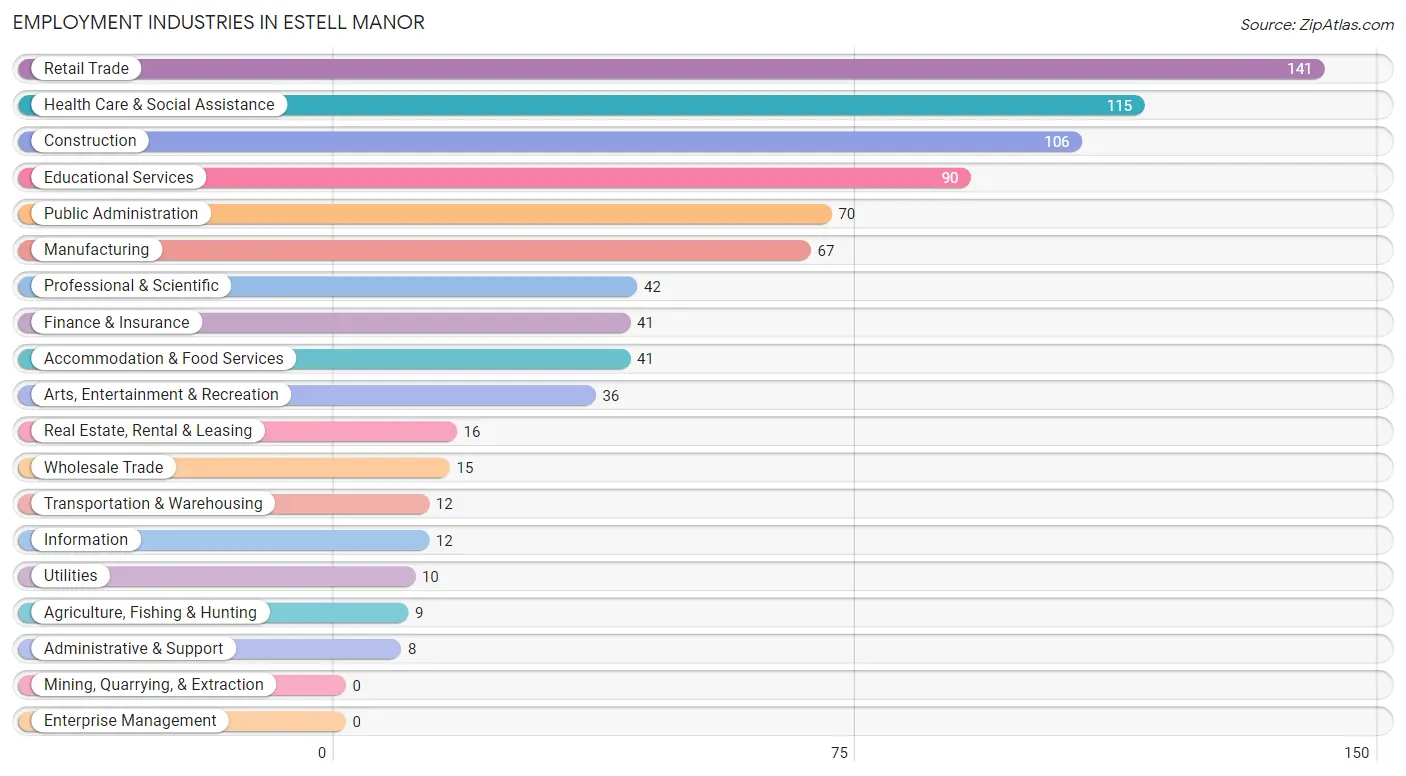
Employment Industries in Estell Manor
The major employment industries in Estell Manor include Retail Trade (141 | 16.6%), Health Care & Social Assistance (115 | 13.5%), Construction (106 | 12.4%), Educational Services (90 | 10.6%), and Public Administration (70 | 8.2%).
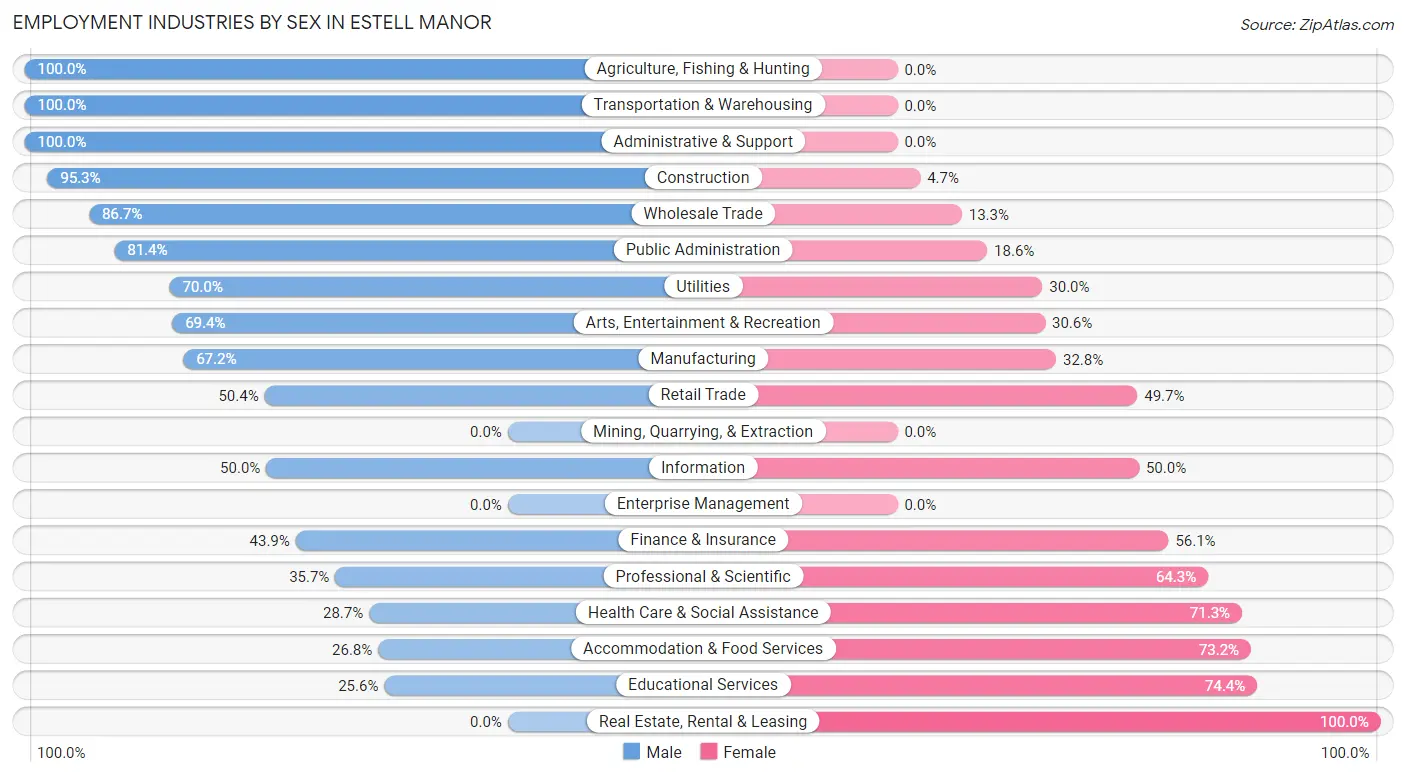
Employment Industries by Sex in Estell Manor
The Estell Manor industries that see more men than women are Agriculture, Fishing & Hunting (100.0%), Transportation & Warehousing (100.0%), and Administrative & Support (100.0%), whereas the industries that tend to have a higher number of women are Real Estate, Rental & Leasing (100.0%), Educational Services (74.4%), and Accommodation & Food Services (73.2%).
| Industry | Male | Female |
| Agriculture, Fishing & Hunting | 9 (100.0%) | 0 (0.0%) |
| Mining, Quarrying, & Extraction | 0 (0.0%) | 0 (0.0%) |
| Construction | 101 (95.3%) | 5 (4.7%) |
| Manufacturing | 45 (67.2%) | 22 (32.8%) |
| Wholesale Trade | 13 (86.7%) | 2 (13.3%) |
| Retail Trade | 71 (50.3%) | 70 (49.6%) |
| Transportation & Warehousing | 12 (100.0%) | 0 (0.0%) |
| Utilities | 7 (70.0%) | 3 (30.0%) |
| Information | 6 (50.0%) | 6 (50.0%) |
| Finance & Insurance | 18 (43.9%) | 23 (56.1%) |
| Real Estate, Rental & Leasing | 0 (0.0%) | 16 (100.0%) |
| Professional & Scientific | 15 (35.7%) | 27 (64.3%) |
| Enterprise Management | 0 (0.0%) | 0 (0.0%) |
| Administrative & Support | 8 (100.0%) | 0 (0.0%) |
| Educational Services | 23 (25.6%) | 67 (74.4%) |
| Health Care & Social Assistance | 33 (28.7%) | 82 (71.3%) |
| Arts, Entertainment & Recreation | 25 (69.4%) | 11 (30.6%) |
| Accommodation & Food Services | 11 (26.8%) | 30 (73.2%) |
| Public Administration | 57 (81.4%) | 13 (18.6%) |
| Total | 470 (55.2%) | 382 (44.8%) |
Education in Estell Manor
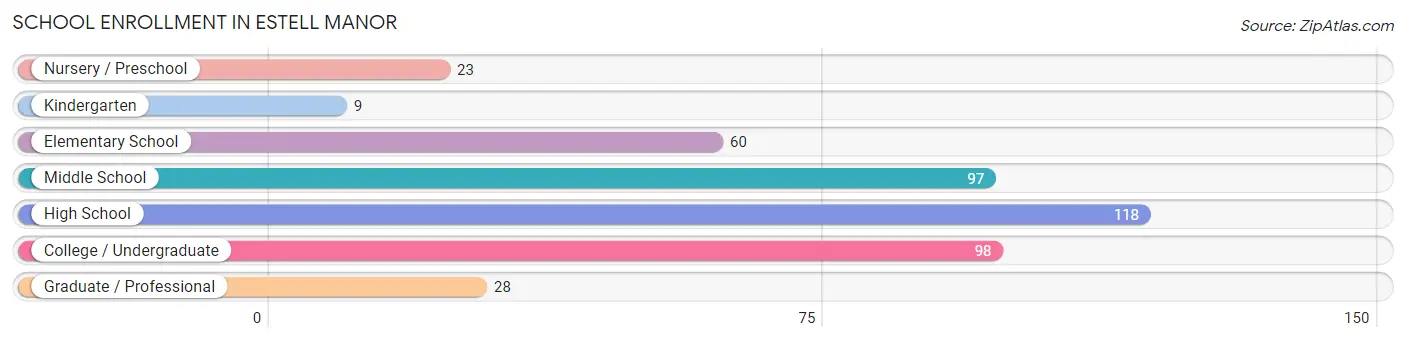
School Enrollment in Estell Manor
The most common levels of schooling among the 433 students in Estell Manor are high school (118 | 27.3%), college / undergraduate (98 | 22.6%), and middle school (97 | 22.4%).
| School Level | # Students | % Students |
| Nursery / Preschool | 23 | 5.3% |
| Kindergarten | 9 | 2.1% |
| Elementary School | 60 | 13.9% |
| Middle School | 97 | 22.4% |
| High School | 118 | 27.3% |
| College / Undergraduate | 98 | 22.6% |
| Graduate / Professional | 28 | 6.5% |
| Total | 433 | 100.0% |
School Enrollment by Age by Funding Source in Estell Manor
Out of a total of 433 students who are enrolled in schools in Estell Manor, 46 (10.6%) attend a private institution, while the remaining 387 (89.4%) are enrolled in public schools. The age group of 35 years and over has the highest likelihood of being enrolled in private schools, with 4 (100.0% in the age bracket) enrolled. Conversely, the age group of 15 to 17 year olds has the lowest likelihood of being enrolled in a private school, with 107 (100.0% in the age bracket) attending a public institution.
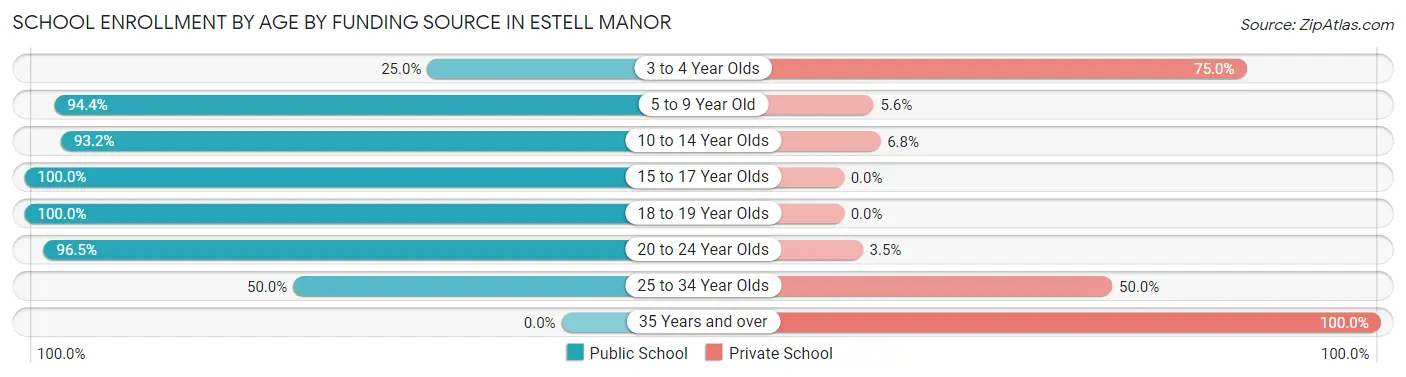
| Age Bracket | Public School | Private School |
| 3 to 4 Year Olds | 5 (25.0%) | 15 (75.0%) |
| 5 to 9 Year Old | 68 (94.4%) | 4 (5.6%) |
| 10 to 14 Year Olds | 96 (93.2%) | 7 (6.8%) |
| 15 to 17 Year Olds | 107 (100.0%) | 0 (0.0%) |
| 18 to 19 Year Olds | 16 (100.0%) | 0 (0.0%) |
| 20 to 24 Year Olds | 82 (96.5%) | 3 (3.5%) |
| 25 to 34 Year Olds | 13 (50.0%) | 13 (50.0%) |
| 35 Years and over | 0 (0.0%) | 4 (100.0%) |
| Total | 387 (89.4%) | 46 (10.6%) |
Educational Attainment by Field of Study in Estell Manor
Education (127 | 28.4%), science & technology (68 | 15.2%), business (59 | 13.2%), engineering (39 | 8.7%), and bio, nature & agricultural (36 | 8.1%) are the most common fields of study among 447 individuals in Estell Manor who have obtained a bachelor's degree or higher.
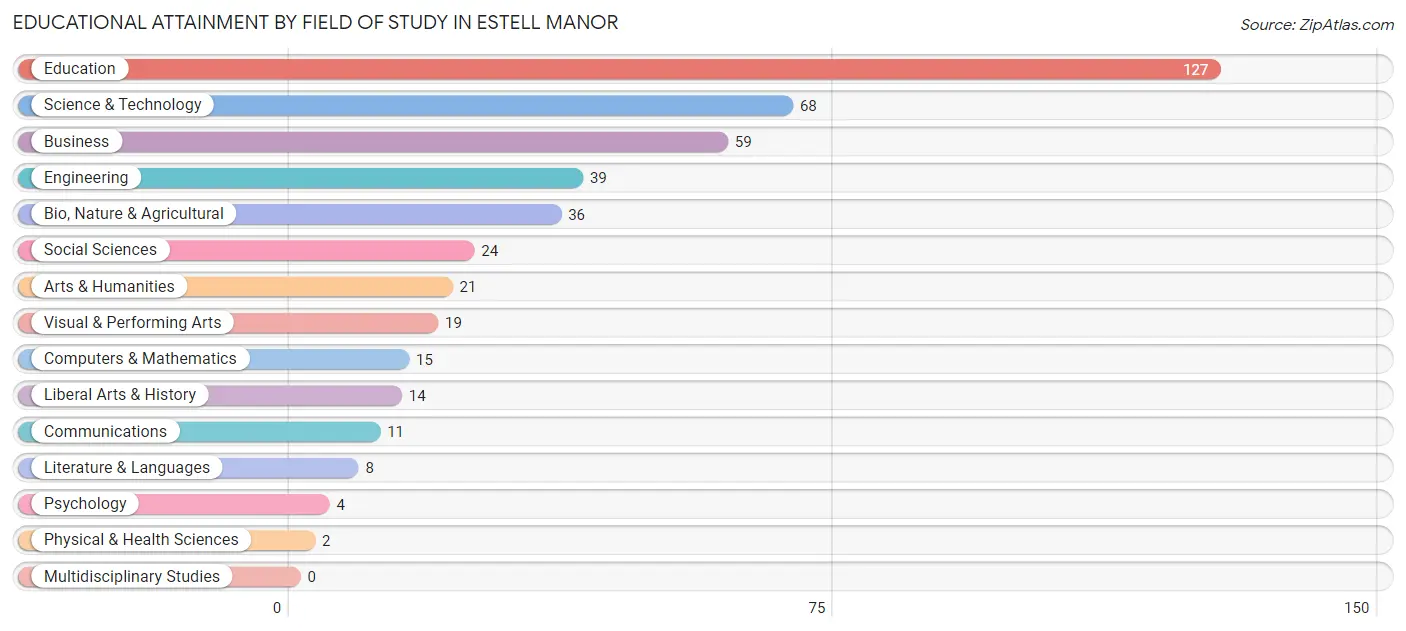
| Field of Study | # Graduates | % Graduates |
| Computers & Mathematics | 15 | 3.4% |
| Bio, Nature & Agricultural | 36 | 8.1% |
| Physical & Health Sciences | 2 | 0.4% |
| Psychology | 4 | 0.9% |
| Social Sciences | 24 | 5.4% |
| Engineering | 39 | 8.7% |
| Multidisciplinary Studies | 0 | 0.0% |
| Science & Technology | 68 | 15.2% |
| Business | 59 | 13.2% |
| Education | 127 | 28.4% |
| Literature & Languages | 8 | 1.8% |
| Liberal Arts & History | 14 | 3.1% |
| Visual & Performing Arts | 19 | 4.3% |
| Communications | 11 | 2.5% |
| Arts & Humanities | 21 | 4.7% |
| Total | 447 | 100.0% |
Transportation & Commute in Estell Manor
Vehicle Availability by Sex in Estell Manor
The most prevalent vehicle ownership categories in Estell Manor are males with 2 vehicles (221, accounting for 48.0%) and females with 2 vehicles (170, making up 57.9%).
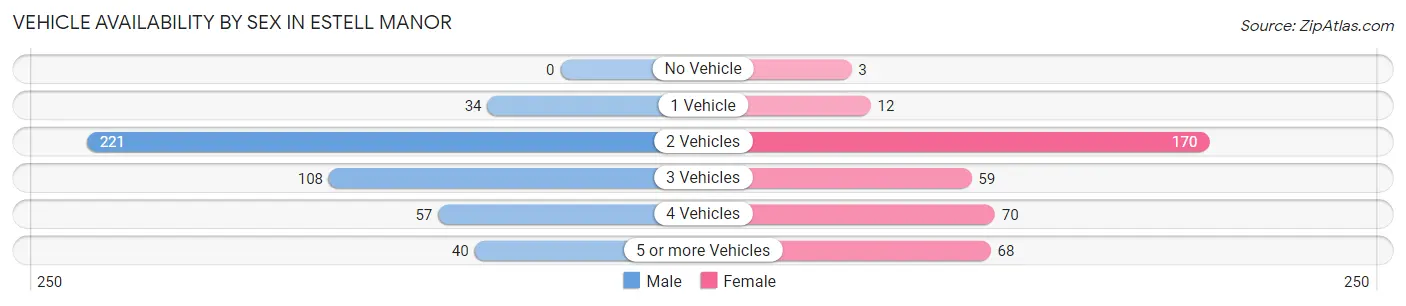
| Vehicles Available | Male | Female |
| No Vehicle | 0 (0.0%) | 3 (0.8%) |
| 1 Vehicle | 34 (7.4%) | 12 (3.1%) |
| 2 Vehicles | 221 (48.0%) | 170 (44.5%) |
| 3 Vehicles | 108 (23.5%) | 59 (15.4%) |
| 4 Vehicles | 57 (12.4%) | 70 (18.3%) |
| 5 or more Vehicles | 40 (8.7%) | 68 (17.8%) |
| Total | 460 (100.0%) | 382 (100.0%) |
Commute Time in Estell Manor
The most frequently occuring commute durations in Estell Manor are 30 to 34 minutes (236 commuters, 30.2%), 25 to 29 minutes (122 commuters, 15.6%), and 40 to 44 minutes (82 commuters, 10.5%).
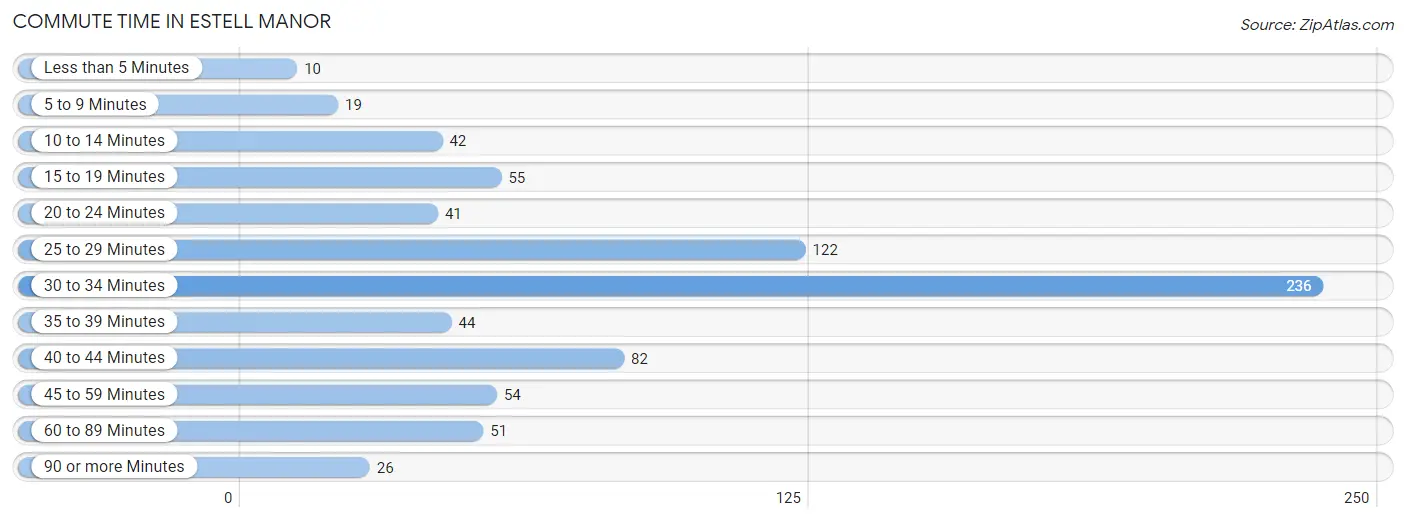
| Commute Time | # Commuters | % Commuters |
| Less than 5 Minutes | 10 | 1.3% |
| 5 to 9 Minutes | 19 | 2.4% |
| 10 to 14 Minutes | 42 | 5.4% |
| 15 to 19 Minutes | 55 | 7.0% |
| 20 to 24 Minutes | 41 | 5.2% |
| 25 to 29 Minutes | 122 | 15.6% |
| 30 to 34 Minutes | 236 | 30.2% |
| 35 to 39 Minutes | 44 | 5.6% |
| 40 to 44 Minutes | 82 | 10.5% |
| 45 to 59 Minutes | 54 | 6.9% |
| 60 to 89 Minutes | 51 | 6.5% |
| 90 or more Minutes | 26 | 3.3% |
Commute Time by Sex in Estell Manor
The most common commute times in Estell Manor are 30 to 34 minutes (119 commuters, 26.7%) for males and 30 to 34 minutes (117 commuters, 34.7%) for females.
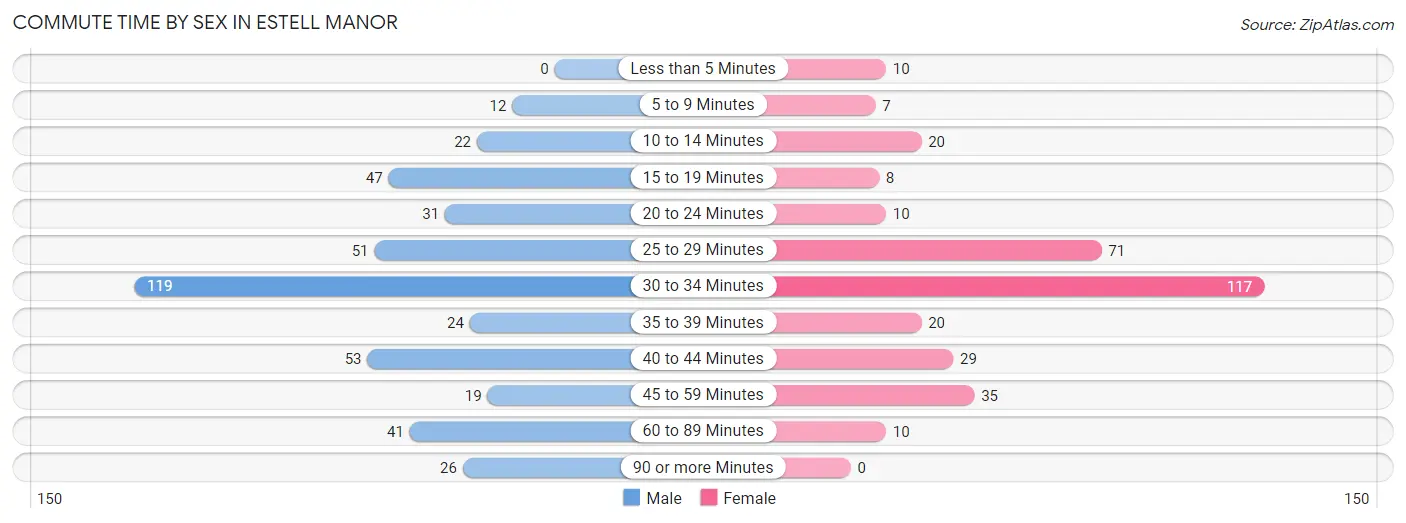
| Commute Time | Male | Female |
| Less than 5 Minutes | 0 (0.0%) | 10 (3.0%) |
| 5 to 9 Minutes | 12 (2.7%) | 7 (2.1%) |
| 10 to 14 Minutes | 22 (4.9%) | 20 (5.9%) |
| 15 to 19 Minutes | 47 (10.6%) | 8 (2.4%) |
| 20 to 24 Minutes | 31 (7.0%) | 10 (3.0%) |
| 25 to 29 Minutes | 51 (11.5%) | 71 (21.1%) |
| 30 to 34 Minutes | 119 (26.7%) | 117 (34.7%) |
| 35 to 39 Minutes | 24 (5.4%) | 20 (5.9%) |
| 40 to 44 Minutes | 53 (11.9%) | 29 (8.6%) |
| 45 to 59 Minutes | 19 (4.3%) | 35 (10.4%) |
| 60 to 89 Minutes | 41 (9.2%) | 10 (3.0%) |
| 90 or more Minutes | 26 (5.8%) | 0 (0.0%) |
Time of Departure to Work by Sex in Estell Manor
The most frequent times of departure to work in Estell Manor are 7:00 AM to 7:29 AM (111, 24.9%) for males and 8:00 AM to 8:29 AM (69, 20.5%) for females.
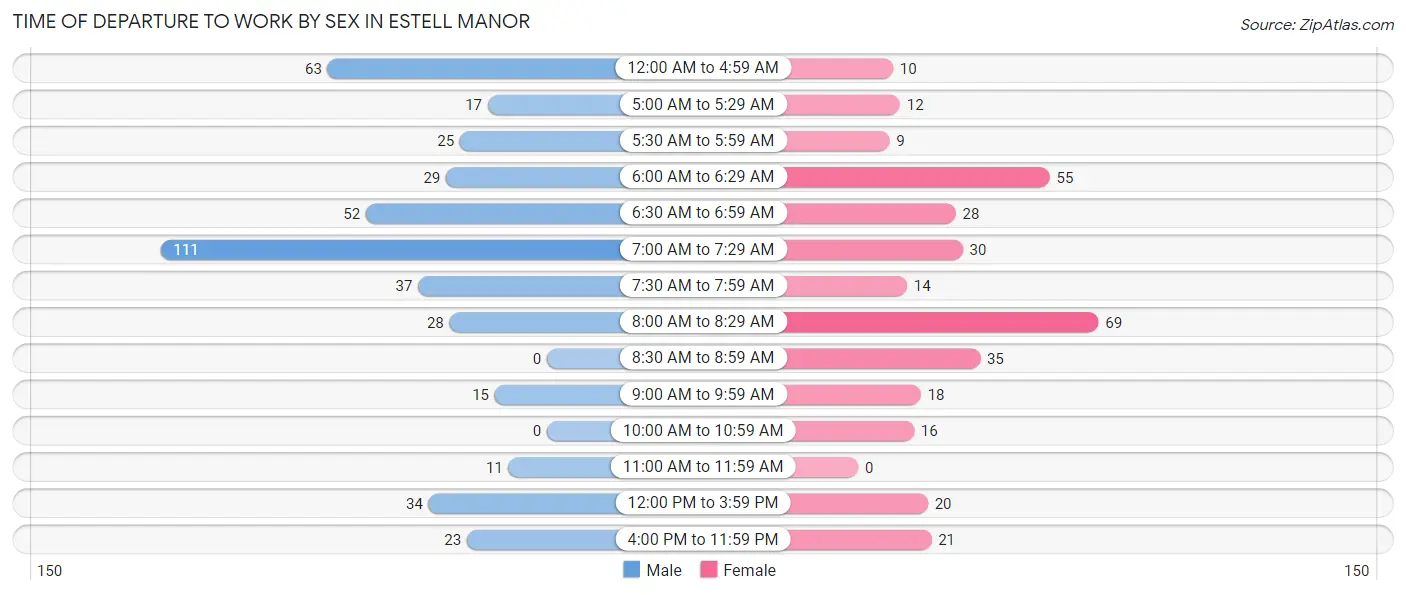
| Time of Departure | Male | Female |
| 12:00 AM to 4:59 AM | 63 (14.2%) | 10 (3.0%) |
| 5:00 AM to 5:29 AM | 17 (3.8%) | 12 (3.6%) |
| 5:30 AM to 5:59 AM | 25 (5.6%) | 9 (2.7%) |
| 6:00 AM to 6:29 AM | 29 (6.5%) | 55 (16.3%) |
| 6:30 AM to 6:59 AM | 52 (11.7%) | 28 (8.3%) |
| 7:00 AM to 7:29 AM | 111 (24.9%) | 30 (8.9%) |
| 7:30 AM to 7:59 AM | 37 (8.3%) | 14 (4.2%) |
| 8:00 AM to 8:29 AM | 28 (6.3%) | 69 (20.5%) |
| 8:30 AM to 8:59 AM | 0 (0.0%) | 35 (10.4%) |
| 9:00 AM to 9:59 AM | 15 (3.4%) | 18 (5.3%) |
| 10:00 AM to 10:59 AM | 0 (0.0%) | 16 (4.8%) |
| 11:00 AM to 11:59 AM | 11 (2.5%) | 0 (0.0%) |
| 12:00 PM to 3:59 PM | 34 (7.6%) | 20 (5.9%) |
| 4:00 PM to 11:59 PM | 23 (5.2%) | 21 (6.2%) |
| Total | 445 (100.0%) | 337 (100.0%) |
Housing Occupancy in Estell Manor
Occupancy by Ownership in Estell Manor
Of the total 598 dwellings in Estell Manor, owner-occupied units account for 578 (96.7%), while renter-occupied units make up 20 (3.3%).
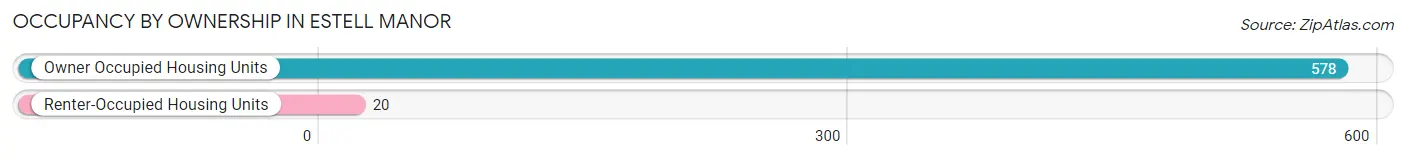
| Occupancy | # Housing Units | % Housing Units |
| Owner Occupied Housing Units | 578 | 96.7% |
| Renter-Occupied Housing Units | 20 | 3.3% |
| Total Occupied Housing Units | 598 | 100.0% |
Occupancy by Household Size in Estell Manor
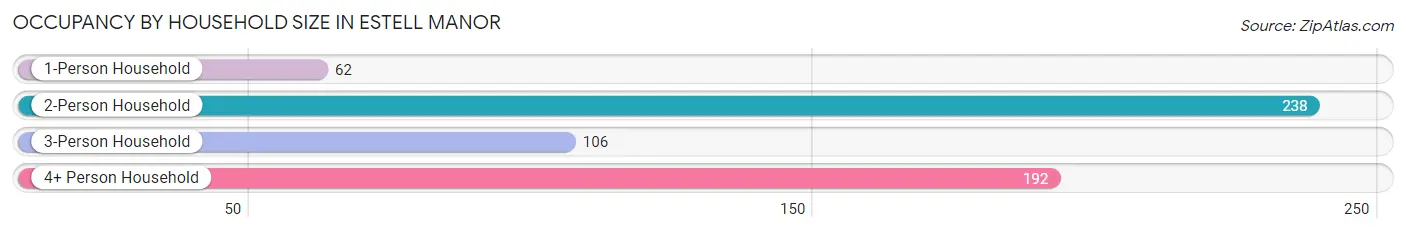
| Household Size | # Housing Units | % Housing Units |
| 1-Person Household | 62 | 10.4% |
| 2-Person Household | 238 | 39.8% |
| 3-Person Household | 106 | 17.7% |
| 4+ Person Household | 192 | 32.1% |
| Total Housing Units | 598 | 100.0% |
Occupancy by Ownership by Household Size in Estell Manor
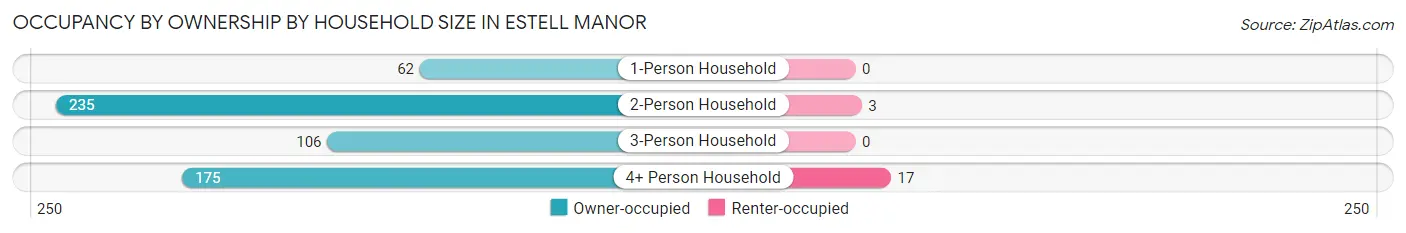
| Household Size | Owner-occupied | Renter-occupied |
| 1-Person Household | 62 (100.0%) | 0 (0.0%) |
| 2-Person Household | 235 (98.7%) | 3 (1.3%) |
| 3-Person Household | 106 (100.0%) | 0 (0.0%) |
| 4+ Person Household | 175 (91.1%) | 17 (8.8%) |
| Total Housing Units | 578 (96.7%) | 20 (3.3%) |
Occupancy by Educational Attainment in Estell Manor

| Household Size | Owner-occupied | Renter-occupied |
| Less than High School | 16 (100.0%) | 0 (0.0%) |
| High School Diploma | 183 (98.4%) | 3 (1.6%) |
| College/Associate Degree | 159 (93.0%) | 12 (7.0%) |
| Bachelor's Degree or higher | 220 (97.8%) | 5 (2.2%) |
Occupancy by Age of Householder in Estell Manor
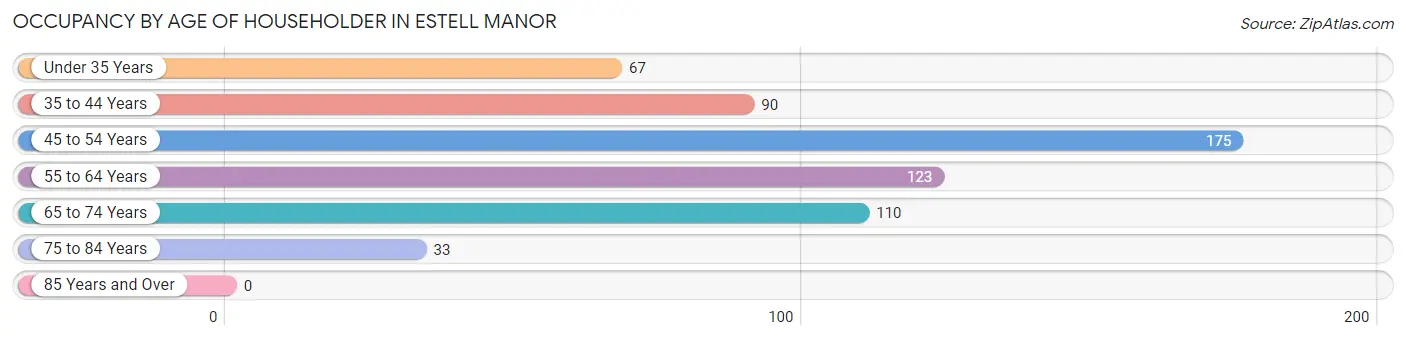
| Age Bracket | # Households | % Households |
| Under 35 Years | 67 | 11.2% |
| 35 to 44 Years | 90 | 15.0% |
| 45 to 54 Years | 175 | 29.3% |
| 55 to 64 Years | 123 | 20.6% |
| 65 to 74 Years | 110 | 18.4% |
| 75 to 84 Years | 33 | 5.5% |
| 85 Years and Over | 0 | 0.0% |
| Total | 598 | 100.0% |
Housing Finances in Estell Manor
Median Income by Occupancy in Estell Manor
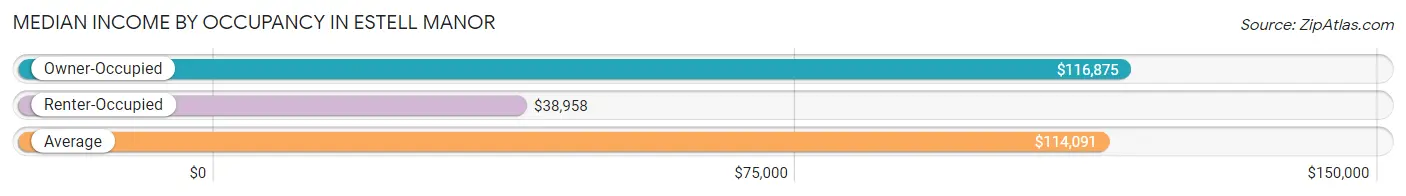
| Occupancy Type | # Households | Median Income |
| Owner-Occupied | 578 (96.7%) | $116,875 |
| Renter-Occupied | 20 (3.3%) | $38,958 |
| Average | 598 (100.0%) | $114,091 |
Occupancy by Householder Income Bracket in Estell Manor
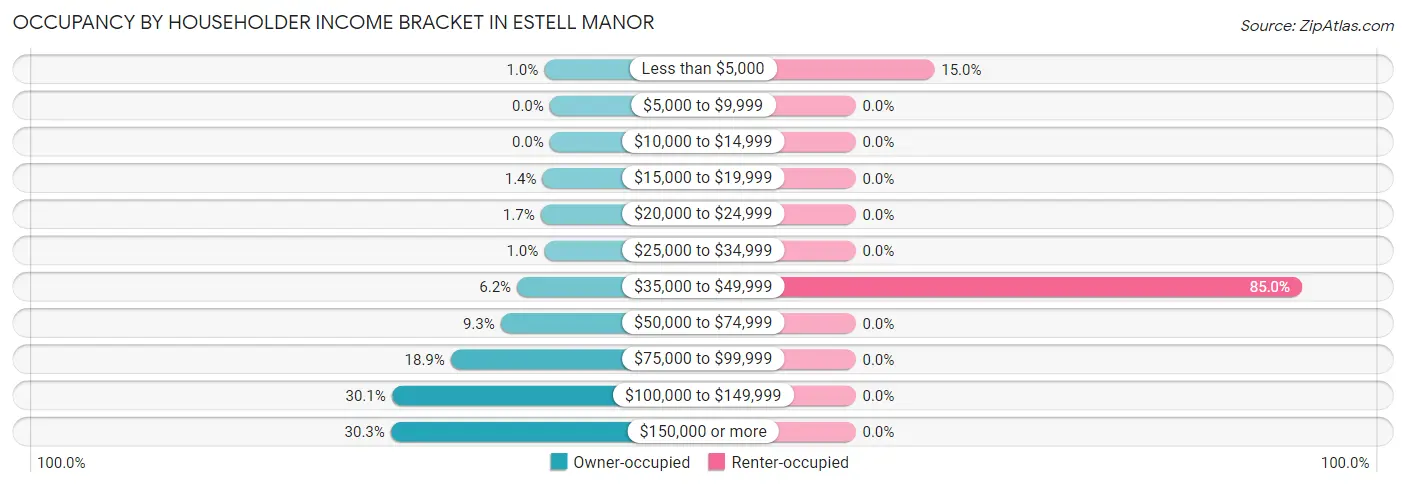
| Income Bracket | Owner-occupied | Renter-occupied |
| Less than $5,000 | 6 (1.0%) | 3 (15.0%) |
| $5,000 to $9,999 | 0 (0.0%) | 0 (0.0%) |
| $10,000 to $14,999 | 0 (0.0%) | 0 (0.0%) |
| $15,000 to $19,999 | 8 (1.4%) | 0 (0.0%) |
| $20,000 to $24,999 | 10 (1.7%) | 0 (0.0%) |
| $25,000 to $34,999 | 6 (1.0%) | 0 (0.0%) |
| $35,000 to $49,999 | 36 (6.2%) | 17 (85.0%) |
| $50,000 to $74,999 | 54 (9.3%) | 0 (0.0%) |
| $75,000 to $99,999 | 109 (18.9%) | 0 (0.0%) |
| $100,000 to $149,999 | 174 (30.1%) | 0 (0.0%) |
| $150,000 or more | 175 (30.3%) | 0 (0.0%) |
| Total | 578 (100.0%) | 20 (100.0%) |
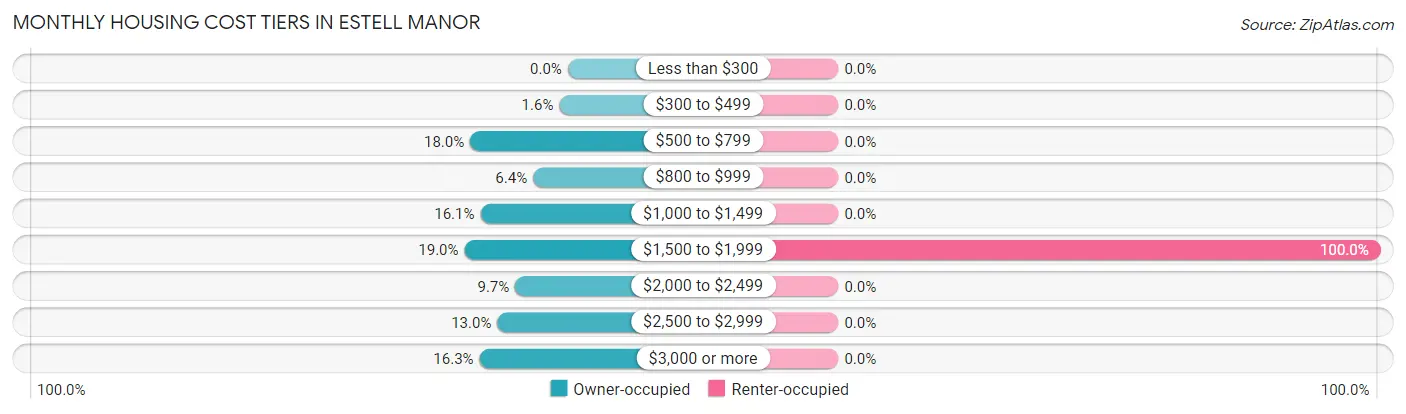
Monthly Housing Cost Tiers in Estell Manor
| Monthly Cost | Owner-occupied | Renter-occupied |
| Less than $300 | 0 (0.0%) | 0 (0.0%) |
| $300 to $499 | 9 (1.6%) | 0 (0.0%) |
| $500 to $799 | 104 (18.0%) | 0 (0.0%) |
| $800 to $999 | 37 (6.4%) | 0 (0.0%) |
| $1,000 to $1,499 | 93 (16.1%) | 0 (0.0%) |
| $1,500 to $1,999 | 110 (19.0%) | 20 (100.0%) |
| $2,000 to $2,499 | 56 (9.7%) | 0 (0.0%) |
| $2,500 to $2,999 | 75 (13.0%) | 0 (0.0%) |
| $3,000 or more | 94 (16.3%) | 0 (0.0%) |
| Total | 578 (100.0%) | 20 (100.0%) |
Physical Housing Characteristics in Estell Manor
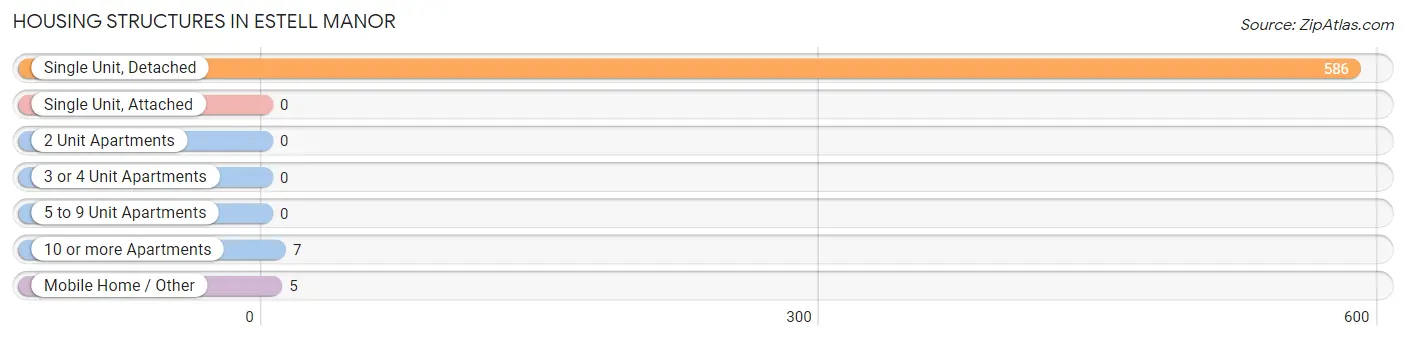
Housing Structures in Estell Manor
| Structure Type | # Housing Units | % Housing Units |
| Single Unit, Detached | 586 | 98.0% |
| Single Unit, Attached | 0 | 0.0% |
| 2 Unit Apartments | 0 | 0.0% |
| 3 or 4 Unit Apartments | 0 | 0.0% |
| 5 to 9 Unit Apartments | 0 | 0.0% |
| 10 or more Apartments | 7 | 1.2% |
| Mobile Home / Other | 5 | 0.8% |
| Total | 598 | 100.0% |
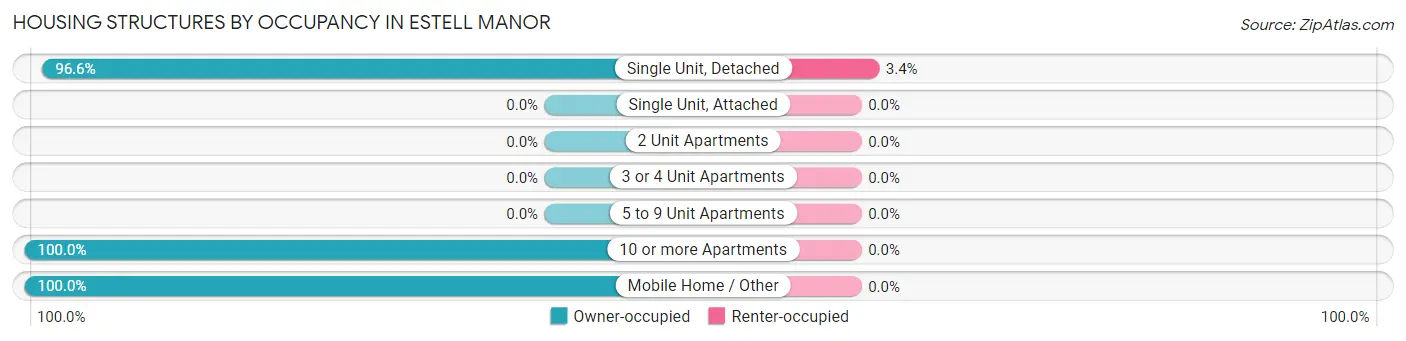
Housing Structures by Occupancy in Estell Manor
| Structure Type | Owner-occupied | Renter-occupied |
| Single Unit, Detached | 566 (96.6%) | 20 (3.4%) |
| Single Unit, Attached | 0 (0.0%) | 0 (0.0%) |
| 2 Unit Apartments | 0 (0.0%) | 0 (0.0%) |
| 3 or 4 Unit Apartments | 0 (0.0%) | 0 (0.0%) |
| 5 to 9 Unit Apartments | 0 (0.0%) | 0 (0.0%) |
| 10 or more Apartments | 7 (100.0%) | 0 (0.0%) |
| Mobile Home / Other | 5 (100.0%) | 0 (0.0%) |
| Total | 578 (96.7%) | 20 (3.3%) |
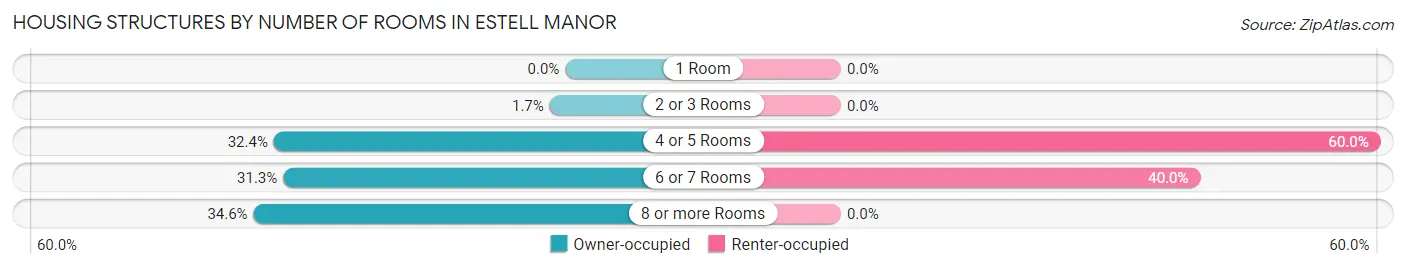
Housing Structures by Number of Rooms in Estell Manor
| Number of Rooms | Owner-occupied | Renter-occupied |
| 1 Room | 0 (0.0%) | 0 (0.0%) |
| 2 or 3 Rooms | 10 (1.7%) | 0 (0.0%) |
| 4 or 5 Rooms | 187 (32.4%) | 12 (60.0%) |
| 6 or 7 Rooms | 181 (31.3%) | 8 (40.0%) |
| 8 or more Rooms | 200 (34.6%) | 0 (0.0%) |
| Total | 578 (100.0%) | 20 (100.0%) |
Housing Structure by Heating Type in Estell Manor
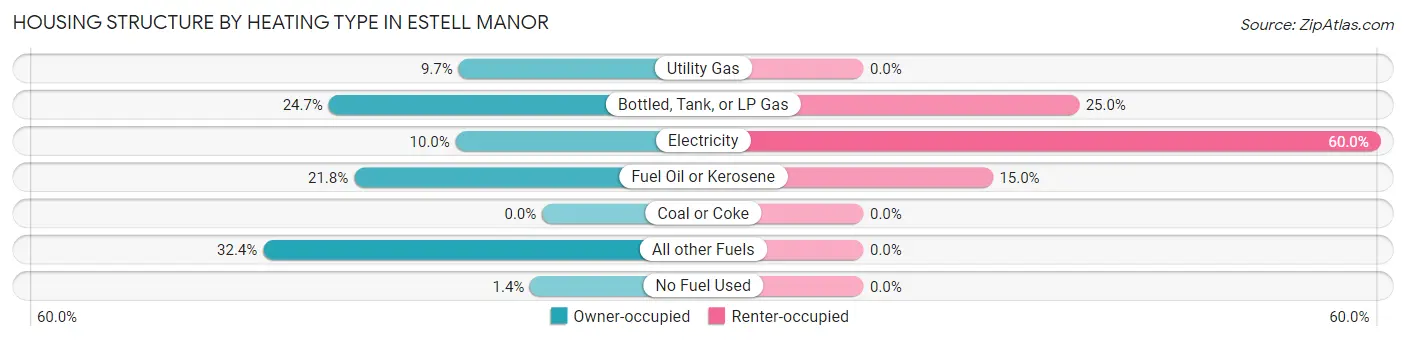
| Heating Type | Owner-occupied | Renter-occupied |
| Utility Gas | 56 (9.7%) | 0 (0.0%) |
| Bottled, Tank, or LP Gas | 143 (24.7%) | 5 (25.0%) |
| Electricity | 58 (10.0%) | 12 (60.0%) |
| Fuel Oil or Kerosene | 126 (21.8%) | 3 (15.0%) |
| Coal or Coke | 0 (0.0%) | 0 (0.0%) |
| All other Fuels | 187 (32.4%) | 0 (0.0%) |
| No Fuel Used | 8 (1.4%) | 0 (0.0%) |
| Total | 578 (100.0%) | 20 (100.0%) |
Household Vehicle Usage in Estell Manor
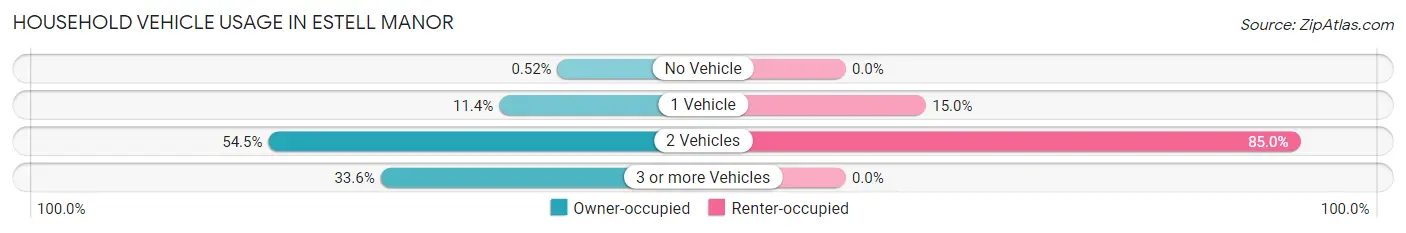
| Vehicles per Household | Owner-occupied | Renter-occupied |
| No Vehicle | 3 (0.5%) | 0 (0.0%) |
| 1 Vehicle | 66 (11.4%) | 3 (15.0%) |
| 2 Vehicles | 315 (54.5%) | 17 (85.0%) |
| 3 or more Vehicles | 194 (33.6%) | 0 (0.0%) |
| Total | 578 (100.0%) | 20 (100.0%) |
Real Estate & Mortgages in Estell Manor
Real Estate and Mortgage Overview in Estell Manor
| Characteristic | Without Mortgage | With Mortgage |
| Housing Units | 184 | 394 |
| Median Property Value | $209,800 | $311,800 |
| Median Household Income | $91,471 | $148 |
| Monthly Housing Costs | $709 | $94 |
| Real Estate Taxes | $4,971 | $12 |
Property Value by Mortgage Status in Estell Manor
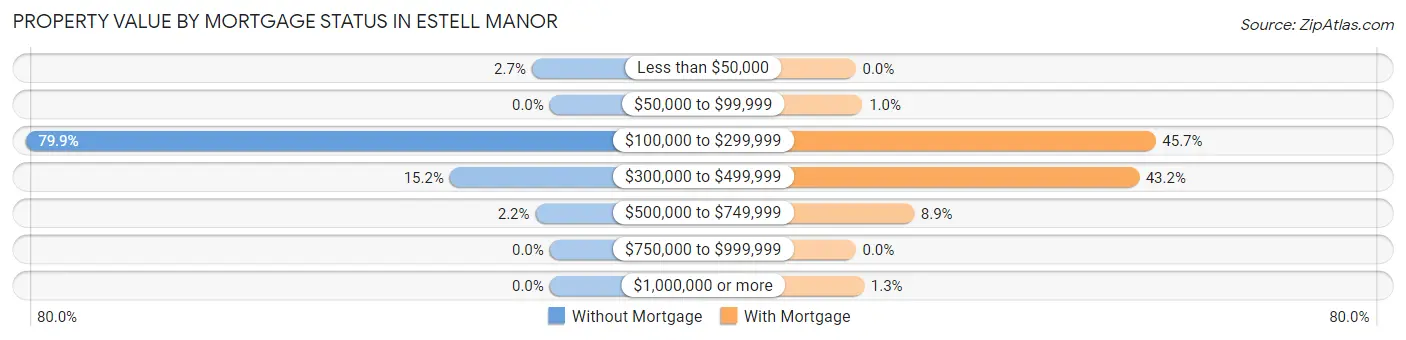
| Property Value | Without Mortgage | With Mortgage |
| Less than $50,000 | 5 (2.7%) | 0 (0.0%) |
| $50,000 to $99,999 | 0 (0.0%) | 4 (1.0%) |
| $100,000 to $299,999 | 147 (79.9%) | 180 (45.7%) |
| $300,000 to $499,999 | 28 (15.2%) | 170 (43.1%) |
| $500,000 to $749,999 | 4 (2.2%) | 35 (8.9%) |
| $750,000 to $999,999 | 0 (0.0%) | 0 (0.0%) |
| $1,000,000 or more | 0 (0.0%) | 5 (1.3%) |
| Total | 184 (100.0%) | 394 (100.0%) |
Household Income by Mortgage Status in Estell Manor
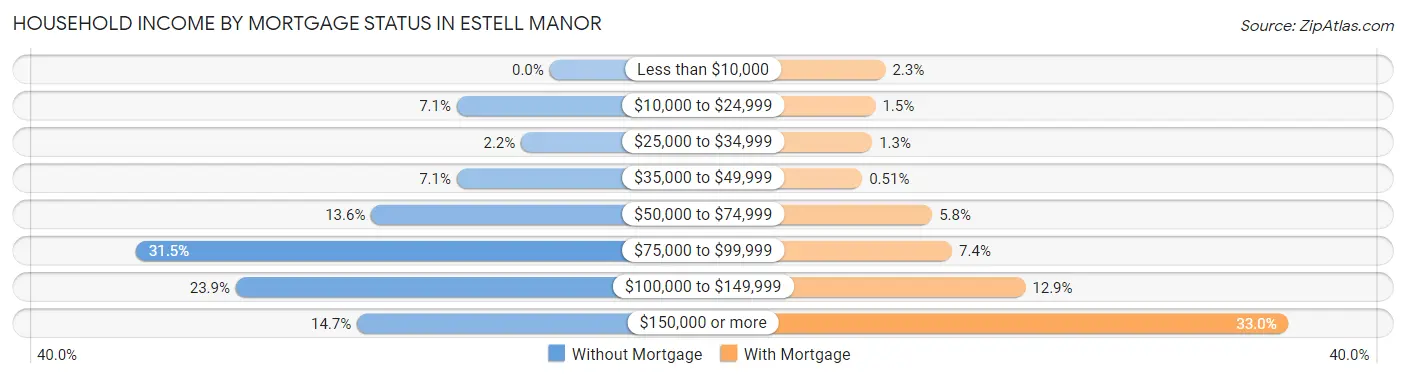
| Household Income | Without Mortgage | With Mortgage |
| Less than $10,000 | 0 (0.0%) | 9 (2.3%) |
| $10,000 to $24,999 | 13 (7.1%) | 6 (1.5%) |
| $25,000 to $34,999 | 4 (2.2%) | 5 (1.3%) |
| $35,000 to $49,999 | 13 (7.1%) | 2 (0.5%) |
| $50,000 to $74,999 | 25 (13.6%) | 23 (5.8%) |
| $75,000 to $99,999 | 58 (31.5%) | 29 (7.4%) |
| $100,000 to $149,999 | 44 (23.9%) | 51 (12.9%) |
| $150,000 or more | 27 (14.7%) | 130 (33.0%) |
| Total | 184 (100.0%) | 394 (100.0%) |
Property Value to Household Income Ratio in Estell Manor
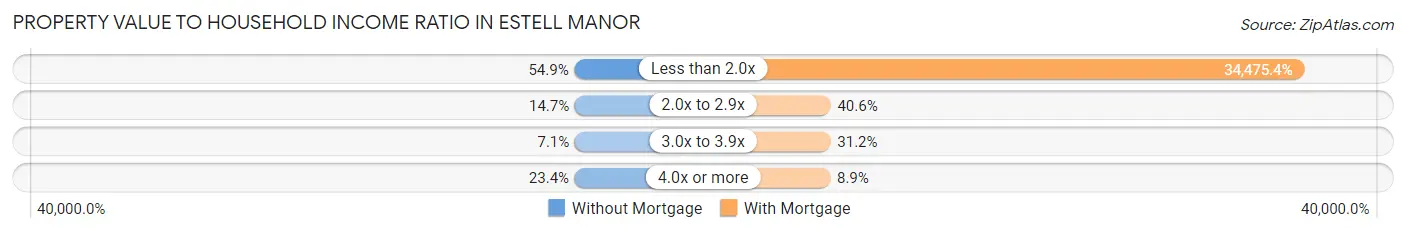
| Value-to-Income Ratio | Without Mortgage | With Mortgage |
| Less than 2.0x | 101 (54.9%) | 135,833 (34,475.4%) |
| 2.0x to 2.9x | 27 (14.7%) | 160 (40.6%) |
| 3.0x to 3.9x | 13 (7.1%) | 123 (31.2%) |
| 4.0x or more | 43 (23.4%) | 35 (8.9%) |
| Total | 184 (100.0%) | 394 (100.0%) |
Real Estate Taxes by Mortgage Status in Estell Manor
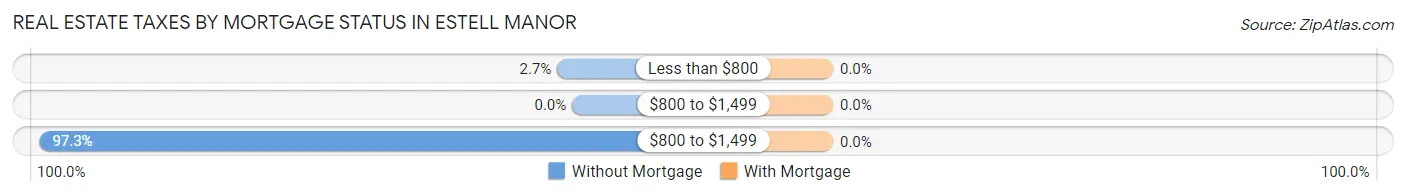
| Property Taxes | Without Mortgage | With Mortgage |
| Less than $800 | 5 (2.7%) | 0 (0.0%) |
| $800 to $1,499 | 0 (0.0%) | 0 (0.0%) |
| $800 to $1,499 | 179 (97.3%) | 0 (0.0%) |
| Total | 184 (100.0%) | 394 (100.0%) |
Health & Disability in Estell Manor
Health Insurance Coverage by Age in Estell Manor
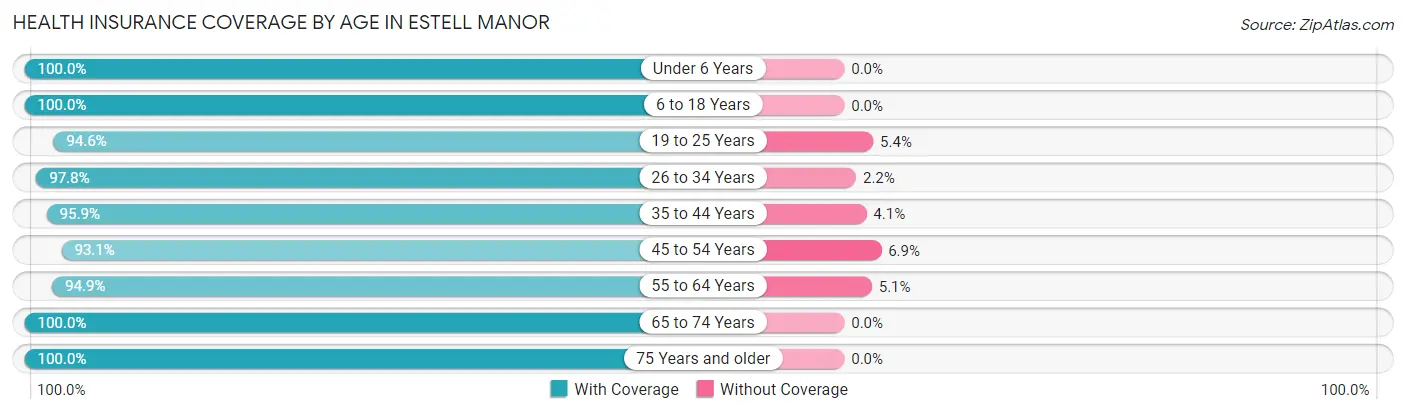
| Age Bracket | With Coverage | Without Coverage |
| Under 6 Years | 114 (100.0%) | 0 (0.0%) |
| 6 to 18 Years | 285 (100.0%) | 0 (0.0%) |
| 19 to 25 Years | 176 (94.6%) | 10 (5.4%) |
| 26 to 34 Years | 179 (97.8%) | 4 (2.2%) |
| 35 to 44 Years | 186 (95.9%) | 8 (4.1%) |
| 45 to 54 Years | 257 (93.1%) | 19 (6.9%) |
| 55 to 64 Years | 222 (94.9%) | 12 (5.1%) |
| 65 to 74 Years | 189 (100.0%) | 0 (0.0%) |
| 75 Years and older | 67 (100.0%) | 0 (0.0%) |
| Total | 1,675 (96.9%) | 53 (3.1%) |
Health Insurance Coverage by Citizenship Status in Estell Manor

| Citizenship Status | With Coverage | Without Coverage |
| Native Born | 114 (100.0%) | 0 (0.0%) |
| Foreign Born, Citizen | 285 (100.0%) | 0 (0.0%) |
| Foreign Born, not a Citizen | 176 (94.6%) | 10 (5.4%) |
Health Insurance Coverage by Household Income in Estell Manor
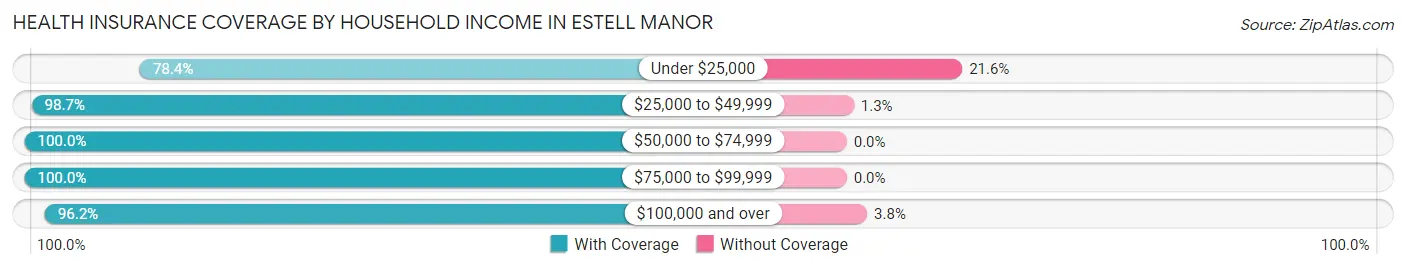
| Household Income | With Coverage | Without Coverage |
| Under $25,000 | 29 (78.4%) | 8 (21.6%) |
| $25,000 to $49,999 | 149 (98.7%) | 2 (1.3%) |
| $50,000 to $74,999 | 89 (100.0%) | 0 (0.0%) |
| $75,000 to $99,999 | 323 (100.0%) | 0 (0.0%) |
| $100,000 and over | 1,085 (96.2%) | 43 (3.8%) |
Public vs Private Health Insurance Coverage by Age in Estell Manor
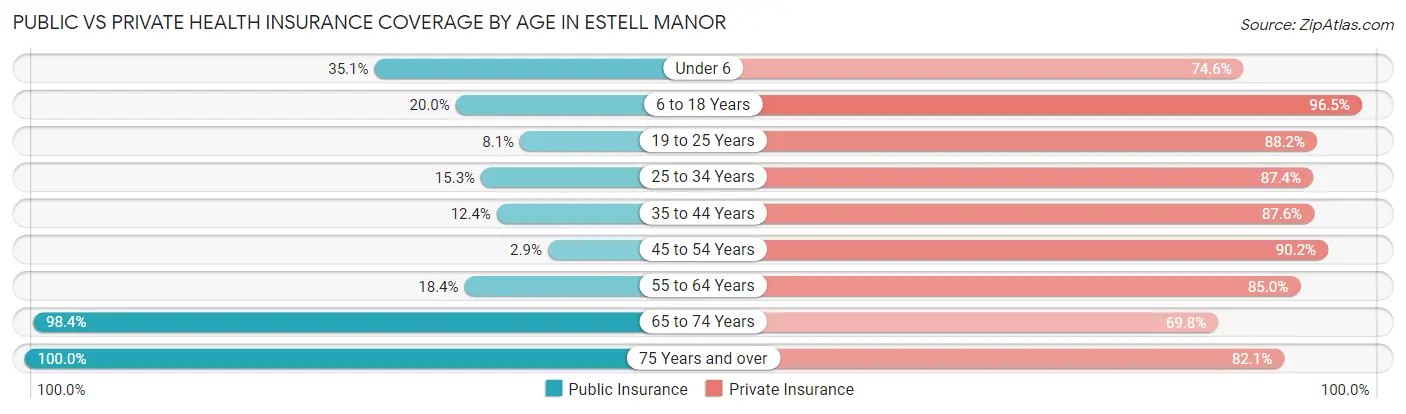
| Age Bracket | Public Insurance | Private Insurance |
| Under 6 | 40 (35.1%) | 85 (74.6%) |
| 6 to 18 Years | 57 (20.0%) | 275 (96.5%) |
| 19 to 25 Years | 15 (8.1%) | 164 (88.2%) |
| 25 to 34 Years | 28 (15.3%) | 160 (87.4%) |
| 35 to 44 Years | 24 (12.4%) | 170 (87.6%) |
| 45 to 54 Years | 8 (2.9%) | 249 (90.2%) |
| 55 to 64 Years | 43 (18.4%) | 199 (85.0%) |
| 65 to 74 Years | 186 (98.4%) | 132 (69.8%) |
| 75 Years and over | 67 (100.0%) | 55 (82.1%) |
| Total | 468 (27.1%) | 1,489 (86.2%) |
Disability Status by Sex by Age in Estell Manor
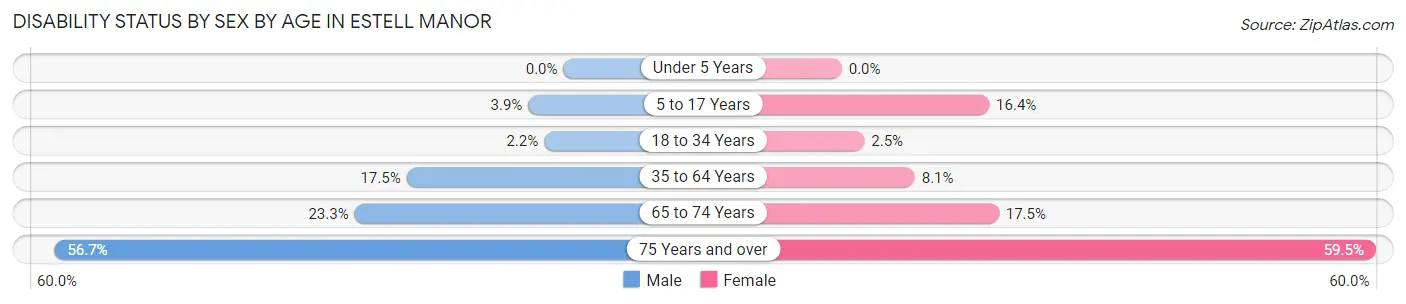
| Age Bracket | Male | Female |
| Under 5 Years | 0 (0.0%) | 0 (0.0%) |
| 5 to 17 Years | 6 (3.9%) | 21 (16.4%) |
| 18 to 34 Years | 4 (2.1%) | 5 (2.5%) |
| 35 to 64 Years | 65 (17.5%) | 27 (8.1%) |
| 65 to 74 Years | 20 (23.3%) | 18 (17.5%) |
| 75 Years and over | 17 (56.7%) | 22 (59.5%) |
Disability Class by Sex by Age in Estell Manor
Disability Class: Hearing Difficulty
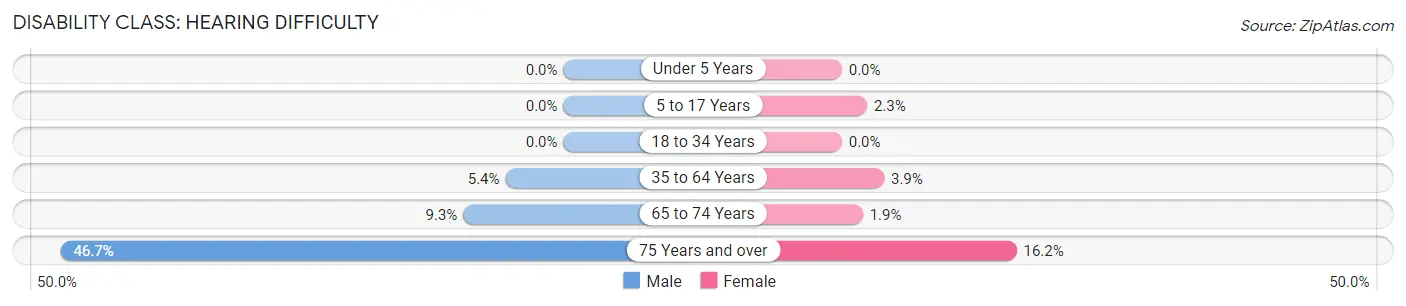
| Age Bracket | Male | Female |
| Under 5 Years | 0 (0.0%) | 0 (0.0%) |
| 5 to 17 Years | 0 (0.0%) | 3 (2.3%) |
| 18 to 34 Years | 0 (0.0%) | 0 (0.0%) |
| 35 to 64 Years | 20 (5.4%) | 13 (3.9%) |
| 65 to 74 Years | 8 (9.3%) | 2 (1.9%) |
| 75 Years and over | 14 (46.7%) | 6 (16.2%) |
Disability Class: Vision Difficulty
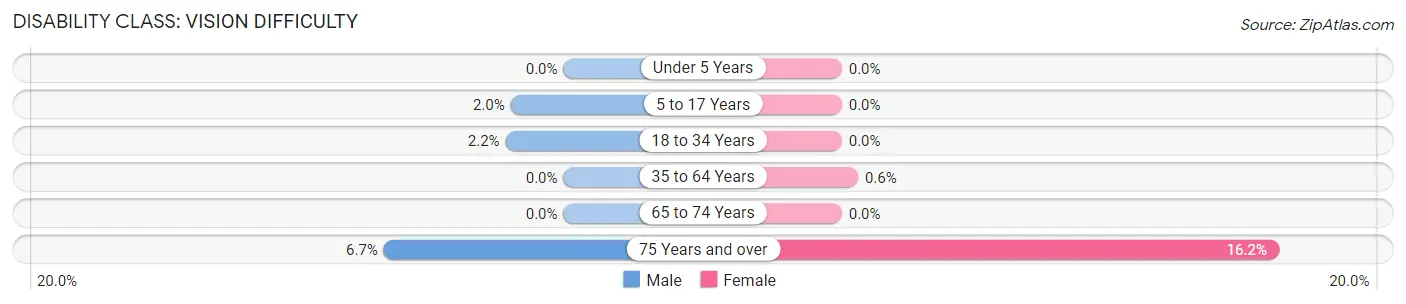
| Age Bracket | Male | Female |
| Under 5 Years | 0 (0.0%) | 0 (0.0%) |
| 5 to 17 Years | 3 (2.0%) | 0 (0.0%) |
| 18 to 34 Years | 4 (2.1%) | 0 (0.0%) |
| 35 to 64 Years | 0 (0.0%) | 2 (0.6%) |
| 65 to 74 Years | 0 (0.0%) | 0 (0.0%) |
| 75 Years and over | 2 (6.7%) | 6 (16.2%) |
Disability Class: Cognitive Difficulty
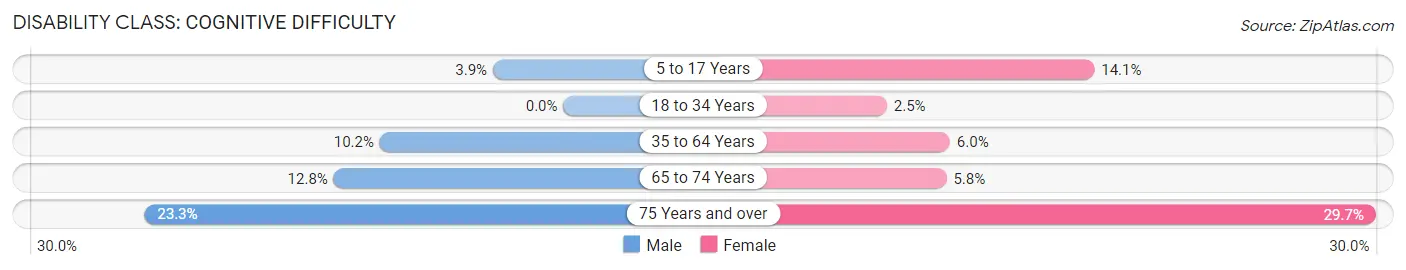
| Age Bracket | Male | Female |
| 5 to 17 Years | 6 (3.9%) | 18 (14.1%) |
| 18 to 34 Years | 0 (0.0%) | 5 (2.5%) |
| 35 to 64 Years | 38 (10.2%) | 20 (6.0%) |
| 65 to 74 Years | 11 (12.8%) | 6 (5.8%) |
| 75 Years and over | 7 (23.3%) | 11 (29.7%) |
Disability Class: Ambulatory Difficulty
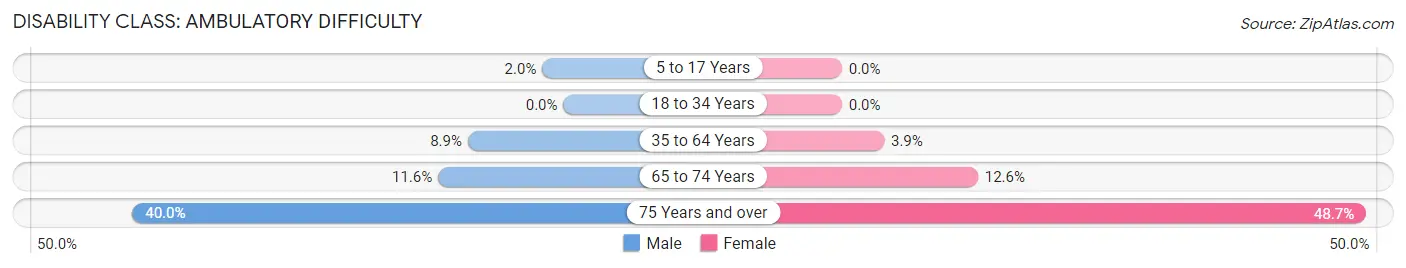
| Age Bracket | Male | Female |
| 5 to 17 Years | 3 (2.0%) | 0 (0.0%) |
| 18 to 34 Years | 0 (0.0%) | 0 (0.0%) |
| 35 to 64 Years | 33 (8.9%) | 13 (3.9%) |
| 65 to 74 Years | 10 (11.6%) | 13 (12.6%) |
| 75 Years and over | 12 (40.0%) | 18 (48.6%) |
Disability Class: Self-Care Difficulty

| Age Bracket | Male | Female |
| 5 to 17 Years | 3 (2.0%) | 3 (2.3%) |
| 18 to 34 Years | 0 (0.0%) | 5 (2.5%) |
| 35 to 64 Years | 10 (2.7%) | 4 (1.2%) |
| 65 to 74 Years | 0 (0.0%) | 3 (2.9%) |
| 75 Years and over | 12 (40.0%) | 5 (13.5%) |
Technology Access in Estell Manor
Computing Device Access in Estell Manor
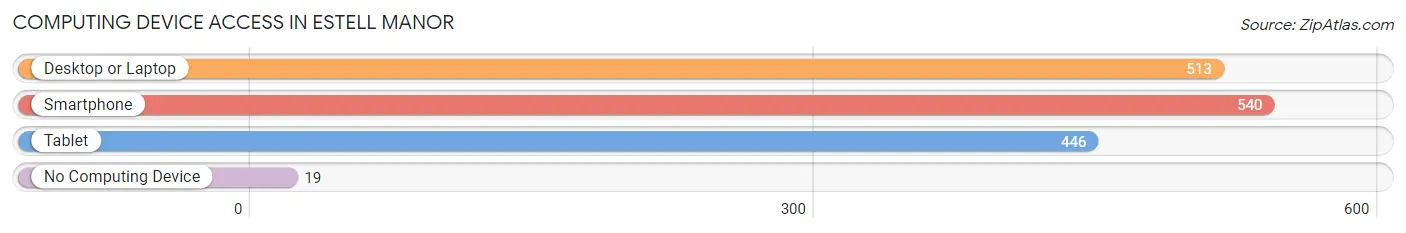
| Device Type | # Households | % Households |
| Desktop or Laptop | 513 | 85.8% |
| Smartphone | 540 | 90.3% |
| Tablet | 446 | 74.6% |
| No Computing Device | 19 | 3.2% |
| Total | 598 | 100.0% |
Internet Access in Estell Manor
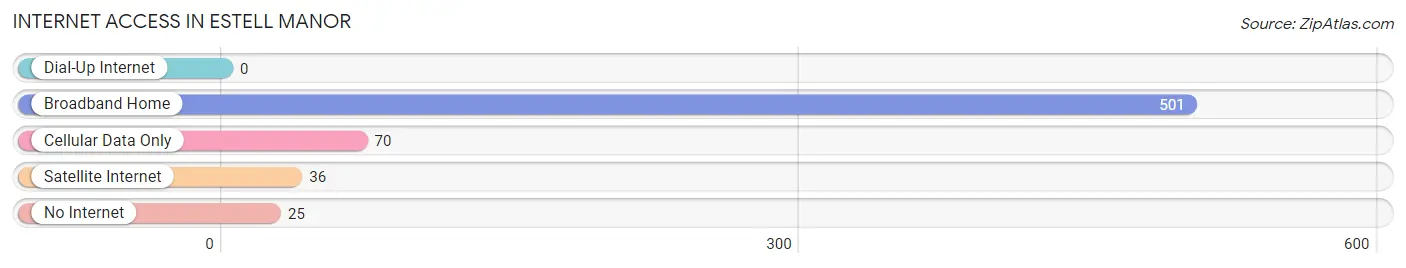
| Internet Type | # Households | % Households |
| Dial-Up Internet | 0 | 0.0% |
| Broadband Home | 501 | 83.8% |
| Cellular Data Only | 70 | 11.7% |
| Satellite Internet | 36 | 6.0% |
| No Internet | 25 | 4.2% |
| Total | 598 | 100.0% |
Estell Manor Summary
Estell Manor is a small city located in Atlantic County, New Jersey. It is situated on the banks of the Great Egg Harbor River, approximately 10 miles west of Atlantic City. Estell Manor was founded in 1798 by John Estell, a Quaker from Pennsylvania. The city was named after him and has been a part of Atlantic County since its incorporation in 1891.
Geography
Estell Manor is located at 39°25'N 74°45'W. It is situated on the banks of the Great Egg Harbor River, approximately 10 miles west of Atlantic City. The city covers an area of 1.3 square miles, all of which is land. Estell Manor is bordered by Buena Vista Township to the north, Weymouth Township to the east, and Hamilton Township to the south and west.
The city is located in the Atlantic Coastal Plain, a flat, low-lying region of sandy soil and pine forests. The climate is humid subtropical, with hot, humid summers and mild winters. The average annual temperature is around 60°F, with an average high of around 80°F in the summer and an average low of around 40°F in the winter.
Economy
Estell Manor’s economy is largely based on agriculture and tourism. The city is home to several farms, which produce a variety of fruits and vegetables, as well as dairy products. Estell Manor is also a popular destination for tourists, who come to enjoy the city’s beaches, fishing, and other outdoor activities.
The city is also home to several small businesses, including restaurants, retail stores, and service providers. Estell Manor is also home to a number of manufacturing companies, which produce a variety of products, including furniture, clothing, and electronics.
Demographics
As of the 2010 census, Estell Manor had a population of 1,717. The racial makeup of the city was 94.2% White, 2.2% African American, 0.3% Native American, 0.7% Asian, 0.1% Pacific Islander, and 2.5% from other races. Hispanic or Latino of any race were 4.2% of the population.
The median household income in Estell Manor was $45,938, and the median family income was $51,964. The per capita income was $20,945. About 8.3% of families and 10.2% of the population were below the poverty line, including 14.2% of those under age 18 and 8.2% of those age 65 or over.
Estell Manor is served by the Estell Manor School District, which consists of one elementary school, one middle school, and one high school. The city is also home to a branch of Atlantic Cape Community College.
Estell Manor is a small city with a rich history and a diverse population. It is a popular destination for tourists, and its economy is largely based on agriculture and tourism. The city is also home to several small businesses, manufacturing companies, and educational institutions. Estell Manor is a great place to live, work, and visit.
Common Questions
What is Per Capita Income in Estell Manor?
Per Capita income in Estell Manor is $47,253.
What is the Median Family Income in Estell Manor?
Median Family Income in Estell Manor is $127,750.
What is the Median Household income in Estell Manor?
Median Household Income in Estell Manor is $114,091.
What is Income or Wage Gap in Estell Manor?
Income or Wage Gap in Estell Manor is 16.5%.
Women in Estell Manor earn 83.5 cents for every dollar earned by a man.
What is Inequality or Gini Index in Estell Manor?
Inequality or Gini Index in Estell Manor is 0.38.
What is the Total Population of Estell Manor?
Total Population of Estell Manor is 1,729.
What is the Total Male Population of Estell Manor?
Total Male Population of Estell Manor is 896.
What is the Total Female Population of Estell Manor?
Total Female Population of Estell Manor is 833.
What is the Ratio of Males per 100 Females in Estell Manor?
There are 107.56 Males per 100 Females in Estell Manor.
What is the Ratio of Females per 100 Males in Estell Manor?
There are 92.97 Females per 100 Males in Estell Manor.
What is the Median Population Age in Estell Manor?
Median Population Age in Estell Manor is 40.3 Years.
What is the Average Family Size in Estell Manor
Average Family Size in Estell Manor is 3.1 People.
What is the Average Household Size in Estell Manor
Average Household Size in Estell Manor is 2.9 People.
How Large is the Labor Force in Estell Manor?
There are 885 People in the Labor Forcein in Estell Manor.
What is the Percentage of People in the Labor Force in Estell Manor?
64.1% of People are in the Labor Force in Estell Manor.
What is the Unemployment Rate in Estell Manor?
Unemployment Rate in Estell Manor is 3.7%.