Beverly, NJ Map & Demographics
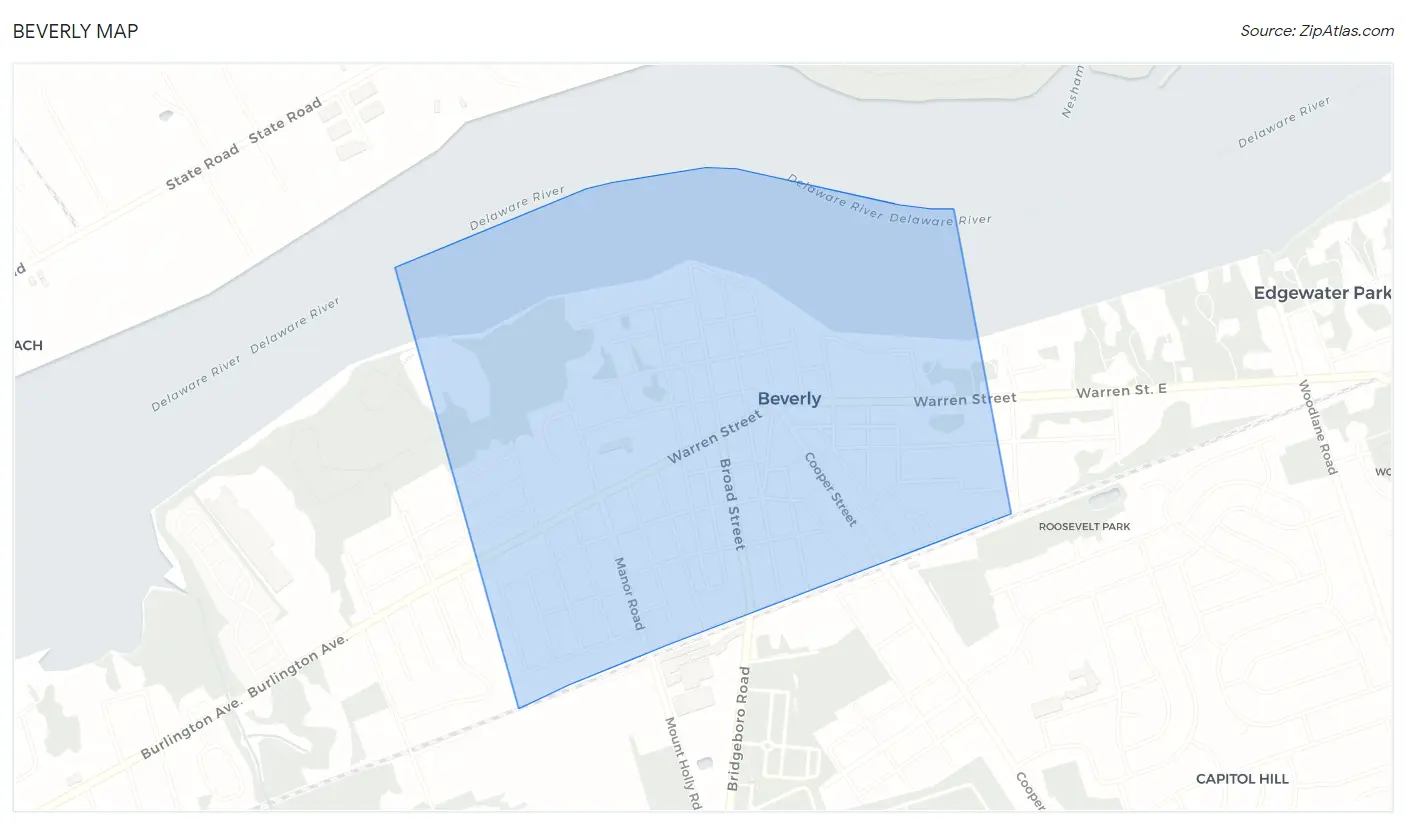
Beverly Map
Beverly Overview
$34,955
PER CAPITA INCOME
$100,000
AVG FAMILY INCOME
$90,069
AVG HOUSEHOLD INCOME
26.8%
WAGE / INCOME GAP [ % ]
73.2¢/ $1
WAGE / INCOME GAP [ $ ]
$12,291
FAMILY INCOME DEFICIT
0.39
INEQUALITY / GINI INDEX
2,502
TOTAL POPULATION
1,146
MALE POPULATION
1,356
FEMALE POPULATION
84.51
MALES / 100 FEMALES
118.32
FEMALES / 100 MALES
41.5
MEDIAN AGE
3.3
AVG FAMILY SIZE
3.0
AVG HOUSEHOLD SIZE
1,233
LABOR FORCE [ PEOPLE ]
59.0%
PERCENT IN LABOR FORCE
7.7%
UNEMPLOYMENT RATE
Beverly Zip Codes
Income in Beverly
Income Overview in Beverly
Per Capita Income in Beverly is $34,955, while median incomes of families and households are $100,000 and $90,069 respectively.
| Characteristic | Number | Measure |
| Per Capita Income | 2,502 | $34,955 |
| Median Family Income | 632 | $100,000 |
| Mean Family Income | 632 | $103,466 |
| Median Household Income | 833 | $90,069 |
| Mean Household Income | 833 | $101,072 |
| Income Deficit | 632 | $12,291 |
| Wage / Income Gap (%) | 2,502 | 26.80% |
| Wage / Income Gap ($) | 2,502 | 73.20¢ per $1 |
| Gini / Inequality Index | 2,502 | 0.39 |
Earnings by Sex in Beverly
Average Earnings in Beverly are $42,358, $50,139 for men and $36,701 for women, a difference of 26.8%.
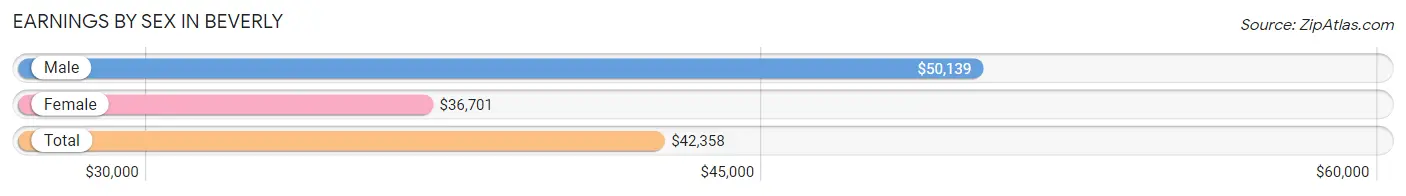
| Sex | Number | Average Earnings |
| Male | 620 (48.3%) | $50,139 |
| Female | 663 (51.7%) | $36,701 |
| Total | 1,283 (100.0%) | $42,358 |
Earnings by Sex by Income Bracket in Beverly
The most common earnings brackets in Beverly are $100,000+ for men (87 | 14.0%) and $100,000+ for women (92 | 13.9%).
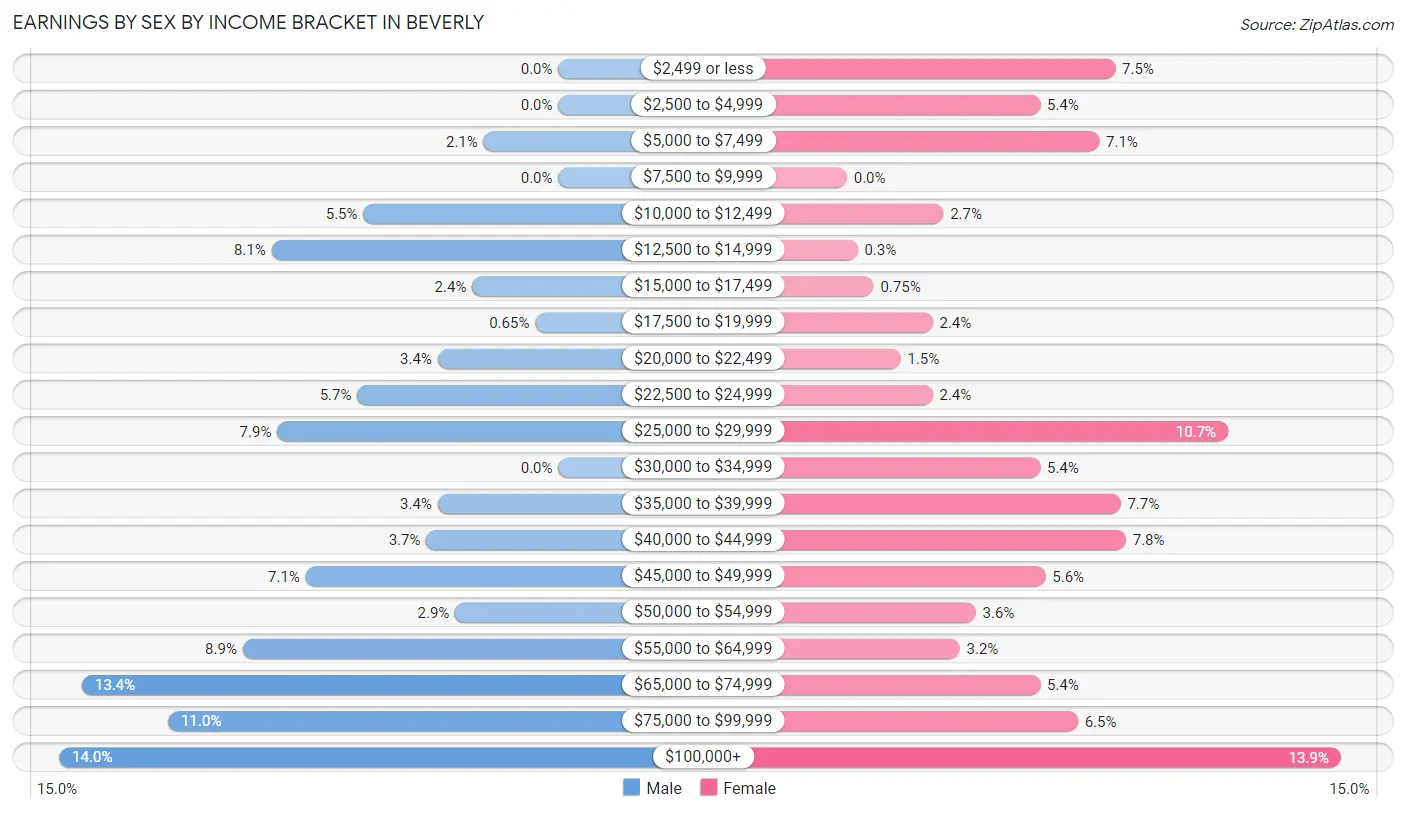
| Income | Male | Female |
| $2,499 or less | 0 (0.0%) | 50 (7.5%) |
| $2,500 to $4,999 | 0 (0.0%) | 36 (5.4%) |
| $5,000 to $7,499 | 13 (2.1%) | 47 (7.1%) |
| $7,500 to $9,999 | 0 (0.0%) | 0 (0.0%) |
| $10,000 to $12,499 | 34 (5.5%) | 18 (2.7%) |
| $12,500 to $14,999 | 50 (8.1%) | 2 (0.3%) |
| $15,000 to $17,499 | 15 (2.4%) | 5 (0.7%) |
| $17,500 to $19,999 | 4 (0.6%) | 16 (2.4%) |
| $20,000 to $22,499 | 21 (3.4%) | 10 (1.5%) |
| $22,500 to $24,999 | 35 (5.7%) | 16 (2.4%) |
| $25,000 to $29,999 | 49 (7.9%) | 71 (10.7%) |
| $30,000 to $34,999 | 0 (0.0%) | 36 (5.4%) |
| $35,000 to $39,999 | 21 (3.4%) | 51 (7.7%) |
| $40,000 to $44,999 | 23 (3.7%) | 52 (7.8%) |
| $45,000 to $49,999 | 44 (7.1%) | 37 (5.6%) |
| $50,000 to $54,999 | 18 (2.9%) | 24 (3.6%) |
| $55,000 to $64,999 | 55 (8.9%) | 21 (3.2%) |
| $65,000 to $74,999 | 83 (13.4%) | 36 (5.4%) |
| $75,000 to $99,999 | 68 (11.0%) | 43 (6.5%) |
| $100,000+ | 87 (14.0%) | 92 (13.9%) |
| Total | 620 (100.0%) | 663 (100.0%) |
Earnings by Sex by Educational Attainment in Beverly
Average earnings in Beverly are $55,540 for men and $42,679 for women, a difference of 23.2%. Men with an educational attainment of graduate degree enjoy the highest average annual earnings of $141,125, while those with bachelor's degree education earn the least with $46,111. Women with an educational attainment of graduate degree earn the most with the average annual earnings of $81,008, while those with high school diploma education have the smallest earnings of $31,786.
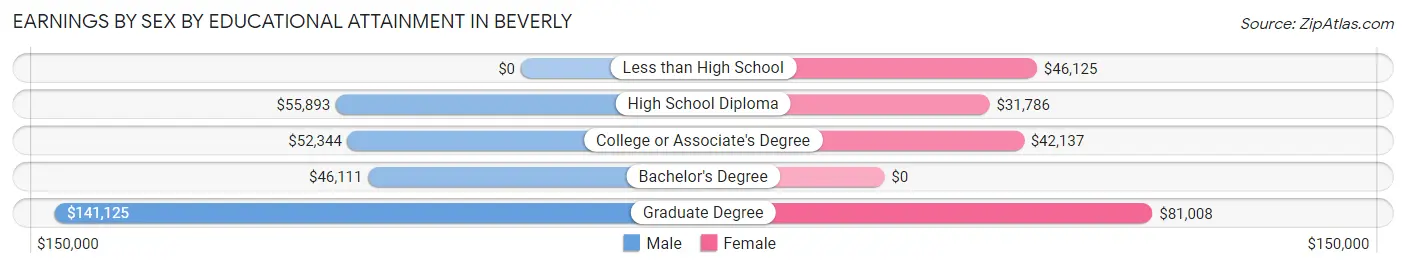
| Educational Attainment | Male Income | Female Income |
| Less than High School | - | - |
| High School Diploma | $55,893 | $31,786 |
| College or Associate's Degree | $52,344 | $42,137 |
| Bachelor's Degree | $46,111 | $0 |
| Graduate Degree | $141,125 | $81,008 |
| Total | $55,540 | $42,679 |
Family Income in Beverly
Family Income Brackets in Beverly
According to the Beverly family income data, there are 128 families falling into the $150,000 to $199,999 income range, which is the most common income bracket and makes up 20.3% of all families. Conversely, the $25,000 to $34,999 income bracket is the least frequent group with only 7 families (1.1%) belonging to this category.
| Income Bracket | # Families | % Families |
| Less than $10,000 | 47 | 7.4% |
| $10,000 to $14,999 | 43 | 6.8% |
| $15,000 to $24,999 | 54 | 8.5% |
| $25,000 to $34,999 | 7 | 1.1% |
| $35,000 to $49,999 | 54 | 8.5% |
| $50,000 to $74,999 | 84 | 13.3% |
| $75,000 to $99,999 | 27 | 4.3% |
| $100,000 to $149,999 | 100 | 15.8% |
| $150,000 to $199,999 | 128 | 20.3% |
| $200,000+ | 88 | 13.9% |
Family Income by Famaliy Size in Beverly
4-person families (114 | 18.0%) account for the highest median family income in Beverly with $183,839 per family, while 4-person families (114 | 18.0%) have the highest median income of $45,960 per family member.
| Income Bracket | # Families | Median Income |
| 2-Person Families | 253 (40.0%) | $58,750 |
| 3-Person Families | 195 (30.8%) | $0 |
| 4-Person Families | 114 (18.0%) | $183,839 |
| 5-Person Families | 32 (5.1%) | $0 |
| 6-Person Families | 38 (6.0%) | $0 |
| 7+ Person Families | 0 (0.0%) | $0 |
| Total | 632 (100.0%) | $100,000 |
Family Income by Number of Earners in Beverly
The median family income in Beverly is $100,000, with families comprising 3+ earners (45) having the highest median family income of $183,375, while families with no earners (139) have the lowest median family income of $18,798, accounting for 7.1% and 22.0% of families, respectively.
| Number of Earners | # Families | Median Income |
| No Earners | 139 (22.0%) | $18,798 |
| 1 Earner | 165 (26.1%) | $55,804 |
| 2 Earners | 283 (44.8%) | $151,688 |
| 3+ Earners | 45 (7.1%) | $183,375 |
| Total | 632 (100.0%) | $100,000 |
Household Income in Beverly
Household Income Brackets in Beverly
With 152 households falling in the category, the $150,000 to $199,999 income range is the most frequent in Beverly, accounting for 18.2% of all households. In contrast, only 17 households (2.0%) fall into the less than $10,000 income bracket, making it the least populous group.
| Income Bracket | # Households | % Households |
| Less than $10,000 | 17 | 2.0% |
| $10,000 to $14,999 | 56 | 6.7% |
| $15,000 to $24,999 | 65 | 7.8% |
| $25,000 to $34,999 | 50 | 6.0% |
| $35,000 to $49,999 | 60 | 7.2% |
| $50,000 to $74,999 | 120 | 14.4% |
| $75,000 to $99,999 | 90 | 10.8% |
| $100,000 to $149,999 | 132 | 15.8% |
| $150,000 to $199,999 | 152 | 18.2% |
| $200,000+ | 91 | 10.9% |
Household Income by Householder Age in Beverly
The median household income in Beverly is $90,069, with the highest median household income of $115,313 found in the 45 to 64 years age bracket for the primary householder. A total of 380 households (45.6%) fall into this category. Meanwhile, the 15 to 24 years age bracket for the primary householder has the lowest median household income of $0, with 37 households (4.4%) in this group.
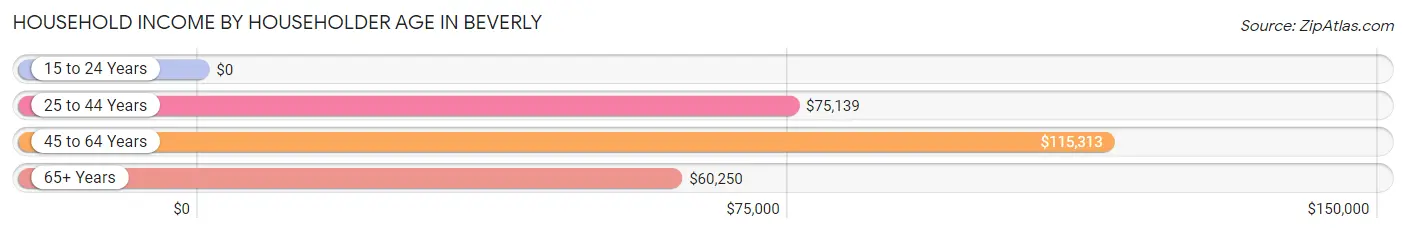
| Income Bracket | # Households | Median Income |
| 15 to 24 Years | 37 (4.4%) | $0 |
| 25 to 44 Years | 179 (21.5%) | $75,139 |
| 45 to 64 Years | 380 (45.6%) | $115,313 |
| 65+ Years | 237 (28.4%) | $60,250 |
| Total | 833 (100.0%) | $90,069 |
Poverty in Beverly
Income Below Poverty by Sex and Age in Beverly
With 9.7% poverty level for males and 19.2% for females among the residents of Beverly, 16 and 17 year old males and 12 to 14 year old females are the most vulnerable to poverty, with 7 males (100.0%) and 14 females (100.0%) in their respective age groups living below the poverty level.
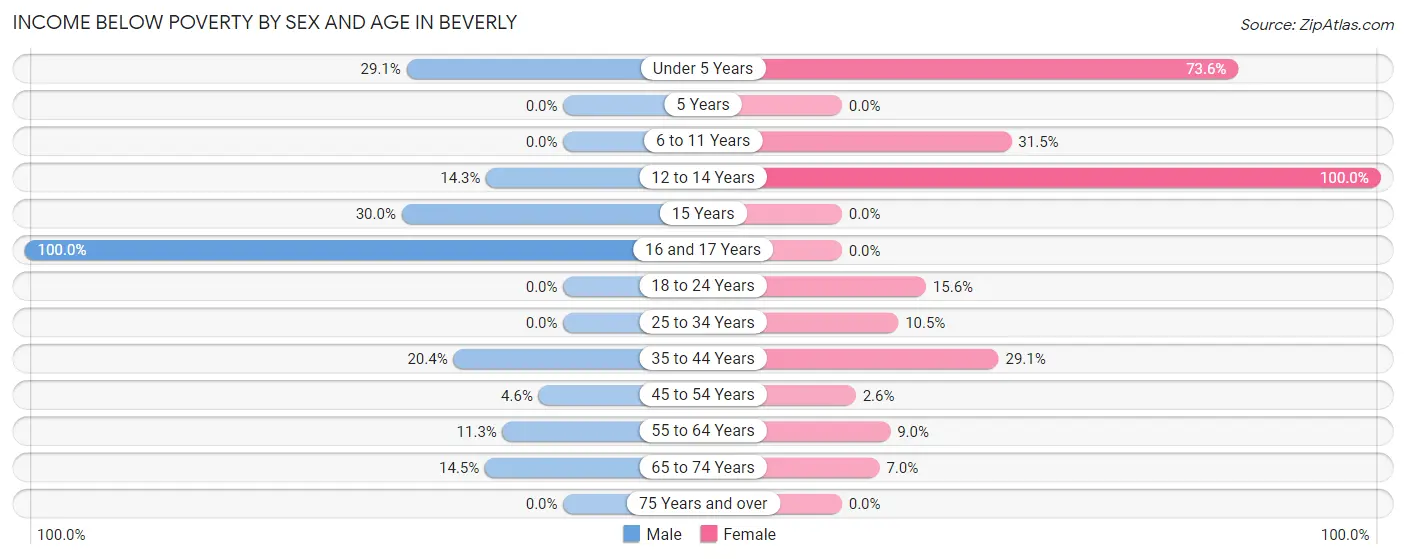
| Age Bracket | Male | Female |
| Under 5 Years | 16 (29.1%) | 103 (73.6%) |
| 5 Years | 0 (0.0%) | 0 (0.0%) |
| 6 to 11 Years | 0 (0.0%) | 17 (31.5%) |
| 12 to 14 Years | 11 (14.3%) | 14 (100.0%) |
| 15 Years | 6 (30.0%) | 0 (0.0%) |
| 16 and 17 Years | 7 (100.0%) | 0 (0.0%) |
| 18 to 24 Years | 0 (0.0%) | 37 (15.6%) |
| 25 to 34 Years | 0 (0.0%) | 18 (10.5%) |
| 35 to 44 Years | 21 (20.4%) | 39 (29.1%) |
| 45 to 54 Years | 9 (4.6%) | 5 (2.6%) |
| 55 to 64 Years | 23 (11.3%) | 17 (9.0%) |
| 65 to 74 Years | 18 (14.5%) | 10 (7.0%) |
| 75 Years and over | 0 (0.0%) | 0 (0.0%) |
| Total | 111 (9.7%) | 260 (19.2%) |
Income Above Poverty by Sex and Age in Beverly
According to the poverty statistics in Beverly, males aged 6 to 11 years and females aged 16 and 17 years are the age groups that are most secure financially, with 100.0% of males and 100.0% of females in these age groups living above the poverty line.
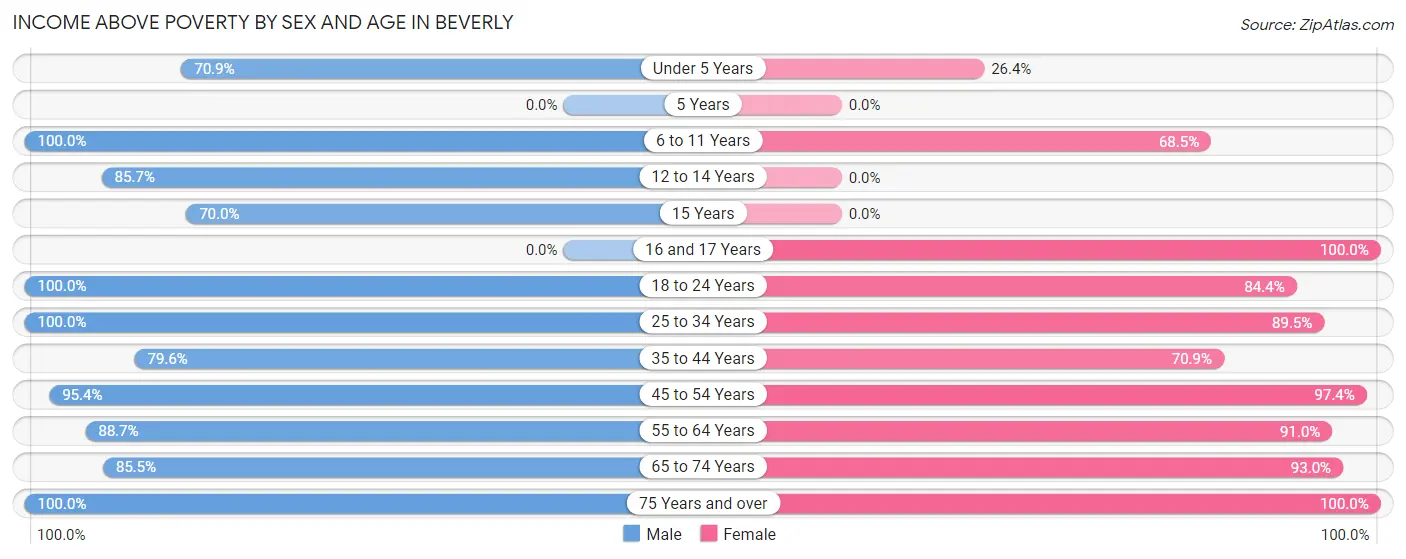
| Age Bracket | Male | Female |
| Under 5 Years | 39 (70.9%) | 37 (26.4%) |
| 5 Years | 0 (0.0%) | 0 (0.0%) |
| 6 to 11 Years | 53 (100.0%) | 37 (68.5%) |
| 12 to 14 Years | 66 (85.7%) | 0 (0.0%) |
| 15 Years | 14 (70.0%) | 0 (0.0%) |
| 16 and 17 Years | 0 (0.0%) | 25 (100.0%) |
| 18 to 24 Years | 68 (100.0%) | 200 (84.4%) |
| 25 to 34 Years | 180 (100.0%) | 154 (89.5%) |
| 35 to 44 Years | 82 (79.6%) | 95 (70.9%) |
| 45 to 54 Years | 188 (95.4%) | 188 (97.4%) |
| 55 to 64 Years | 181 (88.7%) | 172 (91.0%) |
| 65 to 74 Years | 106 (85.5%) | 133 (93.0%) |
| 75 Years and over | 58 (100.0%) | 55 (100.0%) |
| Total | 1,035 (90.3%) | 1,096 (80.8%) |
Income Below Poverty Among Married-Couple Families in Beverly
The poverty statistics for married-couple families in Beverly show that 9.5% or 40 of the total 423 families live below the poverty line. Families with 1 or 2 children have the highest poverty rate of 20.0%, comprising of 23 families. On the other hand, families with no children have the lowest poverty rate of 5.5%, which includes 17 families.
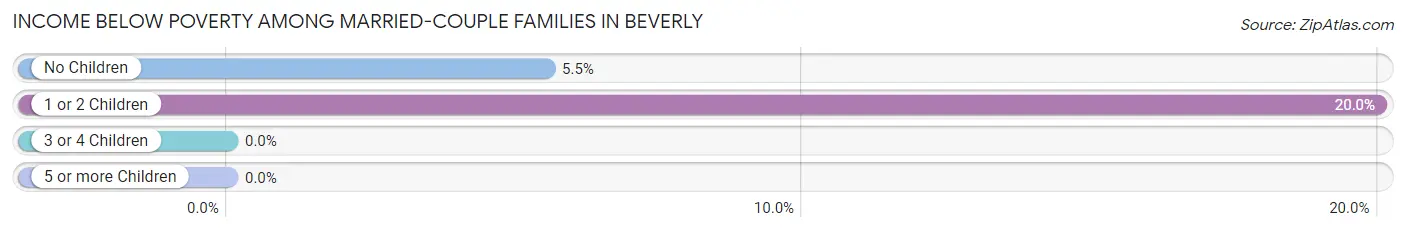
| Children | Above Poverty | Below Poverty |
| No Children | 291 (94.5%) | 17 (5.5%) |
| 1 or 2 Children | 92 (80.0%) | 23 (20.0%) |
| 3 or 4 Children | 0 (0.0%) | 0 (0.0%) |
| 5 or more Children | 0 (0.0%) | 0 (0.0%) |
| Total | 383 (90.5%) | 40 (9.5%) |
Income Below Poverty Among Single-Parent Households in Beverly
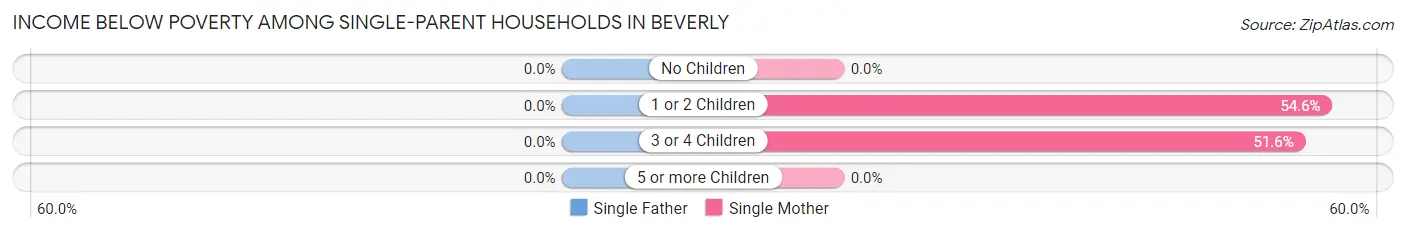
| Children | Single Father | Single Mother |
| No Children | 0 (0.0%) | 0 (0.0%) |
| 1 or 2 Children | 0 (0.0%) | 65 (54.6%) |
| 3 or 4 Children | 0 (0.0%) | 16 (51.6%) |
| 5 or more Children | 0 (0.0%) | 0 (0.0%) |
| Total | 0 (0.0%) | 81 (41.5%) |
Income Below Poverty Among Married-Couple vs Single-Parent Households in Beverly
The poverty data for Beverly shows that 40 of the married-couple family households (9.5%) and 81 of the single-parent households (38.8%) are living below the poverty level. Within the married-couple family households, those with 1 or 2 children have the highest poverty rate, with 23 households (20.0%) falling below the poverty line. Among the single-parent households, those with 3 or 4 children have the highest poverty rate, with 16 household (51.6%) living below poverty.
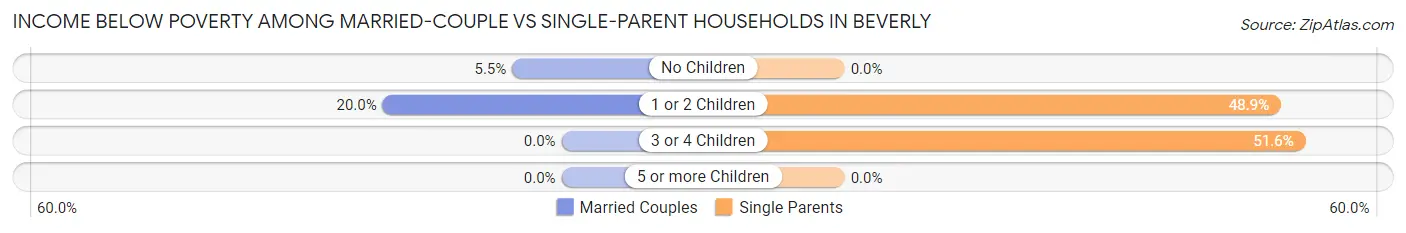
| Children | Married-Couple Families | Single-Parent Households |
| No Children | 17 (5.5%) | 0 (0.0%) |
| 1 or 2 Children | 23 (20.0%) | 65 (48.9%) |
| 3 or 4 Children | 0 (0.0%) | 16 (51.6%) |
| 5 or more Children | 0 (0.0%) | 0 (0.0%) |
| Total | 40 (9.5%) | 81 (38.8%) |
Race in Beverly
The most populous races in Beverly are White / Caucasian (1,374 | 54.9%), Black / African American (650 | 26.0%), and Hispanic or Latino (310 | 12.4%).
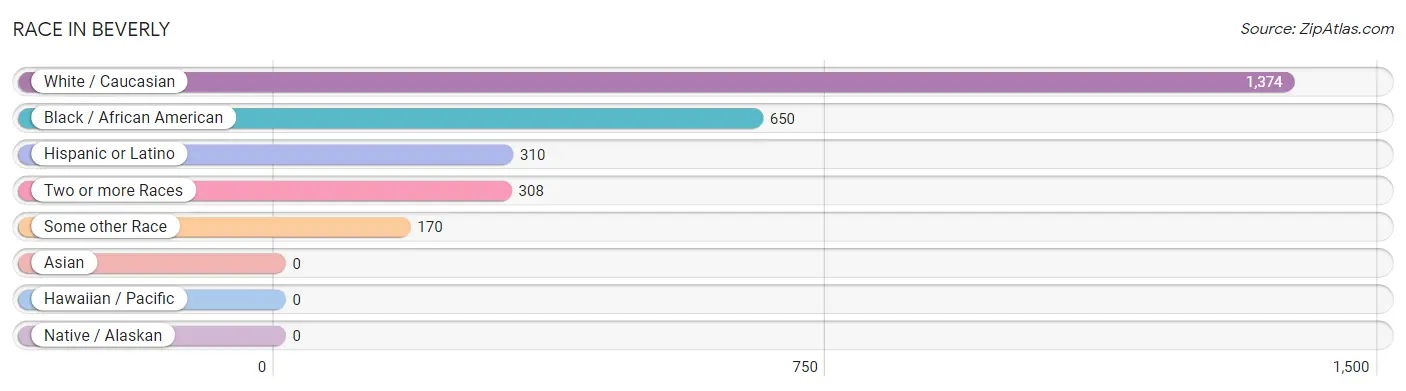
| Race | # Population | % Population |
| Asian | 0 | 0.0% |
| Black / African American | 650 | 26.0% |
| Hawaiian / Pacific | 0 | 0.0% |
| Hispanic or Latino | 310 | 12.4% |
| Native / Alaskan | 0 | 0.0% |
| White / Caucasian | 1,374 | 54.9% |
| Two or more Races | 308 | 12.3% |
| Some other Race | 170 | 6.8% |
| Total | 2,502 | 100.0% |
Ancestry in Beverly
The most populous ancestries reported in Beverly are German (548 | 21.9%), Irish (418 | 16.7%), English (411 | 16.4%), Italian (358 | 14.3%), and Puerto Rican (228 | 9.1%), together accounting for 78.5% of all Beverly residents.
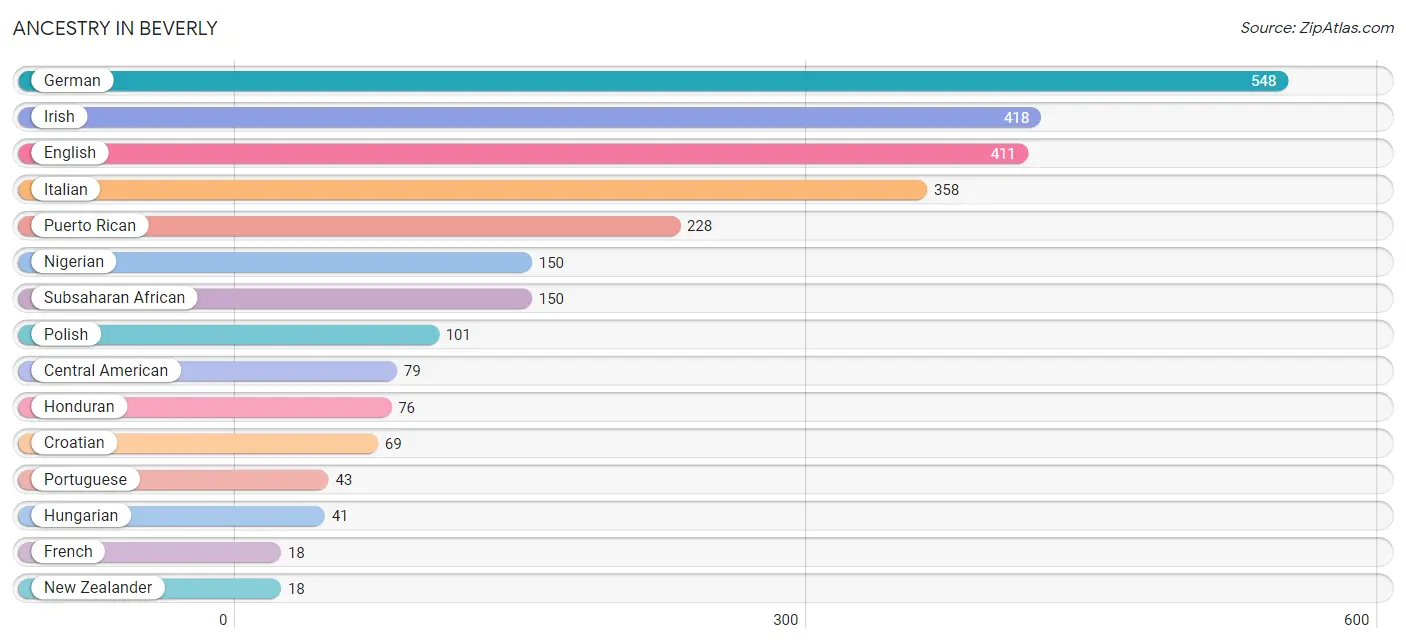
| Ancestry | # Population | % Population |
| American | 9 | 0.4% |
| Bhutanese | 14 | 0.6% |
| Blackfeet | 11 | 0.4% |
| British | 6 | 0.2% |
| Central American | 79 | 3.2% |
| Central American Indian | 5 | 0.2% |
| Cherokee | 3 | 0.1% |
| Croatian | 69 | 2.8% |
| Czech | 6 | 0.2% |
| Dutch | 15 | 0.6% |
| Ecuadorian | 3 | 0.1% |
| English | 411 | 16.4% |
| European | 3 | 0.1% |
| Filipino | 8 | 0.3% |
| Finnish | 3 | 0.1% |
| French | 18 | 0.7% |
| French Canadian | 10 | 0.4% |
| German | 548 | 21.9% |
| Honduran | 76 | 3.0% |
| Hungarian | 41 | 1.6% |
| Irish | 418 | 16.7% |
| Italian | 358 | 14.3% |
| Jamaican | 13 | 0.5% |
| Korean | 15 | 0.6% |
| Native Hawaiian | 3 | 0.1% |
| New Zealander | 18 | 0.7% |
| Nigerian | 150 | 6.0% |
| Norwegian | 2 | 0.1% |
| Panamanian | 3 | 0.1% |
| Pennsylvania German | 1 | 0.0% |
| Polish | 101 | 4.0% |
| Portuguese | 43 | 1.7% |
| Puerto Rican | 228 | 9.1% |
| Russian | 14 | 0.6% |
| Scandinavian | 7 | 0.3% |
| Scotch-Irish | 4 | 0.2% |
| Scottish | 7 | 0.3% |
| South American | 3 | 0.1% |
| Subsaharan African | 150 | 6.0% |
| Ukrainian | 3 | 0.1% |
| Welsh | 5 | 0.2% | View All 41 Rows |
Immigrants in Beverly
The most numerous immigrant groups reported in Beverly came from Africa (65 | 2.6%), Nigeria (65 | 2.6%), Western Africa (65 | 2.6%), Latin America (53 | 2.1%), and South America (24 | 1.0%), together accounting for 10.9% of all Beverly residents.
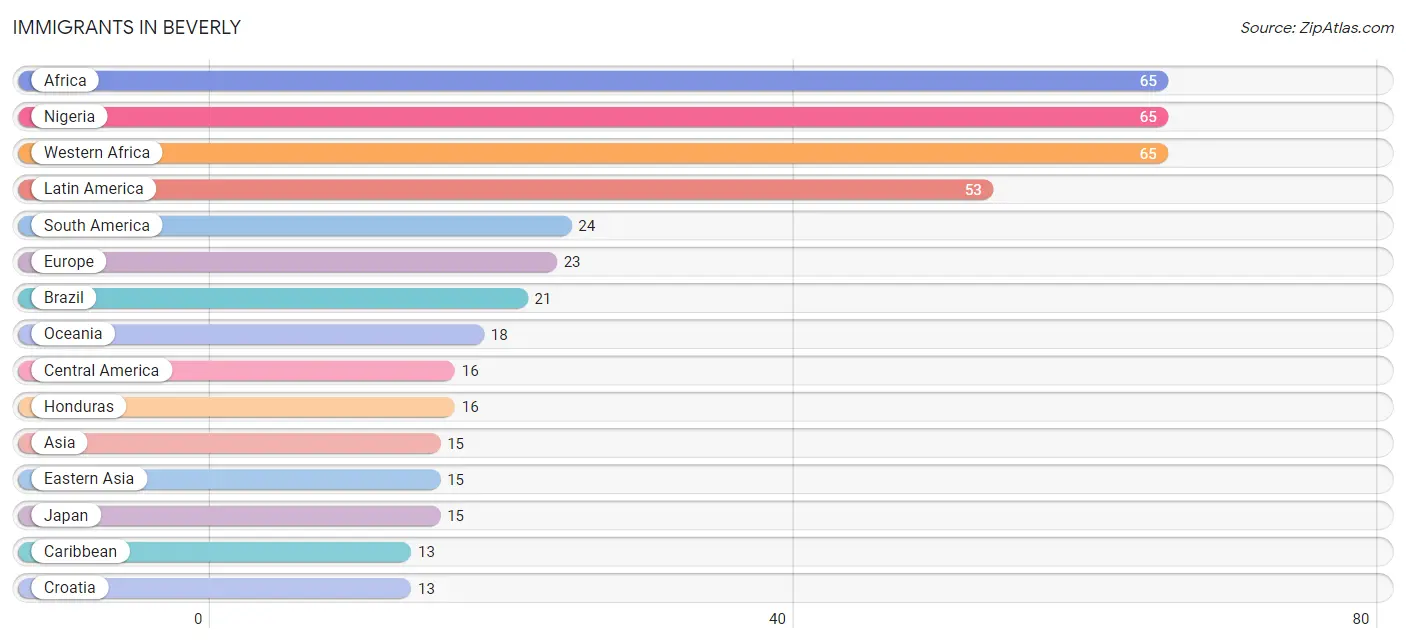
| Immigration Origin | # Population | % Population |
| Africa | 65 | 2.6% |
| Asia | 15 | 0.6% |
| Brazil | 21 | 0.8% |
| Caribbean | 13 | 0.5% |
| Central America | 16 | 0.6% |
| Croatia | 13 | 0.5% |
| Eastern Asia | 15 | 0.6% |
| Eastern Europe | 13 | 0.5% |
| Ecuador | 3 | 0.1% |
| England | 10 | 0.4% |
| Europe | 23 | 0.9% |
| Honduras | 16 | 0.6% |
| Jamaica | 13 | 0.5% |
| Japan | 15 | 0.6% |
| Latin America | 53 | 2.1% |
| Nigeria | 65 | 2.6% |
| Northern Europe | 10 | 0.4% |
| Oceania | 18 | 0.7% |
| South America | 24 | 1.0% |
| Western Africa | 65 | 2.6% | View All 20 Rows |
Sex and Age in Beverly
Sex and Age in Beverly
The most populous age groups in Beverly are 25 to 29 Years (140 | 12.2%) for men and 20 to 24 Years (208 | 15.3%) for women.
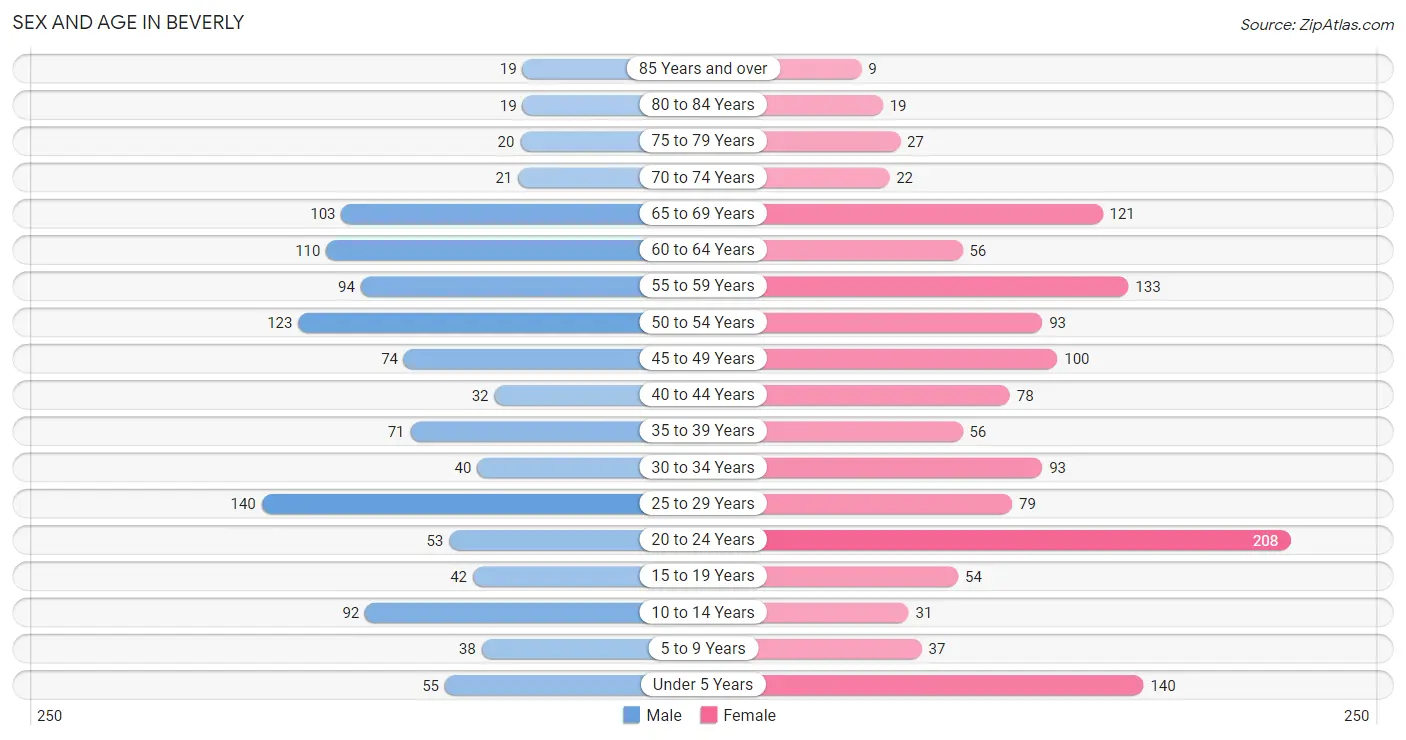
| Age Bracket | Male | Female |
| Under 5 Years | 55 (4.8%) | 140 (10.3%) |
| 5 to 9 Years | 38 (3.3%) | 37 (2.7%) |
| 10 to 14 Years | 92 (8.0%) | 31 (2.3%) |
| 15 to 19 Years | 42 (3.7%) | 54 (4.0%) |
| 20 to 24 Years | 53 (4.6%) | 208 (15.3%) |
| 25 to 29 Years | 140 (12.2%) | 79 (5.8%) |
| 30 to 34 Years | 40 (3.5%) | 93 (6.9%) |
| 35 to 39 Years | 71 (6.2%) | 56 (4.1%) |
| 40 to 44 Years | 32 (2.8%) | 78 (5.8%) |
| 45 to 49 Years | 74 (6.5%) | 100 (7.4%) |
| 50 to 54 Years | 123 (10.7%) | 93 (6.9%) |
| 55 to 59 Years | 94 (8.2%) | 133 (9.8%) |
| 60 to 64 Years | 110 (9.6%) | 56 (4.1%) |
| 65 to 69 Years | 103 (9.0%) | 121 (8.9%) |
| 70 to 74 Years | 21 (1.8%) | 22 (1.6%) |
| 75 to 79 Years | 20 (1.8%) | 27 (2.0%) |
| 80 to 84 Years | 19 (1.7%) | 19 (1.4%) |
| 85 Years and over | 19 (1.7%) | 9 (0.7%) |
| Total | 1,146 (100.0%) | 1,356 (100.0%) |
Families and Households in Beverly
Median Family Size in Beverly
The median family size in Beverly is 3.33 persons per family, with married-couple families (423 | 66.9%) accounting for the largest median family size of 3.56 persons per family. On the other hand, single male/father families (14 | 2.2%) represent the smallest median family size with 2.64 persons per family.
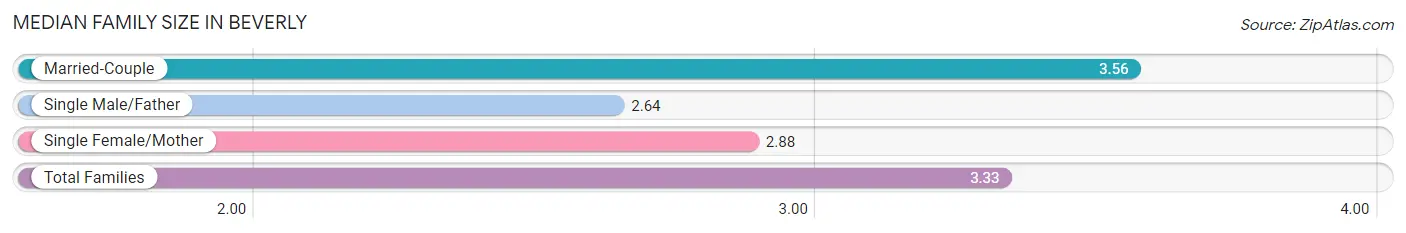
| Family Type | # Families | Family Size |
| Married-Couple | 423 (66.9%) | 3.56 |
| Single Male/Father | 14 (2.2%) | 2.64 |
| Single Female/Mother | 195 (30.8%) | 2.88 |
| Total Families | 632 (100.0%) | 3.33 |
Median Household Size in Beverly
The median household size in Beverly is 3.00 persons per household, with single male/father households (14 | 1.7%) accounting for the largest median household size of 3.71 persons per household. non-family households (201 | 24.1%) represent the smallest median household size with 1.37 persons per household.
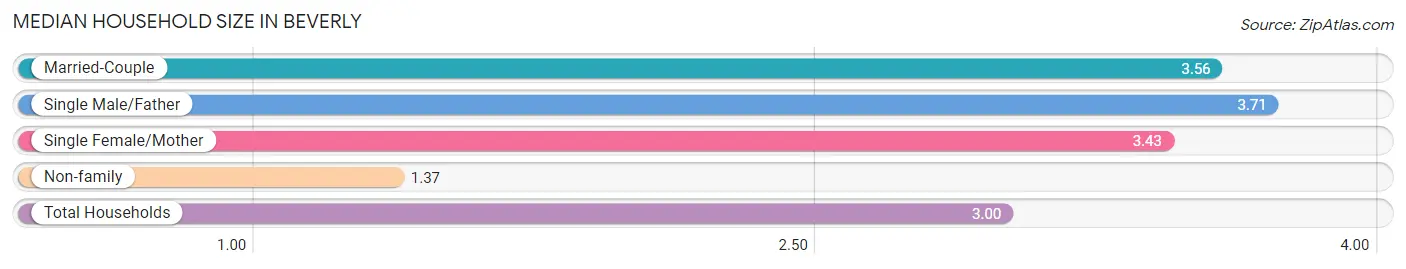
| Household Type | # Households | Household Size |
| Married-Couple | 423 (50.8%) | 3.56 |
| Single Male/Father | 14 (1.7%) | 3.71 |
| Single Female/Mother | 195 (23.4%) | 3.43 |
| Non-family | 201 (24.1%) | 1.37 |
| Total Households | 833 (100.0%) | 3.00 |
Household Size by Marriage Status in Beverly
Out of a total of 833 households in Beverly, 632 (75.9%) are family households, while 201 (24.1%) are nonfamily households. The most numerous type of family households are 2-person households, comprising 218, and the most common type of nonfamily households are 1-person households, comprising 152.
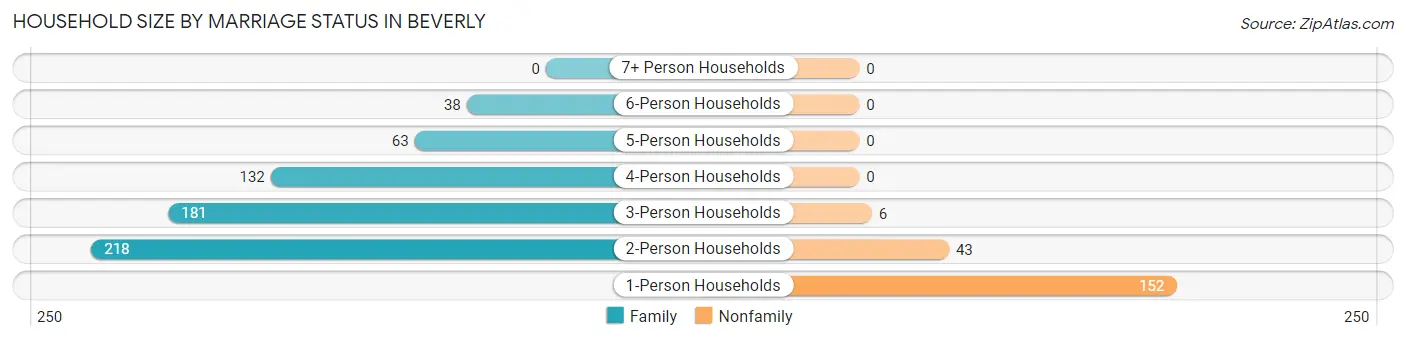
| Household Size | Family Households | Nonfamily Households |
| 1-Person Households | - | 152 (18.2%) |
| 2-Person Households | 218 (26.2%) | 43 (5.2%) |
| 3-Person Households | 181 (21.7%) | 6 (0.7%) |
| 4-Person Households | 132 (15.9%) | 0 (0.0%) |
| 5-Person Households | 63 (7.6%) | 0 (0.0%) |
| 6-Person Households | 38 (4.6%) | 0 (0.0%) |
| 7+ Person Households | 0 (0.0%) | 0 (0.0%) |
| Total | 632 (75.9%) | 201 (24.1%) |
Female Fertility in Beverly
Fertility by Age in Beverly
Average fertility rate in Beverly is 120.0 births per 1,000 women. Women in the age bracket of 35 to 50 years have the highest fertility rate with 200.0 births per 1,000 women. Women in the age bracket of 35 to 50 years acount for 63.1% of all women with births.
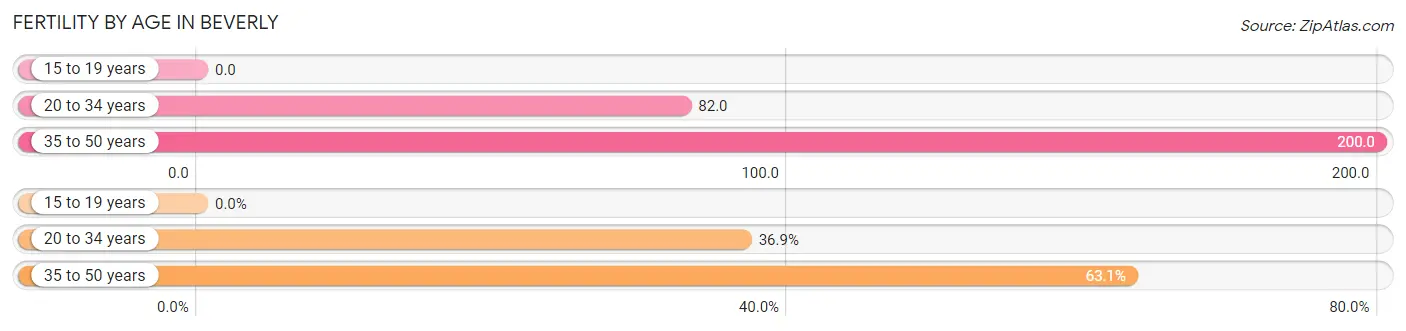
| Age Bracket | Women with Births | Births / 1,000 Women |
| 15 to 19 years | 0 (0.0%) | 0.0 |
| 20 to 34 years | 31 (36.9%) | 82.0 |
| 35 to 50 years | 53 (63.1%) | 200.0 |
| Total | 84 (100.0%) | 120.0 |
Fertility by Age by Marriage Status in Beverly
63.1% of women with births (84) in Beverly are married. The highest percentage of unmarried women with births falls into 20 to 34 years age bracket with 100.0% of them unmarried at the time of birth, while the lowest percentage of unmarried women with births belong to 35 to 50 years age bracket with 0.0% of them unmarried.
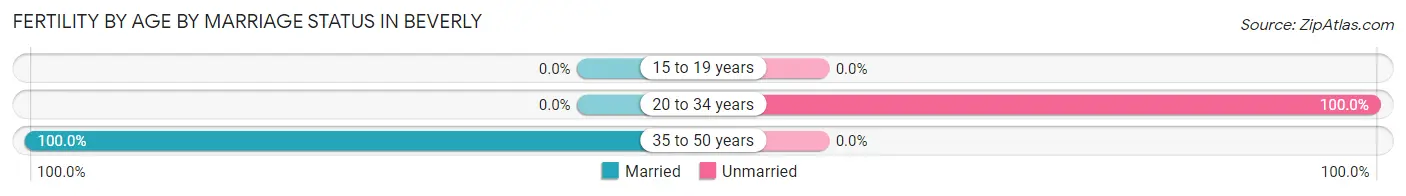
| Age Bracket | Married | Unmarried |
| 15 to 19 years | 0 (0.0%) | 0 (0.0%) |
| 20 to 34 years | 0 (0.0%) | 31 (100.0%) |
| 35 to 50 years | 53 (100.0%) | 0 (0.0%) |
| Total | 53 (63.1%) | 31 (36.9%) |
Fertility by Education in Beverly
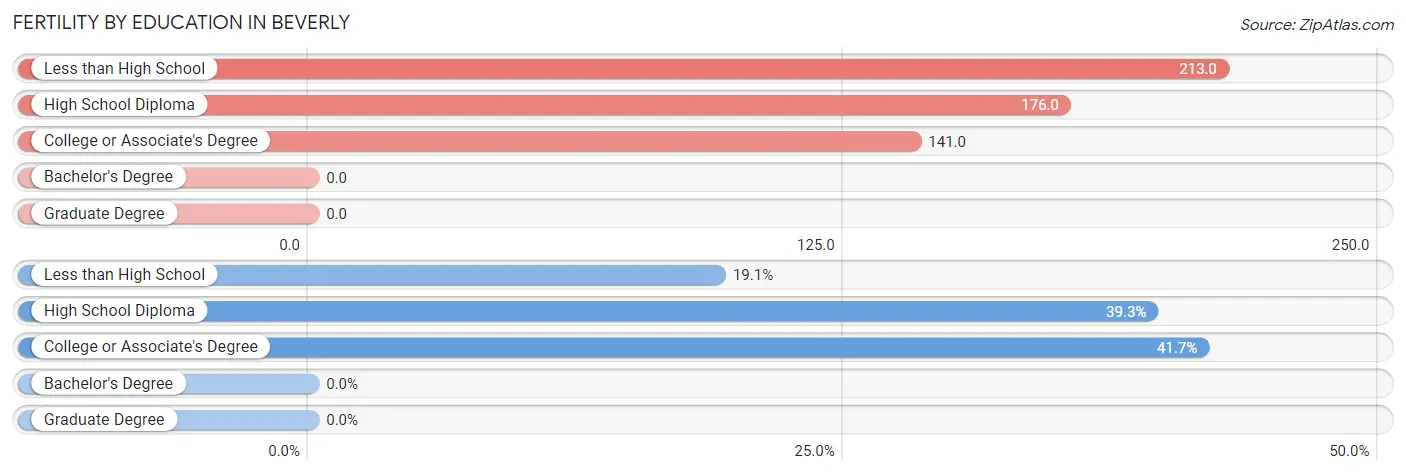
| Educational Attainment | Women with Births | Births / 1,000 Women |
| Less than High School | 16 (19.1%) | 213.0 |
| High School Diploma | 33 (39.3%) | 176.0 |
| College or Associate's Degree | 35 (41.7%) | 141.0 |
| Bachelor's Degree | 0 (0.0%) | 0.0 |
| Graduate Degree | 0 (0.0%) | 0.0 |
| Total | 84 (100.0%) | 120.0 |
Fertility by Education by Marriage Status in Beverly
36.9% of women with births in Beverly are unmarried. Women with the educational attainment of high school diploma are most likely to be married with 100.0% of them married at childbirth, while women with the educational attainment of less than high school are least likely to be married with 100.0% of them unmarried at childbirth.
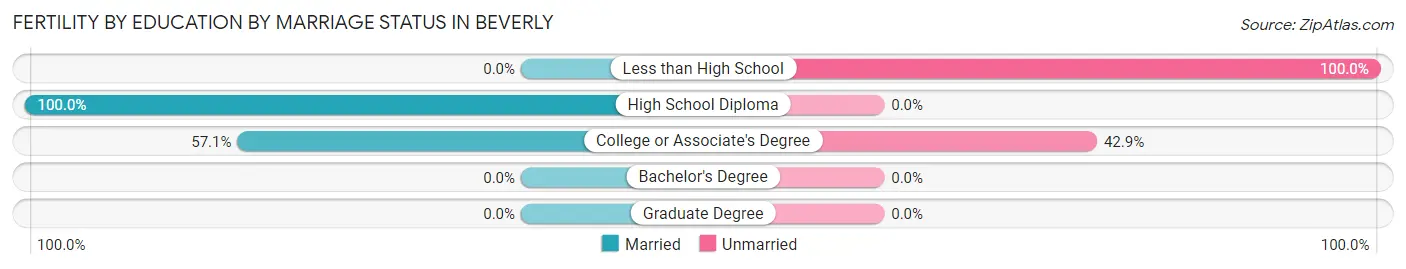
| Educational Attainment | Married | Unmarried |
| Less than High School | 0 (0.0%) | 16 (100.0%) |
| High School Diploma | 33 (100.0%) | 0 (0.0%) |
| College or Associate's Degree | 20 (57.1%) | 15 (42.9%) |
| Bachelor's Degree | 0 (0.0%) | 0 (0.0%) |
| Graduate Degree | 0 (0.0%) | 0 (0.0%) |
| Total | 53 (63.1%) | 31 (36.9%) |
Employment Characteristics in Beverly
Employment by Class of Employer in Beverly
Among the 1,075 employed individuals in Beverly, private company employees (694 | 64.6%), not-for-profit organizations (98 | 9.1%), and local government employees (94 | 8.7%) make up the most common classes of employment.
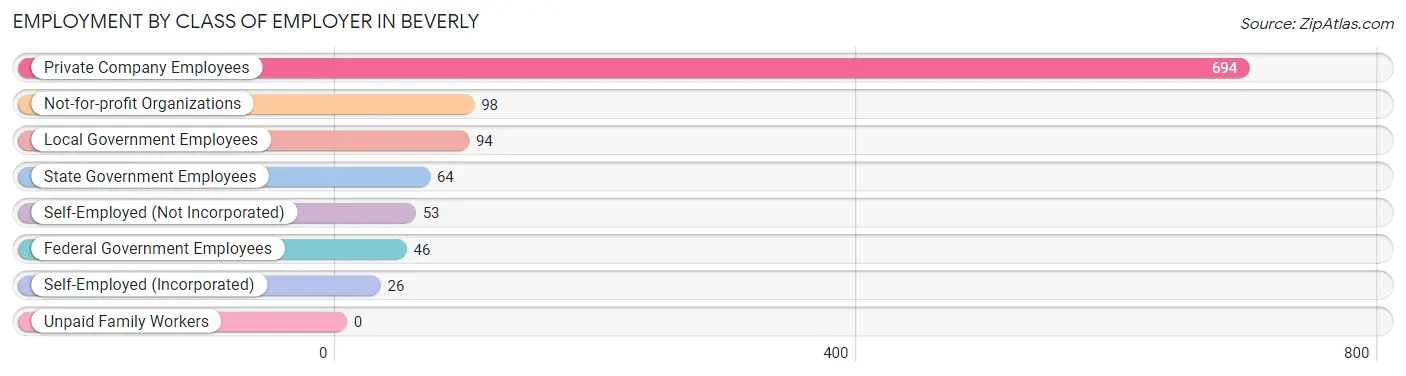
| Employer Class | # Employees | % Employees |
| Private Company Employees | 694 | 64.6% |
| Self-Employed (Incorporated) | 26 | 2.4% |
| Self-Employed (Not Incorporated) | 53 | 4.9% |
| Not-for-profit Organizations | 98 | 9.1% |
| Local Government Employees | 94 | 8.7% |
| State Government Employees | 64 | 5.9% |
| Federal Government Employees | 46 | 4.3% |
| Unpaid Family Workers | 0 | 0.0% |
| Total | 1,075 | 100.0% |
Employment Status by Age in Beverly
According to the labor force statistics for Beverly, out of the total population over 16 years of age (2,089), 59.0% or 1,233 individuals are in the labor force, with 7.7% or 95 of them unemployed. The age group with the highest labor force participation rate is 30 to 34 years, with 86.5% or 115 individuals in the labor force. Within the labor force, the 20 to 24 years age range has the highest percentage of unemployed individuals, with 23.5% or 42 of them being unemployed.
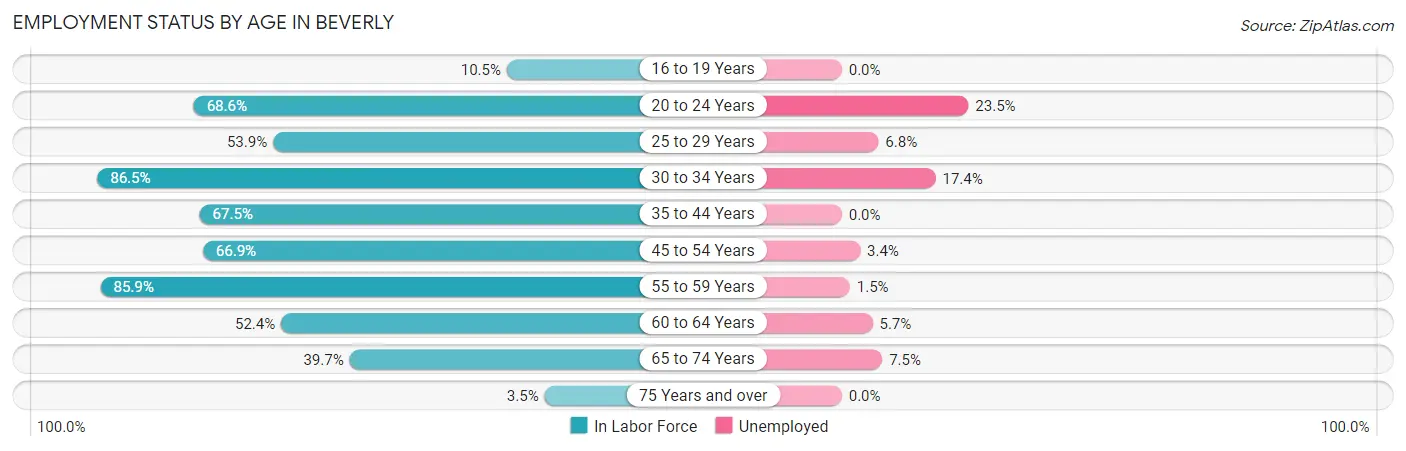
| Age Bracket | In Labor Force | Unemployed |
| 16 to 19 Years | 8 (10.5%) | 0 (0.0%) |
| 20 to 24 Years | 179 (68.6%) | 42 (23.5%) |
| 25 to 29 Years | 118 (53.9%) | 8 (6.8%) |
| 30 to 34 Years | 115 (86.5%) | 20 (17.4%) |
| 35 to 44 Years | 160 (67.5%) | 0 (0.0%) |
| 45 to 54 Years | 261 (66.9%) | 9 (3.4%) |
| 55 to 59 Years | 195 (85.9%) | 3 (1.5%) |
| 60 to 64 Years | 87 (52.4%) | 5 (5.7%) |
| 65 to 74 Years | 106 (39.7%) | 8 (7.5%) |
| 75 Years and over | 4 (3.5%) | 0 (0.0%) |
| Total | 1,233 (59.0%) | 95 (7.7%) |
Employment Status by Educational Attainment in Beverly
According to labor force statistics for Beverly, 68.2% of individuals (936) out of the total population between 25 and 64 years of age (1,372) are in the labor force, with 4.8% or 45 of them being unemployed. The group with the highest labor force participation rate are those with the educational attainment of college / associate degree, with 85.9% or 328 individuals in the labor force. Within the labor force, individuals with high school diploma education have the highest percentage of unemployment, with 7.7% or 20 of them being unemployed.
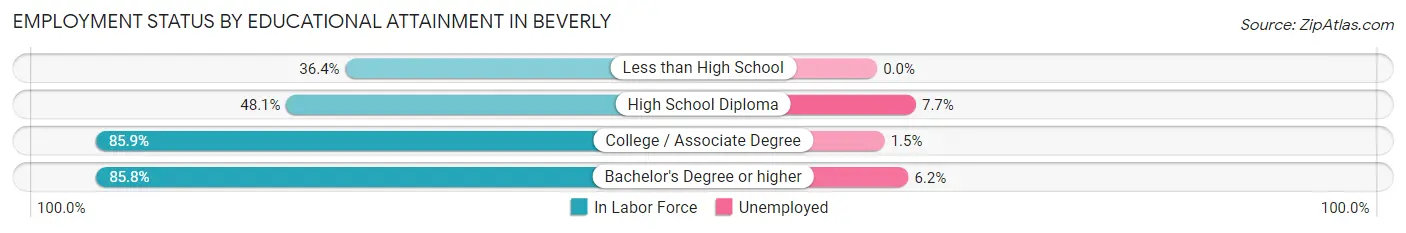
| Educational Attainment | In Labor Force | Unemployed |
| Less than High School | 28 (36.4%) | 0 (0.0%) |
| High School Diploma | 259 (48.1%) | 42 (7.7%) |
| College / Associate Degree | 328 (85.9%) | 6 (1.5%) |
| Bachelor's Degree or higher | 321 (85.8%) | 23 (6.2%) |
| Total | 936 (68.2%) | 66 (4.8%) |
Employment Occupations by Sex in Beverly
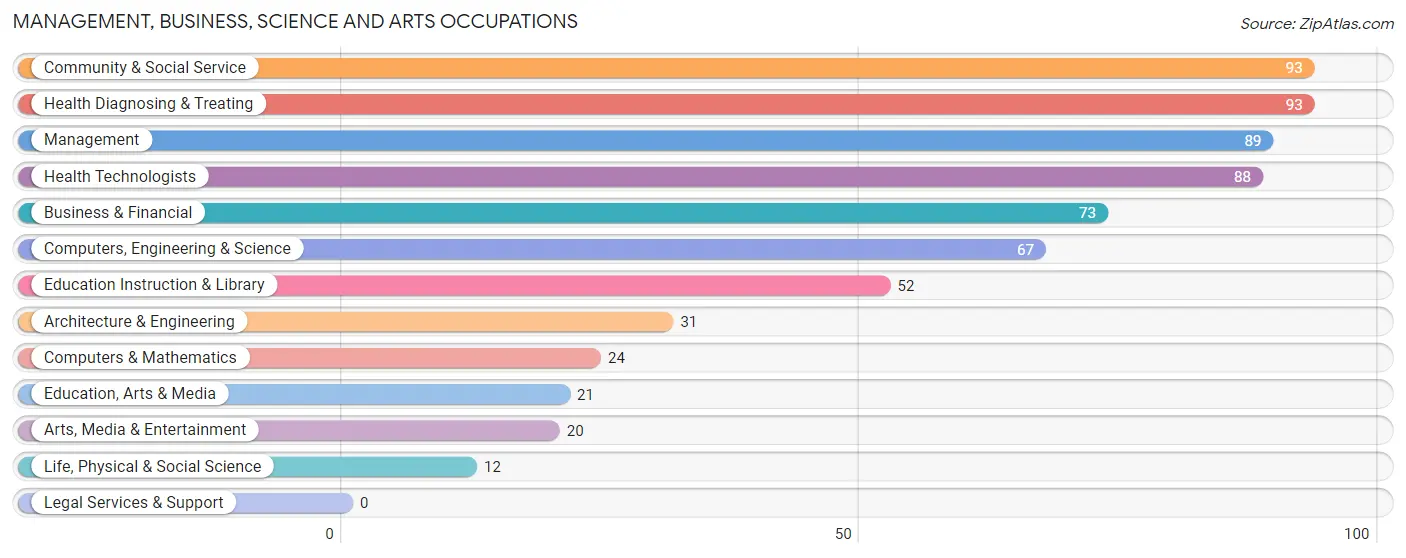
Management, Business, Science and Arts Occupations
The most common Management, Business, Science and Arts occupations in Beverly are Community & Social Service (93 | 8.2%), Health Diagnosing & Treating (93 | 8.2%), Management (89 | 7.8%), Health Technologists (88 | 7.7%), and Business & Financial (73 | 6.4%).
Management, Business, Science and Arts Occupations by Sex
Within the Management, Business, Science and Arts occupations in Beverly, the most male-oriented occupations are Architecture & Engineering (100.0%), Life, Physical & Social Science (100.0%), and Arts, Media & Entertainment (100.0%), while the most female-oriented occupations are Health Technologists (100.0%), Health Diagnosing & Treating (94.6%), and Education Instruction & Library (88.5%).
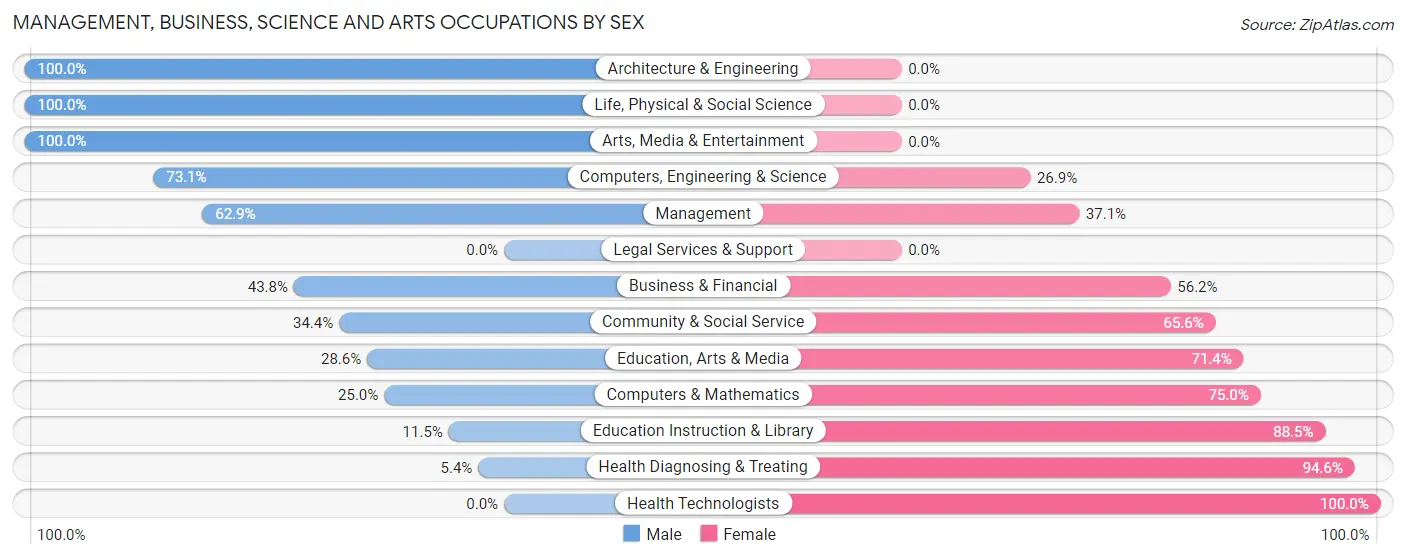
| Occupation | Male | Female |
| Management | 56 (62.9%) | 33 (37.1%) |
| Business & Financial | 32 (43.8%) | 41 (56.2%) |
| Computers, Engineering & Science | 49 (73.1%) | 18 (26.9%) |
| Computers & Mathematics | 6 (25.0%) | 18 (75.0%) |
| Architecture & Engineering | 31 (100.0%) | 0 (0.0%) |
| Life, Physical & Social Science | 12 (100.0%) | 0 (0.0%) |
| Community & Social Service | 32 (34.4%) | 61 (65.6%) |
| Education, Arts & Media | 6 (28.6%) | 15 (71.4%) |
| Legal Services & Support | 0 (0.0%) | 0 (0.0%) |
| Education Instruction & Library | 6 (11.5%) | 46 (88.5%) |
| Arts, Media & Entertainment | 20 (100.0%) | 0 (0.0%) |
| Health Diagnosing & Treating | 5 (5.4%) | 88 (94.6%) |
| Health Technologists | 0 (0.0%) | 88 (100.0%) |
| Total (Category) | 174 (41.9%) | 241 (58.1%) |
| Total (Overall) | 620 (54.5%) | 518 (45.5%) |
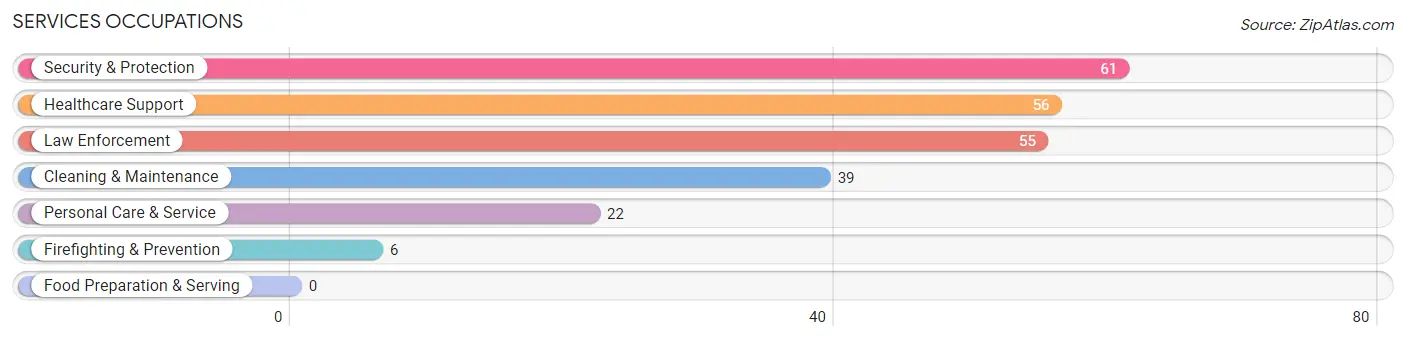
Services Occupations
The most common Services occupations in Beverly are Security & Protection (61 | 5.4%), Healthcare Support (56 | 4.9%), Law Enforcement (55 | 4.8%), Cleaning & Maintenance (39 | 3.4%), and Personal Care & Service (22 | 1.9%).
Services Occupations by Sex
Within the Services occupations in Beverly, the most male-oriented occupations are Firefighting & Prevention (100.0%), Personal Care & Service (100.0%), and Security & Protection (49.2%), while the most female-oriented occupations are Healthcare Support (100.0%), Law Enforcement (56.4%), and Cleaning & Maintenance (53.8%).
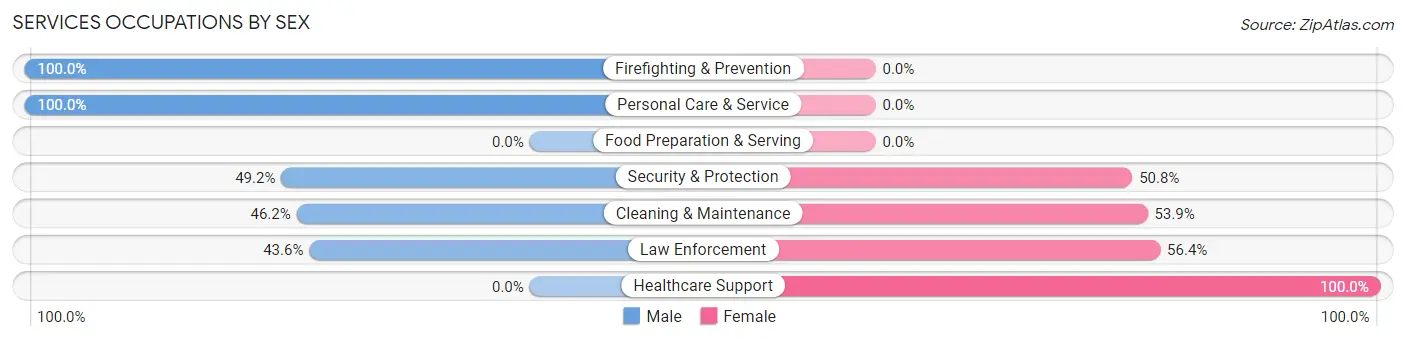
| Occupation | Male | Female |
| Healthcare Support | 0 (0.0%) | 56 (100.0%) |
| Security & Protection | 30 (49.2%) | 31 (50.8%) |
| Firefighting & Prevention | 6 (100.0%) | 0 (0.0%) |
| Law Enforcement | 24 (43.6%) | 31 (56.4%) |
| Food Preparation & Serving | 0 (0.0%) | 0 (0.0%) |
| Cleaning & Maintenance | 18 (46.2%) | 21 (53.8%) |
| Personal Care & Service | 22 (100.0%) | 0 (0.0%) |
| Total (Category) | 70 (39.3%) | 108 (60.7%) |
| Total (Overall) | 620 (54.5%) | 518 (45.5%) |
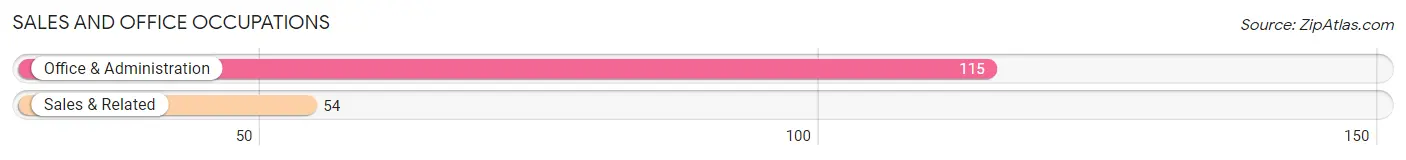
Sales and Office Occupations
The most common Sales and Office occupations in Beverly are Office & Administration (115 | 10.1%), and Sales & Related (54 | 4.8%).
Sales and Office Occupations by Sex
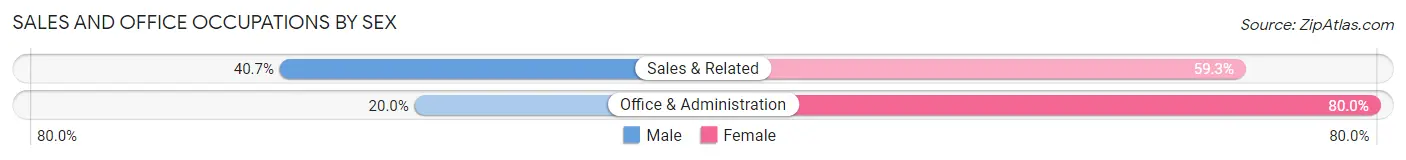
| Occupation | Male | Female |
| Sales & Related | 22 (40.7%) | 32 (59.3%) |
| Office & Administration | 23 (20.0%) | 92 (80.0%) |
| Total (Category) | 45 (26.6%) | 124 (73.4%) |
| Total (Overall) | 620 (54.5%) | 518 (45.5%) |
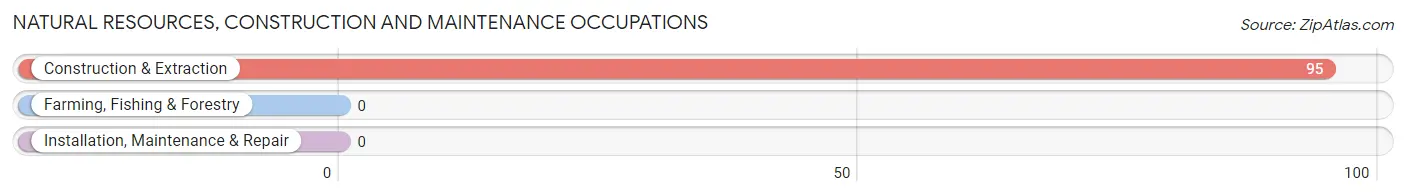
Natural Resources, Construction and Maintenance Occupations
The most common Natural Resources, Construction and Maintenance occupations in Beverly are , and Construction & Extraction (95 | 8.4%).
Natural Resources, Construction and Maintenance Occupations by Sex
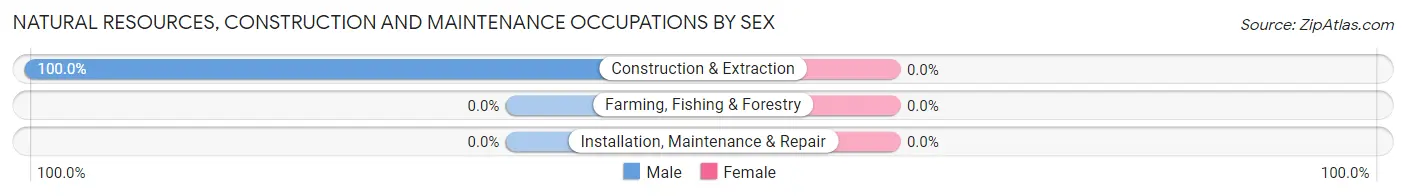
| Occupation | Male | Female |
| Farming, Fishing & Forestry | 0 (0.0%) | 0 (0.0%) |
| Construction & Extraction | 95 (100.0%) | 0 (0.0%) |
| Installation, Maintenance & Repair | 0 (0.0%) | 0 (0.0%) |
| Total (Category) | 95 (100.0%) | 0 (0.0%) |
| Total (Overall) | 620 (54.5%) | 518 (45.5%) |
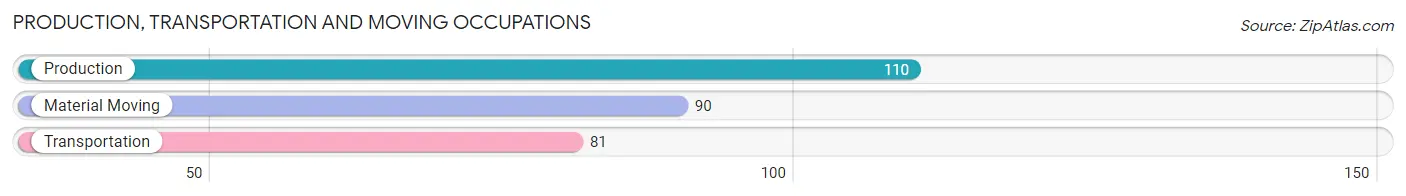
Production, Transportation and Moving Occupations
The most common Production, Transportation and Moving occupations in Beverly are Production (110 | 9.7%), Material Moving (90 | 7.9%), and Transportation (81 | 7.1%).
Production, Transportation and Moving Occupations by Sex
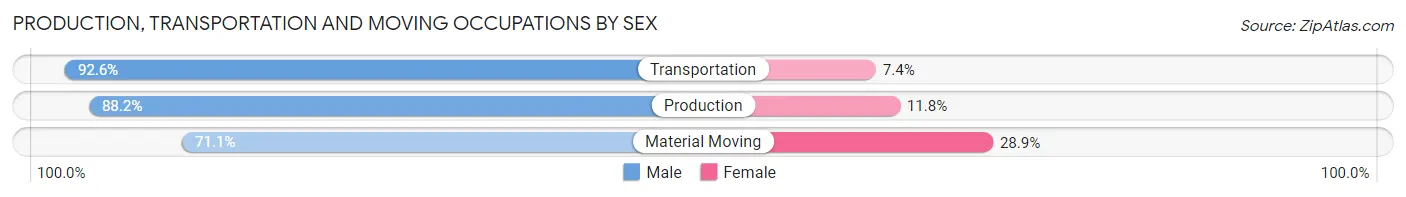
| Occupation | Male | Female |
| Production | 97 (88.2%) | 13 (11.8%) |
| Transportation | 75 (92.6%) | 6 (7.4%) |
| Material Moving | 64 (71.1%) | 26 (28.9%) |
| Total (Category) | 236 (84.0%) | 45 (16.0%) |
| Total (Overall) | 620 (54.5%) | 518 (45.5%) |
Employment Industries by Sex in Beverly
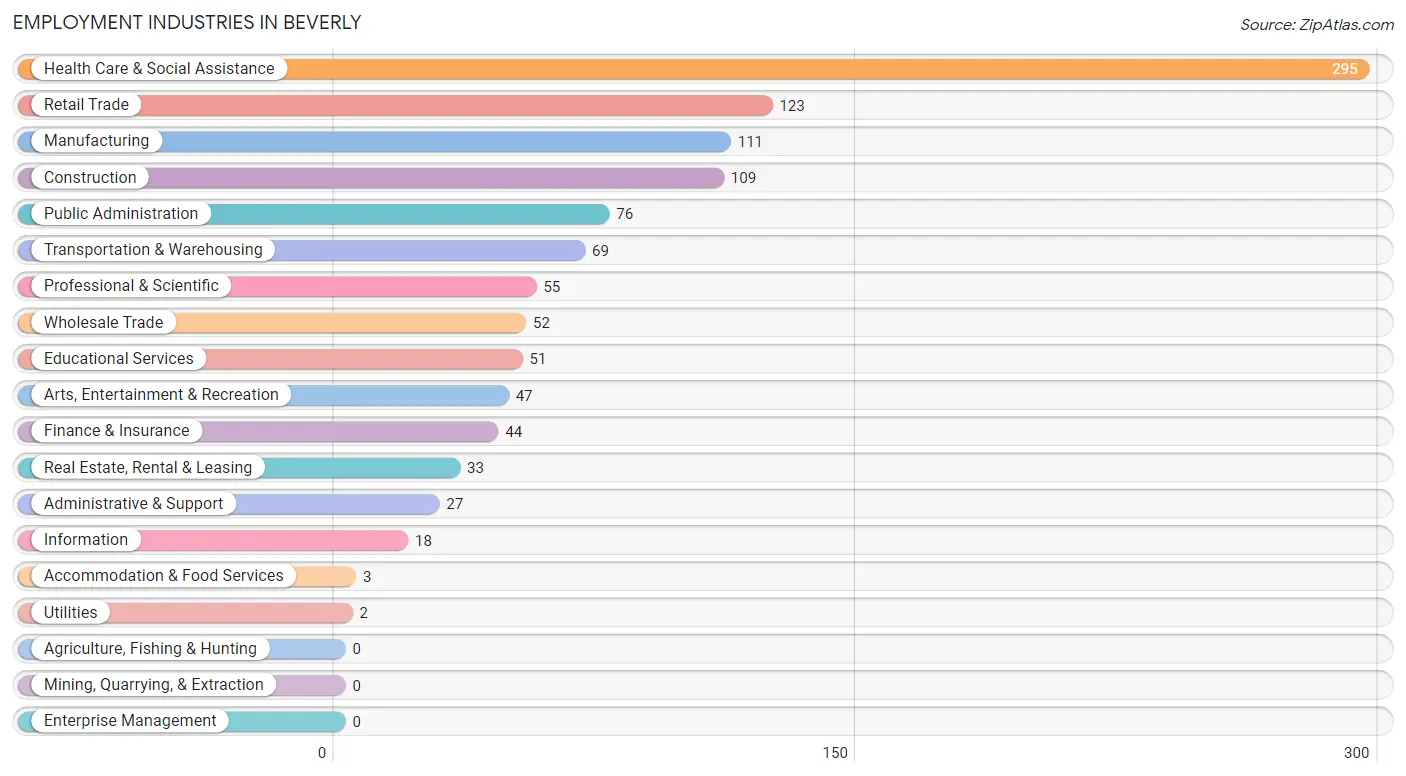
Employment Industries in Beverly
The major employment industries in Beverly include Health Care & Social Assistance (295 | 25.9%), Retail Trade (123 | 10.8%), Manufacturing (111 | 9.8%), Construction (109 | 9.6%), and Public Administration (76 | 6.7%).
Employment Industries by Sex in Beverly
The Beverly industries that see more men than women are Construction (100.0%), Utilities (100.0%), and Finance & Insurance (97.7%), whereas the industries that tend to have a higher number of women are Information (100.0%), Administrative & Support (100.0%), and Accommodation & Food Services (100.0%).
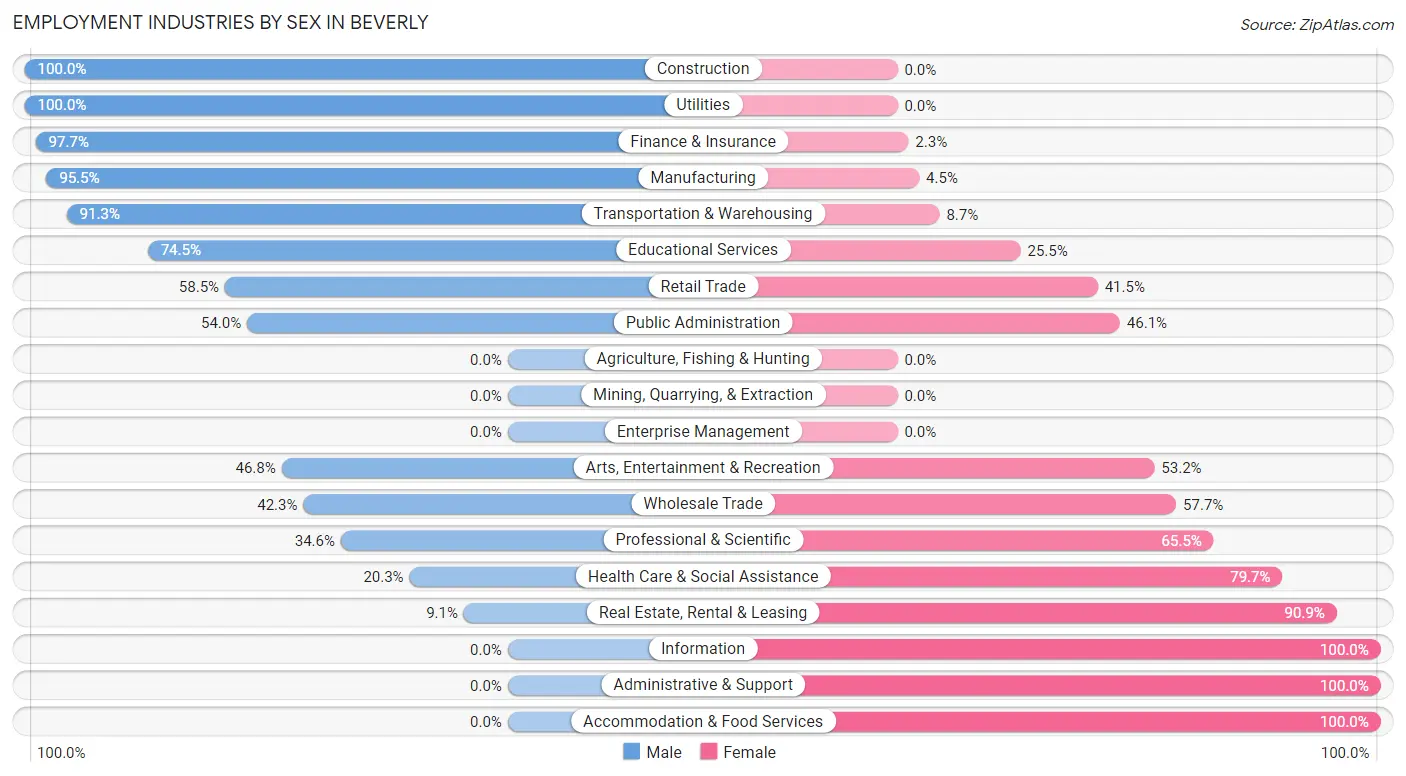
| Industry | Male | Female |
| Agriculture, Fishing & Hunting | 0 (0.0%) | 0 (0.0%) |
| Mining, Quarrying, & Extraction | 0 (0.0%) | 0 (0.0%) |
| Construction | 109 (100.0%) | 0 (0.0%) |
| Manufacturing | 106 (95.5%) | 5 (4.5%) |
| Wholesale Trade | 22 (42.3%) | 30 (57.7%) |
| Retail Trade | 72 (58.5%) | 51 (41.5%) |
| Transportation & Warehousing | 63 (91.3%) | 6 (8.7%) |
| Utilities | 2 (100.0%) | 0 (0.0%) |
| Information | 0 (0.0%) | 18 (100.0%) |
| Finance & Insurance | 43 (97.7%) | 1 (2.3%) |
| Real Estate, Rental & Leasing | 3 (9.1%) | 30 (90.9%) |
| Professional & Scientific | 19 (34.5%) | 36 (65.4%) |
| Enterprise Management | 0 (0.0%) | 0 (0.0%) |
| Administrative & Support | 0 (0.0%) | 27 (100.0%) |
| Educational Services | 38 (74.5%) | 13 (25.5%) |
| Health Care & Social Assistance | 60 (20.3%) | 235 (79.7%) |
| Arts, Entertainment & Recreation | 22 (46.8%) | 25 (53.2%) |
| Accommodation & Food Services | 0 (0.0%) | 3 (100.0%) |
| Public Administration | 41 (53.9%) | 35 (46.1%) |
| Total | 620 (54.5%) | 518 (45.5%) |
Education in Beverly
School Enrollment in Beverly
The most common levels of schooling among the 572 students in Beverly are college / undergraduate (197 | 34.4%), middle school (102 | 17.8%), and graduate / professional (79 | 13.8%).
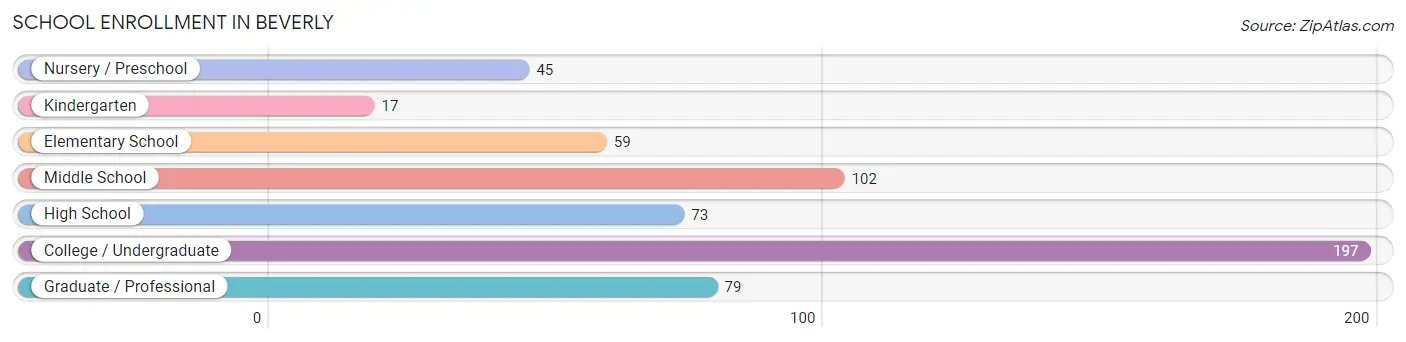
| School Level | # Students | % Students |
| Nursery / Preschool | 45 | 7.9% |
| Kindergarten | 17 | 3.0% |
| Elementary School | 59 | 10.3% |
| Middle School | 102 | 17.8% |
| High School | 73 | 12.8% |
| College / Undergraduate | 197 | 34.4% |
| Graduate / Professional | 79 | 13.8% |
| Total | 572 | 100.0% |
School Enrollment by Age by Funding Source in Beverly
Out of a total of 572 students who are enrolled in schools in Beverly, 142 (24.8%) attend a private institution, while the remaining 430 (75.2%) are enrolled in public schools. The age group of 35 years and over has the highest likelihood of being enrolled in private schools, with 34 (100.0% in the age bracket) enrolled. Conversely, the age group of 3 to 4 year olds has the lowest likelihood of being enrolled in a private school, with 45 (100.0% in the age bracket) attending a public institution.
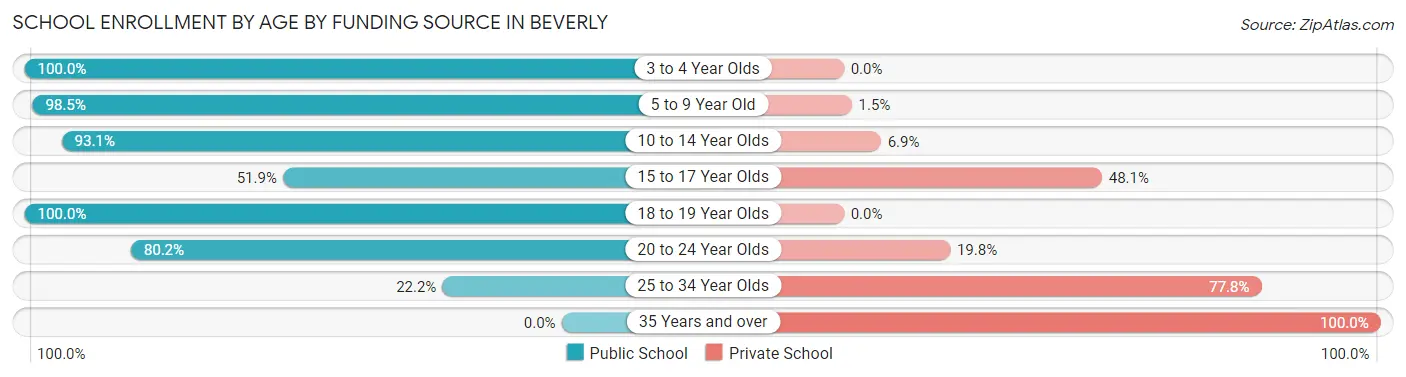
| Age Bracket | Public School | Private School |
| 3 to 4 Year Olds | 45 (100.0%) | 0 (0.0%) |
| 5 to 9 Year Old | 67 (98.5%) | 1 (1.5%) |
| 10 to 14 Year Olds | 108 (93.1%) | 8 (6.9%) |
| 15 to 17 Year Olds | 27 (51.9%) | 25 (48.1%) |
| 18 to 19 Year Olds | 15 (100.0%) | 0 (0.0%) |
| 20 to 24 Year Olds | 158 (80.2%) | 39 (19.8%) |
| 25 to 34 Year Olds | 10 (22.2%) | 35 (77.8%) |
| 35 Years and over | 0 (0.0%) | 34 (100.0%) |
| Total | 430 (75.2%) | 142 (24.8%) |
Educational Attainment by Field of Study in Beverly
Science & technology (91 | 18.8%), business (90 | 18.6%), education (69 | 14.3%), liberal arts & history (41 | 8.5%), and visual & performing arts (38 | 7.9%) are the most common fields of study among 484 individuals in Beverly who have obtained a bachelor's degree or higher.
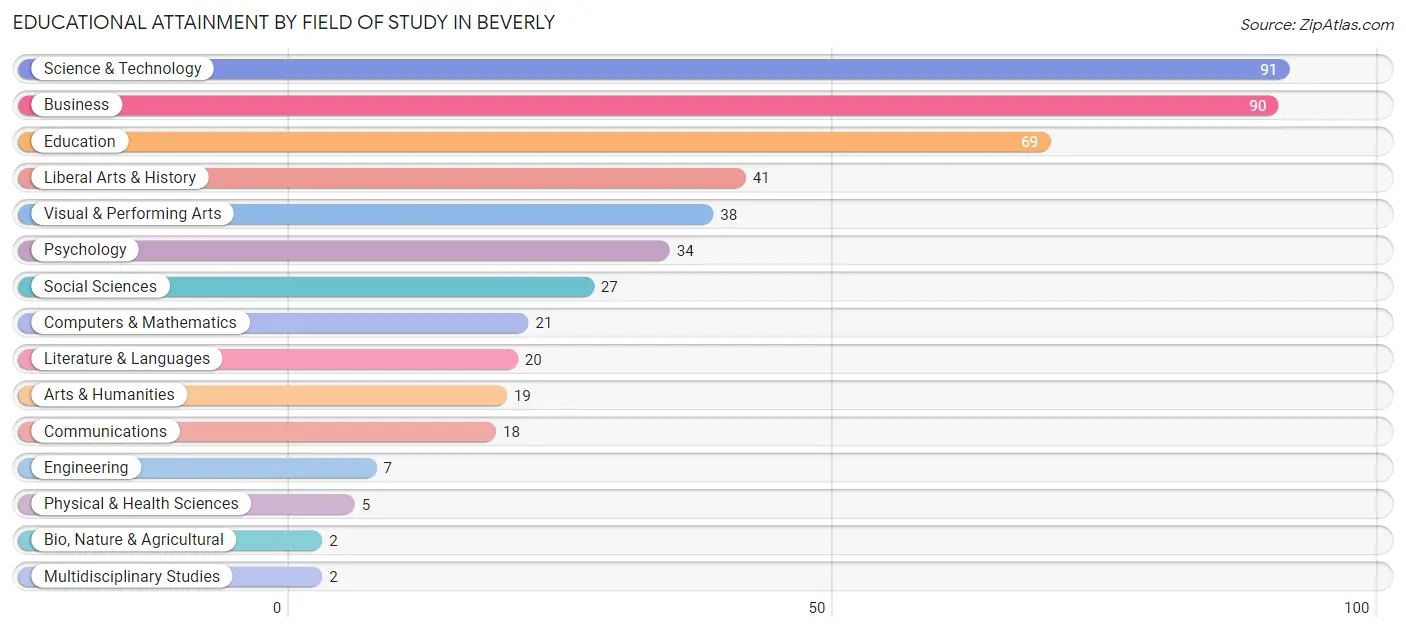
| Field of Study | # Graduates | % Graduates |
| Computers & Mathematics | 21 | 4.3% |
| Bio, Nature & Agricultural | 2 | 0.4% |
| Physical & Health Sciences | 5 | 1.0% |
| Psychology | 34 | 7.0% |
| Social Sciences | 27 | 5.6% |
| Engineering | 7 | 1.5% |
| Multidisciplinary Studies | 2 | 0.4% |
| Science & Technology | 91 | 18.8% |
| Business | 90 | 18.6% |
| Education | 69 | 14.3% |
| Literature & Languages | 20 | 4.1% |
| Liberal Arts & History | 41 | 8.5% |
| Visual & Performing Arts | 38 | 7.9% |
| Communications | 18 | 3.7% |
| Arts & Humanities | 19 | 3.9% |
| Total | 484 | 100.0% |
Transportation & Commute in Beverly
Vehicle Availability by Sex in Beverly
The most prevalent vehicle ownership categories in Beverly are males with 2 vehicles (181, accounting for 30.8%) and females with 2 vehicles (223, making up 37.2%).
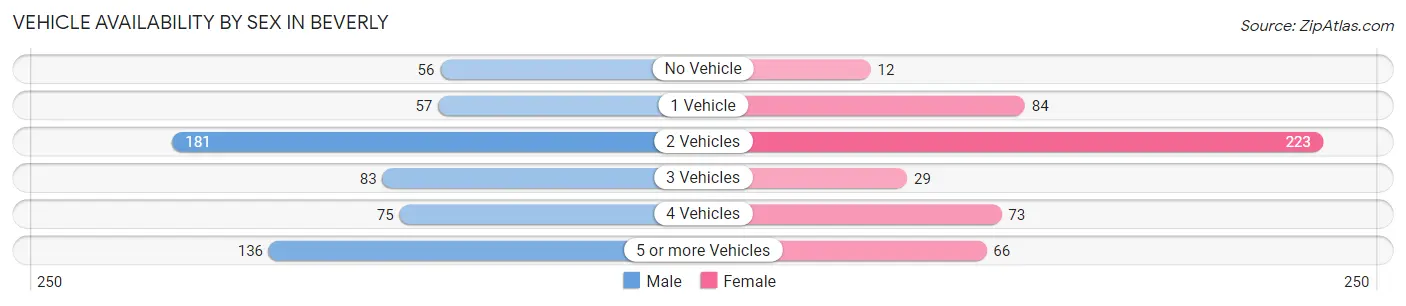
| Vehicles Available | Male | Female |
| No Vehicle | 56 (9.5%) | 12 (2.5%) |
| 1 Vehicle | 57 (9.7%) | 84 (17.2%) |
| 2 Vehicles | 181 (30.8%) | 223 (45.8%) |
| 3 Vehicles | 83 (14.1%) | 29 (5.9%) |
| 4 Vehicles | 75 (12.8%) | 73 (15.0%) |
| 5 or more Vehicles | 136 (23.1%) | 66 (13.6%) |
| Total | 588 (100.0%) | 487 (100.0%) |
Commute Time in Beverly
The most frequently occuring commute durations in Beverly are 20 to 24 minutes (252 commuters, 24.6%), 15 to 19 minutes (143 commuters, 14.0%), and 30 to 34 minutes (112 commuters, 10.9%).
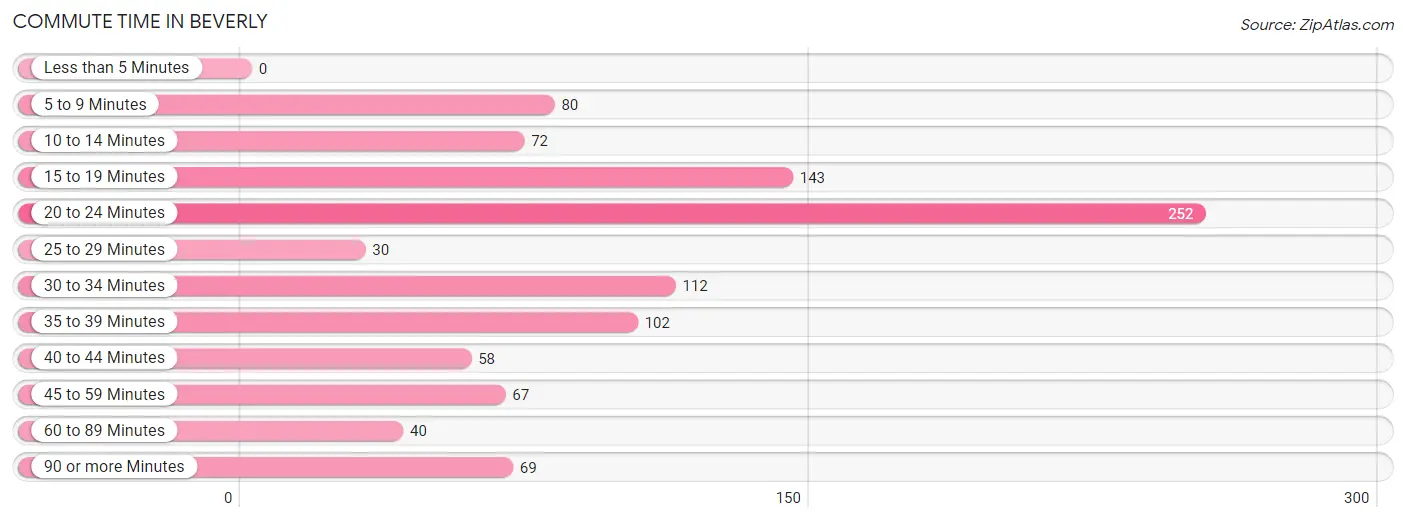
| Commute Time | # Commuters | % Commuters |
| Less than 5 Minutes | 0 | 0.0% |
| 5 to 9 Minutes | 80 | 7.8% |
| 10 to 14 Minutes | 72 | 7.0% |
| 15 to 19 Minutes | 143 | 14.0% |
| 20 to 24 Minutes | 252 | 24.6% |
| 25 to 29 Minutes | 30 | 2.9% |
| 30 to 34 Minutes | 112 | 10.9% |
| 35 to 39 Minutes | 102 | 10.0% |
| 40 to 44 Minutes | 58 | 5.7% |
| 45 to 59 Minutes | 67 | 6.5% |
| 60 to 89 Minutes | 40 | 3.9% |
| 90 or more Minutes | 69 | 6.7% |
Commute Time by Sex in Beverly
The most common commute times in Beverly are 20 to 24 minutes (191 commuters, 33.8%) for males and 15 to 19 minutes (104 commuters, 22.7%) for females.
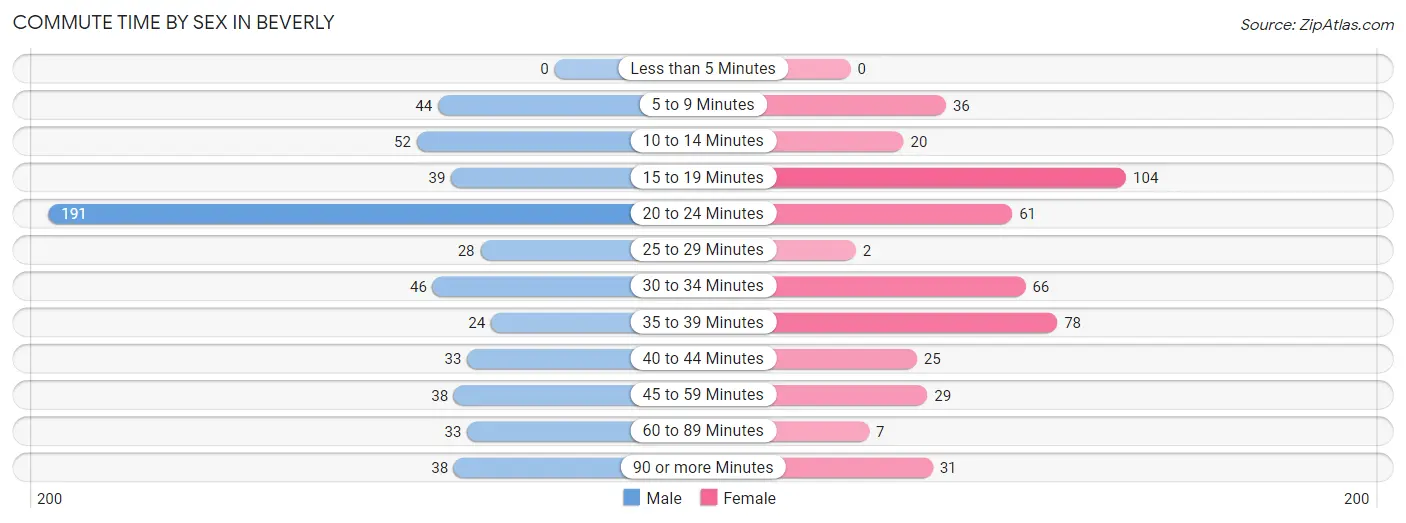
| Commute Time | Male | Female |
| Less than 5 Minutes | 0 (0.0%) | 0 (0.0%) |
| 5 to 9 Minutes | 44 (7.8%) | 36 (7.8%) |
| 10 to 14 Minutes | 52 (9.2%) | 20 (4.4%) |
| 15 to 19 Minutes | 39 (6.9%) | 104 (22.7%) |
| 20 to 24 Minutes | 191 (33.8%) | 61 (13.3%) |
| 25 to 29 Minutes | 28 (5.0%) | 2 (0.4%) |
| 30 to 34 Minutes | 46 (8.1%) | 66 (14.4%) |
| 35 to 39 Minutes | 24 (4.2%) | 78 (17.0%) |
| 40 to 44 Minutes | 33 (5.8%) | 25 (5.4%) |
| 45 to 59 Minutes | 38 (6.7%) | 29 (6.3%) |
| 60 to 89 Minutes | 33 (5.8%) | 7 (1.5%) |
| 90 or more Minutes | 38 (6.7%) | 31 (6.8%) |
Time of Departure to Work by Sex in Beverly
The most frequent times of departure to work in Beverly are 6:30 AM to 6:59 AM (94, 16.6%) for males and 6:30 AM to 6:59 AM (116, 25.3%) for females.
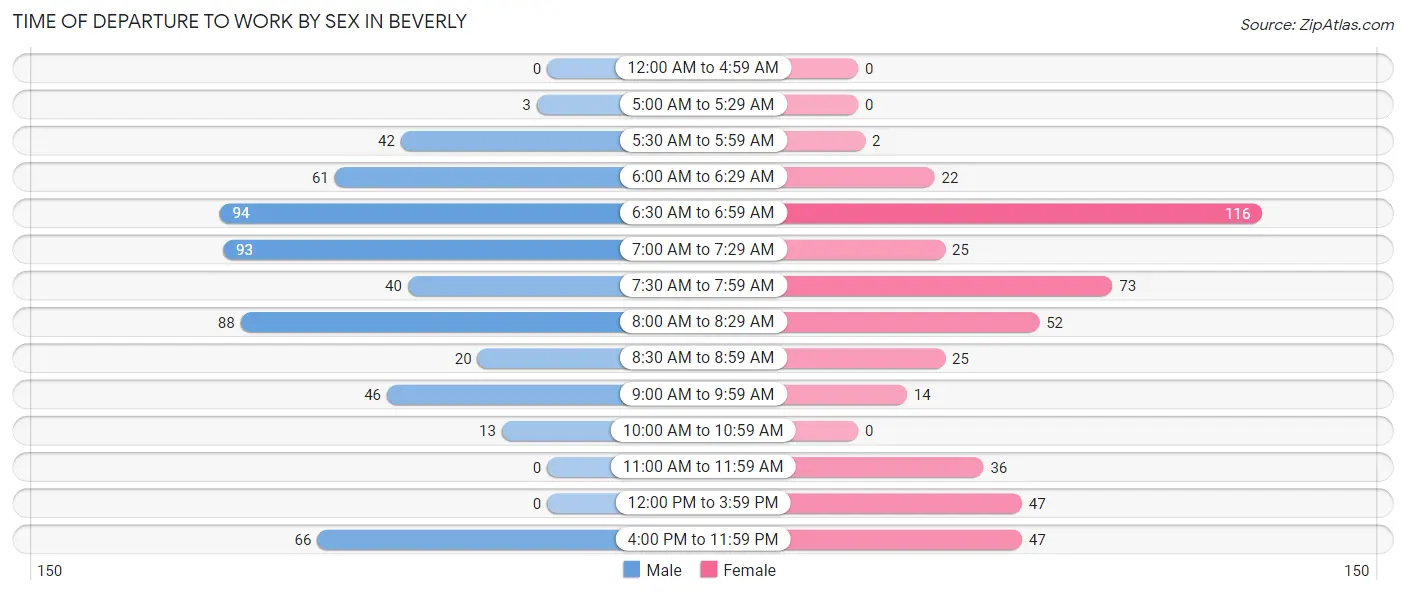
| Time of Departure | Male | Female |
| 12:00 AM to 4:59 AM | 0 (0.0%) | 0 (0.0%) |
| 5:00 AM to 5:29 AM | 3 (0.5%) | 0 (0.0%) |
| 5:30 AM to 5:59 AM | 42 (7.4%) | 2 (0.4%) |
| 6:00 AM to 6:29 AM | 61 (10.8%) | 22 (4.8%) |
| 6:30 AM to 6:59 AM | 94 (16.6%) | 116 (25.3%) |
| 7:00 AM to 7:29 AM | 93 (16.4%) | 25 (5.4%) |
| 7:30 AM to 7:59 AM | 40 (7.1%) | 73 (15.9%) |
| 8:00 AM to 8:29 AM | 88 (15.5%) | 52 (11.3%) |
| 8:30 AM to 8:59 AM | 20 (3.5%) | 25 (5.4%) |
| 9:00 AM to 9:59 AM | 46 (8.1%) | 14 (3.0%) |
| 10:00 AM to 10:59 AM | 13 (2.3%) | 0 (0.0%) |
| 11:00 AM to 11:59 AM | 0 (0.0%) | 36 (7.8%) |
| 12:00 PM to 3:59 PM | 0 (0.0%) | 47 (10.2%) |
| 4:00 PM to 11:59 PM | 66 (11.7%) | 47 (10.2%) |
| Total | 566 (100.0%) | 459 (100.0%) |
Housing Occupancy in Beverly
Occupancy by Ownership in Beverly
Of the total 833 dwellings in Beverly, owner-occupied units account for 650 (78.0%), while renter-occupied units make up 183 (22.0%).
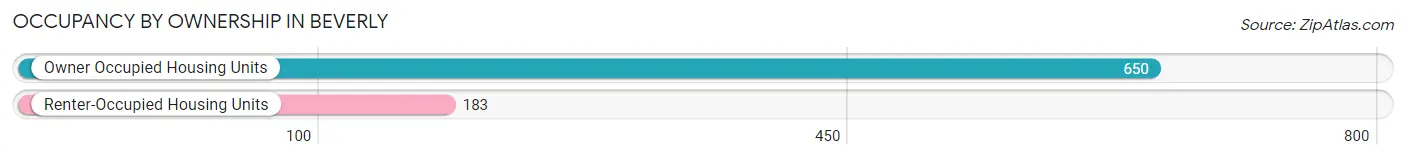
| Occupancy | # Housing Units | % Housing Units |
| Owner Occupied Housing Units | 650 | 78.0% |
| Renter-Occupied Housing Units | 183 | 22.0% |
| Total Occupied Housing Units | 833 | 100.0% |
Occupancy by Household Size in Beverly
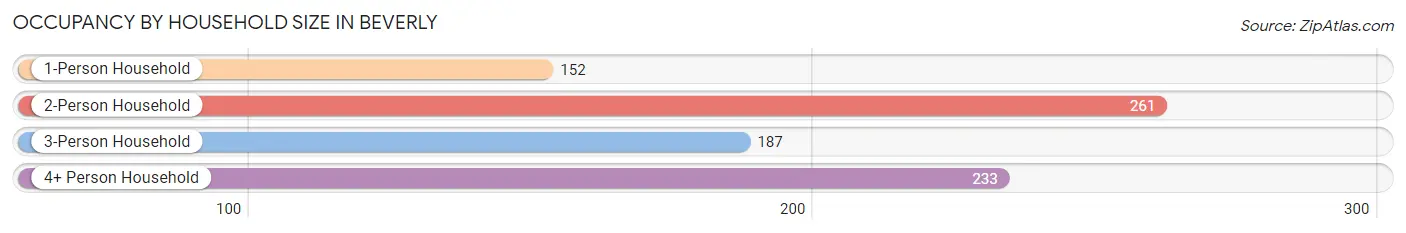
| Household Size | # Housing Units | % Housing Units |
| 1-Person Household | 152 | 18.2% |
| 2-Person Household | 261 | 31.3% |
| 3-Person Household | 187 | 22.5% |
| 4+ Person Household | 233 | 28.0% |
| Total Housing Units | 833 | 100.0% |
Occupancy by Ownership by Household Size in Beverly
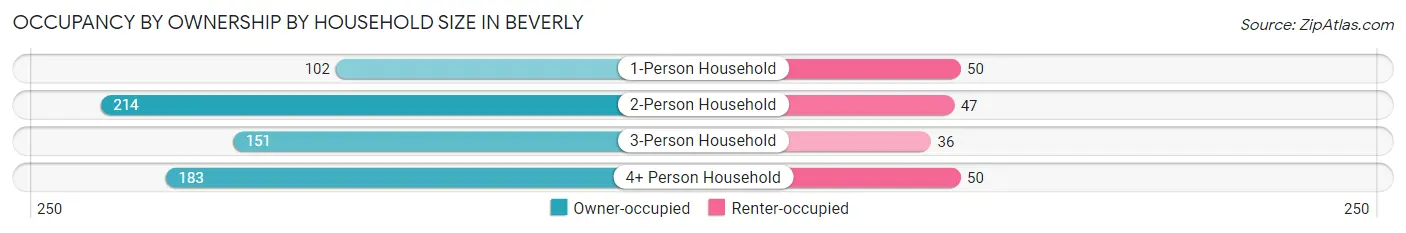
| Household Size | Owner-occupied | Renter-occupied |
| 1-Person Household | 102 (67.1%) | 50 (32.9%) |
| 2-Person Household | 214 (82.0%) | 47 (18.0%) |
| 3-Person Household | 151 (80.7%) | 36 (19.3%) |
| 4+ Person Household | 183 (78.5%) | 50 (21.5%) |
| Total Housing Units | 650 (78.0%) | 183 (22.0%) |
Occupancy by Educational Attainment in Beverly
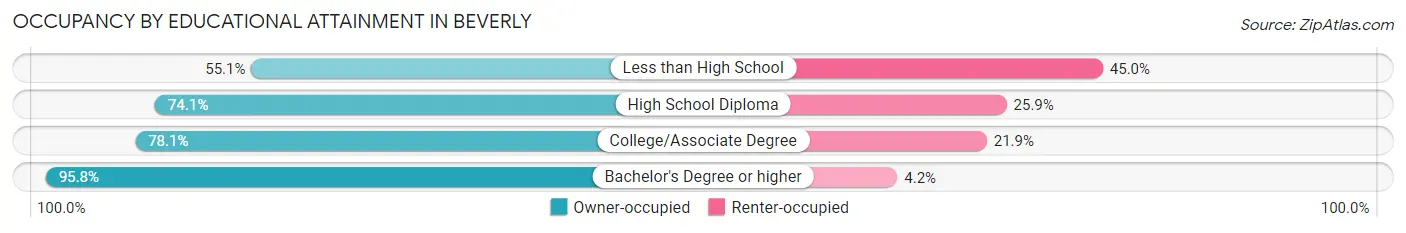
| Household Size | Owner-occupied | Renter-occupied |
| Less than High School | 60 (55.0%) | 49 (45.0%) |
| High School Diploma | 172 (74.1%) | 60 (25.9%) |
| College/Associate Degree | 235 (78.1%) | 66 (21.9%) |
| Bachelor's Degree or higher | 183 (95.8%) | 8 (4.2%) |
Occupancy by Age of Householder in Beverly
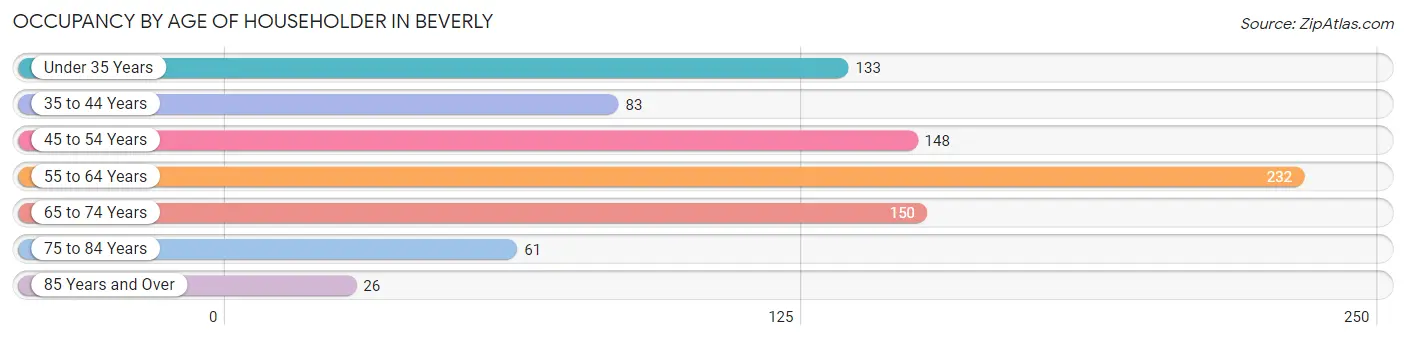
| Age Bracket | # Households | % Households |
| Under 35 Years | 133 | 16.0% |
| 35 to 44 Years | 83 | 10.0% |
| 45 to 54 Years | 148 | 17.8% |
| 55 to 64 Years | 232 | 27.9% |
| 65 to 74 Years | 150 | 18.0% |
| 75 to 84 Years | 61 | 7.3% |
| 85 Years and Over | 26 | 3.1% |
| Total | 833 | 100.0% |
Housing Finances in Beverly
Median Income by Occupancy in Beverly
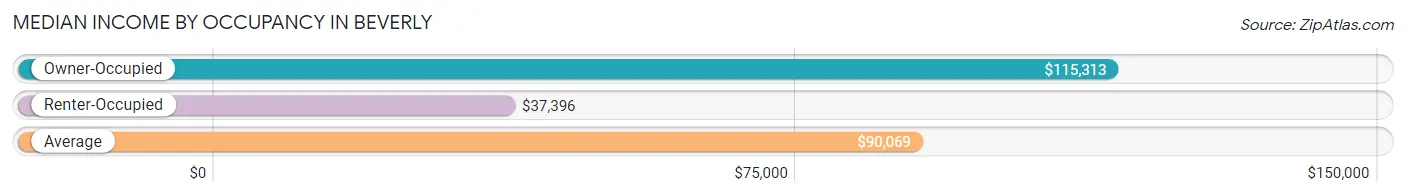
| Occupancy Type | # Households | Median Income |
| Owner-Occupied | 650 (78.0%) | $115,313 |
| Renter-Occupied | 183 (22.0%) | $37,396 |
| Average | 833 (100.0%) | $90,069 |
Occupancy by Householder Income Bracket in Beverly
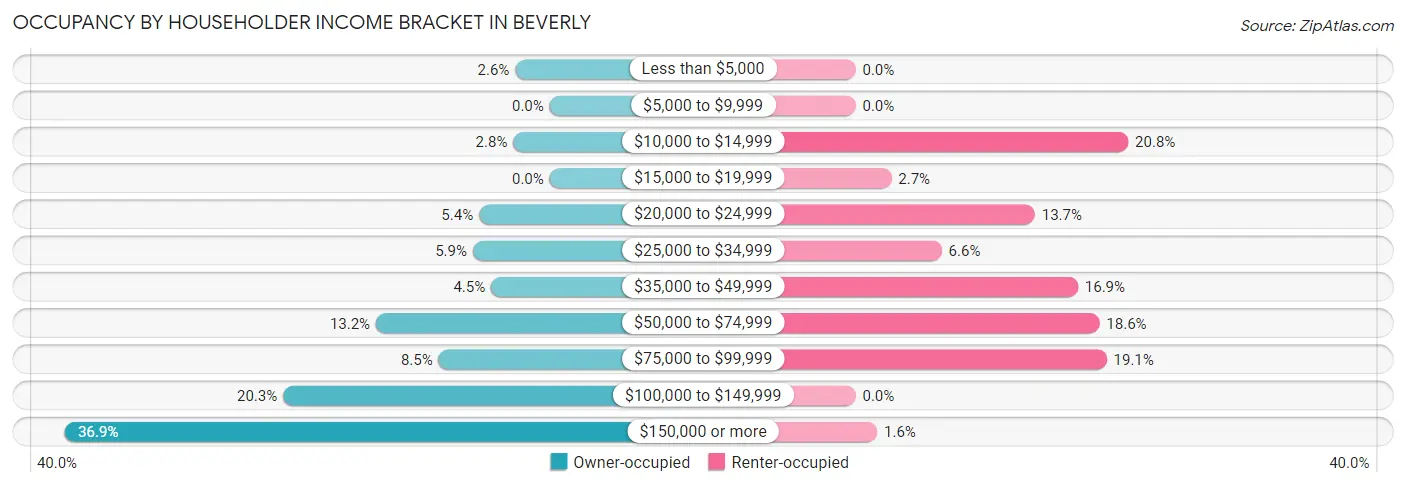
| Income Bracket | Owner-occupied | Renter-occupied |
| Less than $5,000 | 17 (2.6%) | 0 (0.0%) |
| $5,000 to $9,999 | 0 (0.0%) | 0 (0.0%) |
| $10,000 to $14,999 | 18 (2.8%) | 38 (20.8%) |
| $15,000 to $19,999 | 0 (0.0%) | 5 (2.7%) |
| $20,000 to $24,999 | 35 (5.4%) | 25 (13.7%) |
| $25,000 to $34,999 | 38 (5.9%) | 12 (6.6%) |
| $35,000 to $49,999 | 29 (4.5%) | 31 (16.9%) |
| $50,000 to $74,999 | 86 (13.2%) | 34 (18.6%) |
| $75,000 to $99,999 | 55 (8.5%) | 35 (19.1%) |
| $100,000 to $149,999 | 132 (20.3%) | 0 (0.0%) |
| $150,000 or more | 240 (36.9%) | 3 (1.6%) |
| Total | 650 (100.0%) | 183 (100.0%) |
Monthly Housing Cost Tiers in Beverly
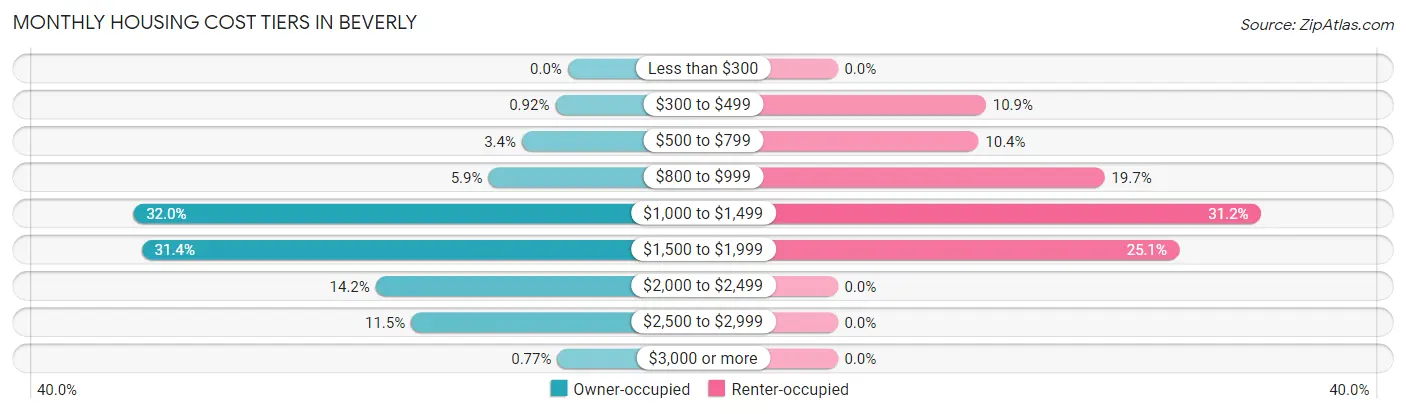
| Monthly Cost | Owner-occupied | Renter-occupied |
| Less than $300 | 0 (0.0%) | 0 (0.0%) |
| $300 to $499 | 6 (0.9%) | 20 (10.9%) |
| $500 to $799 | 22 (3.4%) | 19 (10.4%) |
| $800 to $999 | 38 (5.9%) | 36 (19.7%) |
| $1,000 to $1,499 | 208 (32.0%) | 57 (31.1%) |
| $1,500 to $1,999 | 204 (31.4%) | 46 (25.1%) |
| $2,000 to $2,499 | 92 (14.1%) | 0 (0.0%) |
| $2,500 to $2,999 | 75 (11.5%) | 0 (0.0%) |
| $3,000 or more | 5 (0.8%) | 0 (0.0%) |
| Total | 650 (100.0%) | 183 (100.0%) |
Physical Housing Characteristics in Beverly
Housing Structures in Beverly
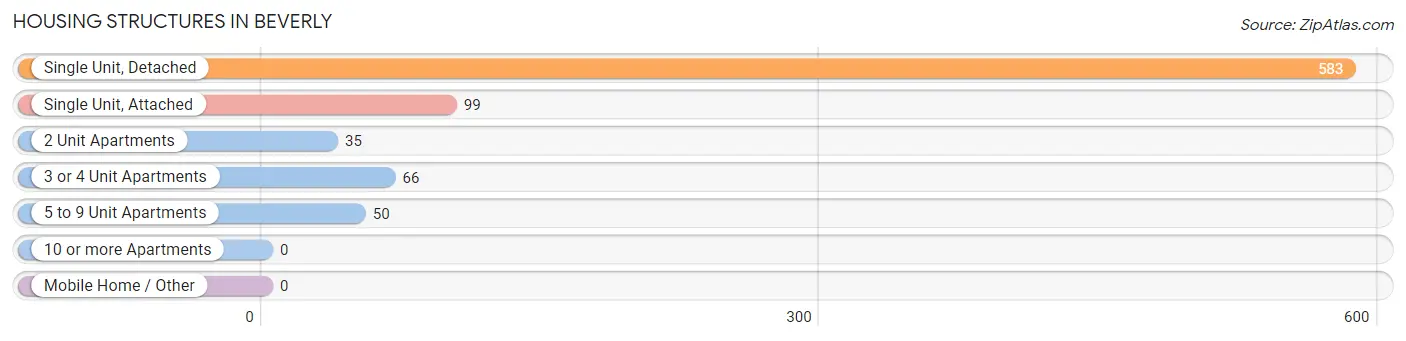
| Structure Type | # Housing Units | % Housing Units |
| Single Unit, Detached | 583 | 70.0% |
| Single Unit, Attached | 99 | 11.9% |
| 2 Unit Apartments | 35 | 4.2% |
| 3 or 4 Unit Apartments | 66 | 7.9% |
| 5 to 9 Unit Apartments | 50 | 6.0% |
| 10 or more Apartments | 0 | 0.0% |
| Mobile Home / Other | 0 | 0.0% |
| Total | 833 | 100.0% |
Housing Structures by Occupancy in Beverly
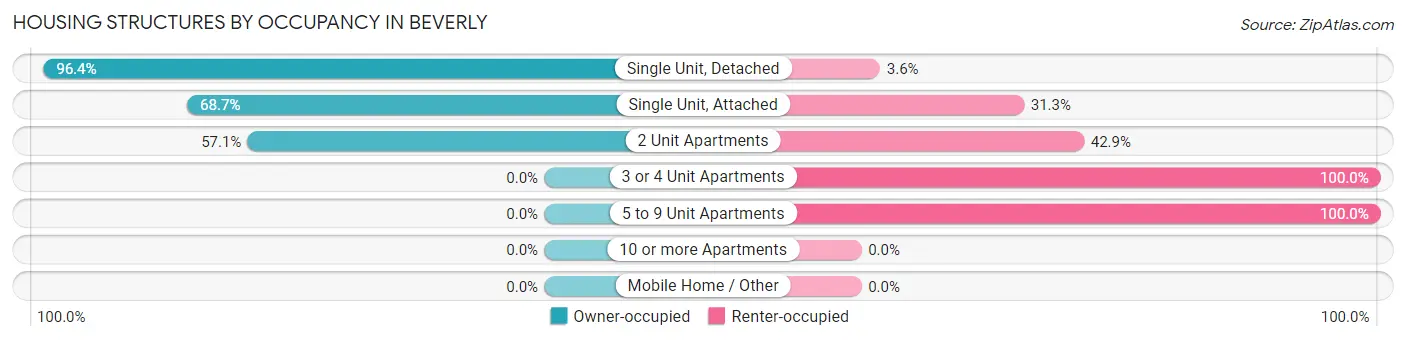
| Structure Type | Owner-occupied | Renter-occupied |
| Single Unit, Detached | 562 (96.4%) | 21 (3.6%) |
| Single Unit, Attached | 68 (68.7%) | 31 (31.3%) |
| 2 Unit Apartments | 20 (57.1%) | 15 (42.9%) |
| 3 or 4 Unit Apartments | 0 (0.0%) | 66 (100.0%) |
| 5 to 9 Unit Apartments | 0 (0.0%) | 50 (100.0%) |
| 10 or more Apartments | 0 (0.0%) | 0 (0.0%) |
| Mobile Home / Other | 0 (0.0%) | 0 (0.0%) |
| Total | 650 (78.0%) | 183 (22.0%) |
Housing Structures by Number of Rooms in Beverly
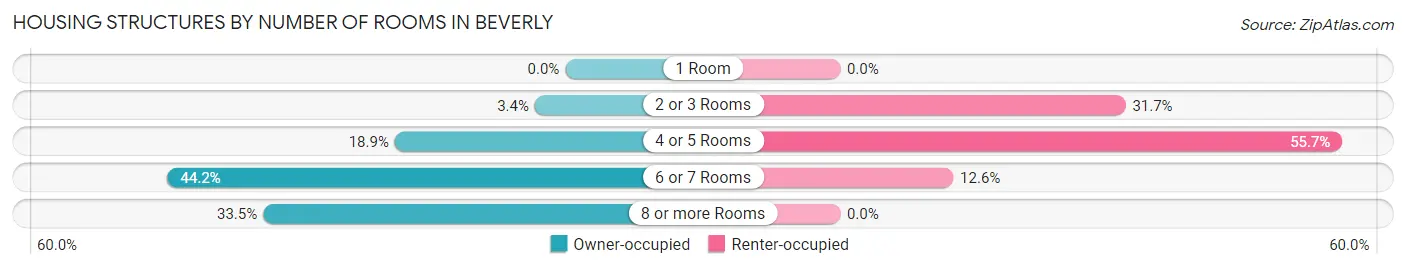
| Number of Rooms | Owner-occupied | Renter-occupied |
| 1 Room | 0 (0.0%) | 0 (0.0%) |
| 2 or 3 Rooms | 22 (3.4%) | 58 (31.7%) |
| 4 or 5 Rooms | 123 (18.9%) | 102 (55.7%) |
| 6 or 7 Rooms | 287 (44.2%) | 23 (12.6%) |
| 8 or more Rooms | 218 (33.5%) | 0 (0.0%) |
| Total | 650 (100.0%) | 183 (100.0%) |
Housing Structure by Heating Type in Beverly
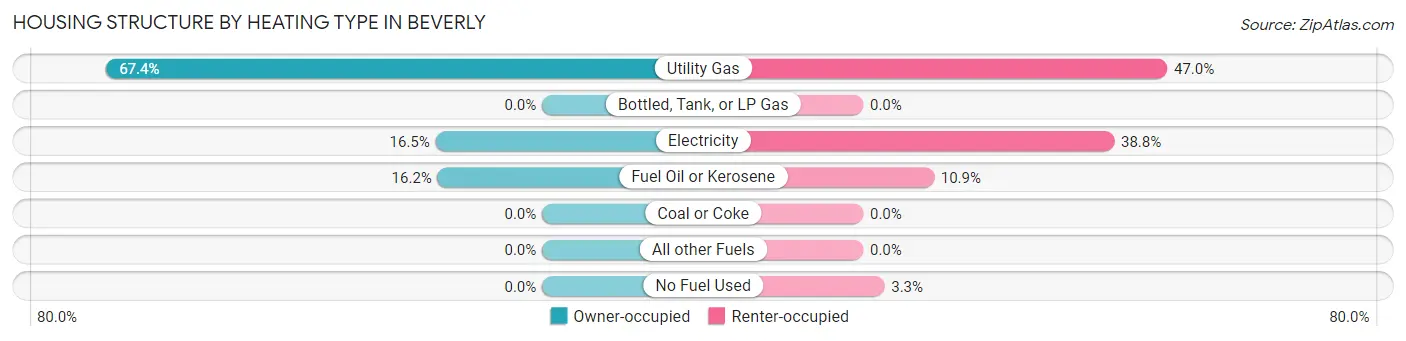
| Heating Type | Owner-occupied | Renter-occupied |
| Utility Gas | 438 (67.4%) | 86 (47.0%) |
| Bottled, Tank, or LP Gas | 0 (0.0%) | 0 (0.0%) |
| Electricity | 107 (16.5%) | 71 (38.8%) |
| Fuel Oil or Kerosene | 105 (16.2%) | 20 (10.9%) |
| Coal or Coke | 0 (0.0%) | 0 (0.0%) |
| All other Fuels | 0 (0.0%) | 0 (0.0%) |
| No Fuel Used | 0 (0.0%) | 6 (3.3%) |
| Total | 650 (100.0%) | 183 (100.0%) |
Household Vehicle Usage in Beverly
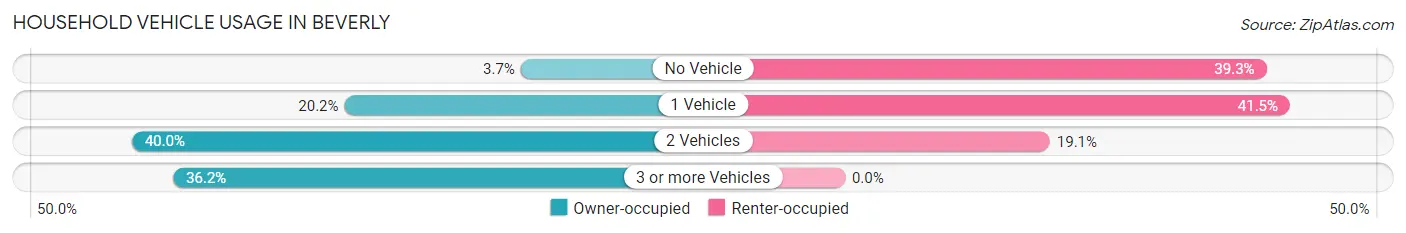
| Vehicles per Household | Owner-occupied | Renter-occupied |
| No Vehicle | 24 (3.7%) | 72 (39.3%) |
| 1 Vehicle | 131 (20.2%) | 76 (41.5%) |
| 2 Vehicles | 260 (40.0%) | 35 (19.1%) |
| 3 or more Vehicles | 235 (36.1%) | 0 (0.0%) |
| Total | 650 (100.0%) | 183 (100.0%) |
Real Estate & Mortgages in Beverly
Real Estate and Mortgage Overview in Beverly
| Characteristic | Without Mortgage | With Mortgage |
| Housing Units | 175 | 475 |
| Median Property Value | $168,100 | $191,400 |
| Median Household Income | $78,625 | $200 |
| Monthly Housing Costs | $1,128 | $5 |
| Real Estate Taxes | $7,673 | $0 |
Property Value by Mortgage Status in Beverly
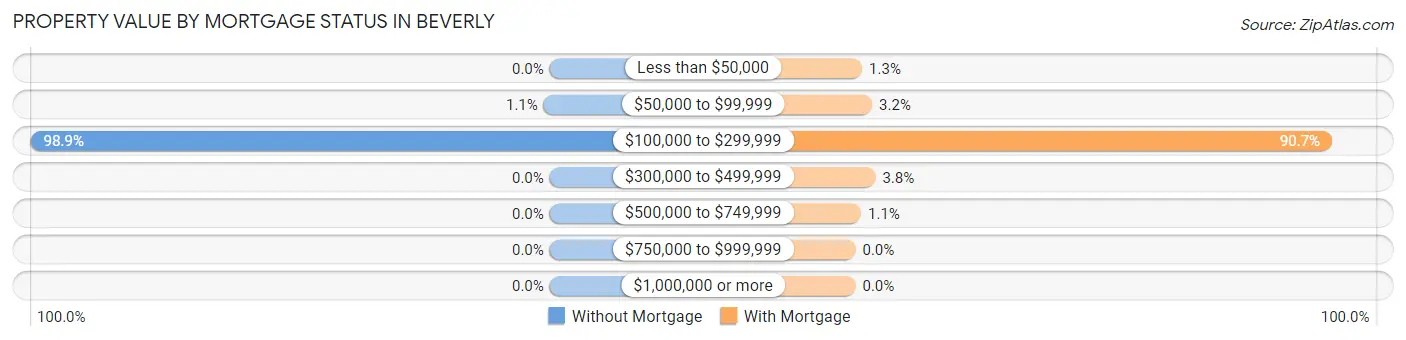
| Property Value | Without Mortgage | With Mortgage |
| Less than $50,000 | 0 (0.0%) | 6 (1.3%) |
| $50,000 to $99,999 | 2 (1.1%) | 15 (3.2%) |
| $100,000 to $299,999 | 173 (98.9%) | 431 (90.7%) |
| $300,000 to $499,999 | 0 (0.0%) | 18 (3.8%) |
| $500,000 to $749,999 | 0 (0.0%) | 5 (1.1%) |
| $750,000 to $999,999 | 0 (0.0%) | 0 (0.0%) |
| $1,000,000 or more | 0 (0.0%) | 0 (0.0%) |
| Total | 175 (100.0%) | 475 (100.0%) |
Household Income by Mortgage Status in Beverly
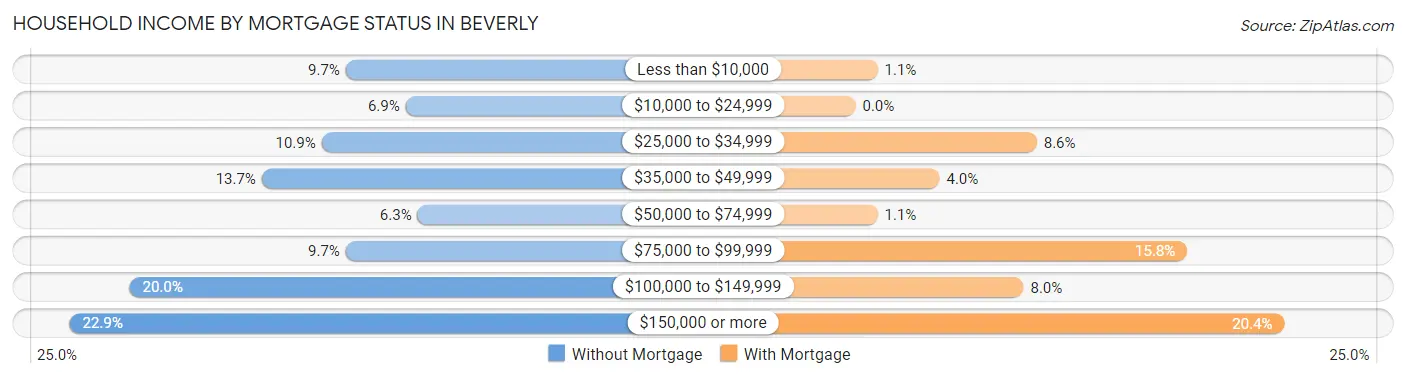
| Household Income | Without Mortgage | With Mortgage |
| Less than $10,000 | 17 (9.7%) | 5 (1.1%) |
| $10,000 to $24,999 | 12 (6.9%) | 0 (0.0%) |
| $25,000 to $34,999 | 19 (10.9%) | 41 (8.6%) |
| $35,000 to $49,999 | 24 (13.7%) | 19 (4.0%) |
| $50,000 to $74,999 | 11 (6.3%) | 5 (1.1%) |
| $75,000 to $99,999 | 17 (9.7%) | 75 (15.8%) |
| $100,000 to $149,999 | 35 (20.0%) | 38 (8.0%) |
| $150,000 or more | 40 (22.9%) | 97 (20.4%) |
| Total | 175 (100.0%) | 475 (100.0%) |
Property Value to Household Income Ratio in Beverly
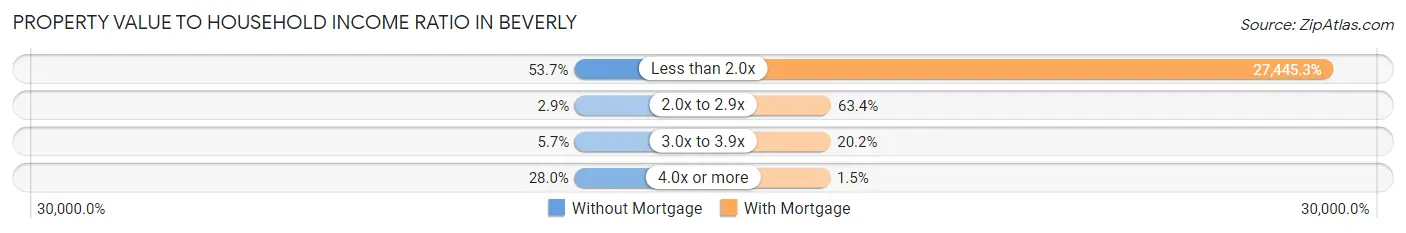
| Value-to-Income Ratio | Without Mortgage | With Mortgage |
| Less than 2.0x | 94 (53.7%) | 130,365 (27,445.3%) |
| 2.0x to 2.9x | 5 (2.9%) | 301 (63.4%) |
| 3.0x to 3.9x | 10 (5.7%) | 96 (20.2%) |
| 4.0x or more | 49 (28.0%) | 7 (1.5%) |
| Total | 175 (100.0%) | 475 (100.0%) |
Real Estate Taxes by Mortgage Status in Beverly
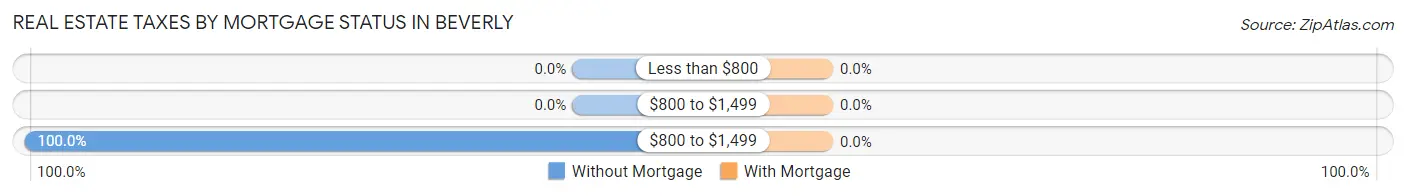
| Property Taxes | Without Mortgage | With Mortgage |
| Less than $800 | 0 (0.0%) | 0 (0.0%) |
| $800 to $1,499 | 0 (0.0%) | 0 (0.0%) |
| $800 to $1,499 | 175 (100.0%) | 0 (0.0%) |
| Total | 175 (100.0%) | 475 (100.0%) |
Health & Disability in Beverly
Health Insurance Coverage by Age in Beverly
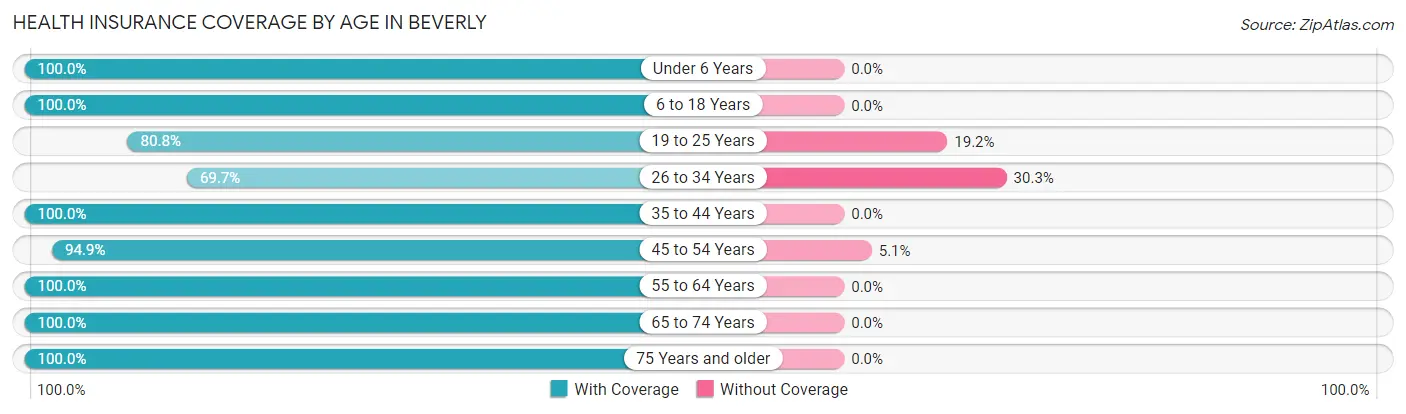
| Age Bracket | With Coverage | Without Coverage |
| Under 6 Years | 195 (100.0%) | 0 (0.0%) |
| 6 to 18 Years | 273 (100.0%) | 0 (0.0%) |
| 19 to 25 Years | 248 (80.8%) | 59 (19.2%) |
| 26 to 34 Years | 228 (69.7%) | 99 (30.3%) |
| 35 to 44 Years | 237 (100.0%) | 0 (0.0%) |
| 45 to 54 Years | 370 (94.9%) | 20 (5.1%) |
| 55 to 64 Years | 393 (100.0%) | 0 (0.0%) |
| 65 to 74 Years | 267 (100.0%) | 0 (0.0%) |
| 75 Years and older | 113 (100.0%) | 0 (0.0%) |
| Total | 2,324 (92.9%) | 178 (7.1%) |
Health Insurance Coverage by Citizenship Status in Beverly
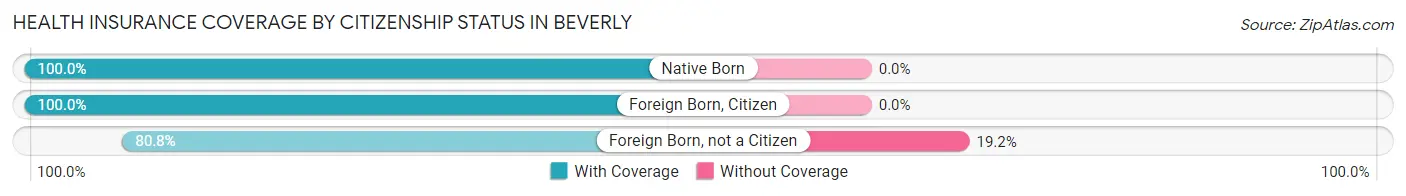
| Citizenship Status | With Coverage | Without Coverage |
| Native Born | 195 (100.0%) | 0 (0.0%) |
| Foreign Born, Citizen | 273 (100.0%) | 0 (0.0%) |
| Foreign Born, not a Citizen | 248 (80.8%) | 59 (19.2%) |
Health Insurance Coverage by Household Income in Beverly
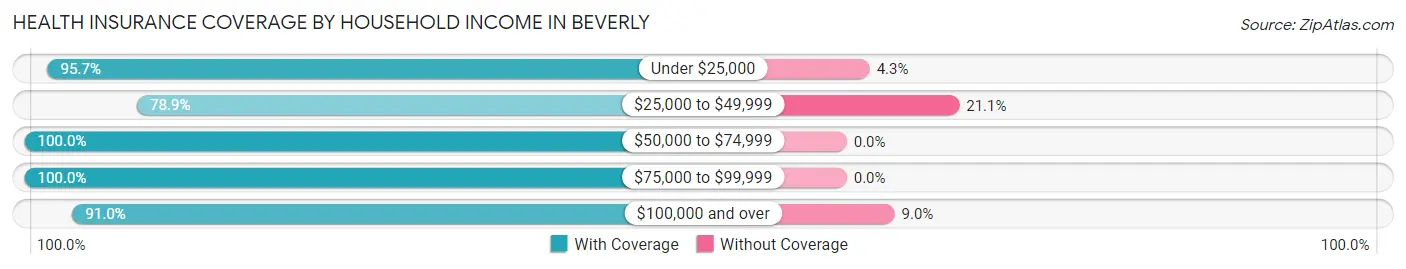
| Household Income | With Coverage | Without Coverage |
| Under $25,000 | 334 (95.7%) | 15 (4.3%) |
| $25,000 to $49,999 | 131 (78.9%) | 35 (21.1%) |
| $50,000 to $74,999 | 298 (100.0%) | 0 (0.0%) |
| $75,000 to $99,999 | 261 (100.0%) | 0 (0.0%) |
| $100,000 and over | 1,300 (91.0%) | 128 (9.0%) |
Public vs Private Health Insurance Coverage by Age in Beverly
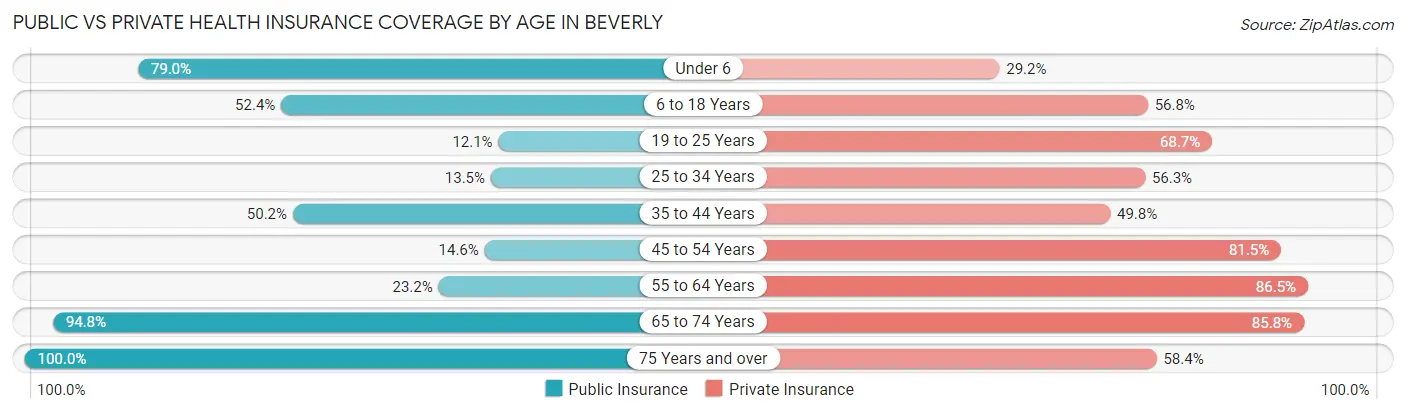
| Age Bracket | Public Insurance | Private Insurance |
| Under 6 | 154 (79.0%) | 57 (29.2%) |
| 6 to 18 Years | 143 (52.4%) | 155 (56.8%) |
| 19 to 25 Years | 37 (12.0%) | 211 (68.7%) |
| 25 to 34 Years | 44 (13.5%) | 184 (56.3%) |
| 35 to 44 Years | 119 (50.2%) | 118 (49.8%) |
| 45 to 54 Years | 57 (14.6%) | 318 (81.5%) |
| 55 to 64 Years | 91 (23.2%) | 340 (86.5%) |
| 65 to 74 Years | 253 (94.8%) | 229 (85.8%) |
| 75 Years and over | 113 (100.0%) | 66 (58.4%) |
| Total | 1,011 (40.4%) | 1,678 (67.1%) |
Disability Status by Sex by Age in Beverly
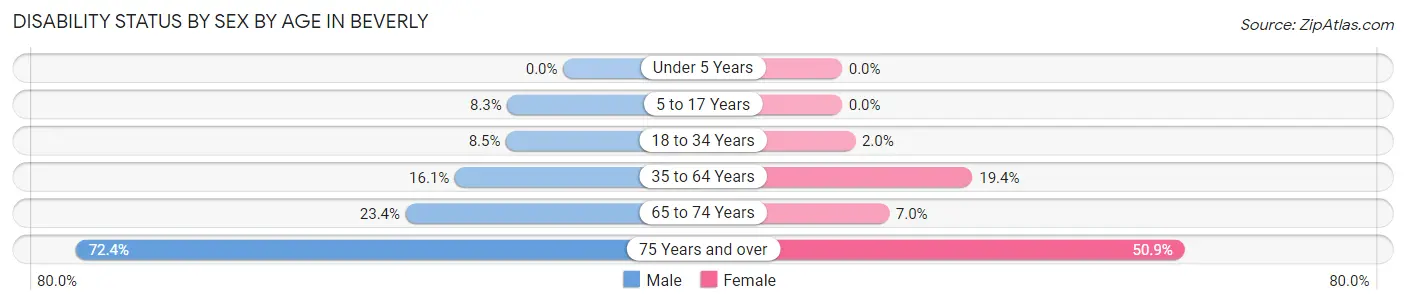
| Age Bracket | Male | Female |
| Under 5 Years | 0 (0.0%) | 0 (0.0%) |
| 5 to 17 Years | 13 (8.3%) | 0 (0.0%) |
| 18 to 34 Years | 21 (8.5%) | 8 (2.0%) |
| 35 to 64 Years | 81 (16.1%) | 100 (19.4%) |
| 65 to 74 Years | 29 (23.4%) | 10 (7.0%) |
| 75 Years and over | 42 (72.4%) | 28 (50.9%) |
Disability Class by Sex by Age in Beverly
Disability Class: Hearing Difficulty
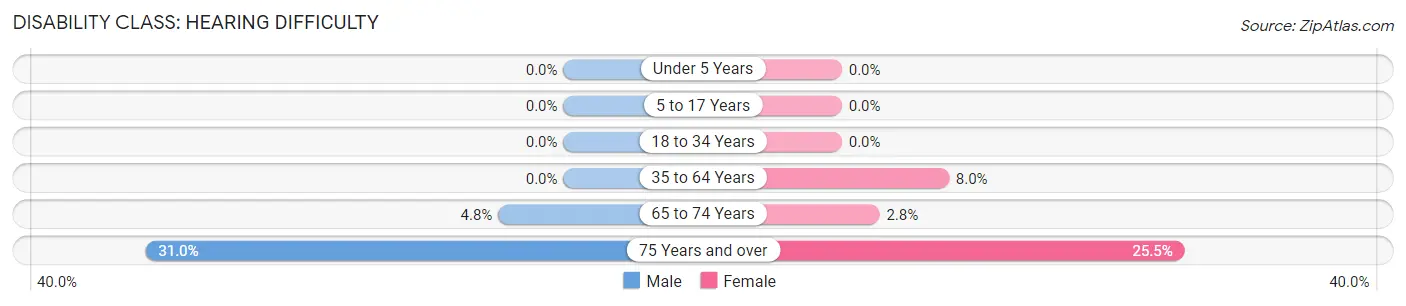
| Age Bracket | Male | Female |
| Under 5 Years | 0 (0.0%) | 0 (0.0%) |
| 5 to 17 Years | 0 (0.0%) | 0 (0.0%) |
| 18 to 34 Years | 0 (0.0%) | 0 (0.0%) |
| 35 to 64 Years | 0 (0.0%) | 41 (8.0%) |
| 65 to 74 Years | 6 (4.8%) | 4 (2.8%) |
| 75 Years and over | 18 (31.0%) | 14 (25.5%) |
Disability Class: Vision Difficulty
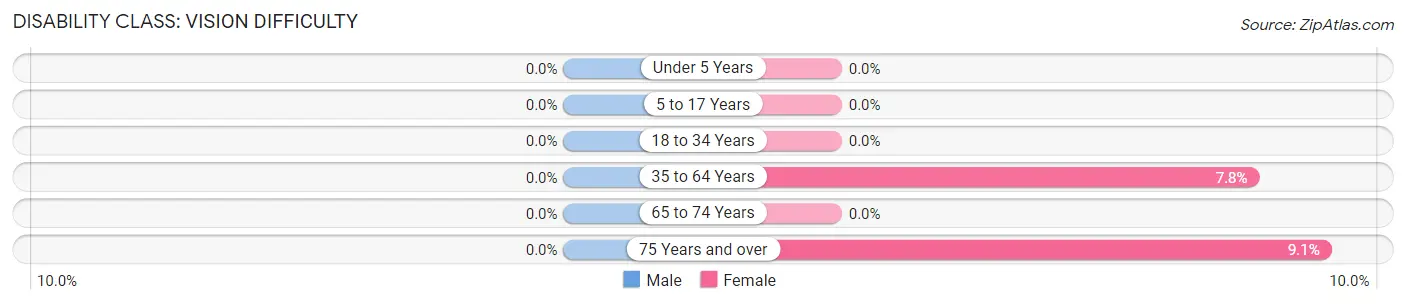
| Age Bracket | Male | Female |
| Under 5 Years | 0 (0.0%) | 0 (0.0%) |
| 5 to 17 Years | 0 (0.0%) | 0 (0.0%) |
| 18 to 34 Years | 0 (0.0%) | 0 (0.0%) |
| 35 to 64 Years | 0 (0.0%) | 40 (7.7%) |
| 65 to 74 Years | 0 (0.0%) | 0 (0.0%) |
| 75 Years and over | 0 (0.0%) | 5 (9.1%) |
Disability Class: Cognitive Difficulty
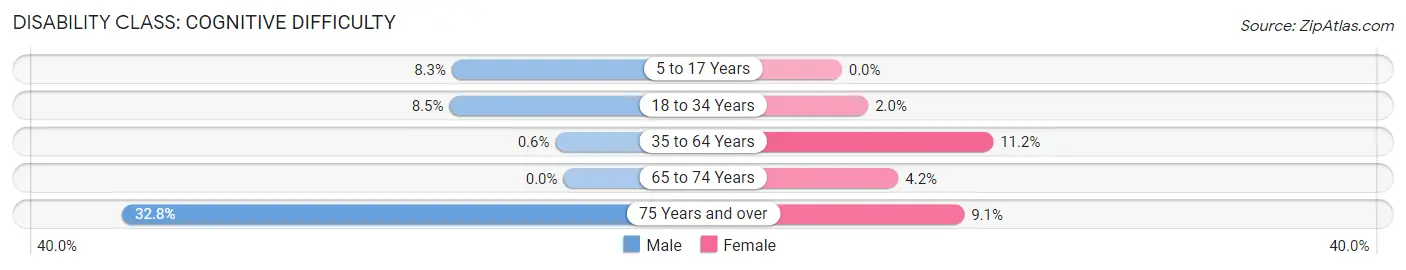
| Age Bracket | Male | Female |
| 5 to 17 Years | 13 (8.3%) | 0 (0.0%) |
| 18 to 34 Years | 21 (8.5%) | 8 (2.0%) |
| 35 to 64 Years | 3 (0.6%) | 58 (11.2%) |
| 65 to 74 Years | 0 (0.0%) | 6 (4.2%) |
| 75 Years and over | 19 (32.8%) | 5 (9.1%) |
Disability Class: Ambulatory Difficulty
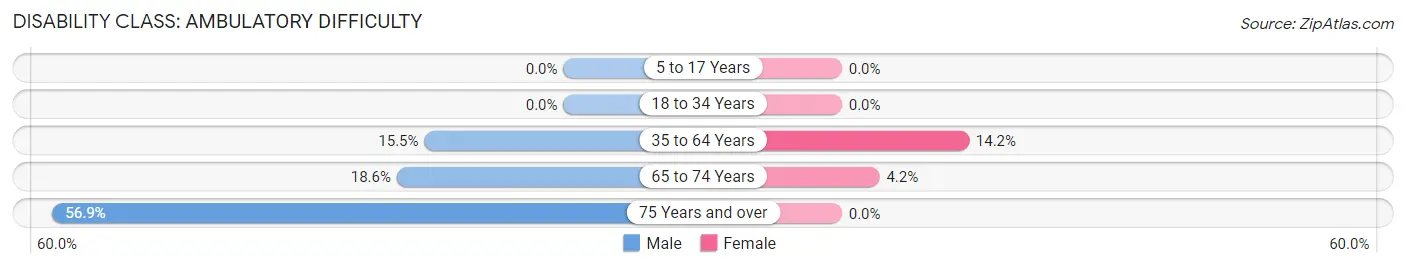
| Age Bracket | Male | Female |
| 5 to 17 Years | 0 (0.0%) | 0 (0.0%) |
| 18 to 34 Years | 0 (0.0%) | 0 (0.0%) |
| 35 to 64 Years | 78 (15.5%) | 73 (14.1%) |
| 65 to 74 Years | 23 (18.5%) | 6 (4.2%) |
| 75 Years and over | 33 (56.9%) | 0 (0.0%) |
Disability Class: Self-Care Difficulty
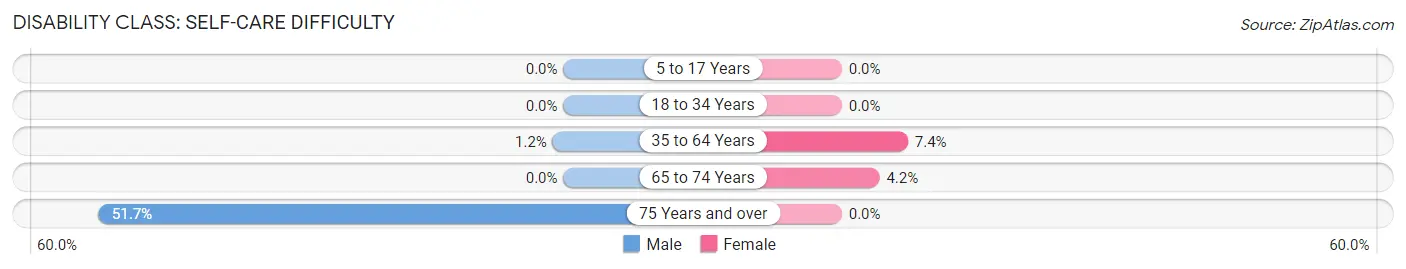
| Age Bracket | Male | Female |
| 5 to 17 Years | 0 (0.0%) | 0 (0.0%) |
| 18 to 34 Years | 0 (0.0%) | 0 (0.0%) |
| 35 to 64 Years | 6 (1.2%) | 38 (7.4%) |
| 65 to 74 Years | 0 (0.0%) | 6 (4.2%) |
| 75 Years and over | 30 (51.7%) | 0 (0.0%) |
Technology Access in Beverly
Computing Device Access in Beverly
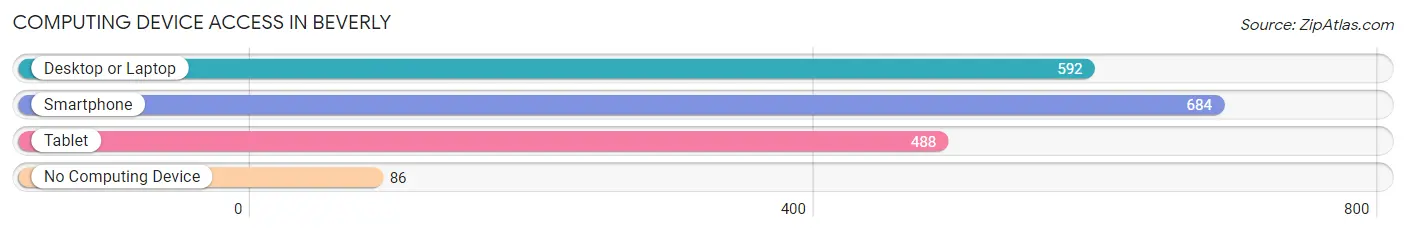
| Device Type | # Households | % Households |
| Desktop or Laptop | 592 | 71.1% |
| Smartphone | 684 | 82.1% |
| Tablet | 488 | 58.6% |
| No Computing Device | 86 | 10.3% |
| Total | 833 | 100.0% |
Internet Access in Beverly
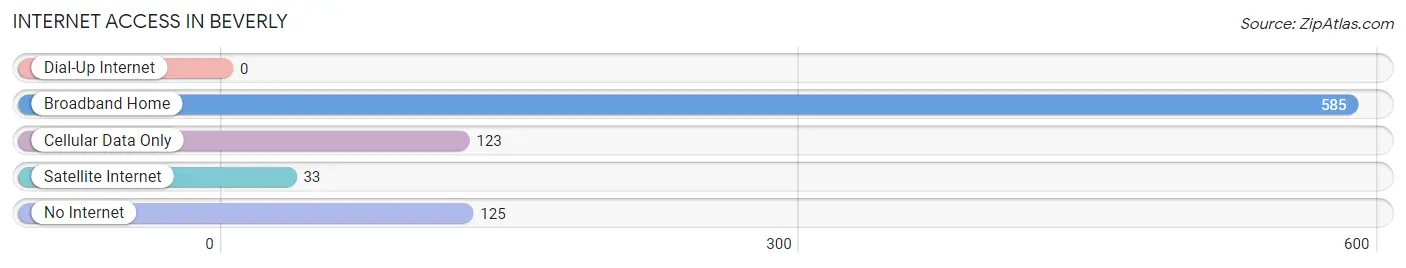
| Internet Type | # Households | % Households |
| Dial-Up Internet | 0 | 0.0% |
| Broadband Home | 585 | 70.2% |
| Cellular Data Only | 123 | 14.8% |
| Satellite Internet | 33 | 4.0% |
| No Internet | 125 | 15.0% |
| Total | 833 | 100.0% |
Beverly Summary
Beverly, NJ is a small city located in Burlington County, New Jersey. It is situated on the Delaware River, just north of Philadelphia. The city has a population of approximately 7,000 people and is part of the larger Philadelphia metropolitan area.
History
Beverly was first settled in 1677 by English Quakers, who named the area after the English town of Beverley. The area was originally part of Burlington Township, but was incorporated as a separate borough in 1875. The city was named after the English town of Beverley, which was the birthplace of the first settler, Thomas Gardiner.
In the late 19th century, Beverly became a popular summer resort for wealthy Philadelphians. The city was home to several large hotels, including the Beverly Hotel, which was built in 1876 and was one of the largest hotels in the area. The city also had a thriving fishing industry, with several fish canneries located along the Delaware River.
In the early 20th century, Beverly experienced a period of growth and development. The city was home to several factories, including a glassworks, a paper mill, and a brickyard. The city also had a thriving commercial district, with several stores and businesses located along Broad Street.
Geography
Beverly is located in Burlington County, New Jersey, on the Delaware River. The city is situated on the eastern side of the river, just north of Philadelphia. The city covers an area of 1.3 square miles and has a population of approximately 7,000 people.
The city is bordered by the towns of Edgewater Park, Delanco, and Willingboro. The city is also located near the New Jersey Turnpike and Interstate 295.
Economy
Beverly has a diverse economy, with several industries located in the city. The city is home to several manufacturing companies, including a glassworks, a paper mill, and a brickyard. The city also has a thriving commercial district, with several stores and businesses located along Broad Street.
The city is also home to several educational institutions, including the Burlington County Institute of Technology and the Burlington County College. The city is also home to several healthcare facilities, including the Lourdes Medical Center of Burlington County.
Demographics
As of the 2010 census, the population of Beverly was 7,000 people. The racial makeup of the city was 79.3% White, 14.2% African American, 0.3% Native American, 1.2% Asian, and 4.9% from other races. The median household income was $50,000, and the median family income was $60,000.
The city has a large Hispanic population, with approximately 25% of the population identifying as Hispanic or Latino. The city also has a large Italian-American population, with approximately 15% of the population identifying as Italian-American.
Conclusion
Beverly, NJ is a small city located in Burlington County, New Jersey. It is situated on the Delaware River, just north of Philadelphia. The city has a population of approximately 7,000 people and is part of the larger Philadelphia metropolitan area. The city has a diverse economy, with several industries located in the city. The city is also home to several educational institutions, healthcare facilities, and a thriving commercial district. The city has a large Hispanic and Italian-American population.
Common Questions
What is Per Capita Income in Beverly?
Per Capita income in Beverly is $34,955.
What is the Median Family Income in Beverly?
Median Family Income in Beverly is $100,000.
What is the Median Household income in Beverly?
Median Household Income in Beverly is $90,069.
What is Income or Wage Gap in Beverly?
Income or Wage Gap in Beverly is 26.8%.
Women in Beverly earn 73.2 cents for every dollar earned by a man.
What is Family Income Deficit in Beverly?
Family Income Deficit in Beverly is $12,291.
Families that are below poverty line in Beverly earn $12,291 less on average than the poverty threshold level.
What is Inequality or Gini Index in Beverly?
Inequality or Gini Index in Beverly is 0.39.
What is the Total Population of Beverly?
Total Population of Beverly is 2,502.
What is the Total Male Population of Beverly?
Total Male Population of Beverly is 1,146.
What is the Total Female Population of Beverly?
Total Female Population of Beverly is 1,356.
What is the Ratio of Males per 100 Females in Beverly?
There are 84.51 Males per 100 Females in Beverly.
What is the Ratio of Females per 100 Males in Beverly?
There are 118.32 Females per 100 Males in Beverly.
What is the Median Population Age in Beverly?
Median Population Age in Beverly is 41.5 Years.
What is the Average Family Size in Beverly
Average Family Size in Beverly is 3.3 People.
What is the Average Household Size in Beverly
Average Household Size in Beverly is 3.0 People.
How Large is the Labor Force in Beverly?
There are 1,233 People in the Labor Forcein in Beverly.
What is the Percentage of People in the Labor Force in Beverly?
59.0% of People are in the Labor Force in Beverly.
What is the Unemployment Rate in Beverly?
Unemployment Rate in Beverly is 7.7%.