Port Norris, NJ Map & Demographics
Port Norris Map
Port Norris Overview
$39,461
PER CAPITA INCOME
$44,091
AVG HOUSEHOLD INCOME
50.2%
WAGE / INCOME GAP [ % ]
49.8¢/ $1
WAGE / INCOME GAP [ $ ]
0.61
INEQUALITY / GINI INDEX
1,711
TOTAL POPULATION
853
MALE POPULATION
858
FEMALE POPULATION
99.42
MALES / 100 FEMALES
100.59
FEMALES / 100 MALES
31.6
MEDIAN AGE
3.5
AVG FAMILY SIZE
2.9
AVG HOUSEHOLD SIZE
798
LABOR FORCE [ PEOPLE ]
62.6%
PERCENT IN LABOR FORCE
6.9%
UNEMPLOYMENT RATE
Port Norris Zip Codes
Port Norris Area Codes
Income in Port Norris
Income Overview in Port Norris
| Characteristic | Number | Measure |
| Per Capita Income | 1,711 | $39,461 |
| Median Family Income | 405 | $0 |
| Mean Family Income | 405 | $57,836 |
| Median Household Income | 592 | $44,091 |
| Mean Household Income | 592 | $89,790 |
| Income Deficit | 405 | $0 |
| Wage / Income Gap (%) | 1,711 | 50.19% |
| Wage / Income Gap ($) | 1,711 | 49.81¢ per $1 |
| Gini / Inequality Index | 1,711 | 0.61 |
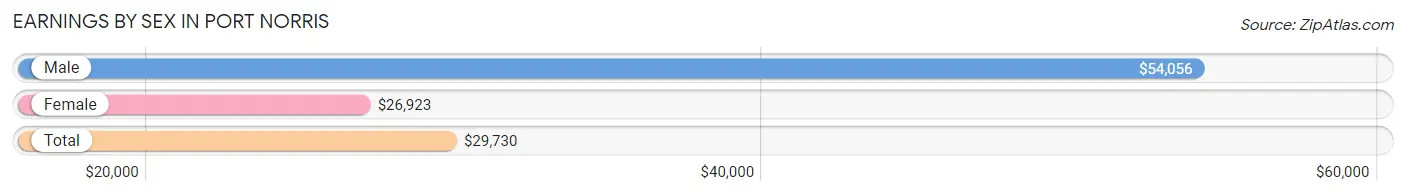
Earnings by Sex in Port Norris
Average Earnings in Port Norris are $29,730, $54,056 for men and $26,923 for women, a difference of 50.2%.
| Sex | Number | Average Earnings |
| Male | 374 (47.9%) | $54,056 |
| Female | 406 (52.0%) | $26,923 |
| Total | 780 (100.0%) | $29,730 |
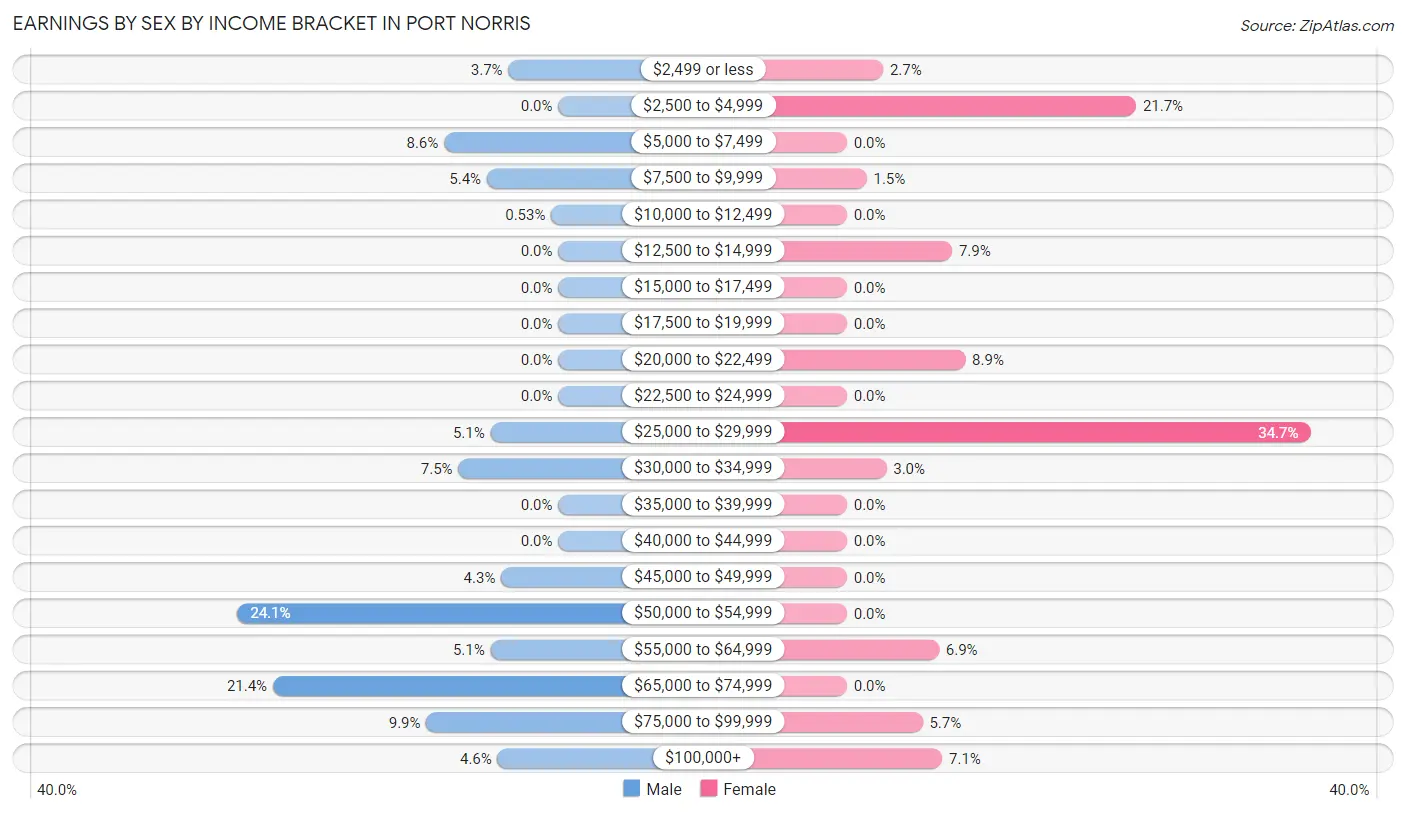
Earnings by Sex by Income Bracket in Port Norris
The most common earnings brackets in Port Norris are $50,000 to $54,999 for men (90 | 24.1%) and $25,000 to $29,999 for women (141 | 34.7%).
| Income | Male | Female |
| $2,499 or less | 14 (3.7%) | 11 (2.7%) |
| $2,500 to $4,999 | 0 (0.0%) | 88 (21.7%) |
| $5,000 to $7,499 | 32 (8.6%) | 0 (0.0%) |
| $7,500 to $9,999 | 20 (5.3%) | 6 (1.5%) |
| $10,000 to $12,499 | 2 (0.5%) | 0 (0.0%) |
| $12,500 to $14,999 | 0 (0.0%) | 32 (7.9%) |
| $15,000 to $17,499 | 0 (0.0%) | 0 (0.0%) |
| $17,500 to $19,999 | 0 (0.0%) | 0 (0.0%) |
| $20,000 to $22,499 | 0 (0.0%) | 36 (8.9%) |
| $22,500 to $24,999 | 0 (0.0%) | 0 (0.0%) |
| $25,000 to $29,999 | 19 (5.1%) | 141 (34.7%) |
| $30,000 to $34,999 | 28 (7.5%) | 12 (3.0%) |
| $35,000 to $39,999 | 0 (0.0%) | 0 (0.0%) |
| $40,000 to $44,999 | 0 (0.0%) | 0 (0.0%) |
| $45,000 to $49,999 | 16 (4.3%) | 0 (0.0%) |
| $50,000 to $54,999 | 90 (24.1%) | 0 (0.0%) |
| $55,000 to $64,999 | 19 (5.1%) | 28 (6.9%) |
| $65,000 to $74,999 | 80 (21.4%) | 0 (0.0%) |
| $75,000 to $99,999 | 37 (9.9%) | 23 (5.7%) |
| $100,000+ | 17 (4.5%) | 29 (7.1%) |
| Total | 374 (100.0%) | 406 (100.0%) |
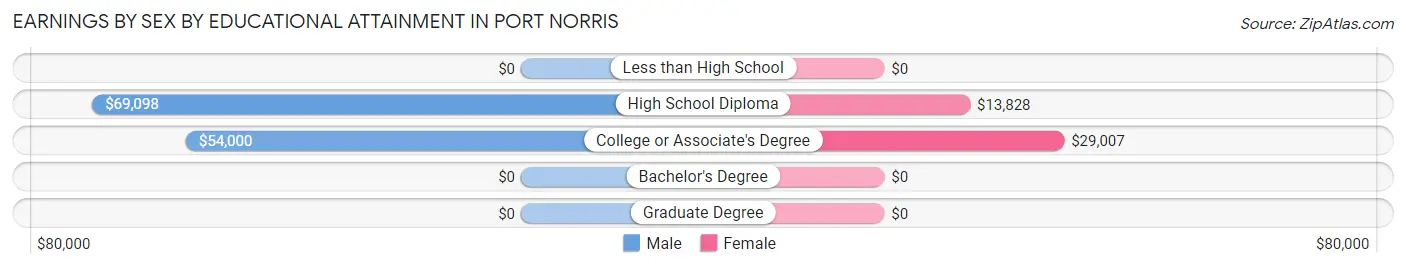
Earnings by Sex by Educational Attainment in Port Norris
Average earnings in Port Norris are $54,500 for men and $28,603 for women, a difference of 47.5%. Men with an educational attainment of high school diploma enjoy the highest average annual earnings of $69,098, while those with college or associate's degree education earn the least with $54,000. Women with an educational attainment of college or associate's degree earn the most with the average annual earnings of $29,007, while those with high school diploma education have the smallest earnings of $13,828.
| Educational Attainment | Male Income | Female Income |
| Less than High School | - | - |
| High School Diploma | $69,098 | $13,828 |
| College or Associate's Degree | $54,000 | $29,007 |
| Bachelor's Degree | - | - |
| Graduate Degree | - | - |
| Total | $54,500 | $28,603 |
Family Income in Port Norris
Family Income Brackets in Port Norris
According to the Port Norris family income data, there are 127 families falling into the $25,000 to $34,999 income range, which is the most common income bracket and makes up 31.4% of all families.
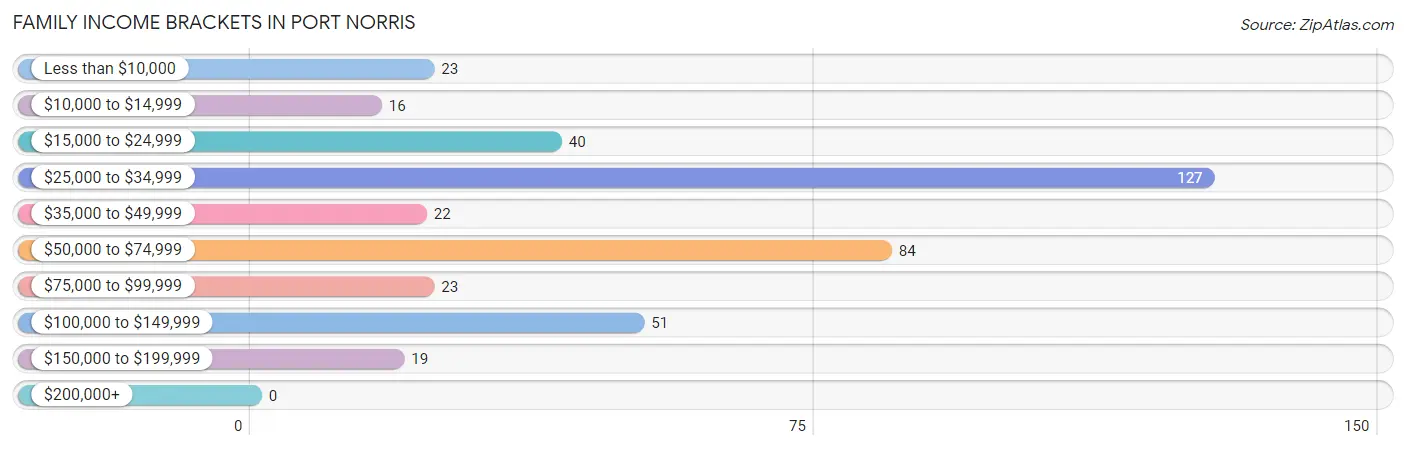
| Income Bracket | # Families | % Families |
| Less than $10,000 | 23 | 5.7% |
| $10,000 to $14,999 | 16 | 4.0% |
| $15,000 to $24,999 | 40 | 9.9% |
| $25,000 to $34,999 | 127 | 31.4% |
| $35,000 to $49,999 | 22 | 5.4% |
| $50,000 to $74,999 | 84 | 20.7% |
| $75,000 to $99,999 | 23 | 5.7% |
| $100,000 to $149,999 | 51 | 12.6% |
| $150,000 to $199,999 | 19 | 4.7% |
| $200,000+ | 0 | 0.0% |
Family Income by Famaliy Size in Port Norris
4-person families (130 | 32.1%) account for the highest median family income in Port Norris with $74,038 per family, while 2-person families (123 | 30.4%) have the highest median income of $21,676 per family member.
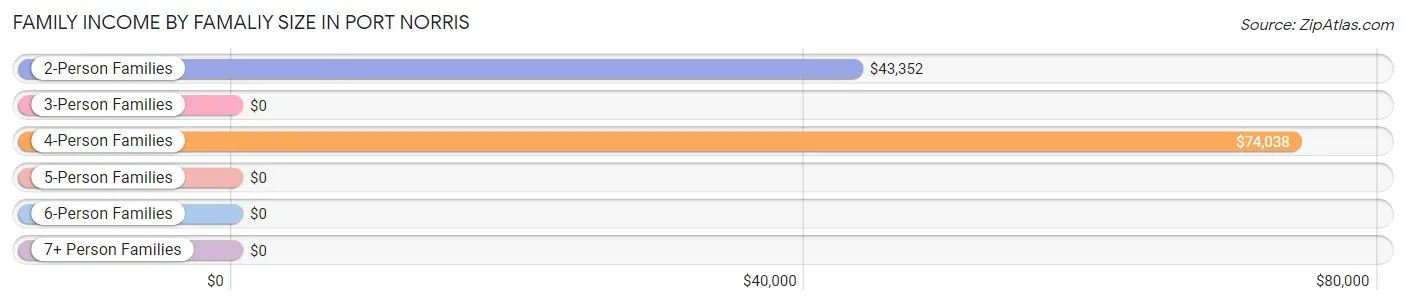
| Income Bracket | # Families | Median Income |
| 2-Person Families | 123 (30.4%) | $43,352 |
| 3-Person Families | 127 (31.4%) | $0 |
| 4-Person Families | 130 (32.1%) | $74,038 |
| 5-Person Families | 25 (6.2%) | $0 |
| 6-Person Families | 0 (0.0%) | $0 |
| 7+ Person Families | 0 (0.0%) | $0 |
| Total | 405 (100.0%) | $0 |
Family Income by Number of Earners in Port Norris
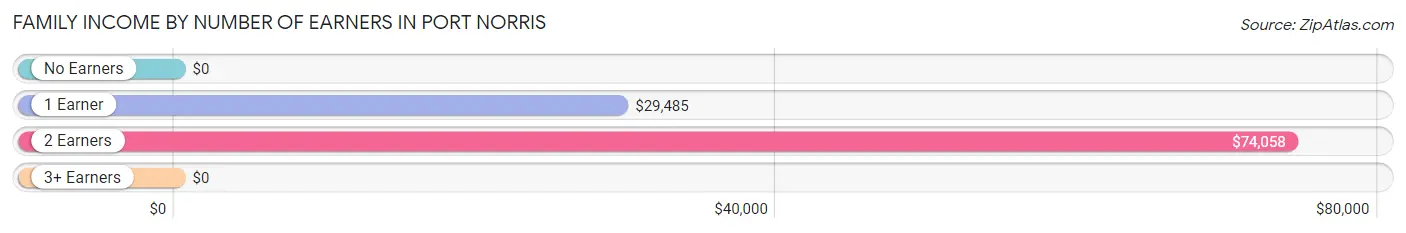
| Number of Earners | # Families | Median Income |
| No Earners | 82 (20.3%) | $0 |
| 1 Earner | 162 (40.0%) | $29,485 |
| 2 Earners | 131 (32.4%) | $74,058 |
| 3+ Earners | 30 (7.4%) | $0 |
| Total | 405 (100.0%) | $0 |
Household Income in Port Norris
Household Income Brackets in Port Norris
With 158 households falling in the category, the $50,000 to $74,999 income range is the most frequent in Port Norris, accounting for 26.7% of all households. In contrast, only 19 households (3.2%) fall into the $150,000 to $199,999 income bracket, making it the least populous group.
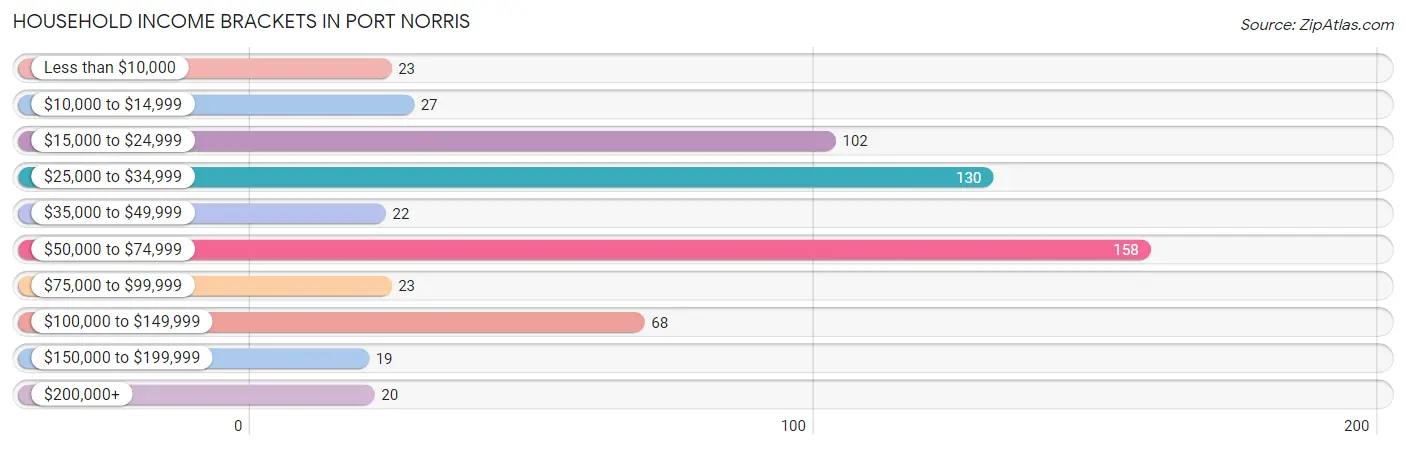
| Income Bracket | # Households | % Households |
| Less than $10,000 | 23 | 3.9% |
| $10,000 to $14,999 | 27 | 4.6% |
| $15,000 to $24,999 | 102 | 17.2% |
| $25,000 to $34,999 | 130 | 22.0% |
| $35,000 to $49,999 | 22 | 3.7% |
| $50,000 to $74,999 | 158 | 26.7% |
| $75,000 to $99,999 | 23 | 3.9% |
| $100,000 to $149,999 | 68 | 11.5% |
| $150,000 to $199,999 | 19 | 3.2% |
| $200,000+ | 20 | 3.4% |
Household Income by Householder Age in Port Norris
The median household income in Port Norris is $44,091, with the highest median household income of $58,917 found in the 45 to 64 years age bracket for the primary householder. A total of 210 households (35.5%) fall into this category.
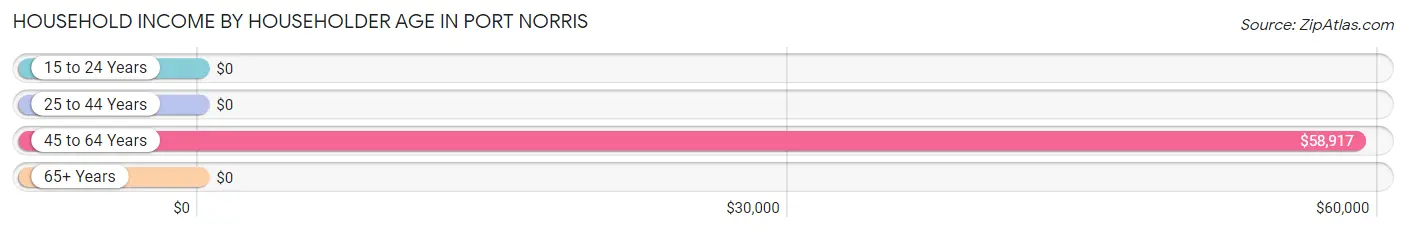
| Income Bracket | # Households | Median Income |
| 15 to 24 Years | 0 (0.0%) | $0 |
| 25 to 44 Years | 259 (43.8%) | $0 |
| 45 to 64 Years | 210 (35.5%) | $58,917 |
| 65+ Years | 123 (20.8%) | $0 |
| Total | 592 (100.0%) | $44,091 |
Poverty in Port Norris
Income Below Poverty by Sex and Age in Port Norris
With 15.6% poverty level for males and 17.0% for females among the residents of Port Norris, 55 to 64 year old males and 6 to 11 year old females are the most vulnerable to poverty, with 37 males (60.7%) and 54 females (100.0%) in their respective age groups living below the poverty level.
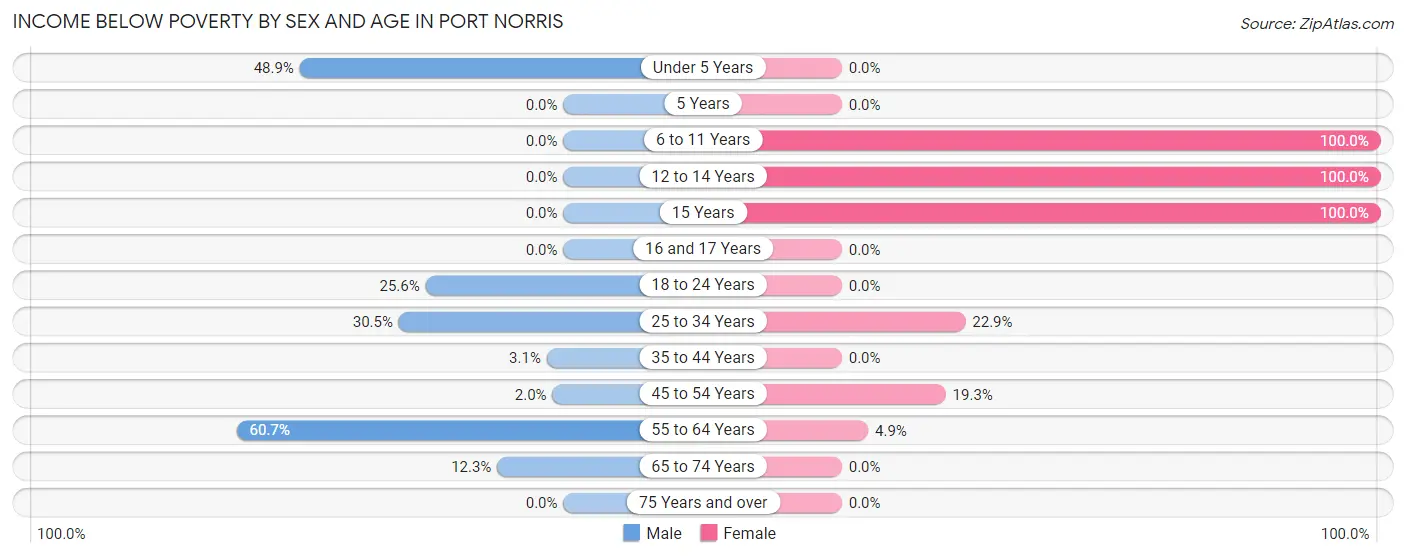
| Age Bracket | Male | Female |
| Under 5 Years | 23 (48.9%) | 0 (0.0%) |
| 5 Years | 0 (0.0%) | 0 (0.0%) |
| 6 to 11 Years | 0 (0.0%) | 54 (100.0%) |
| 12 to 14 Years | 0 (0.0%) | 27 (100.0%) |
| 15 Years | 0 (0.0%) | 20 (100.0%) |
| 16 and 17 Years | 0 (0.0%) | 0 (0.0%) |
| 18 to 24 Years | 11 (25.6%) | 0 (0.0%) |
| 25 to 34 Years | 51 (30.5%) | 25 (22.9%) |
| 35 to 44 Years | 2 (3.1%) | 0 (0.0%) |
| 45 to 54 Years | 2 (2.0%) | 16 (19.3%) |
| 55 to 64 Years | 37 (60.7%) | 4 (4.9%) |
| 65 to 74 Years | 7 (12.3%) | 0 (0.0%) |
| 75 Years and over | 0 (0.0%) | 0 (0.0%) |
| Total | 133 (15.6%) | 146 (17.0%) |
Income Above Poverty by Sex and Age in Port Norris
According to the poverty statistics in Port Norris, males aged 5 years and females aged under 5 years are the age groups that are most secure financially, with 100.0% of males and 100.0% of females in these age groups living above the poverty line.
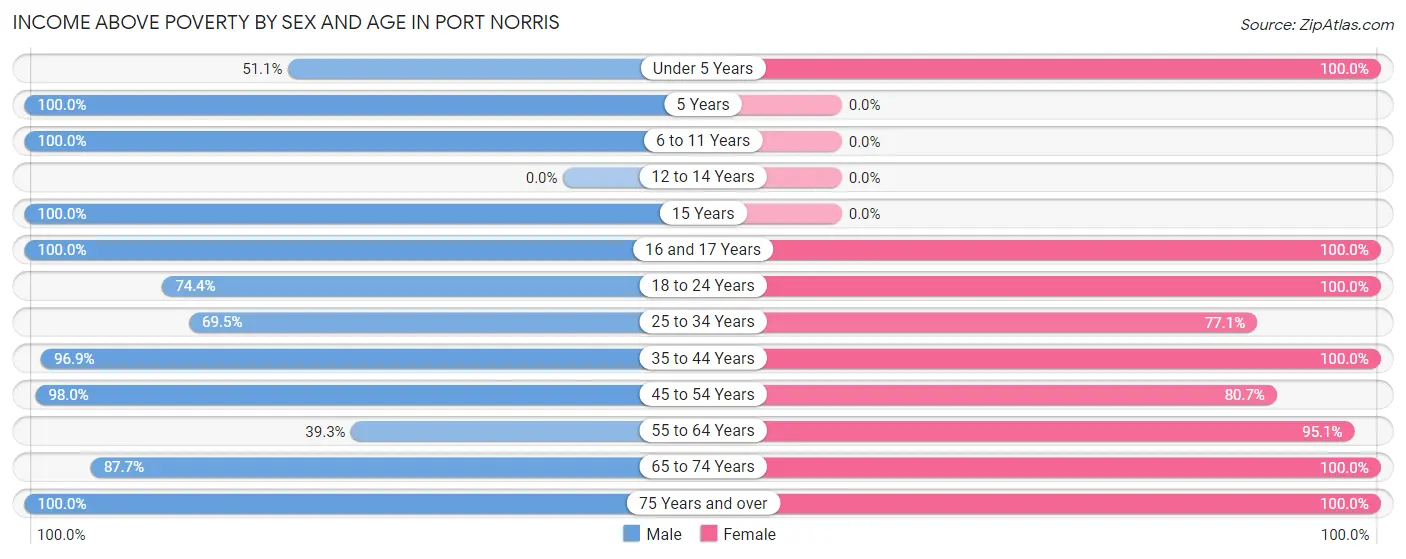
| Age Bracket | Male | Female |
| Under 5 Years | 24 (51.1%) | 54 (100.0%) |
| 5 Years | 24 (100.0%) | 0 (0.0%) |
| 6 to 11 Years | 101 (100.0%) | 0 (0.0%) |
| 12 to 14 Years | 0 (0.0%) | 0 (0.0%) |
| 15 Years | 110 (100.0%) | 0 (0.0%) |
| 16 and 17 Years | 9 (100.0%) | 83 (100.0%) |
| 18 to 24 Years | 32 (74.4%) | 108 (100.0%) |
| 25 to 34 Years | 116 (69.5%) | 84 (77.1%) |
| 35 to 44 Years | 63 (96.9%) | 177 (100.0%) |
| 45 to 54 Years | 97 (98.0%) | 67 (80.7%) |
| 55 to 64 Years | 24 (39.3%) | 78 (95.1%) |
| 65 to 74 Years | 50 (87.7%) | 32 (100.0%) |
| 75 Years and over | 70 (100.0%) | 29 (100.0%) |
| Total | 720 (84.4%) | 712 (83.0%) |
Income Below Poverty Among Married-Couple Families in Port Norris
The poverty statistics for married-couple families in Port Norris show that 2.3% or 4 of the total 177 families live below the poverty line. Families with no children have the highest poverty rate of 5.1%, comprising of 4 families. On the other hand, families with 1 or 2 children have the lowest poverty rate of 0.0%, which includes 0 families.
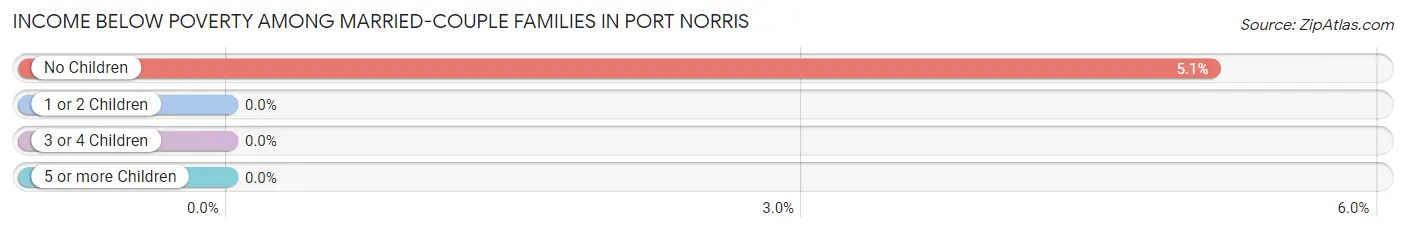
| Children | Above Poverty | Below Poverty |
| No Children | 74 (94.9%) | 4 (5.1%) |
| 1 or 2 Children | 99 (100.0%) | 0 (0.0%) |
| 3 or 4 Children | 0 (0.0%) | 0 (0.0%) |
| 5 or more Children | 0 (0.0%) | 0 (0.0%) |
| Total | 173 (97.7%) | 4 (2.3%) |
Income Below Poverty Among Single-Parent Households in Port Norris
According to the poverty data in Port Norris, 46.3% or 19 single-father households and 21.9% or 41 single-mother households are living below the poverty line. Among single-father households, those with 1 or 2 children have the highest poverty rate, with 19 households (100.0%) experiencing poverty. Likewise, among single-mother households, those with 3 or 4 children have the highest poverty rate, with 25 households (100.0%) falling below the poverty line.
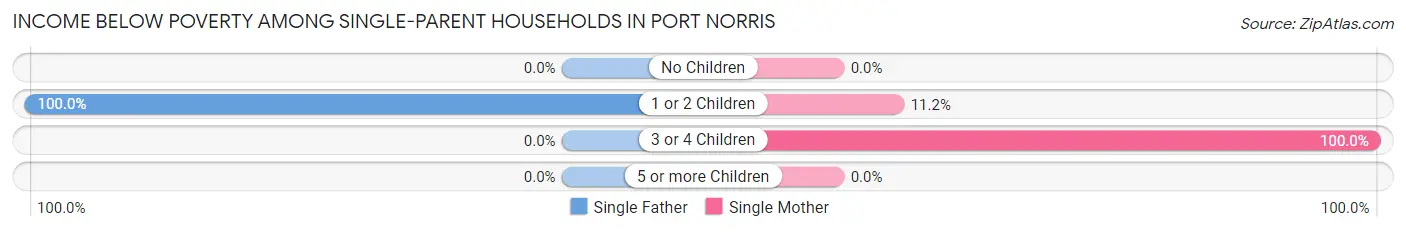
| Children | Single Father | Single Mother |
| No Children | 0 (0.0%) | 0 (0.0%) |
| 1 or 2 Children | 19 (100.0%) | 16 (11.2%) |
| 3 or 4 Children | 0 (0.0%) | 25 (100.0%) |
| 5 or more Children | 0 (0.0%) | 0 (0.0%) |
| Total | 19 (46.3%) | 41 (21.9%) |
Income Below Poverty Among Married-Couple vs Single-Parent Households in Port Norris
The poverty data for Port Norris shows that 4 of the married-couple family households (2.3%) and 60 of the single-parent households (26.3%) are living below the poverty level. Within the married-couple family households, those with no children have the highest poverty rate, with 4 households (5.1%) falling below the poverty line. Among the single-parent households, those with 3 or 4 children have the highest poverty rate, with 25 household (100.0%) living below poverty.
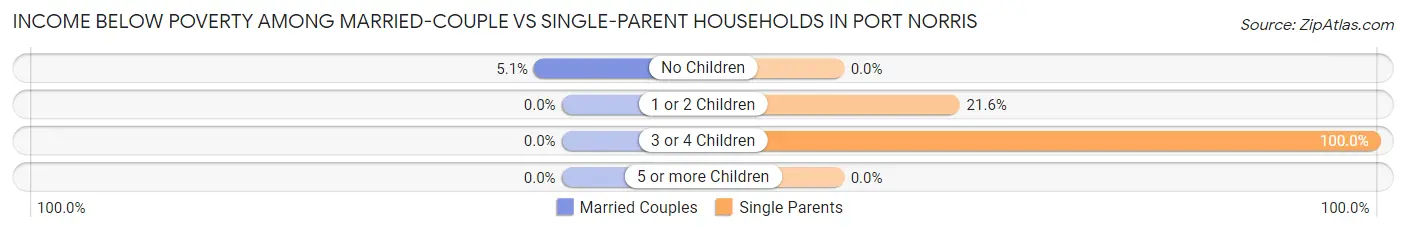
| Children | Married-Couple Families | Single-Parent Households |
| No Children | 4 (5.1%) | 0 (0.0%) |
| 1 or 2 Children | 0 (0.0%) | 35 (21.6%) |
| 3 or 4 Children | 0 (0.0%) | 25 (100.0%) |
| 5 or more Children | 0 (0.0%) | 0 (0.0%) |
| Total | 4 (2.3%) | 60 (26.3%) |
Race in Port Norris
The most populous races in Port Norris are White / Caucasian (1,116 | 65.2%), Black / African American (456 | 26.7%), and Hispanic or Latino (169 | 9.9%).
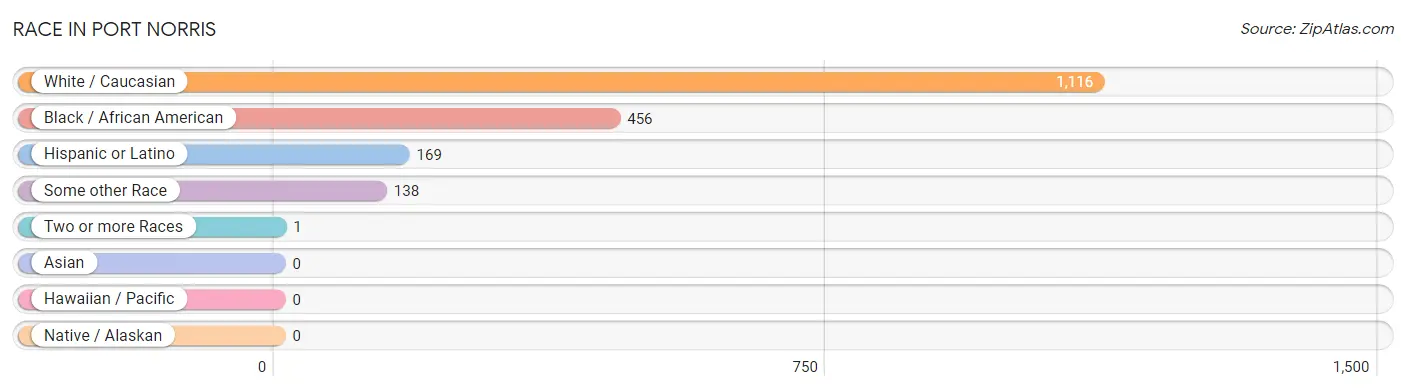
| Race | # Population | % Population |
| Asian | 0 | 0.0% |
| Black / African American | 456 | 26.7% |
| Hawaiian / Pacific | 0 | 0.0% |
| Hispanic or Latino | 169 | 9.9% |
| Native / Alaskan | 0 | 0.0% |
| White / Caucasian | 1,116 | 65.2% |
| Two or more Races | 1 | 0.1% |
| Some other Race | 138 | 8.1% |
| Total | 1,711 | 100.0% |
Ancestry in Port Norris
The most populous ancestries reported in Port Norris are German (297 | 17.4%), Scottish (273 | 16.0%), Italian (189 | 11.1%), Irish (120 | 7.0%), and Cuban (86 | 5.0%), together accounting for 56.4% of all Port Norris residents.
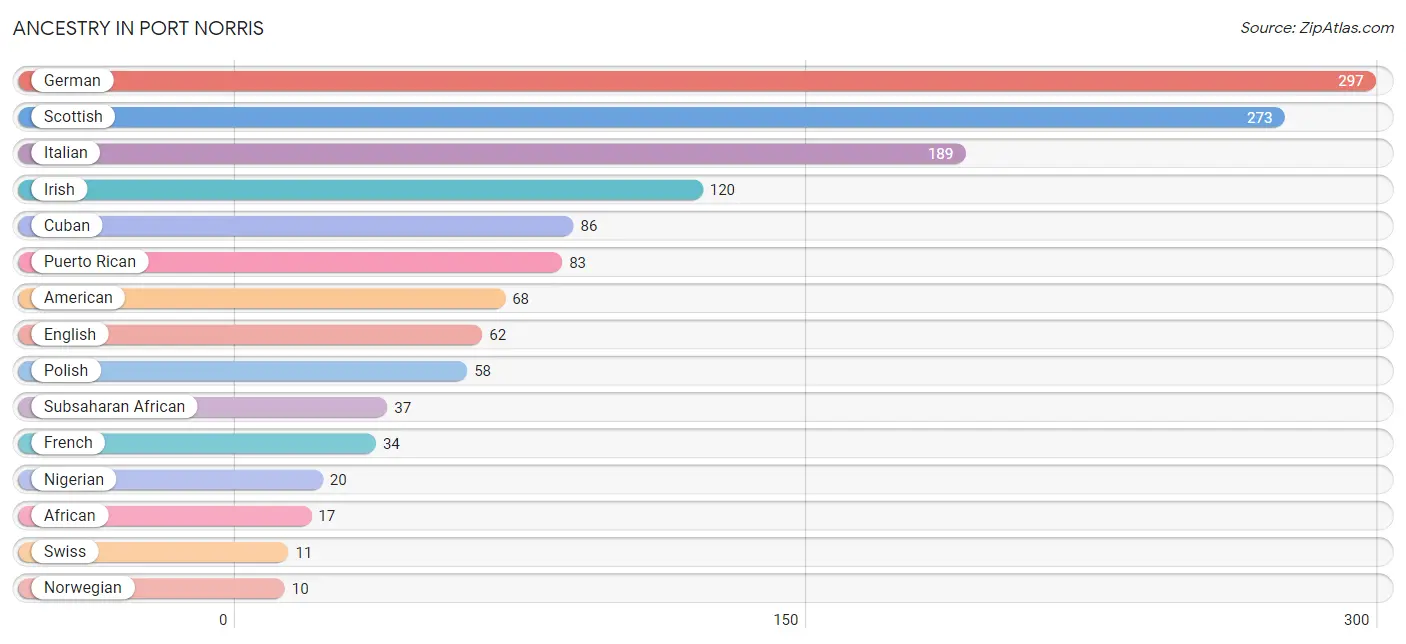
| Ancestry | # Population | % Population |
| African | 17 | 1.0% |
| American | 68 | 4.0% |
| Cuban | 86 | 5.0% |
| English | 62 | 3.6% |
| French | 34 | 2.0% |
| German | 297 | 17.4% |
| Irish | 120 | 7.0% |
| Italian | 189 | 11.1% |
| Nigerian | 20 | 1.2% |
| Norwegian | 10 | 0.6% |
| Polish | 58 | 3.4% |
| Puerto Rican | 83 | 4.9% |
| Scottish | 273 | 16.0% |
| Subsaharan African | 37 | 2.2% |
| Swedish | 6 | 0.4% |
| Swiss | 11 | 0.6% | View All 16 Rows |
Immigrants in Port Norris
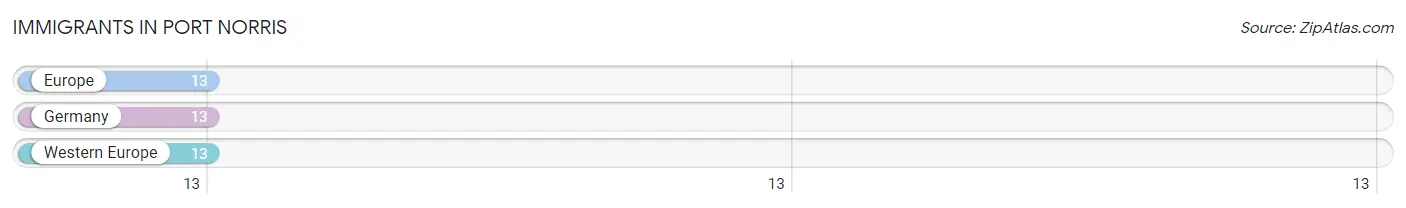
The most numerous immigrant groups reported in Port Norris came from Europe (13 | 0.8%), Germany (13 | 0.8%), and Western Europe (13 | 0.8%), together accounting for 2.3% of all Port Norris residents.
| Immigration Origin | # Population | % Population |
| Europe | 13 | 0.8% |
| Germany | 13 | 0.8% |
| Western Europe | 13 | 0.8% | View All 3 Rows |
Sex and Age in Port Norris
Sex and Age in Port Norris
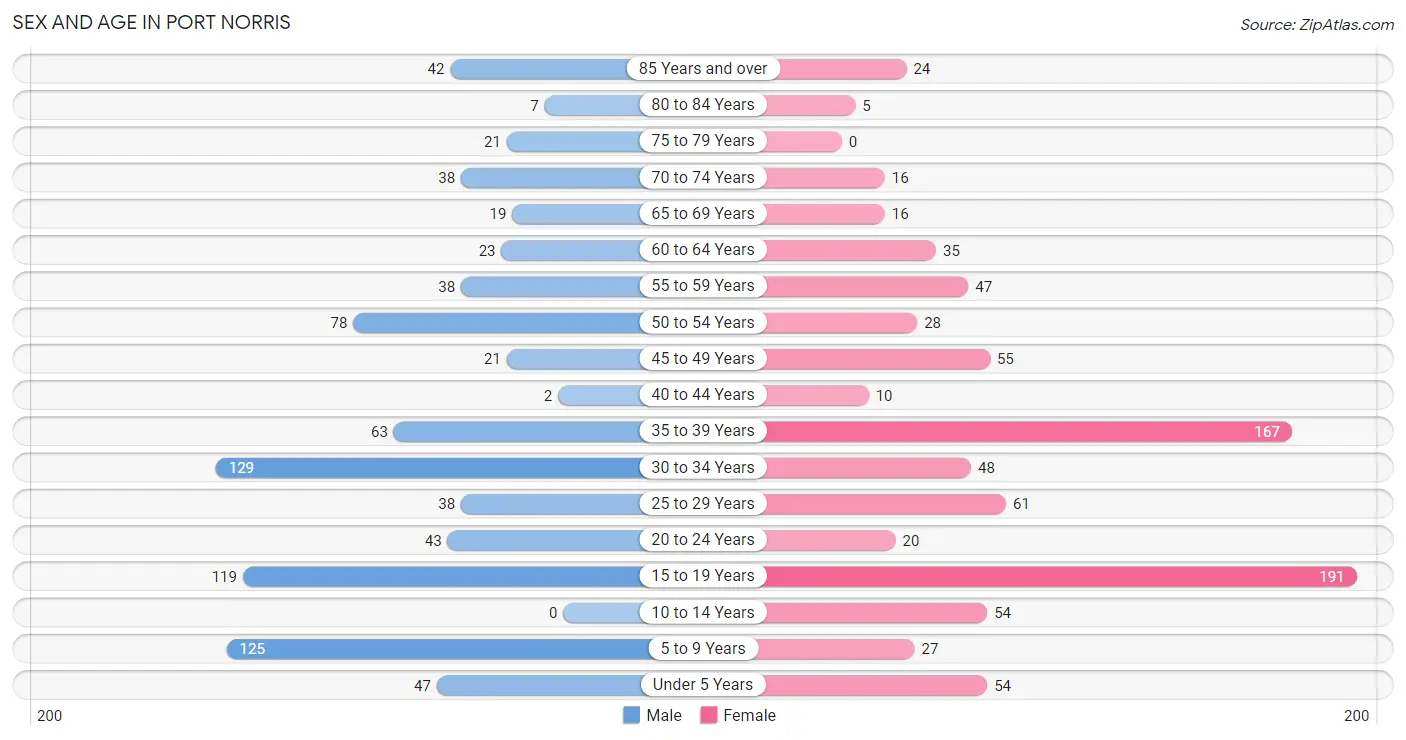
The most populous age groups in Port Norris are 30 to 34 Years (129 | 15.1%) for men and 15 to 19 Years (191 | 22.3%) for women.
| Age Bracket | Male | Female |
| Under 5 Years | 47 (5.5%) | 54 (6.3%) |
| 5 to 9 Years | 125 (14.6%) | 27 (3.2%) |
| 10 to 14 Years | 0 (0.0%) | 54 (6.3%) |
| 15 to 19 Years | 119 (14.0%) | 191 (22.3%) |
| 20 to 24 Years | 43 (5.0%) | 20 (2.3%) |
| 25 to 29 Years | 38 (4.4%) | 61 (7.1%) |
| 30 to 34 Years | 129 (15.1%) | 48 (5.6%) |
| 35 to 39 Years | 63 (7.4%) | 167 (19.5%) |
| 40 to 44 Years | 2 (0.2%) | 10 (1.2%) |
| 45 to 49 Years | 21 (2.5%) | 55 (6.4%) |
| 50 to 54 Years | 78 (9.1%) | 28 (3.3%) |
| 55 to 59 Years | 38 (4.4%) | 47 (5.5%) |
| 60 to 64 Years | 23 (2.7%) | 35 (4.1%) |
| 65 to 69 Years | 19 (2.2%) | 16 (1.9%) |
| 70 to 74 Years | 38 (4.4%) | 16 (1.9%) |
| 75 to 79 Years | 21 (2.5%) | 0 (0.0%) |
| 80 to 84 Years | 7 (0.8%) | 5 (0.6%) |
| 85 Years and over | 42 (4.9%) | 24 (2.8%) |
| Total | 853 (100.0%) | 858 (100.0%) |
Families and Households in Port Norris
Median Family Size in Port Norris
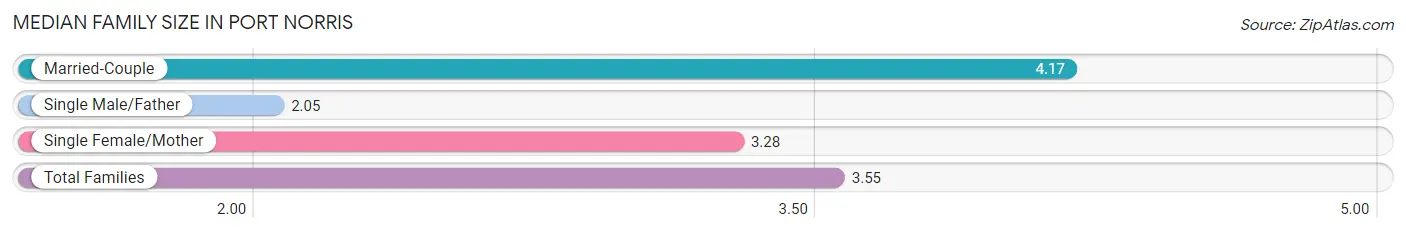
The median family size in Port Norris is 3.55 persons per family, with married-couple families (177 | 43.7%) accounting for the largest median family size of 4.17 persons per family. On the other hand, single male/father families (41 | 10.1%) represent the smallest median family size with 2.05 persons per family.
| Family Type | # Families | Family Size |
| Married-Couple | 177 (43.7%) | 4.17 |
| Single Male/Father | 41 (10.1%) | 2.05 |
| Single Female/Mother | 187 (46.2%) | 3.28 |
| Total Families | 405 (100.0%) | 3.55 |
Median Household Size in Port Norris
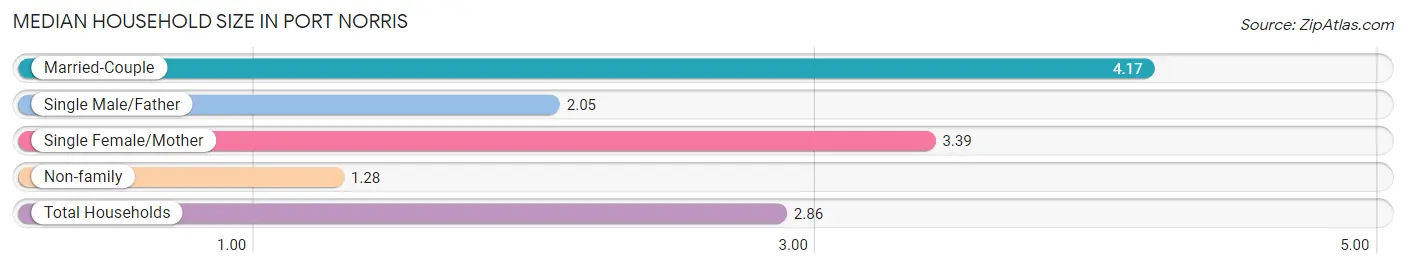
The median household size in Port Norris is 2.86 persons per household, with married-couple households (177 | 29.9%) accounting for the largest median household size of 4.17 persons per household. non-family households (187 | 31.6%) represent the smallest median household size with 1.28 persons per household.
| Household Type | # Households | Household Size |
| Married-Couple | 177 (29.9%) | 4.17 |
| Single Male/Father | 41 (6.9%) | 2.05 |
| Single Female/Mother | 187 (31.6%) | 3.39 |
| Non-family | 187 (31.6%) | 1.28 |
| Total Households | 592 (100.0%) | 2.86 |
Household Size by Marriage Status in Port Norris
Out of a total of 592 households in Port Norris, 405 (68.4%) are family households, while 187 (31.6%) are nonfamily households. The most numerous type of family households are 3-person households, comprising 127, and the most common type of nonfamily households are 1-person households, comprising 152.
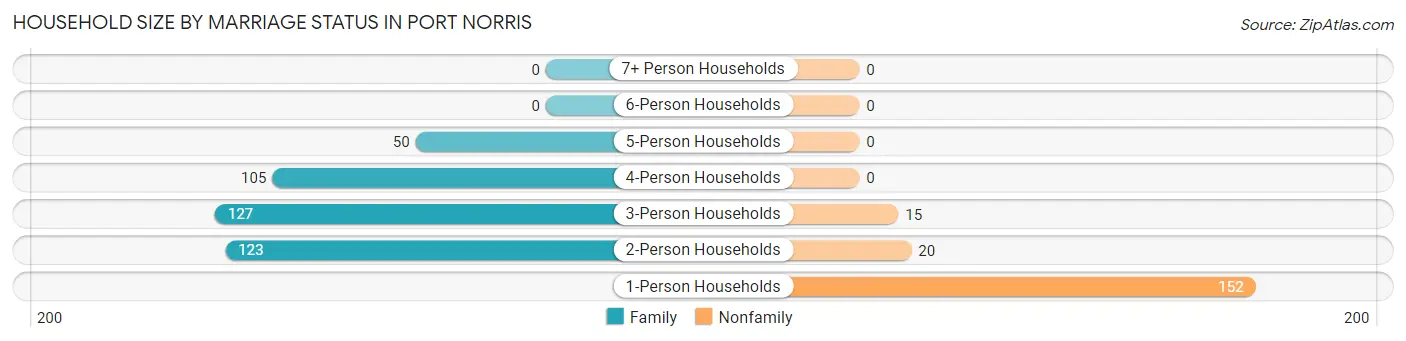
| Household Size | Family Households | Nonfamily Households |
| 1-Person Households | - | 152 (25.7%) |
| 2-Person Households | 123 (20.8%) | 20 (3.4%) |
| 3-Person Households | 127 (21.4%) | 15 (2.5%) |
| 4-Person Households | 105 (17.7%) | 0 (0.0%) |
| 5-Person Households | 50 (8.5%) | 0 (0.0%) |
| 6-Person Households | 0 (0.0%) | 0 (0.0%) |
| 7+ Person Households | 0 (0.0%) | 0 (0.0%) |
| Total | 405 (68.4%) | 187 (31.6%) |
Female Fertility in Port Norris
Fertility by Age in Port Norris
| Age Bracket | Women with Births | Births / 1,000 Women |
| 15 to 19 years | 0 (0.0%) | 0.0 |
| 20 to 34 years | 0 (0.0%) | 0.0 |
| 35 to 50 years | 0 (0.0%) | 0.0 |
| Total | 0 (0.0%) | 0.0 |
Fertility by Age by Marriage Status in Port Norris
| Age Bracket | Married | Unmarried |
| 15 to 19 years | 0 (0.0%) | 0 (0.0%) |
| 20 to 34 years | 0 (0.0%) | 0 (0.0%) |
| 35 to 50 years | 0 (0.0%) | 0 (0.0%) |
| Total | 0 (0.0%) | 0 (0.0%) |
Fertility by Education in Port Norris
| Educational Attainment | Women with Births | Births / 1,000 Women |
| Less than High School | 0 (0.0%) | 0.0 |
| High School Diploma | 0 (0.0%) | 0.0 |
| College or Associate's Degree | 0 (0.0%) | 0.0 |
| Bachelor's Degree | 0 (0.0%) | 0.0 |
| Graduate Degree | 0 (0.0%) | 0.0 |
| Total | 0 (0.0%) | 0.0 |
Fertility by Education by Marriage Status in Port Norris
| Educational Attainment | Married | Unmarried |
| Less than High School | 0 (0.0%) | 0 (0.0%) |
| High School Diploma | 0 (0.0%) | 0 (0.0%) |
| College or Associate's Degree | 0 (0.0%) | 0 (0.0%) |
| Bachelor's Degree | 0 (0.0%) | 0 (0.0%) |
| Graduate Degree | 0 (0.0%) | 0 (0.0%) |
| Total | 0 (0.0%) | 0 (0.0%) |
Employment Characteristics in Port Norris
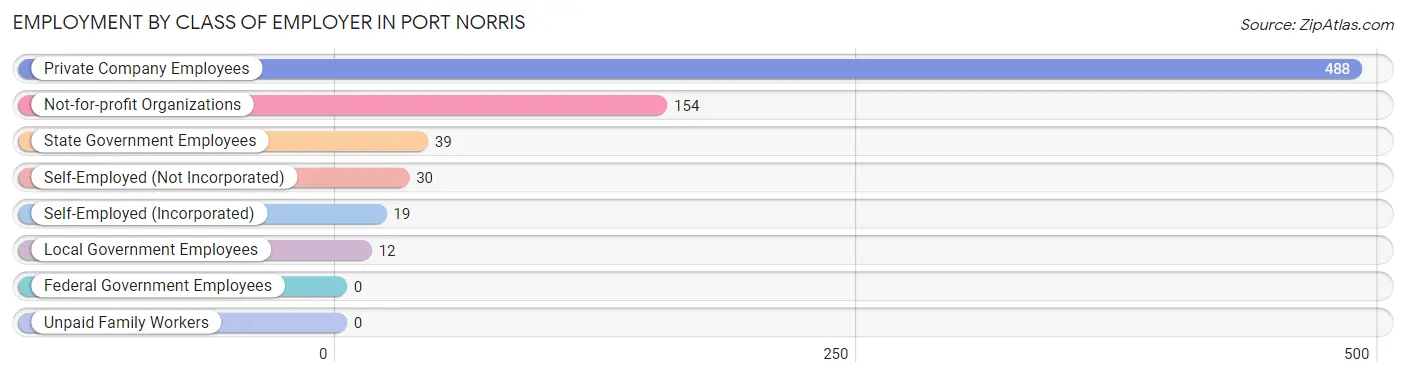
Employment by Class of Employer in Port Norris
Among the 742 employed individuals in Port Norris, private company employees (488 | 65.8%), not-for-profit organizations (154 | 20.7%), and state government employees (39 | 5.3%) make up the most common classes of employment.
| Employer Class | # Employees | % Employees |
| Private Company Employees | 488 | 65.8% |
| Self-Employed (Incorporated) | 19 | 2.6% |
| Self-Employed (Not Incorporated) | 30 | 4.0% |
| Not-for-profit Organizations | 154 | 20.7% |
| Local Government Employees | 12 | 1.6% |
| State Government Employees | 39 | 5.3% |
| Federal Government Employees | 0 | 0.0% |
| Unpaid Family Workers | 0 | 0.0% |
| Total | 742 | 100.0% |
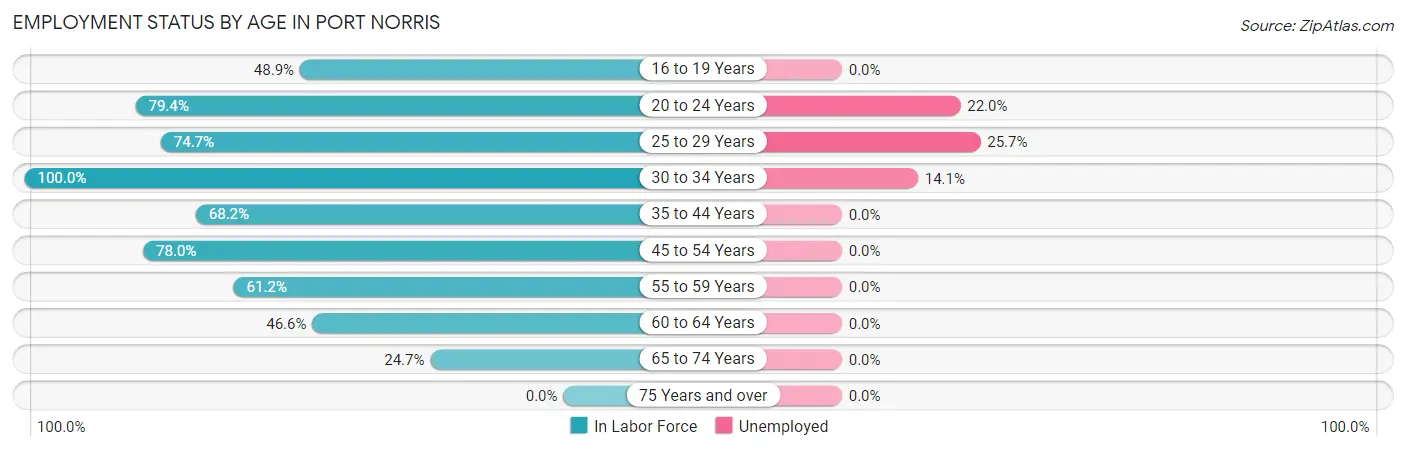
Employment Status by Age in Port Norris
According to the labor force statistics for Port Norris, out of the total population over 16 years of age (1,274), 62.6% or 798 individuals are in the labor force, with 6.9% or 55 of them unemployed. The age group with the highest labor force participation rate is 30 to 34 years, with 100.0% or 177 individuals in the labor force. Within the labor force, the 25 to 29 years age range has the highest percentage of unemployed individuals, with 25.7% or 19 of them being unemployed.
| Age Bracket | In Labor Force | Unemployed |
| 16 to 19 Years | 88 (48.9%) | 0 (0.0%) |
| 20 to 24 Years | 50 (79.4%) | 11 (22.0%) |
| 25 to 29 Years | 74 (74.7%) | 19 (25.7%) |
| 30 to 34 Years | 177 (100.0%) | 25 (14.1%) |
| 35 to 44 Years | 165 (68.2%) | 0 (0.0%) |
| 45 to 54 Years | 142 (78.0%) | 0 (0.0%) |
| 55 to 59 Years | 52 (61.2%) | 0 (0.0%) |
| 60 to 64 Years | 27 (46.6%) | 0 (0.0%) |
| 65 to 74 Years | 22 (24.7%) | 0 (0.0%) |
| 75 Years and over | 0 (0.0%) | 0 (0.0%) |
| Total | 798 (62.6%) | 55 (6.9%) |
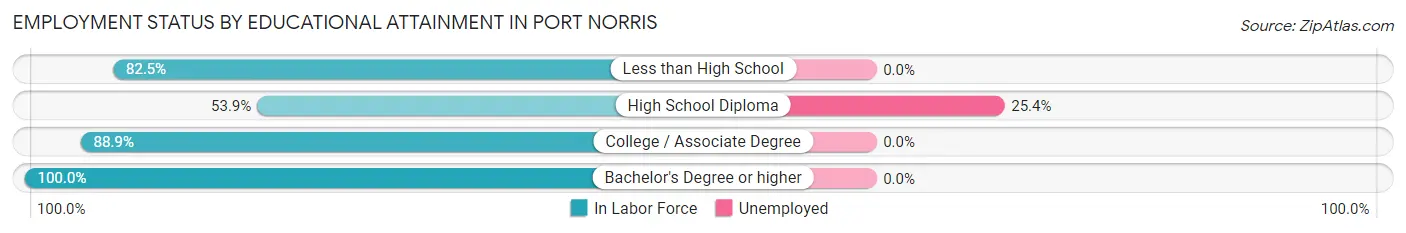
Employment Status by Educational Attainment in Port Norris
According to labor force statistics for Port Norris, 75.6% of individuals (637) out of the total population between 25 and 64 years of age (843) are in the labor force, with 6.9% or 44 of them being unemployed. The group with the highest labor force participation rate are those with the educational attainment of bachelor's degree or higher, with 100.0% or 35 individuals in the labor force. Within the labor force, individuals with high school diploma education have the highest percentage of unemployment, with 25.4% or 44 of them being unemployed.
| Educational Attainment | In Labor Force | Unemployed |
| Less than High School | 52 (82.5%) | 0 (0.0%) |
| High School Diploma | 173 (53.9%) | 82 (25.4%) |
| College / Associate Degree | 377 (88.9%) | 0 (0.0%) |
| Bachelor's Degree or higher | 35 (100.0%) | 0 (0.0%) |
| Total | 637 (75.6%) | 58 (6.9%) |
Employment Occupations by Sex in Port Norris
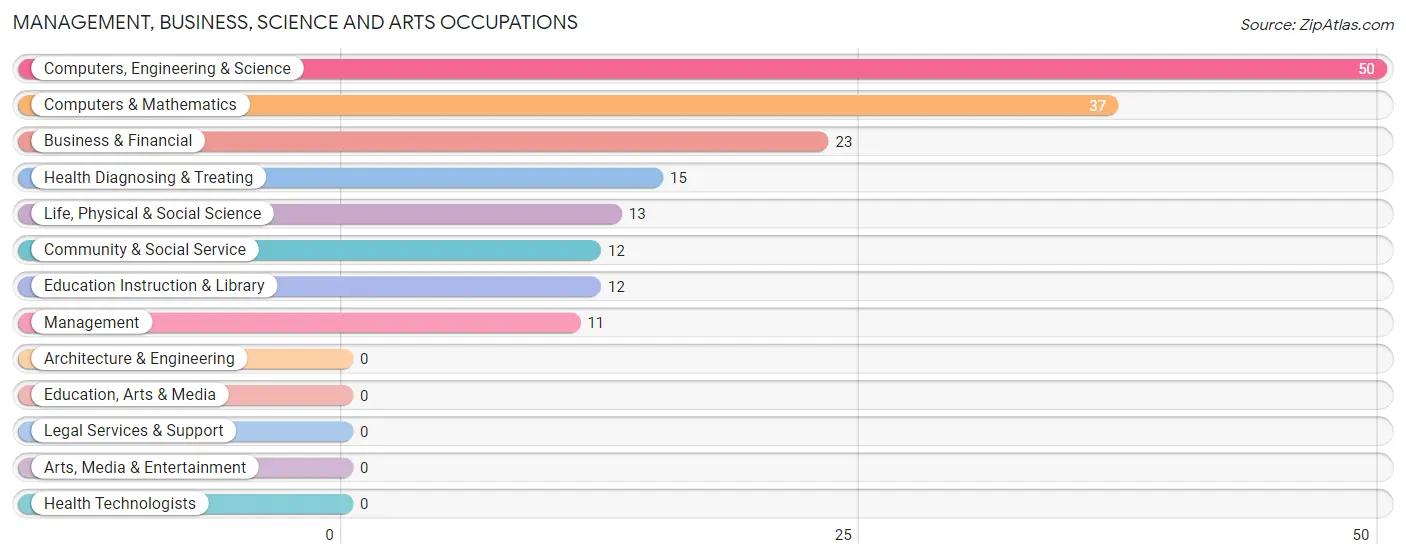
Management, Business, Science and Arts Occupations
The most common Management, Business, Science and Arts occupations in Port Norris are Computers, Engineering & Science (50 | 6.7%), Computers & Mathematics (37 | 5.0%), Business & Financial (23 | 3.1%), Health Diagnosing & Treating (15 | 2.0%), and Life, Physical & Social Science (13 | 1.8%).
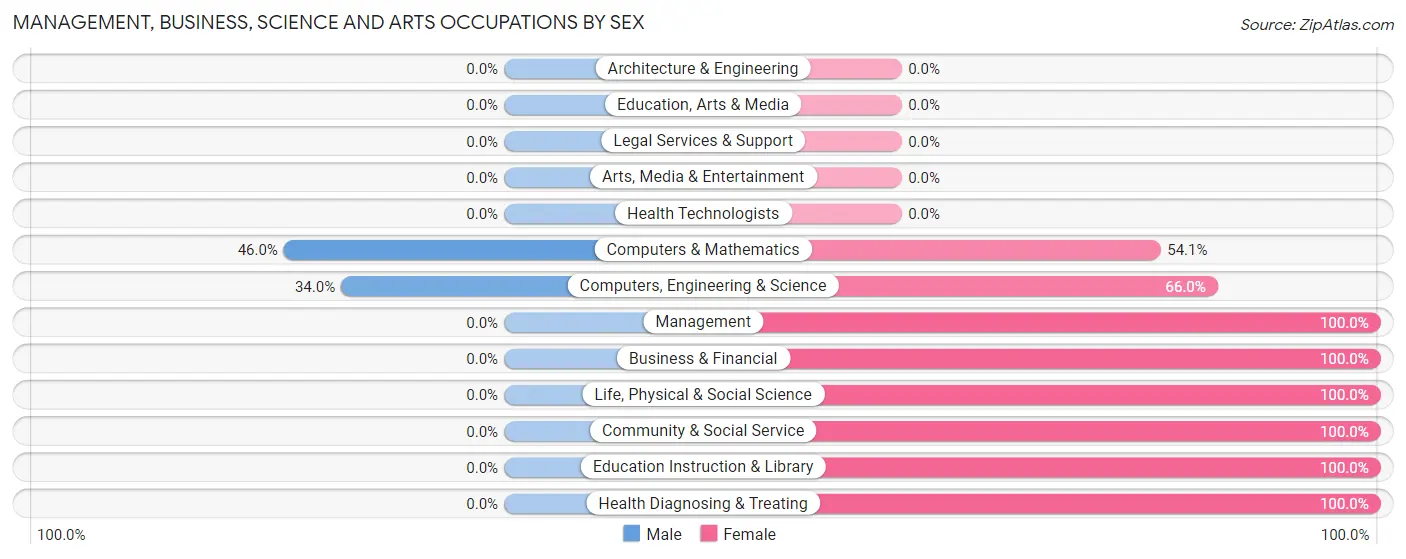
Management, Business, Science and Arts Occupations by Sex
Within the Management, Business, Science and Arts occupations in Port Norris, the most male-oriented occupations are Computers & Mathematics (46.0%), and Computers, Engineering & Science (34.0%), while the most female-oriented occupations are Management (100.0%), Business & Financial (100.0%), and Life, Physical & Social Science (100.0%).
| Occupation | Male | Female |
| Management | 0 (0.0%) | 11 (100.0%) |
| Business & Financial | 0 (0.0%) | 23 (100.0%) |
| Computers, Engineering & Science | 17 (34.0%) | 33 (66.0%) |
| Computers & Mathematics | 17 (46.0%) | 20 (54.0%) |
| Architecture & Engineering | 0 (0.0%) | 0 (0.0%) |
| Life, Physical & Social Science | 0 (0.0%) | 13 (100.0%) |
| Community & Social Service | 0 (0.0%) | 12 (100.0%) |
| Education, Arts & Media | 0 (0.0%) | 0 (0.0%) |
| Legal Services & Support | 0 (0.0%) | 0 (0.0%) |
| Education Instruction & Library | 0 (0.0%) | 12 (100.0%) |
| Arts, Media & Entertainment | 0 (0.0%) | 0 (0.0%) |
| Health Diagnosing & Treating | 0 (0.0%) | 15 (100.0%) |
| Health Technologists | 0 (0.0%) | 0 (0.0%) |
| Total (Category) | 17 (15.3%) | 94 (84.7%) |
| Total (Overall) | 361 (48.6%) | 381 (51.3%) |
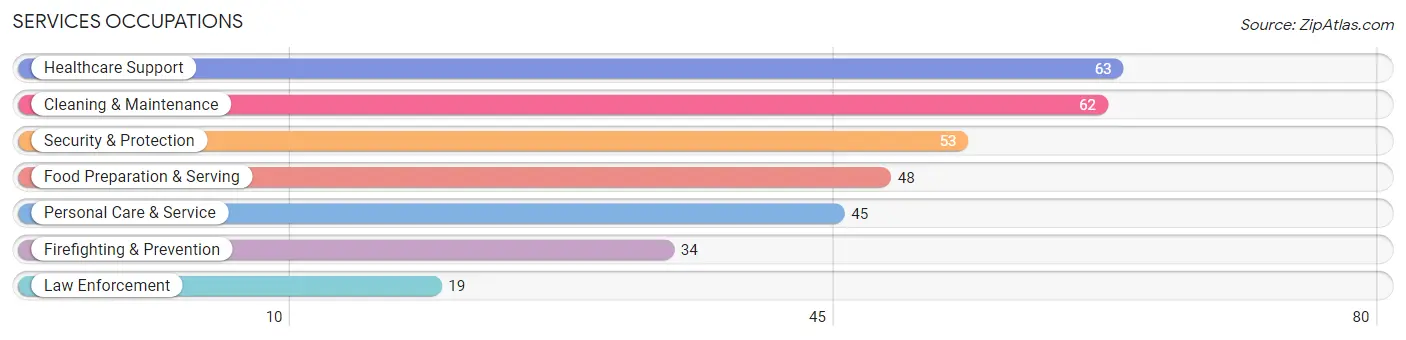
Services Occupations
The most common Services occupations in Port Norris are Healthcare Support (63 | 8.5%), Cleaning & Maintenance (62 | 8.4%), Security & Protection (53 | 7.1%), Food Preparation & Serving (48 | 6.5%), and Personal Care & Service (45 | 6.1%).
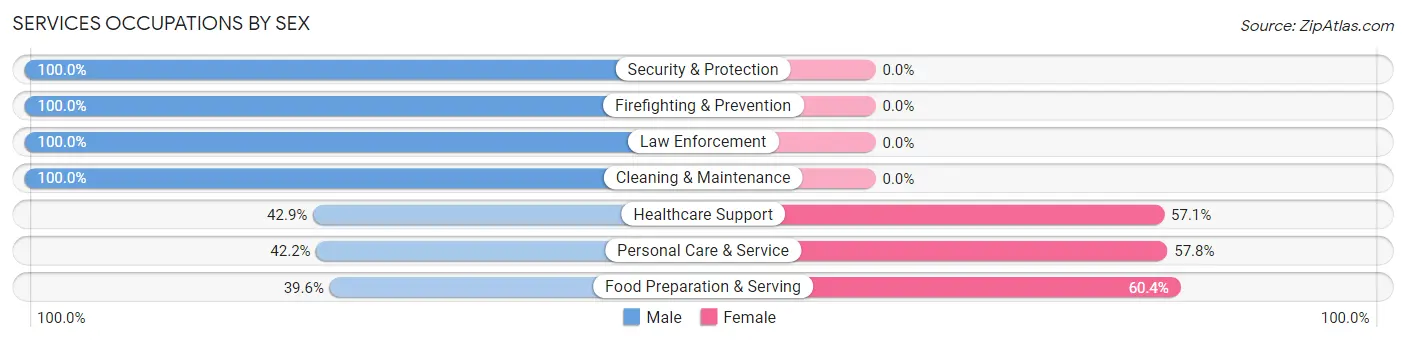
Services Occupations by Sex
Within the Services occupations in Port Norris, the most male-oriented occupations are Security & Protection (100.0%), Firefighting & Prevention (100.0%), and Law Enforcement (100.0%), while the most female-oriented occupations are Food Preparation & Serving (60.4%), Personal Care & Service (57.8%), and Healthcare Support (57.1%).
| Occupation | Male | Female |
| Healthcare Support | 27 (42.9%) | 36 (57.1%) |
| Security & Protection | 53 (100.0%) | 0 (0.0%) |
| Firefighting & Prevention | 34 (100.0%) | 0 (0.0%) |
| Law Enforcement | 19 (100.0%) | 0 (0.0%) |
| Food Preparation & Serving | 19 (39.6%) | 29 (60.4%) |
| Cleaning & Maintenance | 62 (100.0%) | 0 (0.0%) |
| Personal Care & Service | 19 (42.2%) | 26 (57.8%) |
| Total (Category) | 180 (66.4%) | 91 (33.6%) |
| Total (Overall) | 361 (48.6%) | 381 (51.3%) |
Sales and Office Occupations
The most common Sales and Office occupations in Port Norris are Sales & Related (104 | 14.0%), and Office & Administration (2 | 0.3%).
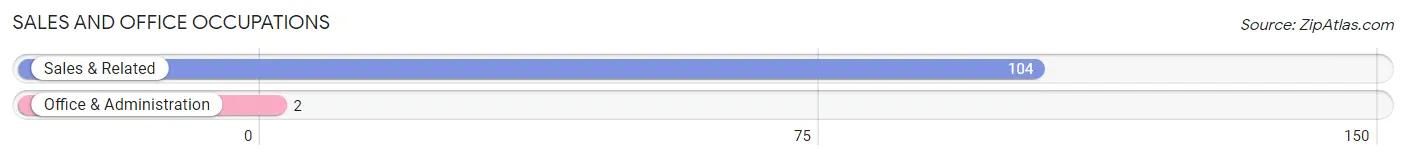
Sales and Office Occupations by Sex

| Occupation | Male | Female |
| Sales & Related | 10 (9.6%) | 94 (90.4%) |
| Office & Administration | 2 (100.0%) | 0 (0.0%) |
| Total (Category) | 12 (11.3%) | 94 (88.7%) |
| Total (Overall) | 361 (48.6%) | 381 (51.3%) |
Natural Resources, Construction and Maintenance Occupations
The most common Natural Resources, Construction and Maintenance occupations in Port Norris are , and Construction & Extraction (90 | 12.1%).
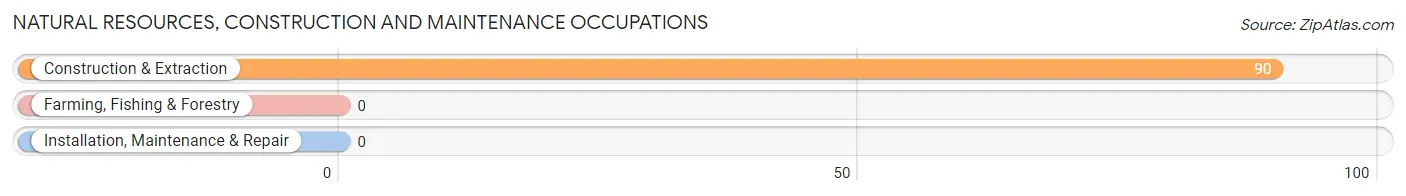
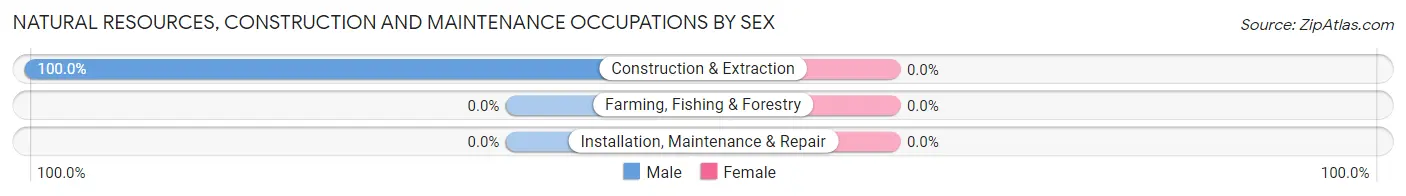
Natural Resources, Construction and Maintenance Occupations by Sex
| Occupation | Male | Female |
| Farming, Fishing & Forestry | 0 (0.0%) | 0 (0.0%) |
| Construction & Extraction | 90 (100.0%) | 0 (0.0%) |
| Installation, Maintenance & Repair | 0 (0.0%) | 0 (0.0%) |
| Total (Category) | 90 (100.0%) | 0 (0.0%) |
| Total (Overall) | 361 (48.6%) | 381 (51.3%) |
Production, Transportation and Moving Occupations
The most common Production, Transportation and Moving occupations in Port Norris are Production (102 | 13.8%), Material Moving (32 | 4.3%), and Transportation (30 | 4.0%).
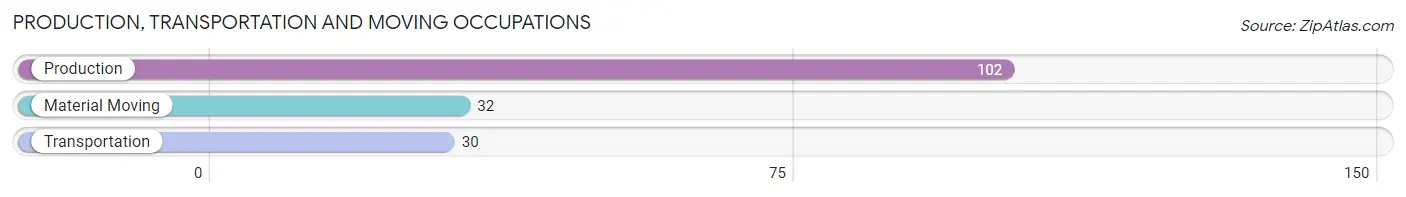
Production, Transportation and Moving Occupations by Sex
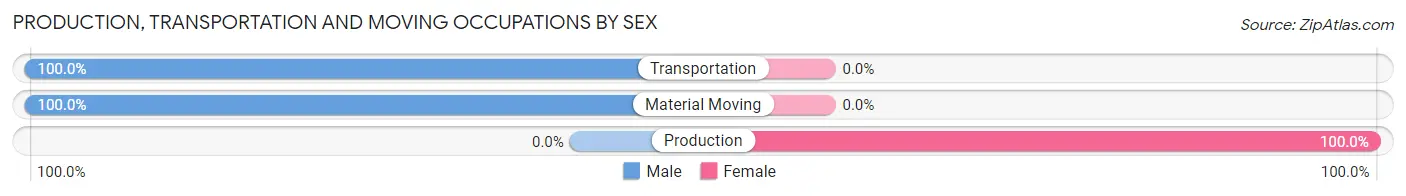
| Occupation | Male | Female |
| Production | 0 (0.0%) | 102 (100.0%) |
| Transportation | 30 (100.0%) | 0 (0.0%) |
| Material Moving | 32 (100.0%) | 0 (0.0%) |
| Total (Category) | 62 (37.8%) | 102 (62.2%) |
| Total (Overall) | 361 (48.6%) | 381 (51.3%) |
Employment Industries by Sex in Port Norris
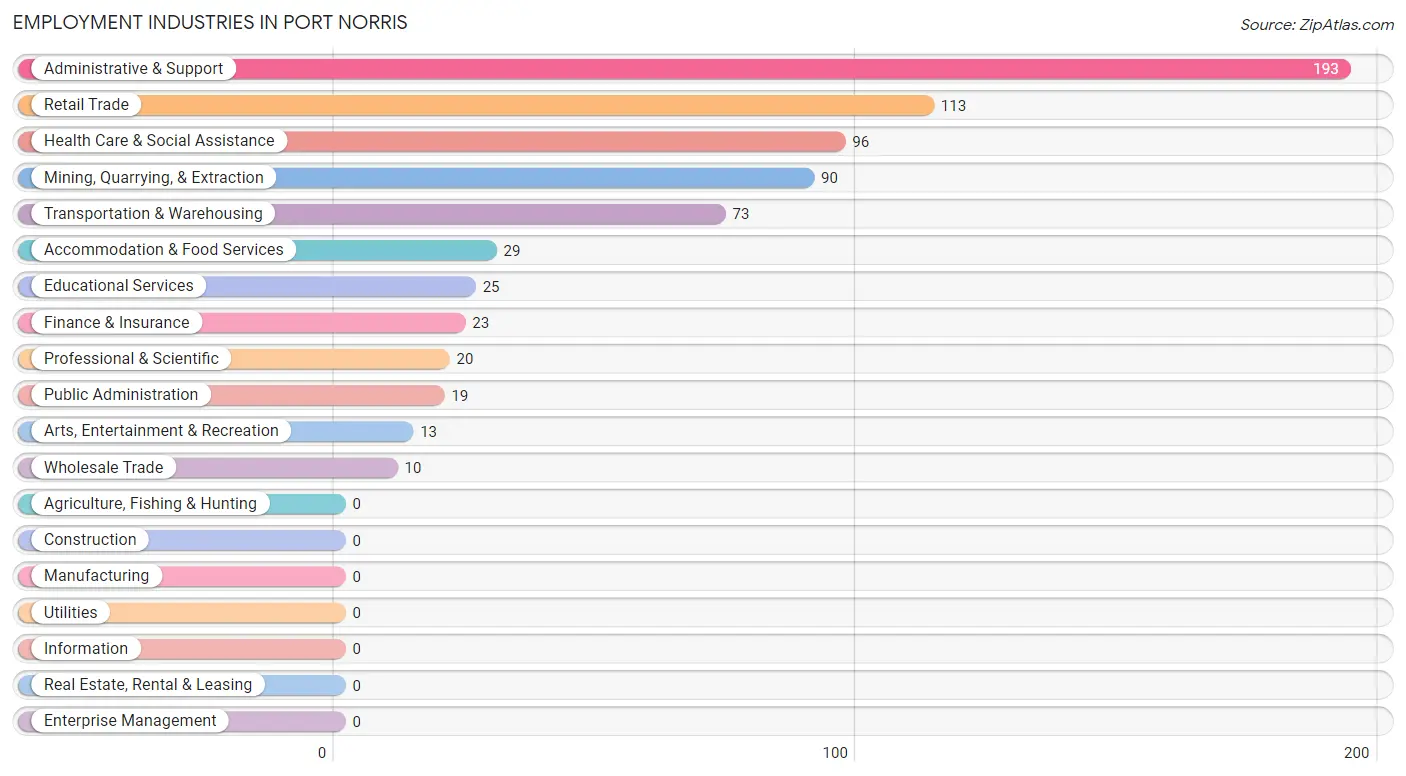
Employment Industries in Port Norris
The major employment industries in Port Norris include Administrative & Support (193 | 26.0%), Retail Trade (113 | 15.2%), Health Care & Social Assistance (96 | 12.9%), Mining, Quarrying, & Extraction (90 | 12.1%), and Transportation & Warehousing (73 | 9.8%).
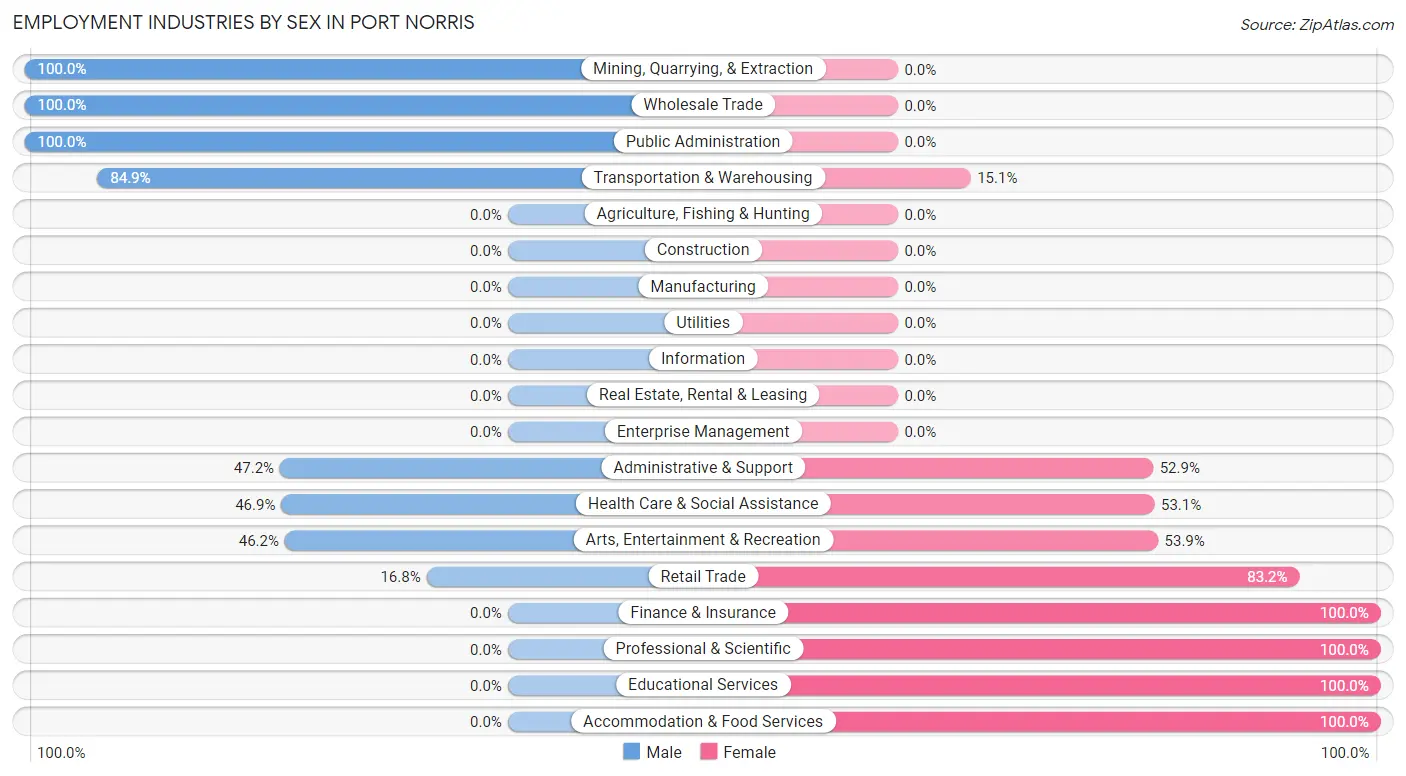
Employment Industries by Sex in Port Norris
The Port Norris industries that see more men than women are Mining, Quarrying, & Extraction (100.0%), Wholesale Trade (100.0%), and Public Administration (100.0%), whereas the industries that tend to have a higher number of women are Finance & Insurance (100.0%), Professional & Scientific (100.0%), and Educational Services (100.0%).
| Industry | Male | Female |
| Agriculture, Fishing & Hunting | 0 (0.0%) | 0 (0.0%) |
| Mining, Quarrying, & Extraction | 90 (100.0%) | 0 (0.0%) |
| Construction | 0 (0.0%) | 0 (0.0%) |
| Manufacturing | 0 (0.0%) | 0 (0.0%) |
| Wholesale Trade | 10 (100.0%) | 0 (0.0%) |
| Retail Trade | 19 (16.8%) | 94 (83.2%) |
| Transportation & Warehousing | 62 (84.9%) | 11 (15.1%) |
| Utilities | 0 (0.0%) | 0 (0.0%) |
| Information | 0 (0.0%) | 0 (0.0%) |
| Finance & Insurance | 0 (0.0%) | 23 (100.0%) |
| Real Estate, Rental & Leasing | 0 (0.0%) | 0 (0.0%) |
| Professional & Scientific | 0 (0.0%) | 20 (100.0%) |
| Enterprise Management | 0 (0.0%) | 0 (0.0%) |
| Administrative & Support | 91 (47.1%) | 102 (52.8%) |
| Educational Services | 0 (0.0%) | 25 (100.0%) |
| Health Care & Social Assistance | 45 (46.9%) | 51 (53.1%) |
| Arts, Entertainment & Recreation | 6 (46.2%) | 7 (53.8%) |
| Accommodation & Food Services | 0 (0.0%) | 29 (100.0%) |
| Public Administration | 19 (100.0%) | 0 (0.0%) |
| Total | 361 (48.6%) | 381 (51.3%) |
Education in Port Norris
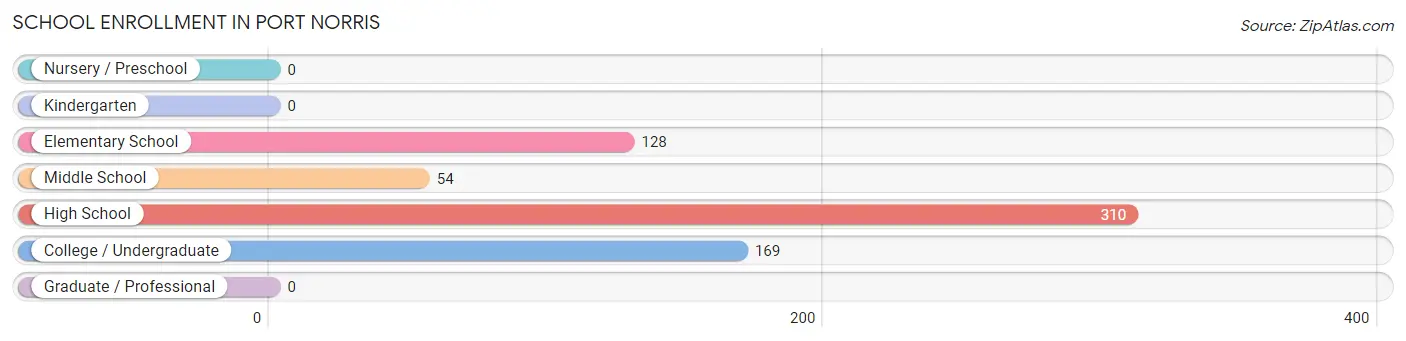
School Enrollment in Port Norris
The most common levels of schooling among the 661 students in Port Norris are high school (310 | 46.9%), college / undergraduate (169 | 25.6%), and elementary school (128 | 19.4%).
| School Level | # Students | % Students |
| Nursery / Preschool | 0 | 0.0% |
| Kindergarten | 0 | 0.0% |
| Elementary School | 128 | 19.4% |
| Middle School | 54 | 8.2% |
| High School | 310 | 46.9% |
| College / Undergraduate | 169 | 25.6% |
| Graduate / Professional | 0 | 0.0% |
| Total | 661 | 100.0% |
School Enrollment by Age by Funding Source in Port Norris
Out of a total of 661 students who are enrolled in schools in Port Norris, 13 (2.0%) attend a private institution, while the remaining 648 (98.0%) are enrolled in public schools. The age group of 20 to 24 year olds has the highest likelihood of being enrolled in private schools, with 13 (39.4% in the age bracket) enrolled. Conversely, the age group of 5 to 9 year old has the lowest likelihood of being enrolled in a private school, with 128 (100.0% in the age bracket) attending a public institution.
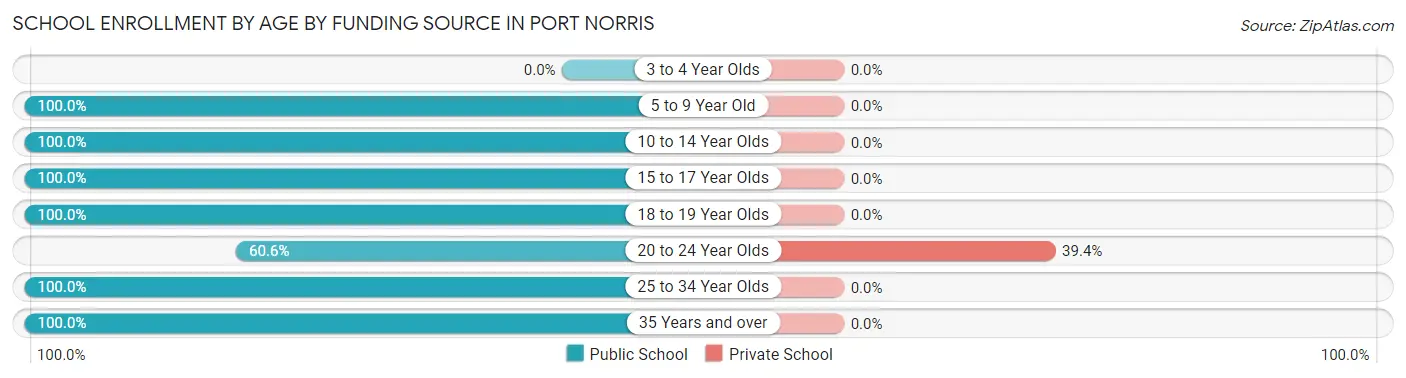
| Age Bracket | Public School | Private School |
| 3 to 4 Year Olds | 0 (0.0%) | 0 (0.0%) |
| 5 to 9 Year Old | 128 (100.0%) | 0 (0.0%) |
| 10 to 14 Year Olds | 54 (100.0%) | 0 (0.0%) |
| 15 to 17 Year Olds | 222 (100.0%) | 0 (0.0%) |
| 18 to 19 Year Olds | 88 (100.0%) | 0 (0.0%) |
| 20 to 24 Year Olds | 20 (60.6%) | 13 (39.4%) |
| 25 to 34 Year Olds | 19 (100.0%) | 0 (0.0%) |
| 35 Years and over | 117 (100.0%) | 0 (0.0%) |
| Total | 648 (98.0%) | 13 (2.0%) |
Educational Attainment by Field of Study in Port Norris
Business (35 | 77.8%), and social sciences (10 | 22.2%) are the most common fields of study among 45 individuals in Port Norris who have obtained a bachelor's degree or higher.
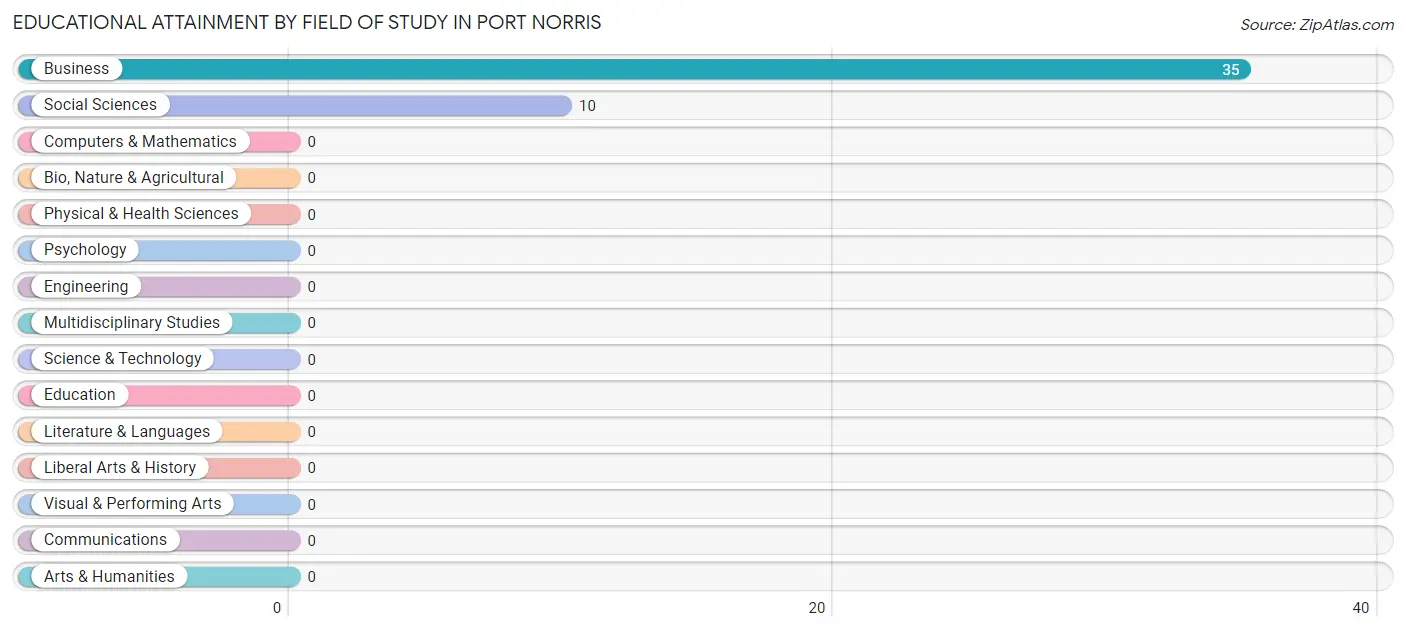
| Field of Study | # Graduates | % Graduates |
| Computers & Mathematics | 0 | 0.0% |
| Bio, Nature & Agricultural | 0 | 0.0% |
| Physical & Health Sciences | 0 | 0.0% |
| Psychology | 0 | 0.0% |
| Social Sciences | 10 | 22.2% |
| Engineering | 0 | 0.0% |
| Multidisciplinary Studies | 0 | 0.0% |
| Science & Technology | 0 | 0.0% |
| Business | 35 | 77.8% |
| Education | 0 | 0.0% |
| Literature & Languages | 0 | 0.0% |
| Liberal Arts & History | 0 | 0.0% |
| Visual & Performing Arts | 0 | 0.0% |
| Communications | 0 | 0.0% |
| Arts & Humanities | 0 | 0.0% |
| Total | 45 | 100.0% |
Transportation & Commute in Port Norris
Vehicle Availability by Sex in Port Norris
The most prevalent vehicle ownership categories in Port Norris are males with 2 vehicles (210, accounting for 58.7%) and females with 2 vehicles (115, making up 55.1%).
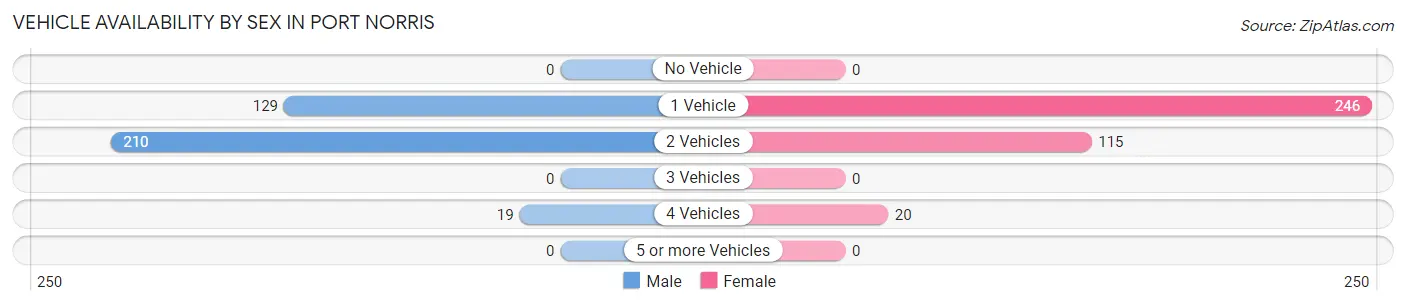
| Vehicles Available | Male | Female |
| No Vehicle | 0 (0.0%) | 0 (0.0%) |
| 1 Vehicle | 129 (36.0%) | 246 (64.6%) |
| 2 Vehicles | 210 (58.7%) | 115 (30.2%) |
| 3 Vehicles | 0 (0.0%) | 0 (0.0%) |
| 4 Vehicles | 19 (5.3%) | 20 (5.2%) |
| 5 or more Vehicles | 0 (0.0%) | 0 (0.0%) |
| Total | 358 (100.0%) | 381 (100.0%) |
Commute Time in Port Norris
The most frequently occuring commute durations in Port Norris are 30 to 34 minutes (116 commuters, 16.5%), 60 to 89 minutes (113 commuters, 16.1%), and 5 to 9 minutes (90 commuters, 12.8%).
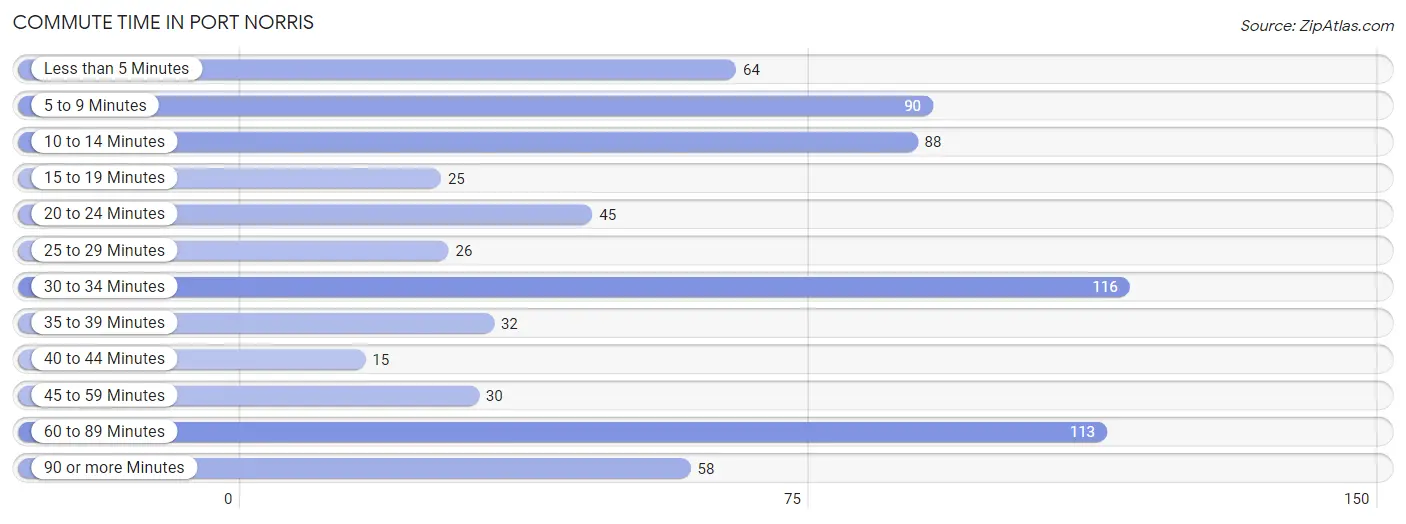
| Commute Time | # Commuters | % Commuters |
| Less than 5 Minutes | 64 | 9.1% |
| 5 to 9 Minutes | 90 | 12.8% |
| 10 to 14 Minutes | 88 | 12.5% |
| 15 to 19 Minutes | 25 | 3.6% |
| 20 to 24 Minutes | 45 | 6.4% |
| 25 to 29 Minutes | 26 | 3.7% |
| 30 to 34 Minutes | 116 | 16.5% |
| 35 to 39 Minutes | 32 | 4.6% |
| 40 to 44 Minutes | 15 | 2.1% |
| 45 to 59 Minutes | 30 | 4.3% |
| 60 to 89 Minutes | 113 | 16.1% |
| 90 or more Minutes | 58 | 8.3% |
Commute Time by Sex in Port Norris
The most common commute times in Port Norris are 5 to 9 minutes (90 commuters, 26.2%) for males and 60 to 89 minutes (113 commuters, 31.6%) for females.
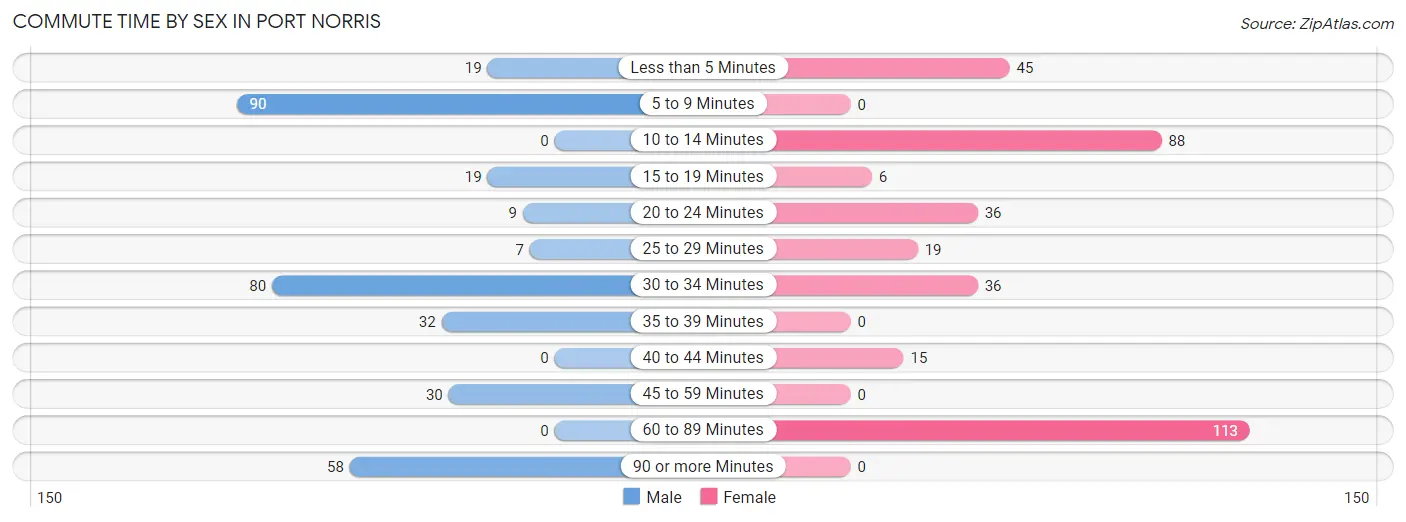
| Commute Time | Male | Female |
| Less than 5 Minutes | 19 (5.5%) | 45 (12.6%) |
| 5 to 9 Minutes | 90 (26.2%) | 0 (0.0%) |
| 10 to 14 Minutes | 0 (0.0%) | 88 (24.6%) |
| 15 to 19 Minutes | 19 (5.5%) | 6 (1.7%) |
| 20 to 24 Minutes | 9 (2.6%) | 36 (10.1%) |
| 25 to 29 Minutes | 7 (2.0%) | 19 (5.3%) |
| 30 to 34 Minutes | 80 (23.3%) | 36 (10.1%) |
| 35 to 39 Minutes | 32 (9.3%) | 0 (0.0%) |
| 40 to 44 Minutes | 0 (0.0%) | 15 (4.2%) |
| 45 to 59 Minutes | 30 (8.7%) | 0 (0.0%) |
| 60 to 89 Minutes | 0 (0.0%) | 113 (31.6%) |
| 90 or more Minutes | 58 (16.9%) | 0 (0.0%) |
Time of Departure to Work by Sex in Port Norris
The most frequent times of departure to work in Port Norris are 5:30 AM to 5:59 AM (151, 43.9%) for males and 7:30 AM to 7:59 AM (153, 42.7%) for females.
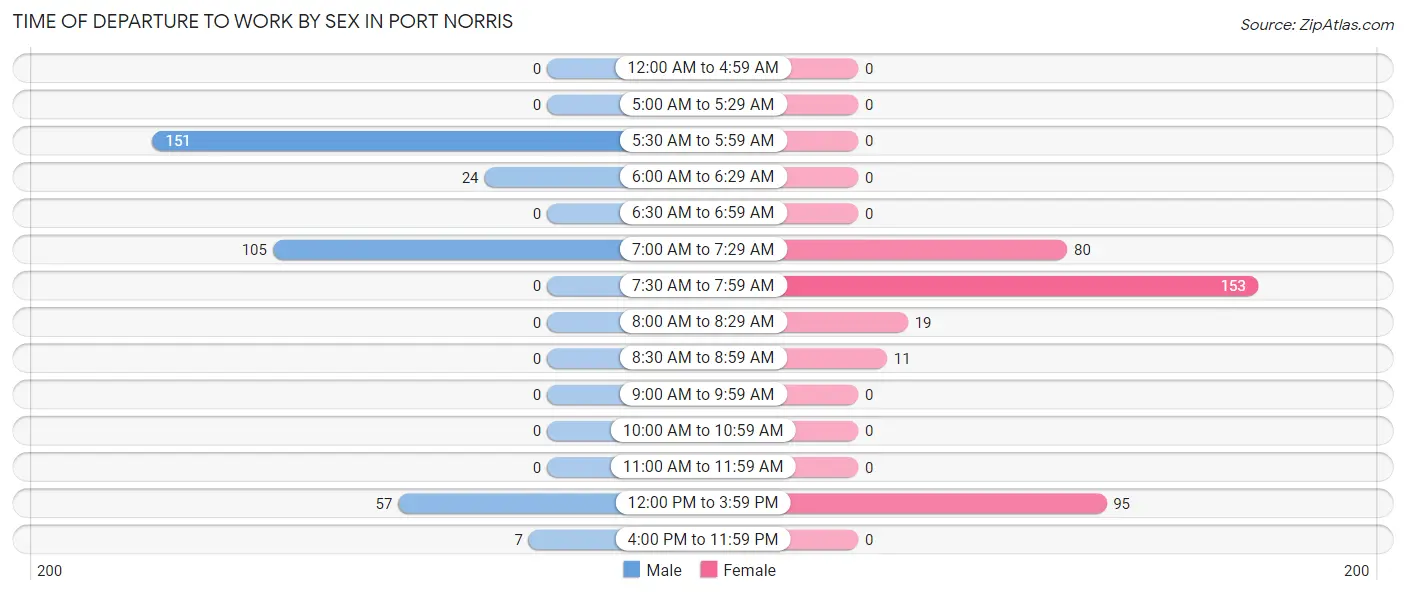
| Time of Departure | Male | Female |
| 12:00 AM to 4:59 AM | 0 (0.0%) | 0 (0.0%) |
| 5:00 AM to 5:29 AM | 0 (0.0%) | 0 (0.0%) |
| 5:30 AM to 5:59 AM | 151 (43.9%) | 0 (0.0%) |
| 6:00 AM to 6:29 AM | 24 (7.0%) | 0 (0.0%) |
| 6:30 AM to 6:59 AM | 0 (0.0%) | 0 (0.0%) |
| 7:00 AM to 7:29 AM | 105 (30.5%) | 80 (22.4%) |
| 7:30 AM to 7:59 AM | 0 (0.0%) | 153 (42.7%) |
| 8:00 AM to 8:29 AM | 0 (0.0%) | 19 (5.3%) |
| 8:30 AM to 8:59 AM | 0 (0.0%) | 11 (3.1%) |
| 9:00 AM to 9:59 AM | 0 (0.0%) | 0 (0.0%) |
| 10:00 AM to 10:59 AM | 0 (0.0%) | 0 (0.0%) |
| 11:00 AM to 11:59 AM | 0 (0.0%) | 0 (0.0%) |
| 12:00 PM to 3:59 PM | 57 (16.6%) | 95 (26.5%) |
| 4:00 PM to 11:59 PM | 7 (2.0%) | 0 (0.0%) |
| Total | 344 (100.0%) | 358 (100.0%) |
Housing Occupancy in Port Norris
Occupancy by Ownership in Port Norris
Of the total 592 dwellings in Port Norris, owner-occupied units account for 308 (52.0%), while renter-occupied units make up 284 (48.0%).
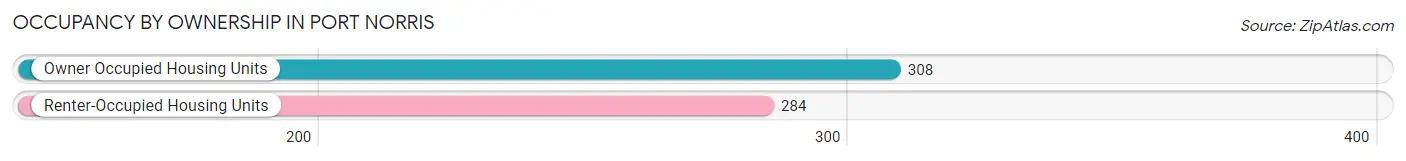
| Occupancy | # Housing Units | % Housing Units |
| Owner Occupied Housing Units | 308 | 52.0% |
| Renter-Occupied Housing Units | 284 | 48.0% |
| Total Occupied Housing Units | 592 | 100.0% |
Occupancy by Household Size in Port Norris
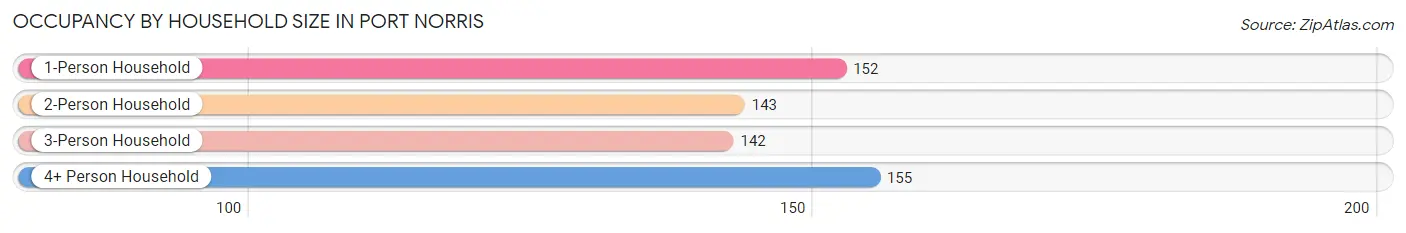
| Household Size | # Housing Units | % Housing Units |
| 1-Person Household | 152 | 25.7% |
| 2-Person Household | 143 | 24.2% |
| 3-Person Household | 142 | 24.0% |
| 4+ Person Household | 155 | 26.2% |
| Total Housing Units | 592 | 100.0% |
Occupancy by Ownership by Household Size in Port Norris
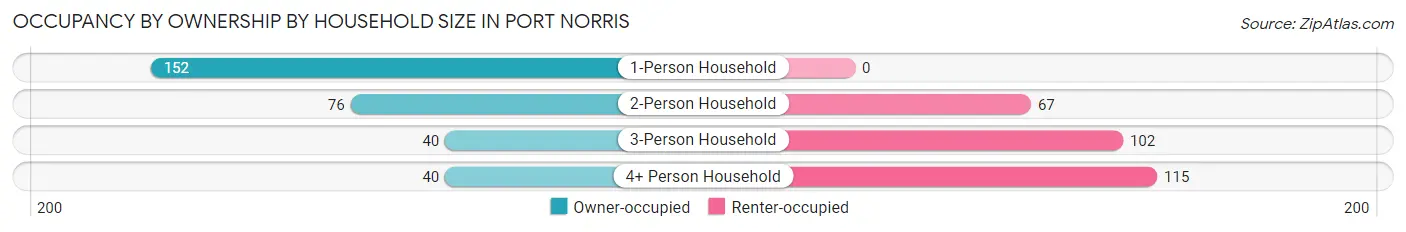
| Household Size | Owner-occupied | Renter-occupied |
| 1-Person Household | 152 (100.0%) | 0 (0.0%) |
| 2-Person Household | 76 (53.1%) | 67 (46.9%) |
| 3-Person Household | 40 (28.2%) | 102 (71.8%) |
| 4+ Person Household | 40 (25.8%) | 115 (74.2%) |
| Total Housing Units | 308 (52.0%) | 284 (48.0%) |
Occupancy by Educational Attainment in Port Norris
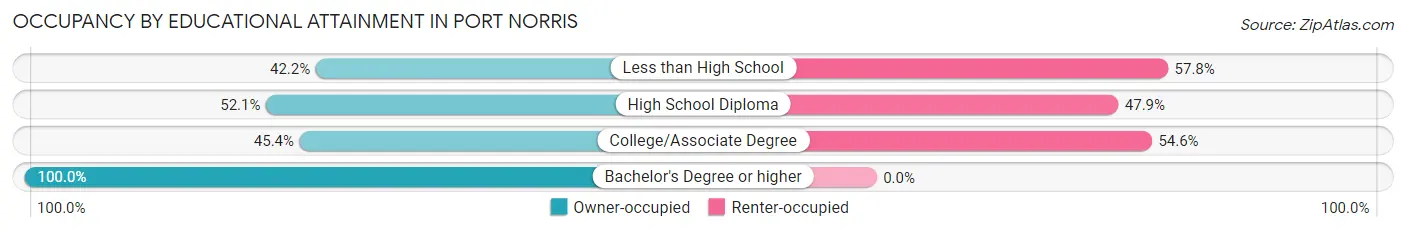
| Household Size | Owner-occupied | Renter-occupied |
| Less than High School | 19 (42.2%) | 26 (57.8%) |
| High School Diploma | 125 (52.1%) | 115 (47.9%) |
| College/Associate Degree | 119 (45.4%) | 143 (54.6%) |
| Bachelor's Degree or higher | 45 (100.0%) | 0 (0.0%) |
Occupancy by Age of Householder in Port Norris
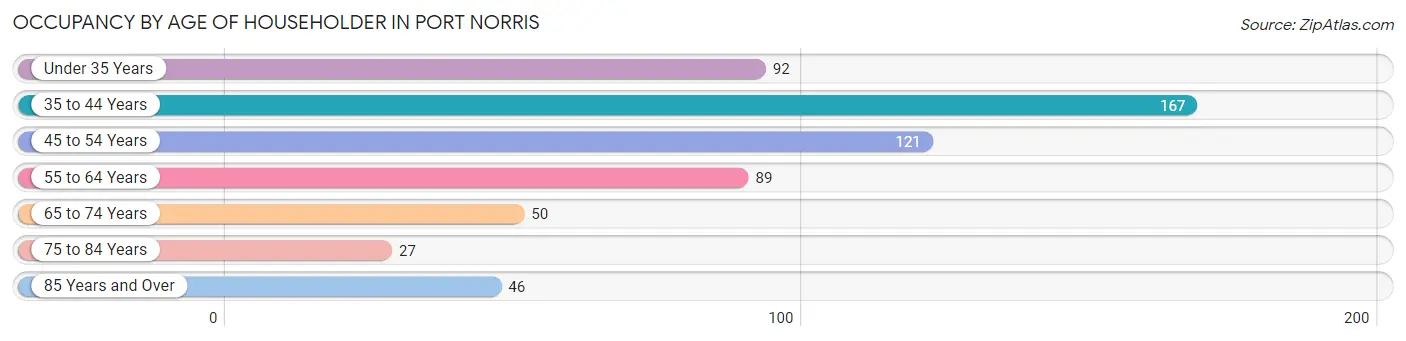
| Age Bracket | # Households | % Households |
| Under 35 Years | 92 | 15.5% |
| 35 to 44 Years | 167 | 28.2% |
| 45 to 54 Years | 121 | 20.4% |
| 55 to 64 Years | 89 | 15.0% |
| 65 to 74 Years | 50 | 8.5% |
| 75 to 84 Years | 27 | 4.6% |
| 85 Years and Over | 46 | 7.8% |
| Total | 592 | 100.0% |
Housing Finances in Port Norris
Median Income by Occupancy in Port Norris
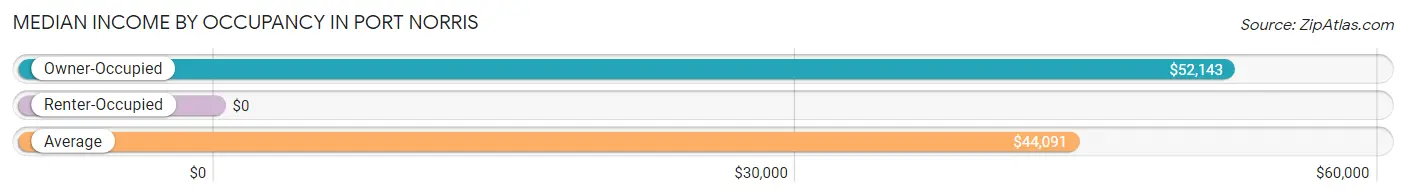
| Occupancy Type | # Households | Median Income |
| Owner-Occupied | 308 (52.0%) | $52,143 |
| Renter-Occupied | 284 (48.0%) | $0 |
| Average | 592 (100.0%) | $44,091 |
Occupancy by Householder Income Bracket in Port Norris
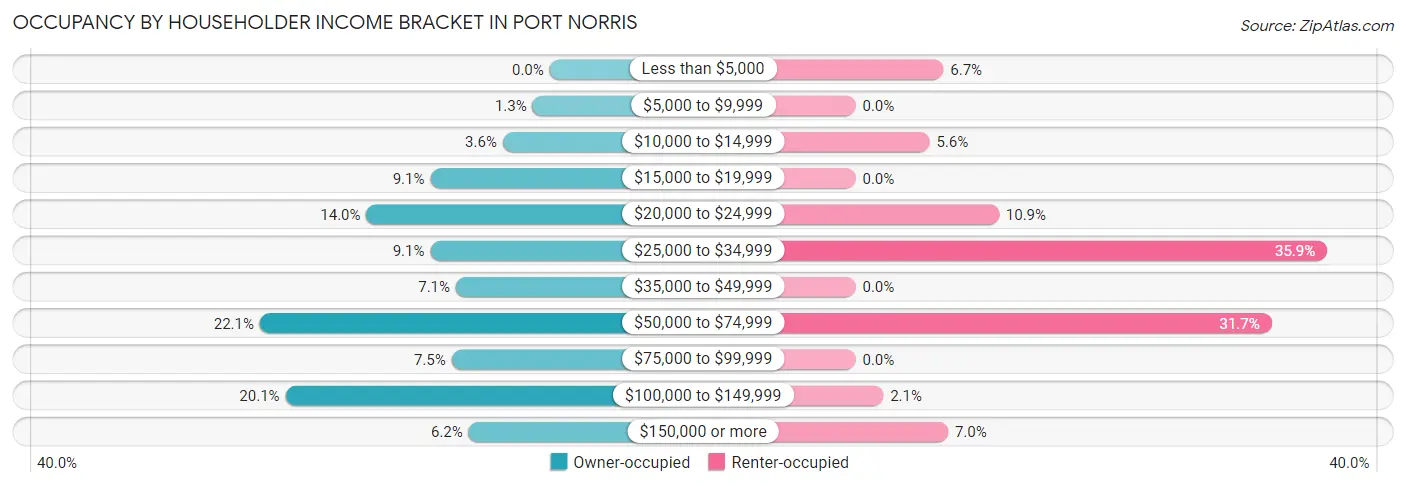
| Income Bracket | Owner-occupied | Renter-occupied |
| Less than $5,000 | 0 (0.0%) | 19 (6.7%) |
| $5,000 to $9,999 | 4 (1.3%) | 0 (0.0%) |
| $10,000 to $14,999 | 11 (3.6%) | 16 (5.6%) |
| $15,000 to $19,999 | 28 (9.1%) | 0 (0.0%) |
| $20,000 to $24,999 | 43 (14.0%) | 31 (10.9%) |
| $25,000 to $34,999 | 28 (9.1%) | 102 (35.9%) |
| $35,000 to $49,999 | 22 (7.1%) | 0 (0.0%) |
| $50,000 to $74,999 | 68 (22.1%) | 90 (31.7%) |
| $75,000 to $99,999 | 23 (7.5%) | 0 (0.0%) |
| $100,000 to $149,999 | 62 (20.1%) | 6 (2.1%) |
| $150,000 or more | 19 (6.2%) | 20 (7.0%) |
| Total | 308 (100.0%) | 284 (100.0%) |
Monthly Housing Cost Tiers in Port Norris
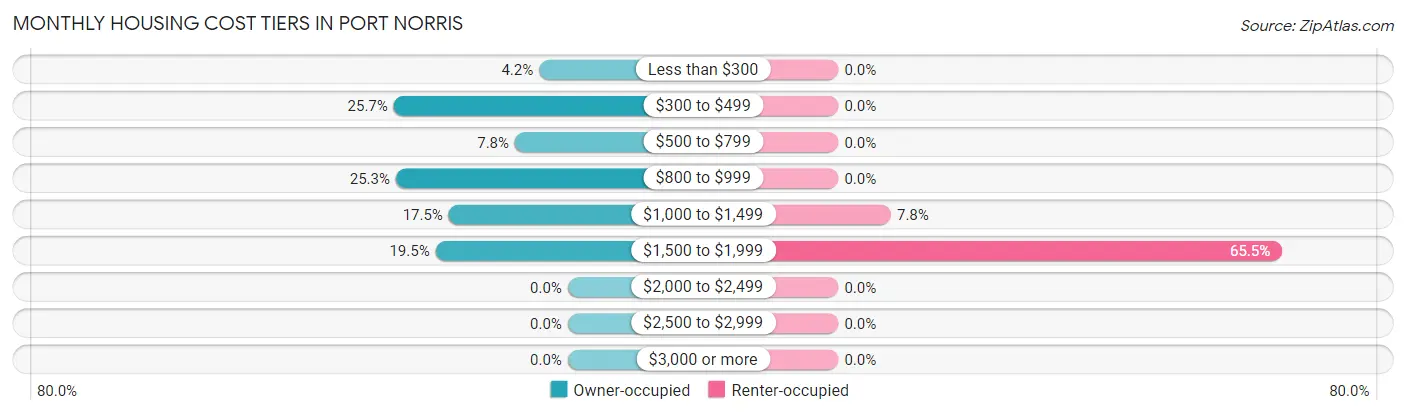
| Monthly Cost | Owner-occupied | Renter-occupied |
| Less than $300 | 13 (4.2%) | 0 (0.0%) |
| $300 to $499 | 79 (25.7%) | 0 (0.0%) |
| $500 to $799 | 24 (7.8%) | 0 (0.0%) |
| $800 to $999 | 78 (25.3%) | 0 (0.0%) |
| $1,000 to $1,499 | 54 (17.5%) | 22 (7.7%) |
| $1,500 to $1,999 | 60 (19.5%) | 186 (65.5%) |
| $2,000 to $2,499 | 0 (0.0%) | 0 (0.0%) |
| $2,500 to $2,999 | 0 (0.0%) | 0 (0.0%) |
| $3,000 or more | 0 (0.0%) | 0 (0.0%) |
| Total | 308 (100.0%) | 284 (100.0%) |
Physical Housing Characteristics in Port Norris
Housing Structures in Port Norris
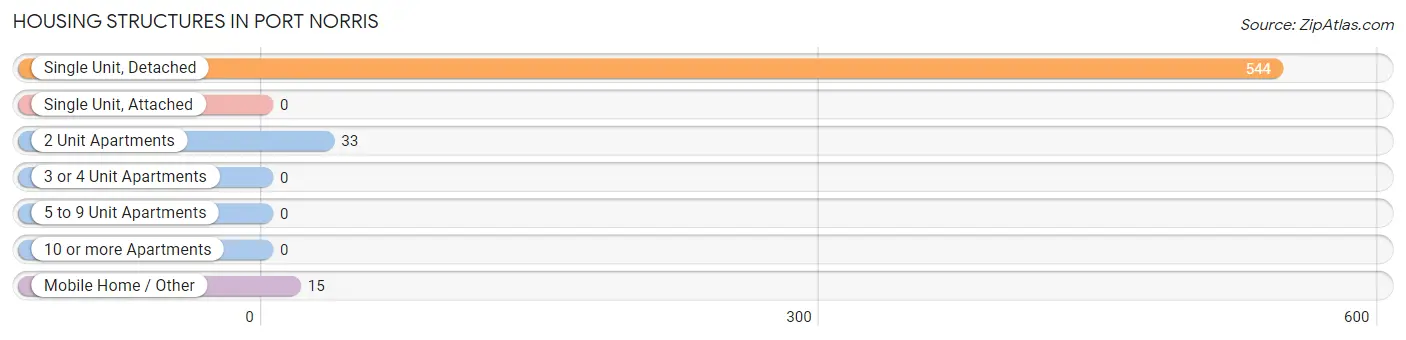
| Structure Type | # Housing Units | % Housing Units |
| Single Unit, Detached | 544 | 91.9% |
| Single Unit, Attached | 0 | 0.0% |
| 2 Unit Apartments | 33 | 5.6% |
| 3 or 4 Unit Apartments | 0 | 0.0% |
| 5 to 9 Unit Apartments | 0 | 0.0% |
| 10 or more Apartments | 0 | 0.0% |
| Mobile Home / Other | 15 | 2.5% |
| Total | 592 | 100.0% |
Housing Structures by Occupancy in Port Norris
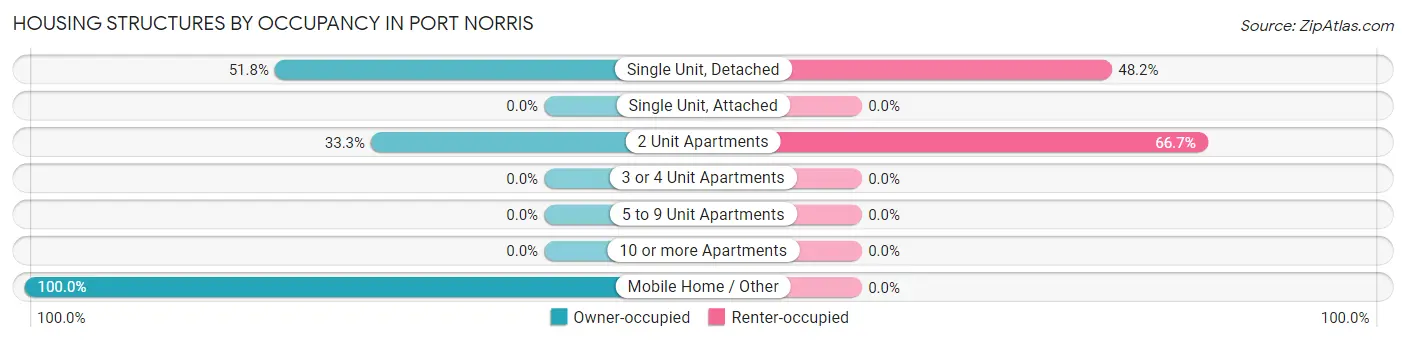
| Structure Type | Owner-occupied | Renter-occupied |
| Single Unit, Detached | 282 (51.8%) | 262 (48.2%) |
| Single Unit, Attached | 0 (0.0%) | 0 (0.0%) |
| 2 Unit Apartments | 11 (33.3%) | 22 (66.7%) |
| 3 or 4 Unit Apartments | 0 (0.0%) | 0 (0.0%) |
| 5 to 9 Unit Apartments | 0 (0.0%) | 0 (0.0%) |
| 10 or more Apartments | 0 (0.0%) | 0 (0.0%) |
| Mobile Home / Other | 15 (100.0%) | 0 (0.0%) |
| Total | 308 (52.0%) | 284 (48.0%) |
Housing Structures by Number of Rooms in Port Norris
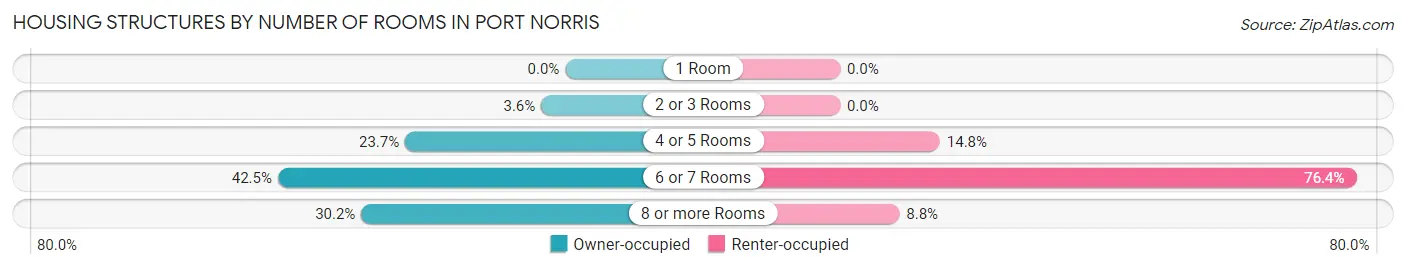
| Number of Rooms | Owner-occupied | Renter-occupied |
| 1 Room | 0 (0.0%) | 0 (0.0%) |
| 2 or 3 Rooms | 11 (3.6%) | 0 (0.0%) |
| 4 or 5 Rooms | 73 (23.7%) | 42 (14.8%) |
| 6 or 7 Rooms | 131 (42.5%) | 217 (76.4%) |
| 8 or more Rooms | 93 (30.2%) | 25 (8.8%) |
| Total | 308 (100.0%) | 284 (100.0%) |
Housing Structure by Heating Type in Port Norris
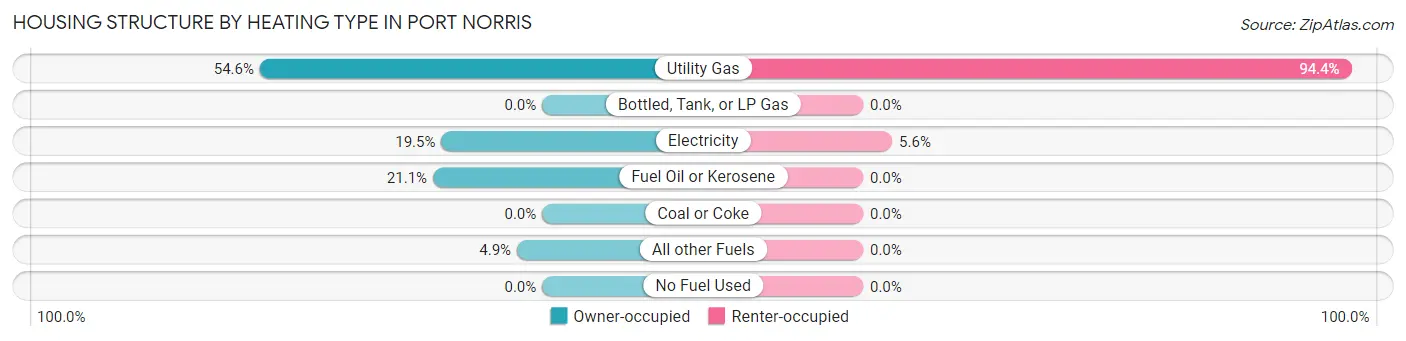
| Heating Type | Owner-occupied | Renter-occupied |
| Utility Gas | 168 (54.5%) | 268 (94.4%) |
| Bottled, Tank, or LP Gas | 0 (0.0%) | 0 (0.0%) |
| Electricity | 60 (19.5%) | 16 (5.6%) |
| Fuel Oil or Kerosene | 65 (21.1%) | 0 (0.0%) |
| Coal or Coke | 0 (0.0%) | 0 (0.0%) |
| All other Fuels | 15 (4.9%) | 0 (0.0%) |
| No Fuel Used | 0 (0.0%) | 0 (0.0%) |
| Total | 308 (100.0%) | 284 (100.0%) |
Household Vehicle Usage in Port Norris
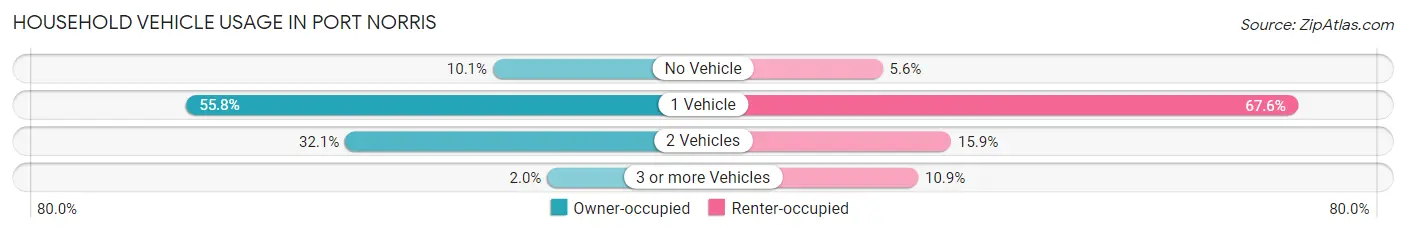
| Vehicles per Household | Owner-occupied | Renter-occupied |
| No Vehicle | 31 (10.1%) | 16 (5.6%) |
| 1 Vehicle | 172 (55.8%) | 192 (67.6%) |
| 2 Vehicles | 99 (32.1%) | 45 (15.9%) |
| 3 or more Vehicles | 6 (1.9%) | 31 (10.9%) |
| Total | 308 (100.0%) | 284 (100.0%) |
Real Estate & Mortgages in Port Norris
Real Estate and Mortgage Overview in Port Norris
| Characteristic | Without Mortgage | With Mortgage |
| Housing Units | 185 | 123 |
| Median Property Value | - | - |
| Median Household Income | $43,807 | $0 |
| Monthly Housing Costs | $506 | $0 |
| Real Estate Taxes | $4,098 | $15 |
Property Value by Mortgage Status in Port Norris
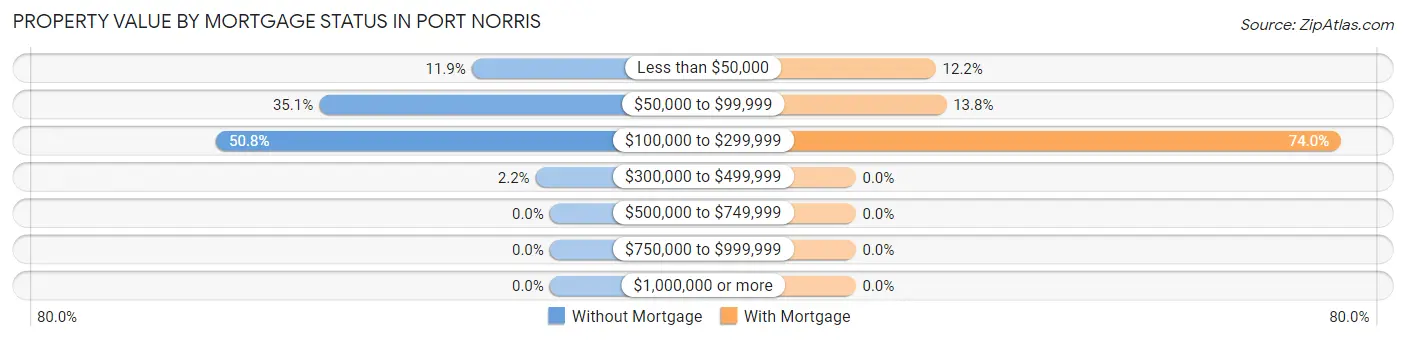
| Property Value | Without Mortgage | With Mortgage |
| Less than $50,000 | 22 (11.9%) | 15 (12.2%) |
| $50,000 to $99,999 | 65 (35.1%) | 17 (13.8%) |
| $100,000 to $299,999 | 94 (50.8%) | 91 (74.0%) |
| $300,000 to $499,999 | 4 (2.2%) | 0 (0.0%) |
| $500,000 to $749,999 | 0 (0.0%) | 0 (0.0%) |
| $750,000 to $999,999 | 0 (0.0%) | 0 (0.0%) |
| $1,000,000 or more | 0 (0.0%) | 0 (0.0%) |
| Total | 185 (100.0%) | 123 (100.0%) |
Household Income by Mortgage Status in Port Norris
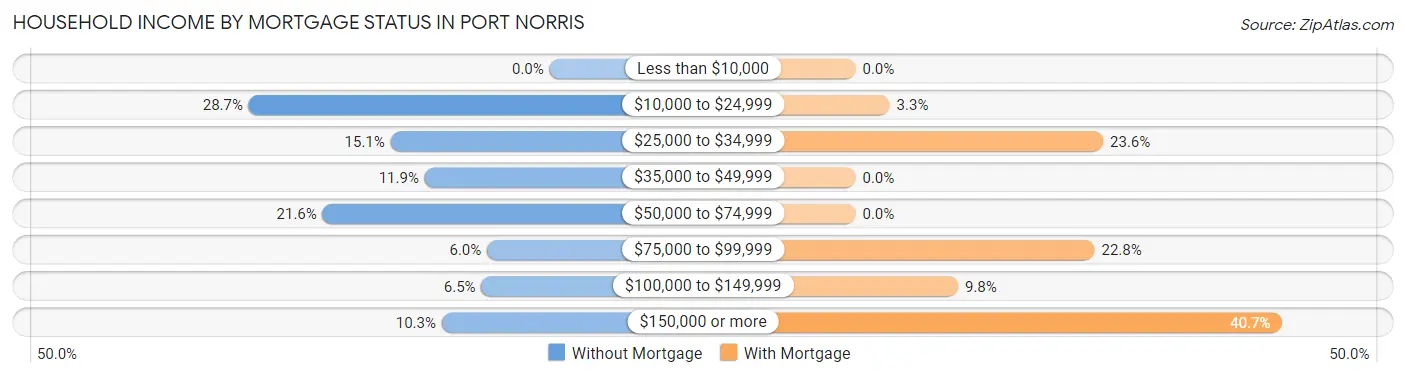
| Household Income | Without Mortgage | With Mortgage |
| Less than $10,000 | 0 (0.0%) | 0 (0.0%) |
| $10,000 to $24,999 | 53 (28.6%) | 4 (3.3%) |
| $25,000 to $34,999 | 28 (15.1%) | 29 (23.6%) |
| $35,000 to $49,999 | 22 (11.9%) | 0 (0.0%) |
| $50,000 to $74,999 | 40 (21.6%) | 0 (0.0%) |
| $75,000 to $99,999 | 11 (5.9%) | 28 (22.8%) |
| $100,000 to $149,999 | 12 (6.5%) | 12 (9.8%) |
| $150,000 or more | 19 (10.3%) | 50 (40.6%) |
| Total | 185 (100.0%) | 123 (100.0%) |
Property Value to Household Income Ratio in Port Norris
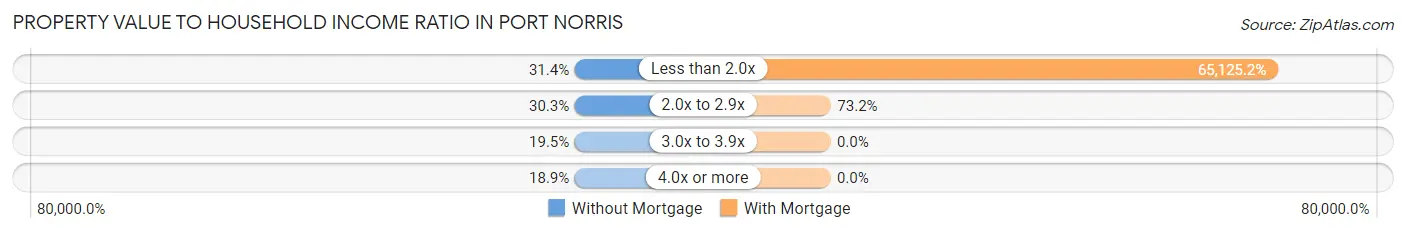
| Value-to-Income Ratio | Without Mortgage | With Mortgage |
| Less than 2.0x | 58 (31.4%) | 80,104 (65,125.2%) |
| 2.0x to 2.9x | 56 (30.3%) | 90 (73.2%) |
| 3.0x to 3.9x | 36 (19.5%) | 0 (0.0%) |
| 4.0x or more | 35 (18.9%) | 0 (0.0%) |
| Total | 185 (100.0%) | 123 (100.0%) |
Real Estate Taxes by Mortgage Status in Port Norris
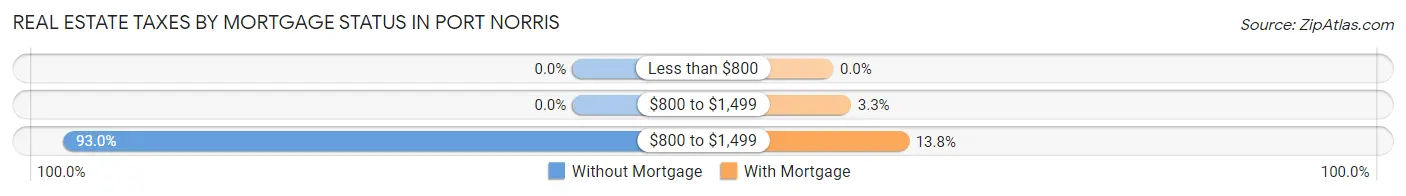
| Property Taxes | Without Mortgage | With Mortgage |
| Less than $800 | 0 (0.0%) | 0 (0.0%) |
| $800 to $1,499 | 0 (0.0%) | 4 (3.3%) |
| $800 to $1,499 | 172 (93.0%) | 17 (13.8%) |
| Total | 185 (100.0%) | 123 (100.0%) |
Health & Disability in Port Norris
Health Insurance Coverage by Age in Port Norris
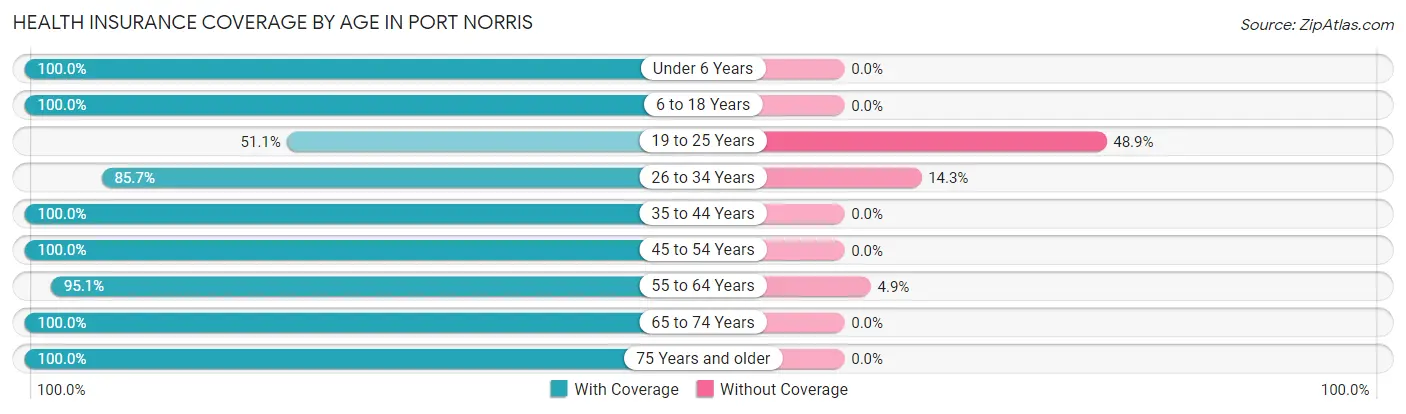
| Age Bracket | With Coverage | Without Coverage |
| Under 6 Years | 125 (100.0%) | 0 (0.0%) |
| 6 to 18 Years | 492 (100.0%) | 0 (0.0%) |
| 19 to 25 Years | 45 (51.1%) | 43 (48.9%) |
| 26 to 34 Years | 215 (85.7%) | 36 (14.3%) |
| 35 to 44 Years | 242 (100.0%) | 0 (0.0%) |
| 45 to 54 Years | 182 (100.0%) | 0 (0.0%) |
| 55 to 64 Years | 136 (95.1%) | 7 (4.9%) |
| 65 to 74 Years | 89 (100.0%) | 0 (0.0%) |
| 75 Years and older | 99 (100.0%) | 0 (0.0%) |
| Total | 1,625 (95.0%) | 86 (5.0%) |
Health Insurance Coverage by Citizenship Status in Port Norris
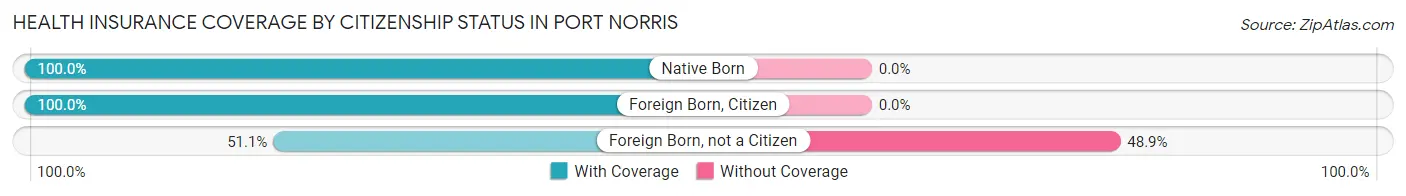
| Citizenship Status | With Coverage | Without Coverage |
| Native Born | 125 (100.0%) | 0 (0.0%) |
| Foreign Born, Citizen | 492 (100.0%) | 0 (0.0%) |
| Foreign Born, not a Citizen | 45 (51.1%) | 43 (48.9%) |
Health Insurance Coverage by Household Income in Port Norris

| Household Income | With Coverage | Without Coverage |
| Under $25,000 | 327 (100.0%) | 0 (0.0%) |
| $25,000 to $49,999 | 356 (100.0%) | 0 (0.0%) |
| $50,000 to $74,999 | 505 (88.4%) | 66 (11.6%) |
| $75,000 to $99,999 | 62 (82.7%) | 13 (17.3%) |
| $100,000 and over | 360 (98.1%) | 7 (1.9%) |
Public vs Private Health Insurance Coverage by Age in Port Norris
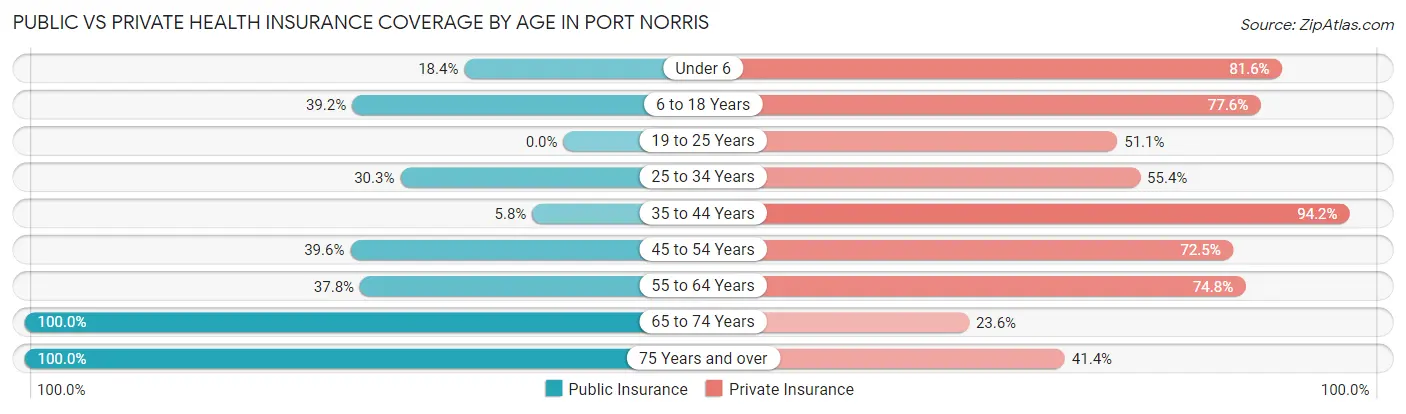
| Age Bracket | Public Insurance | Private Insurance |
| Under 6 | 23 (18.4%) | 102 (81.6%) |
| 6 to 18 Years | 193 (39.2%) | 382 (77.6%) |
| 19 to 25 Years | 0 (0.0%) | 45 (51.1%) |
| 25 to 34 Years | 76 (30.3%) | 139 (55.4%) |
| 35 to 44 Years | 14 (5.8%) | 228 (94.2%) |
| 45 to 54 Years | 72 (39.6%) | 132 (72.5%) |
| 55 to 64 Years | 54 (37.8%) | 107 (74.8%) |
| 65 to 74 Years | 89 (100.0%) | 21 (23.6%) |
| 75 Years and over | 99 (100.0%) | 41 (41.4%) |
| Total | 620 (36.2%) | 1,197 (70.0%) |
Disability Status by Sex by Age in Port Norris
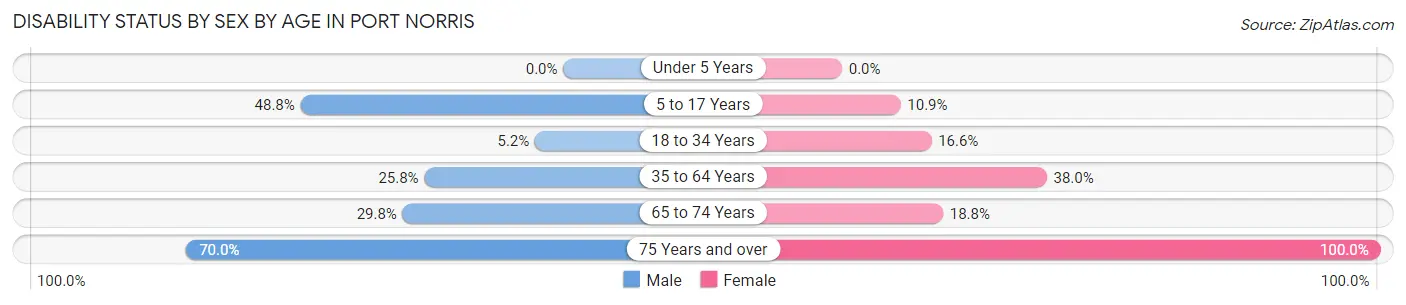
| Age Bracket | Male | Female |
| Under 5 Years | 0 (0.0%) | 0 (0.0%) |
| 5 to 17 Years | 119 (48.8%) | 20 (10.9%) |
| 18 to 34 Years | 11 (5.2%) | 36 (16.6%) |
| 35 to 64 Years | 58 (25.8%) | 130 (38.0%) |
| 65 to 74 Years | 17 (29.8%) | 6 (18.8%) |
| 75 Years and over | 49 (70.0%) | 29 (100.0%) |
Disability Class by Sex by Age in Port Norris
Disability Class: Hearing Difficulty
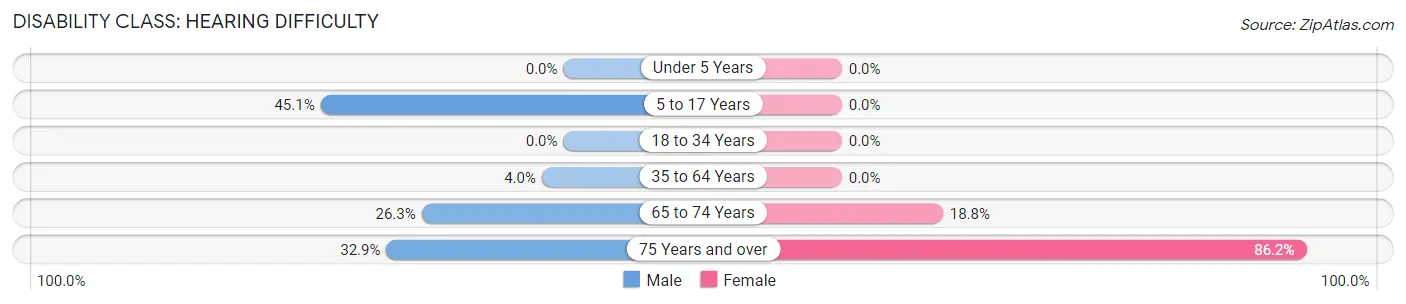
| Age Bracket | Male | Female |
| Under 5 Years | 0 (0.0%) | 0 (0.0%) |
| 5 to 17 Years | 110 (45.1%) | 0 (0.0%) |
| 18 to 34 Years | 0 (0.0%) | 0 (0.0%) |
| 35 to 64 Years | 9 (4.0%) | 0 (0.0%) |
| 65 to 74 Years | 15 (26.3%) | 6 (18.8%) |
| 75 Years and over | 23 (32.9%) | 25 (86.2%) |
Disability Class: Vision Difficulty
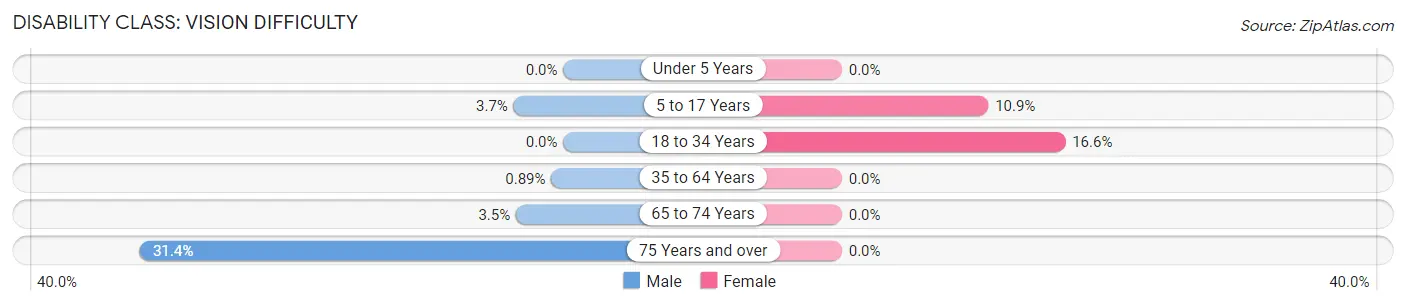
| Age Bracket | Male | Female |
| Under 5 Years | 0 (0.0%) | 0 (0.0%) |
| 5 to 17 Years | 9 (3.7%) | 20 (10.9%) |
| 18 to 34 Years | 0 (0.0%) | 36 (16.6%) |
| 35 to 64 Years | 2 (0.9%) | 0 (0.0%) |
| 65 to 74 Years | 2 (3.5%) | 0 (0.0%) |
| 75 Years and over | 22 (31.4%) | 0 (0.0%) |
Disability Class: Cognitive Difficulty
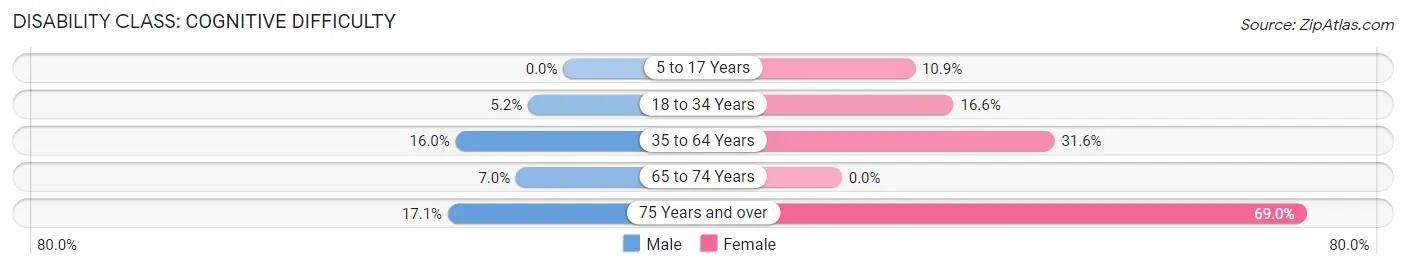
| Age Bracket | Male | Female |
| 5 to 17 Years | 0 (0.0%) | 20 (10.9%) |
| 18 to 34 Years | 11 (5.2%) | 36 (16.6%) |
| 35 to 64 Years | 36 (16.0%) | 108 (31.6%) |
| 65 to 74 Years | 4 (7.0%) | 0 (0.0%) |
| 75 Years and over | 12 (17.1%) | 20 (69.0%) |
Disability Class: Ambulatory Difficulty
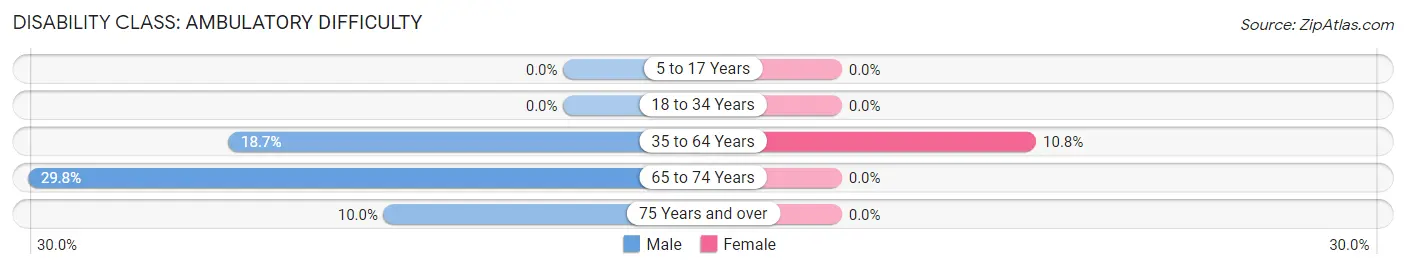
| Age Bracket | Male | Female |
| 5 to 17 Years | 0 (0.0%) | 0 (0.0%) |
| 18 to 34 Years | 0 (0.0%) | 0 (0.0%) |
| 35 to 64 Years | 42 (18.7%) | 37 (10.8%) |
| 65 to 74 Years | 17 (29.8%) | 0 (0.0%) |
| 75 Years and over | 7 (10.0%) | 0 (0.0%) |
Disability Class: Self-Care Difficulty
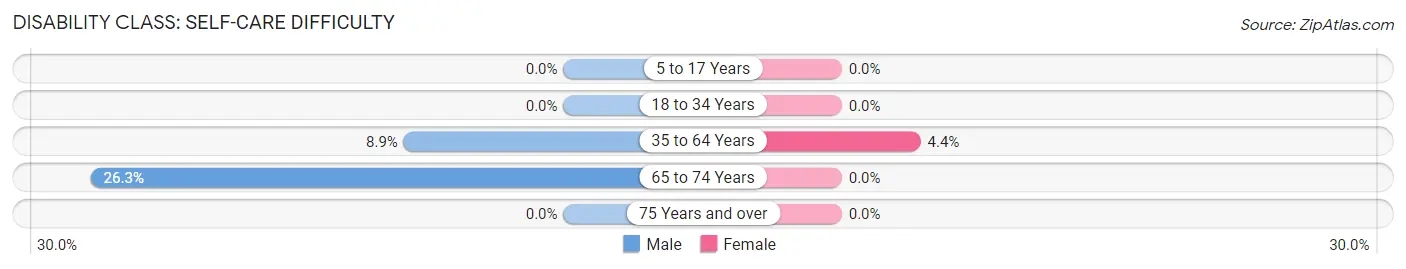
| Age Bracket | Male | Female |
| 5 to 17 Years | 0 (0.0%) | 0 (0.0%) |
| 18 to 34 Years | 0 (0.0%) | 0 (0.0%) |
| 35 to 64 Years | 20 (8.9%) | 15 (4.4%) |
| 65 to 74 Years | 15 (26.3%) | 0 (0.0%) |
| 75 Years and over | 0 (0.0%) | 0 (0.0%) |
Technology Access in Port Norris
Computing Device Access in Port Norris
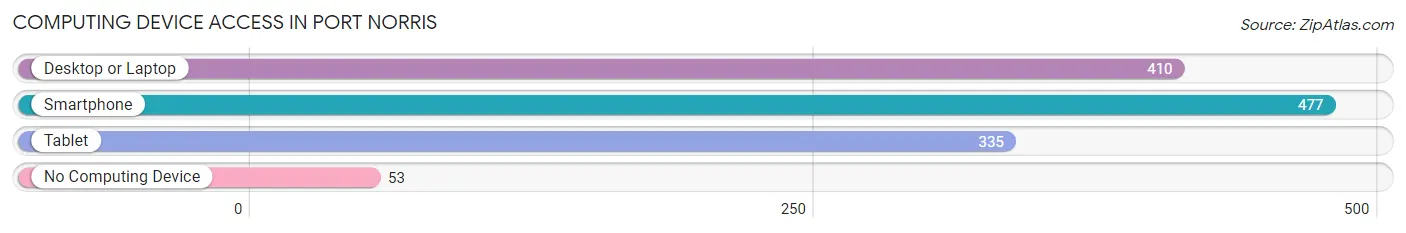
| Device Type | # Households | % Households |
| Desktop or Laptop | 410 | 69.3% |
| Smartphone | 477 | 80.6% |
| Tablet | 335 | 56.6% |
| No Computing Device | 53 | 8.9% |
| Total | 592 | 100.0% |
Internet Access in Port Norris
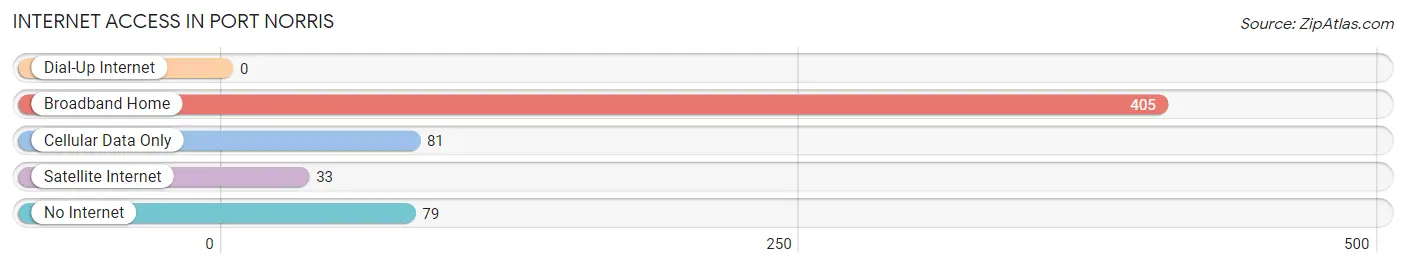
| Internet Type | # Households | % Households |
| Dial-Up Internet | 0 | 0.0% |
| Broadband Home | 405 | 68.4% |
| Cellular Data Only | 81 | 13.7% |
| Satellite Internet | 33 | 5.6% |
| No Internet | 79 | 13.3% |
| Total | 592 | 100.0% |
Port Norris Summary
History
Port Norris is a small unincorporated community located in Cumberland County, New Jersey. It is situated on the Maurice River, which is part of the Delaware Bay estuary. The area was first settled in the late 1600s by Dutch and Swedish settlers. The town was originally known as “Port Norris Landing” and was a major port for the shipping of lumber and other goods. The town was officially incorporated in 1867 and was named after the Norris family, who were prominent landowners in the area.
The town was a major center for the oyster industry in the late 19th and early 20th centuries. The oyster industry was so important to the town that it was nicknamed “The Oyster Capital of the World.” The town was also home to several canneries, which processed the oysters for shipment to other parts of the country.
The town was also home to a thriving shipbuilding industry. The shipyards in Port Norris built many of the ships that were used in World War II. The town was also home to a large fishing fleet, which supplied the local canneries with fish.
Geography
Port Norris is located in Cumberland County, New Jersey. It is situated on the Maurice River, which is part of the Delaware Bay estuary. The town is located approximately 10 miles south of Vineland and 25 miles north of Atlantic City. The town is bordered by the towns of Maurice River Township, Commercial Township, and Downe Township.
The town has a total area of 1.3 square miles, all of which is land. The town is located in a flat coastal plain and is surrounded by marshland and wetlands. The town is located near the mouth of the Maurice River, which is part of the Delaware Bay estuary.
Economy
The economy of Port Norris is largely based on fishing and oyster harvesting. The town is home to several oyster processing plants, which process the oysters for shipment to other parts of the country. The town is also home to a large fishing fleet, which supplies the local canneries with fish.
The town is also home to several small businesses, including restaurants, convenience stores, and a few small retail stores. The town is also home to a few small manufacturing plants, which produce a variety of products.
Demographics
As of the 2010 census, the population of Port Norris was 2,717. The racial makeup of the town was 79.3% White, 15.2% African American, 0.3% Native American, 0.7% Asian, 0.1% Pacific Islander, and 4.4% from other races. Hispanic or Latino of any race were 5.2% of the population.
The median household income in Port Norris was $37,917, and the median family income was $45,938. The per capita income for the town was $17,945. About 16.2% of families and 19.2% of the population were below the poverty line, including 28.3% of those under age 18 and 11.2% of those age 65 or over.
Common Questions
What is Per Capita Income in Port Norris?
Per Capita income in Port Norris is $39,461.
What is the Median Household income in Port Norris?
Median Household Income in Port Norris is $44,091.
What is Income or Wage Gap in Port Norris?
Income or Wage Gap in Port Norris is 50.2%.
Women in Port Norris earn 49.8 cents for every dollar earned by a man.
What is Inequality or Gini Index in Port Norris?
Inequality or Gini Index in Port Norris is 0.61.
What is the Total Population of Port Norris?
Total Population of Port Norris is 1,711.
What is the Total Male Population of Port Norris?
Total Male Population of Port Norris is 853.
What is the Total Female Population of Port Norris?
Total Female Population of Port Norris is 858.
What is the Ratio of Males per 100 Females in Port Norris?
There are 99.42 Males per 100 Females in Port Norris.
What is the Ratio of Females per 100 Males in Port Norris?
There are 100.59 Females per 100 Males in Port Norris.
What is the Median Population Age in Port Norris?
Median Population Age in Port Norris is 31.6 Years.
What is the Average Family Size in Port Norris
Average Family Size in Port Norris is 3.5 People.
What is the Average Household Size in Port Norris
Average Household Size in Port Norris is 2.9 People.
How Large is the Labor Force in Port Norris?
There are 798 People in the Labor Forcein in Port Norris.
What is the Percentage of People in the Labor Force in Port Norris?
62.6% of People are in the Labor Force in Port Norris.
What is the Unemployment Rate in Port Norris?
Unemployment Rate in Port Norris is 6.9%.