Zip Codes with the Highest Percentage of Population Employed in Security & Protection in Princeton, NJ
RELATED REPORTS & OPTIONS
Security & Protection
Princeton
Compare Zip Codes
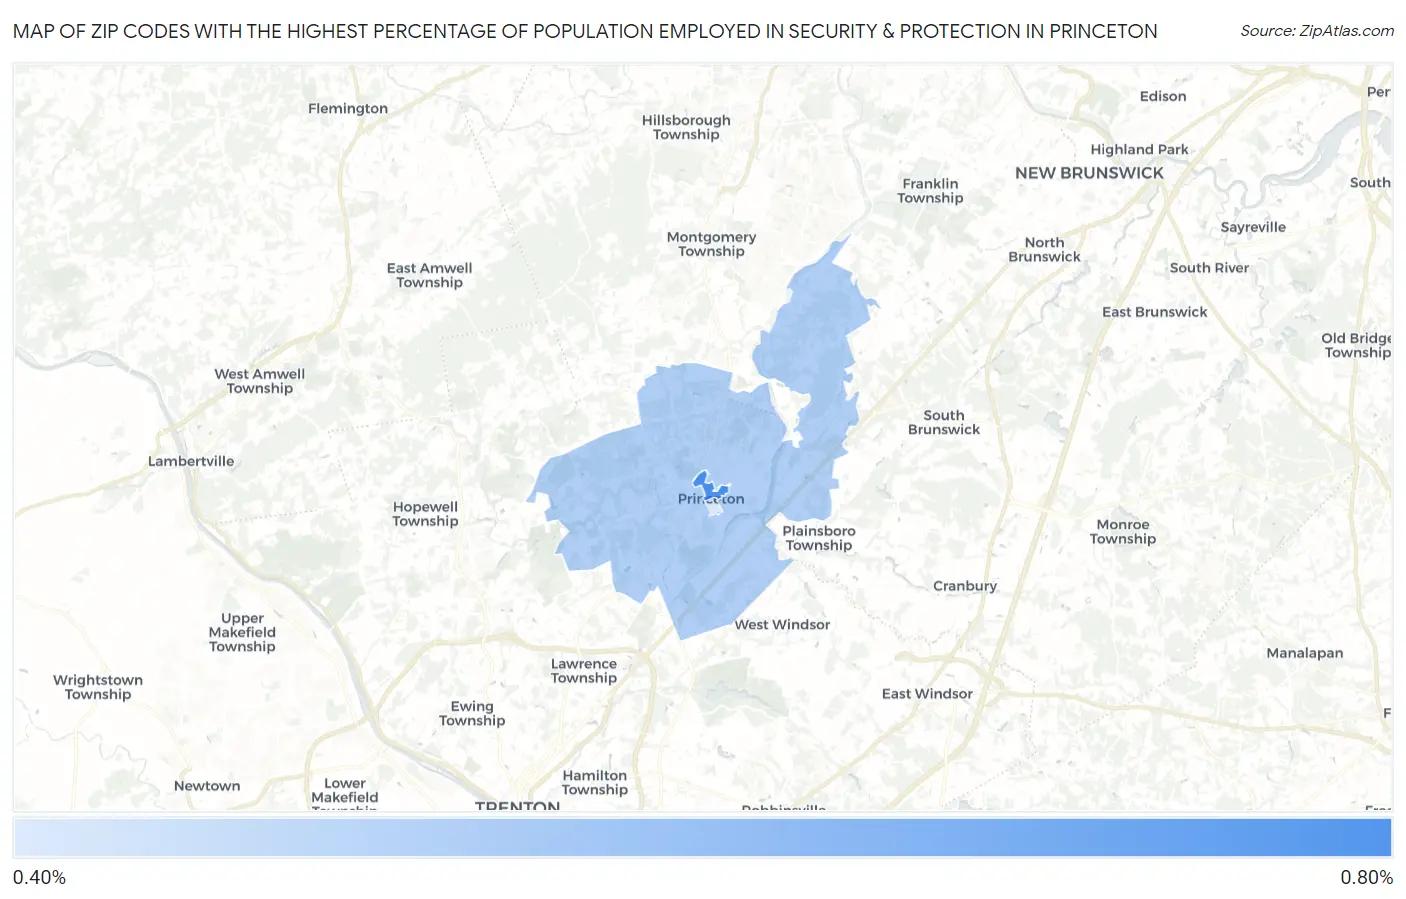
Map of Zip Codes with the Highest Percentage of Population Employed in Security & Protection in Princeton
0.44%
0.71%
Zip Codes with the Highest Percentage of Population Employed in Security & Protection in Princeton, NJ
| Zip Code | % Employed | vs State | vs National | |
| 1. | 08542 | 0.71% | 2.4%(-1.69)#495 | 2.1%(-1.44)#21,997 |
| 2. | 08540 | 0.52% | 2.4%(-1.89)#511 | 2.1%(-1.63)#23,148 |
| 3. | 08544 | 0.44% | 2.4%(-1.96)#515 | 2.1%(-1.71)#23,547 |
1
Common Questions
What are the Top Zip Codes with the Highest Percentage of Population Employed in Security & Protection in Princeton, NJ?
Top Zip Codes with the Highest Percentage of Population Employed in Security & Protection in Princeton, NJ are:
What zip code has the Highest Percentage of Population Employed in Security & Protection in Princeton, NJ?
08542 has the Highest Percentage of Population Employed in Security & Protection in Princeton, NJ with 0.71%.
What is the Percentage of Population Employed in Security & Protection in Princeton, NJ?
Percentage of Population Employed in Security & Protection in Princeton is 0.65%.
What is the Percentage of Population Employed in Security & Protection in New Jersey?
Percentage of Population Employed in Security & Protection in New Jersey is 2.4%.
What is the Percentage of Population Employed in Security & Protection in the United States?
Percentage of Population Employed in Security & Protection in the United States is 2.1%.