Zip Codes with the Highest Percentage of Population Employed in Security & Protection in New Jersey
RELATED REPORTS & OPTIONS
Security & Protection
New Jersey
Compare Zip Codes
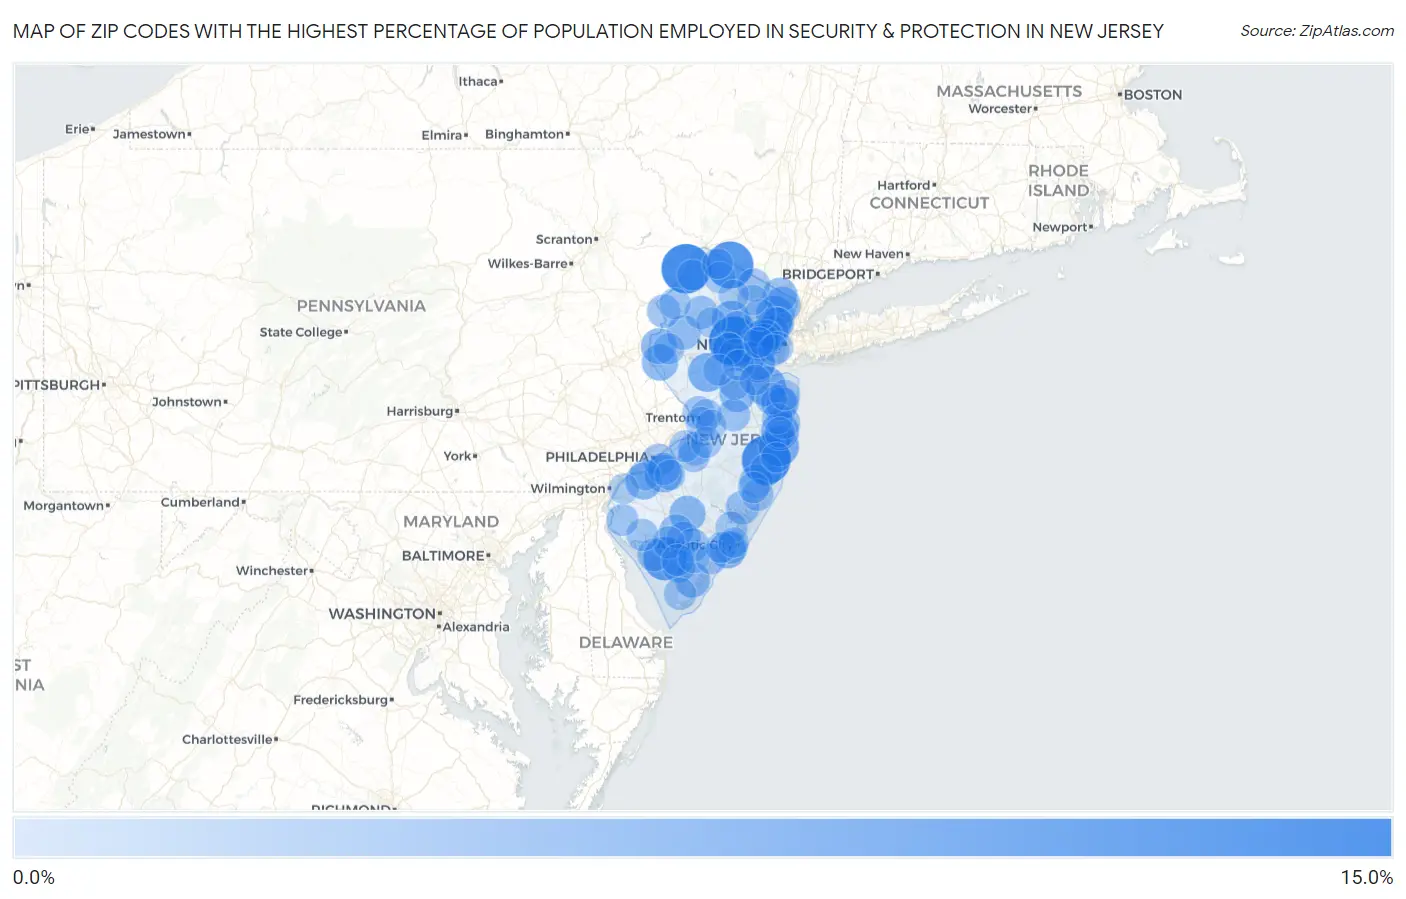
Map of Zip Codes with the Highest Percentage of Population Employed in Security & Protection in New Jersey
0.0%
15.0%
Zip Codes with the Highest Percentage of Population Employed in Security & Protection in New Jersey
| Zip Code | % Employed | vs State | vs National | |
| 1. | 07851 | 11.5% | 2.4%(+9.09)#1 | 2.1%(+9.35)#604 |
| 2. | 07935 | 11.4% | 2.4%(+9.03)#2 | 2.1%(+9.28)#609 |
| 3. | 08741 | 11.1% | 2.4%(+8.74)#3 | 2.1%(+8.99)#632 |
| 4. | 07418 | 10.5% | 2.4%(+8.06)#4 | 2.1%(+8.31)#712 |
| 5. | 08349 | 9.0% | 2.4%(+6.63)#5 | 2.1%(+6.89)#906 |
| 6. | 08738 | 7.8% | 2.4%(+5.38)#6 | 2.1%(+5.63)#1,246 |
| 7. | 07730 | 7.4% | 2.4%(+5.05)#7 | 2.1%(+5.30)#1,353 |
| 8. | 08821 | 7.1% | 2.4%(+4.72)#8 | 2.1%(+4.97)#1,483 |
| 9. | 07878 | 7.0% | 2.4%(+4.61)#9 | 2.1%(+4.86)#1,526 |
| 10. | 07663 | 6.9% | 2.4%(+4.51)#10 | 2.1%(+4.77)#1,572 |
| 11. | 08750 | 6.8% | 2.4%(+4.44)#11 | 2.1%(+4.69)#1,610 |
| 12. | 08029 | 6.7% | 2.4%(+4.26)#12 | 2.1%(+4.52)#1,697 |
| 13. | 08402 | 6.4% | 2.4%(+3.98)#13 | 2.1%(+4.23)#1,841 |
| 14. | 08056 | 6.3% | 2.4%(+3.88)#14 | 2.1%(+4.14)#1,907 |
| 15. | 07630 | 6.2% | 2.4%(+3.76)#15 | 2.1%(+4.02)#1,971 |
| 16. | 08848 | 6.1% | 2.4%(+3.71)#16 | 2.1%(+3.97)#2,002 |
| 17. | 08828 | 6.1% | 2.4%(+3.66)#17 | 2.1%(+3.91)#2,034 |
| 18. | 08346 | 6.0% | 2.4%(+3.64)#18 | 2.1%(+3.89)#2,056 |
| 19. | 07106 | 6.0% | 2.4%(+3.59)#19 | 2.1%(+3.85)#2,084 |
| 20. | 08886 | 6.0% | 2.4%(+3.57)#20 | 2.1%(+3.83)#2,094 |
| 21. | 07702 | 5.8% | 2.4%(+3.37)#21 | 2.1%(+3.63)#2,227 |
| 22. | 08210 | 5.7% | 2.4%(+3.32)#22 | 2.1%(+3.57)#2,269 |
| 23. | 07064 | 5.7% | 2.4%(+3.29)#23 | 2.1%(+3.54)#2,291 |
| 24. | 07031 | 5.6% | 2.4%(+3.23)#24 | 2.1%(+3.48)#2,347 |
| 25. | 07018 | 5.6% | 2.4%(+3.21)#25 | 2.1%(+3.46)#2,366 |
| 26. | 07112 | 5.6% | 2.4%(+3.17)#26 | 2.1%(+3.42)#2,394 |
| 27. | 07656 | 5.5% | 2.4%(+3.14)#27 | 2.1%(+3.39)#2,426 |
| 28. | 07865 | 5.4% | 2.4%(+3.01)#28 | 2.1%(+3.27)#2,525 |
| 29. | 07107 | 5.3% | 2.4%(+2.95)#29 | 2.1%(+3.20)#2,589 |
| 30. | 07075 | 5.3% | 2.4%(+2.90)#30 | 2.1%(+3.16)#2,637 |
| 31. | 07946 | 5.2% | 2.4%(+2.83)#31 | 2.1%(+3.08)#2,689 |
| 32. | 08340 | 5.2% | 2.4%(+2.80)#32 | 2.1%(+3.05)#2,713 |
| 33. | 08361 | 5.2% | 2.4%(+2.77)#33 | 2.1%(+3.02)#2,738 |
| 34. | 08087 | 5.2% | 2.4%(+2.77)#34 | 2.1%(+3.02)#2,743 |
| 35. | 08758 | 5.1% | 2.4%(+2.70)#35 | 2.1%(+2.95)#2,811 |
| 36. | 07832 | 5.0% | 2.4%(+2.64)#36 | 2.1%(+2.90)#2,874 |
| 37. | 07874 | 5.0% | 2.4%(+2.60)#37 | 2.1%(+2.85)#2,926 |
| 38. | 07981 | 5.0% | 2.4%(+2.59)#38 | 2.1%(+2.84)#2,936 |
| 39. | 08319 | 5.0% | 2.4%(+2.57)#39 | 2.1%(+2.82)#2,958 |
| 40. | 08314 | 5.0% | 2.4%(+2.55)#40 | 2.1%(+2.81)#2,977 |
| 41. | 08060 | 4.9% | 2.4%(+2.54)#41 | 2.1%(+2.79)#3,000 |
| 42. | 07717 | 4.9% | 2.4%(+2.47)#42 | 2.1%(+2.72)#3,076 |
| 43. | 07456 | 4.8% | 2.4%(+2.43)#43 | 2.1%(+2.68)#3,131 |
| 44. | 08345 | 4.8% | 2.4%(+2.43)#44 | 2.1%(+2.68)#3,139 |
| 45. | 07606 | 4.8% | 2.4%(+2.42)#45 | 2.1%(+2.68)#3,149 |
| 46. | 08535 | 4.8% | 2.4%(+2.41)#46 | 2.1%(+2.66)#3,172 |
| 47. | 08638 | 4.8% | 2.4%(+2.35)#47 | 2.1%(+2.60)#3,237 |
| 48. | 07104 | 4.7% | 2.4%(+2.32)#48 | 2.1%(+2.58)#3,265 |
| 49. | 07066 | 4.7% | 2.4%(+2.32)#49 | 2.1%(+2.57)#3,278 |
| 50. | 08103 | 4.7% | 2.4%(+2.31)#50 | 2.1%(+2.57)#3,281 |
| 51. | 07008 | 4.7% | 2.4%(+2.30)#51 | 2.1%(+2.55)#3,302 |
| 52. | 07757 | 4.7% | 2.4%(+2.29)#52 | 2.1%(+2.54)#3,312 |
| 53. | 08406 | 4.7% | 2.4%(+2.28)#53 | 2.1%(+2.54)#3,325 |
| 54. | 08734 | 4.7% | 2.4%(+2.27)#54 | 2.1%(+2.52)#3,344 |
| 55. | 08332 | 4.6% | 2.4%(+2.22)#55 | 2.1%(+2.47)#3,402 |
| 56. | 07069 | 4.6% | 2.4%(+2.20)#56 | 2.1%(+2.46)#3,423 |
| 57. | 08035 | 4.6% | 2.4%(+2.20)#57 | 2.1%(+2.45)#3,441 |
| 58. | 08251 | 4.6% | 2.4%(+2.19)#58 | 2.1%(+2.44)#3,458 |
| 59. | 07103 | 4.6% | 2.4%(+2.19)#59 | 2.1%(+2.44)#3,462 |
| 60. | 08302 | 4.5% | 2.4%(+2.14)#60 | 2.1%(+2.39)#3,542 |
| 61. | 08850 | 4.5% | 2.4%(+2.13)#61 | 2.1%(+2.39)#3,555 |
| 62. | 07980 | 4.5% | 2.4%(+2.10)#62 | 2.1%(+2.35)#3,609 |
| 63. | 08327 | 4.5% | 2.4%(+2.08)#63 | 2.1%(+2.34)#3,635 |
| 64. | 08619 | 4.5% | 2.4%(+2.06)#64 | 2.1%(+2.31)#3,665 |
| 65. | 08205 | 4.4% | 2.4%(+2.05)#65 | 2.1%(+2.30)#3,691 |
| 66. | 08048 | 4.4% | 2.4%(+2.04)#66 | 2.1%(+2.29)#3,706 |
| 67. | 08079 | 4.4% | 2.4%(+2.03)#67 | 2.1%(+2.28)#3,725 |
| 68. | 07305 | 4.4% | 2.4%(+2.01)#68 | 2.1%(+2.26)#3,760 |
| 69. | 08050 | 4.4% | 2.4%(+2.00)#69 | 2.1%(+2.25)#3,771 |
| 70. | 08046 | 4.4% | 2.4%(+1.97)#70 | 2.1%(+2.22)#3,823 |
| 71. | 08611 | 4.3% | 2.4%(+1.92)#71 | 2.1%(+2.17)#3,907 |
| 72. | 08835 | 4.3% | 2.4%(+1.87)#72 | 2.1%(+2.13)#3,987 |
| 73. | 08005 | 4.3% | 2.4%(+1.87)#73 | 2.1%(+2.12)#3,992 |
| 74. | 07738 | 4.3% | 2.4%(+1.86)#74 | 2.1%(+2.11)#4,005 |
| 75. | 07512 | 4.3% | 2.4%(+1.85)#75 | 2.1%(+2.10)#4,023 |
| 76. | 07002 | 4.2% | 2.4%(+1.81)#76 | 2.1%(+2.07)#4,097 |
| 77. | 07825 | 4.2% | 2.4%(+1.79)#77 | 2.1%(+2.04)#4,132 |
| 78. | 08270 | 4.2% | 2.4%(+1.79)#78 | 2.1%(+2.04)#4,142 |
| 79. | 08802 | 4.2% | 2.4%(+1.77)#79 | 2.1%(+2.02)#4,177 |
| 80. | 07419 | 4.1% | 2.4%(+1.74)#80 | 2.1%(+2.00)#4,220 |
| 81. | 08223 | 4.1% | 2.4%(+1.74)#81 | 2.1%(+2.00)#4,221 |
| 82. | 08221 | 4.1% | 2.4%(+1.70)#82 | 2.1%(+1.95)#4,293 |
| 83. | 08066 | 4.1% | 2.4%(+1.70)#83 | 2.1%(+1.95)#4,294 |
| 84. | 07753 | 4.1% | 2.4%(+1.68)#84 | 2.1%(+1.94)#4,330 |
| 85. | 08022 | 4.1% | 2.4%(+1.67)#85 | 2.1%(+1.93)#4,350 |
| 86. | 07080 | 4.1% | 2.4%(+1.67)#86 | 2.1%(+1.92)#4,357 |
| 87. | 07111 | 4.0% | 2.4%(+1.62)#87 | 2.1%(+1.87)#4,451 |
| 88. | 07826 | 4.0% | 2.4%(+1.60)#88 | 2.1%(+1.85)#4,495 |
| 89. | 08736 | 4.0% | 2.4%(+1.58)#89 | 2.1%(+1.84)#4,524 |
| 90. | 07442 | 4.0% | 2.4%(+1.58)#90 | 2.1%(+1.83)#4,531 |
| 91. | 08620 | 4.0% | 2.4%(+1.56)#91 | 2.1%(+1.82)#4,563 |
| 92. | 07760 | 4.0% | 2.4%(+1.56)#92 | 2.1%(+1.81)#4,569 |
| 93. | 07461 | 3.9% | 2.4%(+1.54)#93 | 2.1%(+1.80)#4,598 |
| 94. | 08879 | 3.9% | 2.4%(+1.49)#94 | 2.1%(+1.75)#4,691 |
| 95. | 07435 | 3.9% | 2.4%(+1.46)#95 | 2.1%(+1.72)#4,760 |
| 96. | 08084 | 3.9% | 2.4%(+1.46)#96 | 2.1%(+1.71)#4,773 |
| 97. | 08067 | 3.8% | 2.4%(+1.43)#97 | 2.1%(+1.68)#4,843 |
| 98. | 08401 | 3.8% | 2.4%(+1.40)#98 | 2.1%(+1.66)#4,893 |
| 99. | 07876 | 3.8% | 2.4%(+1.40)#99 | 2.1%(+1.65)#4,901 |
| 100. | 08751 | 3.8% | 2.4%(+1.39)#100 | 2.1%(+1.65)#4,921 |
Common Questions
What are the Top 10 Zip Codes with the Highest Percentage of Population Employed in Security & Protection in New Jersey?
Top 10 Zip Codes with the Highest Percentage of Population Employed in Security & Protection in New Jersey are:
What zip code has the Highest Percentage of Population Employed in Security & Protection in New Jersey?
07851 has the Highest Percentage of Population Employed in Security & Protection in New Jersey with 11.5%.
What is the Percentage of Population Employed in Security & Protection in the State of New Jersey?
Percentage of Population Employed in Security & Protection in New Jersey is 2.4%.
What is the Percentage of Population Employed in Security & Protection in the United States?
Percentage of Population Employed in Security & Protection in the United States is 2.1%.