Collings Lakes, NJ Map & Demographics
Collings Lakes Map
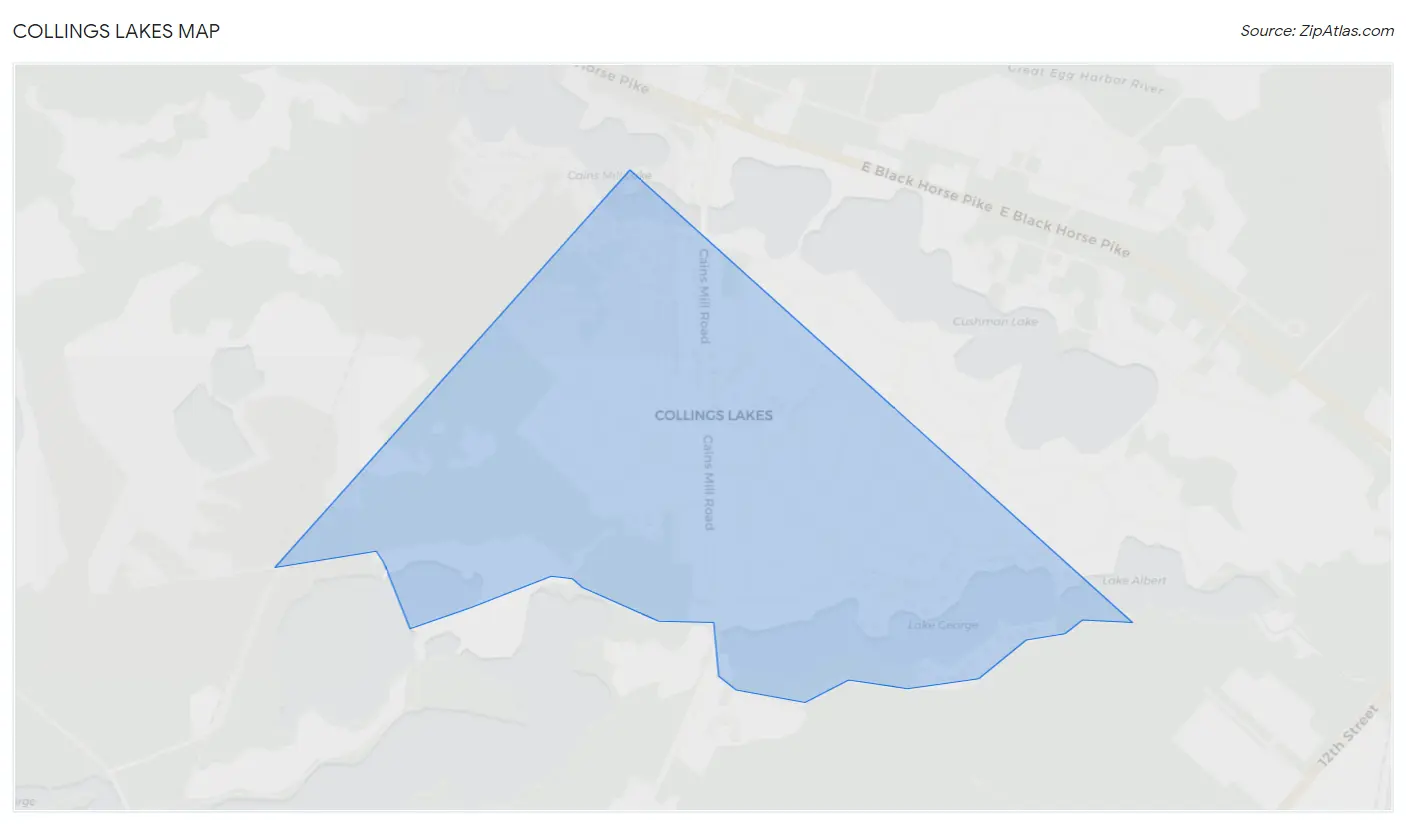
Collings Lakes Overview
$29,615
PER CAPITA INCOME
$82,961
AVG FAMILY INCOME
$84,265
AVG HOUSEHOLD INCOME
67.8%
WAGE / INCOME GAP [ % ]
32.2¢/ $1
WAGE / INCOME GAP [ $ ]
0.29
INEQUALITY / GINI INDEX
2,111
TOTAL POPULATION
1,000
MALE POPULATION
1,111
FEMALE POPULATION
90.01
MALES / 100 FEMALES
111.10
FEMALES / 100 MALES
29.1
MEDIAN AGE
3.3
AVG FAMILY SIZE
3.3
AVG HOUSEHOLD SIZE
1,160
LABOR FORCE [ PEOPLE ]
70.0%
PERCENT IN LABOR FORCE
5.2%
UNEMPLOYMENT RATE
Income in Collings Lakes
Income Overview in Collings Lakes
Per Capita Income in Collings Lakes is $29,615, while median incomes of families and households are $82,961 and $84,265 respectively.
| Characteristic | Number | Measure |
| Per Capita Income | 2,111 | $29,615 |
| Median Family Income | 623 | $82,961 |
| Mean Family Income | 623 | $96,128 |
| Median Household Income | 640 | $84,265 |
| Mean Household Income | 640 | $96,868 |
| Income Deficit | 623 | $0 |
| Wage / Income Gap (%) | 2,111 | 67.83% |
| Wage / Income Gap ($) | 2,111 | 32.17¢ per $1 |
| Gini / Inequality Index | 2,111 | 0.29 |
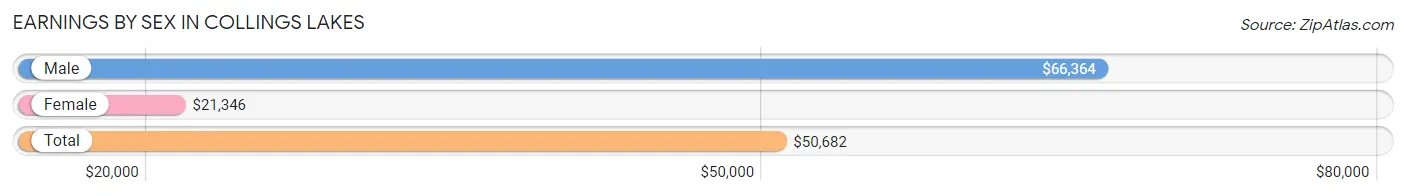
Earnings by Sex in Collings Lakes
Average Earnings in Collings Lakes are $50,682, $66,364 for men and $21,346 for women, a difference of 67.8%.
| Sex | Number | Average Earnings |
| Male | 582 (48.7%) | $66,364 |
| Female | 612 (51.3%) | $21,346 |
| Total | 1,194 (100.0%) | $50,682 |
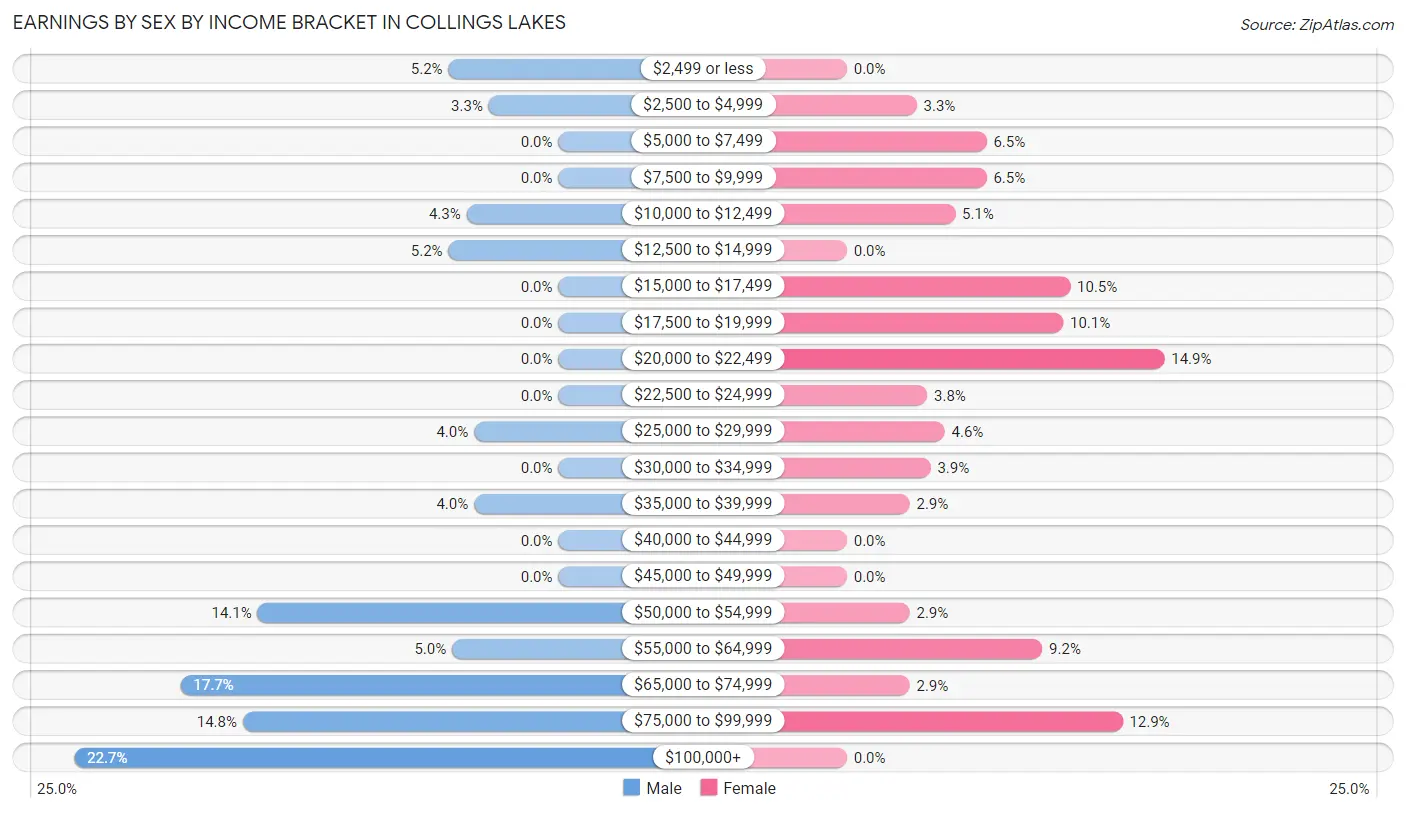
Earnings by Sex by Income Bracket in Collings Lakes
The most common earnings brackets in Collings Lakes are $100,000+ for men (132 | 22.7%) and $20,000 to $22,499 for women (91 | 14.9%).
| Income | Male | Female |
| $2,499 or less | 30 (5.1%) | 0 (0.0%) |
| $2,500 to $4,999 | 19 (3.3%) | 20 (3.3%) |
| $5,000 to $7,499 | 0 (0.0%) | 40 (6.5%) |
| $7,500 to $9,999 | 0 (0.0%) | 40 (6.5%) |
| $10,000 to $12,499 | 25 (4.3%) | 31 (5.1%) |
| $12,500 to $14,999 | 30 (5.1%) | 0 (0.0%) |
| $15,000 to $17,499 | 0 (0.0%) | 64 (10.5%) |
| $17,500 to $19,999 | 0 (0.0%) | 62 (10.1%) |
| $20,000 to $22,499 | 0 (0.0%) | 91 (14.9%) |
| $22,500 to $24,999 | 0 (0.0%) | 23 (3.8%) |
| $25,000 to $29,999 | 23 (4.0%) | 28 (4.6%) |
| $30,000 to $34,999 | 0 (0.0%) | 24 (3.9%) |
| $35,000 to $39,999 | 23 (4.0%) | 18 (2.9%) |
| $40,000 to $44,999 | 0 (0.0%) | 0 (0.0%) |
| $45,000 to $49,999 | 0 (0.0%) | 0 (0.0%) |
| $50,000 to $54,999 | 82 (14.1%) | 18 (2.9%) |
| $55,000 to $64,999 | 29 (5.0%) | 56 (9.1%) |
| $65,000 to $74,999 | 103 (17.7%) | 18 (2.9%) |
| $75,000 to $99,999 | 86 (14.8%) | 79 (12.9%) |
| $100,000+ | 132 (22.7%) | 0 (0.0%) |
| Total | 582 (100.0%) | 612 (100.0%) |
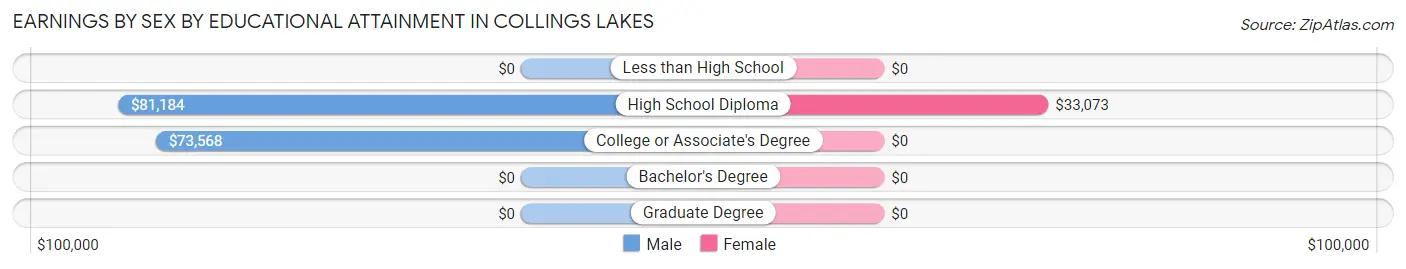
Earnings by Sex by Educational Attainment in Collings Lakes
Average earnings in Collings Lakes are $73,229 for men and $26,813 for women, a difference of 63.4%. Men with an educational attainment of high school diploma enjoy the highest average annual earnings of $81,184, while those with college or associate's degree education earn the least with $73,568. Women with an educational attainment of high school diploma earn the most with the average annual earnings of $33,073, while those with high school diploma education have the smallest earnings of $33,073.
| Educational Attainment | Male Income | Female Income |
| Less than High School | - | - |
| High School Diploma | $81,184 | $33,073 |
| College or Associate's Degree | $73,568 | $0 |
| Bachelor's Degree | - | - |
| Graduate Degree | - | - |
| Total | $73,229 | $26,813 |
Family Income in Collings Lakes
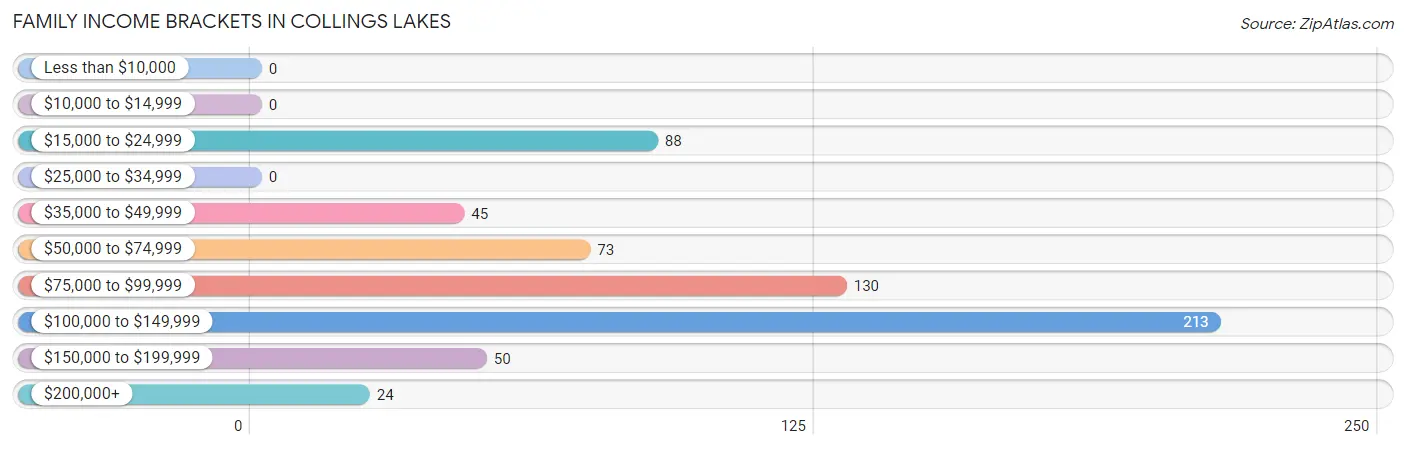
Family Income Brackets in Collings Lakes
According to the Collings Lakes family income data, there are 213 families falling into the $100,000 to $149,999 income range, which is the most common income bracket and makes up 34.2% of all families.
| Income Bracket | # Families | % Families |
| Less than $10,000 | 0 | 0.0% |
| $10,000 to $14,999 | 0 | 0.0% |
| $15,000 to $24,999 | 88 | 14.1% |
| $25,000 to $34,999 | 0 | 0.0% |
| $35,000 to $49,999 | 45 | 7.2% |
| $50,000 to $74,999 | 73 | 11.7% |
| $75,000 to $99,999 | 130 | 20.9% |
| $100,000 to $149,999 | 213 | 34.2% |
| $150,000 to $199,999 | 50 | 8.0% |
| $200,000+ | 24 | 3.9% |
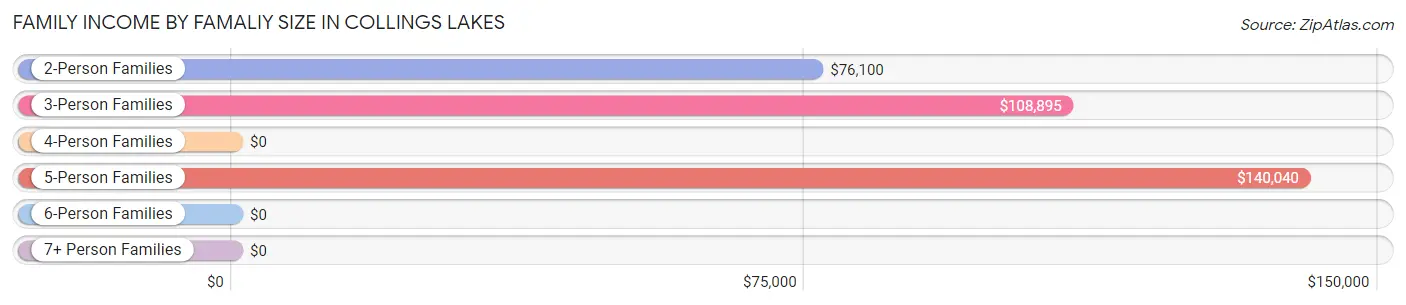
Family Income by Famaliy Size in Collings Lakes
5-person families (122 | 19.6%) account for the highest median family income in Collings Lakes with $140,040 per family, while 2-person families (188 | 30.2%) have the highest median income of $38,050 per family member.
| Income Bracket | # Families | Median Income |
| 2-Person Families | 188 (30.2%) | $76,100 |
| 3-Person Families | 160 (25.7%) | $108,895 |
| 4-Person Families | 153 (24.6%) | $0 |
| 5-Person Families | 122 (19.6%) | $140,040 |
| 6-Person Families | 0 (0.0%) | $0 |
| 7+ Person Families | 0 (0.0%) | $0 |
| Total | 623 (100.0%) | $82,961 |
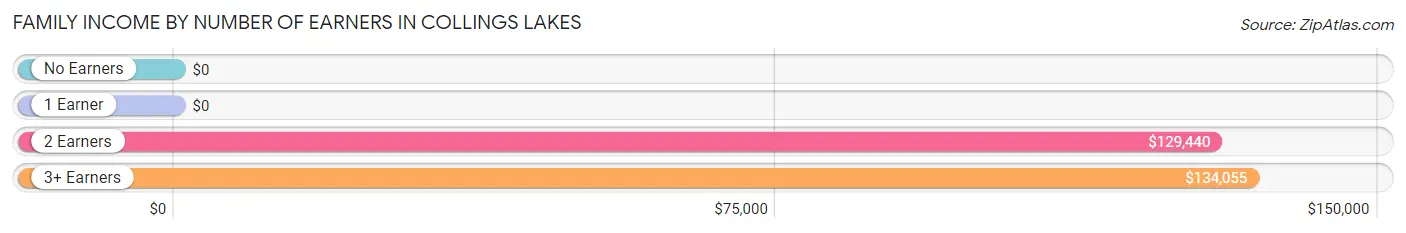
Family Income by Number of Earners in Collings Lakes
| Number of Earners | # Families | Median Income |
| No Earners | 47 (7.5%) | $0 |
| 1 Earner | 220 (35.3%) | $0 |
| 2 Earners | 177 (28.4%) | $129,440 |
| 3+ Earners | 179 (28.7%) | $134,055 |
| Total | 623 (100.0%) | $82,961 |
Household Income in Collings Lakes
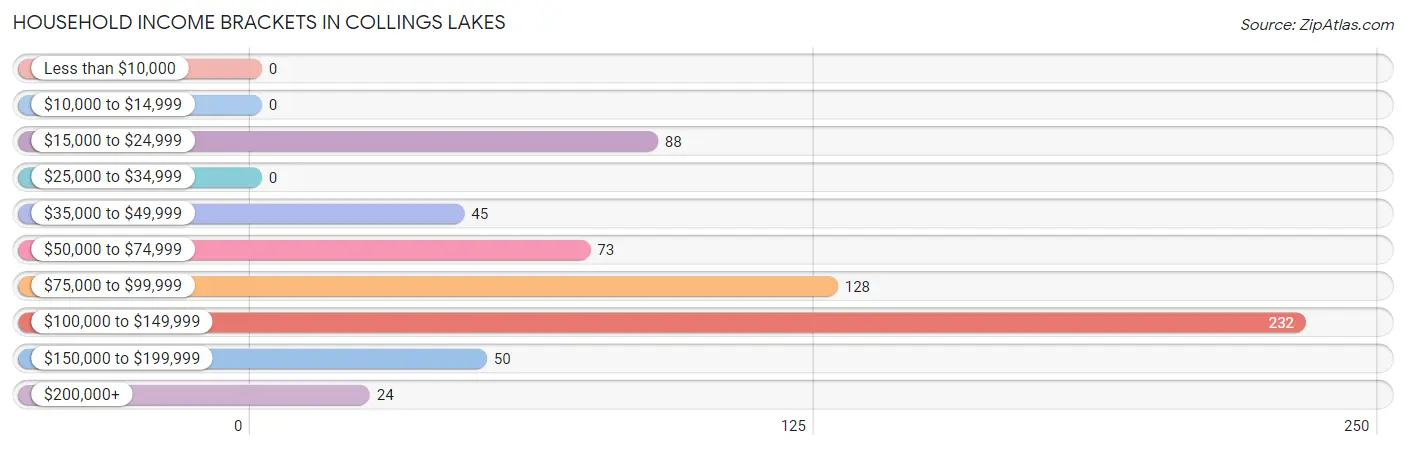
Household Income Brackets in Collings Lakes
With 232 households falling in the category, the $100,000 to $149,999 income range is the most frequent in Collings Lakes, accounting for 36.2% of all households.
| Income Bracket | # Households | % Households |
| Less than $10,000 | 0 | 0.0% |
| $10,000 to $14,999 | 0 | 0.0% |
| $15,000 to $24,999 | 88 | 13.8% |
| $25,000 to $34,999 | 0 | 0.0% |
| $35,000 to $49,999 | 45 | 7.0% |
| $50,000 to $74,999 | 73 | 11.4% |
| $75,000 to $99,999 | 128 | 20.0% |
| $100,000 to $149,999 | 232 | 36.3% |
| $150,000 to $199,999 | 50 | 7.8% |
| $200,000+ | 24 | 3.8% |
Household Income by Householder Age in Collings Lakes
The median household income in Collings Lakes is $84,265, with the highest median household income of $80,263 found in the 45 to 64 years age bracket for the primary householder. A total of 288 households (45.0%) fall into this category. Meanwhile, the 15 to 24 years age bracket for the primary householder has the lowest median household income of $0, with 29 households (4.5%) in this group.
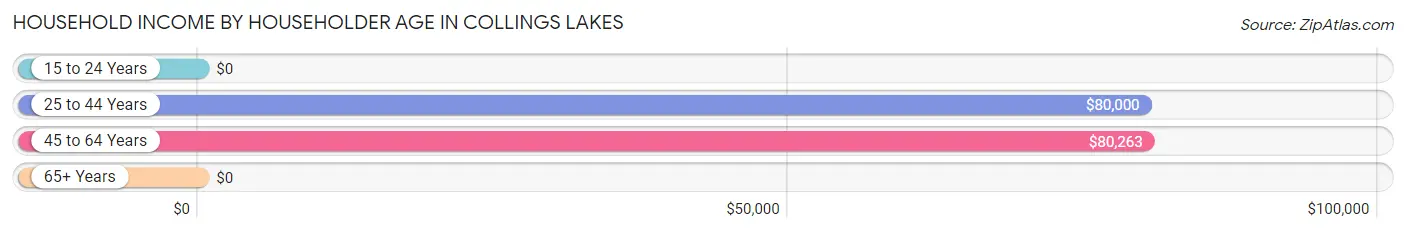
| Income Bracket | # Households | Median Income |
| 15 to 24 Years | 29 (4.5%) | $0 |
| 25 to 44 Years | 294 (45.9%) | $80,000 |
| 45 to 64 Years | 288 (45.0%) | $80,263 |
| 65+ Years | 29 (4.5%) | $0 |
| Total | 640 (100.0%) | $84,265 |
Poverty in Collings Lakes
Income Below Poverty by Sex and Age in Collings Lakes
With 7.6% poverty level for males and 9.7% for females among the residents of Collings Lakes, under 5 year old males and 6 to 11 year old females are the most vulnerable to poverty, with 41 males (51.2%) and 44 females (62.0%) in their respective age groups living below the poverty level.
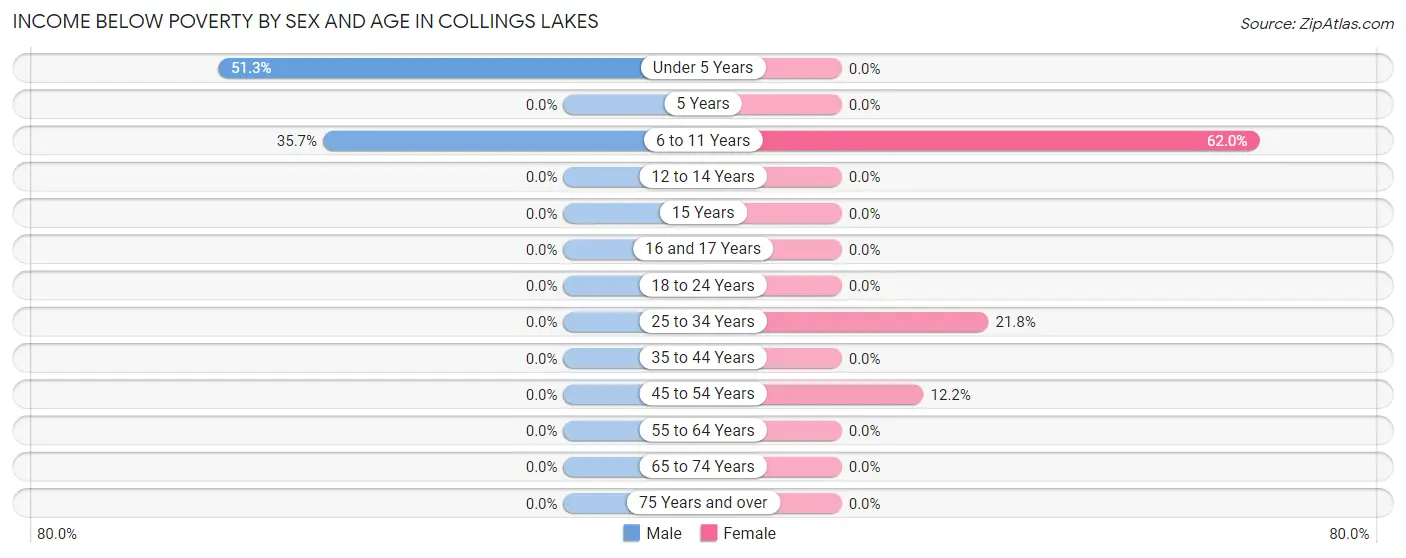
| Age Bracket | Male | Female |
| Under 5 Years | 41 (51.2%) | 0 (0.0%) |
| 5 Years | 0 (0.0%) | 0 (0.0%) |
| 6 to 11 Years | 35 (35.7%) | 44 (62.0%) |
| 12 to 14 Years | 0 (0.0%) | 0 (0.0%) |
| 15 Years | 0 (0.0%) | 0 (0.0%) |
| 16 and 17 Years | 0 (0.0%) | 0 (0.0%) |
| 18 to 24 Years | 0 (0.0%) | 0 (0.0%) |
| 25 to 34 Years | 0 (0.0%) | 34 (21.8%) |
| 35 to 44 Years | 0 (0.0%) | 0 (0.0%) |
| 45 to 54 Years | 0 (0.0%) | 30 (12.1%) |
| 55 to 64 Years | 0 (0.0%) | 0 (0.0%) |
| 65 to 74 Years | 0 (0.0%) | 0 (0.0%) |
| 75 Years and over | 0 (0.0%) | 0 (0.0%) |
| Total | 76 (7.6%) | 108 (9.7%) |
Income Above Poverty by Sex and Age in Collings Lakes
According to the poverty statistics in Collings Lakes, males aged 5 years and females aged under 5 years are the age groups that are most secure financially, with 100.0% of males and 100.0% of females in these age groups living above the poverty line.
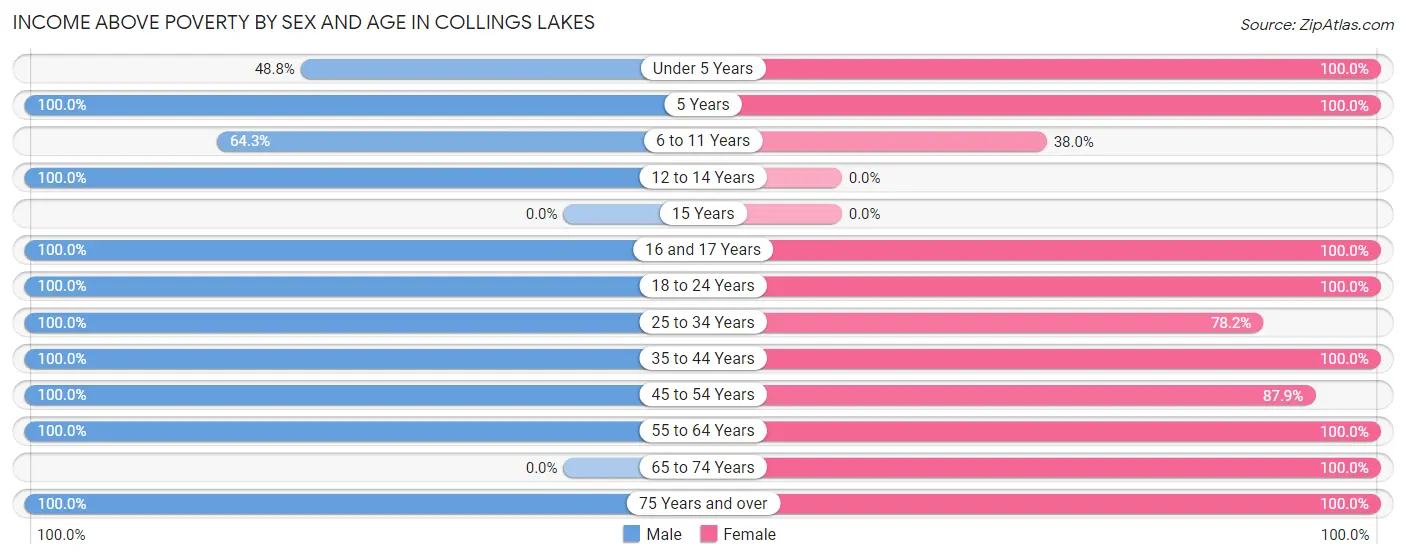
| Age Bracket | Male | Female |
| Under 5 Years | 39 (48.7%) | 131 (100.0%) |
| 5 Years | 24 (100.0%) | 38 (100.0%) |
| 6 to 11 Years | 63 (64.3%) | 27 (38.0%) |
| 12 to 14 Years | 12 (100.0%) | 0 (0.0%) |
| 15 Years | 0 (0.0%) | 0 (0.0%) |
| 16 and 17 Years | 83 (100.0%) | 82 (100.0%) |
| 18 to 24 Years | 109 (100.0%) | 177 (100.0%) |
| 25 to 34 Years | 273 (100.0%) | 122 (78.2%) |
| 35 to 44 Years | 27 (100.0%) | 85 (100.0%) |
| 45 to 54 Years | 195 (100.0%) | 217 (87.8%) |
| 55 to 64 Years | 76 (100.0%) | 58 (100.0%) |
| 65 to 74 Years | 0 (0.0%) | 46 (100.0%) |
| 75 Years and over | 23 (100.0%) | 20 (100.0%) |
| Total | 924 (92.4%) | 1,003 (90.3%) |
Income Below Poverty Among Married-Couple Families in Collings Lakes
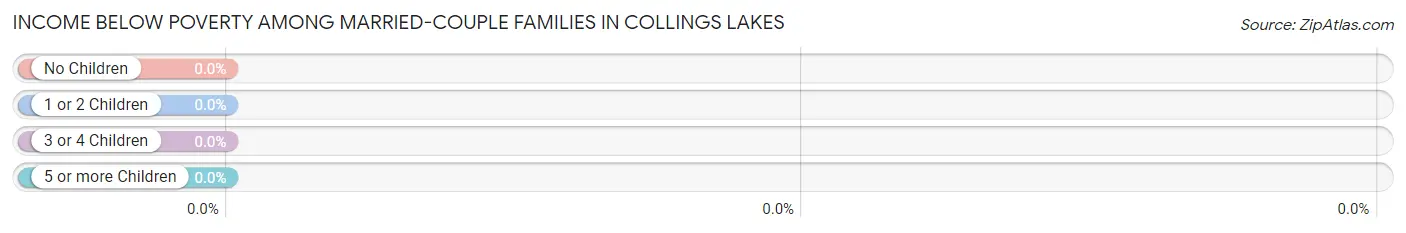
| Children | Above Poverty | Below Poverty |
| No Children | 203 (100.0%) | 0 (0.0%) |
| 1 or 2 Children | 148 (100.0%) | 0 (0.0%) |
| 3 or 4 Children | 62 (100.0%) | 0 (0.0%) |
| 5 or more Children | 0 (0.0%) | 0 (0.0%) |
| Total | 413 (100.0%) | 0 (0.0%) |
Income Below Poverty Among Single-Parent Households in Collings Lakes
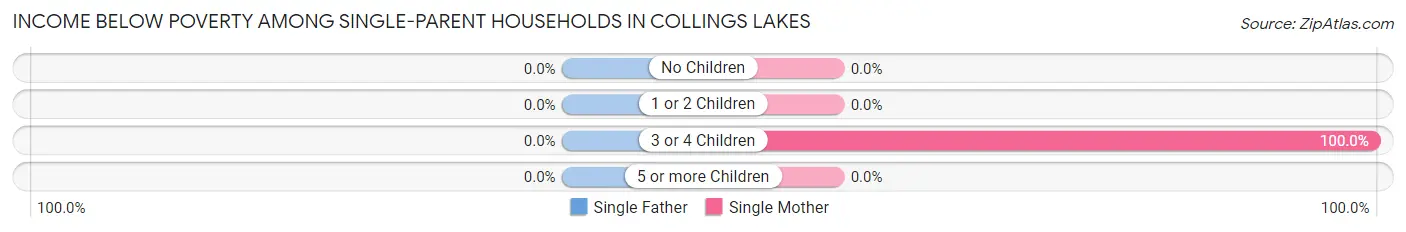
| Children | Single Father | Single Mother |
| No Children | 0 (0.0%) | 0 (0.0%) |
| 1 or 2 Children | 0 (0.0%) | 0 (0.0%) |
| 3 or 4 Children | 0 (0.0%) | 34 (100.0%) |
| 5 or more Children | 0 (0.0%) | 0 (0.0%) |
| Total | 0 (0.0%) | 34 (24.1%) |
Income Below Poverty Among Married-Couple vs Single-Parent Households in Collings Lakes
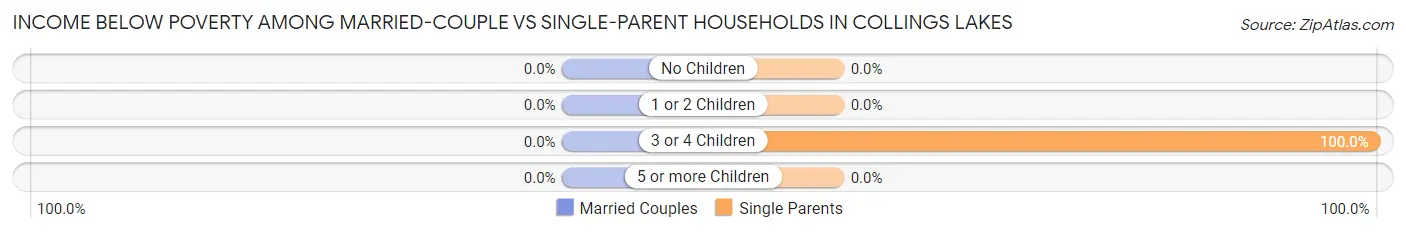
| Children | Married-Couple Families | Single-Parent Households |
| No Children | 0 (0.0%) | 0 (0.0%) |
| 1 or 2 Children | 0 (0.0%) | 0 (0.0%) |
| 3 or 4 Children | 0 (0.0%) | 34 (100.0%) |
| 5 or more Children | 0 (0.0%) | 0 (0.0%) |
| Total | 0 (0.0%) | 34 (16.2%) |
Race in Collings Lakes
The most populous races in Collings Lakes are White / Caucasian (1,750 | 82.9%), Hispanic or Latino (522 | 24.7%), and Two or more Races (210 | 10.0%).
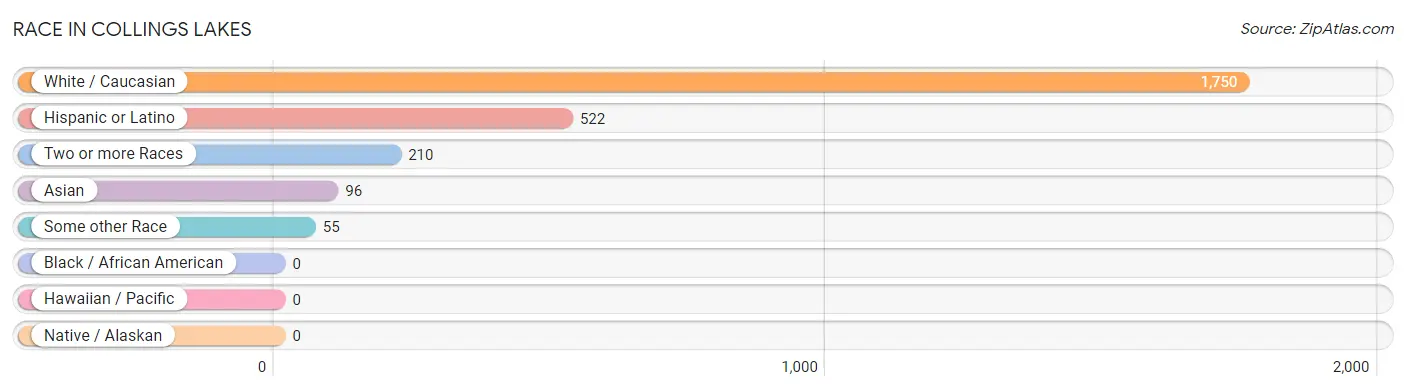
| Race | # Population | % Population |
| Asian | 96 | 4.5% |
| Black / African American | 0 | 0.0% |
| Hawaiian / Pacific | 0 | 0.0% |
| Hispanic or Latino | 522 | 24.7% |
| Native / Alaskan | 0 | 0.0% |
| White / Caucasian | 1,750 | 82.9% |
| Two or more Races | 210 | 10.0% |
| Some other Race | 55 | 2.6% |
| Total | 2,111 | 100.0% |
Ancestry in Collings Lakes
The most populous ancestries reported in Collings Lakes are Italian (846 | 40.1%), Irish (628 | 29.7%), Puerto Rican (522 | 24.7%), German (493 | 23.4%), and English (306 | 14.5%), together accounting for 132.4% of all Collings Lakes residents.
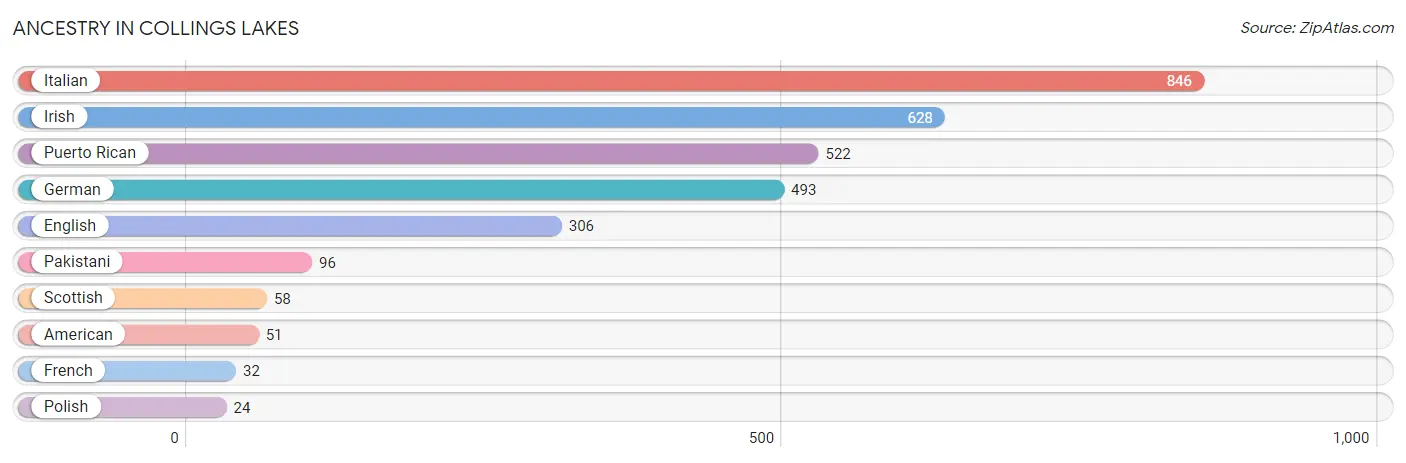
| Ancestry | # Population | % Population |
| American | 51 | 2.4% |
| English | 306 | 14.5% |
| French | 32 | 1.5% |
| German | 493 | 23.4% |
| Irish | 628 | 29.7% |
| Italian | 846 | 40.1% |
| Pakistani | 96 | 4.5% |
| Polish | 24 | 1.1% |
| Puerto Rican | 522 | 24.7% |
| Scottish | 58 | 2.8% | View All 10 Rows |
Immigrants in Collings Lakes
The most numerous immigrant groups reported in Collings Lakes came from , and Canada (8 | 0.4%), together accounting for 0.4% of all Collings Lakes residents.

| Immigration Origin | # Population | % Population |
| Canada | 8 | 0.4% | View All 1 Rows |
Sex and Age in Collings Lakes
Sex and Age in Collings Lakes
The most populous age groups in Collings Lakes are 30 to 34 Years (138 | 13.8%) for men and 50 to 54 Years (174 | 15.7%) for women.
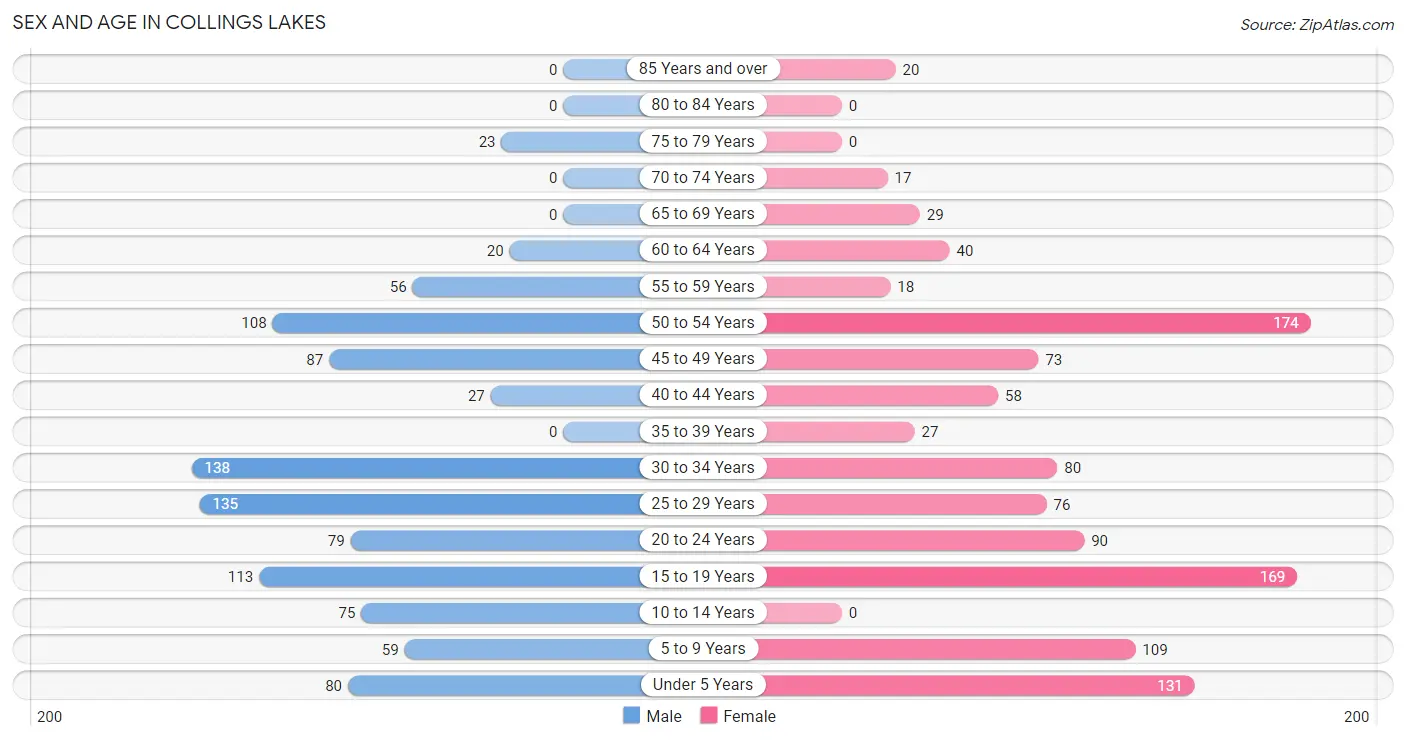
| Age Bracket | Male | Female |
| Under 5 Years | 80 (8.0%) | 131 (11.8%) |
| 5 to 9 Years | 59 (5.9%) | 109 (9.8%) |
| 10 to 14 Years | 75 (7.5%) | 0 (0.0%) |
| 15 to 19 Years | 113 (11.3%) | 169 (15.2%) |
| 20 to 24 Years | 79 (7.9%) | 90 (8.1%) |
| 25 to 29 Years | 135 (13.5%) | 76 (6.8%) |
| 30 to 34 Years | 138 (13.8%) | 80 (7.2%) |
| 35 to 39 Years | 0 (0.0%) | 27 (2.4%) |
| 40 to 44 Years | 27 (2.7%) | 58 (5.2%) |
| 45 to 49 Years | 87 (8.7%) | 73 (6.6%) |
| 50 to 54 Years | 108 (10.8%) | 174 (15.7%) |
| 55 to 59 Years | 56 (5.6%) | 18 (1.6%) |
| 60 to 64 Years | 20 (2.0%) | 40 (3.6%) |
| 65 to 69 Years | 0 (0.0%) | 29 (2.6%) |
| 70 to 74 Years | 0 (0.0%) | 17 (1.5%) |
| 75 to 79 Years | 23 (2.3%) | 0 (0.0%) |
| 80 to 84 Years | 0 (0.0%) | 0 (0.0%) |
| 85 Years and over | 0 (0.0%) | 20 (1.8%) |
| Total | 1,000 (100.0%) | 1,111 (100.0%) |
Families and Households in Collings Lakes
Median Family Size in Collings Lakes
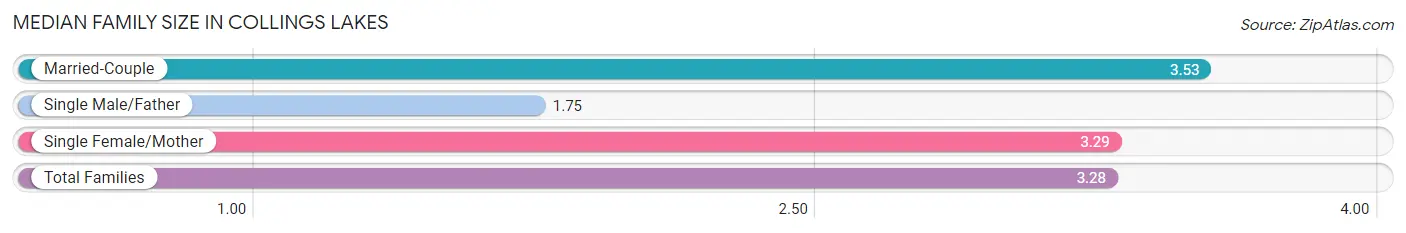
The median family size in Collings Lakes is 3.28 persons per family, with married-couple families (413 | 66.3%) accounting for the largest median family size of 3.53 persons per family. On the other hand, single male/father families (69 | 11.1%) represent the smallest median family size with 1.75 persons per family.
| Family Type | # Families | Family Size |
| Married-Couple | 413 (66.3%) | 3.53 |
| Single Male/Father | 69 (11.1%) | 1.75 |
| Single Female/Mother | 141 (22.6%) | 3.29 |
| Total Families | 623 (100.0%) | 3.28 |
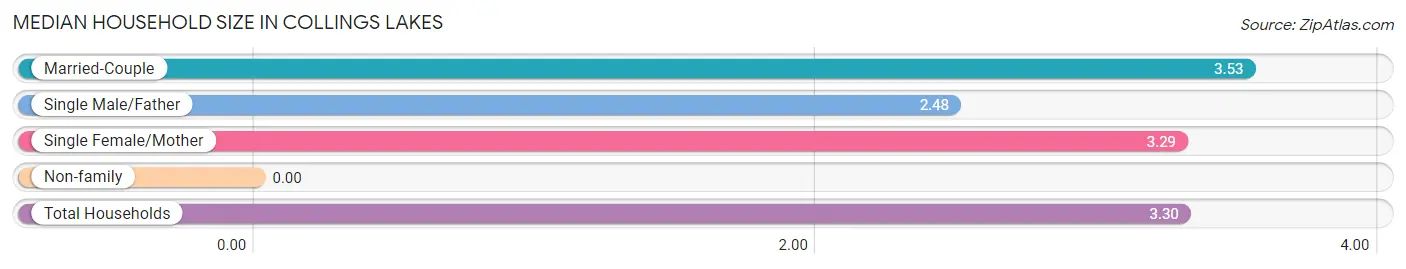
Median Household Size in Collings Lakes
| Household Type | # Households | Household Size |
| Married-Couple | 413 (64.5%) | 3.53 |
| Single Male/Father | 69 (10.8%) | 2.48 |
| Single Female/Mother | 141 (22.0%) | 3.29 |
| Non-family | 17 (2.7%) | - |
| Total Households | 640 (100.0%) | 3.30 |
Household Size by Marriage Status in Collings Lakes
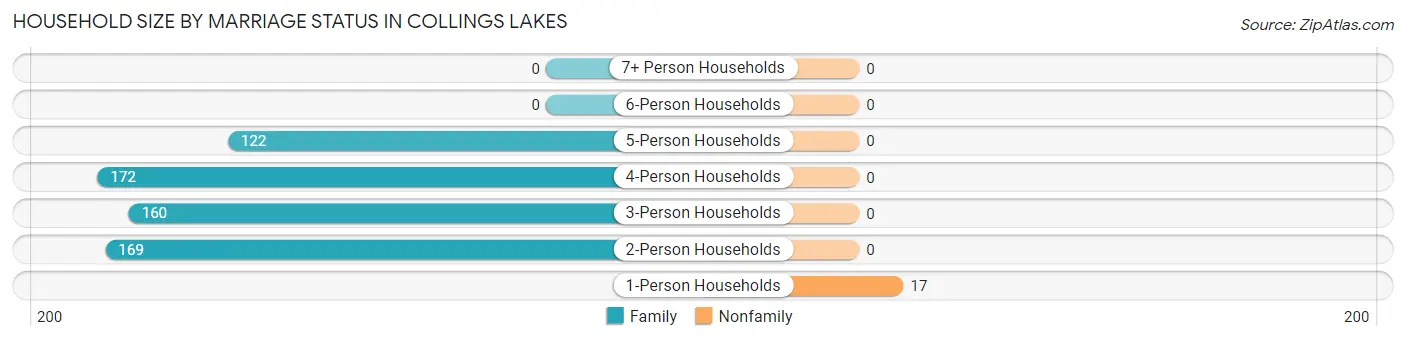
Out of a total of 640 households in Collings Lakes, 623 (97.3%) are family households, while 17 (2.7%) are nonfamily households. The most numerous type of family households are 4-person households, comprising 172, and the most common type of nonfamily households are 1-person households, comprising 17.
| Household Size | Family Households | Nonfamily Households |
| 1-Person Households | - | 17 (2.7%) |
| 2-Person Households | 169 (26.4%) | 0 (0.0%) |
| 3-Person Households | 160 (25.0%) | 0 (0.0%) |
| 4-Person Households | 172 (26.9%) | 0 (0.0%) |
| 5-Person Households | 122 (19.1%) | 0 (0.0%) |
| 6-Person Households | 0 (0.0%) | 0 (0.0%) |
| 7+ Person Households | 0 (0.0%) | 0 (0.0%) |
| Total | 623 (97.3%) | 17 (2.7%) |
Female Fertility in Collings Lakes
Fertility by Age in Collings Lakes
Average fertility rate in Collings Lakes is 155.0 births per 1,000 women. Women in the age bracket of 20 to 34 years have the highest fertility rate with 252.0 births per 1,000 women. Women in the age bracket of 20 to 34 years acount for 69.7% of all women with births.
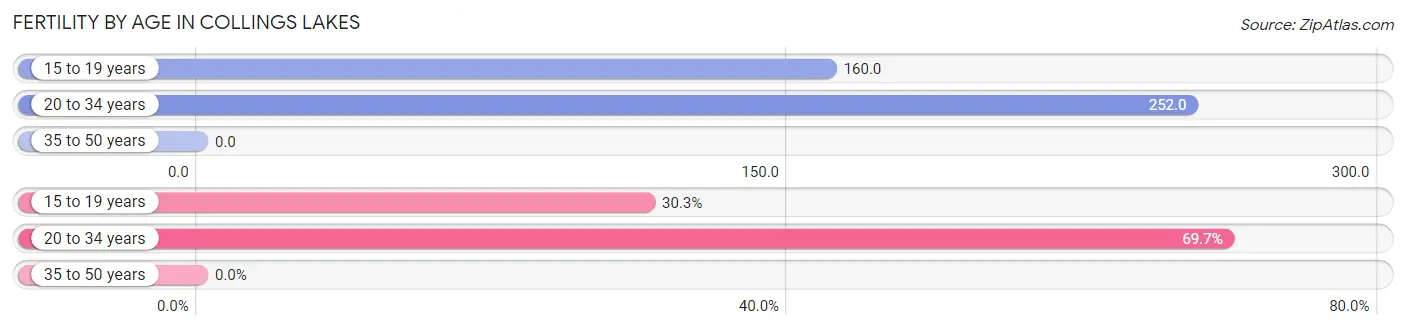
| Age Bracket | Women with Births | Births / 1,000 Women |
| 15 to 19 years | 27 (30.3%) | 160.0 |
| 20 to 34 years | 62 (69.7%) | 252.0 |
| 35 to 50 years | 0 (0.0%) | 0.0 |
| Total | 89 (100.0%) | 155.0 |
Fertility by Age by Marriage Status in Collings Lakes
69.7% of women with births (89) in Collings Lakes are married. The highest percentage of unmarried women with births falls into 15 to 19 years age bracket with 100.0% of them unmarried at the time of birth, while the lowest percentage of unmarried women with births belong to 20 to 34 years age bracket with 0.0% of them unmarried.
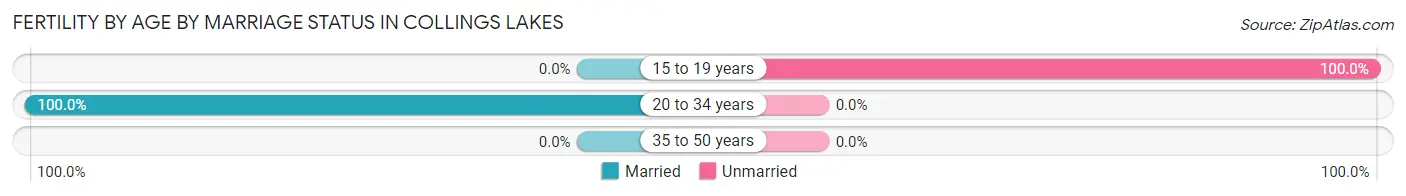
| Age Bracket | Married | Unmarried |
| 15 to 19 years | 0 (0.0%) | 27 (100.0%) |
| 20 to 34 years | 62 (100.0%) | 0 (0.0%) |
| 35 to 50 years | 0 (0.0%) | 0 (0.0%) |
| Total | 62 (69.7%) | 27 (30.3%) |
Fertility by Education in Collings Lakes
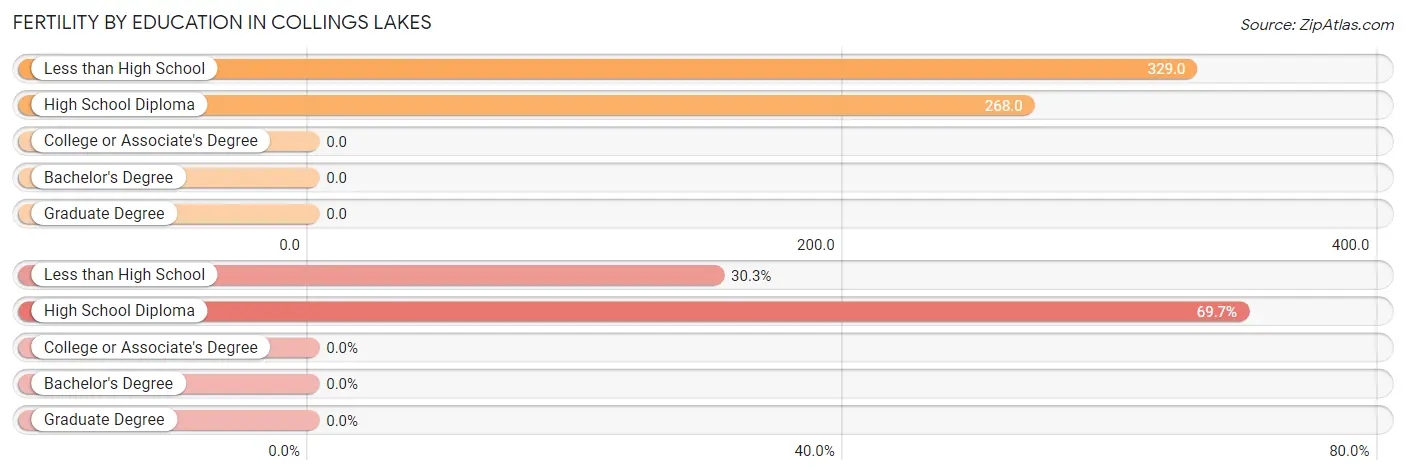
| Educational Attainment | Women with Births | Births / 1,000 Women |
| Less than High School | 27 (30.3%) | 329.0 |
| High School Diploma | 62 (69.7%) | 268.0 |
| College or Associate's Degree | 0 (0.0%) | 0.0 |
| Bachelor's Degree | 0 (0.0%) | 0.0 |
| Graduate Degree | 0 (0.0%) | 0.0 |
| Total | 89 (100.0%) | 155.0 |
Fertility by Education by Marriage Status in Collings Lakes
30.3% of women with births in Collings Lakes are unmarried. Women with the educational attainment of high school diploma are most likely to be married with 100.0% of them married at childbirth, while women with the educational attainment of less than high school are least likely to be married with 100.0% of them unmarried at childbirth.
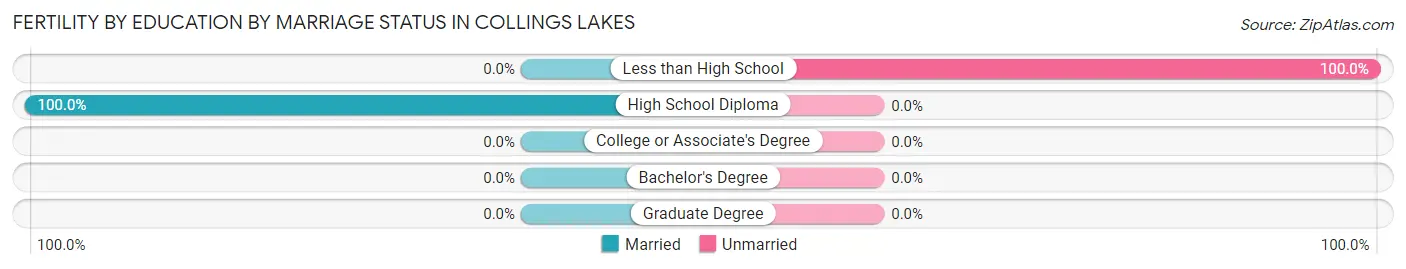
| Educational Attainment | Married | Unmarried |
| Less than High School | 0 (0.0%) | 27 (100.0%) |
| High School Diploma | 62 (100.0%) | 0 (0.0%) |
| College or Associate's Degree | 0 (0.0%) | 0 (0.0%) |
| Bachelor's Degree | 0 (0.0%) | 0 (0.0%) |
| Graduate Degree | 0 (0.0%) | 0 (0.0%) |
| Total | 62 (69.7%) | 27 (30.3%) |
Employment Characteristics in Collings Lakes
Employment by Class of Employer in Collings Lakes
Among the 1,038 employed individuals in Collings Lakes, private company employees (726 | 69.9%), self-employed (not incorporated) (96 | 9.2%), and local government employees (81 | 7.8%) make up the most common classes of employment.
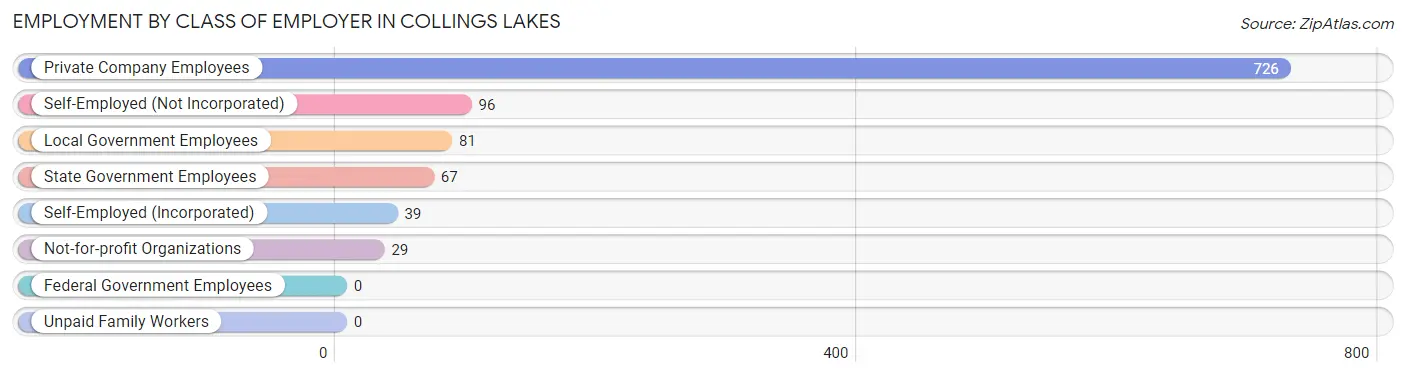
| Employer Class | # Employees | % Employees |
| Private Company Employees | 726 | 69.9% |
| Self-Employed (Incorporated) | 39 | 3.8% |
| Self-Employed (Not Incorporated) | 96 | 9.2% |
| Not-for-profit Organizations | 29 | 2.8% |
| Local Government Employees | 81 | 7.8% |
| State Government Employees | 67 | 6.5% |
| Federal Government Employees | 0 | 0.0% |
| Unpaid Family Workers | 0 | 0.0% |
| Total | 1,038 | 100.0% |
Employment Status by Age in Collings Lakes
According to the labor force statistics for Collings Lakes, out of the total population over 16 years of age (1,657), 70.0% or 1,160 individuals are in the labor force, with 5.2% or 60 of them unemployed. The age group with the highest labor force participation rate is 30 to 34 years, with 100.0% or 218 individuals in the labor force. Within the labor force, the 60 to 64 years age range has the highest percentage of unemployed individuals, with 100.0% or 22 of them being unemployed.
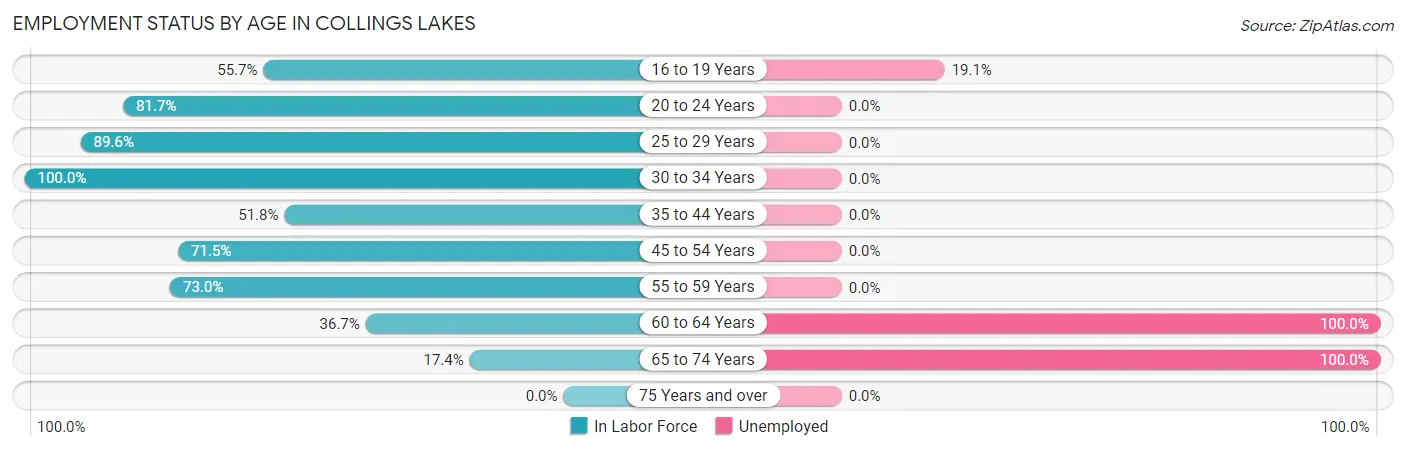
| Age Bracket | In Labor Force | Unemployed |
| 16 to 19 Years | 157 (55.7%) | 30 (19.1%) |
| 20 to 24 Years | 138 (81.7%) | 0 (0.0%) |
| 25 to 29 Years | 189 (89.6%) | 0 (0.0%) |
| 30 to 34 Years | 218 (100.0%) | 0 (0.0%) |
| 35 to 44 Years | 58 (51.8%) | 0 (0.0%) |
| 45 to 54 Years | 316 (71.5%) | 0 (0.0%) |
| 55 to 59 Years | 54 (73.0%) | 0 (0.0%) |
| 60 to 64 Years | 22 (36.7%) | 22 (100.0%) |
| 65 to 74 Years | 8 (17.4%) | 8 (100.0%) |
| 75 Years and over | 0 (0.0%) | 0 (0.0%) |
| Total | 1,160 (70.0%) | 60 (5.2%) |
Employment Status by Educational Attainment in Collings Lakes
According to labor force statistics for Collings Lakes, 76.7% of individuals (857) out of the total population between 25 and 64 years of age (1,117) are in the labor force, with 2.6% or 22 of them being unemployed. The group with the highest labor force participation rate are those with the educational attainment of high school diploma, with 85.3% or 477 individuals in the labor force. Within the labor force, individuals with college / associate degree education have the highest percentage of unemployment, with 7.1% or 22 of them being unemployed.
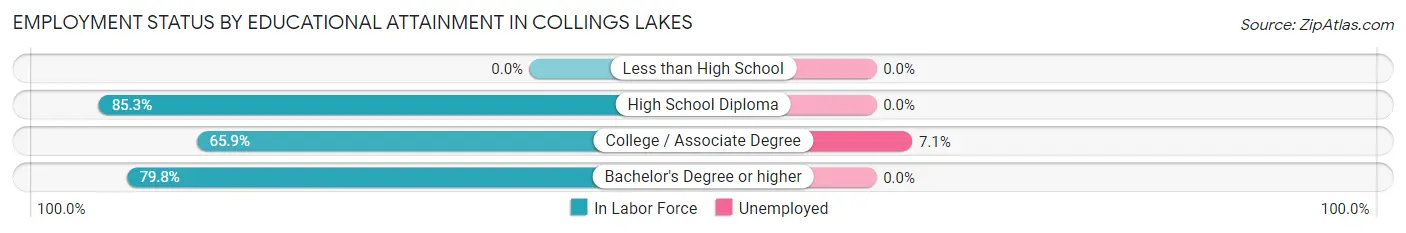
| Educational Attainment | In Labor Force | Unemployed |
| Less than High School | 0 (0.0%) | 0 (0.0%) |
| High School Diploma | 477 (85.3%) | 0 (0.0%) |
| College / Associate Degree | 309 (65.9%) | 33 (7.1%) |
| Bachelor's Degree or higher | 71 (79.8%) | 0 (0.0%) |
| Total | 857 (76.7%) | 29 (2.6%) |
Employment Occupations by Sex in Collings Lakes
Management, Business, Science and Arts Occupations
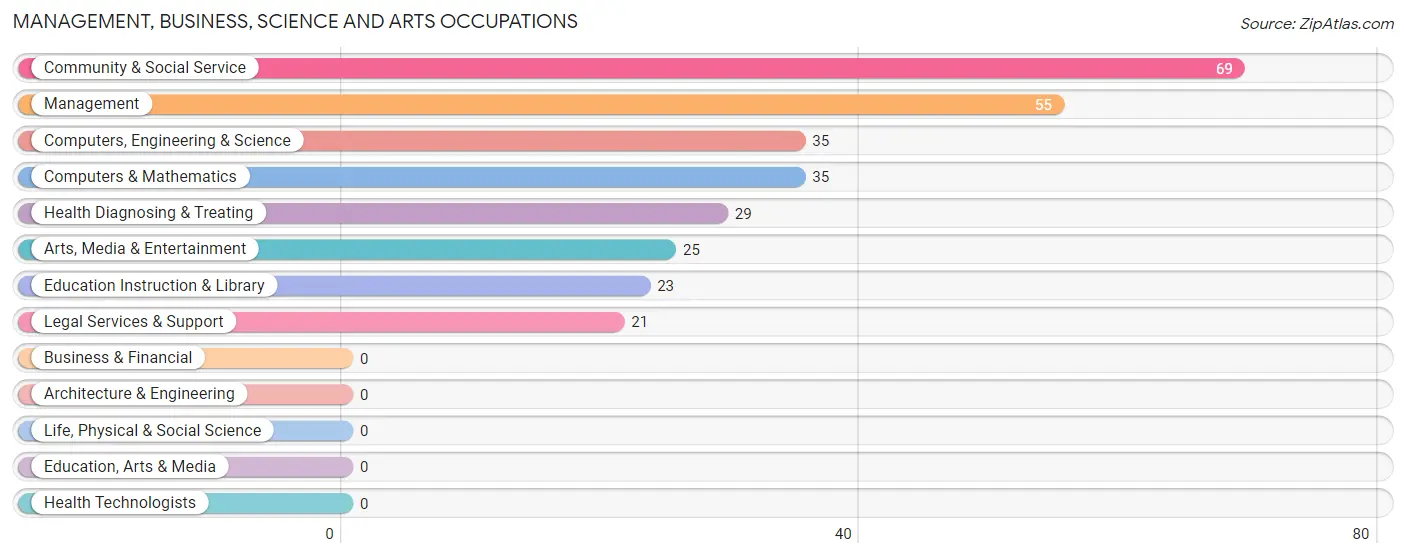
The most common Management, Business, Science and Arts occupations in Collings Lakes are Community & Social Service (69 | 6.3%), Management (55 | 5.0%), Computers, Engineering & Science (35 | 3.2%), Computers & Mathematics (35 | 3.2%), and Health Diagnosing & Treating (29 | 2.6%).
Management, Business, Science and Arts Occupations by Sex
Within the Management, Business, Science and Arts occupations in Collings Lakes, the most male-oriented occupations are Computers, Engineering & Science (100.0%), Computers & Mathematics (100.0%), and Legal Services & Support (100.0%), while the most female-oriented occupations are Education Instruction & Library (100.0%), Health Diagnosing & Treating (100.0%), and Management (65.4%).
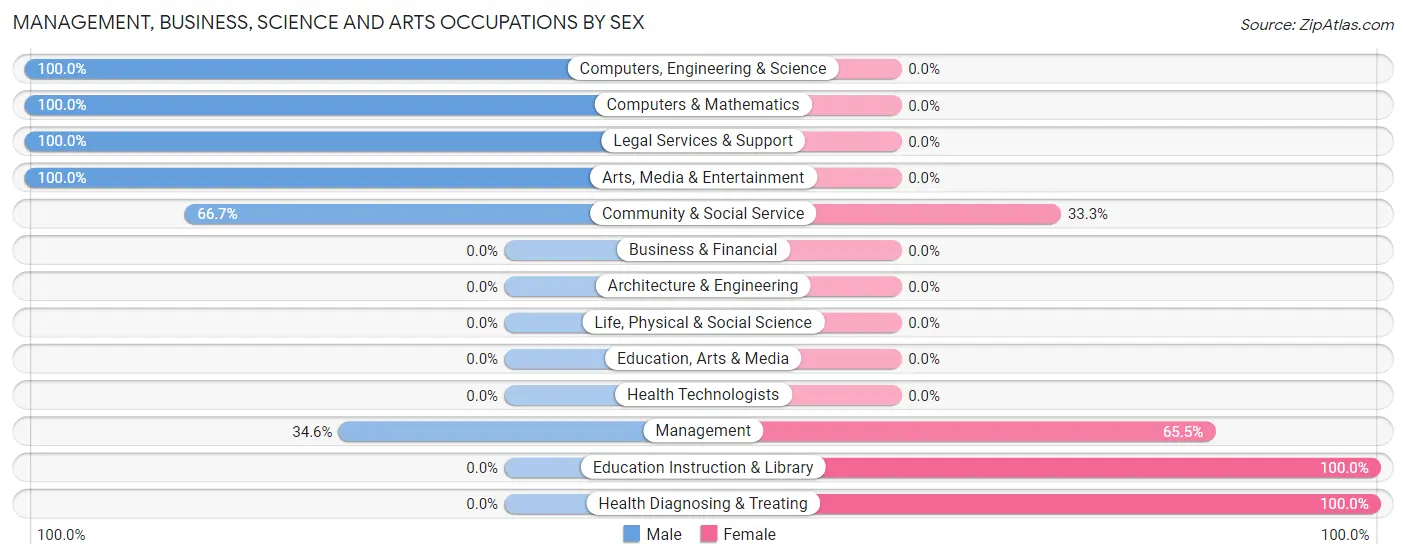
| Occupation | Male | Female |
| Management | 19 (34.5%) | 36 (65.4%) |
| Business & Financial | 0 (0.0%) | 0 (0.0%) |
| Computers, Engineering & Science | 35 (100.0%) | 0 (0.0%) |
| Computers & Mathematics | 35 (100.0%) | 0 (0.0%) |
| Architecture & Engineering | 0 (0.0%) | 0 (0.0%) |
| Life, Physical & Social Science | 0 (0.0%) | 0 (0.0%) |
| Community & Social Service | 46 (66.7%) | 23 (33.3%) |
| Education, Arts & Media | 0 (0.0%) | 0 (0.0%) |
| Legal Services & Support | 21 (100.0%) | 0 (0.0%) |
| Education Instruction & Library | 0 (0.0%) | 23 (100.0%) |
| Arts, Media & Entertainment | 25 (100.0%) | 0 (0.0%) |
| Health Diagnosing & Treating | 0 (0.0%) | 29 (100.0%) |
| Health Technologists | 0 (0.0%) | 0 (0.0%) |
| Total (Category) | 100 (53.2%) | 88 (46.8%) |
| Total (Overall) | 552 (50.2%) | 548 (49.8%) |
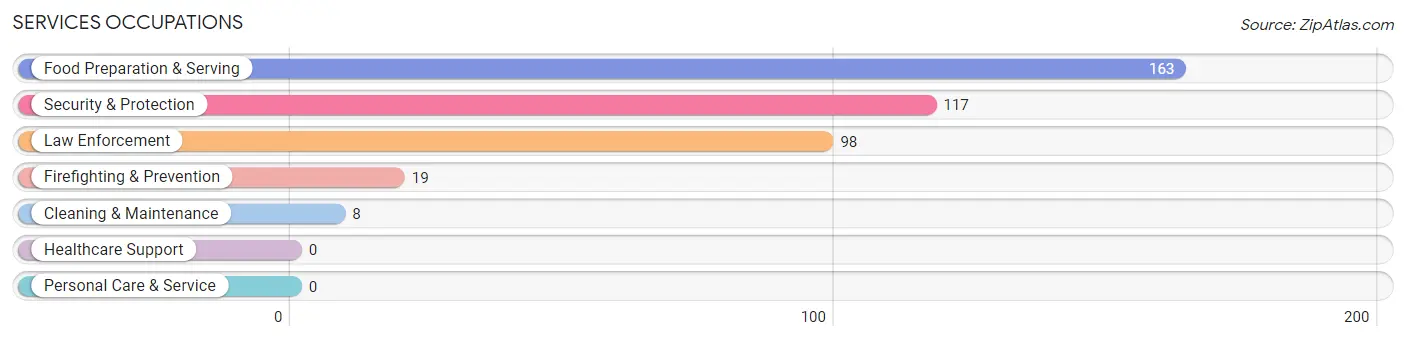
Services Occupations
The most common Services occupations in Collings Lakes are Food Preparation & Serving (163 | 14.8%), Security & Protection (117 | 10.6%), Law Enforcement (98 | 8.9%), Firefighting & Prevention (19 | 1.7%), and Cleaning & Maintenance (8 | 0.7%).
Services Occupations by Sex
Within the Services occupations in Collings Lakes, the most male-oriented occupations are Security & Protection (100.0%), Firefighting & Prevention (100.0%), and Law Enforcement (100.0%), while the most female-oriented occupations are Food Preparation & Serving (100.0%), and Cleaning & Maintenance (100.0%).
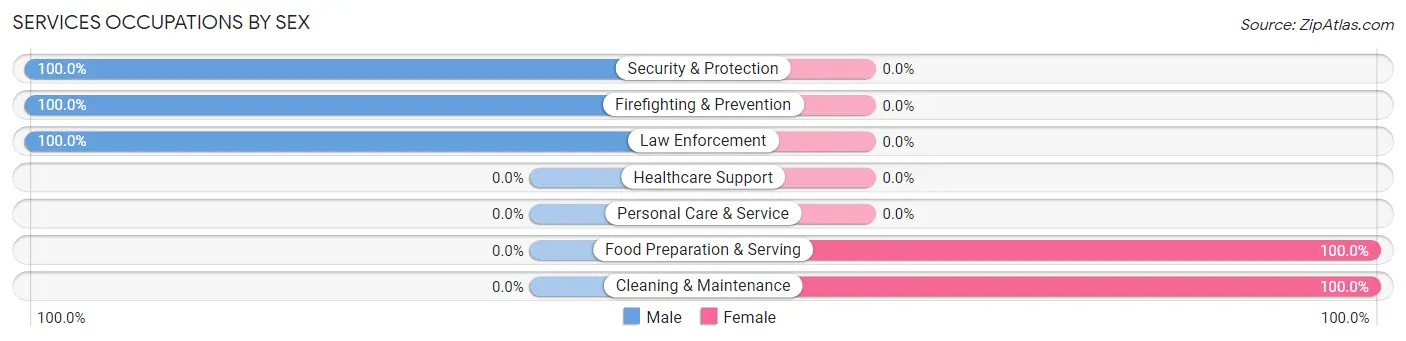
| Occupation | Male | Female |
| Healthcare Support | 0 (0.0%) | 0 (0.0%) |
| Security & Protection | 117 (100.0%) | 0 (0.0%) |
| Firefighting & Prevention | 19 (100.0%) | 0 (0.0%) |
| Law Enforcement | 98 (100.0%) | 0 (0.0%) |
| Food Preparation & Serving | 0 (0.0%) | 163 (100.0%) |
| Cleaning & Maintenance | 0 (0.0%) | 8 (100.0%) |
| Personal Care & Service | 0 (0.0%) | 0 (0.0%) |
| Total (Category) | 117 (40.6%) | 171 (59.4%) |
| Total (Overall) | 552 (50.2%) | 548 (49.8%) |
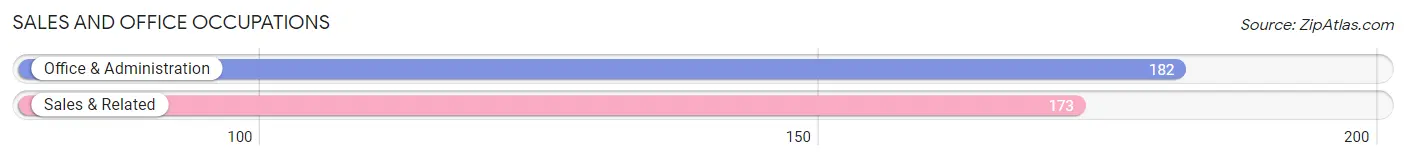
Sales and Office Occupations
The most common Sales and Office occupations in Collings Lakes are Office & Administration (182 | 16.6%), and Sales & Related (173 | 15.7%).
Sales and Office Occupations by Sex
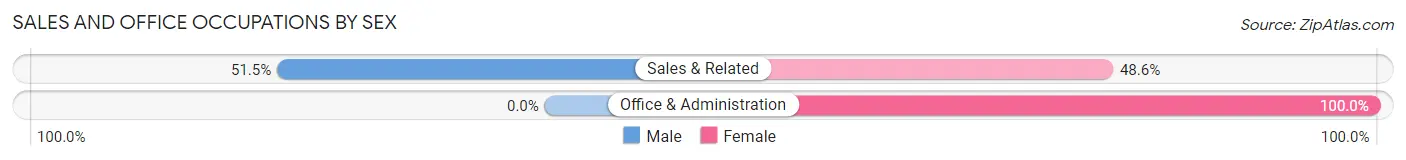
| Occupation | Male | Female |
| Sales & Related | 89 (51.4%) | 84 (48.5%) |
| Office & Administration | 0 (0.0%) | 182 (100.0%) |
| Total (Category) | 89 (25.1%) | 266 (74.9%) |
| Total (Overall) | 552 (50.2%) | 548 (49.8%) |
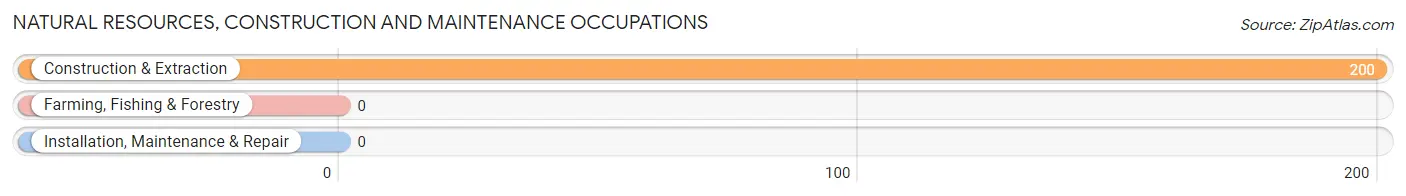
Natural Resources, Construction and Maintenance Occupations
The most common Natural Resources, Construction and Maintenance occupations in Collings Lakes are , and Construction & Extraction (200 | 18.2%).
Natural Resources, Construction and Maintenance Occupations by Sex
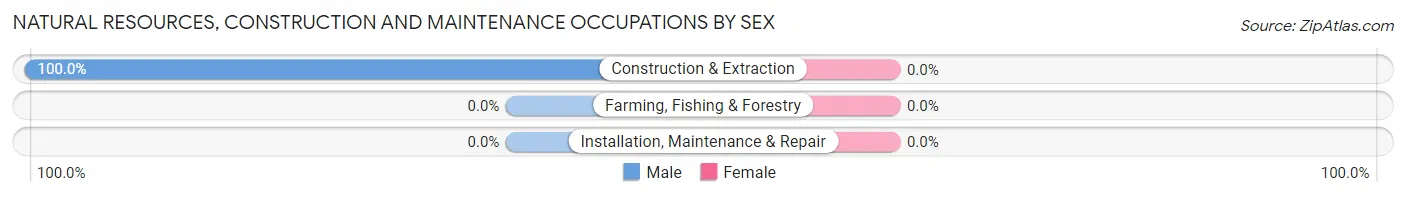
| Occupation | Male | Female |
| Farming, Fishing & Forestry | 0 (0.0%) | 0 (0.0%) |
| Construction & Extraction | 200 (100.0%) | 0 (0.0%) |
| Installation, Maintenance & Repair | 0 (0.0%) | 0 (0.0%) |
| Total (Category) | 200 (100.0%) | 0 (0.0%) |
| Total (Overall) | 552 (50.2%) | 548 (49.8%) |
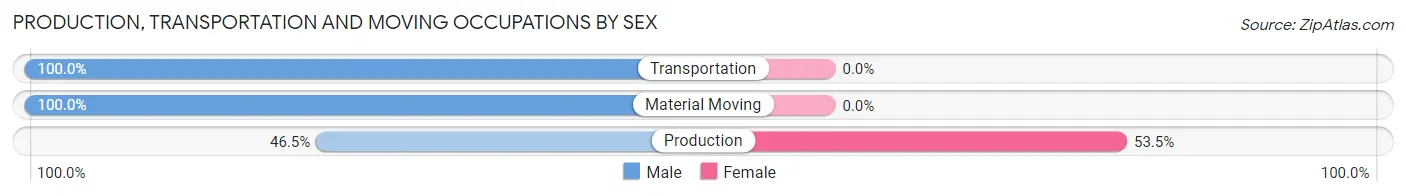
Production, Transportation and Moving Occupations
The most common Production, Transportation and Moving occupations in Collings Lakes are Production (43 | 3.9%), Transportation (17 | 1.5%), and Material Moving (9 | 0.8%).
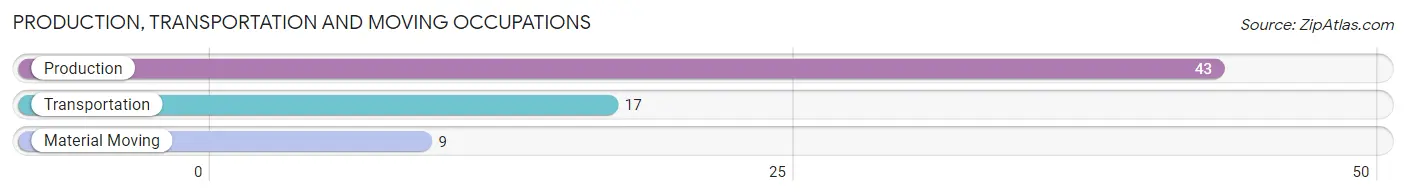
Production, Transportation and Moving Occupations by Sex
| Occupation | Male | Female |
| Production | 20 (46.5%) | 23 (53.5%) |
| Transportation | 17 (100.0%) | 0 (0.0%) |
| Material Moving | 9 (100.0%) | 0 (0.0%) |
| Total (Category) | 46 (66.7%) | 23 (33.3%) |
| Total (Overall) | 552 (50.2%) | 548 (49.8%) |
Employment Industries by Sex in Collings Lakes
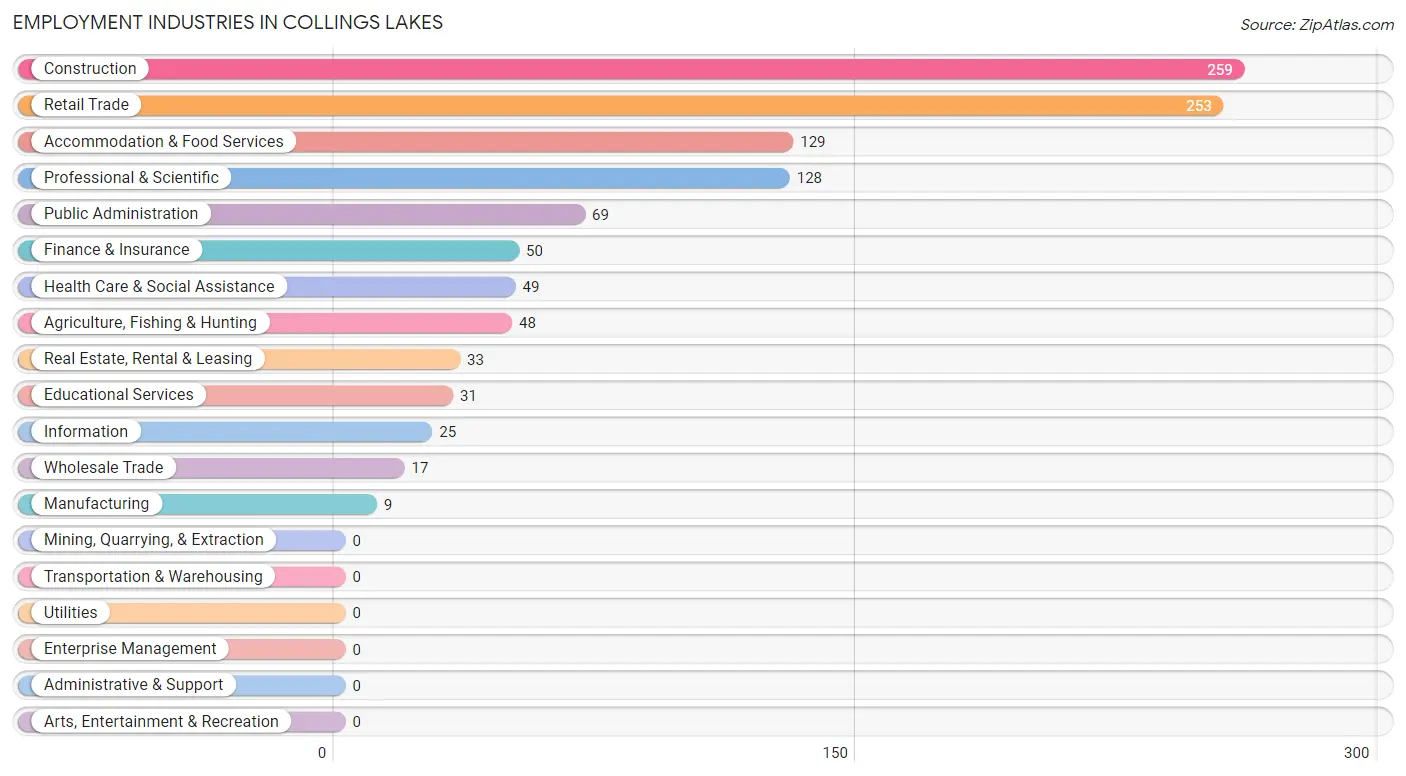
Employment Industries in Collings Lakes
The major employment industries in Collings Lakes include Construction (259 | 23.5%), Retail Trade (253 | 23.0%), Accommodation & Food Services (129 | 11.7%), Professional & Scientific (128 | 11.6%), and Public Administration (69 | 6.3%).
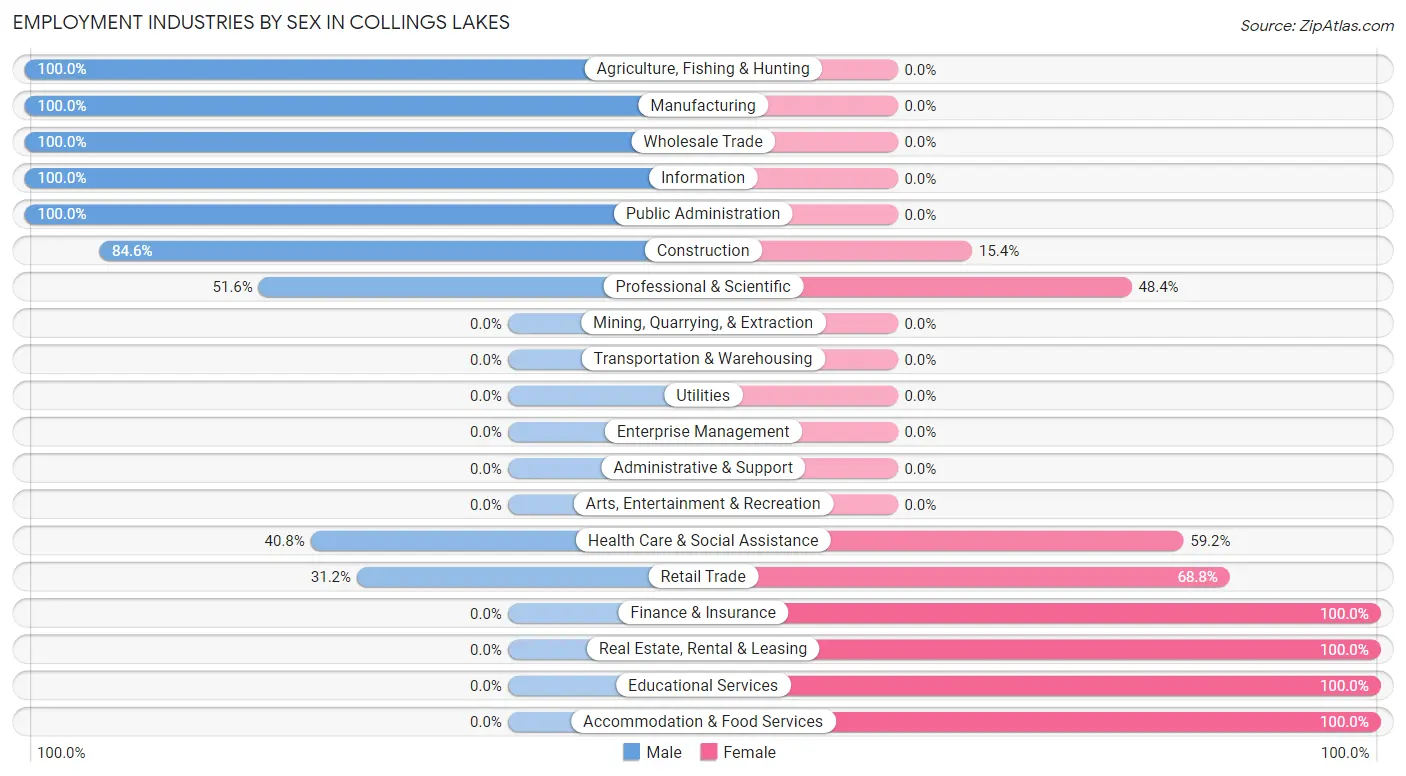
Employment Industries by Sex in Collings Lakes
The Collings Lakes industries that see more men than women are Agriculture, Fishing & Hunting (100.0%), Manufacturing (100.0%), and Wholesale Trade (100.0%), whereas the industries that tend to have a higher number of women are Finance & Insurance (100.0%), Real Estate, Rental & Leasing (100.0%), and Educational Services (100.0%).
| Industry | Male | Female |
| Agriculture, Fishing & Hunting | 48 (100.0%) | 0 (0.0%) |
| Mining, Quarrying, & Extraction | 0 (0.0%) | 0 (0.0%) |
| Construction | 219 (84.6%) | 40 (15.4%) |
| Manufacturing | 9 (100.0%) | 0 (0.0%) |
| Wholesale Trade | 17 (100.0%) | 0 (0.0%) |
| Retail Trade | 79 (31.2%) | 174 (68.8%) |
| Transportation & Warehousing | 0 (0.0%) | 0 (0.0%) |
| Utilities | 0 (0.0%) | 0 (0.0%) |
| Information | 25 (100.0%) | 0 (0.0%) |
| Finance & Insurance | 0 (0.0%) | 50 (100.0%) |
| Real Estate, Rental & Leasing | 0 (0.0%) | 33 (100.0%) |
| Professional & Scientific | 66 (51.6%) | 62 (48.4%) |
| Enterprise Management | 0 (0.0%) | 0 (0.0%) |
| Administrative & Support | 0 (0.0%) | 0 (0.0%) |
| Educational Services | 0 (0.0%) | 31 (100.0%) |
| Health Care & Social Assistance | 20 (40.8%) | 29 (59.2%) |
| Arts, Entertainment & Recreation | 0 (0.0%) | 0 (0.0%) |
| Accommodation & Food Services | 0 (0.0%) | 129 (100.0%) |
| Public Administration | 69 (100.0%) | 0 (0.0%) |
| Total | 552 (50.2%) | 548 (49.8%) |
Education in Collings Lakes
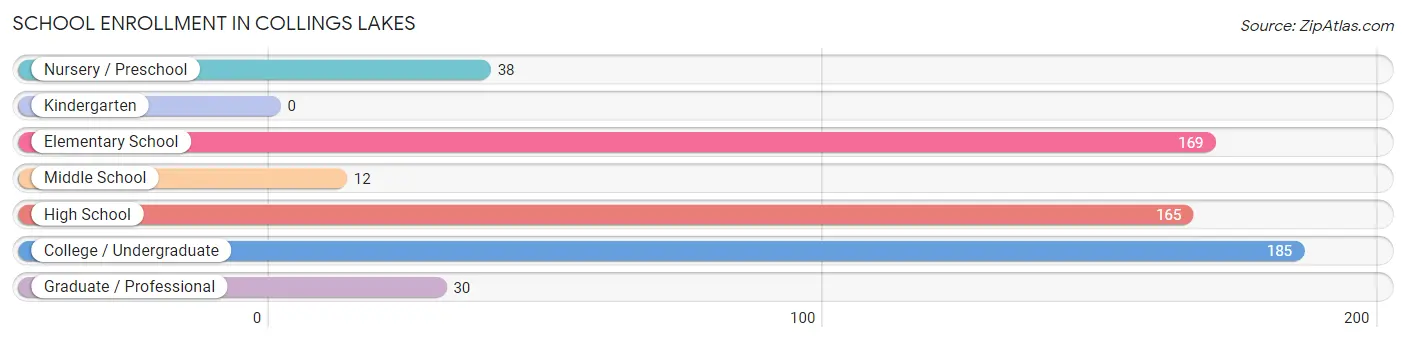
School Enrollment in Collings Lakes
The most common levels of schooling among the 599 students in Collings Lakes are college / undergraduate (185 | 30.9%), elementary school (169 | 28.2%), and high school (165 | 27.6%).
| School Level | # Students | % Students |
| Nursery / Preschool | 38 | 6.3% |
| Kindergarten | 0 | 0.0% |
| Elementary School | 169 | 28.2% |
| Middle School | 12 | 2.0% |
| High School | 165 | 27.6% |
| College / Undergraduate | 185 | 30.9% |
| Graduate / Professional | 30 | 5.0% |
| Total | 599 | 100.0% |
School Enrollment by Age by Funding Source in Collings Lakes
Out of a total of 599 students who are enrolled in schools in Collings Lakes, 70 (11.7%) attend a private institution, while the remaining 529 (88.3%) are enrolled in public schools. The age group of 20 to 24 year olds has the highest likelihood of being enrolled in private schools, with 30 (32.6% in the age bracket) enrolled. Conversely, the age group of 5 to 9 year old has the lowest likelihood of being enrolled in a private school, with 144 (100.0% in the age bracket) attending a public institution.
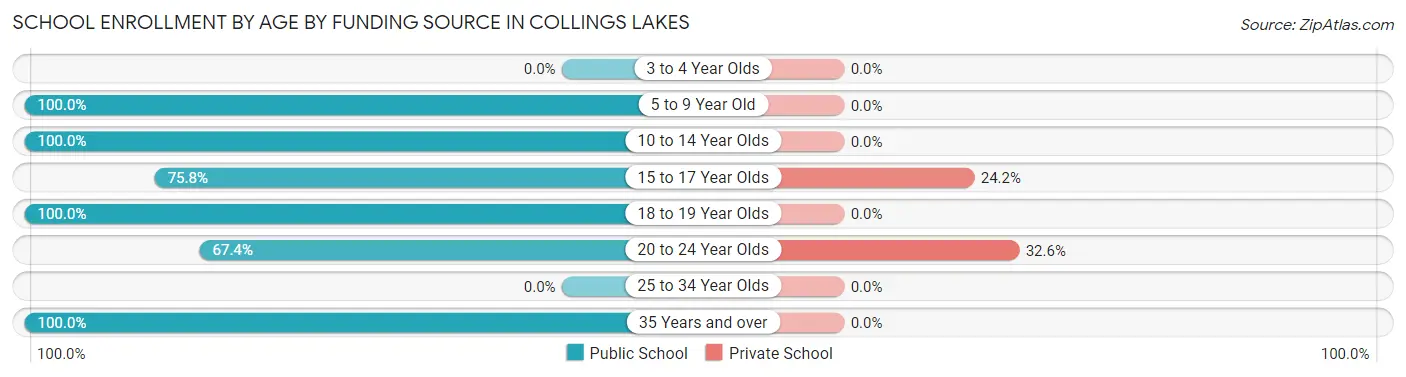
| Age Bracket | Public School | Private School |
| 3 to 4 Year Olds | 0 (0.0%) | 0 (0.0%) |
| 5 to 9 Year Old | 144 (100.0%) | 0 (0.0%) |
| 10 to 14 Year Olds | 75 (100.0%) | 0 (0.0%) |
| 15 to 17 Year Olds | 125 (75.8%) | 40 (24.2%) |
| 18 to 19 Year Olds | 69 (100.0%) | 0 (0.0%) |
| 20 to 24 Year Olds | 62 (67.4%) | 30 (32.6%) |
| 25 to 34 Year Olds | 0 (0.0%) | 0 (0.0%) |
| 35 Years and over | 54 (100.0%) | 0 (0.0%) |
| Total | 529 (88.3%) | 70 (11.7%) |
Educational Attainment by Field of Study in Collings Lakes
Business (68 | 62.4%), social sciences (21 | 19.3%), and education (20 | 18.3%) are the most common fields of study among 109 individuals in Collings Lakes who have obtained a bachelor's degree or higher.
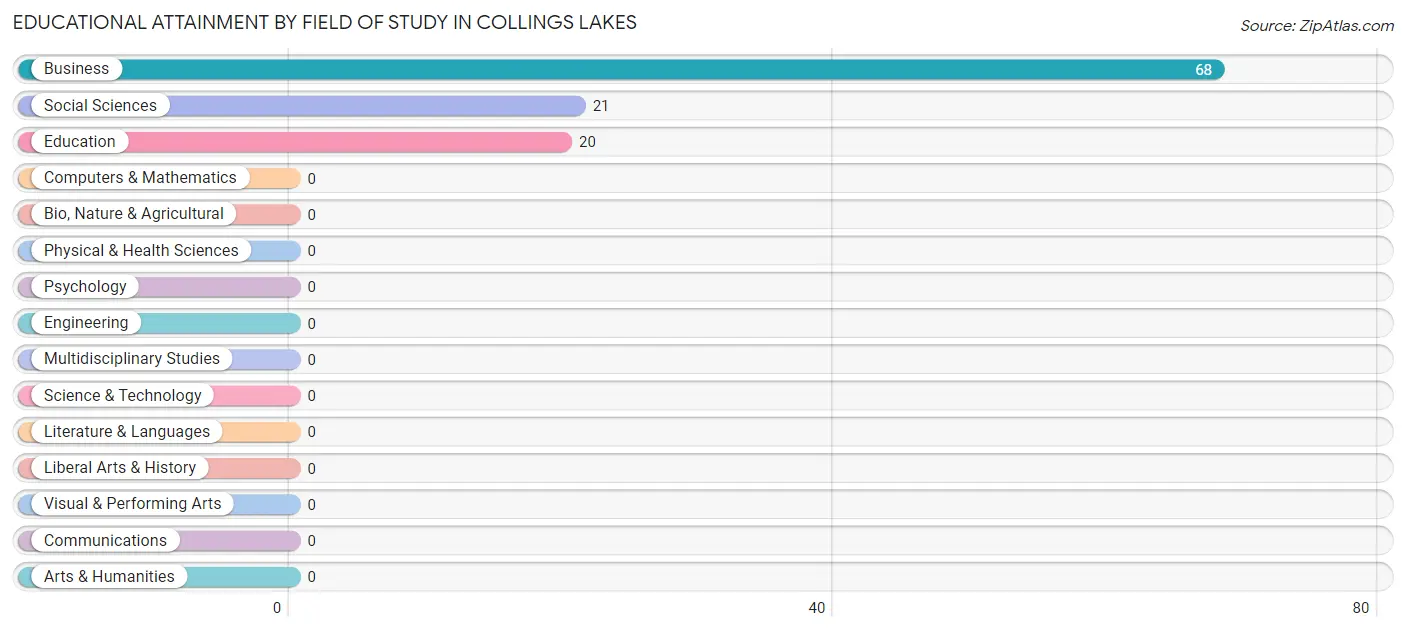
| Field of Study | # Graduates | % Graduates |
| Computers & Mathematics | 0 | 0.0% |
| Bio, Nature & Agricultural | 0 | 0.0% |
| Physical & Health Sciences | 0 | 0.0% |
| Psychology | 0 | 0.0% |
| Social Sciences | 21 | 19.3% |
| Engineering | 0 | 0.0% |
| Multidisciplinary Studies | 0 | 0.0% |
| Science & Technology | 0 | 0.0% |
| Business | 68 | 62.4% |
| Education | 20 | 18.3% |
| Literature & Languages | 0 | 0.0% |
| Liberal Arts & History | 0 | 0.0% |
| Visual & Performing Arts | 0 | 0.0% |
| Communications | 0 | 0.0% |
| Arts & Humanities | 0 | 0.0% |
| Total | 109 | 100.0% |
Transportation & Commute in Collings Lakes
Vehicle Availability by Sex in Collings Lakes
The most prevalent vehicle ownership categories in Collings Lakes are males with 2 vehicles (142, accounting for 25.7%) and females with 2 vehicles (100, making up 29.2%).
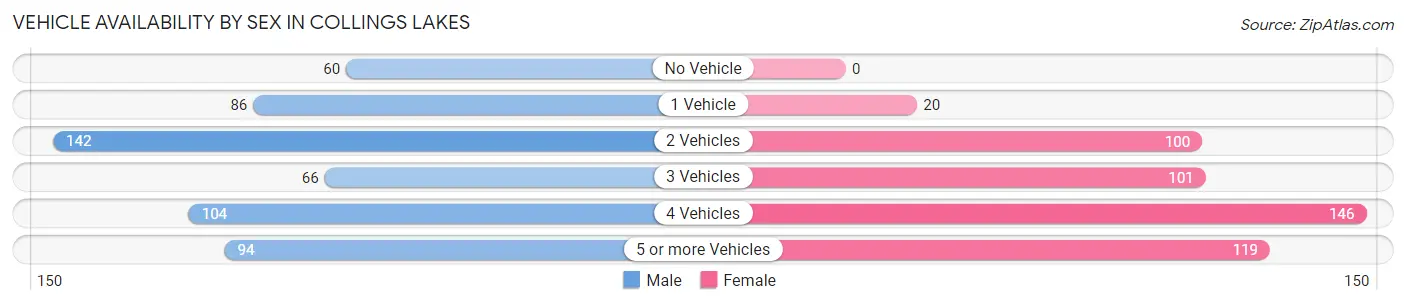
| Vehicles Available | Male | Female |
| No Vehicle | 60 (10.9%) | 0 (0.0%) |
| 1 Vehicle | 86 (15.6%) | 20 (4.1%) |
| 2 Vehicles | 142 (25.7%) | 100 (20.6%) |
| 3 Vehicles | 66 (12.0%) | 101 (20.8%) |
| 4 Vehicles | 104 (18.8%) | 146 (30.0%) |
| 5 or more Vehicles | 94 (17.0%) | 119 (24.5%) |
| Total | 552 (100.0%) | 486 (100.0%) |
Commute Time in Collings Lakes
The most frequently occuring commute durations in Collings Lakes are 15 to 19 minutes (261 commuters, 26.2%), 20 to 24 minutes (164 commuters, 16.4%), and 90 or more minutes (122 commuters, 12.2%).
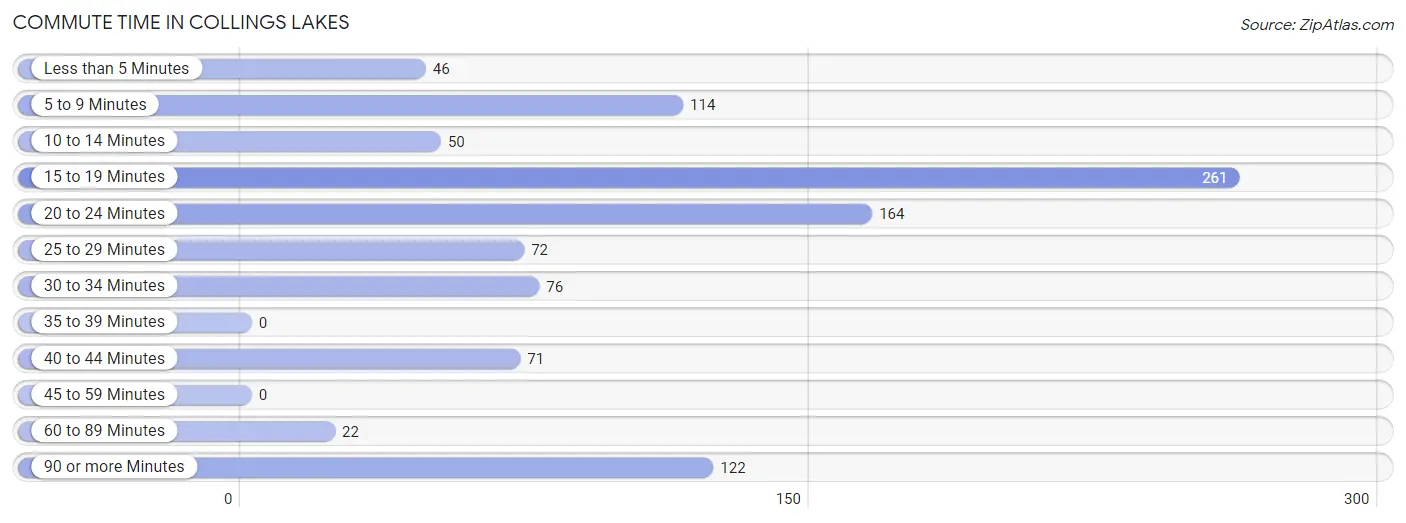
| Commute Time | # Commuters | % Commuters |
| Less than 5 Minutes | 46 | 4.6% |
| 5 to 9 Minutes | 114 | 11.4% |
| 10 to 14 Minutes | 50 | 5.0% |
| 15 to 19 Minutes | 261 | 26.2% |
| 20 to 24 Minutes | 164 | 16.4% |
| 25 to 29 Minutes | 72 | 7.2% |
| 30 to 34 Minutes | 76 | 7.6% |
| 35 to 39 Minutes | 0 | 0.0% |
| 40 to 44 Minutes | 71 | 7.1% |
| 45 to 59 Minutes | 0 | 0.0% |
| 60 to 89 Minutes | 22 | 2.2% |
| 90 or more Minutes | 122 | 12.2% |
Commute Time by Sex in Collings Lakes
The most common commute times in Collings Lakes are 15 to 19 minutes (113 commuters, 22.1%) for males and 15 to 19 minutes (148 commuters, 30.4%) for females.
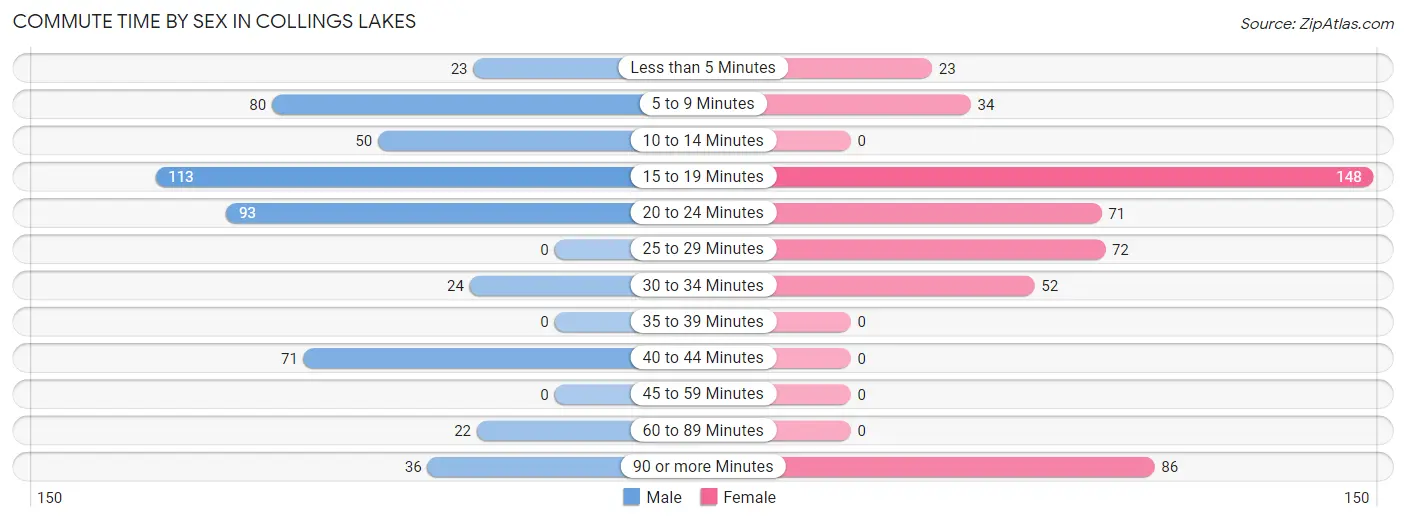
| Commute Time | Male | Female |
| Less than 5 Minutes | 23 (4.5%) | 23 (4.7%) |
| 5 to 9 Minutes | 80 (15.6%) | 34 (7.0%) |
| 10 to 14 Minutes | 50 (9.8%) | 0 (0.0%) |
| 15 to 19 Minutes | 113 (22.1%) | 148 (30.4%) |
| 20 to 24 Minutes | 93 (18.2%) | 71 (14.6%) |
| 25 to 29 Minutes | 0 (0.0%) | 72 (14.8%) |
| 30 to 34 Minutes | 24 (4.7%) | 52 (10.7%) |
| 35 to 39 Minutes | 0 (0.0%) | 0 (0.0%) |
| 40 to 44 Minutes | 71 (13.9%) | 0 (0.0%) |
| 45 to 59 Minutes | 0 (0.0%) | 0 (0.0%) |
| 60 to 89 Minutes | 22 (4.3%) | 0 (0.0%) |
| 90 or more Minutes | 36 (7.0%) | 86 (17.7%) |
Time of Departure to Work by Sex in Collings Lakes
The most frequent times of departure to work in Collings Lakes are 4:00 PM to 11:59 PM (145, 28.3%) for males and 12:00 PM to 3:59 PM (108, 22.2%) for females.
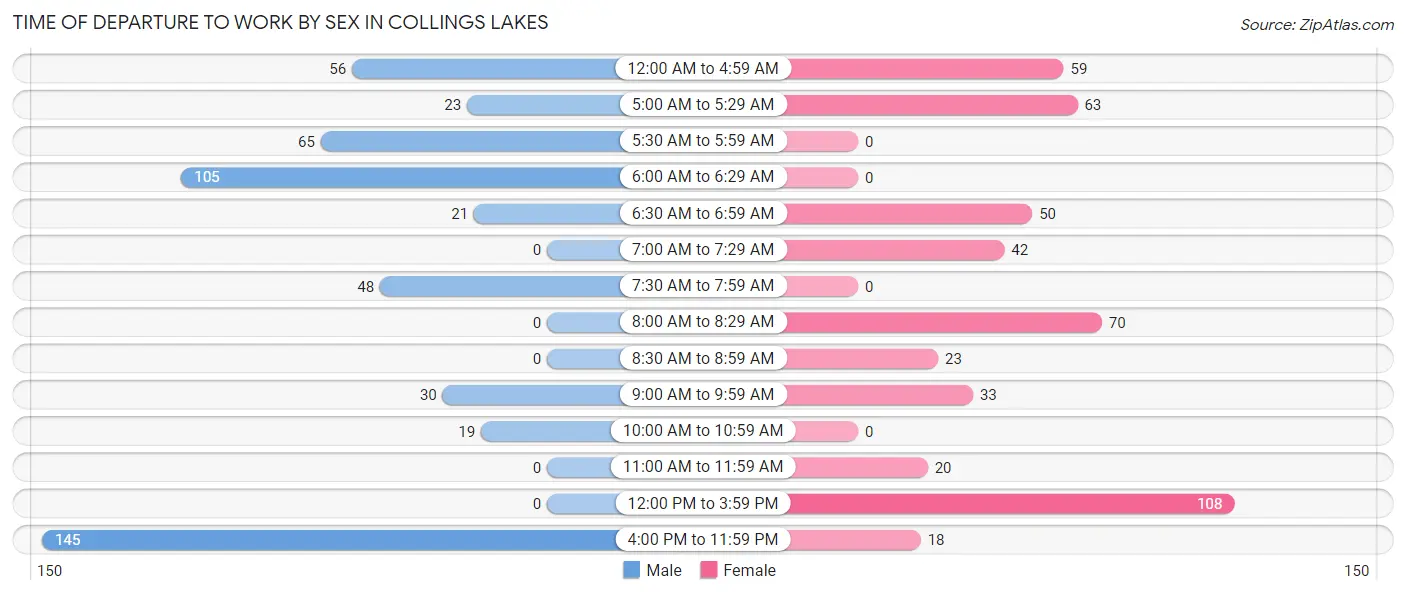
| Time of Departure | Male | Female |
| 12:00 AM to 4:59 AM | 56 (10.9%) | 59 (12.1%) |
| 5:00 AM to 5:29 AM | 23 (4.5%) | 63 (13.0%) |
| 5:30 AM to 5:59 AM | 65 (12.7%) | 0 (0.0%) |
| 6:00 AM to 6:29 AM | 105 (20.5%) | 0 (0.0%) |
| 6:30 AM to 6:59 AM | 21 (4.1%) | 50 (10.3%) |
| 7:00 AM to 7:29 AM | 0 (0.0%) | 42 (8.6%) |
| 7:30 AM to 7:59 AM | 48 (9.4%) | 0 (0.0%) |
| 8:00 AM to 8:29 AM | 0 (0.0%) | 70 (14.4%) |
| 8:30 AM to 8:59 AM | 0 (0.0%) | 23 (4.7%) |
| 9:00 AM to 9:59 AM | 30 (5.9%) | 33 (6.8%) |
| 10:00 AM to 10:59 AM | 19 (3.7%) | 0 (0.0%) |
| 11:00 AM to 11:59 AM | 0 (0.0%) | 20 (4.1%) |
| 12:00 PM to 3:59 PM | 0 (0.0%) | 108 (22.2%) |
| 4:00 PM to 11:59 PM | 145 (28.3%) | 18 (3.7%) |
| Total | 512 (100.0%) | 486 (100.0%) |
Housing Occupancy in Collings Lakes
Occupancy by Ownership in Collings Lakes
Of the total 640 dwellings in Collings Lakes, owner-occupied units account for 640 (100.0%), while renter-occupied units make up 0 (0.0%).
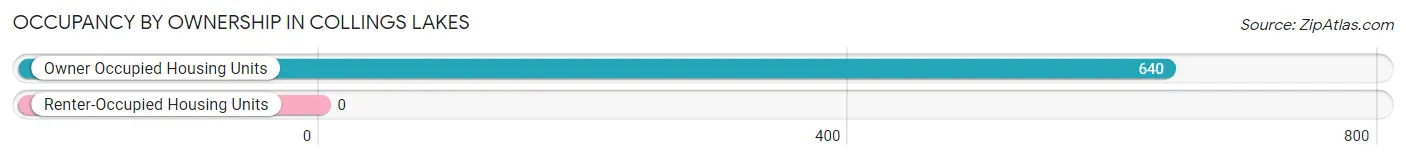
| Occupancy | # Housing Units | % Housing Units |
| Owner Occupied Housing Units | 640 | 100.0% |
| Renter-Occupied Housing Units | 0 | 0.0% |
| Total Occupied Housing Units | 640 | 100.0% |
Occupancy by Household Size in Collings Lakes
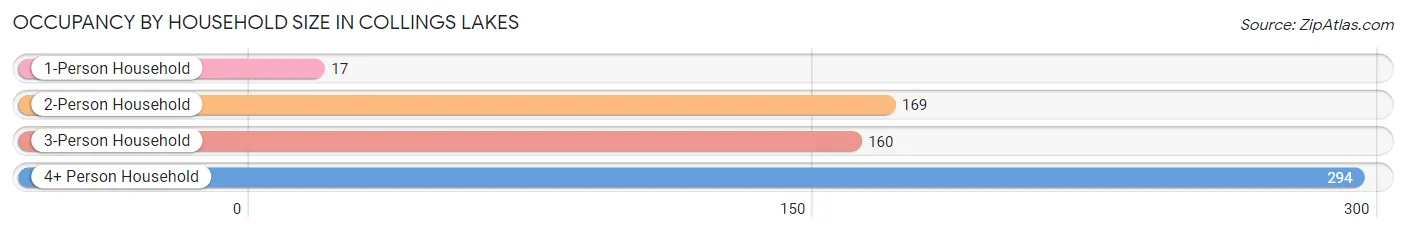
| Household Size | # Housing Units | % Housing Units |
| 1-Person Household | 17 | 2.7% |
| 2-Person Household | 169 | 26.4% |
| 3-Person Household | 160 | 25.0% |
| 4+ Person Household | 294 | 45.9% |
| Total Housing Units | 640 | 100.0% |
Occupancy by Ownership by Household Size in Collings Lakes
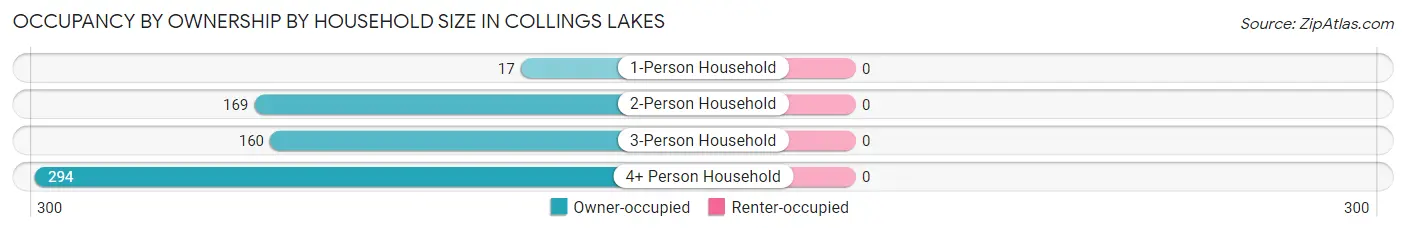
| Household Size | Owner-occupied | Renter-occupied |
| 1-Person Household | 17 (100.0%) | 0 (0.0%) |
| 2-Person Household | 169 (100.0%) | 0 (0.0%) |
| 3-Person Household | 160 (100.0%) | 0 (0.0%) |
| 4+ Person Household | 294 (100.0%) | 0 (0.0%) |
| Total Housing Units | 640 (100.0%) | 0 (0.0%) |
Occupancy by Educational Attainment in Collings Lakes
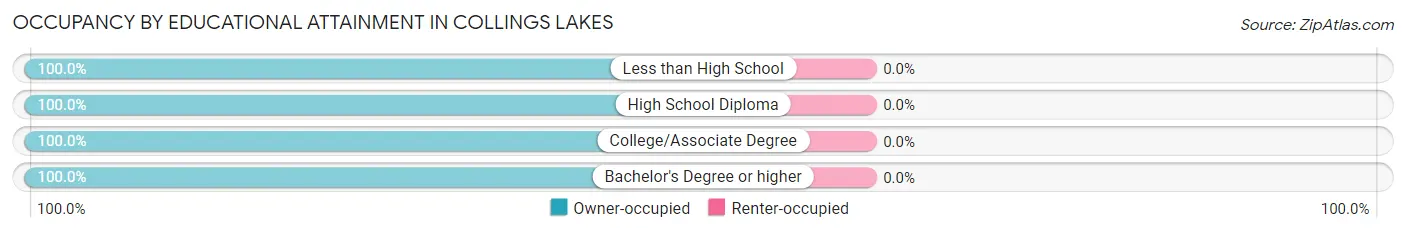
| Household Size | Owner-occupied | Renter-occupied |
| Less than High School | 9 (100.0%) | 0 (0.0%) |
| High School Diploma | 266 (100.0%) | 0 (0.0%) |
| College/Associate Degree | 325 (100.0%) | 0 (0.0%) |
| Bachelor's Degree or higher | 40 (100.0%) | 0 (0.0%) |
Occupancy by Age of Householder in Collings Lakes
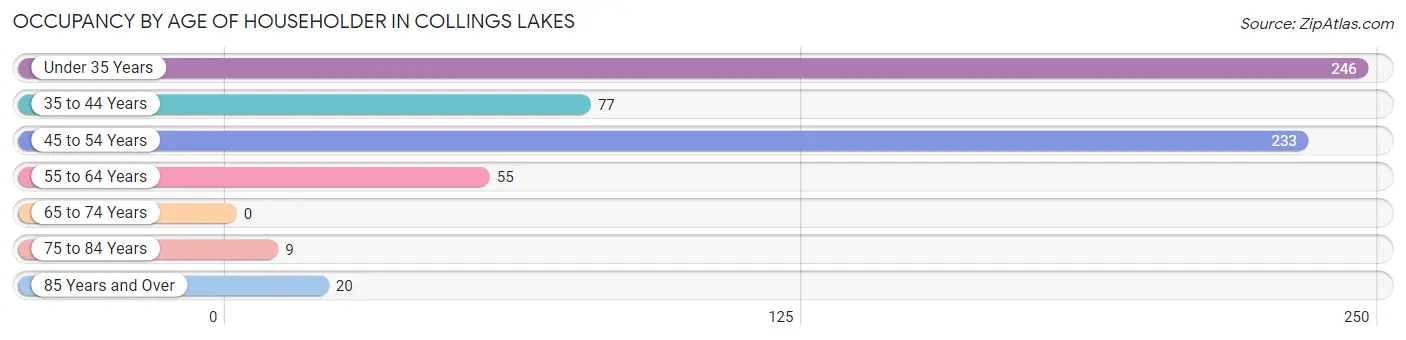
| Age Bracket | # Households | % Households |
| Under 35 Years | 246 | 38.4% |
| 35 to 44 Years | 77 | 12.0% |
| 45 to 54 Years | 233 | 36.4% |
| 55 to 64 Years | 55 | 8.6% |
| 65 to 74 Years | 0 | 0.0% |
| 75 to 84 Years | 9 | 1.4% |
| 85 Years and Over | 20 | 3.1% |
| Total | 640 | 100.0% |
Housing Finances in Collings Lakes
Median Income by Occupancy in Collings Lakes
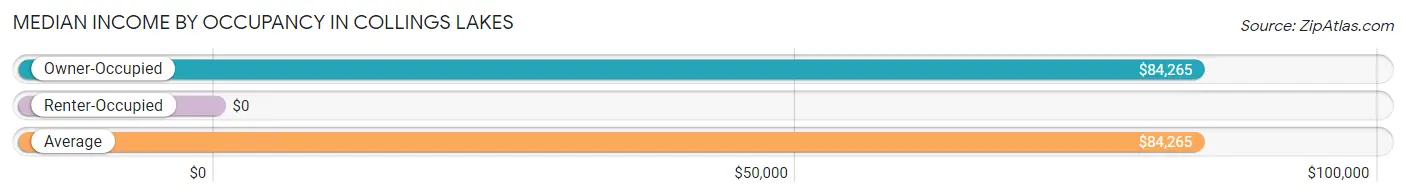
| Occupancy Type | # Households | Median Income |
| Owner-Occupied | 640 (100.0%) | $84,265 |
| Renter-Occupied | 0 (0.0%) | $0 |
| Average | 640 (100.0%) | $84,265 |
Occupancy by Householder Income Bracket in Collings Lakes
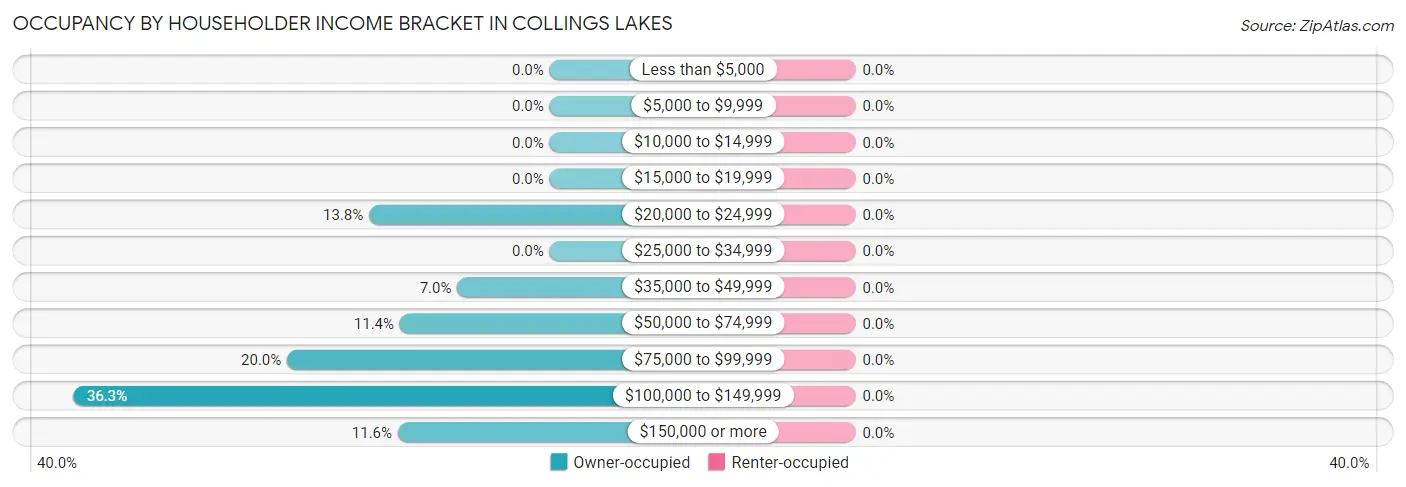
| Income Bracket | Owner-occupied | Renter-occupied |
| Less than $5,000 | 0 (0.0%) | 0 (0.0%) |
| $5,000 to $9,999 | 0 (0.0%) | 0 (0.0%) |
| $10,000 to $14,999 | 0 (0.0%) | 0 (0.0%) |
| $15,000 to $19,999 | 0 (0.0%) | 0 (0.0%) |
| $20,000 to $24,999 | 88 (13.8%) | 0 (0.0%) |
| $25,000 to $34,999 | 0 (0.0%) | 0 (0.0%) |
| $35,000 to $49,999 | 45 (7.0%) | 0 (0.0%) |
| $50,000 to $74,999 | 73 (11.4%) | 0 (0.0%) |
| $75,000 to $99,999 | 128 (20.0%) | 0 (0.0%) |
| $100,000 to $149,999 | 232 (36.2%) | 0 (0.0%) |
| $150,000 or more | 74 (11.6%) | 0 (0.0%) |
| Total | 640 (100.0%) | 0 (0.0%) |
Monthly Housing Cost Tiers in Collings Lakes
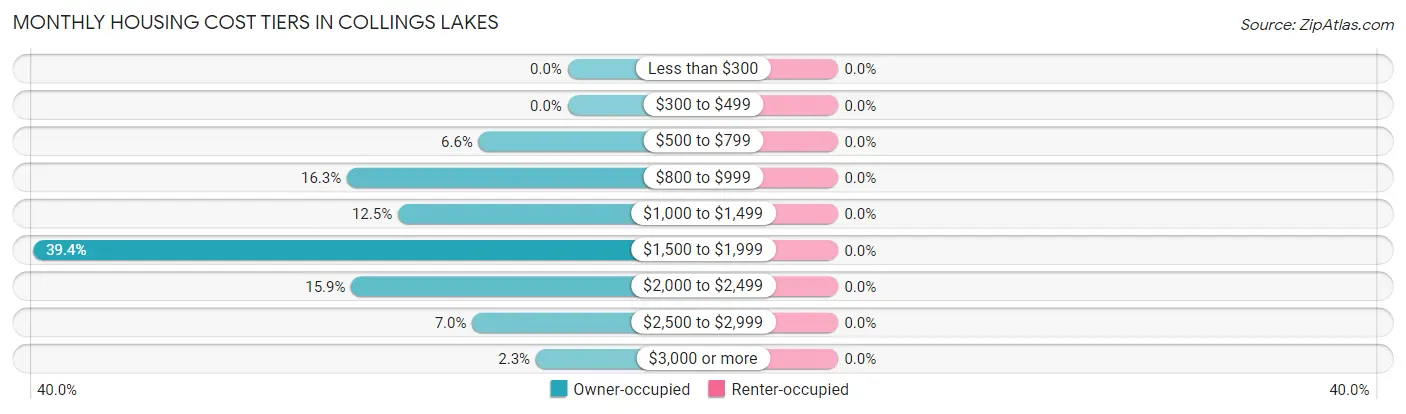
| Monthly Cost | Owner-occupied | Renter-occupied |
| Less than $300 | 0 (0.0%) | 0 (0.0%) |
| $300 to $499 | 0 (0.0%) | 0 (0.0%) |
| $500 to $799 | 42 (6.6%) | 0 (0.0%) |
| $800 to $999 | 104 (16.3%) | 0 (0.0%) |
| $1,000 to $1,499 | 80 (12.5%) | 0 (0.0%) |
| $1,500 to $1,999 | 252 (39.4%) | 0 (0.0%) |
| $2,000 to $2,499 | 102 (15.9%) | 0 (0.0%) |
| $2,500 to $2,999 | 45 (7.0%) | 0 (0.0%) |
| $3,000 or more | 15 (2.3%) | 0 (0.0%) |
| Total | 640 (100.0%) | 0 (0.0%) |
Physical Housing Characteristics in Collings Lakes
Housing Structures in Collings Lakes
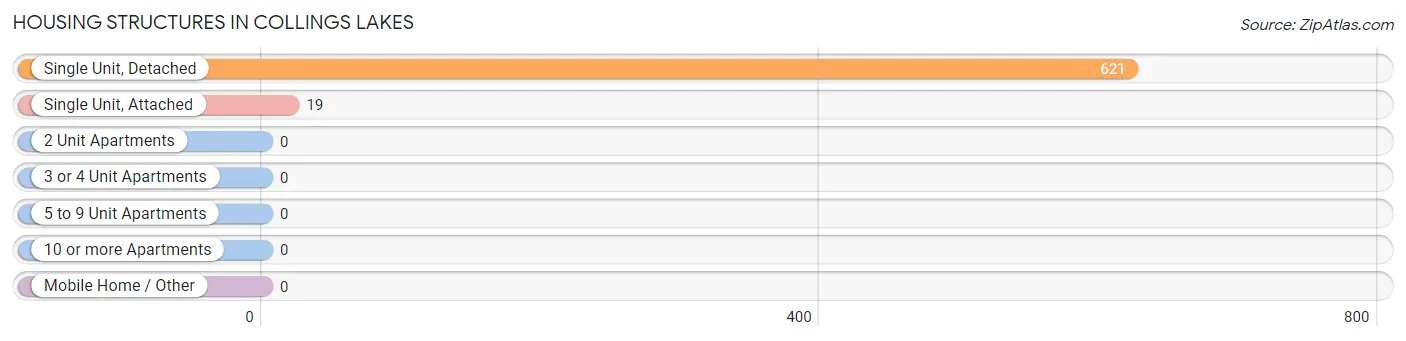
| Structure Type | # Housing Units | % Housing Units |
| Single Unit, Detached | 621 | 97.0% |
| Single Unit, Attached | 19 | 3.0% |
| 2 Unit Apartments | 0 | 0.0% |
| 3 or 4 Unit Apartments | 0 | 0.0% |
| 5 to 9 Unit Apartments | 0 | 0.0% |
| 10 or more Apartments | 0 | 0.0% |
| Mobile Home / Other | 0 | 0.0% |
| Total | 640 | 100.0% |
Housing Structures by Occupancy in Collings Lakes
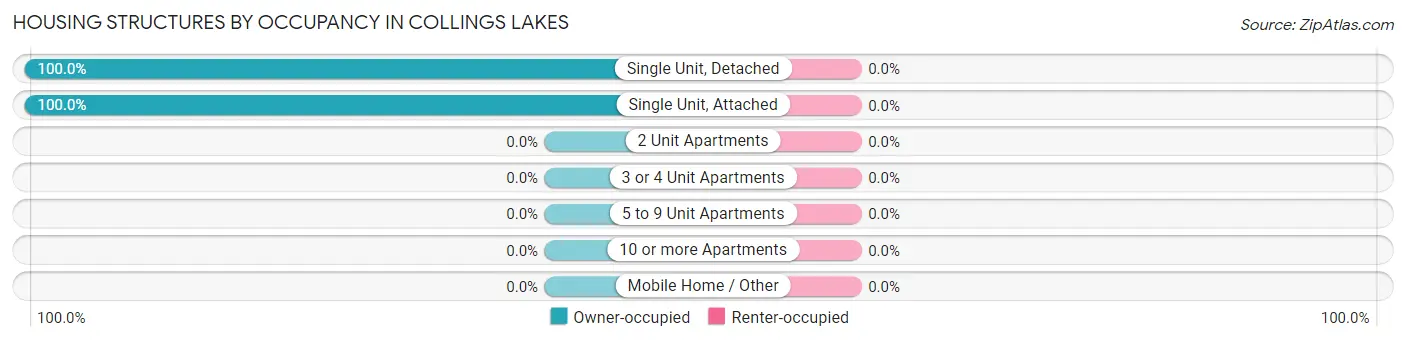
| Structure Type | Owner-occupied | Renter-occupied |
| Single Unit, Detached | 621 (100.0%) | 0 (0.0%) |
| Single Unit, Attached | 19 (100.0%) | 0 (0.0%) |
| 2 Unit Apartments | 0 (0.0%) | 0 (0.0%) |
| 3 or 4 Unit Apartments | 0 (0.0%) | 0 (0.0%) |
| 5 to 9 Unit Apartments | 0 (0.0%) | 0 (0.0%) |
| 10 or more Apartments | 0 (0.0%) | 0 (0.0%) |
| Mobile Home / Other | 0 (0.0%) | 0 (0.0%) |
| Total | 640 (100.0%) | 0 (0.0%) |
Housing Structures by Number of Rooms in Collings Lakes
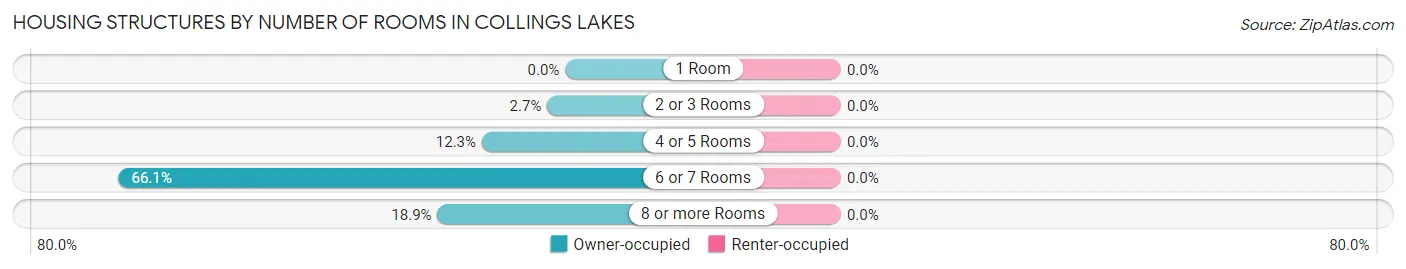
| Number of Rooms | Owner-occupied | Renter-occupied |
| 1 Room | 0 (0.0%) | 0 (0.0%) |
| 2 or 3 Rooms | 17 (2.7%) | 0 (0.0%) |
| 4 or 5 Rooms | 79 (12.3%) | 0 (0.0%) |
| 6 or 7 Rooms | 423 (66.1%) | 0 (0.0%) |
| 8 or more Rooms | 121 (18.9%) | 0 (0.0%) |
| Total | 640 (100.0%) | 0 (0.0%) |
Housing Structure by Heating Type in Collings Lakes
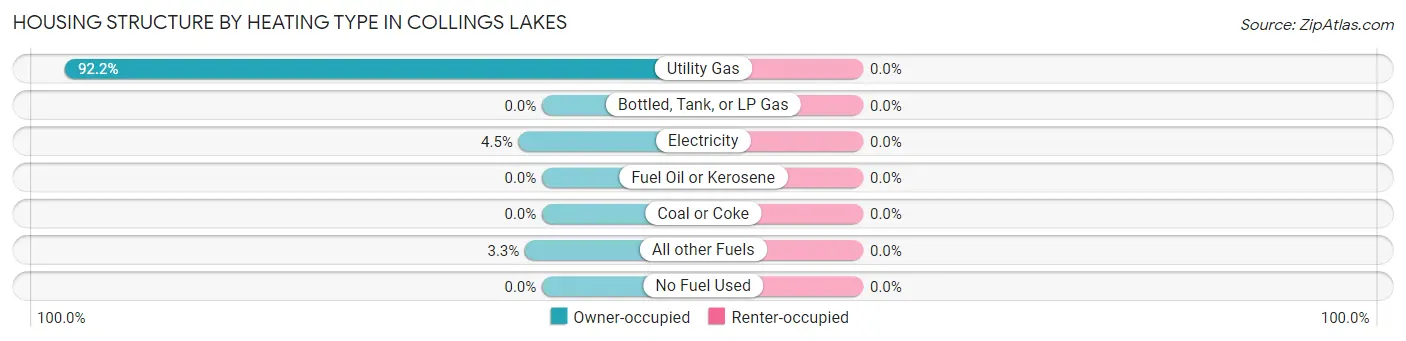
| Heating Type | Owner-occupied | Renter-occupied |
| Utility Gas | 590 (92.2%) | 0 (0.0%) |
| Bottled, Tank, or LP Gas | 0 (0.0%) | 0 (0.0%) |
| Electricity | 29 (4.5%) | 0 (0.0%) |
| Fuel Oil or Kerosene | 0 (0.0%) | 0 (0.0%) |
| Coal or Coke | 0 (0.0%) | 0 (0.0%) |
| All other Fuels | 21 (3.3%) | 0 (0.0%) |
| No Fuel Used | 0 (0.0%) | 0 (0.0%) |
| Total | 640 (100.0%) | 0 (0.0%) |
Household Vehicle Usage in Collings Lakes
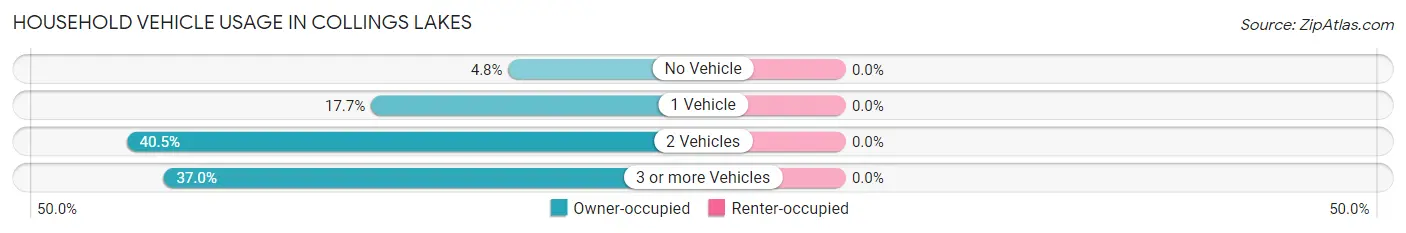
| Vehicles per Household | Owner-occupied | Renter-occupied |
| No Vehicle | 31 (4.8%) | 0 (0.0%) |
| 1 Vehicle | 113 (17.7%) | 0 (0.0%) |
| 2 Vehicles | 259 (40.5%) | 0 (0.0%) |
| 3 or more Vehicles | 237 (37.0%) | 0 (0.0%) |
| Total | 640 (100.0%) | 0 (0.0%) |
Real Estate & Mortgages in Collings Lakes
Real Estate and Mortgage Overview in Collings Lakes
| Characteristic | Without Mortgage | With Mortgage |
| Housing Units | 166 | 474 |
| Median Property Value | $163,500 | $214,500 |
| Median Household Income | $76,450 | $74 |
| Monthly Housing Costs | $839 | $15 |
| Real Estate Taxes | $5,986 | $17 |
Property Value by Mortgage Status in Collings Lakes
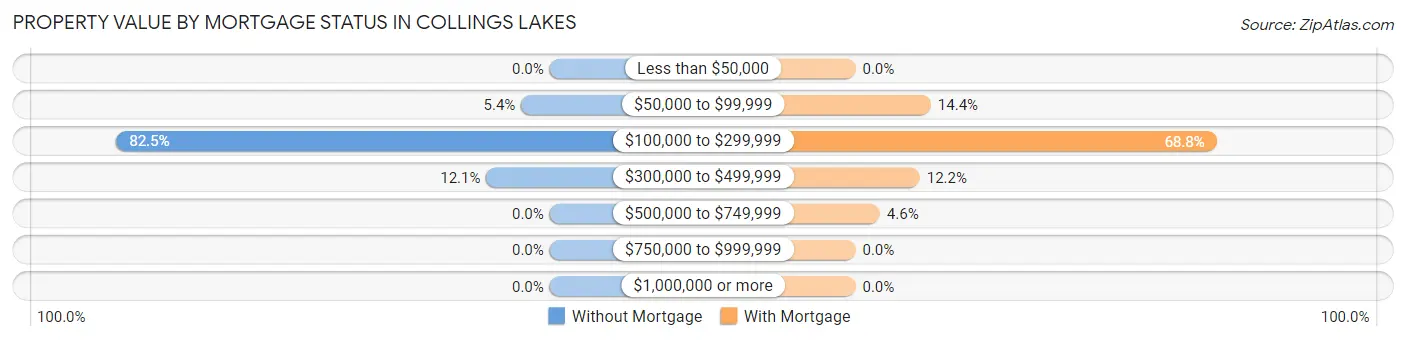
| Property Value | Without Mortgage | With Mortgage |
| Less than $50,000 | 0 (0.0%) | 0 (0.0%) |
| $50,000 to $99,999 | 9 (5.4%) | 68 (14.3%) |
| $100,000 to $299,999 | 137 (82.5%) | 326 (68.8%) |
| $300,000 to $499,999 | 20 (12.0%) | 58 (12.2%) |
| $500,000 to $749,999 | 0 (0.0%) | 22 (4.6%) |
| $750,000 to $999,999 | 0 (0.0%) | 0 (0.0%) |
| $1,000,000 or more | 0 (0.0%) | 0 (0.0%) |
| Total | 166 (100.0%) | 474 (100.0%) |
Household Income by Mortgage Status in Collings Lakes
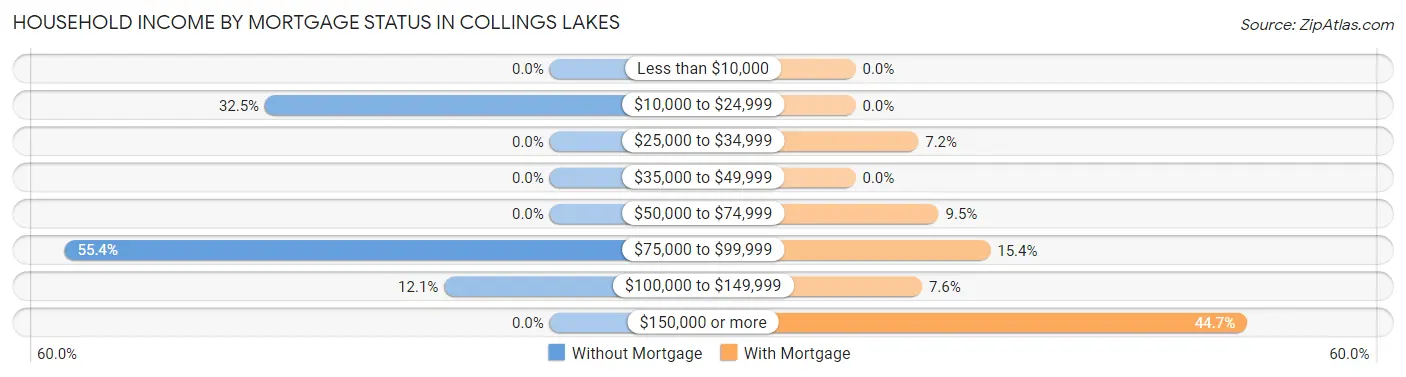
| Household Income | Without Mortgage | With Mortgage |
| Less than $10,000 | 0 (0.0%) | 0 (0.0%) |
| $10,000 to $24,999 | 54 (32.5%) | 0 (0.0%) |
| $25,000 to $34,999 | 0 (0.0%) | 34 (7.2%) |
| $35,000 to $49,999 | 0 (0.0%) | 0 (0.0%) |
| $50,000 to $74,999 | 0 (0.0%) | 45 (9.5%) |
| $75,000 to $99,999 | 92 (55.4%) | 73 (15.4%) |
| $100,000 to $149,999 | 20 (12.0%) | 36 (7.6%) |
| $150,000 or more | 0 (0.0%) | 212 (44.7%) |
| Total | 166 (100.0%) | 474 (100.0%) |
Property Value to Household Income Ratio in Collings Lakes
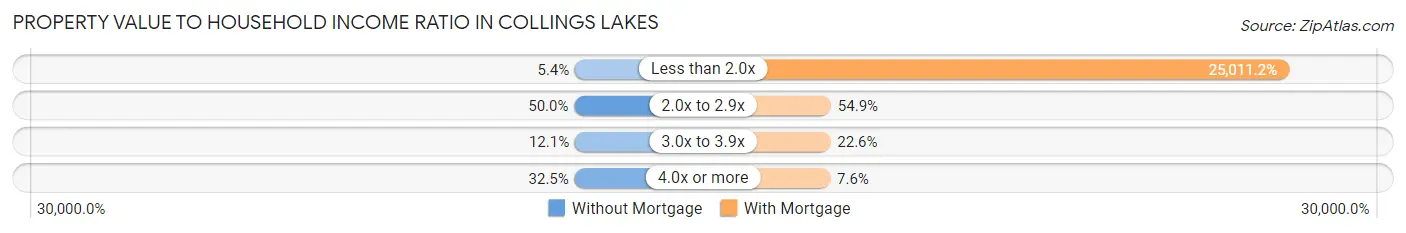
| Value-to-Income Ratio | Without Mortgage | With Mortgage |
| Less than 2.0x | 9 (5.4%) | 118,553 (25,011.2%) |
| 2.0x to 2.9x | 83 (50.0%) | 260 (54.8%) |
| 3.0x to 3.9x | 20 (12.0%) | 107 (22.6%) |
| 4.0x or more | 54 (32.5%) | 36 (7.6%) |
| Total | 166 (100.0%) | 474 (100.0%) |
Real Estate Taxes by Mortgage Status in Collings Lakes
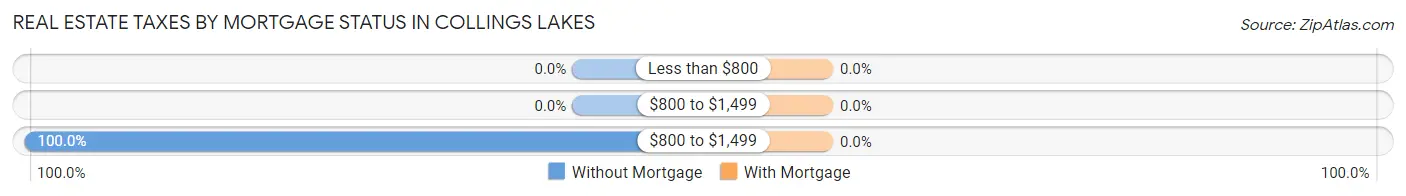
| Property Taxes | Without Mortgage | With Mortgage |
| Less than $800 | 0 (0.0%) | 0 (0.0%) |
| $800 to $1,499 | 0 (0.0%) | 0 (0.0%) |
| $800 to $1,499 | 166 (100.0%) | 0 (0.0%) |
| Total | 166 (100.0%) | 474 (100.0%) |
Health & Disability in Collings Lakes
Health Insurance Coverage by Age in Collings Lakes
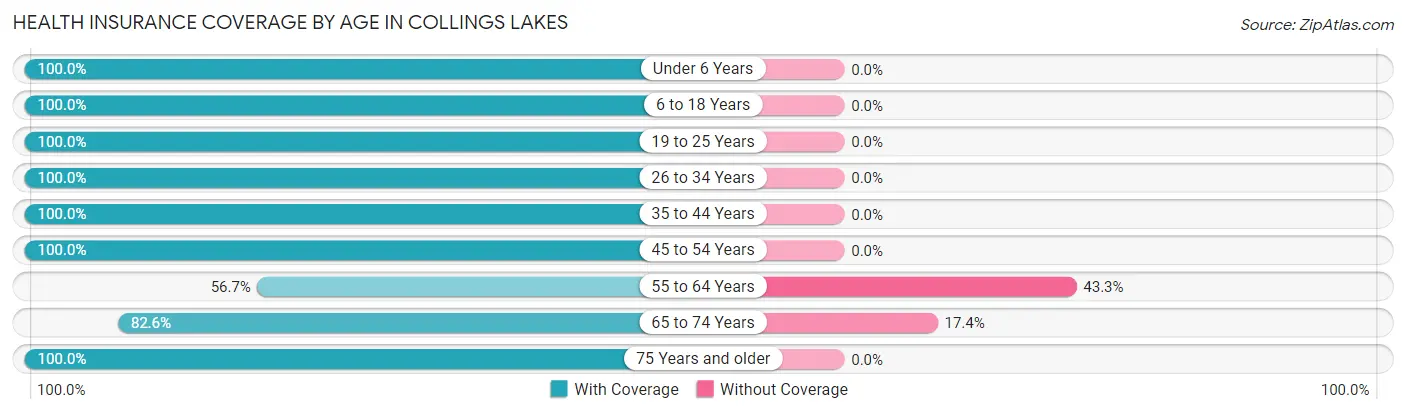
| Age Bracket | With Coverage | Without Coverage |
| Under 6 Years | 273 (100.0%) | 0 (0.0%) |
| 6 to 18 Years | 346 (100.0%) | 0 (0.0%) |
| 19 to 25 Years | 331 (100.0%) | 0 (0.0%) |
| 26 to 34 Years | 384 (100.0%) | 0 (0.0%) |
| 35 to 44 Years | 112 (100.0%) | 0 (0.0%) |
| 45 to 54 Years | 442 (100.0%) | 0 (0.0%) |
| 55 to 64 Years | 76 (56.7%) | 58 (43.3%) |
| 65 to 74 Years | 38 (82.6%) | 8 (17.4%) |
| 75 Years and older | 43 (100.0%) | 0 (0.0%) |
| Total | 2,045 (96.9%) | 66 (3.1%) |
Health Insurance Coverage by Citizenship Status in Collings Lakes
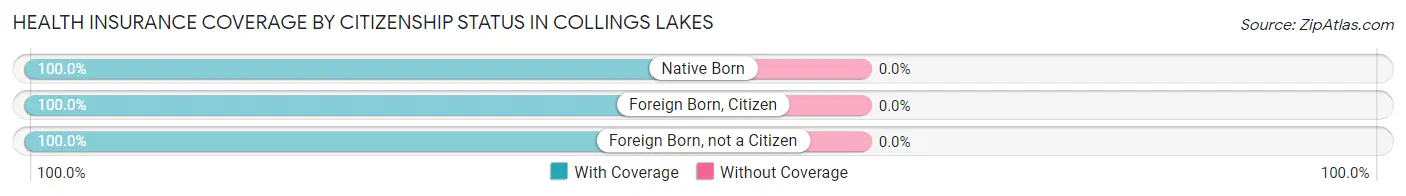
| Citizenship Status | With Coverage | Without Coverage |
| Native Born | 273 (100.0%) | 0 (0.0%) |
| Foreign Born, Citizen | 346 (100.0%) | 0 (0.0%) |
| Foreign Born, not a Citizen | 331 (100.0%) | 0 (0.0%) |
Health Insurance Coverage by Household Income in Collings Lakes
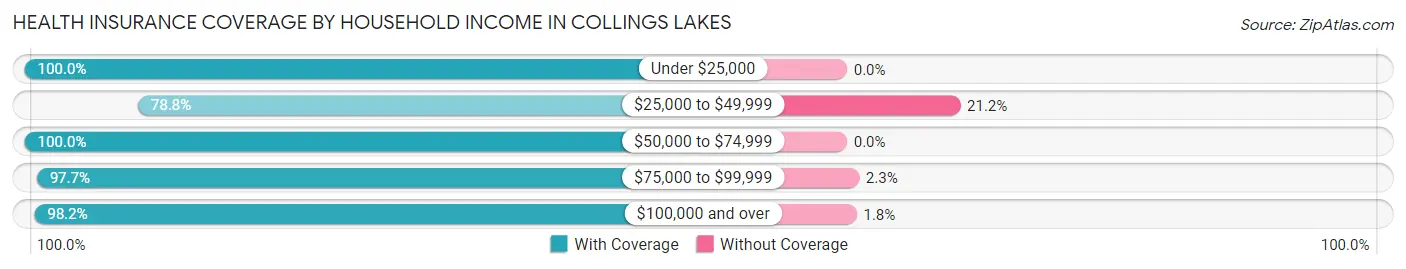
| Household Income | With Coverage | Without Coverage |
| Under $25,000 | 248 (100.0%) | 0 (0.0%) |
| $25,000 to $49,999 | 141 (78.8%) | 38 (21.2%) |
| $50,000 to $74,999 | 232 (100.0%) | 0 (0.0%) |
| $75,000 to $99,999 | 345 (97.7%) | 8 (2.3%) |
| $100,000 and over | 1,079 (98.2%) | 20 (1.8%) |
Public vs Private Health Insurance Coverage by Age in Collings Lakes
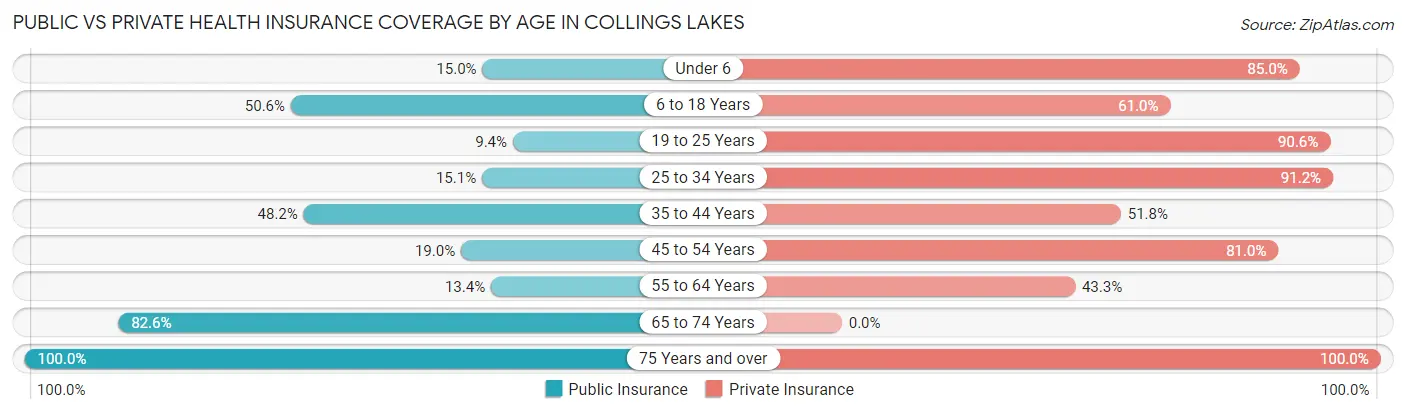
| Age Bracket | Public Insurance | Private Insurance |
| Under 6 | 41 (15.0%) | 232 (85.0%) |
| 6 to 18 Years | 175 (50.6%) | 211 (61.0%) |
| 19 to 25 Years | 31 (9.4%) | 300 (90.6%) |
| 25 to 34 Years | 58 (15.1%) | 350 (91.1%) |
| 35 to 44 Years | 54 (48.2%) | 58 (51.8%) |
| 45 to 54 Years | 84 (19.0%) | 358 (81.0%) |
| 55 to 64 Years | 18 (13.4%) | 58 (43.3%) |
| 65 to 74 Years | 38 (82.6%) | 0 (0.0%) |
| 75 Years and over | 43 (100.0%) | 43 (100.0%) |
| Total | 542 (25.7%) | 1,610 (76.3%) |
Disability Status by Sex by Age in Collings Lakes
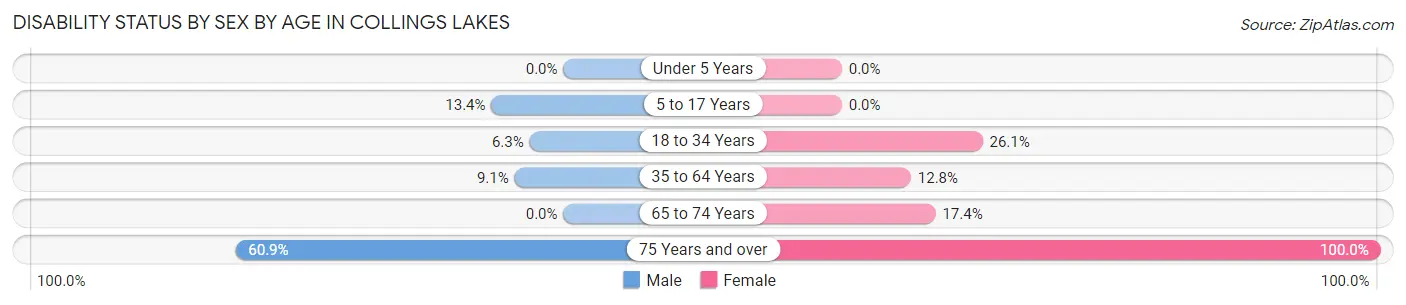
| Age Bracket | Male | Female |
| Under 5 Years | 0 (0.0%) | 0 (0.0%) |
| 5 to 17 Years | 29 (13.4%) | 0 (0.0%) |
| 18 to 34 Years | 24 (6.3%) | 87 (26.1%) |
| 35 to 64 Years | 27 (9.1%) | 50 (12.8%) |
| 65 to 74 Years | 0 (0.0%) | 8 (17.4%) |
| 75 Years and over | 14 (60.9%) | 20 (100.0%) |
Disability Class by Sex by Age in Collings Lakes
Disability Class: Hearing Difficulty
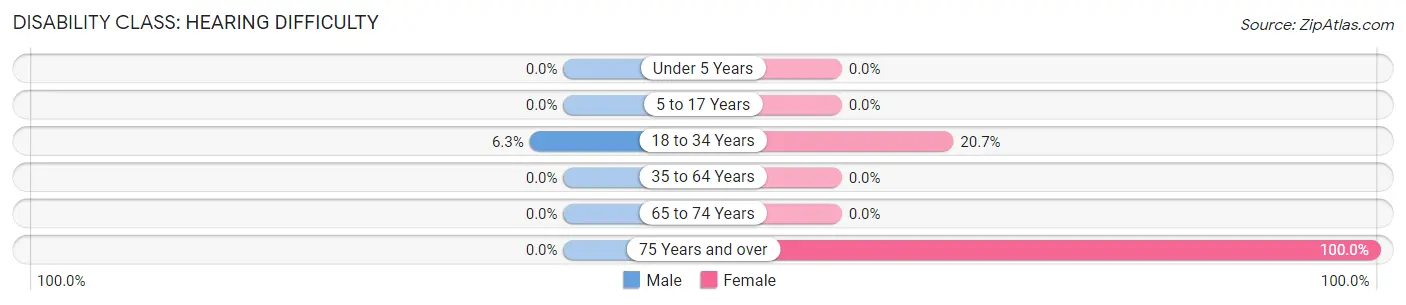
| Age Bracket | Male | Female |
| Under 5 Years | 0 (0.0%) | 0 (0.0%) |
| 5 to 17 Years | 0 (0.0%) | 0 (0.0%) |
| 18 to 34 Years | 24 (6.3%) | 69 (20.7%) |
| 35 to 64 Years | 0 (0.0%) | 0 (0.0%) |
| 65 to 74 Years | 0 (0.0%) | 0 (0.0%) |
| 75 Years and over | 0 (0.0%) | 20 (100.0%) |
Disability Class: Vision Difficulty

| Age Bracket | Male | Female |
| Under 5 Years | 0 (0.0%) | 0 (0.0%) |
| 5 to 17 Years | 0 (0.0%) | 0 (0.0%) |
| 18 to 34 Years | 0 (0.0%) | 18 (5.4%) |
| 35 to 64 Years | 0 (0.0%) | 20 (5.1%) |
| 65 to 74 Years | 0 (0.0%) | 0 (0.0%) |
| 75 Years and over | 0 (0.0%) | 0 (0.0%) |
Disability Class: Cognitive Difficulty
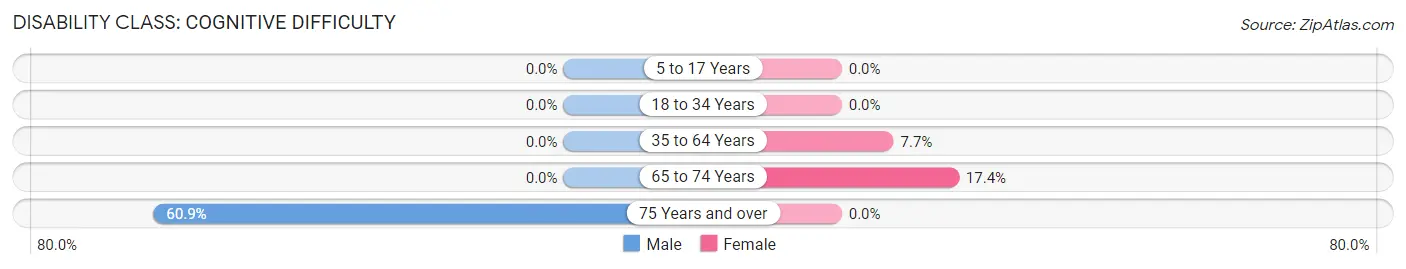
| Age Bracket | Male | Female |
| 5 to 17 Years | 0 (0.0%) | 0 (0.0%) |
| 18 to 34 Years | 0 (0.0%) | 0 (0.0%) |
| 35 to 64 Years | 0 (0.0%) | 30 (7.7%) |
| 65 to 74 Years | 0 (0.0%) | 8 (17.4%) |
| 75 Years and over | 14 (60.9%) | 0 (0.0%) |
Disability Class: Ambulatory Difficulty
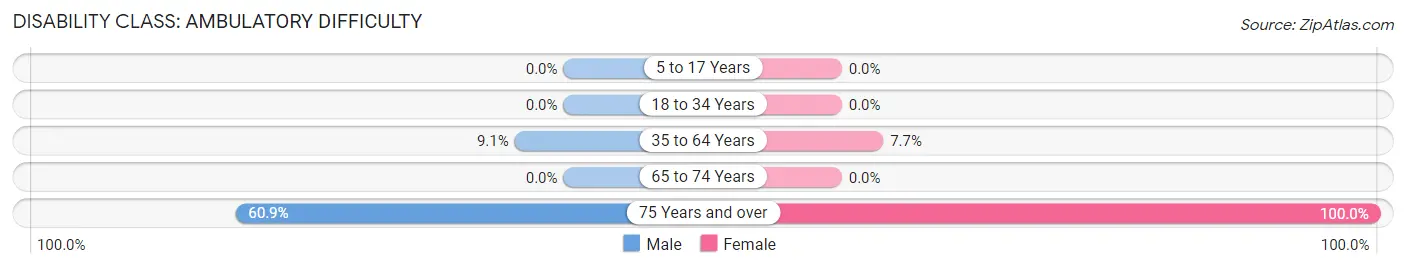
| Age Bracket | Male | Female |
| 5 to 17 Years | 0 (0.0%) | 0 (0.0%) |
| 18 to 34 Years | 0 (0.0%) | 0 (0.0%) |
| 35 to 64 Years | 27 (9.1%) | 30 (7.7%) |
| 65 to 74 Years | 0 (0.0%) | 0 (0.0%) |
| 75 Years and over | 14 (60.9%) | 20 (100.0%) |
Disability Class: Self-Care Difficulty
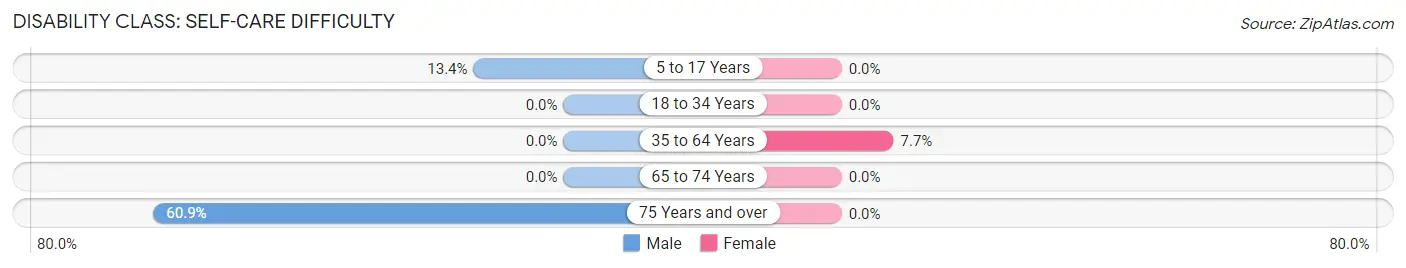
| Age Bracket | Male | Female |
| 5 to 17 Years | 29 (13.4%) | 0 (0.0%) |
| 18 to 34 Years | 0 (0.0%) | 0 (0.0%) |
| 35 to 64 Years | 0 (0.0%) | 30 (7.7%) |
| 65 to 74 Years | 0 (0.0%) | 0 (0.0%) |
| 75 Years and over | 14 (60.9%) | 0 (0.0%) |
Technology Access in Collings Lakes
Computing Device Access in Collings Lakes
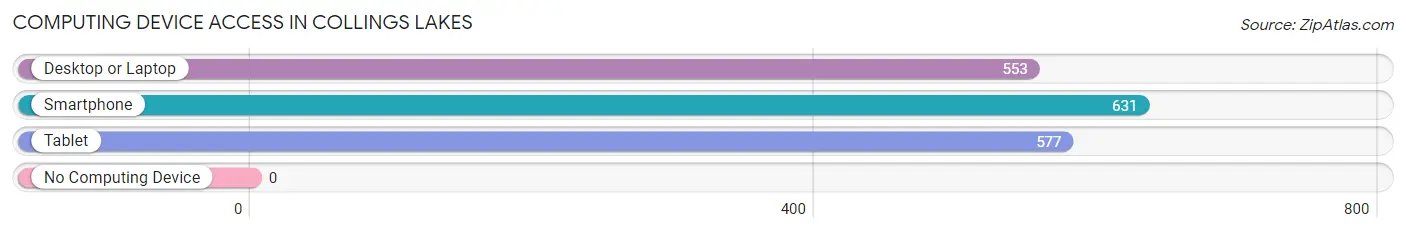
| Device Type | # Households | % Households |
| Desktop or Laptop | 553 | 86.4% |
| Smartphone | 631 | 98.6% |
| Tablet | 577 | 90.2% |
| No Computing Device | 0 | 0.0% |
| Total | 640 | 100.0% |
Internet Access in Collings Lakes
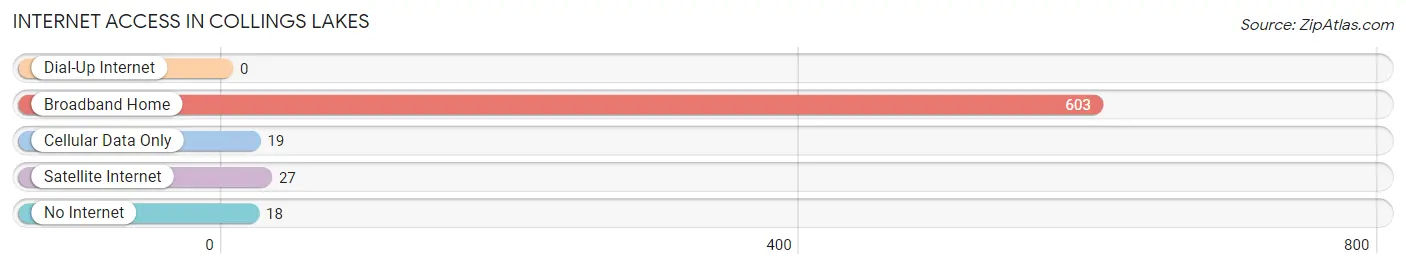
| Internet Type | # Households | % Households |
| Dial-Up Internet | 0 | 0.0% |
| Broadband Home | 603 | 94.2% |
| Cellular Data Only | 19 | 3.0% |
| Satellite Internet | 27 | 4.2% |
| No Internet | 18 | 2.8% |
| Total | 640 | 100.0% |
Collings Lakes Summary
Collings Lakes is a small unincorporated community located in Atlantic County, New Jersey. It is situated in the Pine Barrens region of the state, and is part of the Greater Atlantic City metropolitan area. The community is located on the border of Ocean and Atlantic counties, and is bordered by the towns of Buena Vista Township, Egg Harbor Township, and Hamilton Township.
History
The area that is now Collings Lakes was originally inhabited by the Lenape Native Americans. The first European settlers arrived in the area in the late 17th century, and the community was officially established in 1790. The community was named after the Collings family, who were among the first settlers in the area.
The area was largely rural until the 1950s, when the construction of the Garden State Parkway and other highways made it easier for people to travel to and from the area. This led to an influx of new residents, and the community began to grow.
Geography
Collings Lakes is located in the Pine Barrens region of New Jersey. The community is situated in the Atlantic Coastal Plain, and is bordered by the towns of Buena Vista Township, Egg Harbor Township, and Hamilton Township. The community is located on the border of Ocean and Atlantic counties.
The area is characterized by sandy soil and pine forests. The climate is humid subtropical, with hot, humid summers and mild winters. The average annual temperature is around 60°F (15°C).
Economy
The economy of Collings Lakes is largely based on tourism and retail. The area is home to several small businesses, including restaurants, shops, and other services. The community is also home to a number of small farms, which produce fruits and vegetables for local consumption.
Demographics
As of the 2010 census, the population of Collings Lakes was 2,845. The racial makeup of the community was 94.3% White, 2.2% African American, 0.7% Asian, and 2.8% from other races. The median household income was $50,945, and the median family income was $60,945.
Conclusion
Collings Lakes is a small unincorporated community located in Atlantic County, New Jersey. It is situated in the Pine Barrens region of the state, and is part of the Greater Atlantic City metropolitan area. The community is largely rural, and is home to a number of small businesses and farms. The economy of the area is largely based on tourism and retail, and the population is largely white.
Common Questions
What is Per Capita Income in Collings Lakes?
Per Capita income in Collings Lakes is $29,615.
What is the Median Family Income in Collings Lakes?
Median Family Income in Collings Lakes is $82,961.
What is the Median Household income in Collings Lakes?
Median Household Income in Collings Lakes is $84,265.
What is Income or Wage Gap in Collings Lakes?
Income or Wage Gap in Collings Lakes is 67.8%.
Women in Collings Lakes earn 32.2 cents for every dollar earned by a man.
What is Inequality or Gini Index in Collings Lakes?
Inequality or Gini Index in Collings Lakes is 0.29.
What is the Total Population of Collings Lakes?
Total Population of Collings Lakes is 2,111.
What is the Total Male Population of Collings Lakes?
Total Male Population of Collings Lakes is 1,000.
What is the Total Female Population of Collings Lakes?
Total Female Population of Collings Lakes is 1,111.
What is the Ratio of Males per 100 Females in Collings Lakes?
There are 90.01 Males per 100 Females in Collings Lakes.
What is the Ratio of Females per 100 Males in Collings Lakes?
There are 111.10 Females per 100 Males in Collings Lakes.
What is the Median Population Age in Collings Lakes?
Median Population Age in Collings Lakes is 29.1 Years.
What is the Average Family Size in Collings Lakes
Average Family Size in Collings Lakes is 3.3 People.
What is the Average Household Size in Collings Lakes
Average Household Size in Collings Lakes is 3.3 People.
How Large is the Labor Force in Collings Lakes?
There are 1,160 People in the Labor Forcein in Collings Lakes.
What is the Percentage of People in the Labor Force in Collings Lakes?
70.0% of People are in the Labor Force in Collings Lakes.
What is the Unemployment Rate in Collings Lakes?
Unemployment Rate in Collings Lakes is 5.2%.