Avon by the Sea borough, NJ Map & Demographics
Avon by the Sea borough Overview
$90,056
PER CAPITA INCOME
$147,750
AVG FAMILY INCOME
$106,563
AVG HOUSEHOLD INCOME
42.7%
WAGE / INCOME GAP [ % ]
57.3¢/ $1
WAGE / INCOME GAP [ $ ]
0.55
INEQUALITY / GINI INDEX
1,792
TOTAL POPULATION
783
MALE POPULATION
1,009
FEMALE POPULATION
77.60
MALES / 100 FEMALES
128.86
FEMALES / 100 MALES
56.2
MEDIAN AGE
2.8
AVG FAMILY SIZE
2.1
AVG HOUSEHOLD SIZE
956
LABOR FORCE [ PEOPLE ]
59.8%
PERCENT IN LABOR FORCE
5.6%
UNEMPLOYMENT RATE
Income in Avon by the Sea borough
Income Overview in Avon by the Sea borough
Per Capita Income in Avon by the Sea borough is $90,056, while median incomes of families and households are $147,750 and $106,563 respectively.
| Characteristic | Number | Measure |
| Per Capita Income | 1,792 | $90,056 |
| Median Family Income | 483 | $147,750 |
| Mean Family Income | 483 | $262,365 |
| Median Household Income | 868 | $106,563 |
| Mean Household Income | 868 | $182,706 |
| Income Deficit | 483 | $0 |
| Wage / Income Gap (%) | 1,792 | 42.67% |
| Wage / Income Gap ($) | 1,792 | 57.33¢ per $1 |
| Gini / Inequality Index | 1,792 | 0.55 |
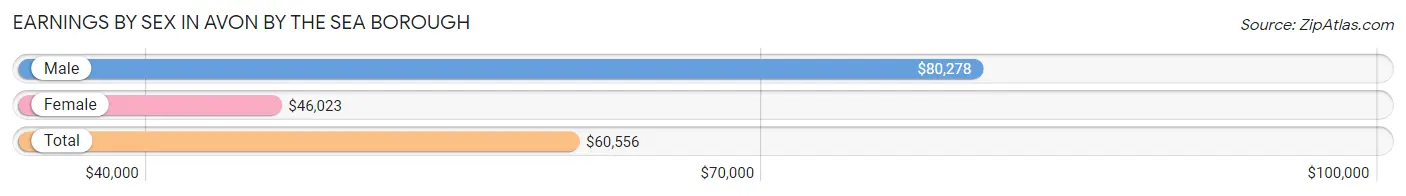
Earnings by Sex in Avon by the Sea borough
Average Earnings in Avon by the Sea borough are $60,556, $80,278 for men and $46,023 for women, a difference of 42.7%.
| Sex | Number | Average Earnings |
| Male | 492 (48.9%) | $80,278 |
| Female | 514 (51.1%) | $46,023 |
| Total | 1,006 (100.0%) | $60,556 |
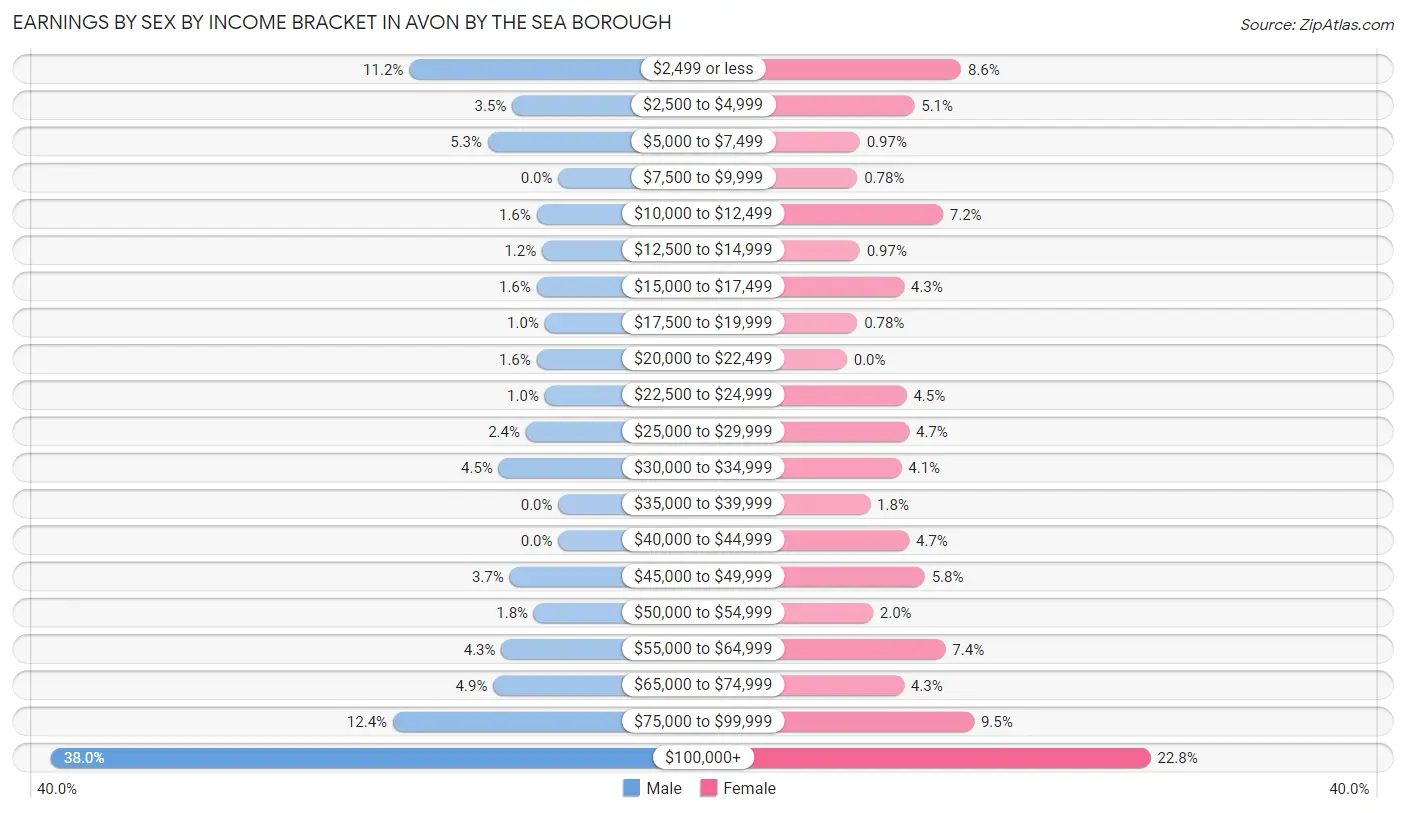
Earnings by Sex by Income Bracket in Avon by the Sea borough
The most common earnings brackets in Avon by the Sea borough are $100,000+ for men (187 | 38.0%) and $100,000+ for women (117 | 22.8%).
| Income | Male | Female |
| $2,499 or less | 55 (11.2%) | 44 (8.6%) |
| $2,500 to $4,999 | 17 (3.5%) | 26 (5.1%) |
| $5,000 to $7,499 | 26 (5.3%) | 5 (1.0%) |
| $7,500 to $9,999 | 0 (0.0%) | 4 (0.8%) |
| $10,000 to $12,499 | 8 (1.6%) | 37 (7.2%) |
| $12,500 to $14,999 | 6 (1.2%) | 5 (1.0%) |
| $15,000 to $17,499 | 8 (1.6%) | 22 (4.3%) |
| $17,500 to $19,999 | 5 (1.0%) | 4 (0.8%) |
| $20,000 to $22,499 | 8 (1.6%) | 0 (0.0%) |
| $22,500 to $24,999 | 5 (1.0%) | 23 (4.5%) |
| $25,000 to $29,999 | 12 (2.4%) | 24 (4.7%) |
| $30,000 to $34,999 | 22 (4.5%) | 21 (4.1%) |
| $35,000 to $39,999 | 0 (0.0%) | 9 (1.8%) |
| $40,000 to $44,999 | 0 (0.0%) | 24 (4.7%) |
| $45,000 to $49,999 | 18 (3.7%) | 30 (5.8%) |
| $50,000 to $54,999 | 9 (1.8%) | 10 (1.9%) |
| $55,000 to $64,999 | 21 (4.3%) | 38 (7.4%) |
| $65,000 to $74,999 | 24 (4.9%) | 22 (4.3%) |
| $75,000 to $99,999 | 61 (12.4%) | 49 (9.5%) |
| $100,000+ | 187 (38.0%) | 117 (22.8%) |
| Total | 492 (100.0%) | 514 (100.0%) |
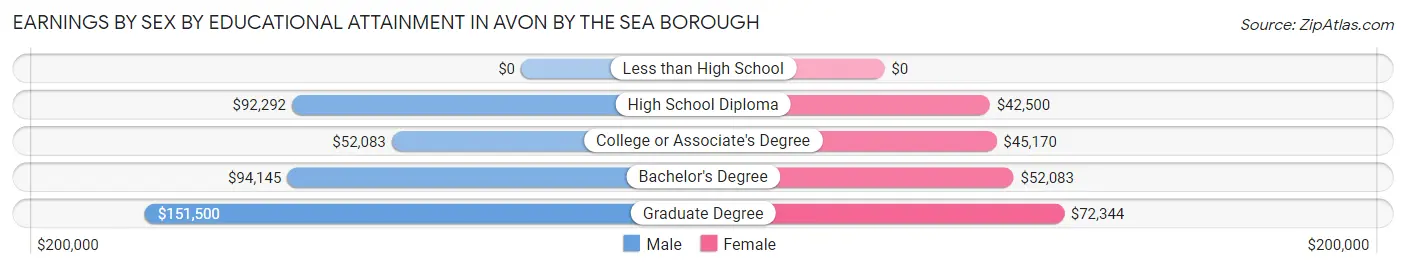
Earnings by Sex by Educational Attainment in Avon by the Sea borough
Average earnings in Avon by the Sea borough are $93,750 for men and $49,844 for women, a difference of 46.8%. Men with an educational attainment of graduate degree enjoy the highest average annual earnings of $151,500, while those with college or associate's degree education earn the least with $52,083. Women with an educational attainment of graduate degree earn the most with the average annual earnings of $72,344, while those with high school diploma education have the smallest earnings of $42,500.
| Educational Attainment | Male Income | Female Income |
| Less than High School | - | - |
| High School Diploma | $92,292 | $42,500 |
| College or Associate's Degree | $52,083 | $45,170 |
| Bachelor's Degree | $94,145 | $52,083 |
| Graduate Degree | $151,500 | $72,344 |
| Total | $93,750 | $49,844 |
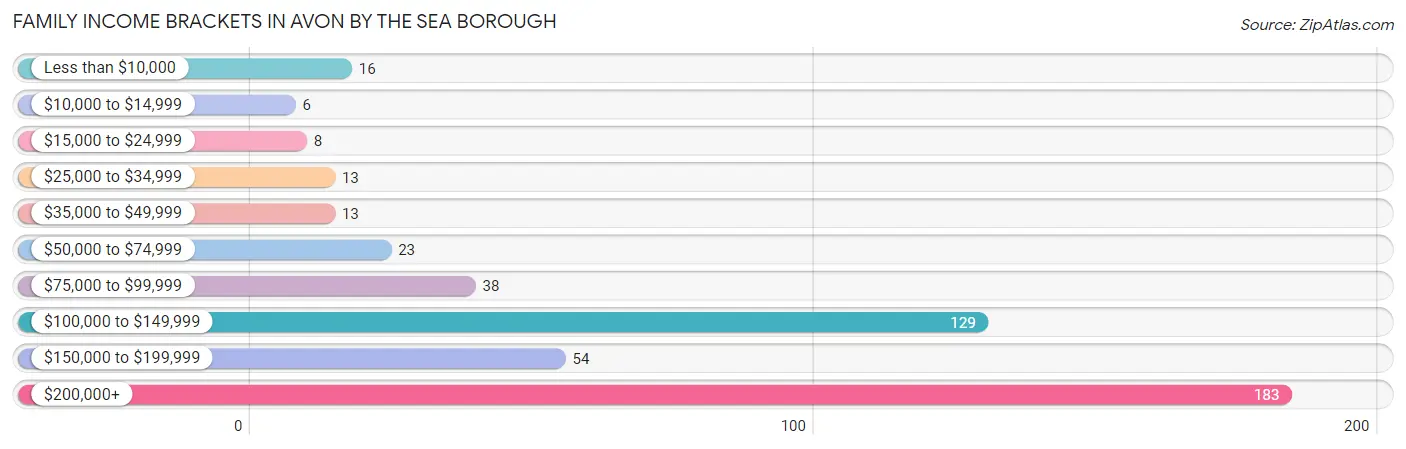
Family Income in Avon by the Sea borough
Family Income Brackets in Avon by the Sea borough
According to the Avon by the Sea borough family income data, there are 183 families falling into the $200,000+ income range, which is the most common income bracket and makes up 37.9% of all families. Conversely, the $10,000 to $14,999 income bracket is the least frequent group with only 6 families (1.2%) belonging to this category.
| Income Bracket | # Families | % Families |
| Less than $10,000 | 16 | 3.3% |
| $10,000 to $14,999 | 6 | 1.2% |
| $15,000 to $24,999 | 8 | 1.7% |
| $25,000 to $34,999 | 13 | 2.7% |
| $35,000 to $49,999 | 13 | 2.7% |
| $50,000 to $74,999 | 23 | 4.8% |
| $75,000 to $99,999 | 38 | 7.9% |
| $100,000 to $149,999 | 129 | 26.7% |
| $150,000 to $199,999 | 54 | 11.2% |
| $200,000+ | 183 | 37.9% |
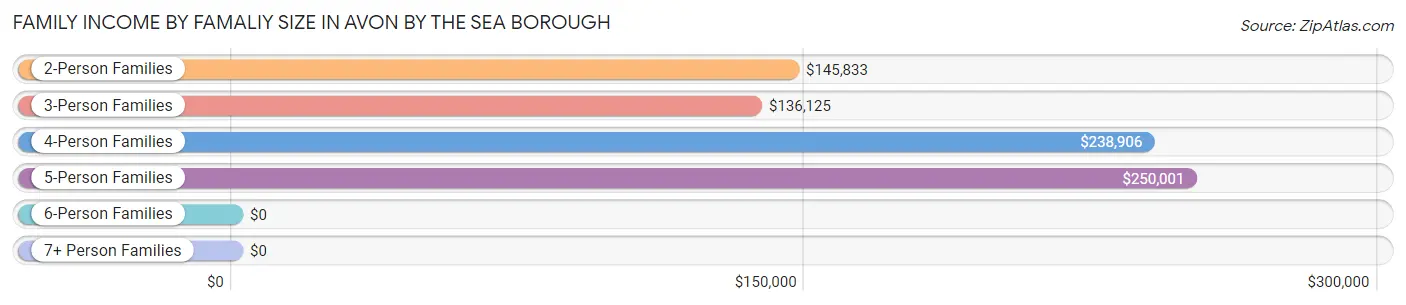
Family Income by Famaliy Size in Avon by the Sea borough
5-person families (26 | 5.4%) account for the highest median family income in Avon by the Sea borough with $250,001 per family, while 2-person families (308 | 63.8%) have the highest median income of $72,916 per family member.
| Income Bracket | # Families | Median Income |
| 2-Person Families | 308 (63.8%) | $145,833 |
| 3-Person Families | 41 (8.5%) | $136,125 |
| 4-Person Families | 97 (20.1%) | $238,906 |
| 5-Person Families | 26 (5.4%) | $250,001 |
| 6-Person Families | 11 (2.3%) | $0 |
| 7+ Person Families | 0 (0.0%) | $0 |
| Total | 483 (100.0%) | $147,750 |
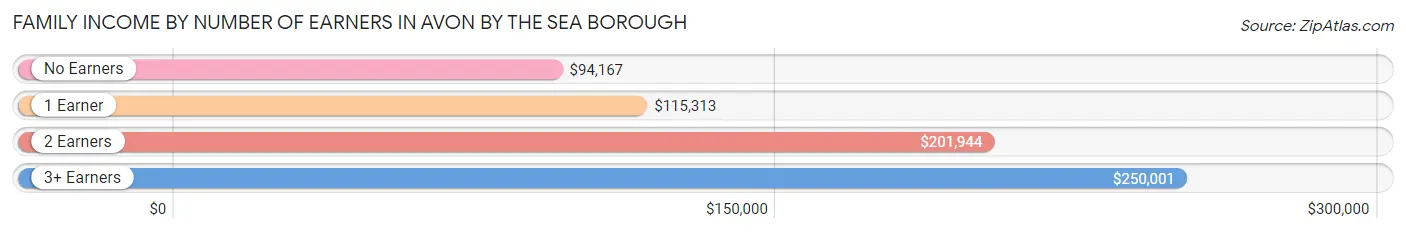
Family Income by Number of Earners in Avon by the Sea borough
The median family income in Avon by the Sea borough is $147,750, with families comprising 3+ earners (78) having the highest median family income of $250,001, while families with no earners (96) have the lowest median family income of $94,167, accounting for 16.2% and 19.9% of families, respectively.
| Number of Earners | # Families | Median Income |
| No Earners | 96 (19.9%) | $94,167 |
| 1 Earner | 167 (34.6%) | $115,313 |
| 2 Earners | 142 (29.4%) | $201,944 |
| 3+ Earners | 78 (16.2%) | $250,001 |
| Total | 483 (100.0%) | $147,750 |
Household Income in Avon by the Sea borough
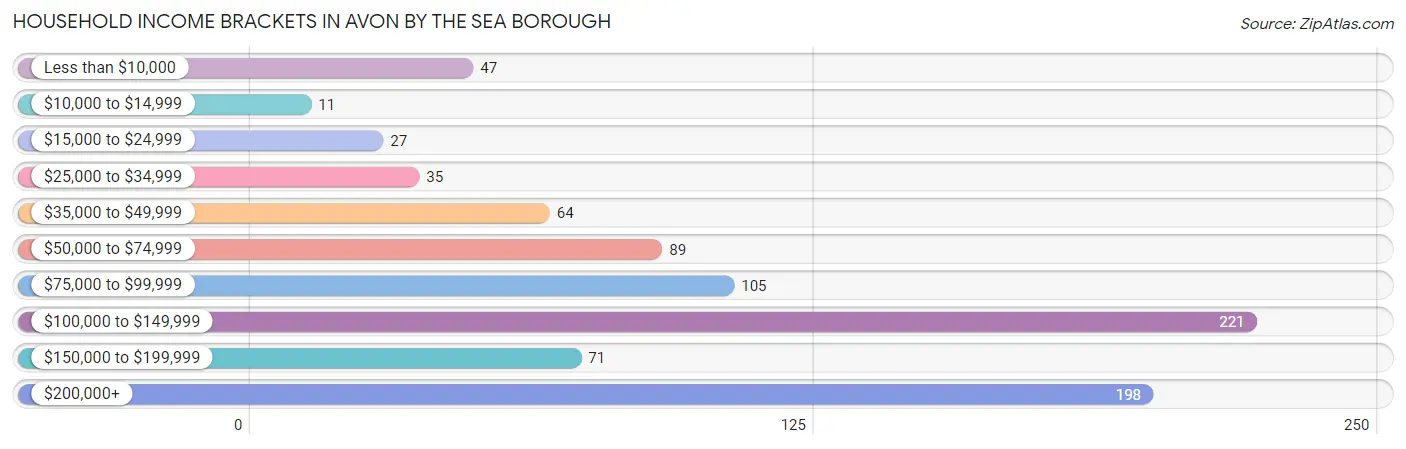
Household Income Brackets in Avon by the Sea borough
With 221 households falling in the category, the $100,000 to $149,999 income range is the most frequent in Avon by the Sea borough, accounting for 25.5% of all households. In contrast, only 11 households (1.3%) fall into the $10,000 to $14,999 income bracket, making it the least populous group.
| Income Bracket | # Households | % Households |
| Less than $10,000 | 47 | 5.4% |
| $10,000 to $14,999 | 11 | 1.3% |
| $15,000 to $24,999 | 27 | 3.1% |
| $25,000 to $34,999 | 35 | 4.0% |
| $35,000 to $49,999 | 64 | 7.4% |
| $50,000 to $74,999 | 89 | 10.3% |
| $75,000 to $99,999 | 105 | 12.1% |
| $100,000 to $149,999 | 221 | 25.5% |
| $150,000 to $199,999 | 71 | 8.2% |
| $200,000+ | 198 | 22.8% |
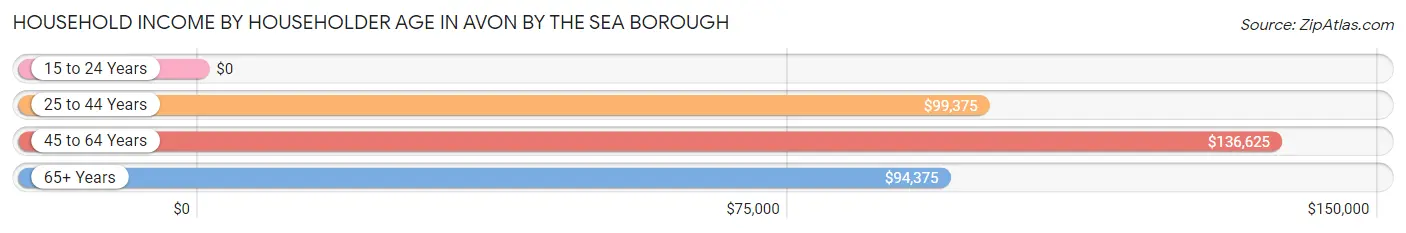
Household Income by Householder Age in Avon by the Sea borough
The median household income in Avon by the Sea borough is $106,563, with the highest median household income of $136,625 found in the 45 to 64 years age bracket for the primary householder. A total of 327 households (37.7%) fall into this category.
| Income Bracket | # Households | Median Income |
| 15 to 24 Years | 0 (0.0%) | $0 |
| 25 to 44 Years | 134 (15.4%) | $99,375 |
| 45 to 64 Years | 327 (37.7%) | $136,625 |
| 65+ Years | 407 (46.9%) | $94,375 |
| Total | 868 (100.0%) | $106,563 |
Poverty in Avon by the Sea borough
Income Below Poverty by Sex and Age in Avon by the Sea borough
With 8.6% poverty level for males and 9.5% for females among the residents of Avon by the Sea borough, 6 to 11 year old males and 6 to 11 year old females are the most vulnerable to poverty, with 14 males (56.0%) and 17 females (50.0%) in their respective age groups living below the poverty level.
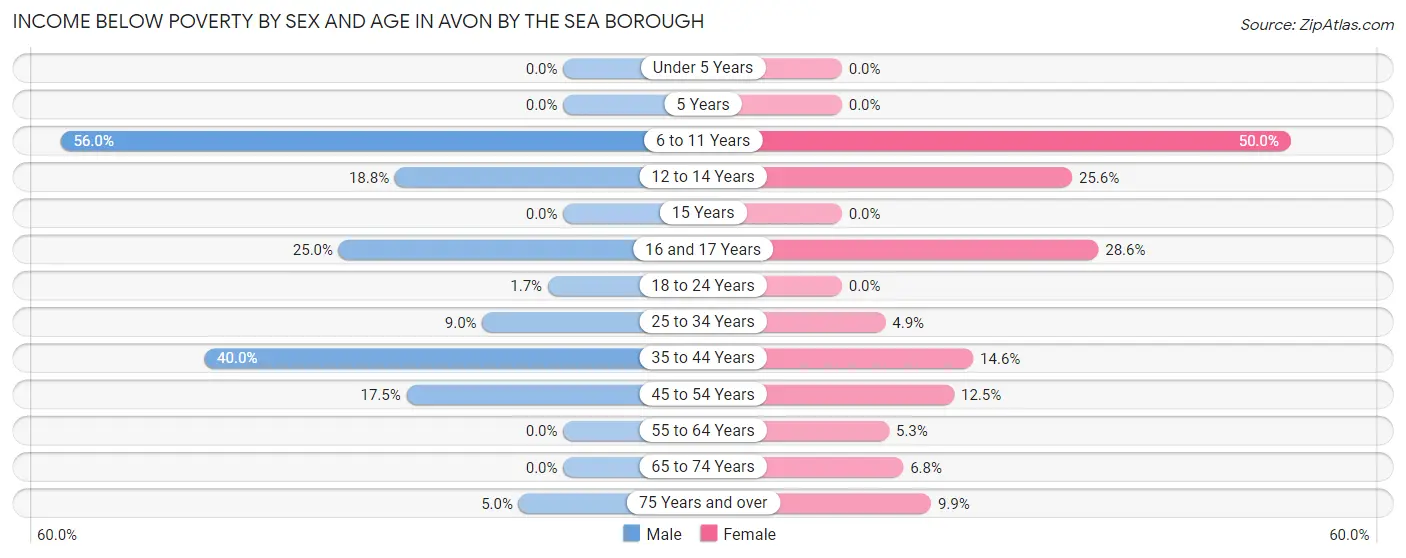
| Age Bracket | Male | Female |
| Under 5 Years | 0 (0.0%) | 0 (0.0%) |
| 5 Years | 0 (0.0%) | 0 (0.0%) |
| 6 to 11 Years | 14 (56.0%) | 17 (50.0%) |
| 12 to 14 Years | 6 (18.8%) | 10 (25.6%) |
| 15 Years | 0 (0.0%) | 0 (0.0%) |
| 16 and 17 Years | 5 (25.0%) | 6 (28.6%) |
| 18 to 24 Years | 1 (1.7%) | 0 (0.0%) |
| 25 to 34 Years | 10 (9.0%) | 5 (4.9%) |
| 35 to 44 Years | 14 (40.0%) | 6 (14.6%) |
| 45 to 54 Years | 11 (17.5%) | 14 (12.5%) |
| 55 to 64 Years | 0 (0.0%) | 11 (5.3%) |
| 65 to 74 Years | 0 (0.0%) | 13 (6.8%) |
| 75 Years and over | 6 (5.0%) | 14 (9.9%) |
| Total | 67 (8.6%) | 96 (9.5%) |
Income Above Poverty by Sex and Age in Avon by the Sea borough
According to the poverty statistics in Avon by the Sea borough, males aged under 5 years and females aged under 5 years are the age groups that are most secure financially, with 100.0% of males and 100.0% of females in these age groups living above the poverty line.
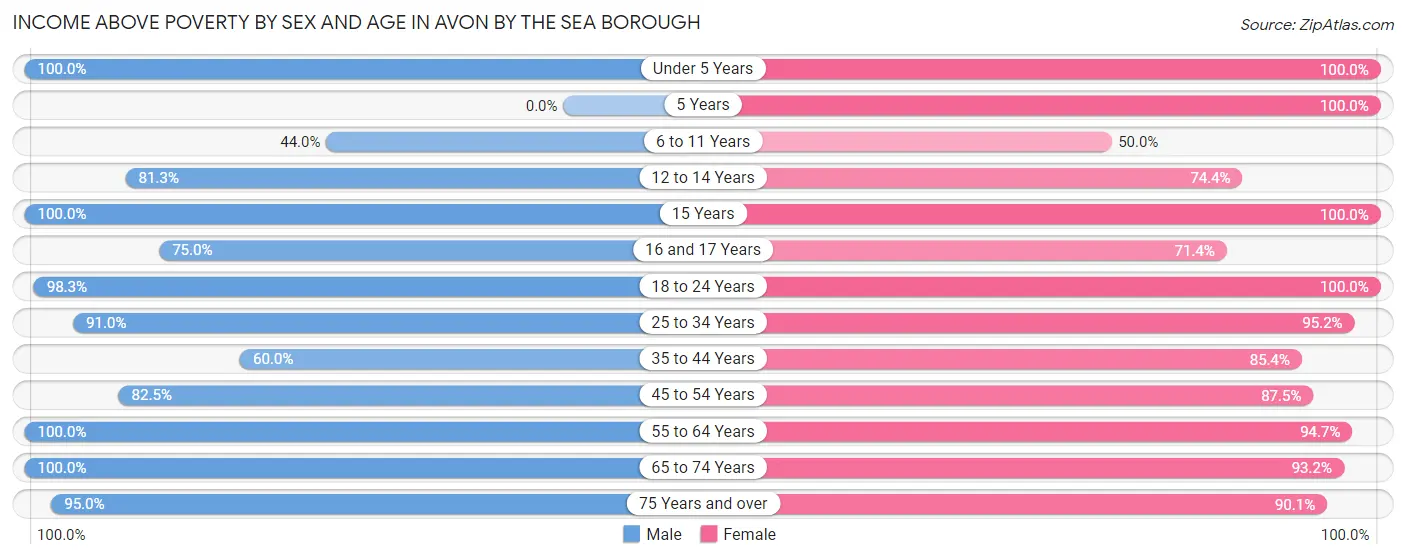
| Age Bracket | Male | Female |
| Under 5 Years | 9 (100.0%) | 13 (100.0%) |
| 5 Years | 0 (0.0%) | 15 (100.0%) |
| 6 to 11 Years | 11 (44.0%) | 17 (50.0%) |
| 12 to 14 Years | 26 (81.2%) | 29 (74.4%) |
| 15 Years | 10 (100.0%) | 16 (100.0%) |
| 16 and 17 Years | 15 (75.0%) | 15 (71.4%) |
| 18 to 24 Years | 57 (98.3%) | 75 (100.0%) |
| 25 to 34 Years | 101 (91.0%) | 98 (95.2%) |
| 35 to 44 Years | 21 (60.0%) | 35 (85.4%) |
| 45 to 54 Years | 52 (82.5%) | 98 (87.5%) |
| 55 to 64 Years | 153 (100.0%) | 198 (94.7%) |
| 65 to 74 Years | 146 (100.0%) | 177 (93.2%) |
| 75 Years and over | 115 (95.0%) | 127 (90.1%) |
| Total | 716 (91.4%) | 913 (90.5%) |
Income Below Poverty Among Married-Couple Families in Avon by the Sea borough
The poverty statistics for married-couple families in Avon by the Sea borough show that 4.6% or 19 of the total 412 families live below the poverty line. Families with 1 or 2 children have the highest poverty rate of 38.2%, comprising of 13 families. On the other hand, families with 3 or 4 children have the lowest poverty rate of 0.0%, which includes 0 families.
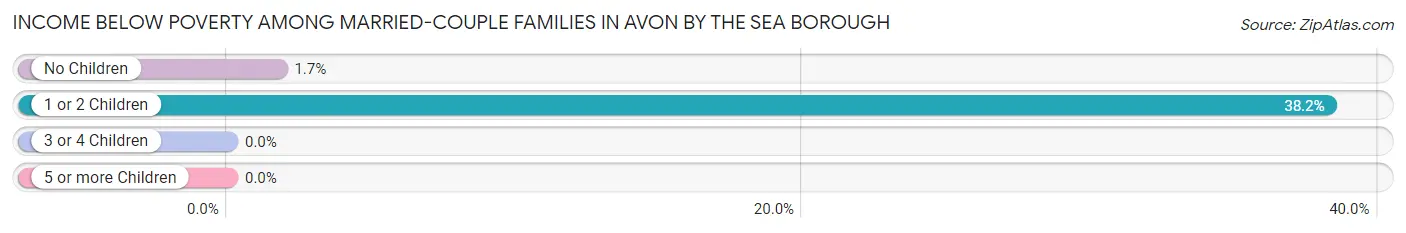
| Children | Above Poverty | Below Poverty |
| No Children | 343 (98.3%) | 6 (1.7%) |
| 1 or 2 Children | 21 (61.8%) | 13 (38.2%) |
| 3 or 4 Children | 29 (100.0%) | 0 (0.0%) |
| 5 or more Children | 0 (0.0%) | 0 (0.0%) |
| Total | 393 (95.4%) | 19 (4.6%) |
Income Below Poverty Among Single-Parent Households in Avon by the Sea borough
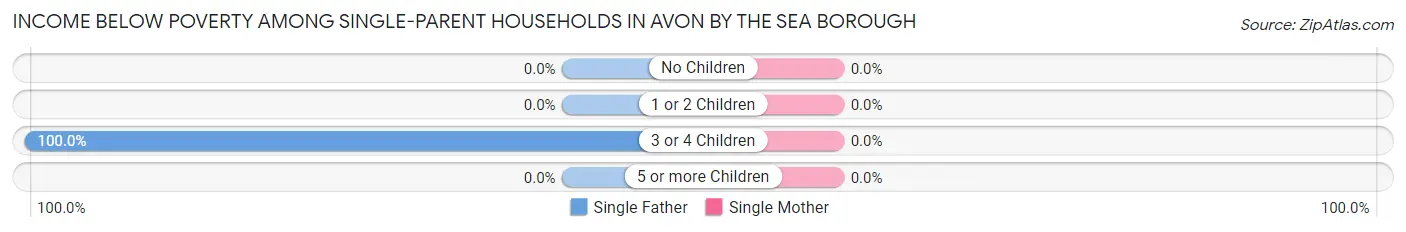
| Children | Single Father | Single Mother |
| No Children | 0 (0.0%) | 0 (0.0%) |
| 1 or 2 Children | 0 (0.0%) | 0 (0.0%) |
| 3 or 4 Children | 11 (100.0%) | 0 (0.0%) |
| 5 or more Children | 0 (0.0%) | 0 (0.0%) |
| Total | 11 (73.3%) | 0 (0.0%) |
Income Below Poverty Among Married-Couple vs Single-Parent Households in Avon by the Sea borough
The poverty data for Avon by the Sea borough shows that 19 of the married-couple family households (4.6%) and 11 of the single-parent households (15.5%) are living below the poverty level. Within the married-couple family households, those with 1 or 2 children have the highest poverty rate, with 13 households (38.2%) falling below the poverty line. Among the single-parent households, those with 3 or 4 children have the highest poverty rate, with 11 household (100.0%) living below poverty.
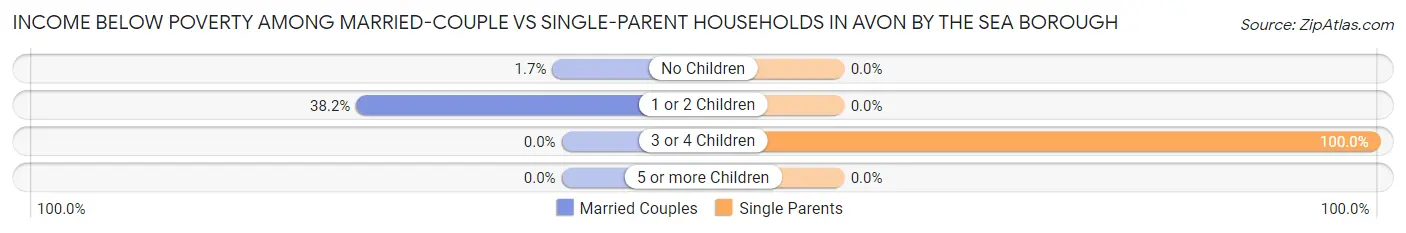
| Children | Married-Couple Families | Single-Parent Households |
| No Children | 6 (1.7%) | 0 (0.0%) |
| 1 or 2 Children | 13 (38.2%) | 0 (0.0%) |
| 3 or 4 Children | 0 (0.0%) | 11 (100.0%) |
| 5 or more Children | 0 (0.0%) | 0 (0.0%) |
| Total | 19 (4.6%) | 11 (15.5%) |
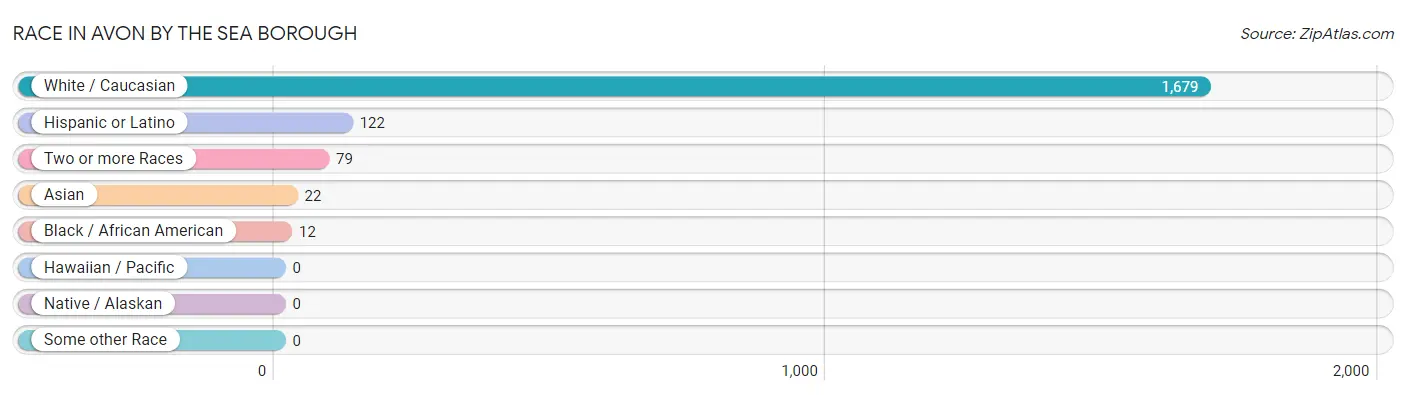
Race in Avon by the Sea borough
The most populous races in Avon by the Sea borough are White / Caucasian (1,679 | 93.7%), Hispanic or Latino (122 | 6.8%), and Two or more Races (79 | 4.4%).
| Race | # Population | % Population |
| Asian | 22 | 1.2% |
| Black / African American | 12 | 0.7% |
| Hawaiian / Pacific | 0 | 0.0% |
| Hispanic or Latino | 122 | 6.8% |
| Native / Alaskan | 0 | 0.0% |
| White / Caucasian | 1,679 | 93.7% |
| Two or more Races | 79 | 4.4% |
| Some other Race | 0 | 0.0% |
| Total | 1,792 | 100.0% |
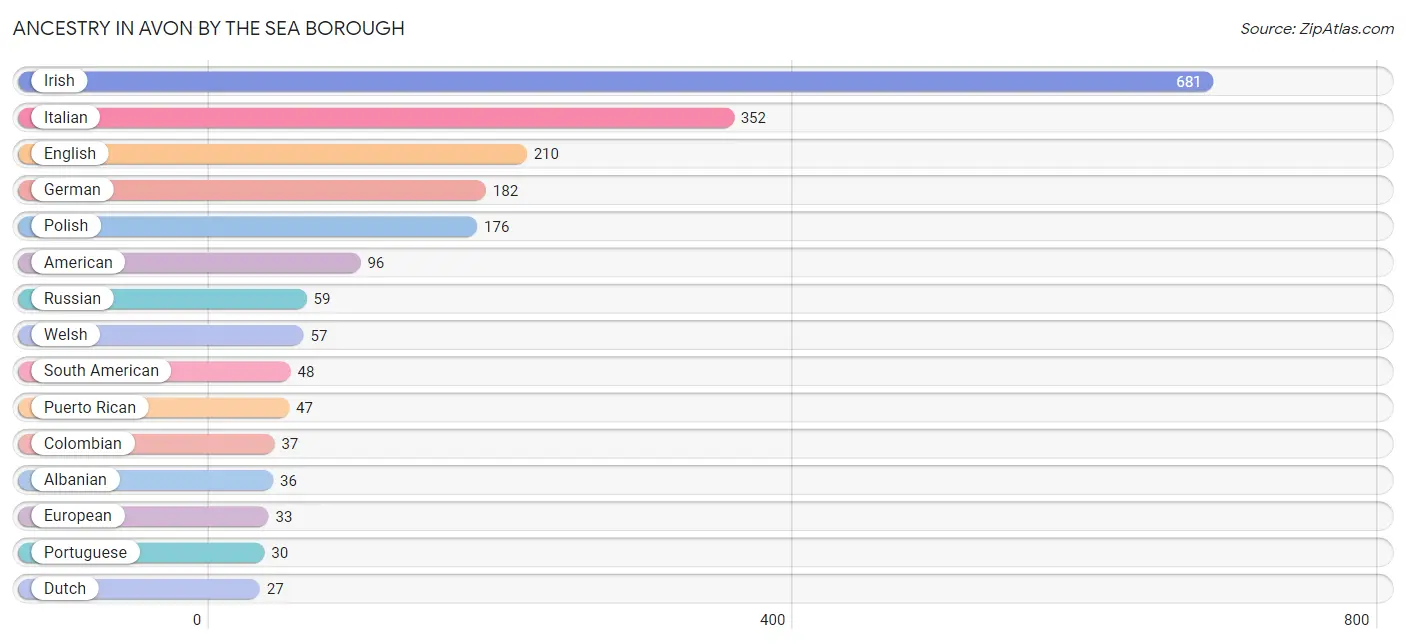
Ancestry in Avon by the Sea borough
The most populous ancestries reported in Avon by the Sea borough are Irish (681 | 38.0%), Italian (352 | 19.6%), English (210 | 11.7%), German (182 | 10.2%), and Polish (176 | 9.8%), together accounting for 89.3% of all Avon by the Sea borough residents.
| Ancestry | # Population | % Population |
| Albanian | 36 | 2.0% |
| American | 96 | 5.4% |
| Austrian | 26 | 1.5% |
| British | 14 | 0.8% |
| Burmese | 9 | 0.5% |
| Cambodian | 5 | 0.3% |
| Central American | 6 | 0.3% |
| Colombian | 37 | 2.1% |
| Costa Rican | 6 | 0.3% |
| Czech | 5 | 0.3% |
| Dutch | 27 | 1.5% |
| English | 210 | 11.7% |
| European | 33 | 1.8% |
| French | 5 | 0.3% |
| French Canadian | 5 | 0.3% |
| German | 182 | 10.2% |
| Guyanese | 14 | 0.8% |
| Hungarian | 26 | 1.5% |
| Iranian | 4 | 0.2% |
| Irish | 681 | 38.0% |
| Italian | 352 | 19.6% |
| Lithuanian | 8 | 0.4% |
| Mexican | 14 | 0.8% |
| Northern European | 6 | 0.3% |
| Pakistani | 8 | 0.4% |
| Polish | 176 | 9.8% |
| Portuguese | 30 | 1.7% |
| Puerto Rican | 47 | 2.6% |
| Russian | 59 | 3.3% |
| Scotch-Irish | 5 | 0.3% |
| Scottish | 11 | 0.6% |
| Slavic | 5 | 0.3% |
| South American | 48 | 2.7% |
| Spaniard | 7 | 0.4% |
| Swedish | 8 | 0.4% |
| Ukrainian | 5 | 0.3% |
| Welsh | 57 | 3.2% | View All 37 Rows |
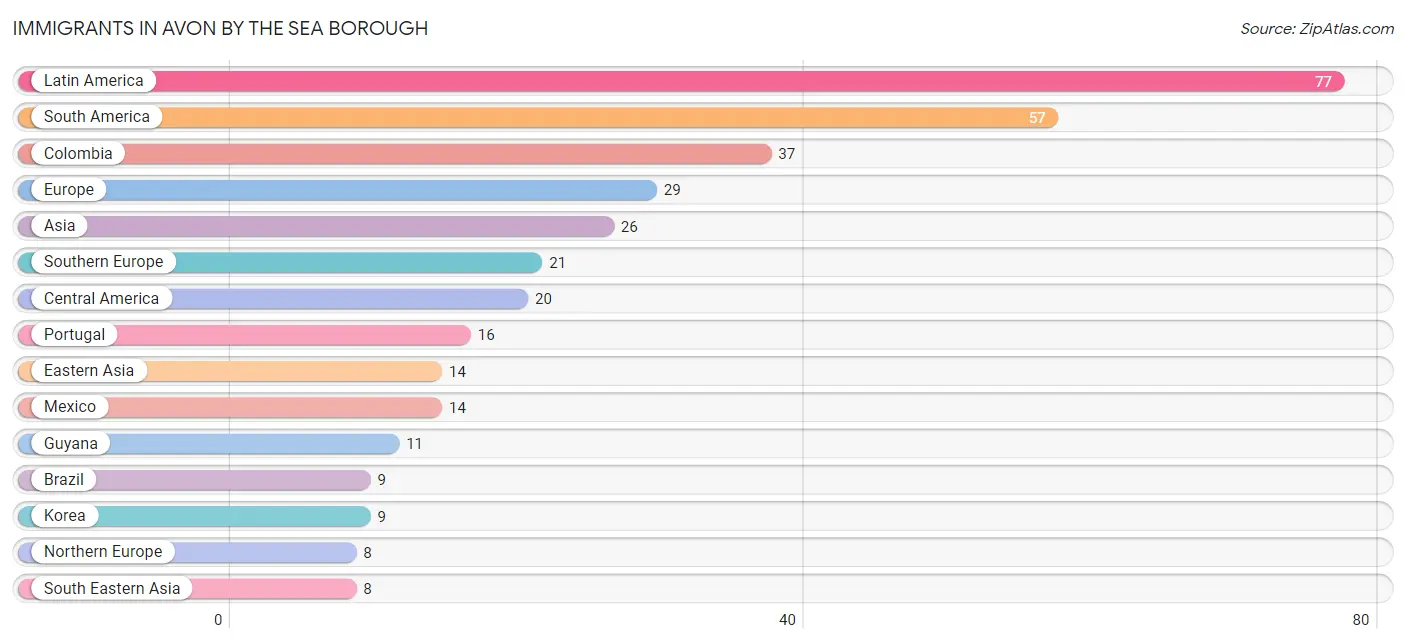
Immigrants in Avon by the Sea borough
The most numerous immigrant groups reported in Avon by the Sea borough came from Latin America (77 | 4.3%), South America (57 | 3.2%), Colombia (37 | 2.1%), Europe (29 | 1.6%), and Asia (26 | 1.5%), together accounting for 12.6% of all Avon by the Sea borough residents.
| Immigration Origin | # Population | % Population |
| Asia | 26 | 1.5% |
| Brazil | 9 | 0.5% |
| Central America | 20 | 1.1% |
| China | 5 | 0.3% |
| Colombia | 37 | 2.1% |
| Costa Rica | 6 | 0.3% |
| Eastern Asia | 14 | 0.8% |
| Europe | 29 | 1.6% |
| Guyana | 11 | 0.6% |
| Iran | 4 | 0.2% |
| Italy | 5 | 0.3% |
| Korea | 9 | 0.5% |
| Latin America | 77 | 4.3% |
| Mexico | 14 | 0.8% |
| Northern Europe | 8 | 0.4% |
| Portugal | 16 | 0.9% |
| South America | 57 | 3.2% |
| South Central Asia | 4 | 0.2% |
| South Eastern Asia | 8 | 0.4% |
| Southern Europe | 21 | 1.2% |
| Sweden | 8 | 0.4% |
| Thailand | 8 | 0.4% | View All 22 Rows |
Sex and Age in Avon by the Sea borough
Sex and Age in Avon by the Sea borough
The most populous age groups in Avon by the Sea borough are 65 to 69 Years (105 | 13.4%) for men and 70 to 74 Years (136 | 13.5%) for women.
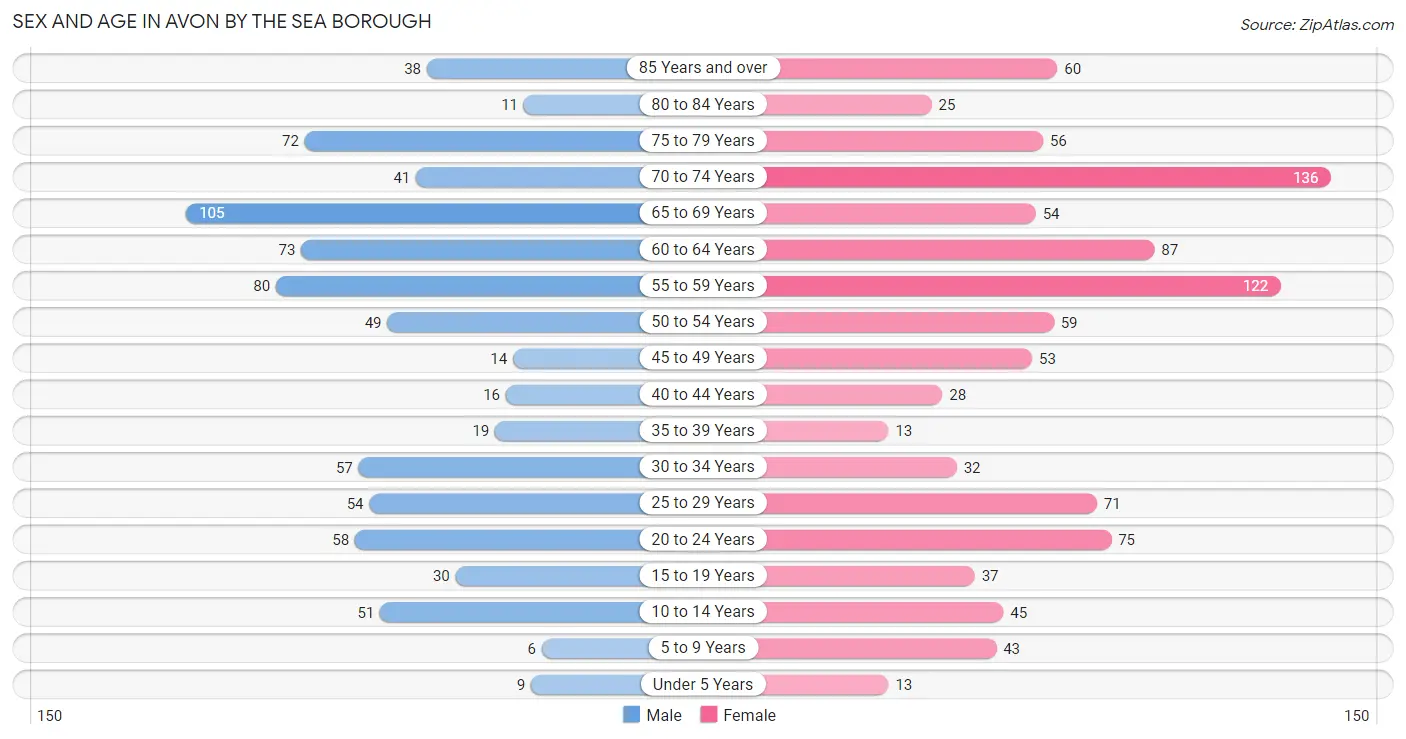
| Age Bracket | Male | Female |
| Under 5 Years | 9 (1.1%) | 13 (1.3%) |
| 5 to 9 Years | 6 (0.8%) | 43 (4.3%) |
| 10 to 14 Years | 51 (6.5%) | 45 (4.5%) |
| 15 to 19 Years | 30 (3.8%) | 37 (3.7%) |
| 20 to 24 Years | 58 (7.4%) | 75 (7.4%) |
| 25 to 29 Years | 54 (6.9%) | 71 (7.0%) |
| 30 to 34 Years | 57 (7.3%) | 32 (3.2%) |
| 35 to 39 Years | 19 (2.4%) | 13 (1.3%) |
| 40 to 44 Years | 16 (2.0%) | 28 (2.8%) |
| 45 to 49 Years | 14 (1.8%) | 53 (5.2%) |
| 50 to 54 Years | 49 (6.3%) | 59 (5.9%) |
| 55 to 59 Years | 80 (10.2%) | 122 (12.1%) |
| 60 to 64 Years | 73 (9.3%) | 87 (8.6%) |
| 65 to 69 Years | 105 (13.4%) | 54 (5.3%) |
| 70 to 74 Years | 41 (5.2%) | 136 (13.5%) |
| 75 to 79 Years | 72 (9.2%) | 56 (5.6%) |
| 80 to 84 Years | 11 (1.4%) | 25 (2.5%) |
| 85 Years and over | 38 (4.9%) | 60 (5.9%) |
| Total | 783 (100.0%) | 1,009 (100.0%) |
Families and Households in Avon by the Sea borough
Median Family Size in Avon by the Sea borough
The median family size in Avon by the Sea borough is 2.82 persons per family, with single male/father families (15 | 3.1%) accounting for the largest median family size of 3.6 persons per family. On the other hand, single female/mother families (56 | 11.6%) represent the smallest median family size with 2.75 persons per family.
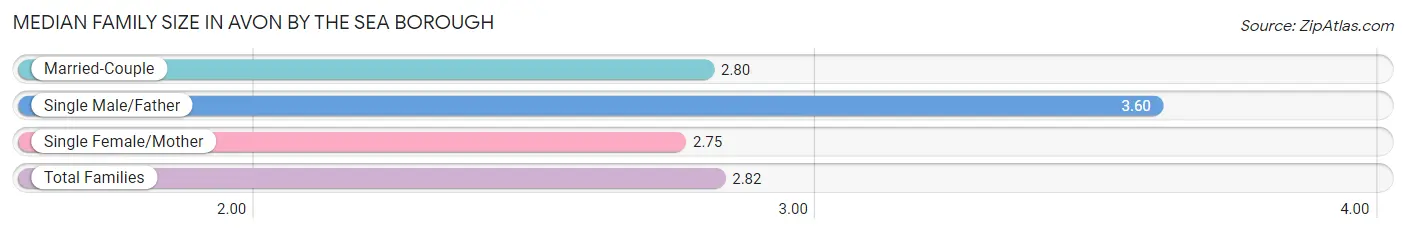
| Family Type | # Families | Family Size |
| Married-Couple | 412 (85.3%) | 2.80 |
| Single Male/Father | 15 (3.1%) | 3.60 |
| Single Female/Mother | 56 (11.6%) | 2.75 |
| Total Families | 483 (100.0%) | 2.82 |
Median Household Size in Avon by the Sea borough
The median household size in Avon by the Sea borough is 2.06 persons per household, with single male/father households (15 | 1.7%) accounting for the largest median household size of 3.6 persons per household. non-family households (385 | 44.4%) represent the smallest median household size with 1.09 persons per household.
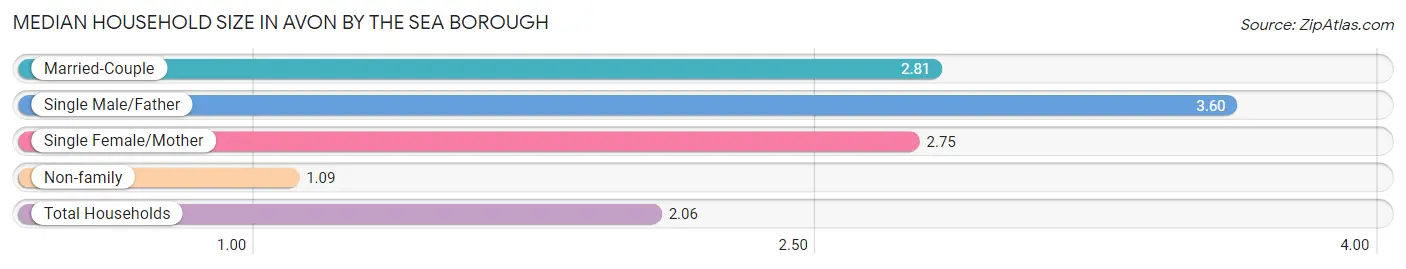
| Household Type | # Households | Household Size |
| Married-Couple | 412 (47.5%) | 2.81 |
| Single Male/Father | 15 (1.7%) | 3.60 |
| Single Female/Mother | 56 (6.5%) | 2.75 |
| Non-family | 385 (44.4%) | 1.09 |
| Total Households | 868 (100.0%) | 2.06 |
Household Size by Marriage Status in Avon by the Sea borough
Out of a total of 868 households in Avon by the Sea borough, 483 (55.6%) are family households, while 385 (44.4%) are nonfamily households. The most numerous type of family households are 2-person households, comprising 304, and the most common type of nonfamily households are 1-person households, comprising 350.
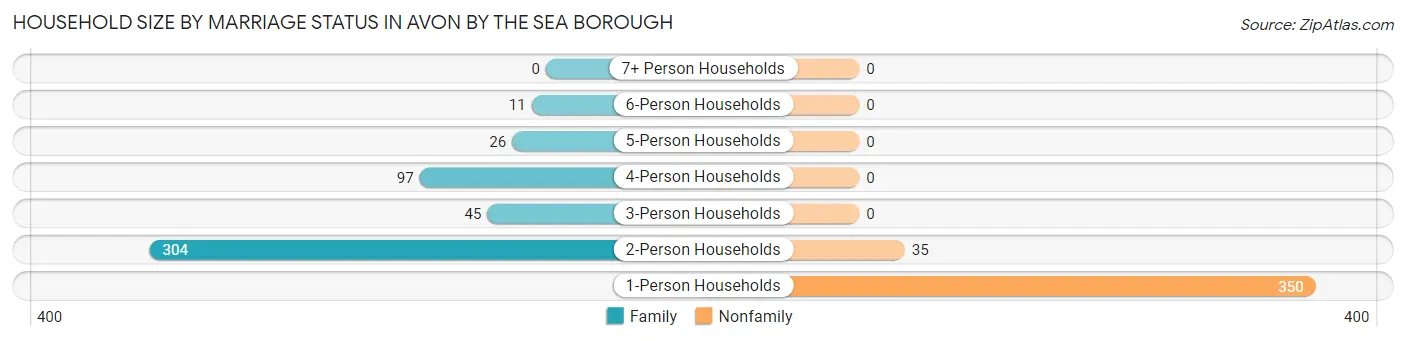
| Household Size | Family Households | Nonfamily Households |
| 1-Person Households | - | 350 (40.3%) |
| 2-Person Households | 304 (35.0%) | 35 (4.0%) |
| 3-Person Households | 45 (5.2%) | 0 (0.0%) |
| 4-Person Households | 97 (11.2%) | 0 (0.0%) |
| 5-Person Households | 26 (3.0%) | 0 (0.0%) |
| 6-Person Households | 11 (1.3%) | 0 (0.0%) |
| 7+ Person Households | 0 (0.0%) | 0 (0.0%) |
| Total | 483 (55.6%) | 385 (44.4%) |
Female Fertility in Avon by the Sea borough
Fertility by Age in Avon by the Sea borough
Average fertility rate in Avon by the Sea borough is 26.0 births per 1,000 women. Women in the age bracket of 35 to 50 years have the highest fertility rate with 85.0 births per 1,000 women. Women in the age bracket of 35 to 50 years acount for 100.0% of all women with births.
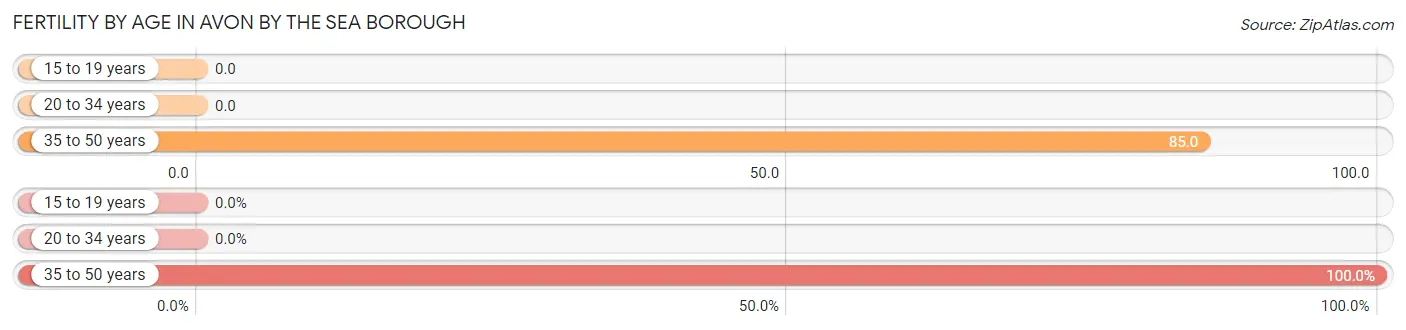
| Age Bracket | Women with Births | Births / 1,000 Women |
| 15 to 19 years | 0 (0.0%) | 0.0 |
| 20 to 34 years | 0 (0.0%) | 0.0 |
| 35 to 50 years | 8 (100.0%) | 85.0 |
| Total | 8 (100.0%) | 26.0 |
Fertility by Age by Marriage Status in Avon by the Sea borough
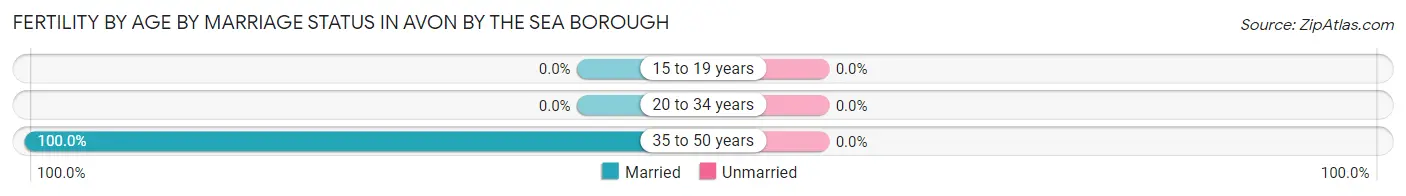
| Age Bracket | Married | Unmarried |
| 15 to 19 years | 0 (0.0%) | 0 (0.0%) |
| 20 to 34 years | 0 (0.0%) | 0 (0.0%) |
| 35 to 50 years | 8 (100.0%) | 0 (0.0%) |
| Total | 8 (100.0%) | 0 (0.0%) |
Fertility by Education in Avon by the Sea borough
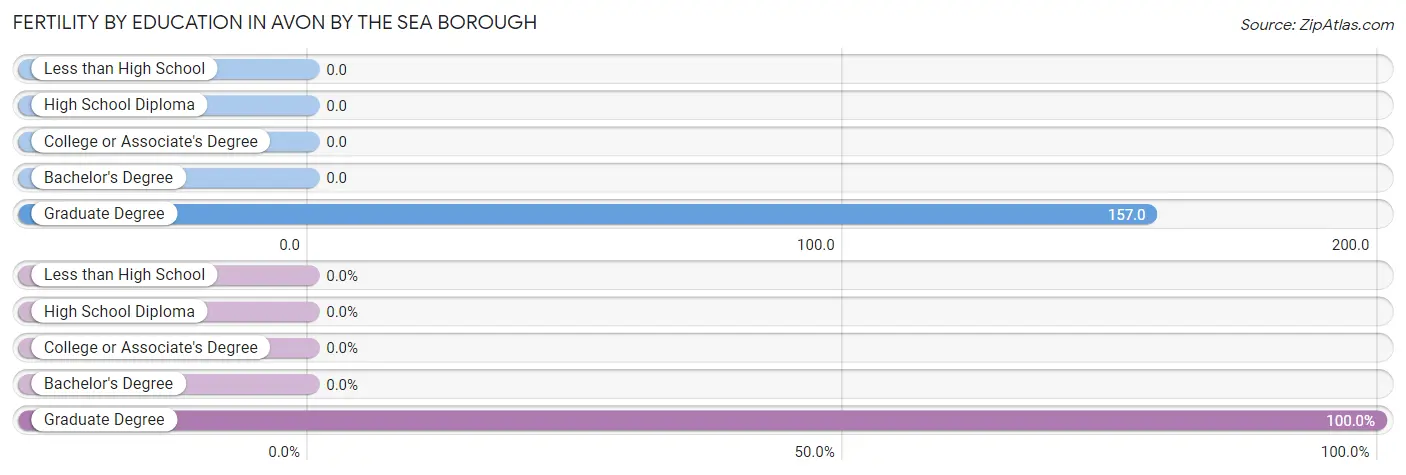
| Educational Attainment | Women with Births | Births / 1,000 Women |
| Less than High School | 0 (0.0%) | 0.0 |
| High School Diploma | 0 (0.0%) | 0.0 |
| College or Associate's Degree | 0 (0.0%) | 0.0 |
| Bachelor's Degree | 0 (0.0%) | 0.0 |
| Graduate Degree | 8 (100.0%) | 157.0 |
| Total | 8 (100.0%) | 26.0 |
Fertility by Education by Marriage Status in Avon by the Sea borough
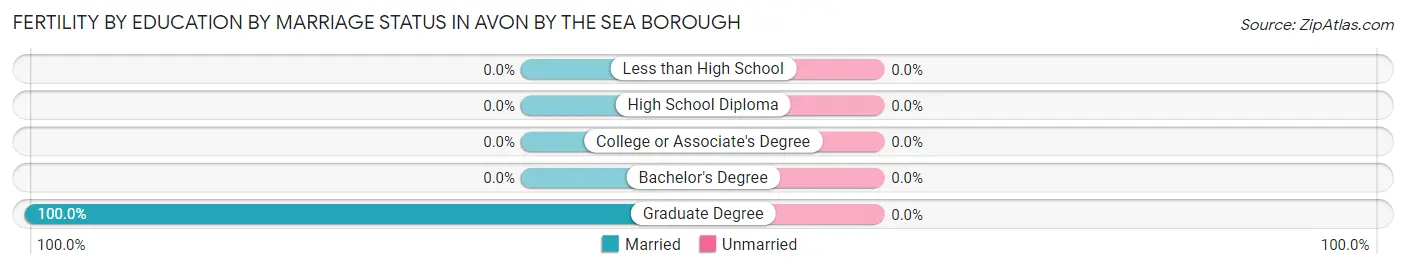
| Educational Attainment | Married | Unmarried |
| Less than High School | 0 (0.0%) | 0 (0.0%) |
| High School Diploma | 0 (0.0%) | 0 (0.0%) |
| College or Associate's Degree | 0 (0.0%) | 0 (0.0%) |
| Bachelor's Degree | 0 (0.0%) | 0 (0.0%) |
| Graduate Degree | 8 (100.0%) | 0 (0.0%) |
| Total | 8 (100.0%) | 0 (0.0%) |
Employment Characteristics in Avon by the Sea borough
Employment by Class of Employer in Avon by the Sea borough
Among the 897 employed individuals in Avon by the Sea borough, private company employees (601 | 67.0%), local government employees (89 | 9.9%), and not-for-profit organizations (86 | 9.6%) make up the most common classes of employment.
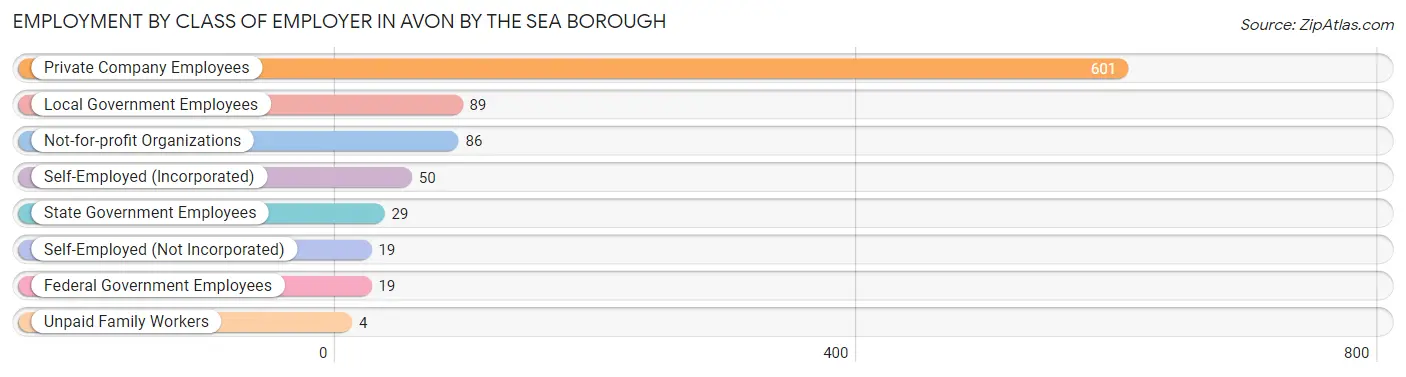
| Employer Class | # Employees | % Employees |
| Private Company Employees | 601 | 67.0% |
| Self-Employed (Incorporated) | 50 | 5.6% |
| Self-Employed (Not Incorporated) | 19 | 2.1% |
| Not-for-profit Organizations | 86 | 9.6% |
| Local Government Employees | 89 | 9.9% |
| State Government Employees | 29 | 3.2% |
| Federal Government Employees | 19 | 2.1% |
| Unpaid Family Workers | 4 | 0.4% |
| Total | 897 | 100.0% |
Employment Status by Age in Avon by the Sea borough
According to the labor force statistics for Avon by the Sea borough, out of the total population over 16 years of age (1,599), 59.8% or 956 individuals are in the labor force, with 5.6% or 54 of them unemployed. The age group with the highest labor force participation rate is 30 to 34 years, with 95.5% or 85 individuals in the labor force. Within the labor force, the 35 to 44 years age range has the highest percentage of unemployed individuals, with 17.1% or 12 of them being unemployed.
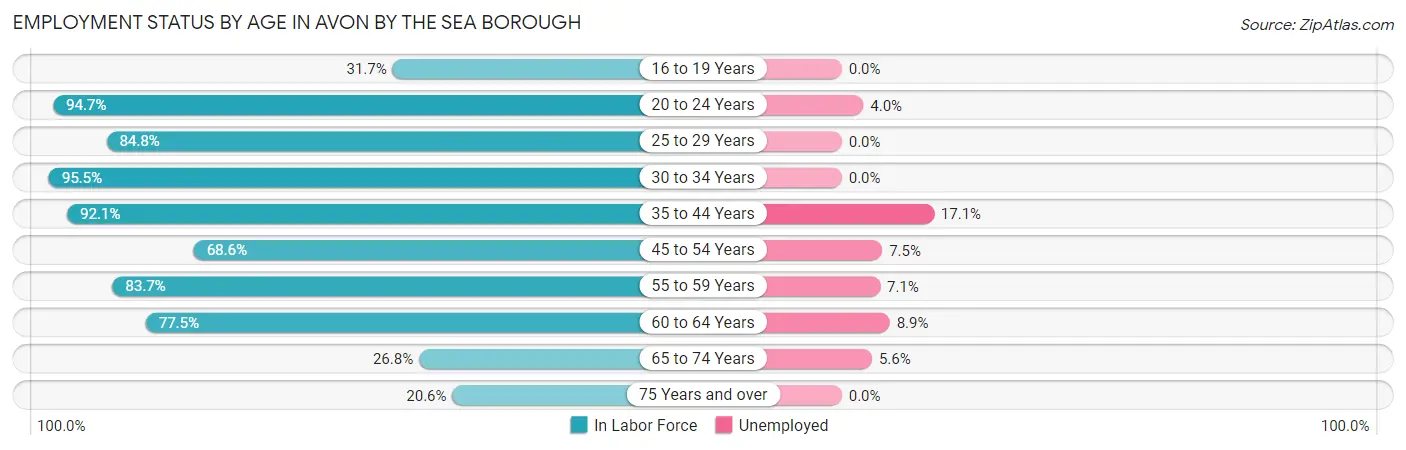
| Age Bracket | In Labor Force | Unemployed |
| 16 to 19 Years | 13 (31.7%) | 0 (0.0%) |
| 20 to 24 Years | 126 (94.7%) | 5 (4.0%) |
| 25 to 29 Years | 106 (84.8%) | 0 (0.0%) |
| 30 to 34 Years | 85 (95.5%) | 0 (0.0%) |
| 35 to 44 Years | 70 (92.1%) | 12 (17.1%) |
| 45 to 54 Years | 120 (68.6%) | 9 (7.5%) |
| 55 to 59 Years | 169 (83.7%) | 12 (7.1%) |
| 60 to 64 Years | 124 (77.5%) | 11 (8.9%) |
| 65 to 74 Years | 90 (26.8%) | 5 (5.6%) |
| 75 Years and over | 54 (20.6%) | 0 (0.0%) |
| Total | 956 (59.8%) | 54 (5.6%) |
Employment Status by Educational Attainment in Avon by the Sea borough
According to labor force statistics for Avon by the Sea borough, 81.5% of individuals (674) out of the total population between 25 and 64 years of age (827) are in the labor force, with 6.5% or 44 of them being unemployed. The group with the highest labor force participation rate are those with the educational attainment of college / associate degree, with 90.8% or 108 individuals in the labor force. Within the labor force, individuals with college / associate degree education have the highest percentage of unemployment, with 10.2% or 11 of them being unemployed.
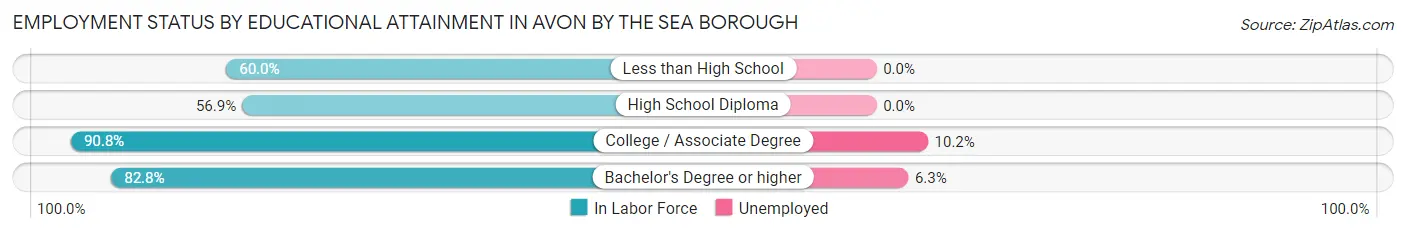
| Educational Attainment | In Labor Force | Unemployed |
| Less than High School | 9 (60.0%) | 0 (0.0%) |
| High School Diploma | 37 (56.9%) | 0 (0.0%) |
| College / Associate Degree | 108 (90.8%) | 12 (10.2%) |
| Bachelor's Degree or higher | 520 (82.8%) | 40 (6.3%) |
| Total | 674 (81.5%) | 54 (6.5%) |
Employment Occupations by Sex in Avon by the Sea borough
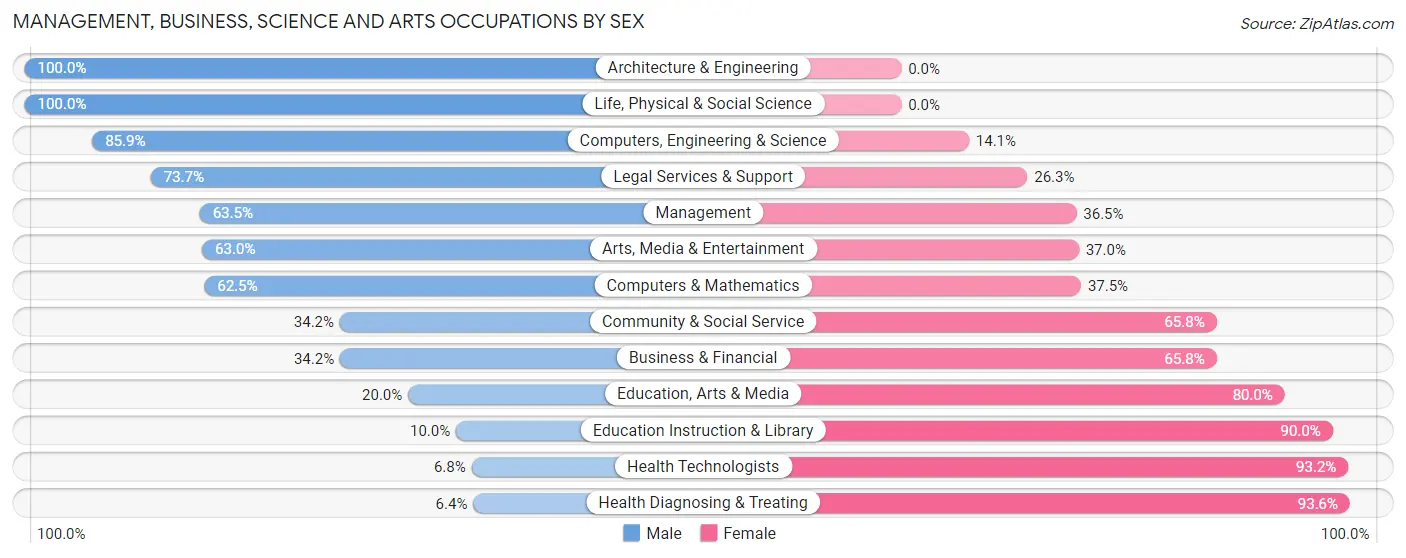
Management, Business, Science and Arts Occupations
The most common Management, Business, Science and Arts occupations in Avon by the Sea borough are Community & Social Service (111 | 12.3%), Management (104 | 11.5%), Computers, Engineering & Science (85 | 9.4%), Health Diagnosing & Treating (78 | 8.6%), and Business & Financial (76 | 8.4%).
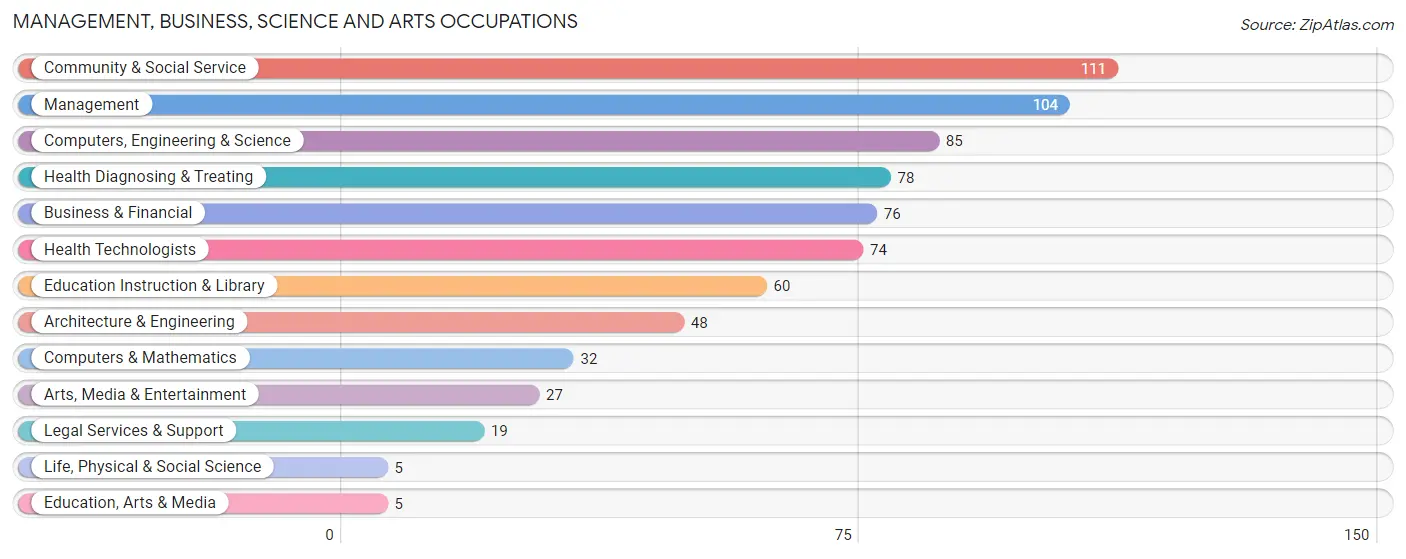
Management, Business, Science and Arts Occupations by Sex
Within the Management, Business, Science and Arts occupations in Avon by the Sea borough, the most male-oriented occupations are Architecture & Engineering (100.0%), Life, Physical & Social Science (100.0%), and Computers, Engineering & Science (85.9%), while the most female-oriented occupations are Health Diagnosing & Treating (93.6%), Health Technologists (93.2%), and Education Instruction & Library (90.0%).
| Occupation | Male | Female |
| Management | 66 (63.5%) | 38 (36.5%) |
| Business & Financial | 26 (34.2%) | 50 (65.8%) |
| Computers, Engineering & Science | 73 (85.9%) | 12 (14.1%) |
| Computers & Mathematics | 20 (62.5%) | 12 (37.5%) |
| Architecture & Engineering | 48 (100.0%) | 0 (0.0%) |
| Life, Physical & Social Science | 5 (100.0%) | 0 (0.0%) |
| Community & Social Service | 38 (34.2%) | 73 (65.8%) |
| Education, Arts & Media | 1 (20.0%) | 4 (80.0%) |
| Legal Services & Support | 14 (73.7%) | 5 (26.3%) |
| Education Instruction & Library | 6 (10.0%) | 54 (90.0%) |
| Arts, Media & Entertainment | 17 (63.0%) | 10 (37.0%) |
| Health Diagnosing & Treating | 5 (6.4%) | 73 (93.6%) |
| Health Technologists | 5 (6.8%) | 69 (93.2%) |
| Total (Category) | 208 (45.8%) | 246 (54.2%) |
| Total (Overall) | 456 (50.5%) | 447 (49.5%) |
Services Occupations
The most common Services occupations in Avon by the Sea borough are Food Preparation & Serving (54 | 6.0%), Personal Care & Service (48 | 5.3%), Security & Protection (44 | 4.9%), Firefighting & Prevention (27 | 3.0%), and Cleaning & Maintenance (23 | 2.5%).

Services Occupations by Sex
Within the Services occupations in Avon by the Sea borough, the most male-oriented occupations are Law Enforcement (100.0%), Security & Protection (88.6%), and Firefighting & Prevention (81.5%), while the most female-oriented occupations are Healthcare Support (100.0%), Personal Care & Service (91.7%), and Cleaning & Maintenance (52.2%).

| Occupation | Male | Female |
| Healthcare Support | 0 (0.0%) | 14 (100.0%) |
| Security & Protection | 39 (88.6%) | 5 (11.4%) |
| Firefighting & Prevention | 22 (81.5%) | 5 (18.5%) |
| Law Enforcement | 17 (100.0%) | 0 (0.0%) |
| Food Preparation & Serving | 34 (63.0%) | 20 (37.0%) |
| Cleaning & Maintenance | 11 (47.8%) | 12 (52.2%) |
| Personal Care & Service | 4 (8.3%) | 44 (91.7%) |
| Total (Category) | 88 (48.1%) | 95 (51.9%) |
| Total (Overall) | 456 (50.5%) | 447 (49.5%) |
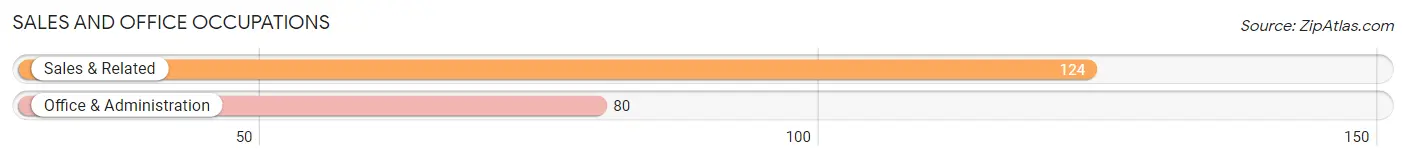
Sales and Office Occupations
The most common Sales and Office occupations in Avon by the Sea borough are Sales & Related (124 | 13.7%), and Office & Administration (80 | 8.9%).
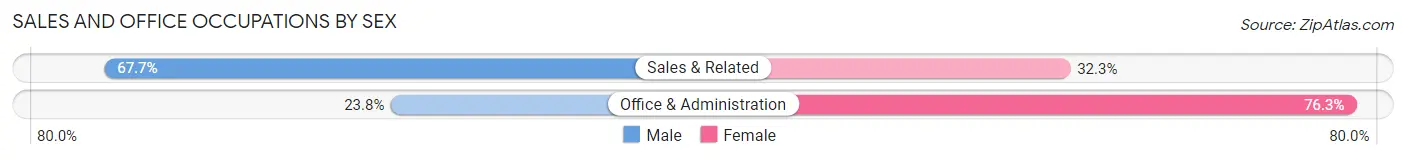
Sales and Office Occupations by Sex
| Occupation | Male | Female |
| Sales & Related | 84 (67.7%) | 40 (32.3%) |
| Office & Administration | 19 (23.7%) | 61 (76.2%) |
| Total (Category) | 103 (50.5%) | 101 (49.5%) |
| Total (Overall) | 456 (50.5%) | 447 (49.5%) |
Natural Resources, Construction and Maintenance Occupations
The most common Natural Resources, Construction and Maintenance occupations in Avon by the Sea borough are , and Construction & Extraction (27 | 3.0%).
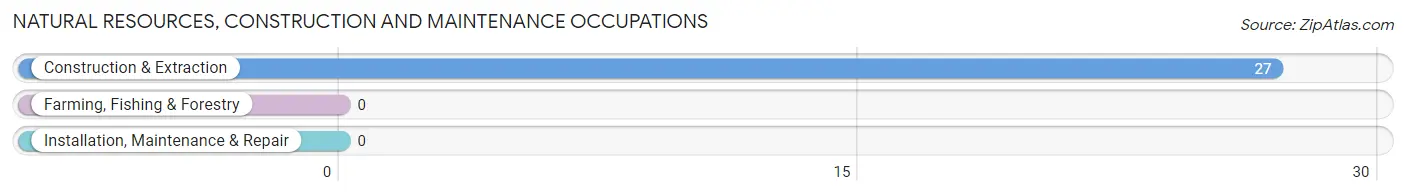
Natural Resources, Construction and Maintenance Occupations by Sex
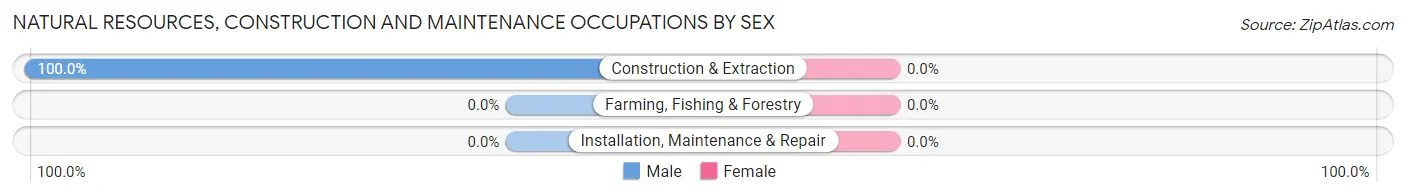
| Occupation | Male | Female |
| Farming, Fishing & Forestry | 0 (0.0%) | 0 (0.0%) |
| Construction & Extraction | 27 (100.0%) | 0 (0.0%) |
| Installation, Maintenance & Repair | 0 (0.0%) | 0 (0.0%) |
| Total (Category) | 27 (100.0%) | 0 (0.0%) |
| Total (Overall) | 456 (50.5%) | 447 (49.5%) |
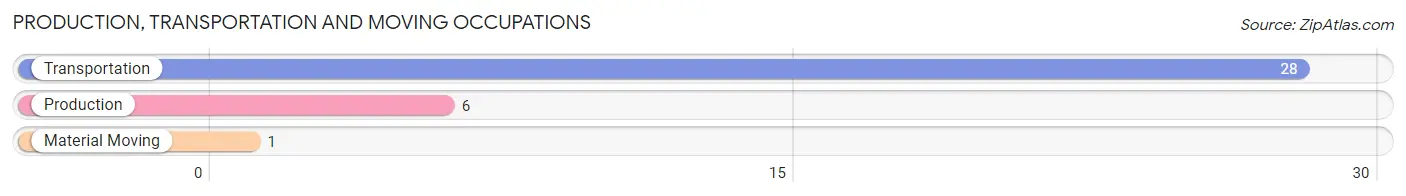
Production, Transportation and Moving Occupations
The most common Production, Transportation and Moving occupations in Avon by the Sea borough are Transportation (28 | 3.1%), Production (6 | 0.7%), and Material Moving (1 | 0.1%).
Production, Transportation and Moving Occupations by Sex
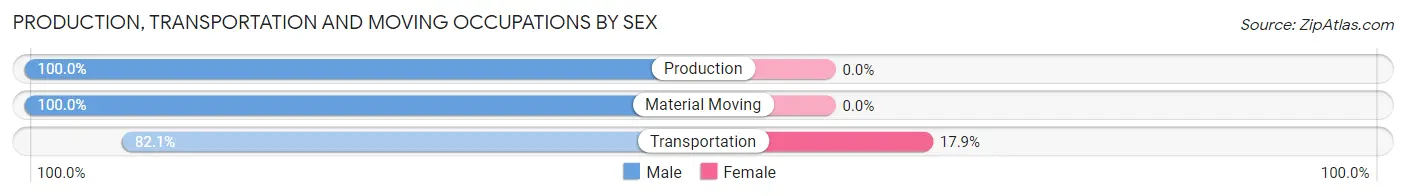
| Occupation | Male | Female |
| Production | 6 (100.0%) | 0 (0.0%) |
| Transportation | 23 (82.1%) | 5 (17.9%) |
| Material Moving | 1 (100.0%) | 0 (0.0%) |
| Total (Category) | 30 (85.7%) | 5 (14.3%) |
| Total (Overall) | 456 (50.5%) | 447 (49.5%) |
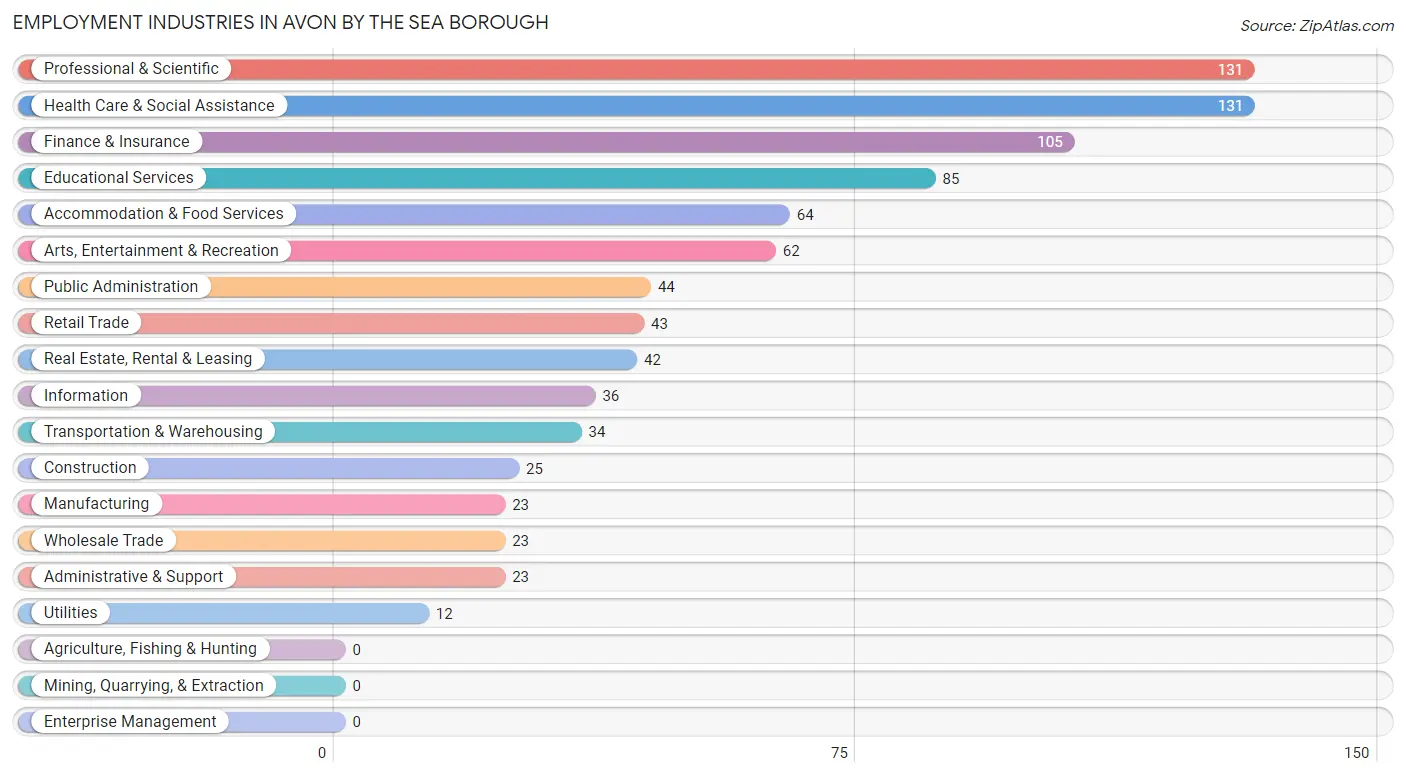
Employment Industries by Sex in Avon by the Sea borough
Employment Industries in Avon by the Sea borough
The major employment industries in Avon by the Sea borough include Professional & Scientific (131 | 14.5%), Health Care & Social Assistance (131 | 14.5%), Finance & Insurance (105 | 11.6%), Educational Services (85 | 9.4%), and Accommodation & Food Services (64 | 7.1%).
Employment Industries by Sex in Avon by the Sea borough
The Avon by the Sea borough industries that see more men than women are Utilities (100.0%), Transportation & Warehousing (85.3%), and Construction (84.0%), whereas the industries that tend to have a higher number of women are Administrative & Support (100.0%), Arts, Entertainment & Recreation (95.2%), and Health Care & Social Assistance (84.0%).
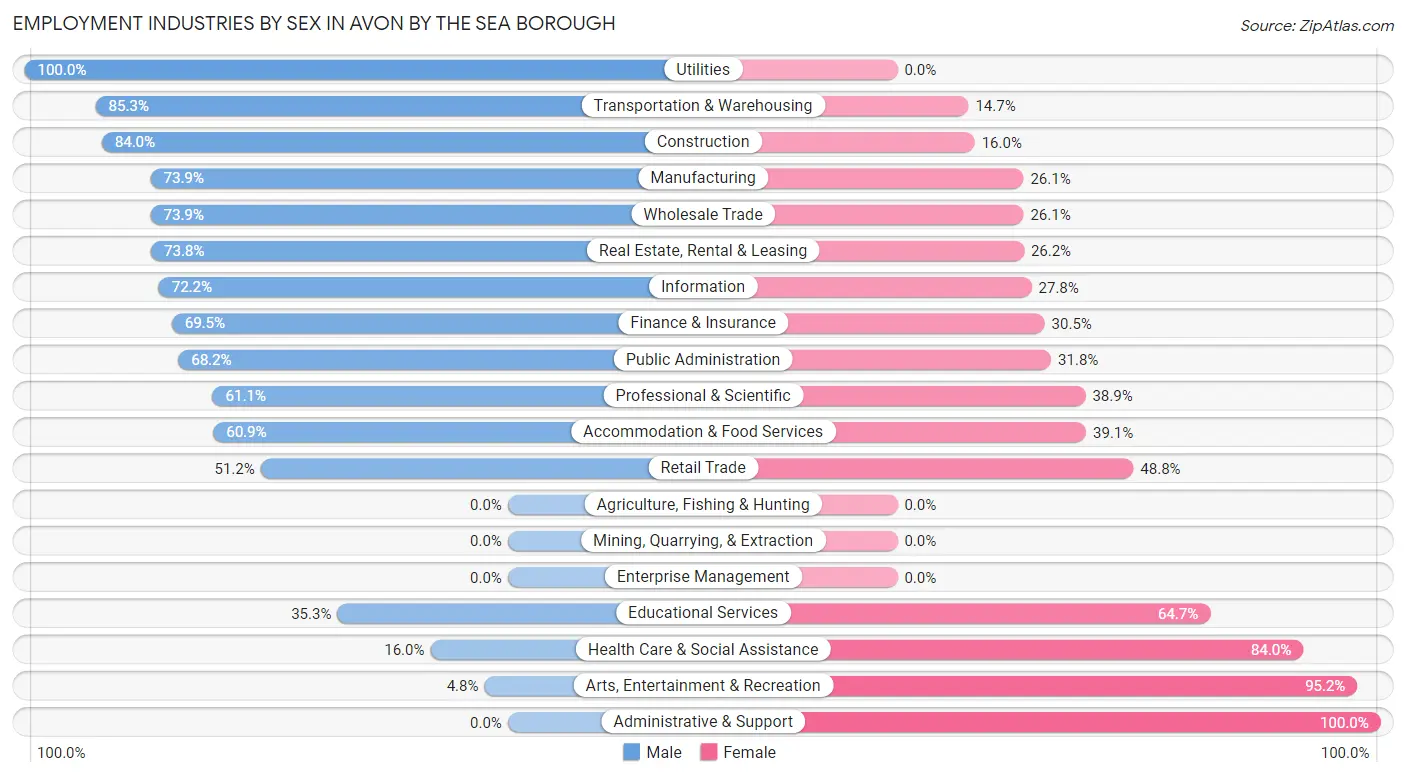
| Industry | Male | Female |
| Agriculture, Fishing & Hunting | 0 (0.0%) | 0 (0.0%) |
| Mining, Quarrying, & Extraction | 0 (0.0%) | 0 (0.0%) |
| Construction | 21 (84.0%) | 4 (16.0%) |
| Manufacturing | 17 (73.9%) | 6 (26.1%) |
| Wholesale Trade | 17 (73.9%) | 6 (26.1%) |
| Retail Trade | 22 (51.2%) | 21 (48.8%) |
| Transportation & Warehousing | 29 (85.3%) | 5 (14.7%) |
| Utilities | 12 (100.0%) | 0 (0.0%) |
| Information | 26 (72.2%) | 10 (27.8%) |
| Finance & Insurance | 73 (69.5%) | 32 (30.5%) |
| Real Estate, Rental & Leasing | 31 (73.8%) | 11 (26.2%) |
| Professional & Scientific | 80 (61.1%) | 51 (38.9%) |
| Enterprise Management | 0 (0.0%) | 0 (0.0%) |
| Administrative & Support | 0 (0.0%) | 23 (100.0%) |
| Educational Services | 30 (35.3%) | 55 (64.7%) |
| Health Care & Social Assistance | 21 (16.0%) | 110 (84.0%) |
| Arts, Entertainment & Recreation | 3 (4.8%) | 59 (95.2%) |
| Accommodation & Food Services | 39 (60.9%) | 25 (39.1%) |
| Public Administration | 30 (68.2%) | 14 (31.8%) |
| Total | 456 (50.5%) | 447 (49.5%) |
Education in Avon by the Sea borough
School Enrollment in Avon by the Sea borough
The most common levels of schooling among the 318 students in Avon by the Sea borough are high school (79 | 24.8%), middle school (65 | 20.4%), and college / undergraduate (53 | 16.7%).
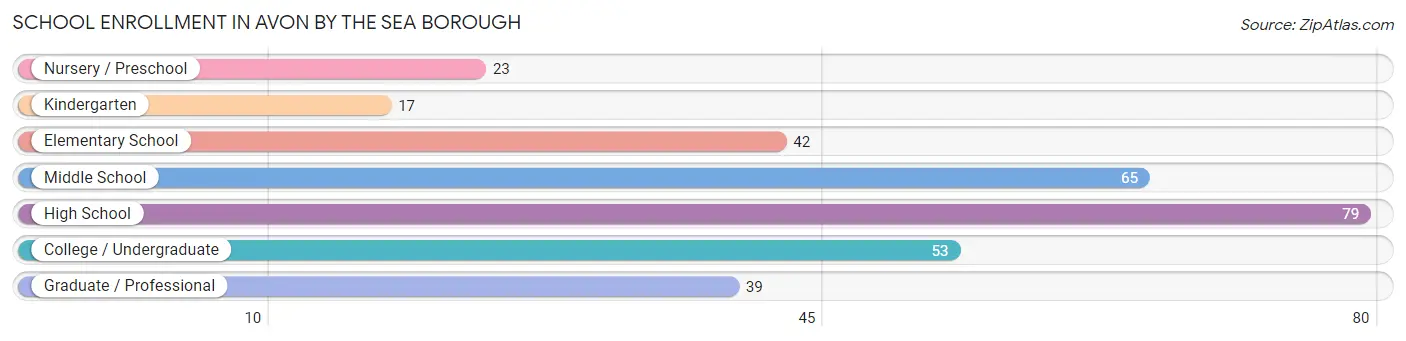
| School Level | # Students | % Students |
| Nursery / Preschool | 23 | 7.2% |
| Kindergarten | 17 | 5.3% |
| Elementary School | 42 | 13.2% |
| Middle School | 65 | 20.4% |
| High School | 79 | 24.8% |
| College / Undergraduate | 53 | 16.7% |
| Graduate / Professional | 39 | 12.3% |
| Total | 318 | 100.0% |
School Enrollment by Age by Funding Source in Avon by the Sea borough
Out of a total of 318 students who are enrolled in schools in Avon by the Sea borough, 155 (48.7%) attend a private institution, while the remaining 163 (51.3%) are enrolled in public schools. The age group of 3 to 4 year olds has the highest likelihood of being enrolled in private schools, with 14 (100.0% in the age bracket) enrolled. Conversely, the age group of 5 to 9 year old has the lowest likelihood of being enrolled in a private school, with 40 (81.6% in the age bracket) attending a public institution.
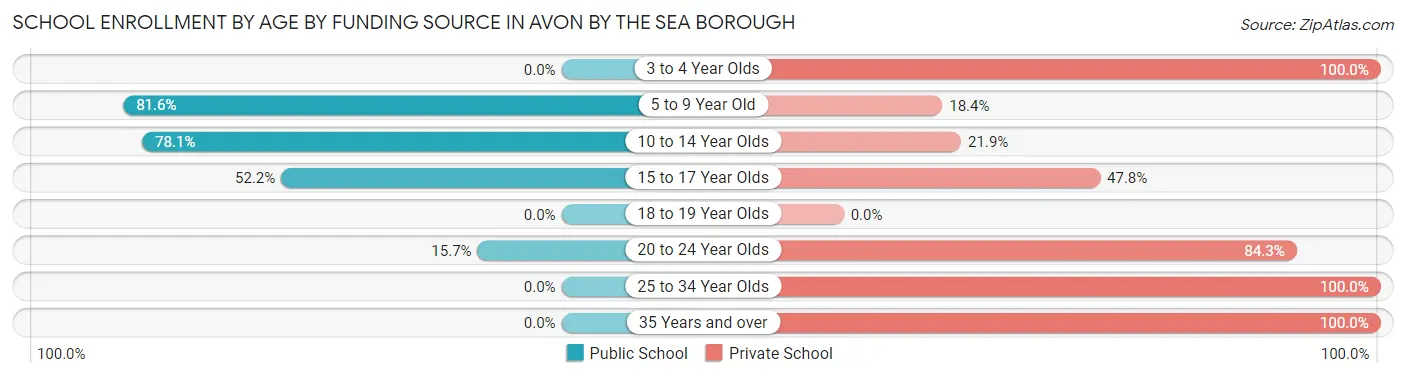
| Age Bracket | Public School | Private School |
| 3 to 4 Year Olds | 0 (0.0%) | 14 (100.0%) |
| 5 to 9 Year Old | 40 (81.6%) | 9 (18.4%) |
| 10 to 14 Year Olds | 75 (78.1%) | 21 (21.9%) |
| 15 to 17 Year Olds | 35 (52.2%) | 32 (47.8%) |
| 18 to 19 Year Olds | 0 (0.0%) | 0 (0.0%) |
| 20 to 24 Year Olds | 13 (15.7%) | 70 (84.3%) |
| 25 to 34 Year Olds | 0 (0.0%) | 5 (100.0%) |
| 35 Years and over | 0 (0.0%) | 4 (100.0%) |
| Total | 163 (51.3%) | 155 (48.7%) |
Educational Attainment by Field of Study in Avon by the Sea borough
Business (219 | 19.9%), education (161 | 14.6%), science & technology (114 | 10.3%), social sciences (99 | 9.0%), and literature & languages (98 | 8.9%) are the most common fields of study among 1,101 individuals in Avon by the Sea borough who have obtained a bachelor's degree or higher.
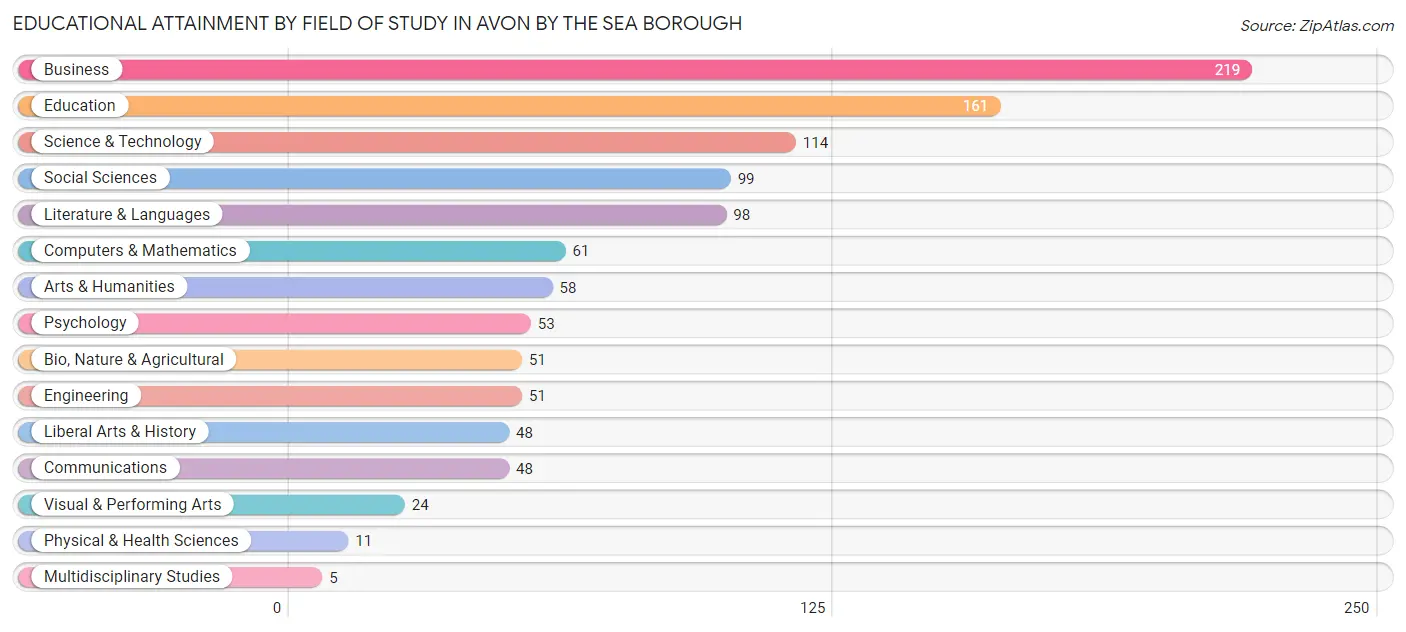
| Field of Study | # Graduates | % Graduates |
| Computers & Mathematics | 61 | 5.5% |
| Bio, Nature & Agricultural | 51 | 4.6% |
| Physical & Health Sciences | 11 | 1.0% |
| Psychology | 53 | 4.8% |
| Social Sciences | 99 | 9.0% |
| Engineering | 51 | 4.6% |
| Multidisciplinary Studies | 5 | 0.4% |
| Science & Technology | 114 | 10.3% |
| Business | 219 | 19.9% |
| Education | 161 | 14.6% |
| Literature & Languages | 98 | 8.9% |
| Liberal Arts & History | 48 | 4.4% |
| Visual & Performing Arts | 24 | 2.2% |
| Communications | 48 | 4.4% |
| Arts & Humanities | 58 | 5.3% |
| Total | 1,101 | 100.0% |
Transportation & Commute in Avon by the Sea borough
Vehicle Availability by Sex in Avon by the Sea borough
The most prevalent vehicle ownership categories in Avon by the Sea borough are males with 2 vehicles (169, accounting for 37.9%) and females with 2 vehicles (165, making up 37.8%).
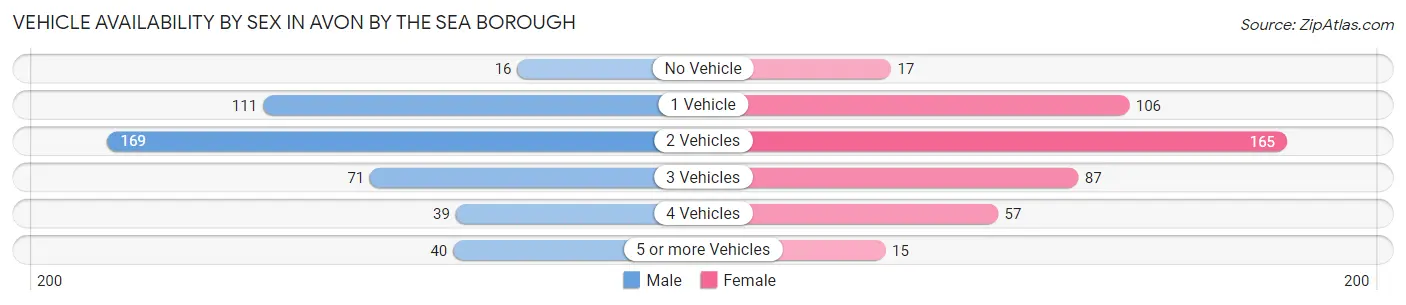
| Vehicles Available | Male | Female |
| No Vehicle | 16 (3.6%) | 17 (3.8%) |
| 1 Vehicle | 111 (24.9%) | 106 (23.7%) |
| 2 Vehicles | 169 (37.9%) | 165 (36.9%) |
| 3 Vehicles | 71 (15.9%) | 87 (19.5%) |
| 4 Vehicles | 39 (8.7%) | 57 (12.8%) |
| 5 or more Vehicles | 40 (9.0%) | 15 (3.4%) |
| Total | 446 (100.0%) | 447 (100.0%) |
Commute Time in Avon by the Sea borough
The most frequently occuring commute durations in Avon by the Sea borough are 5 to 9 minutes (150 commuters, 19.9%), 10 to 14 minutes (111 commuters, 14.7%), and 30 to 34 minutes (95 commuters, 12.6%).
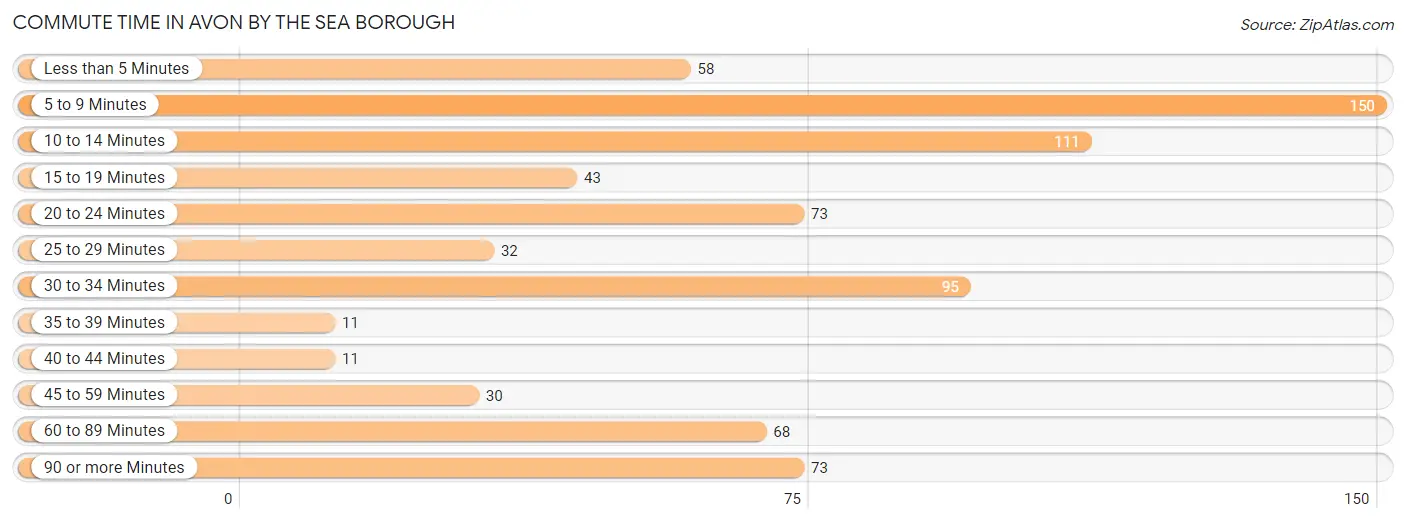
| Commute Time | # Commuters | % Commuters |
| Less than 5 Minutes | 58 | 7.7% |
| 5 to 9 Minutes | 150 | 19.9% |
| 10 to 14 Minutes | 111 | 14.7% |
| 15 to 19 Minutes | 43 | 5.7% |
| 20 to 24 Minutes | 73 | 9.7% |
| 25 to 29 Minutes | 32 | 4.2% |
| 30 to 34 Minutes | 95 | 12.6% |
| 35 to 39 Minutes | 11 | 1.5% |
| 40 to 44 Minutes | 11 | 1.5% |
| 45 to 59 Minutes | 30 | 4.0% |
| 60 to 89 Minutes | 68 | 9.0% |
| 90 or more Minutes | 73 | 9.7% |
Commute Time by Sex in Avon by the Sea borough
The most common commute times in Avon by the Sea borough are 5 to 9 minutes (65 commuters, 16.3%) for males and 5 to 9 minutes (85 commuters, 23.9%) for females.
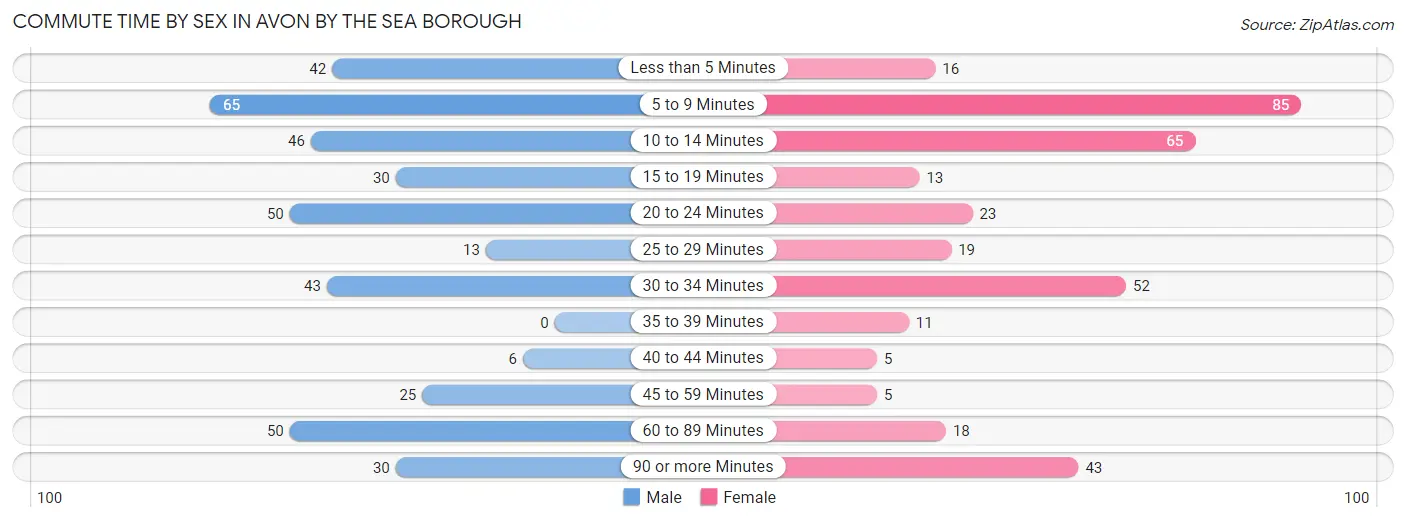
| Commute Time | Male | Female |
| Less than 5 Minutes | 42 (10.5%) | 16 (4.5%) |
| 5 to 9 Minutes | 65 (16.3%) | 85 (23.9%) |
| 10 to 14 Minutes | 46 (11.5%) | 65 (18.3%) |
| 15 to 19 Minutes | 30 (7.5%) | 13 (3.7%) |
| 20 to 24 Minutes | 50 (12.5%) | 23 (6.5%) |
| 25 to 29 Minutes | 13 (3.3%) | 19 (5.3%) |
| 30 to 34 Minutes | 43 (10.7%) | 52 (14.6%) |
| 35 to 39 Minutes | 0 (0.0%) | 11 (3.1%) |
| 40 to 44 Minutes | 6 (1.5%) | 5 (1.4%) |
| 45 to 59 Minutes | 25 (6.2%) | 5 (1.4%) |
| 60 to 89 Minutes | 50 (12.5%) | 18 (5.1%) |
| 90 or more Minutes | 30 (7.5%) | 43 (12.1%) |
Time of Departure to Work by Sex in Avon by the Sea borough
The most frequent times of departure to work in Avon by the Sea borough are 7:30 AM to 7:59 AM (72, 18.0%) for males and 8:00 AM to 8:29 AM (69, 19.4%) for females.
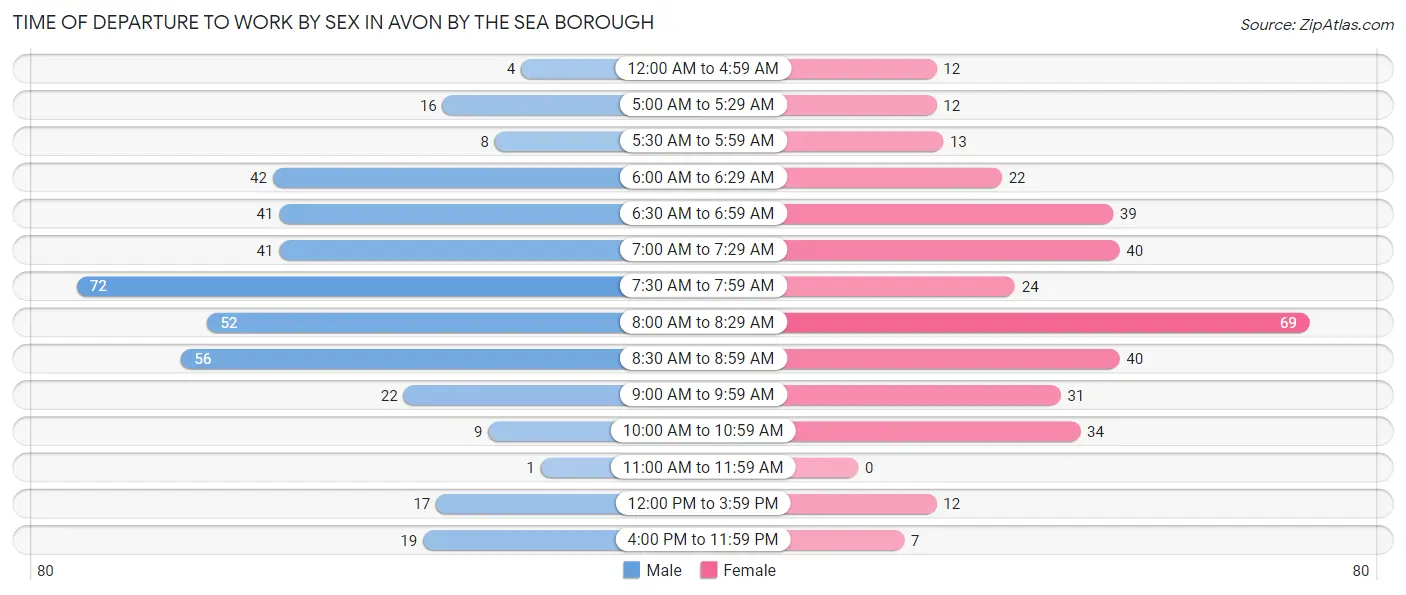
| Time of Departure | Male | Female |
| 12:00 AM to 4:59 AM | 4 (1.0%) | 12 (3.4%) |
| 5:00 AM to 5:29 AM | 16 (4.0%) | 12 (3.4%) |
| 5:30 AM to 5:59 AM | 8 (2.0%) | 13 (3.7%) |
| 6:00 AM to 6:29 AM | 42 (10.5%) | 22 (6.2%) |
| 6:30 AM to 6:59 AM | 41 (10.2%) | 39 (11.0%) |
| 7:00 AM to 7:29 AM | 41 (10.2%) | 40 (11.3%) |
| 7:30 AM to 7:59 AM | 72 (18.0%) | 24 (6.8%) |
| 8:00 AM to 8:29 AM | 52 (13.0%) | 69 (19.4%) |
| 8:30 AM to 8:59 AM | 56 (14.0%) | 40 (11.3%) |
| 9:00 AM to 9:59 AM | 22 (5.5%) | 31 (8.7%) |
| 10:00 AM to 10:59 AM | 9 (2.2%) | 34 (9.6%) |
| 11:00 AM to 11:59 AM | 1 (0.3%) | 0 (0.0%) |
| 12:00 PM to 3:59 PM | 17 (4.3%) | 12 (3.4%) |
| 4:00 PM to 11:59 PM | 19 (4.8%) | 7 (2.0%) |
| Total | 400 (100.0%) | 355 (100.0%) |
Housing Occupancy in Avon by the Sea borough
Occupancy by Ownership in Avon by the Sea borough
Of the total 868 dwellings in Avon by the Sea borough, owner-occupied units account for 594 (68.4%), while renter-occupied units make up 274 (31.6%).
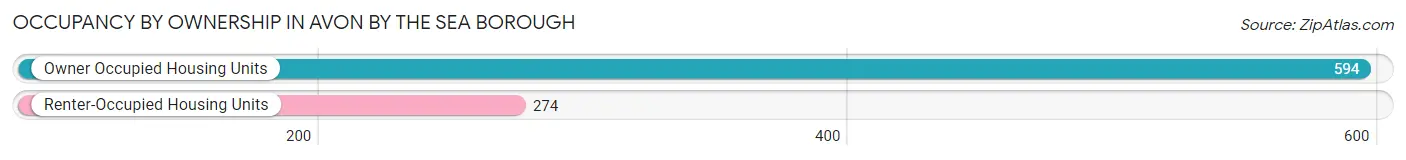
| Occupancy | # Housing Units | % Housing Units |
| Owner Occupied Housing Units | 594 | 68.4% |
| Renter-Occupied Housing Units | 274 | 31.6% |
| Total Occupied Housing Units | 868 | 100.0% |
Occupancy by Household Size in Avon by the Sea borough
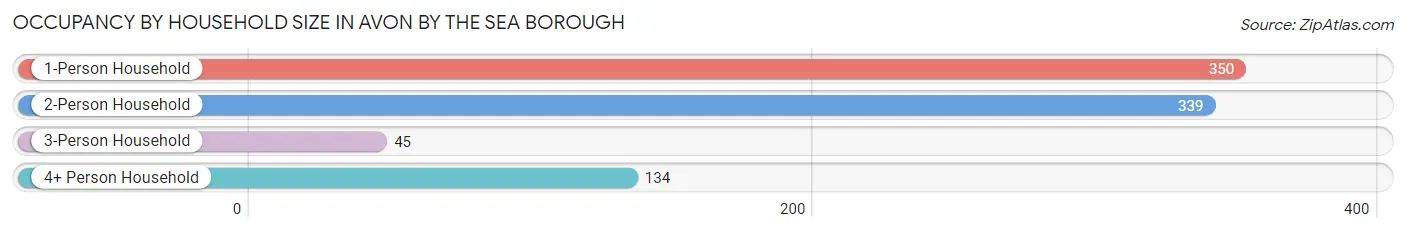
| Household Size | # Housing Units | % Housing Units |
| 1-Person Household | 350 | 40.3% |
| 2-Person Household | 339 | 39.1% |
| 3-Person Household | 45 | 5.2% |
| 4+ Person Household | 134 | 15.4% |
| Total Housing Units | 868 | 100.0% |
Occupancy by Ownership by Household Size in Avon by the Sea borough
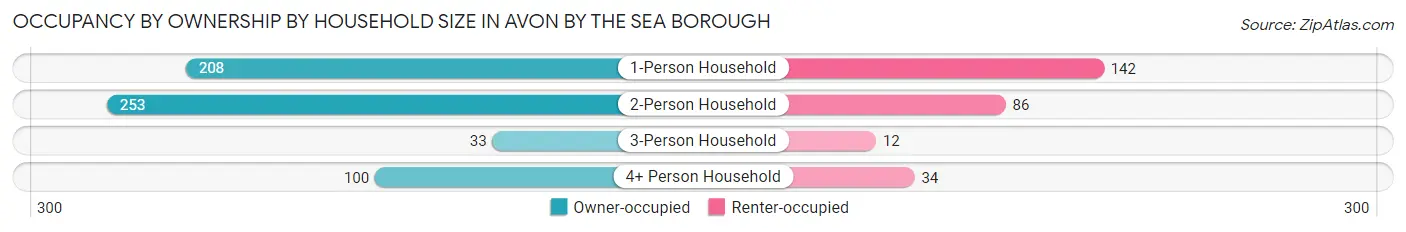
| Household Size | Owner-occupied | Renter-occupied |
| 1-Person Household | 208 (59.4%) | 142 (40.6%) |
| 2-Person Household | 253 (74.6%) | 86 (25.4%) |
| 3-Person Household | 33 (73.3%) | 12 (26.7%) |
| 4+ Person Household | 100 (74.6%) | 34 (25.4%) |
| Total Housing Units | 594 (68.4%) | 274 (31.6%) |
Occupancy by Educational Attainment in Avon by the Sea borough
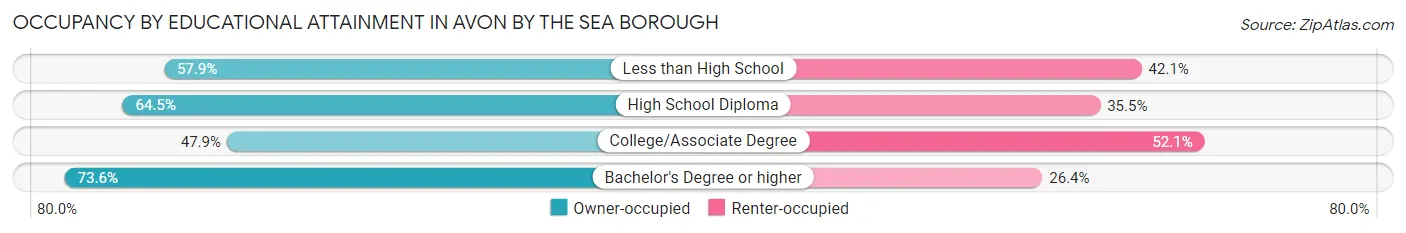
| Household Size | Owner-occupied | Renter-occupied |
| Less than High School | 11 (57.9%) | 8 (42.1%) |
| High School Diploma | 78 (64.5%) | 43 (35.5%) |
| College/Associate Degree | 58 (47.9%) | 63 (52.1%) |
| Bachelor's Degree or higher | 447 (73.6%) | 160 (26.4%) |
Occupancy by Age of Householder in Avon by the Sea borough
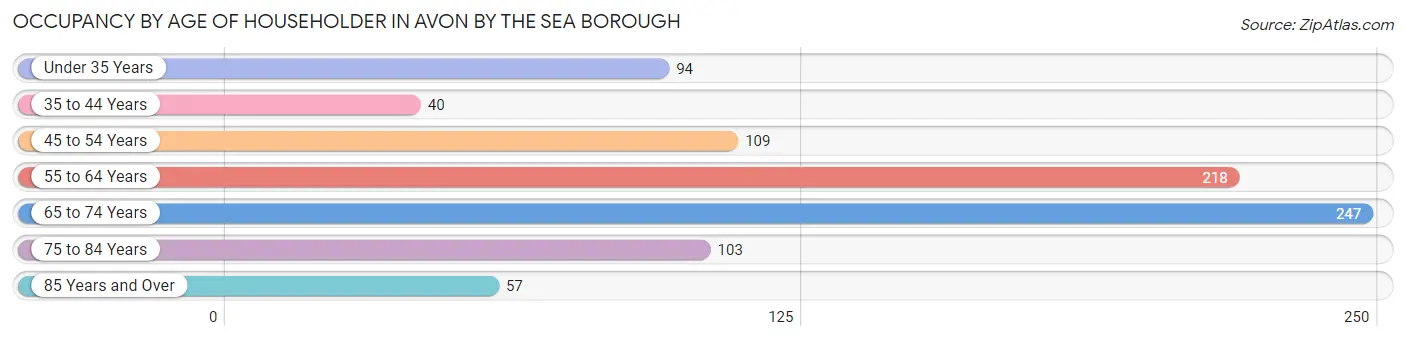
| Age Bracket | # Households | % Households |
| Under 35 Years | 94 | 10.8% |
| 35 to 44 Years | 40 | 4.6% |
| 45 to 54 Years | 109 | 12.6% |
| 55 to 64 Years | 218 | 25.1% |
| 65 to 74 Years | 247 | 28.5% |
| 75 to 84 Years | 103 | 11.9% |
| 85 Years and Over | 57 | 6.6% |
| Total | 868 | 100.0% |
Housing Finances in Avon by the Sea borough
Median Income by Occupancy in Avon by the Sea borough
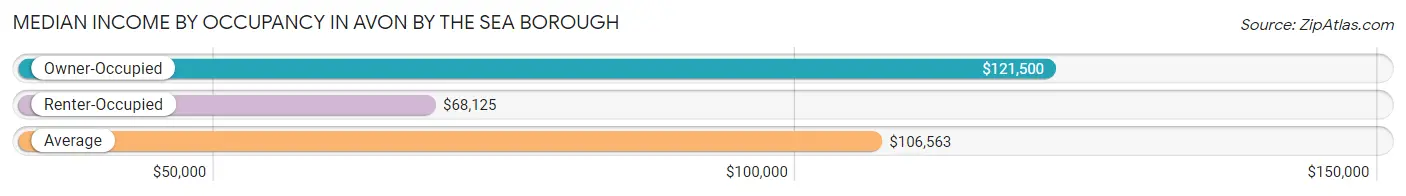
| Occupancy Type | # Households | Median Income |
| Owner-Occupied | 594 (68.4%) | $121,500 |
| Renter-Occupied | 274 (31.6%) | $68,125 |
| Average | 868 (100.0%) | $106,563 |
Occupancy by Householder Income Bracket in Avon by the Sea borough
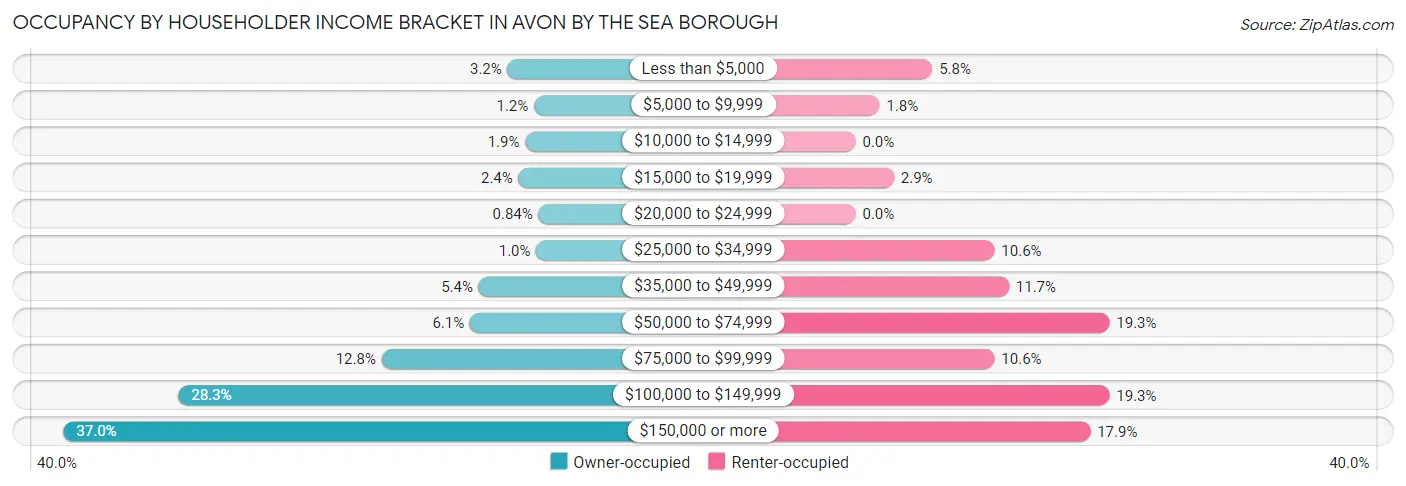
| Income Bracket | Owner-occupied | Renter-occupied |
| Less than $5,000 | 19 (3.2%) | 16 (5.8%) |
| $5,000 to $9,999 | 7 (1.2%) | 5 (1.8%) |
| $10,000 to $14,999 | 11 (1.8%) | 0 (0.0%) |
| $15,000 to $19,999 | 14 (2.4%) | 8 (2.9%) |
| $20,000 to $24,999 | 5 (0.8%) | 0 (0.0%) |
| $25,000 to $34,999 | 6 (1.0%) | 29 (10.6%) |
| $35,000 to $49,999 | 32 (5.4%) | 32 (11.7%) |
| $50,000 to $74,999 | 36 (6.1%) | 53 (19.3%) |
| $75,000 to $99,999 | 76 (12.8%) | 29 (10.6%) |
| $100,000 to $149,999 | 168 (28.3%) | 53 (19.3%) |
| $150,000 or more | 220 (37.0%) | 49 (17.9%) |
| Total | 594 (100.0%) | 274 (100.0%) |
Monthly Housing Cost Tiers in Avon by the Sea borough
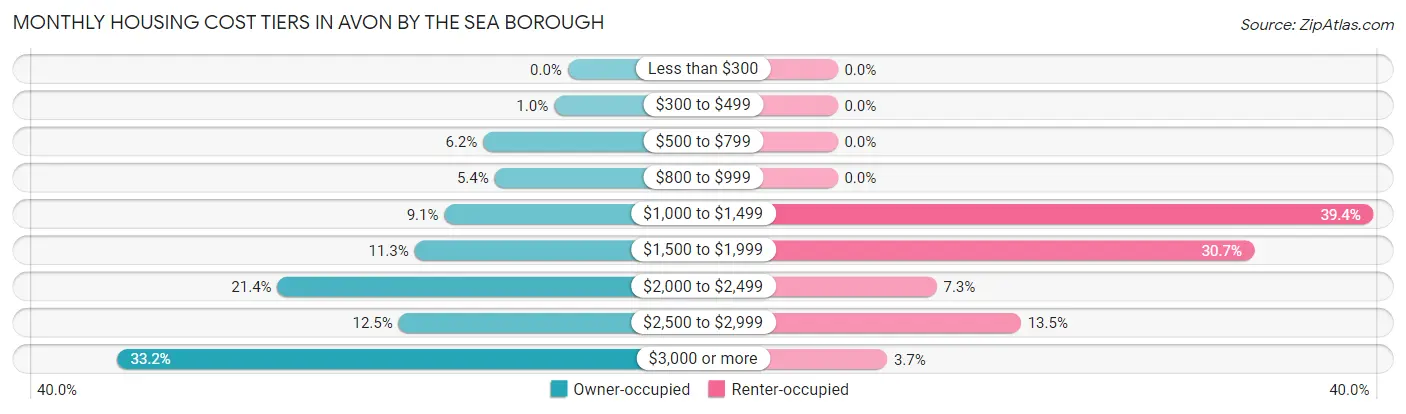
| Monthly Cost | Owner-occupied | Renter-occupied |
| Less than $300 | 0 (0.0%) | 0 (0.0%) |
| $300 to $499 | 6 (1.0%) | 0 (0.0%) |
| $500 to $799 | 37 (6.2%) | 0 (0.0%) |
| $800 to $999 | 32 (5.4%) | 0 (0.0%) |
| $1,000 to $1,499 | 54 (9.1%) | 108 (39.4%) |
| $1,500 to $1,999 | 67 (11.3%) | 84 (30.7%) |
| $2,000 to $2,499 | 127 (21.4%) | 20 (7.3%) |
| $2,500 to $2,999 | 74 (12.5%) | 37 (13.5%) |
| $3,000 or more | 197 (33.2%) | 10 (3.6%) |
| Total | 594 (100.0%) | 274 (100.0%) |
Physical Housing Characteristics in Avon by the Sea borough
Housing Structures in Avon by the Sea borough
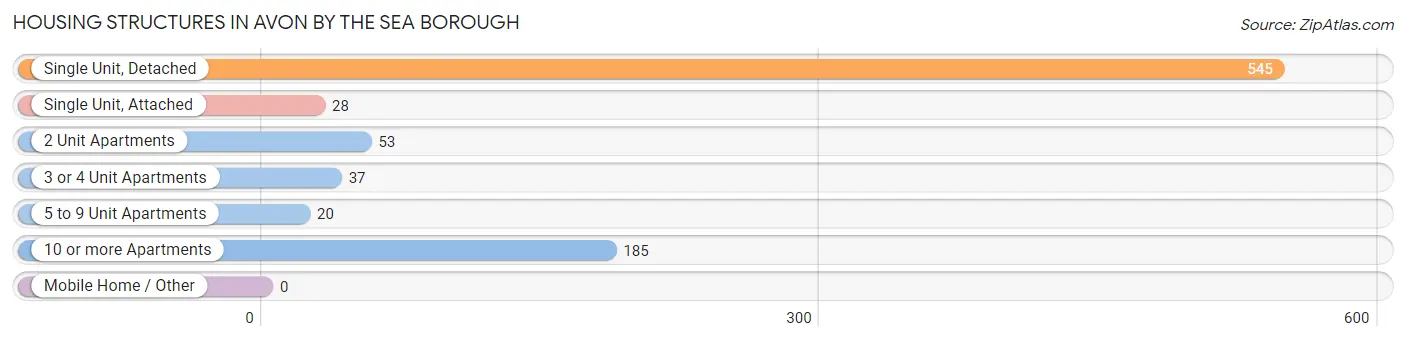
| Structure Type | # Housing Units | % Housing Units |
| Single Unit, Detached | 545 | 62.8% |
| Single Unit, Attached | 28 | 3.2% |
| 2 Unit Apartments | 53 | 6.1% |
| 3 or 4 Unit Apartments | 37 | 4.3% |
| 5 to 9 Unit Apartments | 20 | 2.3% |
| 10 or more Apartments | 185 | 21.3% |
| Mobile Home / Other | 0 | 0.0% |
| Total | 868 | 100.0% |
Housing Structures by Occupancy in Avon by the Sea borough
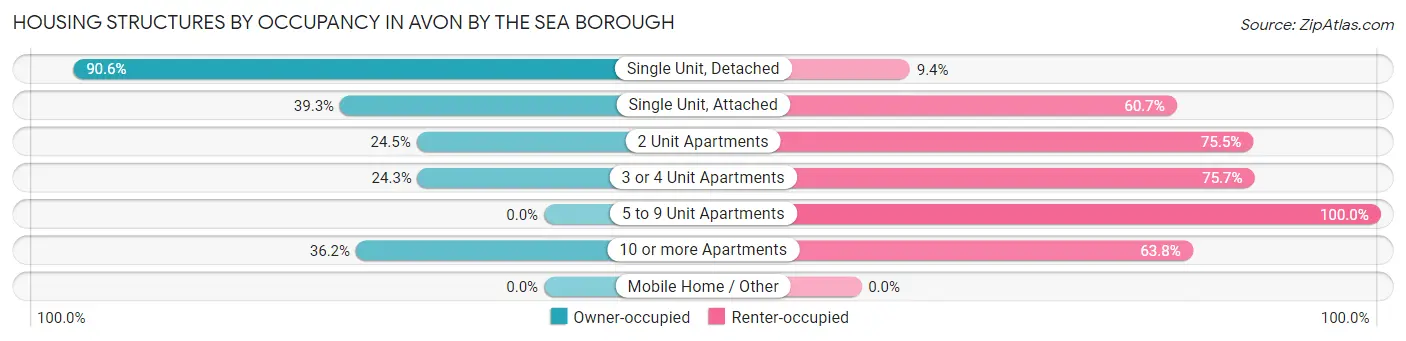
| Structure Type | Owner-occupied | Renter-occupied |
| Single Unit, Detached | 494 (90.6%) | 51 (9.4%) |
| Single Unit, Attached | 11 (39.3%) | 17 (60.7%) |
| 2 Unit Apartments | 13 (24.5%) | 40 (75.5%) |
| 3 or 4 Unit Apartments | 9 (24.3%) | 28 (75.7%) |
| 5 to 9 Unit Apartments | 0 (0.0%) | 20 (100.0%) |
| 10 or more Apartments | 67 (36.2%) | 118 (63.8%) |
| Mobile Home / Other | 0 (0.0%) | 0 (0.0%) |
| Total | 594 (68.4%) | 274 (31.6%) |
Housing Structures by Number of Rooms in Avon by the Sea borough
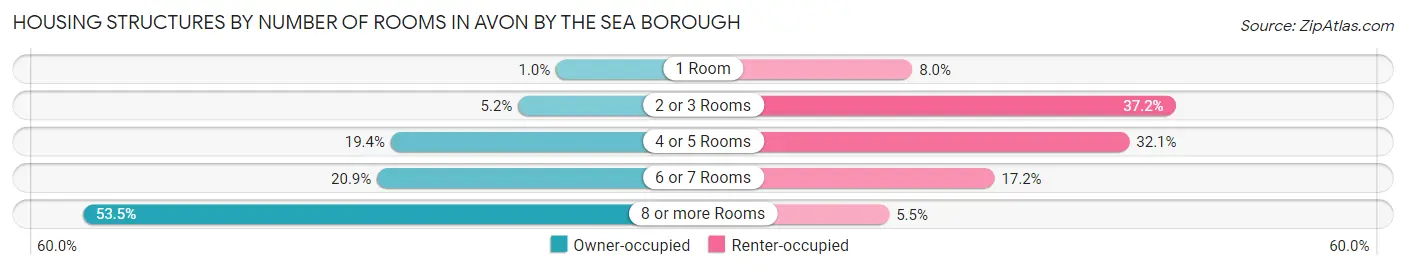
| Number of Rooms | Owner-occupied | Renter-occupied |
| 1 Room | 6 (1.0%) | 22 (8.0%) |
| 2 or 3 Rooms | 31 (5.2%) | 102 (37.2%) |
| 4 or 5 Rooms | 115 (19.4%) | 88 (32.1%) |
| 6 or 7 Rooms | 124 (20.9%) | 47 (17.2%) |
| 8 or more Rooms | 318 (53.5%) | 15 (5.5%) |
| Total | 594 (100.0%) | 274 (100.0%) |
Housing Structure by Heating Type in Avon by the Sea borough
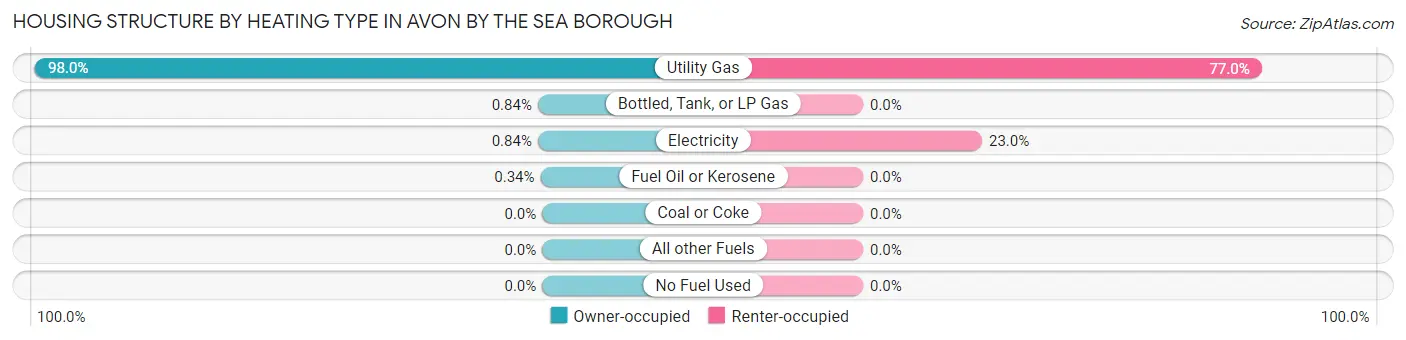
| Heating Type | Owner-occupied | Renter-occupied |
| Utility Gas | 582 (98.0%) | 211 (77.0%) |
| Bottled, Tank, or LP Gas | 5 (0.8%) | 0 (0.0%) |
| Electricity | 5 (0.8%) | 63 (23.0%) |
| Fuel Oil or Kerosene | 2 (0.3%) | 0 (0.0%) |
| Coal or Coke | 0 (0.0%) | 0 (0.0%) |
| All other Fuels | 0 (0.0%) | 0 (0.0%) |
| No Fuel Used | 0 (0.0%) | 0 (0.0%) |
| Total | 594 (100.0%) | 274 (100.0%) |
Household Vehicle Usage in Avon by the Sea borough
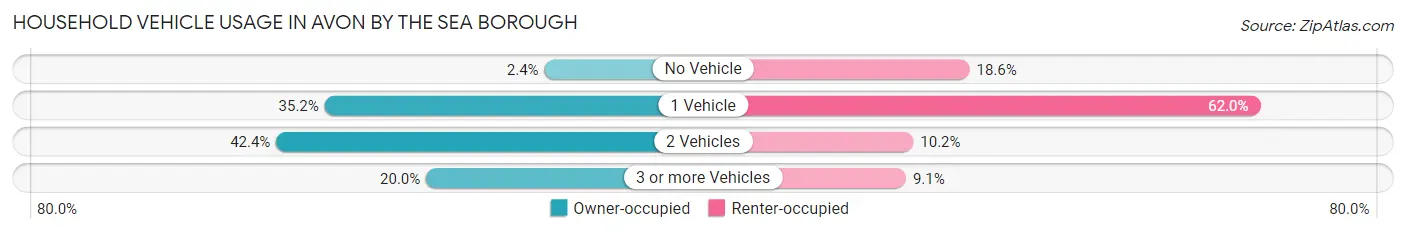
| Vehicles per Household | Owner-occupied | Renter-occupied |
| No Vehicle | 14 (2.4%) | 51 (18.6%) |
| 1 Vehicle | 209 (35.2%) | 170 (62.0%) |
| 2 Vehicles | 252 (42.4%) | 28 (10.2%) |
| 3 or more Vehicles | 119 (20.0%) | 25 (9.1%) |
| Total | 594 (100.0%) | 274 (100.0%) |
Real Estate & Mortgages in Avon by the Sea borough
Real Estate and Mortgage Overview in Avon by the Sea borough
| Characteristic | Without Mortgage | With Mortgage |
| Housing Units | 245 | 349 |
| Median Property Value | $1,193,800 | $1,161,200 |
| Median Household Income | $108,125 | $163 |
| Monthly Housing Costs | $1,501 | $180 |
| Real Estate Taxes | $10,001 | $5 |
Property Value by Mortgage Status in Avon by the Sea borough
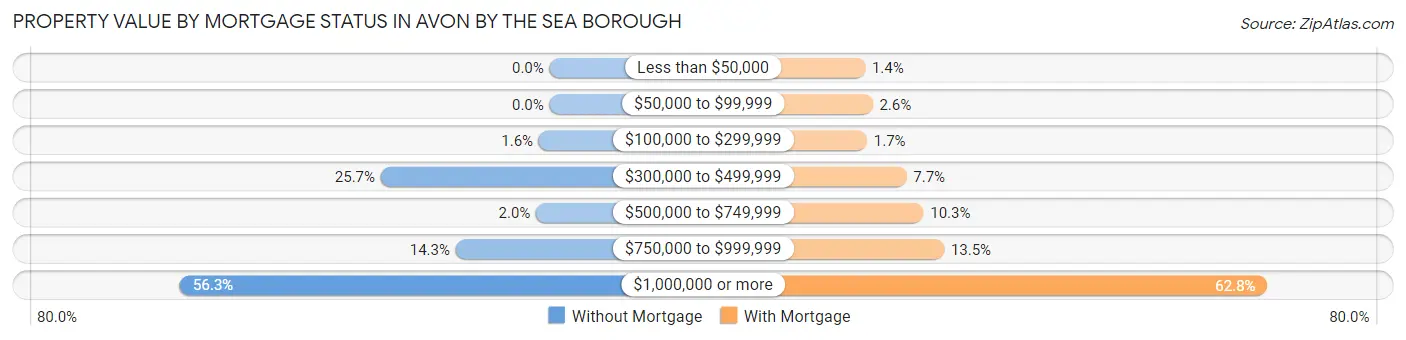
| Property Value | Without Mortgage | With Mortgage |
| Less than $50,000 | 0 (0.0%) | 5 (1.4%) |
| $50,000 to $99,999 | 0 (0.0%) | 9 (2.6%) |
| $100,000 to $299,999 | 4 (1.6%) | 6 (1.7%) |
| $300,000 to $499,999 | 63 (25.7%) | 27 (7.7%) |
| $500,000 to $749,999 | 5 (2.0%) | 36 (10.3%) |
| $750,000 to $999,999 | 35 (14.3%) | 47 (13.5%) |
| $1,000,000 or more | 138 (56.3%) | 219 (62.7%) |
| Total | 245 (100.0%) | 349 (100.0%) |
Household Income by Mortgage Status in Avon by the Sea borough
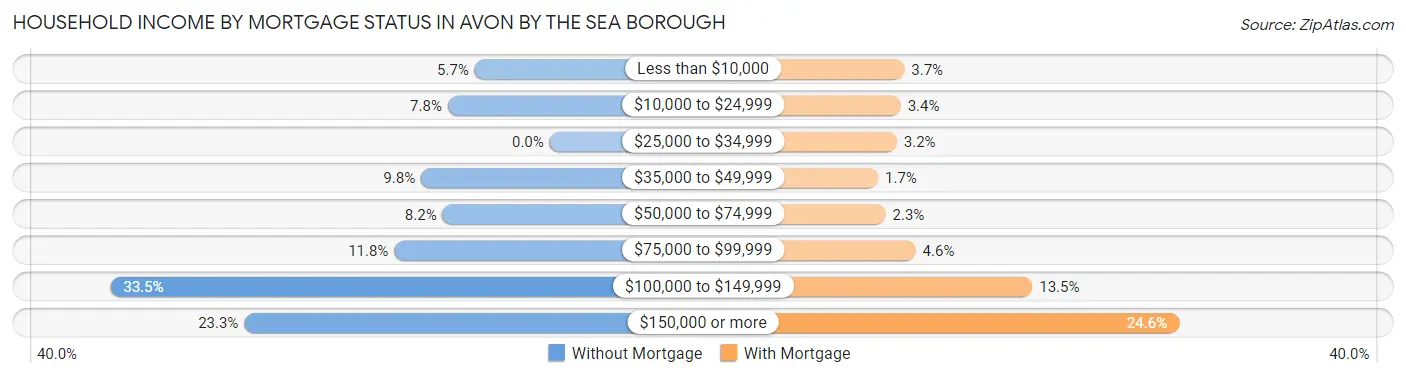
| Household Income | Without Mortgage | With Mortgage |
| Less than $10,000 | 14 (5.7%) | 13 (3.7%) |
| $10,000 to $24,999 | 19 (7.8%) | 12 (3.4%) |
| $25,000 to $34,999 | 0 (0.0%) | 11 (3.2%) |
| $35,000 to $49,999 | 24 (9.8%) | 6 (1.7%) |
| $50,000 to $74,999 | 20 (8.2%) | 8 (2.3%) |
| $75,000 to $99,999 | 29 (11.8%) | 16 (4.6%) |
| $100,000 to $149,999 | 82 (33.5%) | 47 (13.5%) |
| $150,000 or more | 57 (23.3%) | 86 (24.6%) |
| Total | 245 (100.0%) | 349 (100.0%) |
Property Value to Household Income Ratio in Avon by the Sea borough
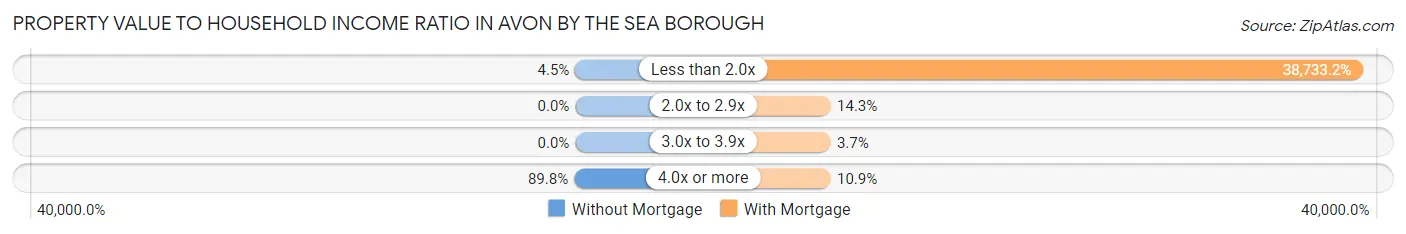
| Value-to-Income Ratio | Without Mortgage | With Mortgage |
| Less than 2.0x | 11 (4.5%) | 135,179 (38,733.2%) |
| 2.0x to 2.9x | 0 (0.0%) | 50 (14.3%) |
| 3.0x to 3.9x | 0 (0.0%) | 13 (3.7%) |
| 4.0x or more | 220 (89.8%) | 38 (10.9%) |
| Total | 245 (100.0%) | 349 (100.0%) |
Real Estate Taxes by Mortgage Status in Avon by the Sea borough
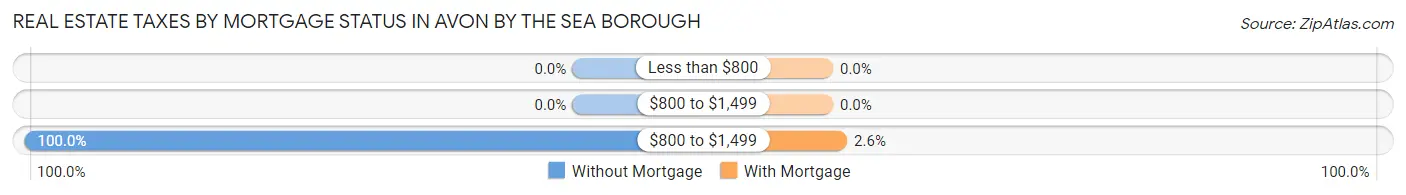
| Property Taxes | Without Mortgage | With Mortgage |
| Less than $800 | 0 (0.0%) | 0 (0.0%) |
| $800 to $1,499 | 0 (0.0%) | 0 (0.0%) |
| $800 to $1,499 | 245 (100.0%) | 9 (2.6%) |
| Total | 245 (100.0%) | 349 (100.0%) |
Health & Disability in Avon by the Sea borough
Health Insurance Coverage by Age in Avon by the Sea borough
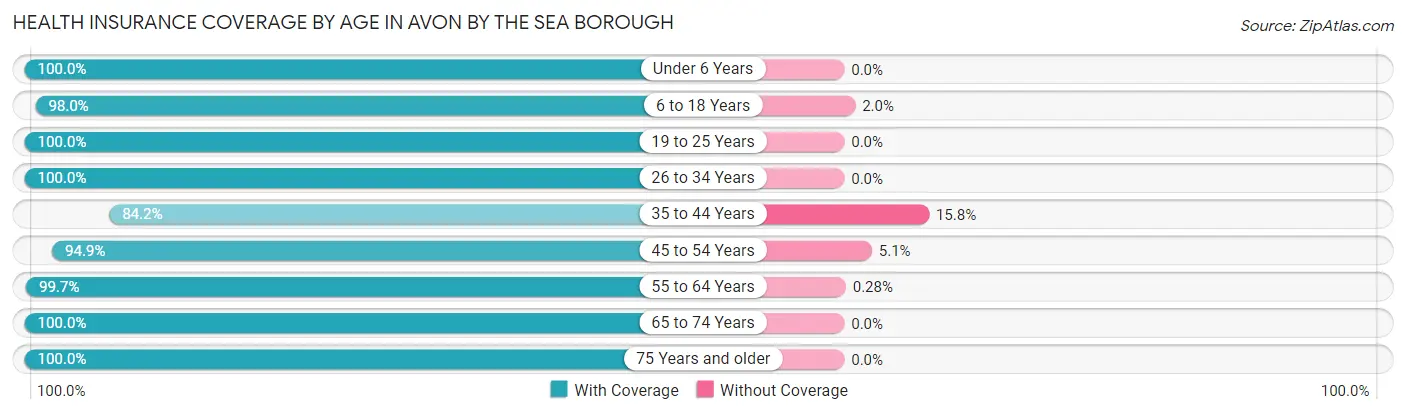
| Age Bracket | With Coverage | Without Coverage |
| Under 6 Years | 37 (100.0%) | 0 (0.0%) |
| 6 to 18 Years | 193 (98.0%) | 4 (2.0%) |
| 19 to 25 Years | 152 (100.0%) | 0 (0.0%) |
| 26 to 34 Years | 195 (100.0%) | 0 (0.0%) |
| 35 to 44 Years | 64 (84.2%) | 12 (15.8%) |
| 45 to 54 Years | 166 (94.9%) | 9 (5.1%) |
| 55 to 64 Years | 361 (99.7%) | 1 (0.3%) |
| 65 to 74 Years | 336 (100.0%) | 0 (0.0%) |
| 75 Years and older | 262 (100.0%) | 0 (0.0%) |
| Total | 1,766 (98.6%) | 26 (1.5%) |
Health Insurance Coverage by Citizenship Status in Avon by the Sea borough
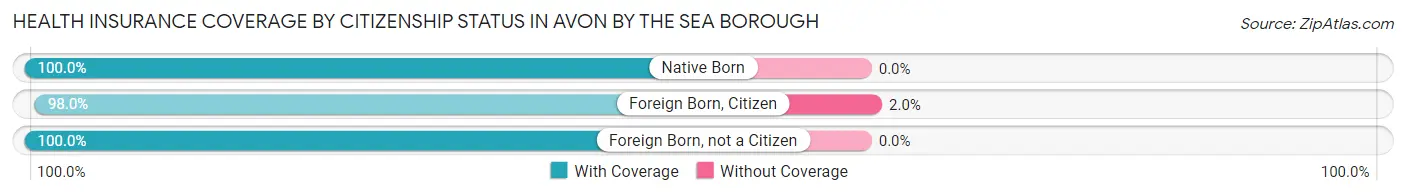
| Citizenship Status | With Coverage | Without Coverage |
| Native Born | 37 (100.0%) | 0 (0.0%) |
| Foreign Born, Citizen | 193 (98.0%) | 4 (2.0%) |
| Foreign Born, not a Citizen | 152 (100.0%) | 0 (0.0%) |
Health Insurance Coverage by Household Income in Avon by the Sea borough
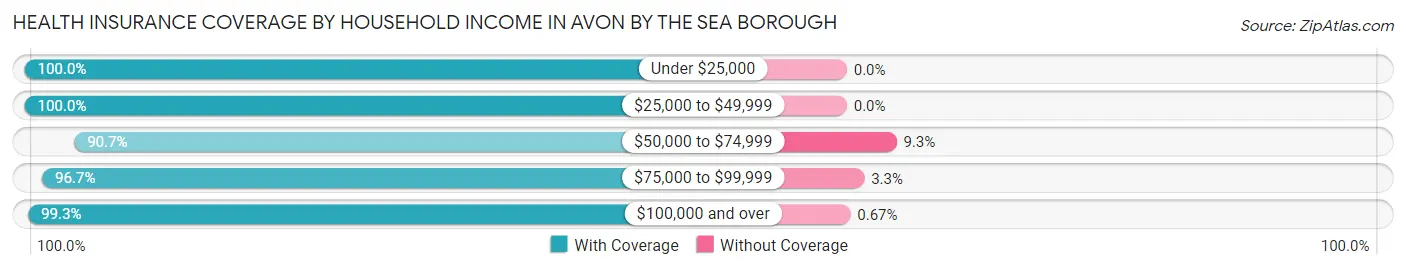
| Household Income | With Coverage | Without Coverage |
| Under $25,000 | 176 (100.0%) | 0 (0.0%) |
| $25,000 to $49,999 | 130 (100.0%) | 0 (0.0%) |
| $50,000 to $74,999 | 117 (90.7%) | 12 (9.3%) |
| $75,000 to $99,999 | 148 (96.7%) | 5 (3.3%) |
| $100,000 and over | 1,191 (99.3%) | 8 (0.7%) |
Public vs Private Health Insurance Coverage by Age in Avon by the Sea borough
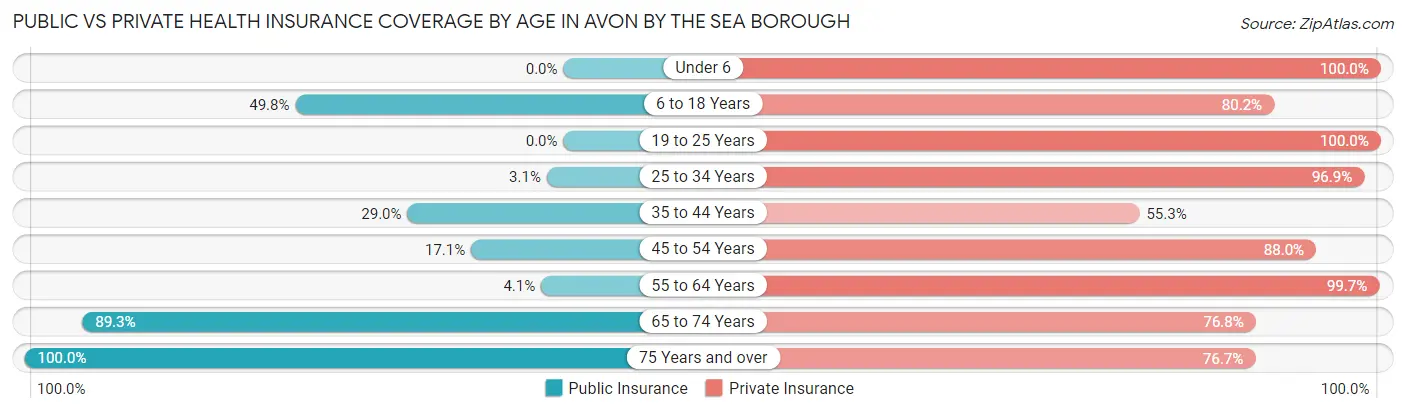
| Age Bracket | Public Insurance | Private Insurance |
| Under 6 | 0 (0.0%) | 37 (100.0%) |
| 6 to 18 Years | 98 (49.7%) | 158 (80.2%) |
| 19 to 25 Years | 0 (0.0%) | 152 (100.0%) |
| 25 to 34 Years | 6 (3.1%) | 189 (96.9%) |
| 35 to 44 Years | 22 (28.9%) | 42 (55.3%) |
| 45 to 54 Years | 30 (17.1%) | 154 (88.0%) |
| 55 to 64 Years | 15 (4.1%) | 361 (99.7%) |
| 65 to 74 Years | 300 (89.3%) | 258 (76.8%) |
| 75 Years and over | 262 (100.0%) | 201 (76.7%) |
| Total | 733 (40.9%) | 1,552 (86.6%) |
Disability Status by Sex by Age in Avon by the Sea borough
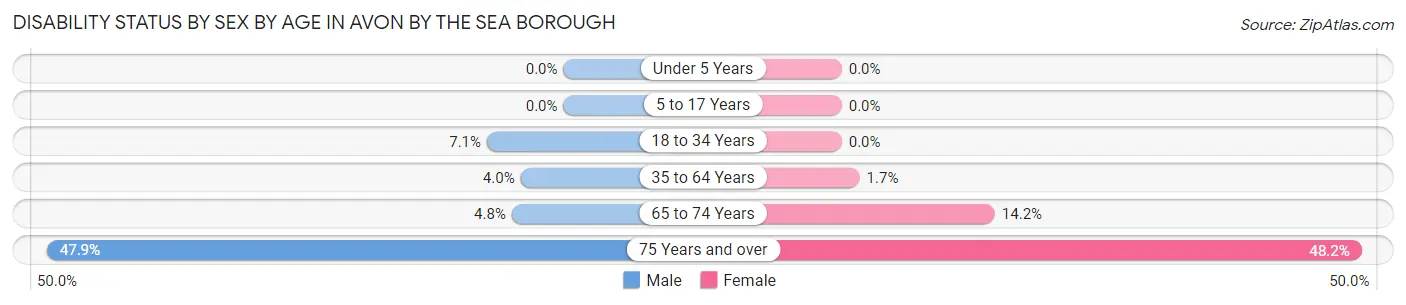
| Age Bracket | Male | Female |
| Under 5 Years | 0 (0.0%) | 0 (0.0%) |
| 5 to 17 Years | 0 (0.0%) | 0 (0.0%) |
| 18 to 34 Years | 12 (7.1%) | 0 (0.0%) |
| 35 to 64 Years | 10 (4.0%) | 6 (1.7%) |
| 65 to 74 Years | 7 (4.8%) | 27 (14.2%) |
| 75 Years and over | 58 (47.9%) | 68 (48.2%) |
Disability Class by Sex by Age in Avon by the Sea borough
Disability Class: Hearing Difficulty
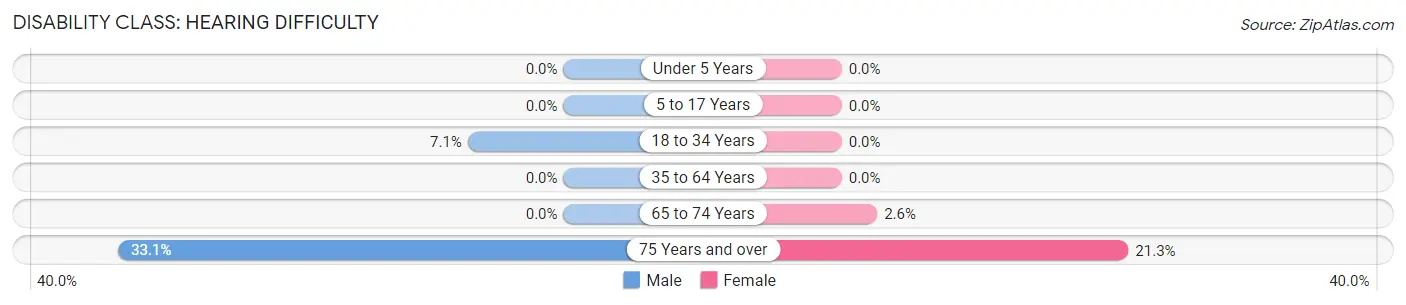
| Age Bracket | Male | Female |
| Under 5 Years | 0 (0.0%) | 0 (0.0%) |
| 5 to 17 Years | 0 (0.0%) | 0 (0.0%) |
| 18 to 34 Years | 12 (7.1%) | 0 (0.0%) |
| 35 to 64 Years | 0 (0.0%) | 0 (0.0%) |
| 65 to 74 Years | 0 (0.0%) | 5 (2.6%) |
| 75 Years and over | 40 (33.1%) | 30 (21.3%) |
Disability Class: Vision Difficulty
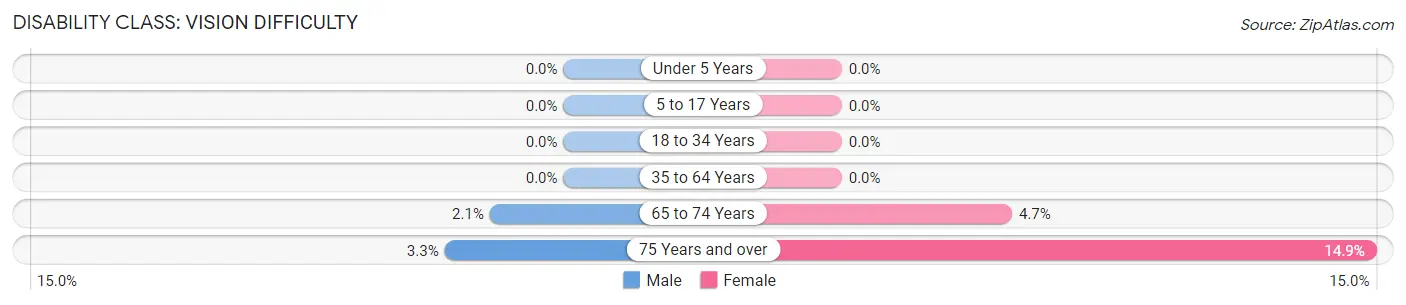
| Age Bracket | Male | Female |
| Under 5 Years | 0 (0.0%) | 0 (0.0%) |
| 5 to 17 Years | 0 (0.0%) | 0 (0.0%) |
| 18 to 34 Years | 0 (0.0%) | 0 (0.0%) |
| 35 to 64 Years | 0 (0.0%) | 0 (0.0%) |
| 65 to 74 Years | 3 (2.1%) | 9 (4.7%) |
| 75 Years and over | 4 (3.3%) | 21 (14.9%) |
Disability Class: Cognitive Difficulty
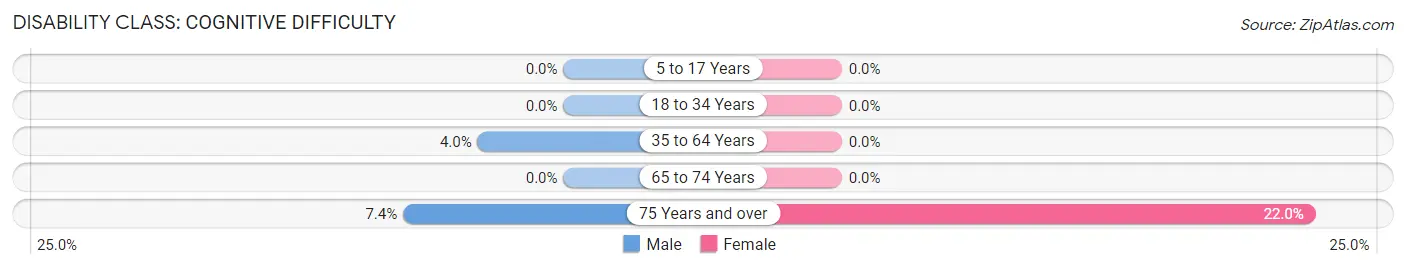
| Age Bracket | Male | Female |
| 5 to 17 Years | 0 (0.0%) | 0 (0.0%) |
| 18 to 34 Years | 0 (0.0%) | 0 (0.0%) |
| 35 to 64 Years | 10 (4.0%) | 0 (0.0%) |
| 65 to 74 Years | 0 (0.0%) | 0 (0.0%) |
| 75 Years and over | 9 (7.4%) | 31 (22.0%) |
Disability Class: Ambulatory Difficulty
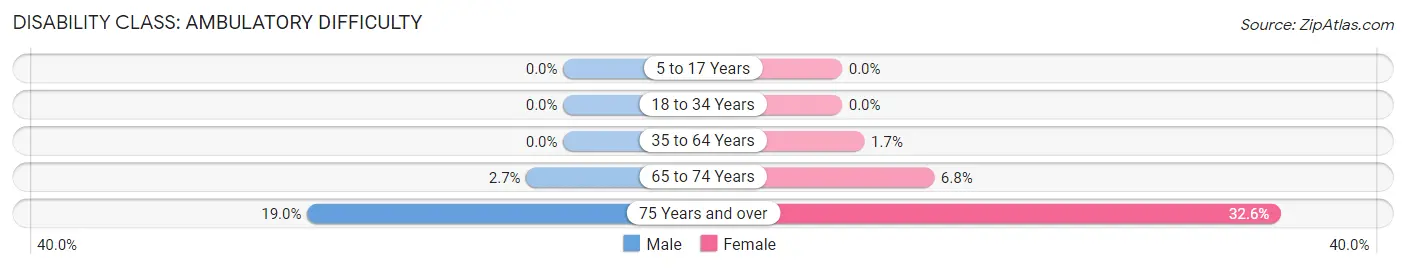
| Age Bracket | Male | Female |
| 5 to 17 Years | 0 (0.0%) | 0 (0.0%) |
| 18 to 34 Years | 0 (0.0%) | 0 (0.0%) |
| 35 to 64 Years | 0 (0.0%) | 6 (1.7%) |
| 65 to 74 Years | 4 (2.7%) | 13 (6.8%) |
| 75 Years and over | 23 (19.0%) | 46 (32.6%) |
Disability Class: Self-Care Difficulty
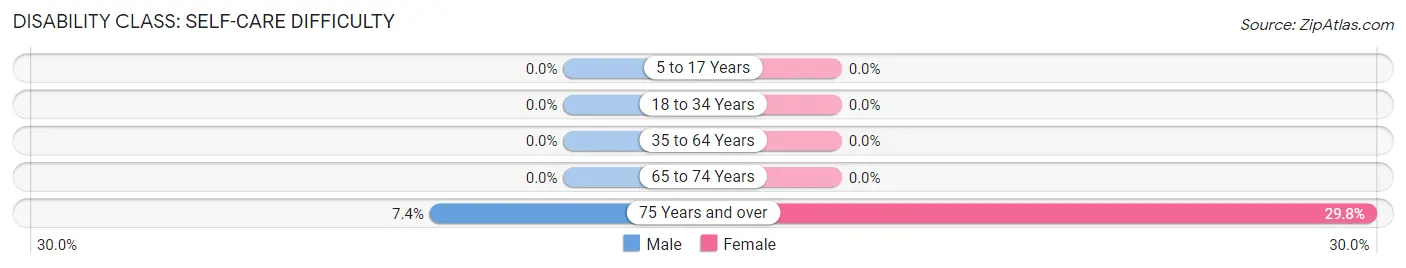
| Age Bracket | Male | Female |
| 5 to 17 Years | 0 (0.0%) | 0 (0.0%) |
| 18 to 34 Years | 0 (0.0%) | 0 (0.0%) |
| 35 to 64 Years | 0 (0.0%) | 0 (0.0%) |
| 65 to 74 Years | 0 (0.0%) | 0 (0.0%) |
| 75 Years and over | 9 (7.4%) | 42 (29.8%) |
Technology Access in Avon by the Sea borough
Computing Device Access in Avon by the Sea borough
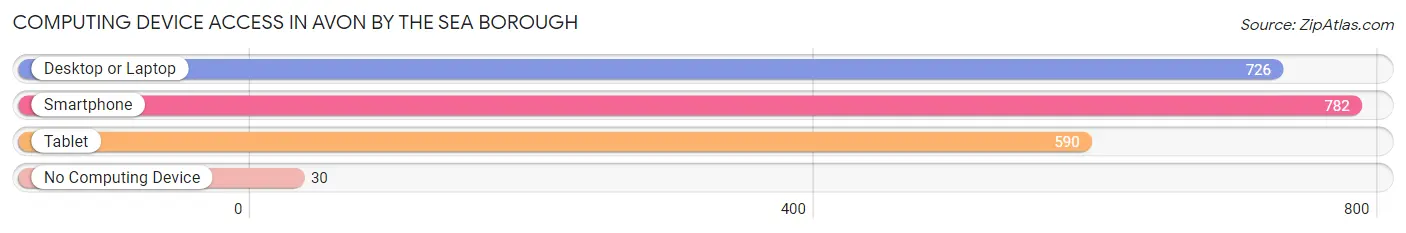
| Device Type | # Households | % Households |
| Desktop or Laptop | 726 | 83.6% |
| Smartphone | 782 | 90.1% |
| Tablet | 590 | 68.0% |
| No Computing Device | 30 | 3.5% |
| Total | 868 | 100.0% |
Internet Access in Avon by the Sea borough
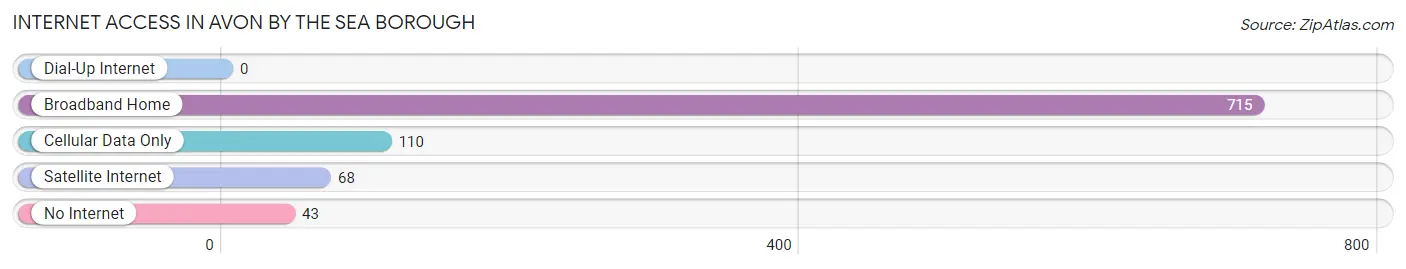
| Internet Type | # Households | % Households |
| Dial-Up Internet | 0 | 0.0% |
| Broadband Home | 715 | 82.4% |
| Cellular Data Only | 110 | 12.7% |
| Satellite Internet | 68 | 7.8% |
| No Internet | 43 | 5.0% |
| Total | 868 | 100.0% |
Avon by the Sea borough Summary
Avon By The Sea Borough, NJ is a small borough located in Monmouth County, New Jersey. It is situated on the Atlantic Ocean, just south of Asbury Park and north of Belmar. The borough is a popular summer destination for beachgoers and vacationers, and is known for its quaint, Victorian-style homes and boardwalk.
History
Avon By The Sea was founded in 1871 by a group of wealthy New Yorkers who wanted to create a seaside resort town. The town was named after the Avon River in England, and was designed to be a luxurious summer destination. The town was incorporated in 1900, and the first mayor was elected in 1901.
The town quickly became a popular destination for wealthy vacationers, and many of the original Victorian-style homes were built during this time. The town also had a thriving fishing industry, and the local fishermen would often bring their catches to the boardwalk to sell.
In the 1950s, the town began to decline as more people moved away from the area. However, in the 1970s, the town began to experience a resurgence as more people began to move back to the area. The town has since become a popular summer destination for beachgoers and vacationers.
Geography
Avon By The Sea is located in Monmouth County, New Jersey. It is situated on the Atlantic Ocean, just south of Asbury Park and north of Belmar. The borough is bordered by the Shark River to the north, the Atlantic Ocean to the east, and the towns of Neptune and Bradley Beach to the south and west, respectively.
The borough covers an area of 1.2 square miles, and is home to a population of approximately 2,500 people. The town is divided into two sections: the beachfront area and the residential area. The beachfront area is home to the boardwalk, which is lined with shops, restaurants, and other attractions. The residential area is made up of mostly Victorian-style homes.
Economy
Avon By The Sea is a popular summer destination for beachgoers and vacationers, and the local economy is largely dependent on tourism. The town is home to a variety of shops, restaurants, and other attractions, which draw in visitors from all over the region. The town also has a thriving fishing industry, and the local fishermen often bring their catches to the boardwalk to sell.
In addition to tourism, the town is also home to a number of small businesses, including a few retail stores, a few restaurants, and a few professional services. The town also has a few small manufacturing companies, which produce a variety of products, including furniture and clothing.
Demographics
As of the 2010 census, Avon By The Sea had a population of 2,543 people. The racial makeup of the borough was 94.3% White, 2.2% African American, 0.3% Native American, 0.9% Asian, 0.1% Pacific Islander, 0.7% from other races, and 1.5% from two or more races. Hispanic or Latino of any race were 3.2% of the population.
The median household income in Avon By The Sea was $68,750, and the median family income was $77,917. The per capita income for the borough was $37,945. About 4.3% of families and 5.7% of the population were below the poverty line, including 8.2% of those under age 18 and 4.2% of those age 65 or over.
Common Questions
What is Per Capita Income in Avon by the Sea borough?
Per Capita income in Avon by the Sea borough is $90,056.
What is the Median Family Income in Avon by the Sea borough?
Median Family Income in Avon by the Sea borough is $147,750.
What is the Median Household income in Avon by the Sea borough?
Median Household Income in Avon by the Sea borough is $106,563.
What is Income or Wage Gap in Avon by the Sea borough?
Income or Wage Gap in Avon by the Sea borough is 42.7%.
Women in Avon by the Sea borough earn 57.3 cents for every dollar earned by a man.
What is Inequality or Gini Index in Avon by the Sea borough?
Inequality or Gini Index in Avon by the Sea borough is 0.55.
What is the Total Population of Avon by the Sea borough?
Total Population of Avon by the Sea borough is 1,792.
What is the Total Male Population of Avon by the Sea borough?
Total Male Population of Avon by the Sea borough is 783.
What is the Total Female Population of Avon by the Sea borough?
Total Female Population of Avon by the Sea borough is 1,009.
What is the Ratio of Males per 100 Females in Avon by the Sea borough?
There are 77.60 Males per 100 Females in Avon by the Sea borough.
What is the Ratio of Females per 100 Males in Avon by the Sea borough?
There are 128.86 Females per 100 Males in Avon by the Sea borough.
What is the Median Population Age in Avon by the Sea borough?
Median Population Age in Avon by the Sea borough is 56.2 Years.
What is the Average Family Size in Avon by the Sea borough
Average Family Size in Avon by the Sea borough is 2.8 People.
What is the Average Household Size in Avon by the Sea borough
Average Household Size in Avon by the Sea borough is 2.1 People.
How Large is the Labor Force in Avon by the Sea borough?
There are 956 People in the Labor Forcein in Avon by the Sea borough.
What is the Percentage of People in the Labor Force in Avon by the Sea borough?
59.8% of People are in the Labor Force in Avon by the Sea borough.
What is the Unemployment Rate in Avon by the Sea borough?
Unemployment Rate in Avon by the Sea borough is 5.6%.