Belmar borough, NJ Map & Demographics
Belmar borough Overview
$66,508
PER CAPITA INCOME
$141,293
AVG FAMILY INCOME
$89,736
AVG HOUSEHOLD INCOME
18.3%
WAGE / INCOME GAP [ % ]
81.7¢/ $1
WAGE / INCOME GAP [ $ ]
0.50
INEQUALITY / GINI INDEX
5,877
TOTAL POPULATION
3,462
MALE POPULATION
2,415
FEMALE POPULATION
143.35
MALES / 100 FEMALES
69.76
FEMALES / 100 MALES
45.3
MEDIAN AGE
3.1
AVG FAMILY SIZE
2.2
AVG HOUSEHOLD SIZE
3,708
LABOR FORCE [ PEOPLE ]
71.4%
PERCENT IN LABOR FORCE
6.8%
UNEMPLOYMENT RATE
Income in Belmar borough
Income Overview in Belmar borough
Per Capita Income in Belmar borough is $66,508, while median incomes of families and households are $141,293 and $89,736 respectively.
| Characteristic | Number | Measure |
| Per Capita Income | 5,877 | $66,508 |
| Median Family Income | 1,260 | $141,293 |
| Mean Family Income | 1,260 | $192,373 |
| Median Household Income | 2,699 | $89,736 |
| Mean Household Income | 2,699 | $141,571 |
| Income Deficit | 1,260 | $0 |
| Wage / Income Gap (%) | 5,877 | 18.32% |
| Wage / Income Gap ($) | 5,877 | 81.68¢ per $1 |
| Gini / Inequality Index | 5,877 | 0.50 |
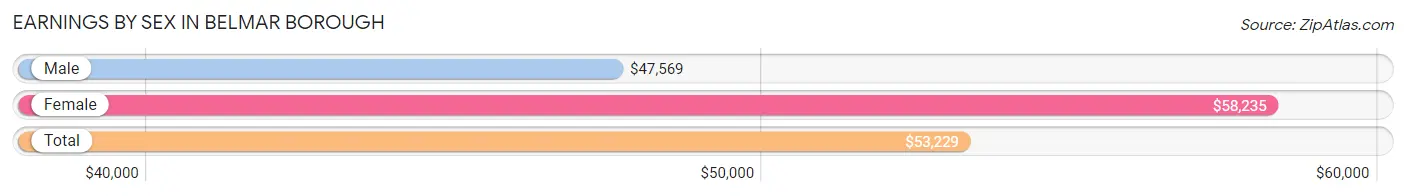
Earnings by Sex in Belmar borough
Average Earnings in Belmar borough are $53,229, $47,569 for men and $58,235 for women, a difference of 18.3%.
| Sex | Number | Average Earnings |
| Male | 2,366 (61.4%) | $47,569 |
| Female | 1,488 (38.6%) | $58,235 |
| Total | 3,854 (100.0%) | $53,229 |
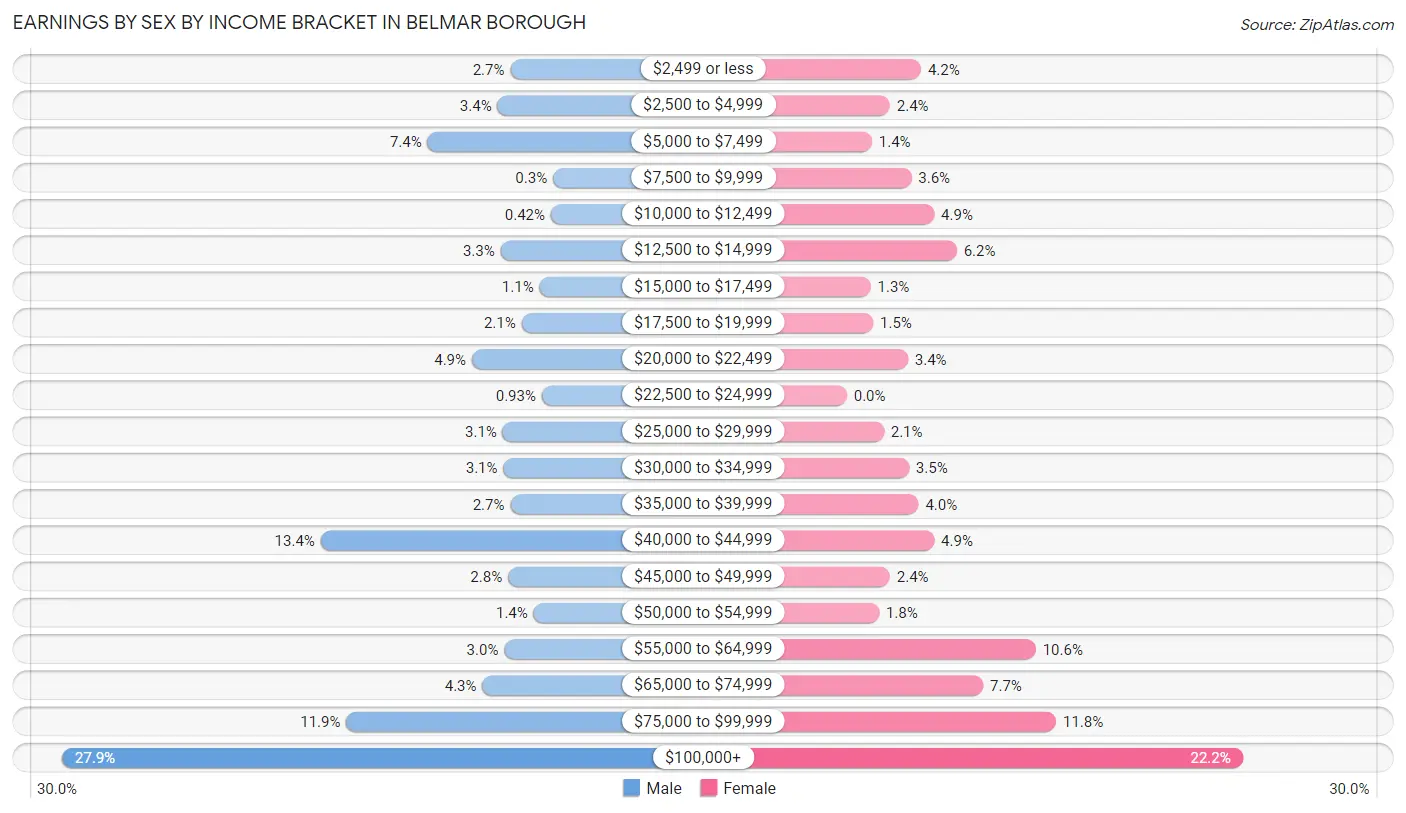
Earnings by Sex by Income Bracket in Belmar borough
The most common earnings brackets in Belmar borough are $100,000+ for men (660 | 27.9%) and $100,000+ for women (331 | 22.2%).
| Income | Male | Female |
| $2,499 or less | 64 (2.7%) | 62 (4.2%) |
| $2,500 to $4,999 | 81 (3.4%) | 36 (2.4%) |
| $5,000 to $7,499 | 174 (7.3%) | 21 (1.4%) |
| $7,500 to $9,999 | 7 (0.3%) | 54 (3.6%) |
| $10,000 to $12,499 | 10 (0.4%) | 73 (4.9%) |
| $12,500 to $14,999 | 77 (3.3%) | 92 (6.2%) |
| $15,000 to $17,499 | 25 (1.1%) | 20 (1.3%) |
| $17,500 to $19,999 | 49 (2.1%) | 22 (1.5%) |
| $20,000 to $22,499 | 115 (4.9%) | 51 (3.4%) |
| $22,500 to $24,999 | 22 (0.9%) | 0 (0.0%) |
| $25,000 to $29,999 | 74 (3.1%) | 31 (2.1%) |
| $30,000 to $34,999 | 73 (3.1%) | 52 (3.5%) |
| $35,000 to $39,999 | 64 (2.7%) | 60 (4.0%) |
| $40,000 to $44,999 | 316 (13.4%) | 73 (4.9%) |
| $45,000 to $49,999 | 67 (2.8%) | 36 (2.4%) |
| $50,000 to $54,999 | 33 (1.4%) | 27 (1.8%) |
| $55,000 to $64,999 | 72 (3.0%) | 158 (10.6%) |
| $65,000 to $74,999 | 101 (4.3%) | 114 (7.7%) |
| $75,000 to $99,999 | 282 (11.9%) | 175 (11.8%) |
| $100,000+ | 660 (27.9%) | 331 (22.2%) |
| Total | 2,366 (100.0%) | 1,488 (100.0%) |
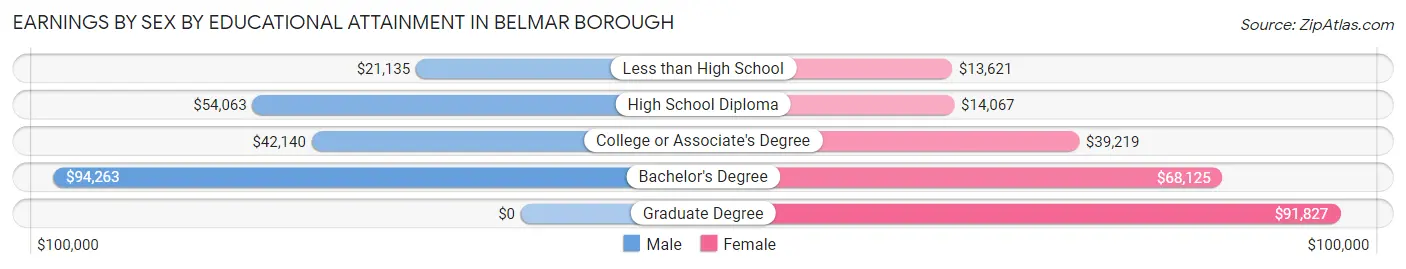
Earnings by Sex by Educational Attainment in Belmar borough
Average earnings in Belmar borough are $65,606 for men and $59,667 for women, a difference of 9.0%. Men with an educational attainment of bachelor's degree enjoy the highest average annual earnings of $94,263, while those with less than high school education earn the least with $21,135. Women with an educational attainment of graduate degree earn the most with the average annual earnings of $91,827, while those with less than high school education have the smallest earnings of $13,621.
| Educational Attainment | Male Income | Female Income |
| Less than High School | $21,135 | $13,621 |
| High School Diploma | $54,063 | $14,067 |
| College or Associate's Degree | $42,140 | $39,219 |
| Bachelor's Degree | $94,263 | $68,125 |
| Graduate Degree | - | - |
| Total | $65,606 | $59,667 |
Family Income in Belmar borough
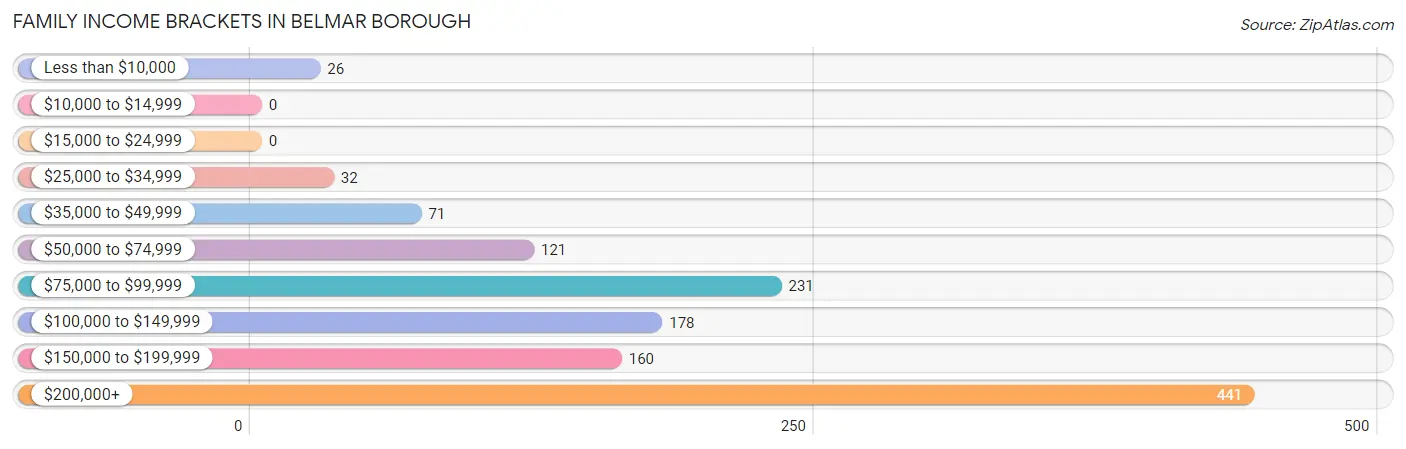
Family Income Brackets in Belmar borough
According to the Belmar borough family income data, there are 441 families falling into the $200,000+ income range, which is the most common income bracket and makes up 35.0% of all families.
| Income Bracket | # Families | % Families |
| Less than $10,000 | 26 | 2.1% |
| $10,000 to $14,999 | 0 | 0.0% |
| $15,000 to $24,999 | 0 | 0.0% |
| $25,000 to $34,999 | 32 | 2.5% |
| $35,000 to $49,999 | 71 | 5.6% |
| $50,000 to $74,999 | 121 | 9.6% |
| $75,000 to $99,999 | 231 | 18.3% |
| $100,000 to $149,999 | 178 | 14.1% |
| $150,000 to $199,999 | 160 | 12.7% |
| $200,000+ | 441 | 35.0% |
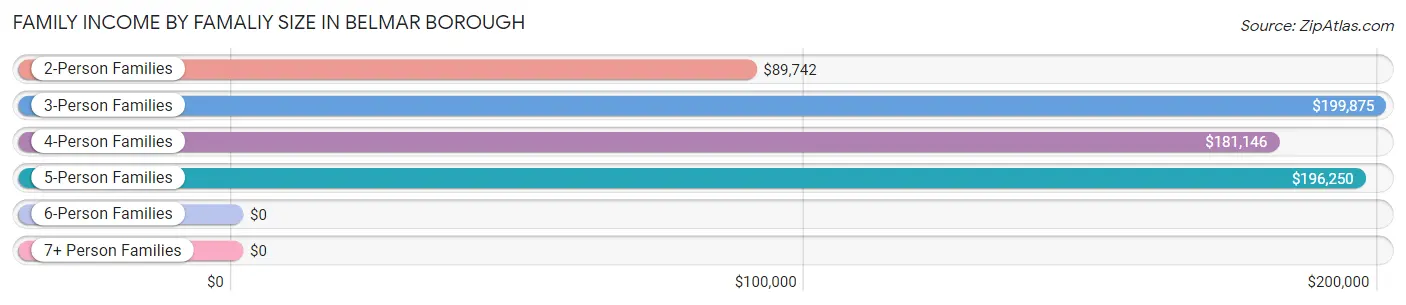
Family Income by Famaliy Size in Belmar borough
3-person families (309 | 24.5%) account for the highest median family income in Belmar borough with $199,875 per family, while 3-person families (309 | 24.5%) have the highest median income of $66,625 per family member.
| Income Bracket | # Families | Median Income |
| 2-Person Families | 567 (45.0%) | $89,742 |
| 3-Person Families | 309 (24.5%) | $199,875 |
| 4-Person Families | 311 (24.7%) | $181,146 |
| 5-Person Families | 32 (2.5%) | $196,250 |
| 6-Person Families | 41 (3.3%) | $0 |
| 7+ Person Families | 0 (0.0%) | $0 |
| Total | 1,260 (100.0%) | $141,293 |
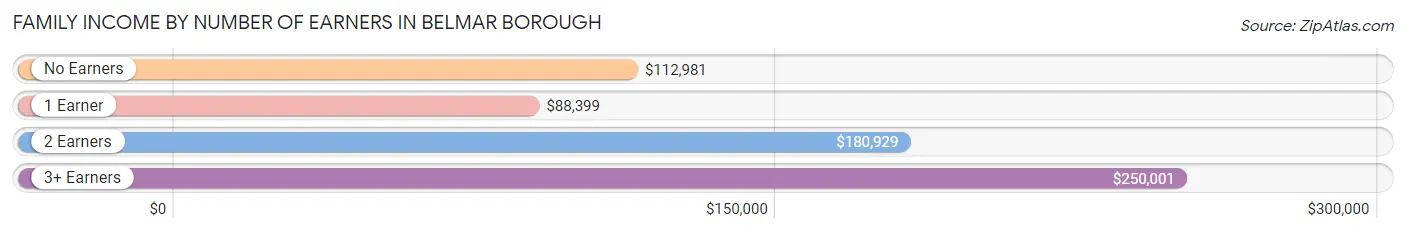
Family Income by Number of Earners in Belmar borough
The median family income in Belmar borough is $141,293, with families comprising 3+ earners (236) having the highest median family income of $250,001, while families with 1 earner (361) have the lowest median family income of $88,399, accounting for 18.7% and 28.6% of families, respectively.
| Number of Earners | # Families | Median Income |
| No Earners | 139 (11.0%) | $112,981 |
| 1 Earner | 361 (28.6%) | $88,399 |
| 2 Earners | 524 (41.6%) | $180,929 |
| 3+ Earners | 236 (18.7%) | $250,001 |
| Total | 1,260 (100.0%) | $141,293 |
Household Income in Belmar borough
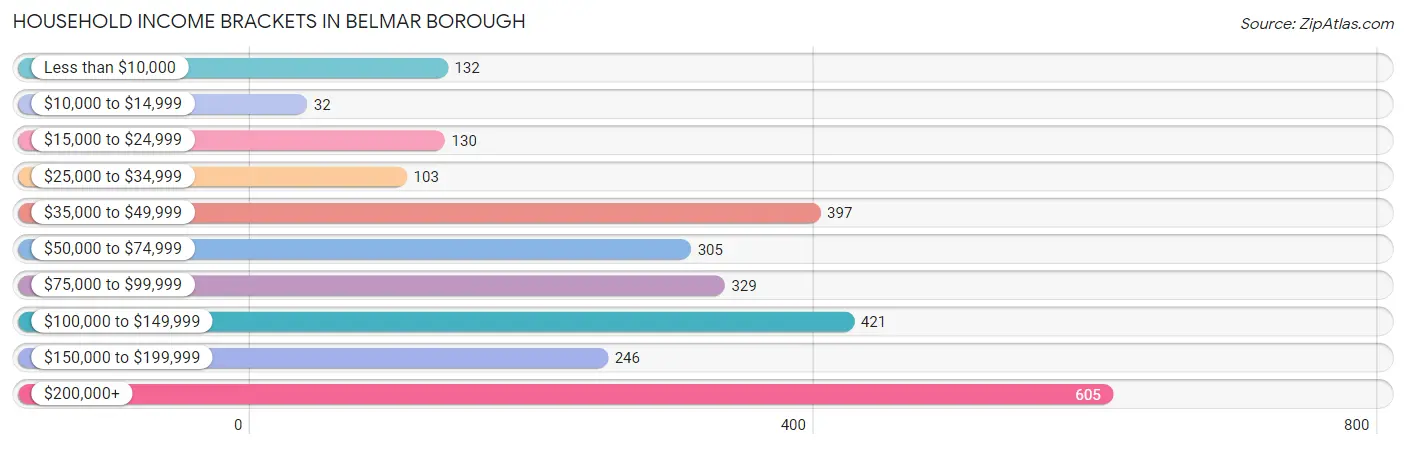
Household Income Brackets in Belmar borough
With 605 households falling in the category, the $200,000+ income range is the most frequent in Belmar borough, accounting for 22.4% of all households. In contrast, only 32 households (1.2%) fall into the $10,000 to $14,999 income bracket, making it the least populous group.
| Income Bracket | # Households | % Households |
| Less than $10,000 | 132 | 4.9% |
| $10,000 to $14,999 | 32 | 1.2% |
| $15,000 to $24,999 | 130 | 4.8% |
| $25,000 to $34,999 | 103 | 3.8% |
| $35,000 to $49,999 | 397 | 14.7% |
| $50,000 to $74,999 | 305 | 11.3% |
| $75,000 to $99,999 | 329 | 12.2% |
| $100,000 to $149,999 | 421 | 15.6% |
| $150,000 to $199,999 | 246 | 9.1% |
| $200,000+ | 605 | 22.4% |
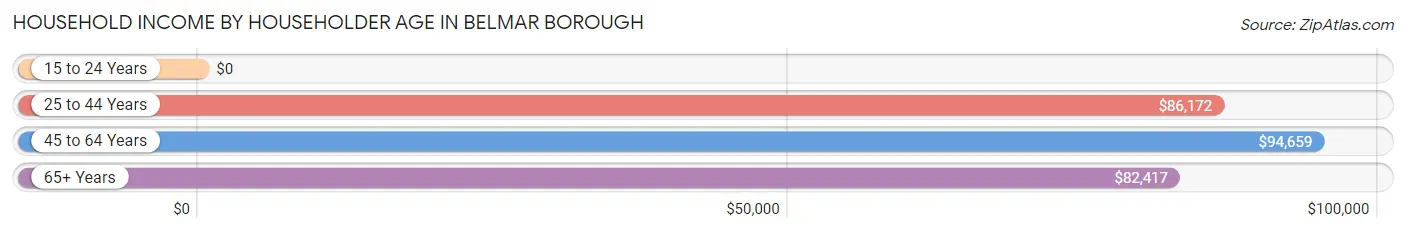
Household Income by Householder Age in Belmar borough
The median household income in Belmar borough is $89,736, with the highest median household income of $94,659 found in the 45 to 64 years age bracket for the primary householder. A total of 1,159 households (42.9%) fall into this category.
| Income Bracket | # Households | Median Income |
| 15 to 24 Years | 0 (0.0%) | $0 |
| 25 to 44 Years | 877 (32.5%) | $86,172 |
| 45 to 64 Years | 1,159 (42.9%) | $94,659 |
| 65+ Years | 663 (24.6%) | $82,417 |
| Total | 2,699 (100.0%) | $89,736 |
Poverty in Belmar borough
Income Below Poverty by Sex and Age in Belmar borough
With 6.8% poverty level for males and 8.2% for females among the residents of Belmar borough, 15 year old males and 12 to 14 year old females are the most vulnerable to poverty, with 15 males (20.8%) and 25 females (48.1%) in their respective age groups living below the poverty level.
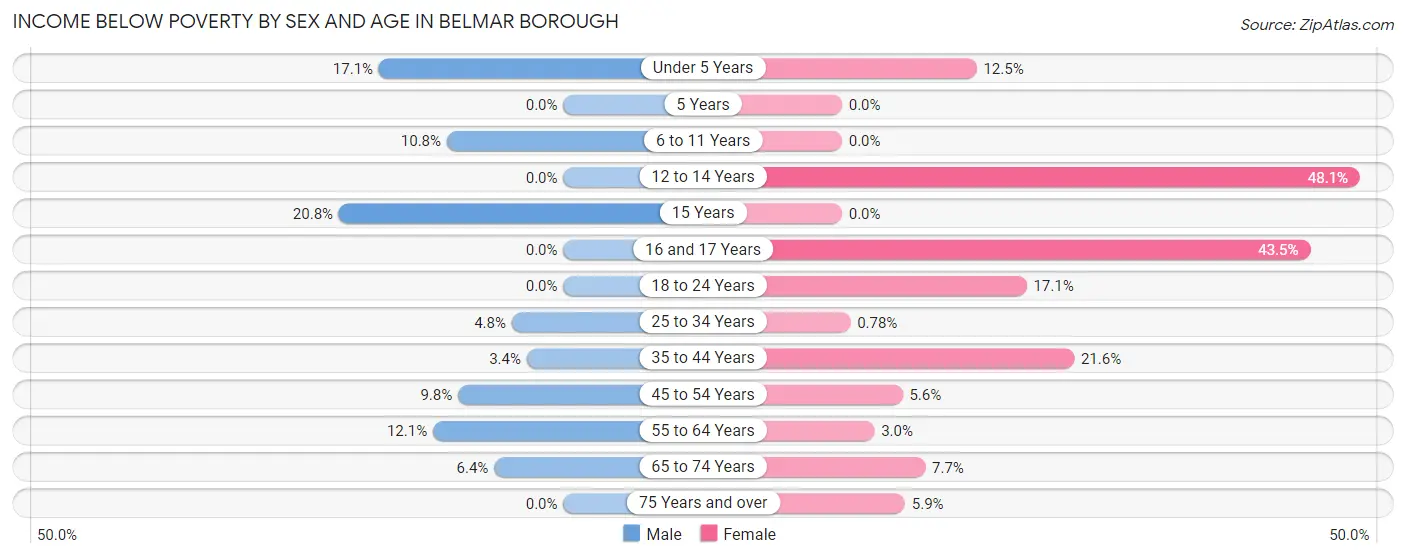
| Age Bracket | Male | Female |
| Under 5 Years | 19 (17.1%) | 12 (12.5%) |
| 5 Years | 0 (0.0%) | 0 (0.0%) |
| 6 to 11 Years | 12 (10.8%) | 0 (0.0%) |
| 12 to 14 Years | 0 (0.0%) | 25 (48.1%) |
| 15 Years | 15 (20.8%) | 0 (0.0%) |
| 16 and 17 Years | 0 (0.0%) | 20 (43.5%) |
| 18 to 24 Years | 0 (0.0%) | 18 (17.1%) |
| 25 to 34 Years | 32 (4.8%) | 3 (0.8%) |
| 35 to 44 Years | 14 (3.4%) | 50 (21.5%) |
| 45 to 54 Years | 55 (9.8%) | 16 (5.6%) |
| 55 to 64 Years | 68 (12.1%) | 16 (3.0%) |
| 65 to 74 Years | 21 (6.4%) | 28 (7.7%) |
| 75 Years and over | 0 (0.0%) | 11 (5.9%) |
| Total | 236 (6.8%) | 199 (8.2%) |
Income Above Poverty by Sex and Age in Belmar borough
According to the poverty statistics in Belmar borough, males aged 5 years and females aged 5 years are the age groups that are most secure financially, with 100.0% of males and 100.0% of females in these age groups living above the poverty line.
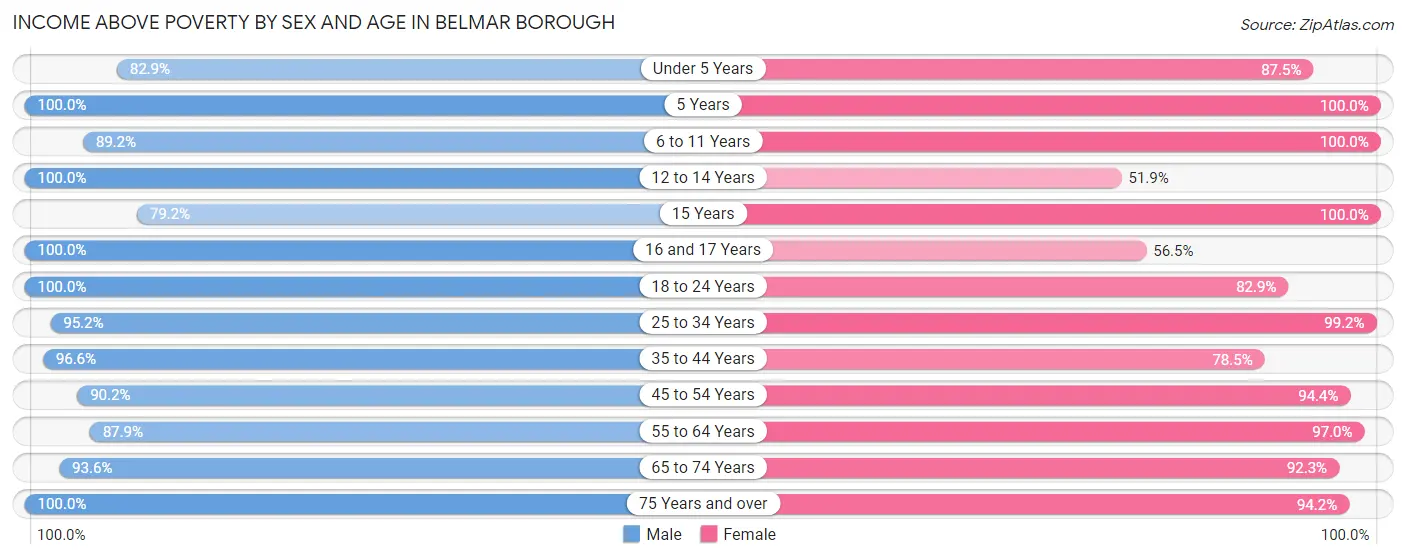
| Age Bracket | Male | Female |
| Under 5 Years | 92 (82.9%) | 84 (87.5%) |
| 5 Years | 14 (100.0%) | 11 (100.0%) |
| 6 to 11 Years | 99 (89.2%) | 104 (100.0%) |
| 12 to 14 Years | 93 (100.0%) | 27 (51.9%) |
| 15 Years | 57 (79.2%) | 19 (100.0%) |
| 16 and 17 Years | 54 (100.0%) | 26 (56.5%) |
| 18 to 24 Years | 320 (100.0%) | 87 (82.9%) |
| 25 to 34 Years | 637 (95.2%) | 381 (99.2%) |
| 35 to 44 Years | 399 (96.6%) | 182 (78.4%) |
| 45 to 54 Years | 508 (90.2%) | 268 (94.4%) |
| 55 to 64 Years | 494 (87.9%) | 515 (97.0%) |
| 65 to 74 Years | 306 (93.6%) | 334 (92.3%) |
| 75 Years and over | 153 (100.0%) | 177 (94.2%) |
| Total | 3,226 (93.2%) | 2,215 (91.8%) |
Income Below Poverty Among Married-Couple Families in Belmar borough
The poverty statistics for married-couple families in Belmar borough show that 1.7% or 14 of the total 848 families live below the poverty line. Families with 1 or 2 children have the highest poverty rate of 5.9%, comprising of 14 families. On the other hand, families with no children have the lowest poverty rate of 0.0%, which includes 0 families.
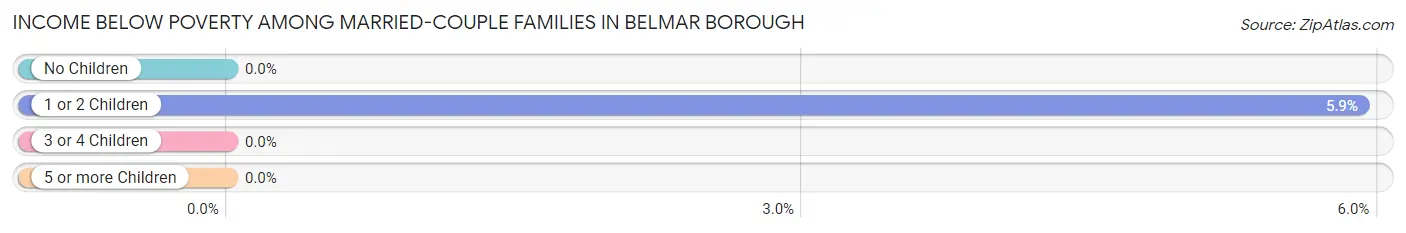
| Children | Above Poverty | Below Poverty |
| No Children | 588 (100.0%) | 0 (0.0%) |
| 1 or 2 Children | 223 (94.1%) | 14 (5.9%) |
| 3 or 4 Children | 23 (100.0%) | 0 (0.0%) |
| 5 or more Children | 0 (0.0%) | 0 (0.0%) |
| Total | 834 (98.4%) | 14 (1.7%) |
Income Below Poverty Among Single-Parent Households in Belmar borough
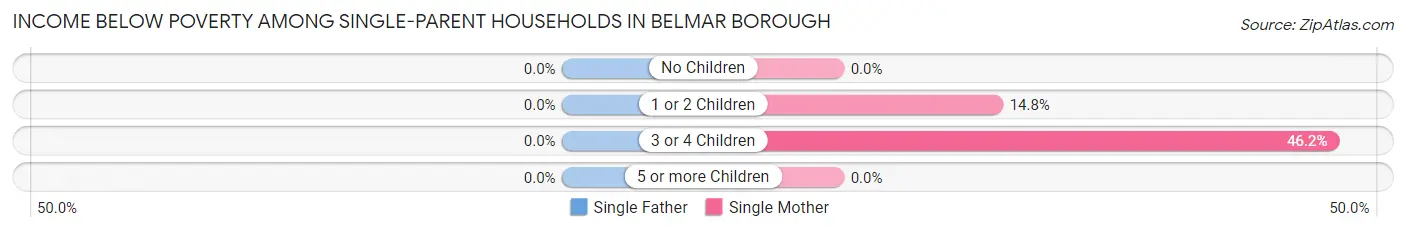
| Children | Single Father | Single Mother |
| No Children | 0 (0.0%) | 0 (0.0%) |
| 1 or 2 Children | 0 (0.0%) | 12 (14.8%) |
| 3 or 4 Children | 0 (0.0%) | 12 (46.2%) |
| 5 or more Children | 0 (0.0%) | 0 (0.0%) |
| Total | 0 (0.0%) | 24 (12.4%) |
Income Below Poverty Among Married-Couple vs Single-Parent Households in Belmar borough
The poverty data for Belmar borough shows that 14 of the married-couple family households (1.7%) and 24 of the single-parent households (5.8%) are living below the poverty level. Within the married-couple family households, those with 1 or 2 children have the highest poverty rate, with 14 households (5.9%) falling below the poverty line. Among the single-parent households, those with 3 or 4 children have the highest poverty rate, with 12 household (46.2%) living below poverty.
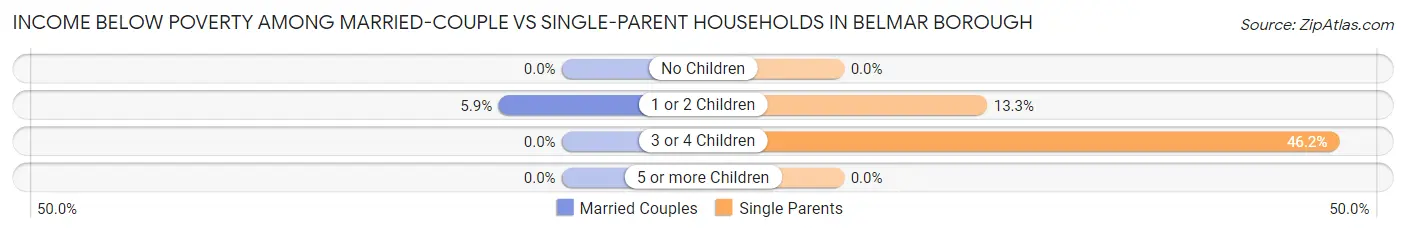
| Children | Married-Couple Families | Single-Parent Households |
| No Children | 0 (0.0%) | 0 (0.0%) |
| 1 or 2 Children | 14 (5.9%) | 12 (13.3%) |
| 3 or 4 Children | 0 (0.0%) | 12 (46.2%) |
| 5 or more Children | 0 (0.0%) | 0 (0.0%) |
| Total | 14 (1.7%) | 24 (5.8%) |
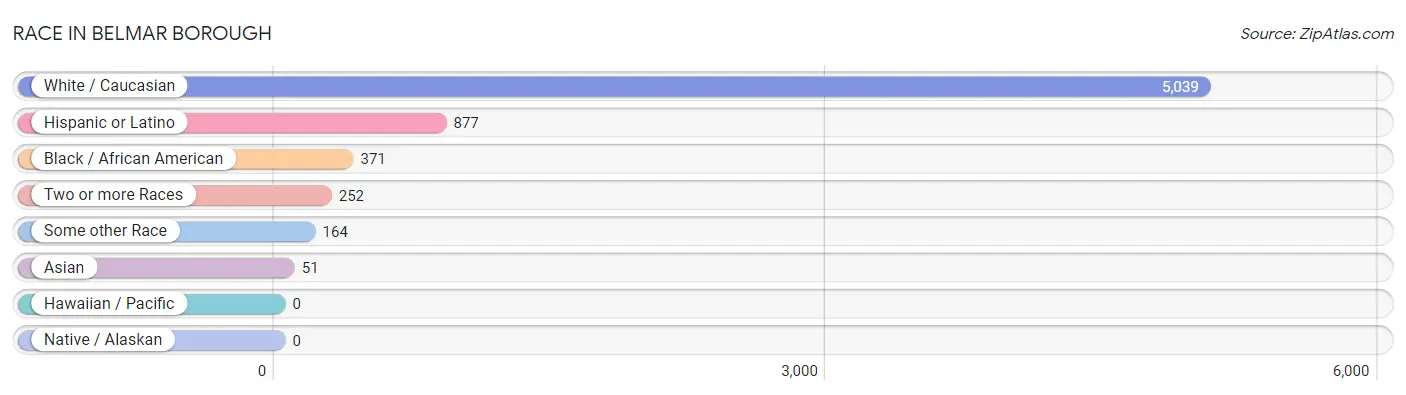
Race in Belmar borough
The most populous races in Belmar borough are White / Caucasian (5,039 | 85.7%), Hispanic or Latino (877 | 14.9%), and Black / African American (371 | 6.3%).
| Race | # Population | % Population |
| Asian | 51 | 0.9% |
| Black / African American | 371 | 6.3% |
| Hawaiian / Pacific | 0 | 0.0% |
| Hispanic or Latino | 877 | 14.9% |
| Native / Alaskan | 0 | 0.0% |
| White / Caucasian | 5,039 | 85.7% |
| Two or more Races | 252 | 4.3% |
| Some other Race | 164 | 2.8% |
| Total | 5,877 | 100.0% |
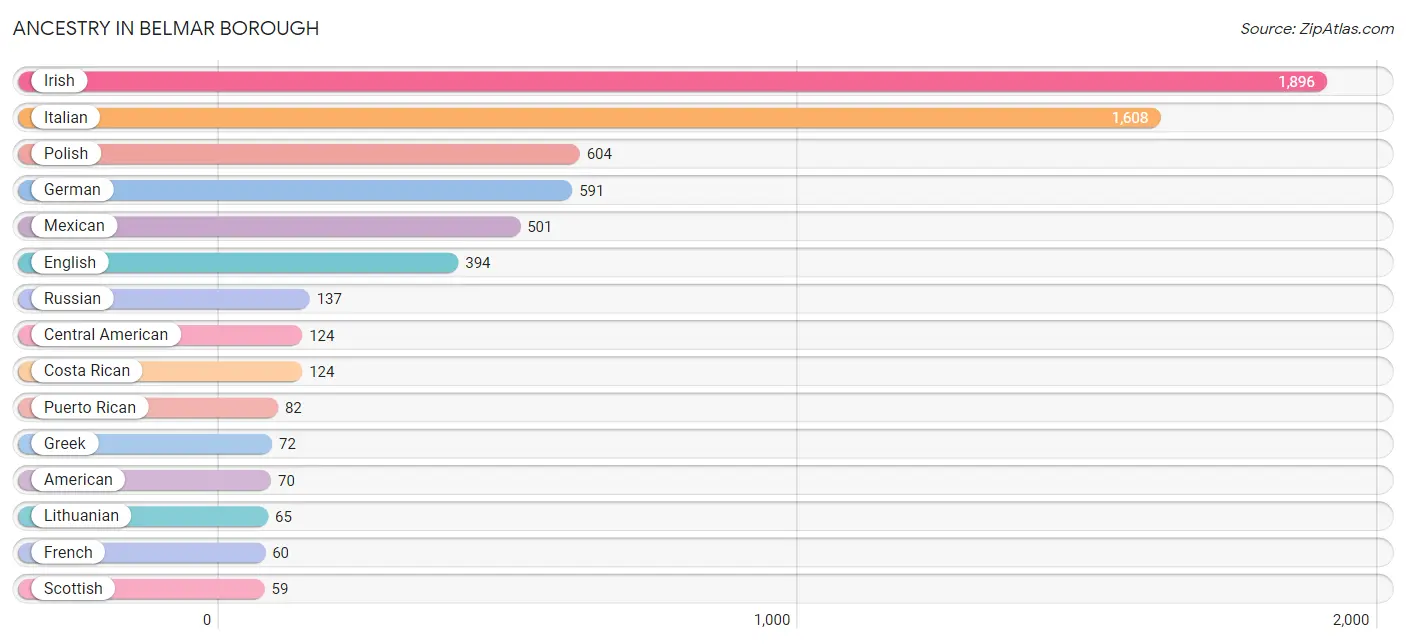
Ancestry in Belmar borough
The most populous ancestries reported in Belmar borough are Irish (1,896 | 32.3%), Italian (1,608 | 27.4%), Polish (604 | 10.3%), German (591 | 10.1%), and Mexican (501 | 8.5%), together accounting for 88.5% of all Belmar borough residents.
| Ancestry | # Population | % Population |
| American | 70 | 1.2% |
| Arab | 10 | 0.2% |
| Argentinean | 15 | 0.3% |
| Armenian | 32 | 0.5% |
| Austrian | 6 | 0.1% |
| Belgian | 51 | 0.9% |
| Bulgarian | 5 | 0.1% |
| Central American | 124 | 2.1% |
| Costa Rican | 124 | 2.1% |
| Croatian | 6 | 0.1% |
| Cuban | 24 | 0.4% |
| Czech | 53 | 0.9% |
| Dominican | 1 | 0.0% |
| Dutch | 10 | 0.2% |
| Eastern European | 24 | 0.4% |
| English | 394 | 6.7% |
| European | 55 | 0.9% |
| French | 60 | 1.0% |
| French Canadian | 17 | 0.3% |
| German | 591 | 10.1% |
| Ghanaian | 10 | 0.2% |
| Greek | 72 | 1.2% |
| Hungarian | 58 | 1.0% |
| Indian (Asian) | 33 | 0.6% |
| Irish | 1,896 | 32.3% |
| Italian | 1,608 | 27.4% |
| Jamaican | 1 | 0.0% |
| Korean | 6 | 0.1% |
| Lithuanian | 65 | 1.1% |
| Mexican | 501 | 8.5% |
| Norwegian | 9 | 0.2% |
| Polish | 604 | 10.3% |
| Portuguese | 32 | 0.5% |
| Puerto Rican | 82 | 1.4% |
| Romanian | 8 | 0.1% |
| Russian | 137 | 2.3% |
| Scotch-Irish | 19 | 0.3% |
| Scottish | 59 | 1.0% |
| Slavic | 44 | 0.7% |
| Slovak | 7 | 0.1% |
| South American | 15 | 0.3% |
| Spaniard | 16 | 0.3% |
| Spanish | 58 | 1.0% |
| Subsaharan African | 10 | 0.2% |
| Swedish | 27 | 0.5% |
| Swiss | 9 | 0.2% |
| Ukrainian | 15 | 0.3% |
| Welsh | 11 | 0.2% |
| West Indian | 9 | 0.2% | View All 49 Rows |
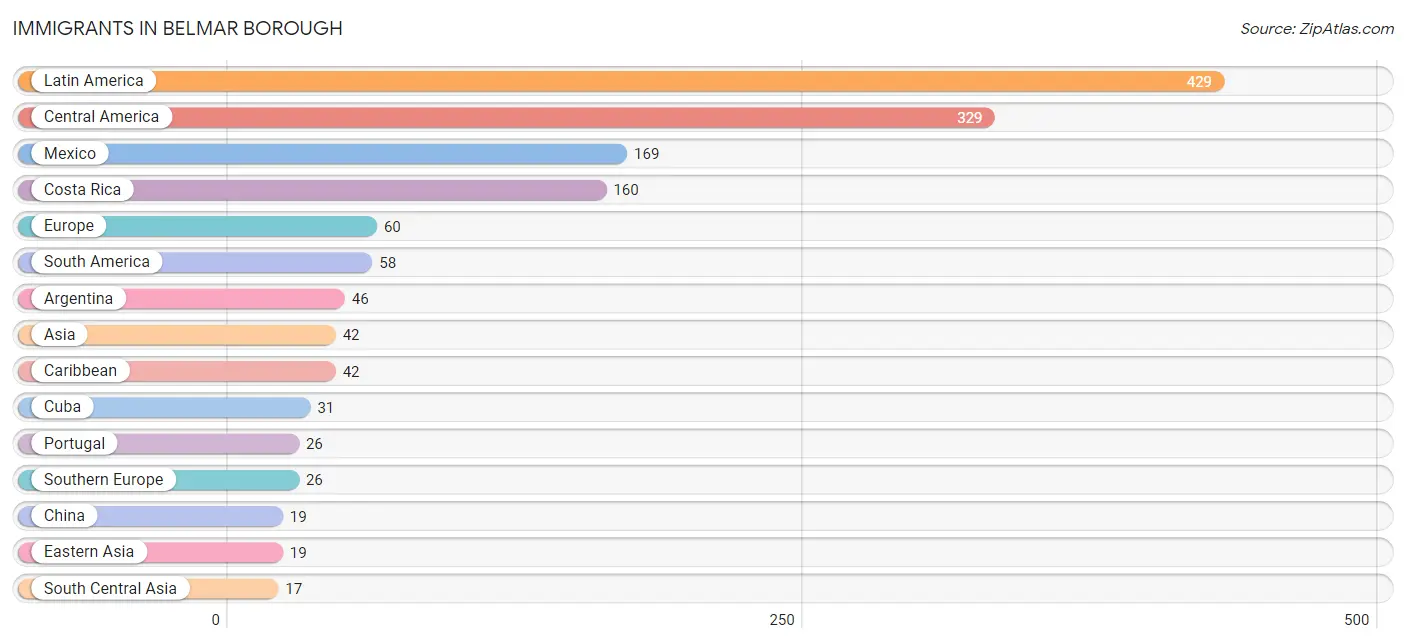
Immigrants in Belmar borough
The most numerous immigrant groups reported in Belmar borough came from Latin America (429 | 7.3%), Central America (329 | 5.6%), Mexico (169 | 2.9%), Costa Rica (160 | 2.7%), and Europe (60 | 1.0%), together accounting for 19.5% of all Belmar borough residents.
| Immigration Origin | # Population | % Population |
| Africa | 16 | 0.3% |
| Argentina | 46 | 0.8% |
| Asia | 42 | 0.7% |
| Brazil | 12 | 0.2% |
| Bulgaria | 5 | 0.1% |
| Caribbean | 42 | 0.7% |
| Central America | 329 | 5.6% |
| China | 19 | 0.3% |
| Costa Rica | 160 | 2.7% |
| Cuba | 31 | 0.5% |
| Dominican Republic | 1 | 0.0% |
| Eastern Asia | 19 | 0.3% |
| Eastern Europe | 14 | 0.2% |
| England | 1 | 0.0% |
| Europe | 60 | 1.0% |
| Germany | 9 | 0.2% |
| Ghana | 10 | 0.2% |
| India | 8 | 0.1% |
| Ireland | 10 | 0.2% |
| Jamaica | 1 | 0.0% |
| Latin America | 429 | 7.3% |
| Mexico | 169 | 2.9% |
| Northern Europe | 11 | 0.2% |
| Pakistan | 9 | 0.2% |
| Philippines | 6 | 0.1% |
| Portugal | 26 | 0.4% |
| South Africa | 6 | 0.1% |
| South America | 58 | 1.0% |
| South Central Asia | 17 | 0.3% |
| South Eastern Asia | 6 | 0.1% |
| Southern Europe | 26 | 0.4% |
| Taiwan | 9 | 0.2% |
| Trinidad and Tobago | 9 | 0.2% |
| Western Africa | 10 | 0.2% |
| Western Europe | 9 | 0.2% | View All 35 Rows |
Sex and Age in Belmar borough
Sex and Age in Belmar borough
The most populous age groups in Belmar borough are 30 to 34 Years (420 | 12.1%) for men and 55 to 59 Years (312 | 12.9%) for women.
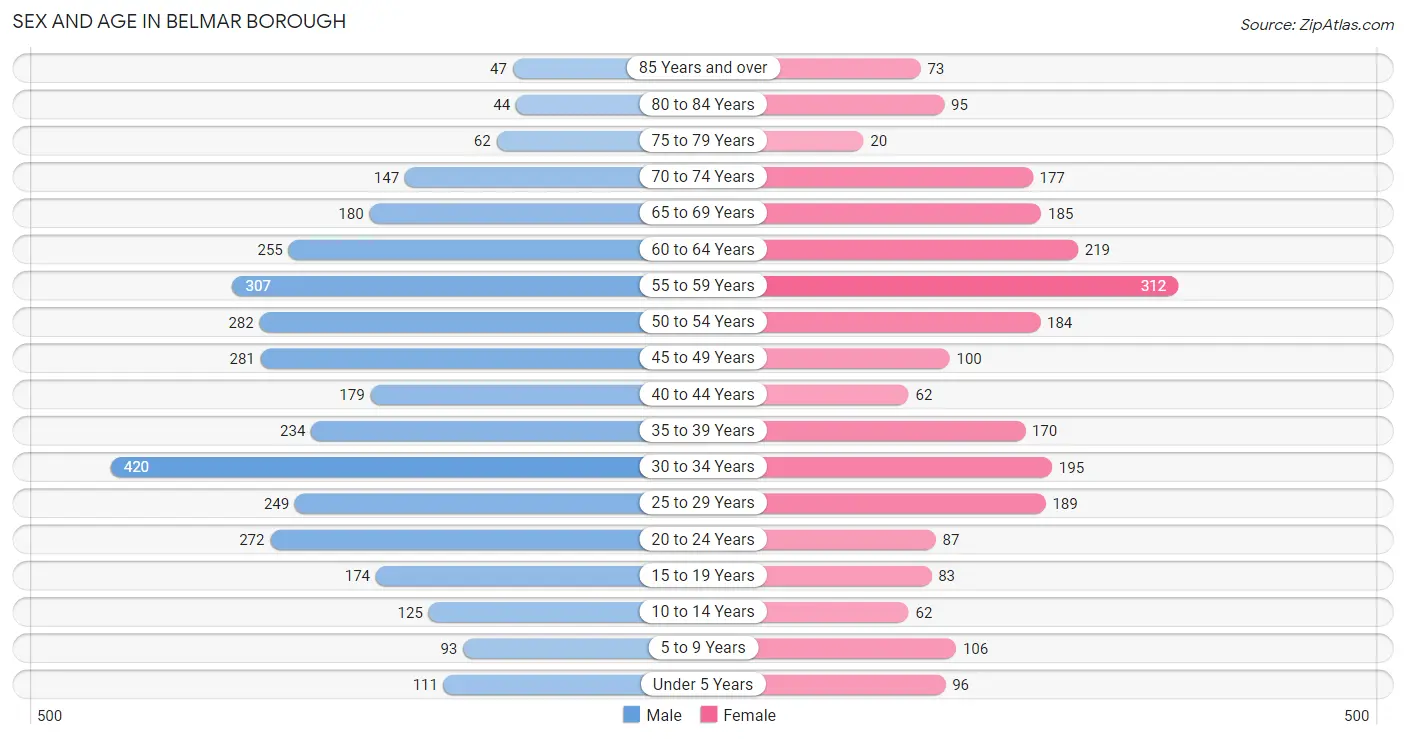
| Age Bracket | Male | Female |
| Under 5 Years | 111 (3.2%) | 96 (4.0%) |
| 5 to 9 Years | 93 (2.7%) | 106 (4.4%) |
| 10 to 14 Years | 125 (3.6%) | 62 (2.6%) |
| 15 to 19 Years | 174 (5.0%) | 83 (3.4%) |
| 20 to 24 Years | 272 (7.9%) | 87 (3.6%) |
| 25 to 29 Years | 249 (7.2%) | 189 (7.8%) |
| 30 to 34 Years | 420 (12.1%) | 195 (8.1%) |
| 35 to 39 Years | 234 (6.8%) | 170 (7.0%) |
| 40 to 44 Years | 179 (5.2%) | 62 (2.6%) |
| 45 to 49 Years | 281 (8.1%) | 100 (4.1%) |
| 50 to 54 Years | 282 (8.2%) | 184 (7.6%) |
| 55 to 59 Years | 307 (8.9%) | 312 (12.9%) |
| 60 to 64 Years | 255 (7.4%) | 219 (9.1%) |
| 65 to 69 Years | 180 (5.2%) | 185 (7.7%) |
| 70 to 74 Years | 147 (4.3%) | 177 (7.3%) |
| 75 to 79 Years | 62 (1.8%) | 20 (0.8%) |
| 80 to 84 Years | 44 (1.3%) | 95 (3.9%) |
| 85 Years and over | 47 (1.4%) | 73 (3.0%) |
| Total | 3,462 (100.0%) | 2,415 (100.0%) |
Families and Households in Belmar borough
Median Family Size in Belmar borough
The median family size in Belmar borough is 3.12 persons per family, with single female/mother families (194 | 15.4%) accounting for the largest median family size of 3.72 persons per family. On the other hand, single male/father families (218 | 17.3%) represent the smallest median family size with 2.38 persons per family.
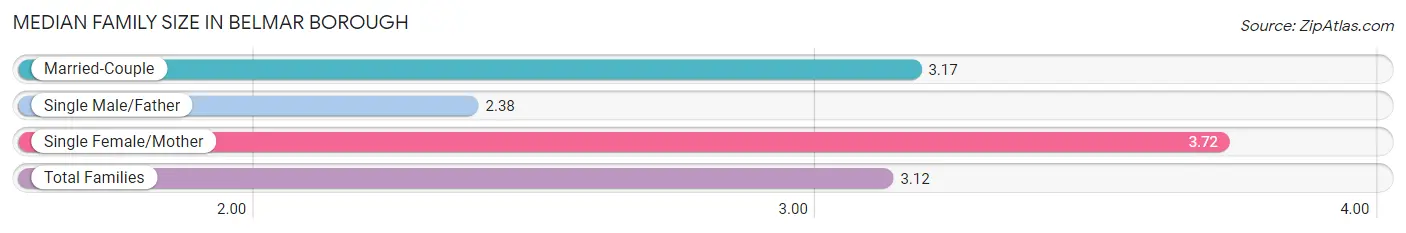
| Family Type | # Families | Family Size |
| Married-Couple | 848 (67.3%) | 3.17 |
| Single Male/Father | 218 (17.3%) | 2.38 |
| Single Female/Mother | 194 (15.4%) | 3.72 |
| Total Families | 1,260 (100.0%) | 3.12 |
Median Household Size in Belmar borough
The median household size in Belmar borough is 2.17 persons per household, with single female/mother households (194 | 7.2%) accounting for the largest median household size of 3.97 persons per household. non-family households (1,439 | 53.3%) represent the smallest median household size with 1.28 persons per household.
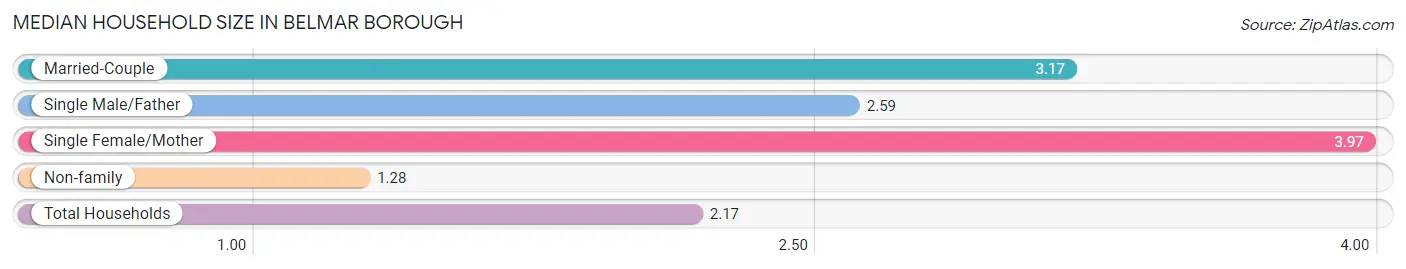
| Household Type | # Households | Household Size |
| Married-Couple | 848 (31.4%) | 3.17 |
| Single Male/Father | 218 (8.1%) | 2.59 |
| Single Female/Mother | 194 (7.2%) | 3.97 |
| Non-family | 1,439 (53.3%) | 1.28 |
| Total Households | 2,699 (100.0%) | 2.17 |
Household Size by Marriage Status in Belmar borough
Out of a total of 2,699 households in Belmar borough, 1,260 (46.7%) are family households, while 1,439 (53.3%) are nonfamily households. The most numerous type of family households are 2-person households, comprising 530, and the most common type of nonfamily households are 1-person households, comprising 1,194.
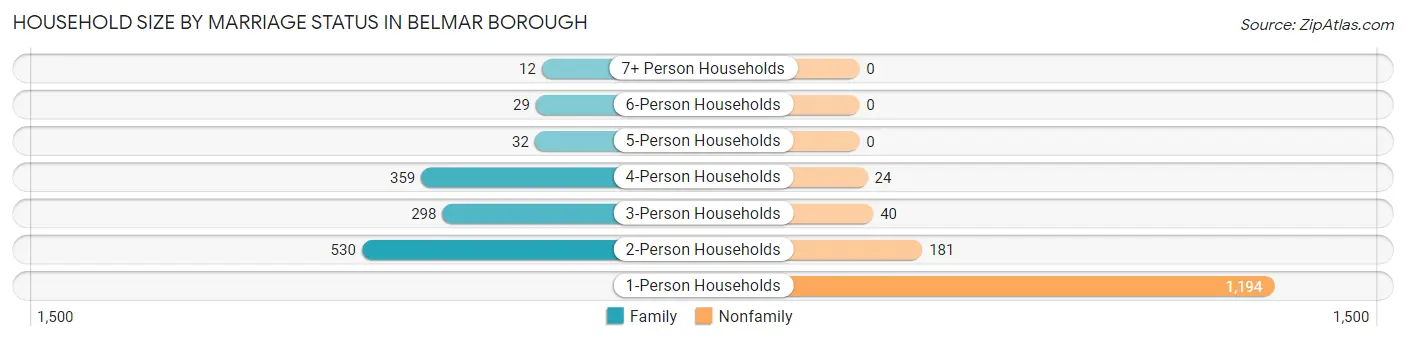
| Household Size | Family Households | Nonfamily Households |
| 1-Person Households | - | 1,194 (44.2%) |
| 2-Person Households | 530 (19.6%) | 181 (6.7%) |
| 3-Person Households | 298 (11.0%) | 40 (1.5%) |
| 4-Person Households | 359 (13.3%) | 24 (0.9%) |
| 5-Person Households | 32 (1.2%) | 0 (0.0%) |
| 6-Person Households | 29 (1.1%) | 0 (0.0%) |
| 7+ Person Households | 12 (0.4%) | 0 (0.0%) |
| Total | 1,260 (46.7%) | 1,439 (53.3%) |
Female Fertility in Belmar borough
Fertility by Age in Belmar borough
| Age Bracket | Women with Births | Births / 1,000 Women |
| 15 to 19 years | 0 (0.0%) | 0.0 |
| 20 to 34 years | 0 (0.0%) | 0.0 |
| 35 to 50 years | 0 (0.0%) | 0.0 |
| Total | 0 (0.0%) | 0.0 |
Fertility by Age by Marriage Status in Belmar borough
| Age Bracket | Married | Unmarried |
| 15 to 19 years | 0 (0.0%) | 0 (0.0%) |
| 20 to 34 years | 0 (0.0%) | 0 (0.0%) |
| 35 to 50 years | 0 (0.0%) | 0 (0.0%) |
| Total | 0 (0.0%) | 0 (0.0%) |
Fertility by Education in Belmar borough
| Educational Attainment | Women with Births | Births / 1,000 Women |
| Less than High School | 0 (0.0%) | 0.0 |
| High School Diploma | 0 (0.0%) | 0.0 |
| College or Associate's Degree | 0 (0.0%) | 0.0 |
| Bachelor's Degree | 0 (0.0%) | 0.0 |
| Graduate Degree | 0 (0.0%) | 0.0 |
| Total | 0 (0.0%) | 0.0 |
Fertility by Education by Marriage Status in Belmar borough
| Educational Attainment | Married | Unmarried |
| Less than High School | 0 (0.0%) | 0 (0.0%) |
| High School Diploma | 0 (0.0%) | 0 (0.0%) |
| College or Associate's Degree | 0 (0.0%) | 0 (0.0%) |
| Bachelor's Degree | 0 (0.0%) | 0 (0.0%) |
| Graduate Degree | 0 (0.0%) | 0 (0.0%) |
| Total | 0 (0.0%) | 0 (0.0%) |
Employment Characteristics in Belmar borough
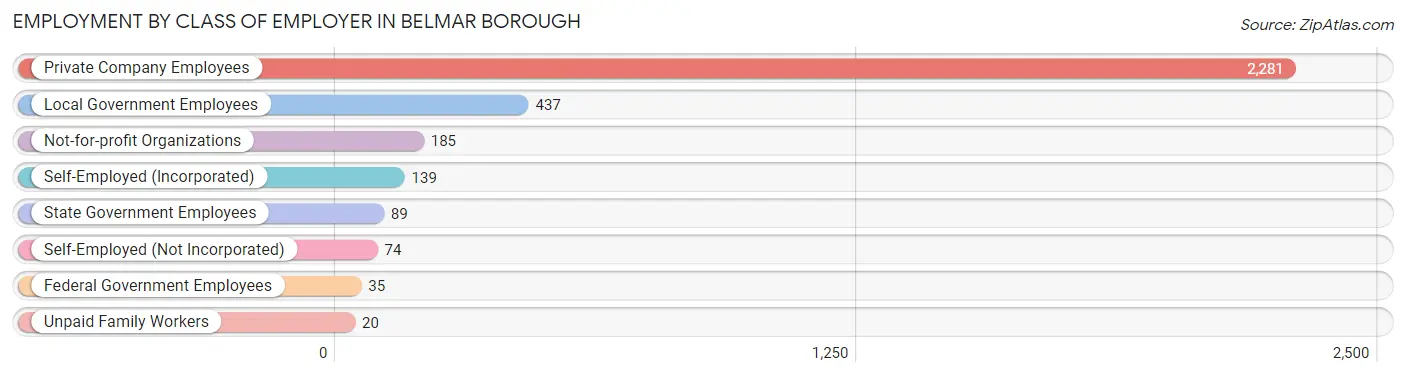
Employment by Class of Employer in Belmar borough
Among the 3,260 employed individuals in Belmar borough, private company employees (2,281 | 70.0%), local government employees (437 | 13.4%), and not-for-profit organizations (185 | 5.7%) make up the most common classes of employment.
| Employer Class | # Employees | % Employees |
| Private Company Employees | 2,281 | 70.0% |
| Self-Employed (Incorporated) | 139 | 4.3% |
| Self-Employed (Not Incorporated) | 74 | 2.3% |
| Not-for-profit Organizations | 185 | 5.7% |
| Local Government Employees | 437 | 13.4% |
| State Government Employees | 89 | 2.7% |
| Federal Government Employees | 35 | 1.1% |
| Unpaid Family Workers | 20 | 0.6% |
| Total | 3,260 | 100.0% |
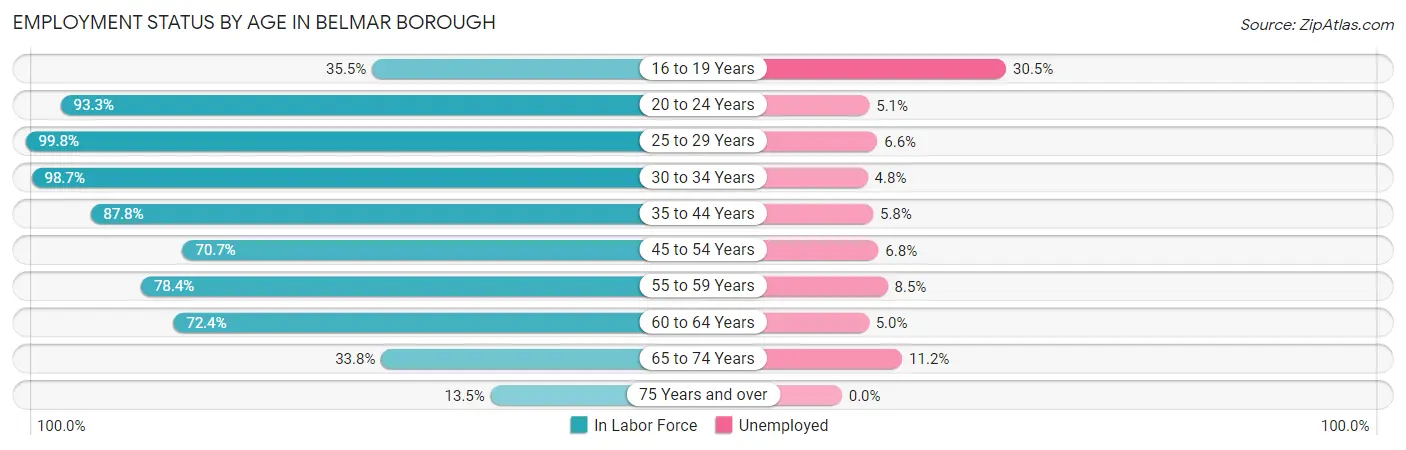
Employment Status by Age in Belmar borough
According to the labor force statistics for Belmar borough, out of the total population over 16 years of age (5,193), 71.4% or 3,708 individuals are in the labor force, with 6.8% or 252 of them unemployed. The age group with the highest labor force participation rate is 25 to 29 years, with 99.8% or 437 individuals in the labor force. Within the labor force, the 16 to 19 years age range has the highest percentage of unemployed individuals, with 30.5% or 18 of them being unemployed.
| Age Bracket | In Labor Force | Unemployed |
| 16 to 19 Years | 59 (35.5%) | 18 (30.5%) |
| 20 to 24 Years | 335 (93.3%) | 17 (5.1%) |
| 25 to 29 Years | 437 (99.8%) | 29 (6.6%) |
| 30 to 34 Years | 607 (98.7%) | 29 (4.8%) |
| 35 to 44 Years | 566 (87.8%) | 33 (5.8%) |
| 45 to 54 Years | 599 (70.7%) | 41 (6.8%) |
| 55 to 59 Years | 485 (78.4%) | 41 (8.5%) |
| 60 to 64 Years | 343 (72.4%) | 17 (5.0%) |
| 65 to 74 Years | 233 (33.8%) | 26 (11.2%) |
| 75 Years and over | 46 (13.5%) | 0 (0.0%) |
| Total | 3,708 (71.4%) | 252 (6.8%) |
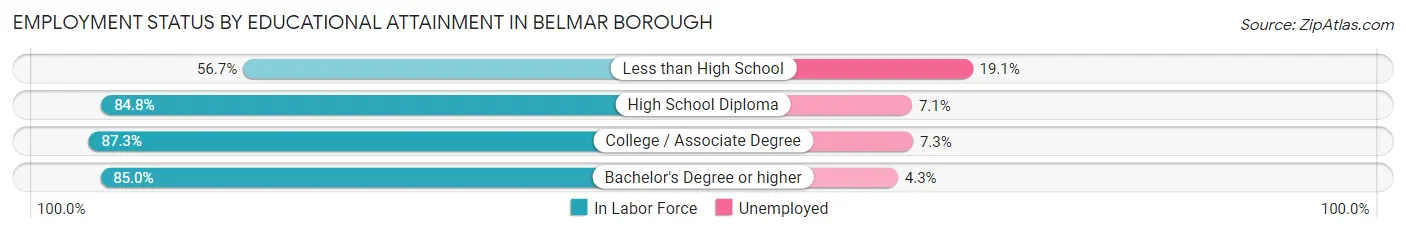
Employment Status by Educational Attainment in Belmar borough
According to labor force statistics for Belmar borough, 83.5% of individuals (3,038) out of the total population between 25 and 64 years of age (3,638) are in the labor force, with 6.3% or 191 of them being unemployed. The group with the highest labor force participation rate are those with the educational attainment of college / associate degree, with 87.3% or 820 individuals in the labor force. Within the labor force, individuals with less than high school education have the highest percentage of unemployment, with 19.1% or 29 of them being unemployed.
| Educational Attainment | In Labor Force | Unemployed |
| Less than High School | 152 (56.7%) | 51 (19.1%) |
| High School Diploma | 467 (84.8%) | 39 (7.1%) |
| College / Associate Degree | 820 (87.3%) | 69 (7.3%) |
| Bachelor's Degree or higher | 1,598 (85.0%) | 81 (4.3%) |
| Total | 3,038 (83.5%) | 229 (6.3%) |
Employment Occupations by Sex in Belmar borough
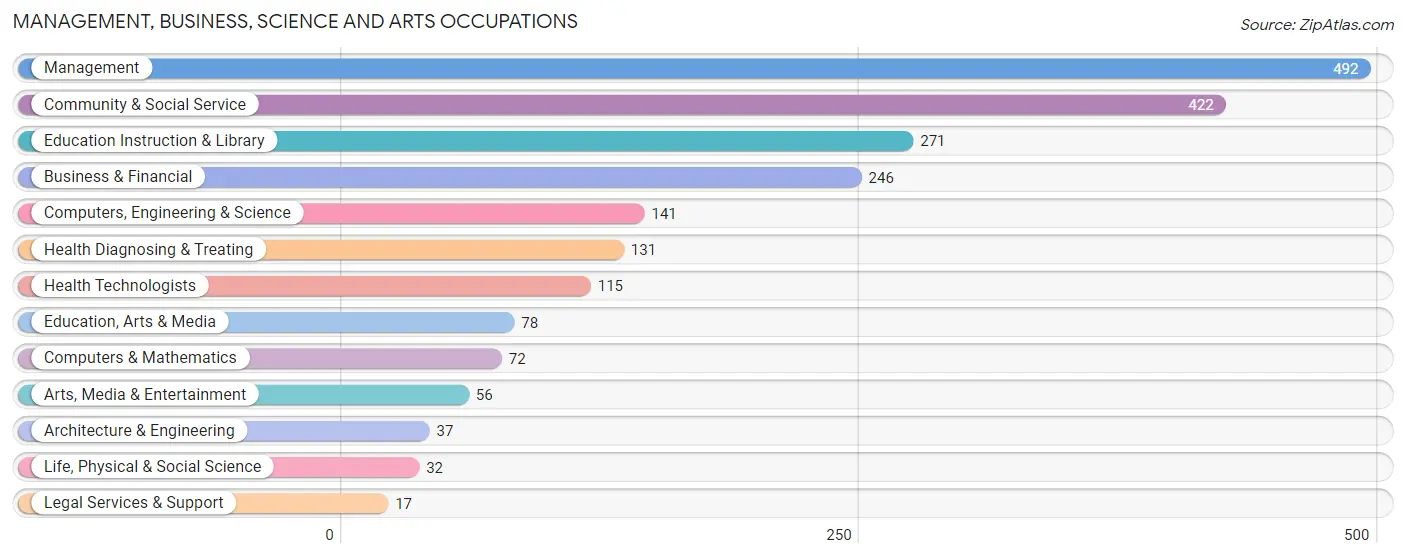
Management, Business, Science and Arts Occupations
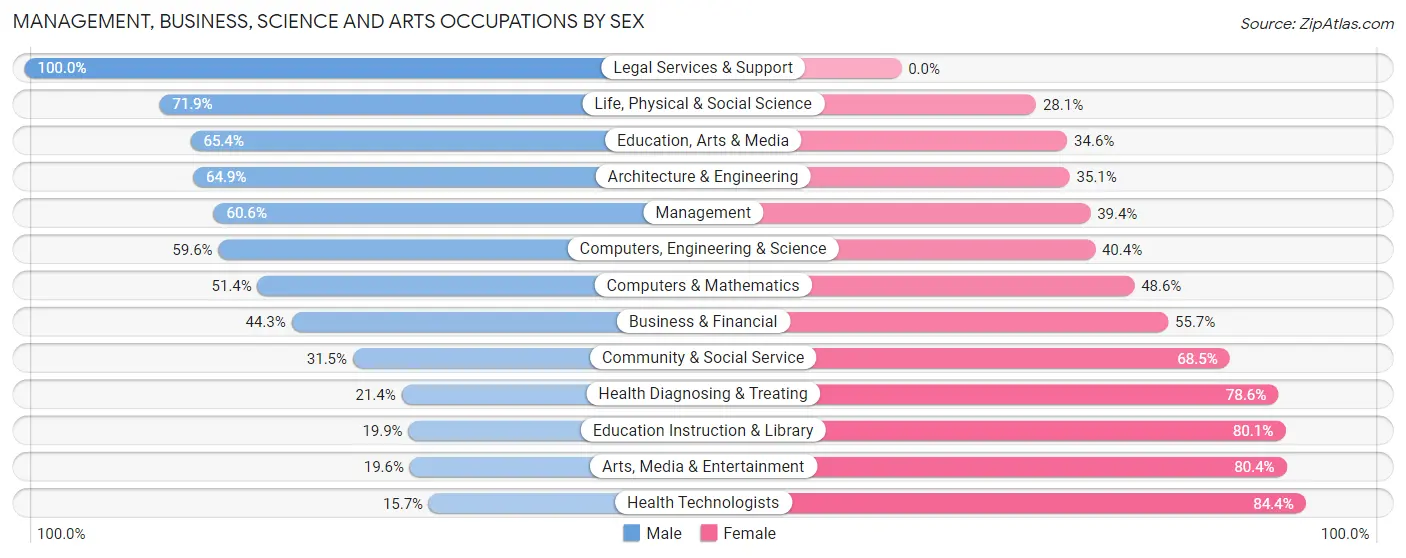
The most common Management, Business, Science and Arts occupations in Belmar borough are Management (492 | 14.2%), Community & Social Service (422 | 12.2%), Education Instruction & Library (271 | 7.8%), Business & Financial (246 | 7.1%), and Computers, Engineering & Science (141 | 4.1%).
Management, Business, Science and Arts Occupations by Sex
Within the Management, Business, Science and Arts occupations in Belmar borough, the most male-oriented occupations are Legal Services & Support (100.0%), Life, Physical & Social Science (71.9%), and Education, Arts & Media (65.4%), while the most female-oriented occupations are Health Technologists (84.4%), Arts, Media & Entertainment (80.4%), and Education Instruction & Library (80.1%).
| Occupation | Male | Female |
| Management | 298 (60.6%) | 194 (39.4%) |
| Business & Financial | 109 (44.3%) | 137 (55.7%) |
| Computers, Engineering & Science | 84 (59.6%) | 57 (40.4%) |
| Computers & Mathematics | 37 (51.4%) | 35 (48.6%) |
| Architecture & Engineering | 24 (64.9%) | 13 (35.1%) |
| Life, Physical & Social Science | 23 (71.9%) | 9 (28.1%) |
| Community & Social Service | 133 (31.5%) | 289 (68.5%) |
| Education, Arts & Media | 51 (65.4%) | 27 (34.6%) |
| Legal Services & Support | 17 (100.0%) | 0 (0.0%) |
| Education Instruction & Library | 54 (19.9%) | 217 (80.1%) |
| Arts, Media & Entertainment | 11 (19.6%) | 45 (80.4%) |
| Health Diagnosing & Treating | 28 (21.4%) | 103 (78.6%) |
| Health Technologists | 18 (15.7%) | 97 (84.4%) |
| Total (Category) | 652 (45.5%) | 780 (54.5%) |
| Total (Overall) | 2,096 (60.6%) | 1,363 (39.4%) |
Services Occupations
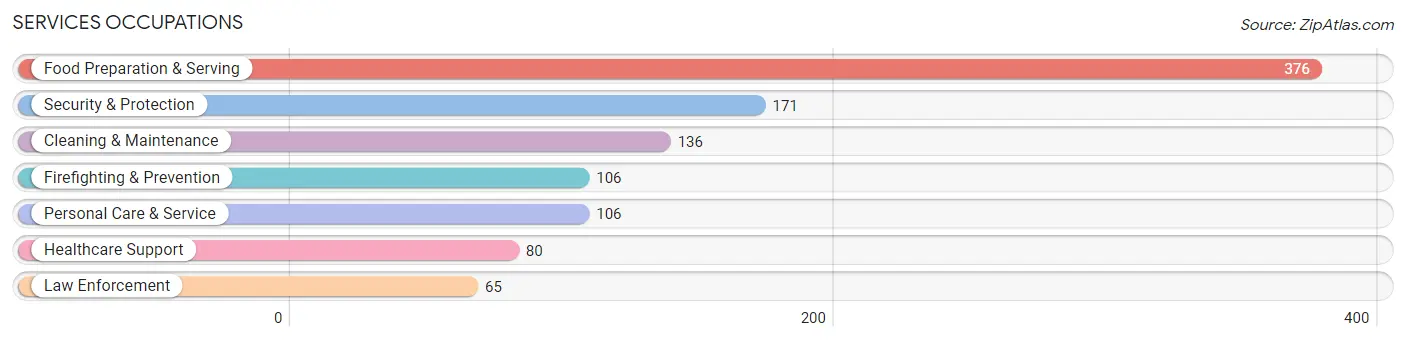
The most common Services occupations in Belmar borough are Food Preparation & Serving (376 | 10.9%), Security & Protection (171 | 4.9%), Cleaning & Maintenance (136 | 3.9%), Firefighting & Prevention (106 | 3.1%), and Personal Care & Service (106 | 3.1%).
Services Occupations by Sex
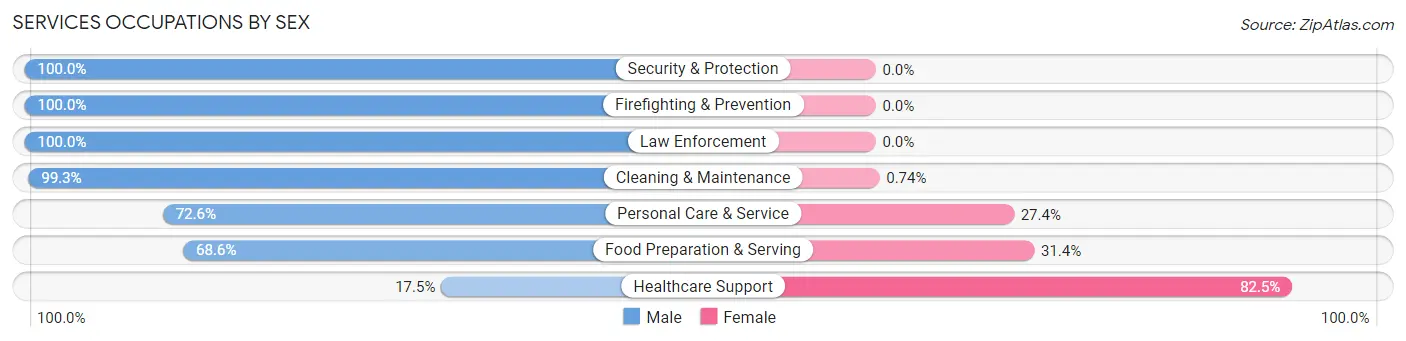
Within the Services occupations in Belmar borough, the most male-oriented occupations are Security & Protection (100.0%), Firefighting & Prevention (100.0%), and Law Enforcement (100.0%), while the most female-oriented occupations are Healthcare Support (82.5%), Food Preparation & Serving (31.4%), and Personal Care & Service (27.4%).
| Occupation | Male | Female |
| Healthcare Support | 14 (17.5%) | 66 (82.5%) |
| Security & Protection | 171 (100.0%) | 0 (0.0%) |
| Firefighting & Prevention | 106 (100.0%) | 0 (0.0%) |
| Law Enforcement | 65 (100.0%) | 0 (0.0%) |
| Food Preparation & Serving | 258 (68.6%) | 118 (31.4%) |
| Cleaning & Maintenance | 135 (99.3%) | 1 (0.7%) |
| Personal Care & Service | 77 (72.6%) | 29 (27.4%) |
| Total (Category) | 655 (75.4%) | 214 (24.6%) |
| Total (Overall) | 2,096 (60.6%) | 1,363 (39.4%) |
Sales and Office Occupations
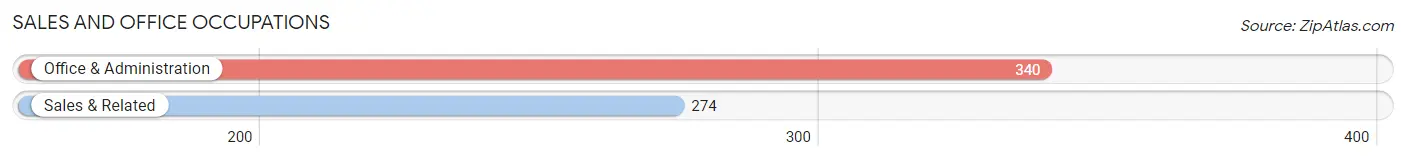
The most common Sales and Office occupations in Belmar borough are Office & Administration (340 | 9.8%), and Sales & Related (274 | 7.9%).
Sales and Office Occupations by Sex

| Occupation | Male | Female |
| Sales & Related | 98 (35.8%) | 176 (64.2%) |
| Office & Administration | 210 (61.8%) | 130 (38.2%) |
| Total (Category) | 308 (50.2%) | 306 (49.8%) |
| Total (Overall) | 2,096 (60.6%) | 1,363 (39.4%) |
Natural Resources, Construction and Maintenance Occupations
The most common Natural Resources, Construction and Maintenance occupations in Belmar borough are Construction & Extraction (164 | 4.7%), and Installation, Maintenance & Repair (79 | 2.3%).
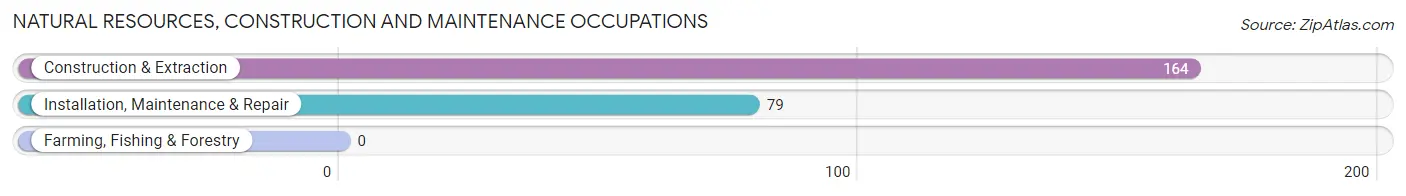
Natural Resources, Construction and Maintenance Occupations by Sex

| Occupation | Male | Female |
| Farming, Fishing & Forestry | 0 (0.0%) | 0 (0.0%) |
| Construction & Extraction | 164 (100.0%) | 0 (0.0%) |
| Installation, Maintenance & Repair | 79 (100.0%) | 0 (0.0%) |
| Total (Category) | 243 (100.0%) | 0 (0.0%) |
| Total (Overall) | 2,096 (60.6%) | 1,363 (39.4%) |
Production, Transportation and Moving Occupations
The most common Production, Transportation and Moving occupations in Belmar borough are Production (214 | 6.2%), Transportation (47 | 1.4%), and Material Moving (40 | 1.2%).
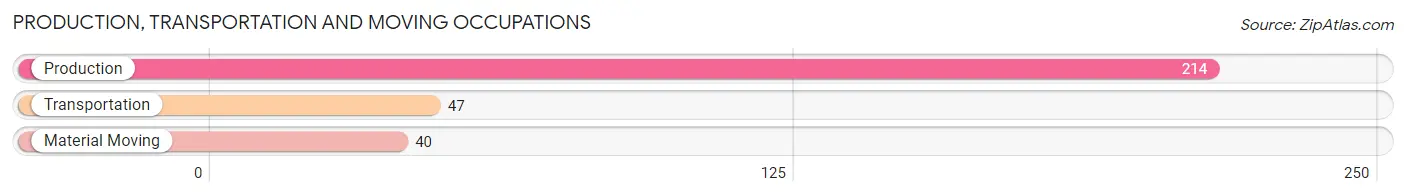
Production, Transportation and Moving Occupations by Sex
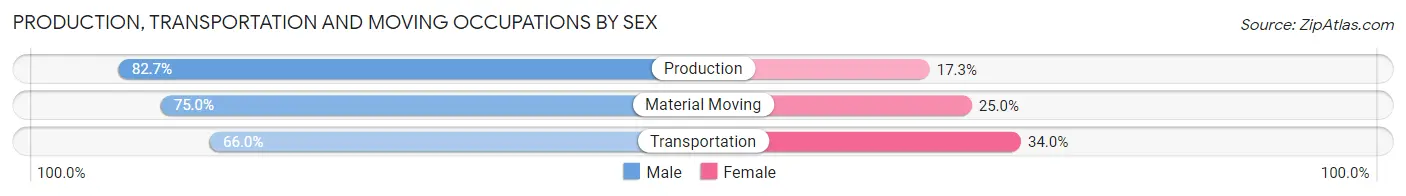
| Occupation | Male | Female |
| Production | 177 (82.7%) | 37 (17.3%) |
| Transportation | 31 (66.0%) | 16 (34.0%) |
| Material Moving | 30 (75.0%) | 10 (25.0%) |
| Total (Category) | 238 (79.1%) | 63 (20.9%) |
| Total (Overall) | 2,096 (60.6%) | 1,363 (39.4%) |
Employment Industries by Sex in Belmar borough
Employment Industries in Belmar borough
The major employment industries in Belmar borough include Educational Services (444 | 12.8%), Accommodation & Food Services (378 | 10.9%), Health Care & Social Assistance (318 | 9.2%), Professional & Scientific (306 | 8.8%), and Transportation & Warehousing (269 | 7.8%).
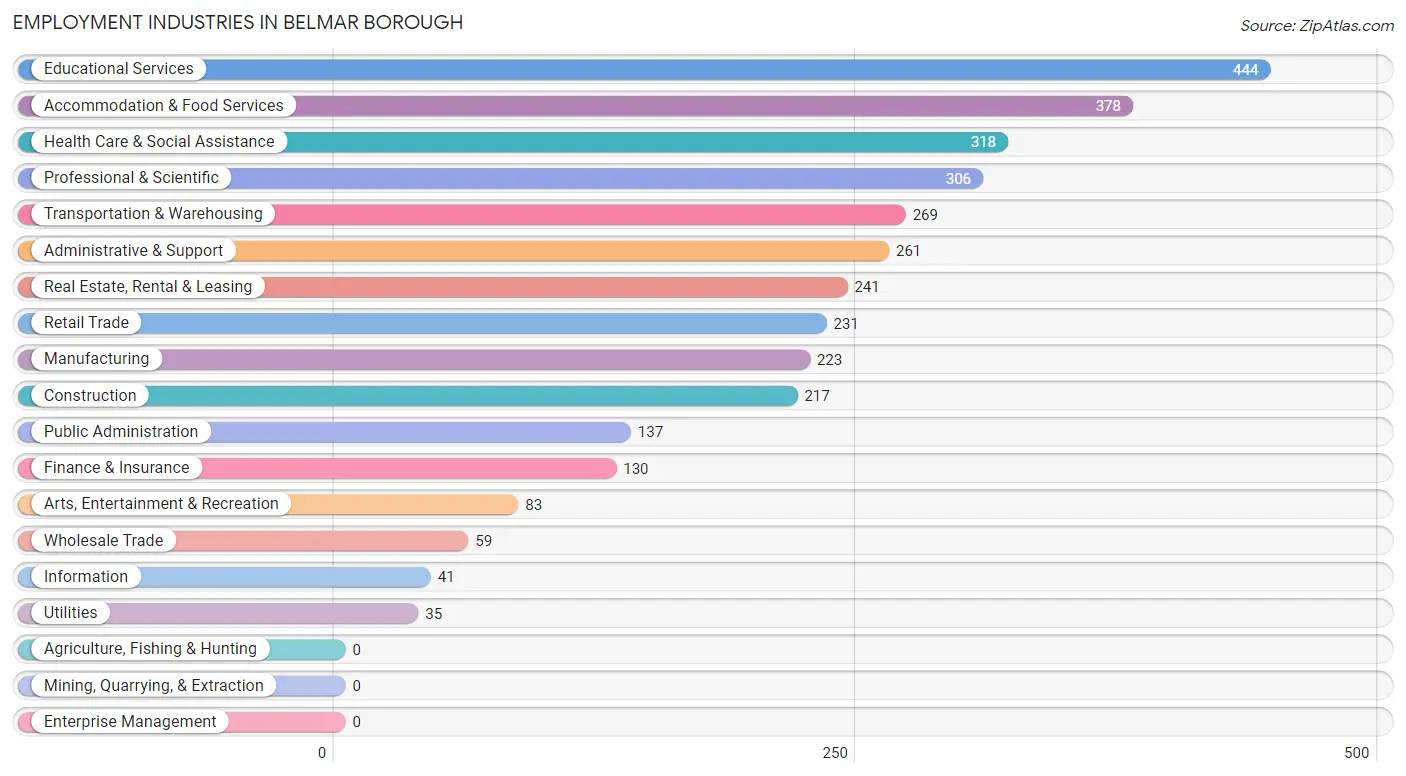
Employment Industries by Sex in Belmar borough
The Belmar borough industries that see more men than women are Construction (100.0%), Utilities (100.0%), and Public Administration (89.8%), whereas the industries that tend to have a higher number of women are Health Care & Social Assistance (79.6%), Information (73.2%), and Real Estate, Rental & Leasing (65.1%).
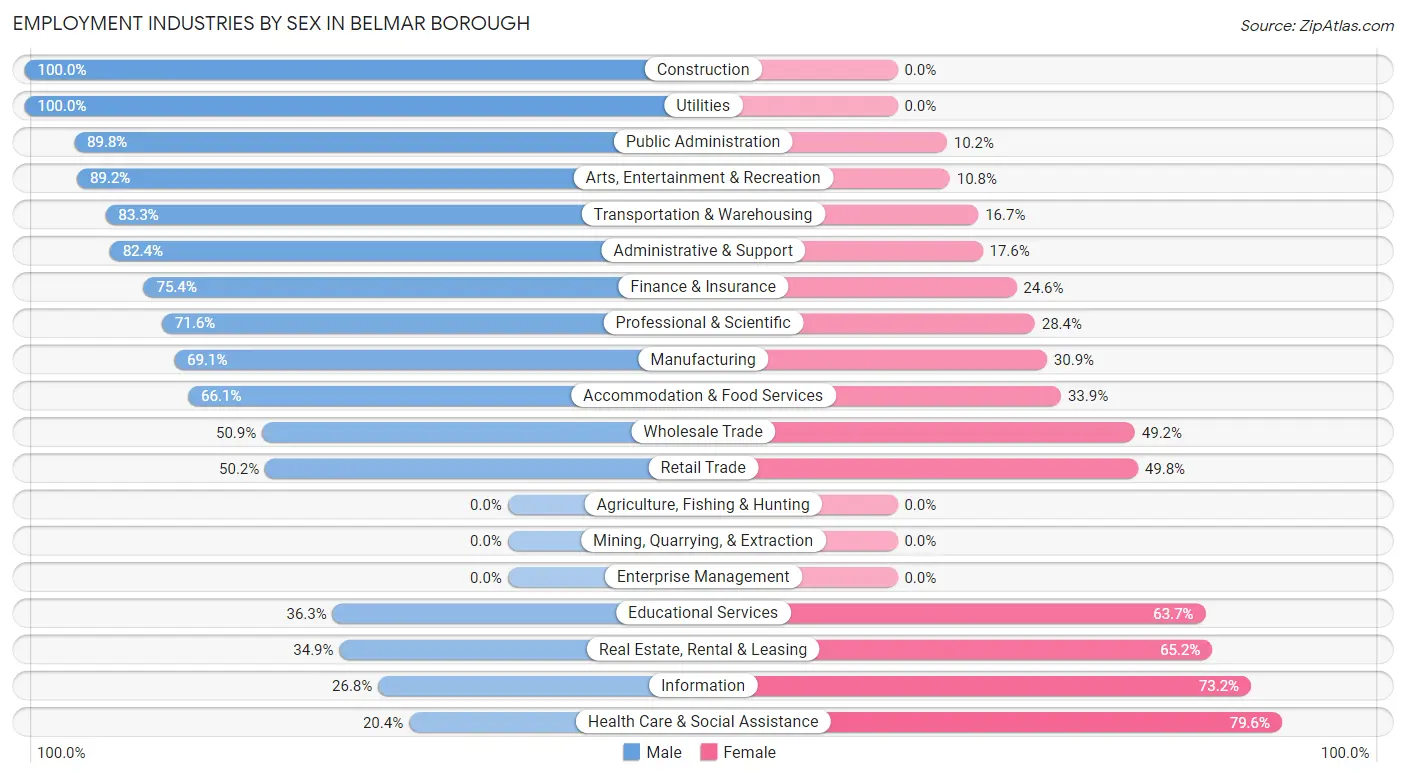
| Industry | Male | Female |
| Agriculture, Fishing & Hunting | 0 (0.0%) | 0 (0.0%) |
| Mining, Quarrying, & Extraction | 0 (0.0%) | 0 (0.0%) |
| Construction | 217 (100.0%) | 0 (0.0%) |
| Manufacturing | 154 (69.1%) | 69 (30.9%) |
| Wholesale Trade | 30 (50.8%) | 29 (49.1%) |
| Retail Trade | 116 (50.2%) | 115 (49.8%) |
| Transportation & Warehousing | 224 (83.3%) | 45 (16.7%) |
| Utilities | 35 (100.0%) | 0 (0.0%) |
| Information | 11 (26.8%) | 30 (73.2%) |
| Finance & Insurance | 98 (75.4%) | 32 (24.6%) |
| Real Estate, Rental & Leasing | 84 (34.8%) | 157 (65.1%) |
| Professional & Scientific | 219 (71.6%) | 87 (28.4%) |
| Enterprise Management | 0 (0.0%) | 0 (0.0%) |
| Administrative & Support | 215 (82.4%) | 46 (17.6%) |
| Educational Services | 161 (36.3%) | 283 (63.7%) |
| Health Care & Social Assistance | 65 (20.4%) | 253 (79.6%) |
| Arts, Entertainment & Recreation | 74 (89.2%) | 9 (10.8%) |
| Accommodation & Food Services | 250 (66.1%) | 128 (33.9%) |
| Public Administration | 123 (89.8%) | 14 (10.2%) |
| Total | 2,096 (60.6%) | 1,363 (39.4%) |
Education in Belmar borough
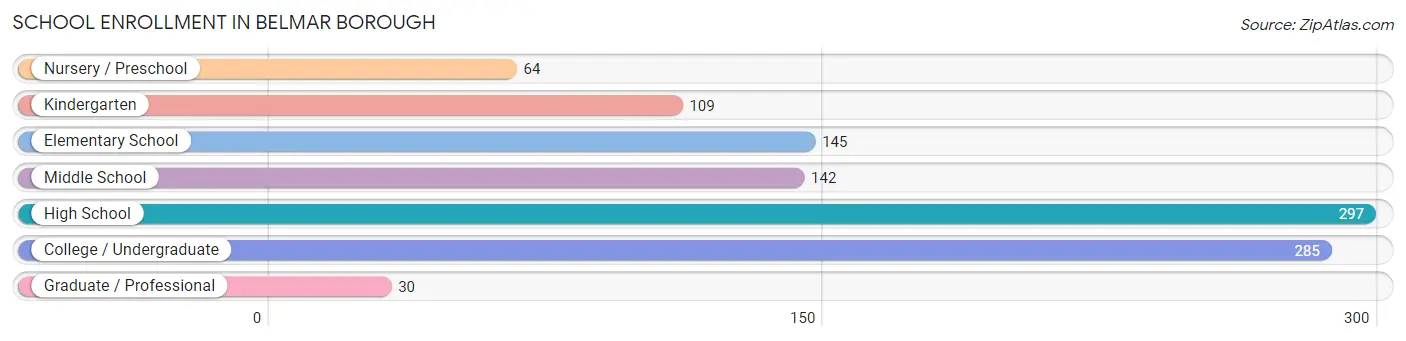
School Enrollment in Belmar borough
The most common levels of schooling among the 1,072 students in Belmar borough are high school (297 | 27.7%), college / undergraduate (285 | 26.6%), and elementary school (145 | 13.5%).
| School Level | # Students | % Students |
| Nursery / Preschool | 64 | 6.0% |
| Kindergarten | 109 | 10.2% |
| Elementary School | 145 | 13.5% |
| Middle School | 142 | 13.3% |
| High School | 297 | 27.7% |
| College / Undergraduate | 285 | 26.6% |
| Graduate / Professional | 30 | 2.8% |
| Total | 1,072 | 100.0% |
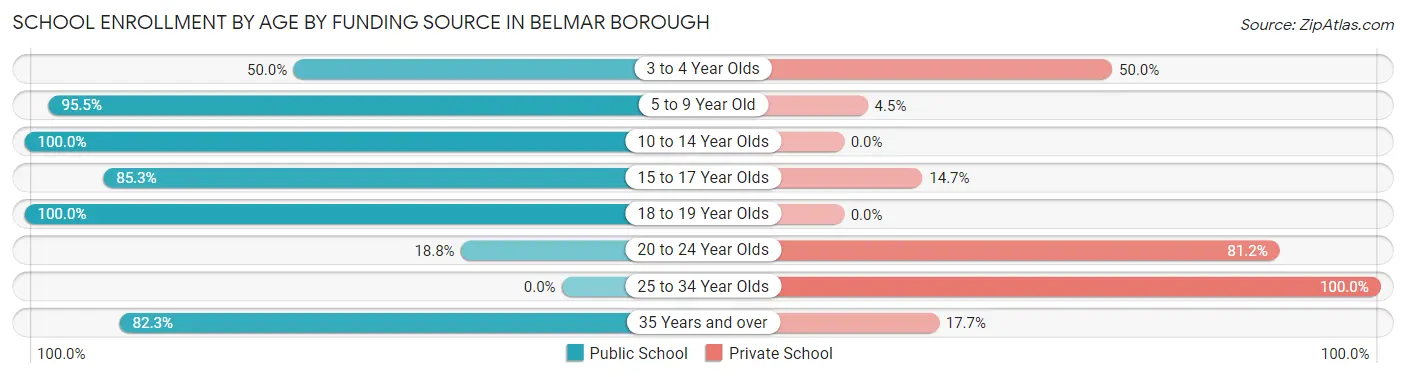
School Enrollment by Age by Funding Source in Belmar borough
Out of a total of 1,072 students who are enrolled in schools in Belmar borough, 351 (32.7%) attend a private institution, while the remaining 721 (67.3%) are enrolled in public schools. The age group of 25 to 34 year olds has the highest likelihood of being enrolled in private schools, with 83 (100.0% in the age bracket) enrolled. Conversely, the age group of 10 to 14 year olds has the lowest likelihood of being enrolled in a private school, with 187 (100.0% in the age bracket) attending a public institution.
| Age Bracket | Public School | Private School |
| 3 to 4 Year Olds | 64 (50.0%) | 64 (50.0%) |
| 5 to 9 Year Old | 171 (95.5%) | 8 (4.5%) |
| 10 to 14 Year Olds | 187 (100.0%) | 0 (0.0%) |
| 15 to 17 Year Olds | 163 (85.3%) | 28 (14.7%) |
| 18 to 19 Year Olds | 22 (100.0%) | 0 (0.0%) |
| 20 to 24 Year Olds | 35 (18.8%) | 151 (81.2%) |
| 25 to 34 Year Olds | 0 (0.0%) | 83 (100.0%) |
| 35 Years and over | 79 (82.3%) | 17 (17.7%) |
| Total | 721 (67.3%) | 351 (32.7%) |
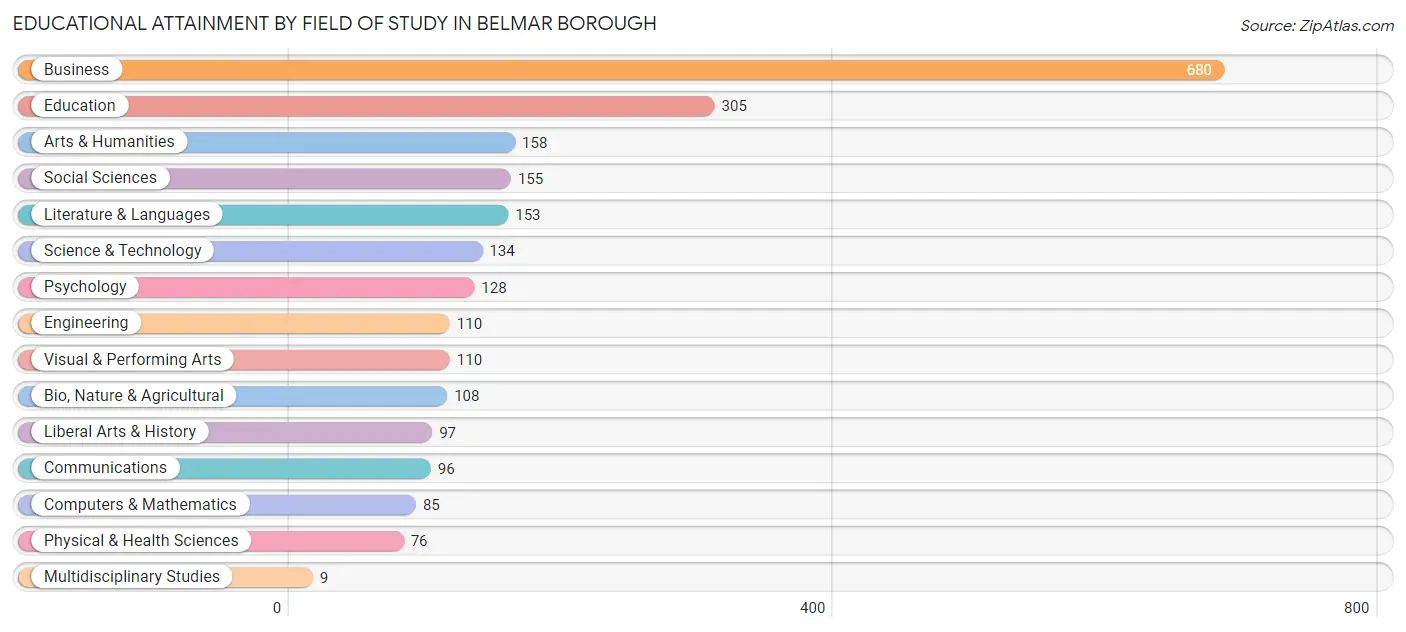
Educational Attainment by Field of Study in Belmar borough
Business (680 | 28.3%), education (305 | 12.7%), arts & humanities (158 | 6.6%), social sciences (155 | 6.5%), and literature & languages (153 | 6.4%) are the most common fields of study among 2,404 individuals in Belmar borough who have obtained a bachelor's degree or higher.
| Field of Study | # Graduates | % Graduates |
| Computers & Mathematics | 85 | 3.5% |
| Bio, Nature & Agricultural | 108 | 4.5% |
| Physical & Health Sciences | 76 | 3.2% |
| Psychology | 128 | 5.3% |
| Social Sciences | 155 | 6.5% |
| Engineering | 110 | 4.6% |
| Multidisciplinary Studies | 9 | 0.4% |
| Science & Technology | 134 | 5.6% |
| Business | 680 | 28.3% |
| Education | 305 | 12.7% |
| Literature & Languages | 153 | 6.4% |
| Liberal Arts & History | 97 | 4.0% |
| Visual & Performing Arts | 110 | 4.6% |
| Communications | 96 | 4.0% |
| Arts & Humanities | 158 | 6.6% |
| Total | 2,404 | 100.0% |
Transportation & Commute in Belmar borough
Vehicle Availability by Sex in Belmar borough
The most prevalent vehicle ownership categories in Belmar borough are males with 2 vehicles (663, accounting for 34.2%) and females with 2 vehicles (392, making up 50.3%).
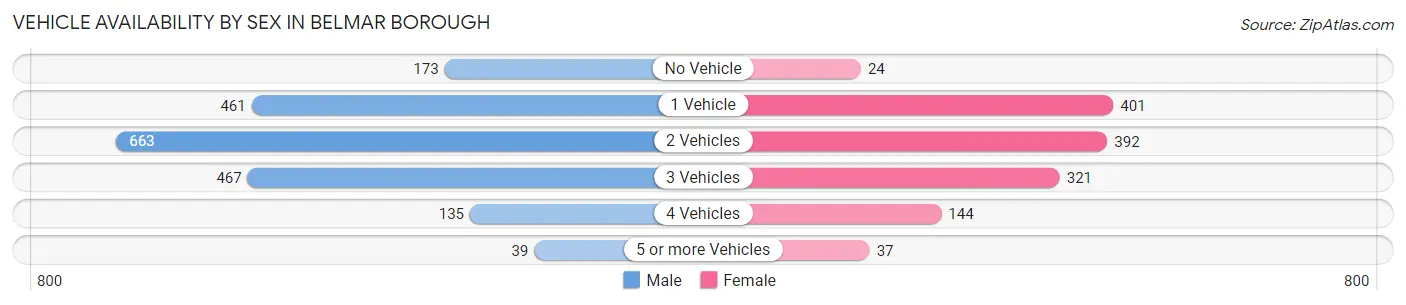
| Vehicles Available | Male | Female |
| No Vehicle | 173 (8.9%) | 24 (1.8%) |
| 1 Vehicle | 461 (23.8%) | 401 (30.4%) |
| 2 Vehicles | 663 (34.2%) | 392 (29.7%) |
| 3 Vehicles | 467 (24.1%) | 321 (24.3%) |
| 4 Vehicles | 135 (7.0%) | 144 (10.9%) |
| 5 or more Vehicles | 39 (2.0%) | 37 (2.8%) |
| Total | 1,938 (100.0%) | 1,319 (100.0%) |
Commute Time in Belmar borough
The most frequently occuring commute durations in Belmar borough are 30 to 34 minutes (641 commuters, 21.7%), 5 to 9 minutes (467 commuters, 15.8%), and 10 to 14 minutes (373 commuters, 12.6%).
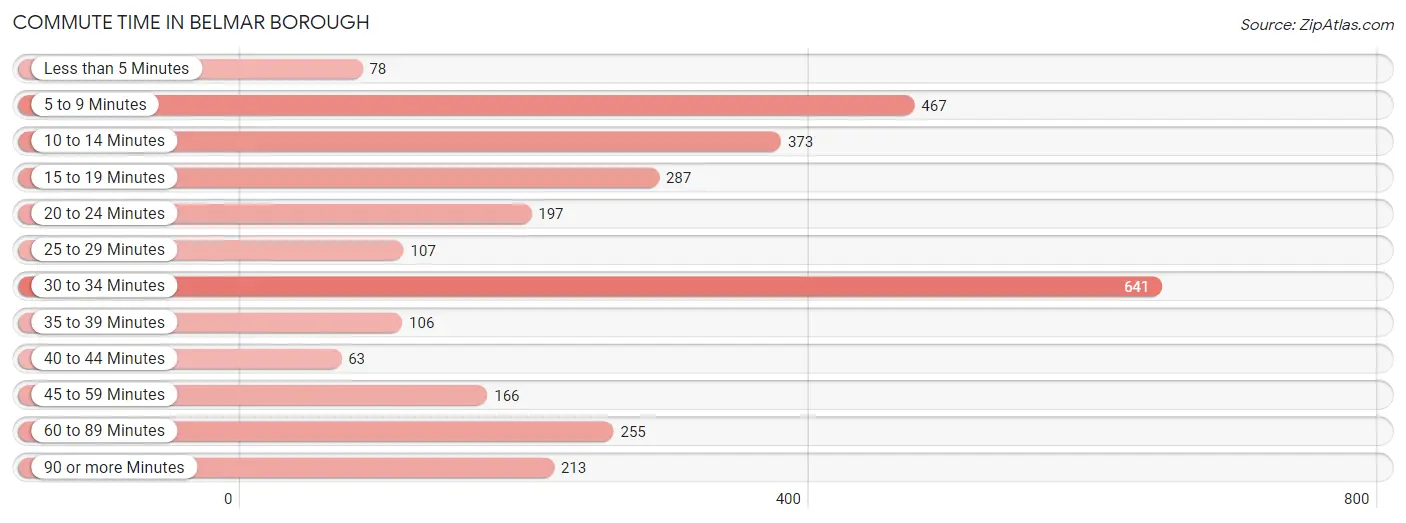
| Commute Time | # Commuters | % Commuters |
| Less than 5 Minutes | 78 | 2.6% |
| 5 to 9 Minutes | 467 | 15.8% |
| 10 to 14 Minutes | 373 | 12.6% |
| 15 to 19 Minutes | 287 | 9.7% |
| 20 to 24 Minutes | 197 | 6.7% |
| 25 to 29 Minutes | 107 | 3.6% |
| 30 to 34 Minutes | 641 | 21.7% |
| 35 to 39 Minutes | 106 | 3.6% |
| 40 to 44 Minutes | 63 | 2.1% |
| 45 to 59 Minutes | 166 | 5.6% |
| 60 to 89 Minutes | 255 | 8.6% |
| 90 or more Minutes | 213 | 7.2% |
Commute Time by Sex in Belmar borough
The most common commute times in Belmar borough are 30 to 34 minutes (433 commuters, 24.4%) for males and 5 to 9 minutes (250 commuters, 21.3%) for females.
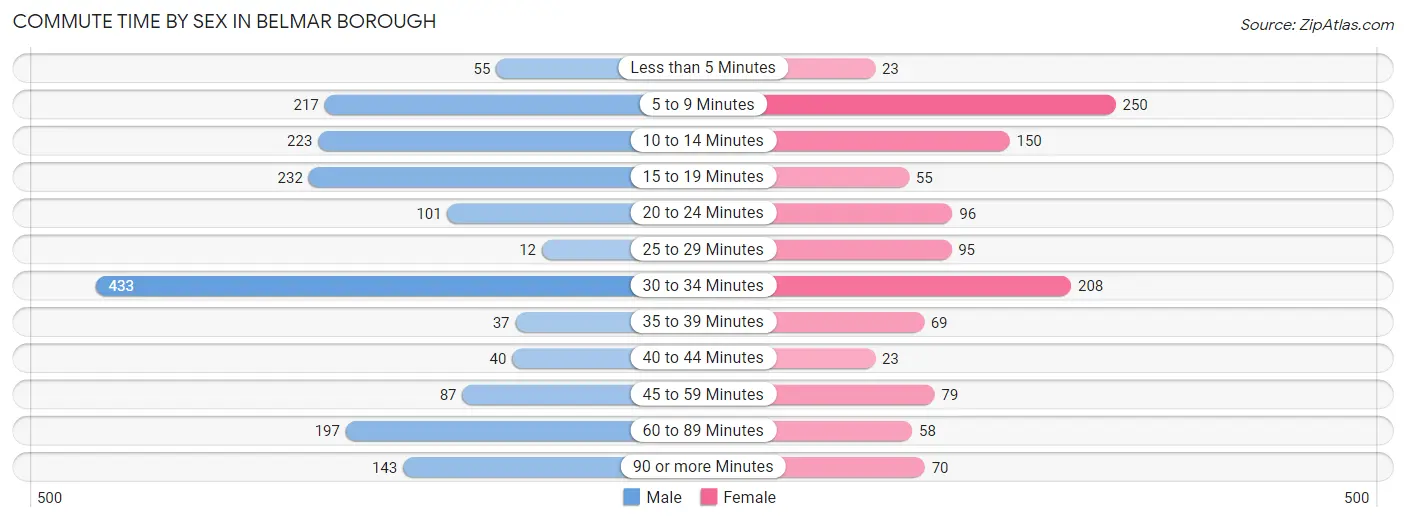
| Commute Time | Male | Female |
| Less than 5 Minutes | 55 (3.1%) | 23 (2.0%) |
| 5 to 9 Minutes | 217 (12.2%) | 250 (21.3%) |
| 10 to 14 Minutes | 223 (12.6%) | 150 (12.8%) |
| 15 to 19 Minutes | 232 (13.1%) | 55 (4.7%) |
| 20 to 24 Minutes | 101 (5.7%) | 96 (8.2%) |
| 25 to 29 Minutes | 12 (0.7%) | 95 (8.1%) |
| 30 to 34 Minutes | 433 (24.4%) | 208 (17.7%) |
| 35 to 39 Minutes | 37 (2.1%) | 69 (5.9%) |
| 40 to 44 Minutes | 40 (2.2%) | 23 (2.0%) |
| 45 to 59 Minutes | 87 (4.9%) | 79 (6.7%) |
| 60 to 89 Minutes | 197 (11.1%) | 58 (4.9%) |
| 90 or more Minutes | 143 (8.1%) | 70 (5.9%) |
Time of Departure to Work by Sex in Belmar borough
The most frequent times of departure to work in Belmar borough are 6:30 AM to 6:59 AM (302, 17.0%) for males and 7:00 AM to 7:29 AM (201, 17.1%) for females.
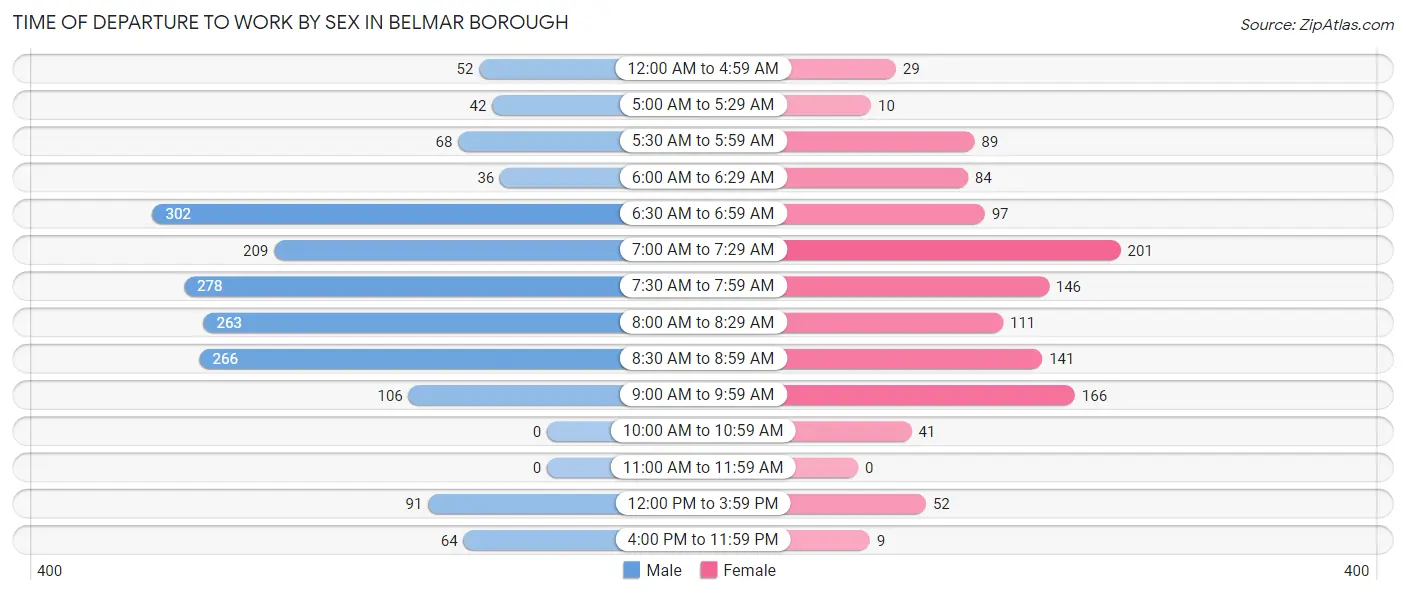
| Time of Departure | Male | Female |
| 12:00 AM to 4:59 AM | 52 (2.9%) | 29 (2.5%) |
| 5:00 AM to 5:29 AM | 42 (2.4%) | 10 (0.9%) |
| 5:30 AM to 5:59 AM | 68 (3.8%) | 89 (7.6%) |
| 6:00 AM to 6:29 AM | 36 (2.0%) | 84 (7.1%) |
| 6:30 AM to 6:59 AM | 302 (17.0%) | 97 (8.3%) |
| 7:00 AM to 7:29 AM | 209 (11.8%) | 201 (17.1%) |
| 7:30 AM to 7:59 AM | 278 (15.6%) | 146 (12.4%) |
| 8:00 AM to 8:29 AM | 263 (14.8%) | 111 (9.4%) |
| 8:30 AM to 8:59 AM | 266 (15.0%) | 141 (12.0%) |
| 9:00 AM to 9:59 AM | 106 (6.0%) | 166 (14.1%) |
| 10:00 AM to 10:59 AM | 0 (0.0%) | 41 (3.5%) |
| 11:00 AM to 11:59 AM | 0 (0.0%) | 0 (0.0%) |
| 12:00 PM to 3:59 PM | 91 (5.1%) | 52 (4.4%) |
| 4:00 PM to 11:59 PM | 64 (3.6%) | 9 (0.8%) |
| Total | 1,777 (100.0%) | 1,176 (100.0%) |
Housing Occupancy in Belmar borough
Occupancy by Ownership in Belmar borough
Of the total 2,699 dwellings in Belmar borough, owner-occupied units account for 1,373 (50.9%), while renter-occupied units make up 1,326 (49.1%).
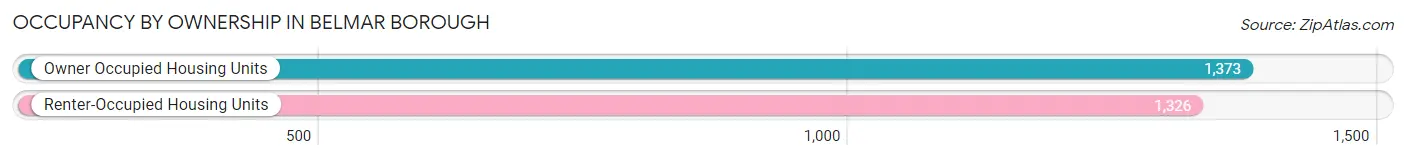
| Occupancy | # Housing Units | % Housing Units |
| Owner Occupied Housing Units | 1,373 | 50.9% |
| Renter-Occupied Housing Units | 1,326 | 49.1% |
| Total Occupied Housing Units | 2,699 | 100.0% |
Occupancy by Household Size in Belmar borough
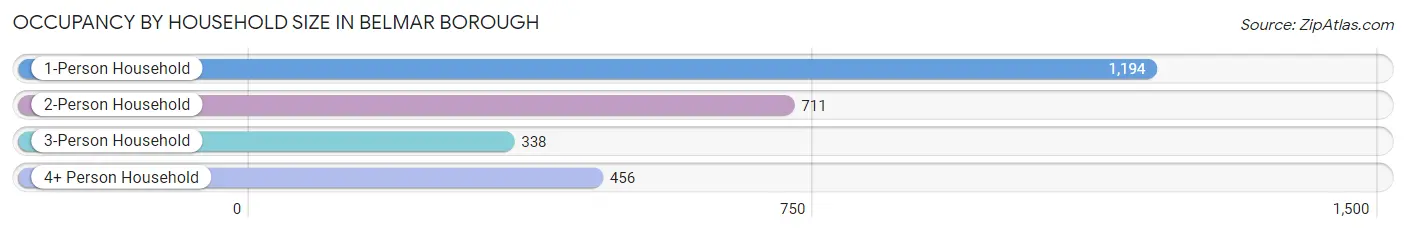
| Household Size | # Housing Units | % Housing Units |
| 1-Person Household | 1,194 | 44.2% |
| 2-Person Household | 711 | 26.3% |
| 3-Person Household | 338 | 12.5% |
| 4+ Person Household | 456 | 16.9% |
| Total Housing Units | 2,699 | 100.0% |
Occupancy by Ownership by Household Size in Belmar borough
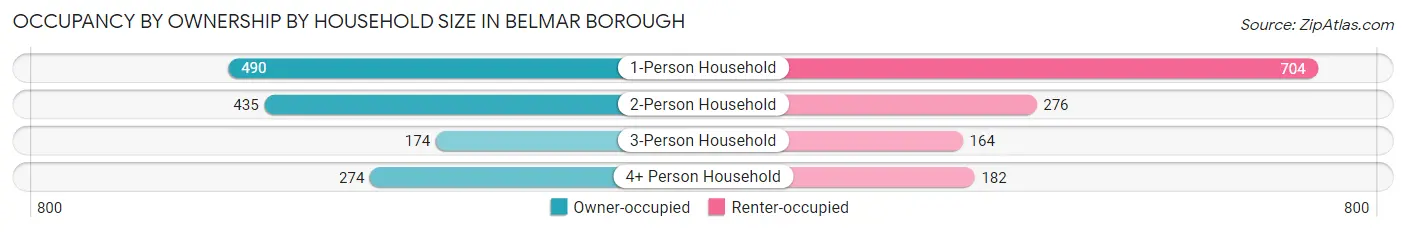
| Household Size | Owner-occupied | Renter-occupied |
| 1-Person Household | 490 (41.0%) | 704 (59.0%) |
| 2-Person Household | 435 (61.2%) | 276 (38.8%) |
| 3-Person Household | 174 (51.5%) | 164 (48.5%) |
| 4+ Person Household | 274 (60.1%) | 182 (39.9%) |
| Total Housing Units | 1,373 (50.9%) | 1,326 (49.1%) |
Occupancy by Educational Attainment in Belmar borough
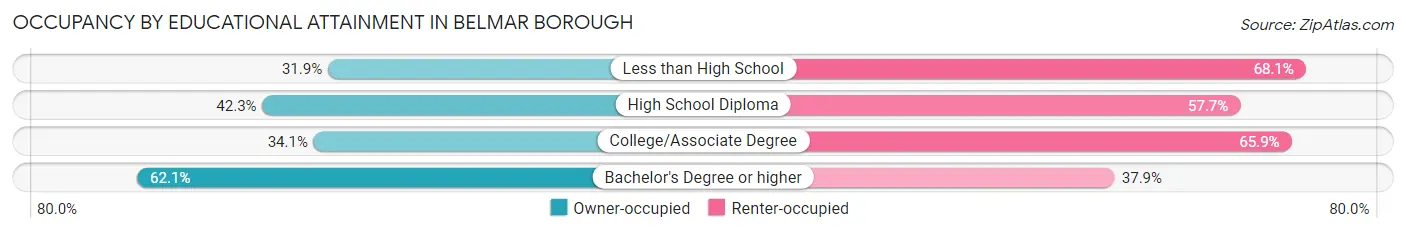
| Household Size | Owner-occupied | Renter-occupied |
| Less than High School | 44 (31.9%) | 94 (68.1%) |
| High School Diploma | 115 (42.3%) | 157 (57.7%) |
| College/Associate Degree | 254 (34.1%) | 490 (65.9%) |
| Bachelor's Degree or higher | 960 (62.1%) | 585 (37.9%) |
Occupancy by Age of Householder in Belmar borough
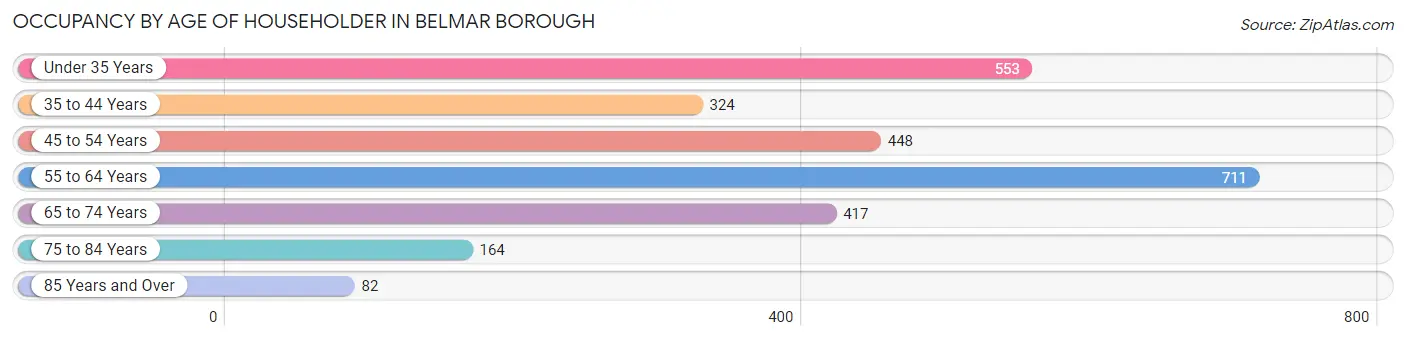
| Age Bracket | # Households | % Households |
| Under 35 Years | 553 | 20.5% |
| 35 to 44 Years | 324 | 12.0% |
| 45 to 54 Years | 448 | 16.6% |
| 55 to 64 Years | 711 | 26.3% |
| 65 to 74 Years | 417 | 15.4% |
| 75 to 84 Years | 164 | 6.1% |
| 85 Years and Over | 82 | 3.0% |
| Total | 2,699 | 100.0% |
Housing Finances in Belmar borough
Median Income by Occupancy in Belmar borough
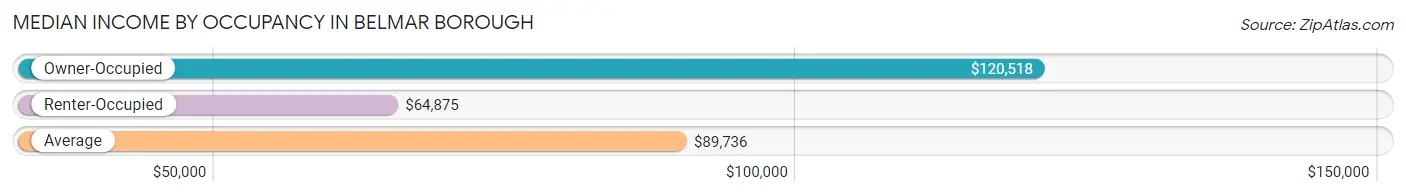
| Occupancy Type | # Households | Median Income |
| Owner-Occupied | 1,373 (50.9%) | $120,518 |
| Renter-Occupied | 1,326 (49.1%) | $64,875 |
| Average | 2,699 (100.0%) | $89,736 |
Occupancy by Householder Income Bracket in Belmar borough
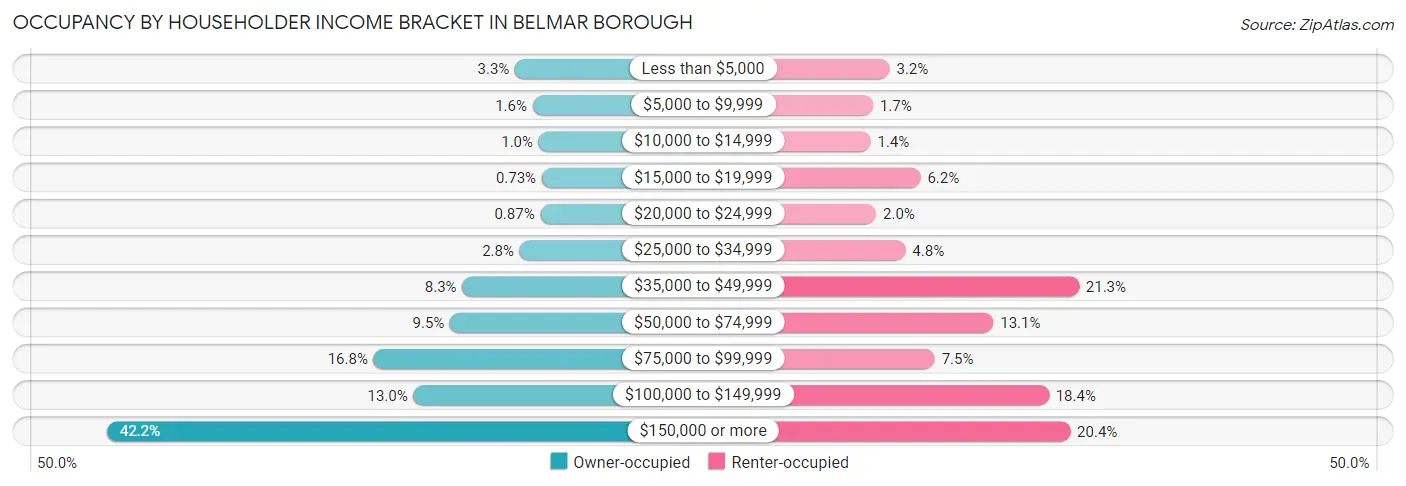
| Income Bracket | Owner-occupied | Renter-occupied |
| Less than $5,000 | 45 (3.3%) | 43 (3.2%) |
| $5,000 to $9,999 | 22 (1.6%) | 22 (1.7%) |
| $10,000 to $14,999 | 14 (1.0%) | 19 (1.4%) |
| $15,000 to $19,999 | 10 (0.7%) | 82 (6.2%) |
| $20,000 to $24,999 | 12 (0.9%) | 26 (2.0%) |
| $25,000 to $34,999 | 39 (2.8%) | 63 (4.8%) |
| $35,000 to $49,999 | 114 (8.3%) | 282 (21.3%) |
| $50,000 to $74,999 | 130 (9.5%) | 174 (13.1%) |
| $75,000 to $99,999 | 230 (16.8%) | 100 (7.5%) |
| $100,000 to $149,999 | 178 (13.0%) | 244 (18.4%) |
| $150,000 or more | 579 (42.2%) | 271 (20.4%) |
| Total | 1,373 (100.0%) | 1,326 (100.0%) |
Monthly Housing Cost Tiers in Belmar borough
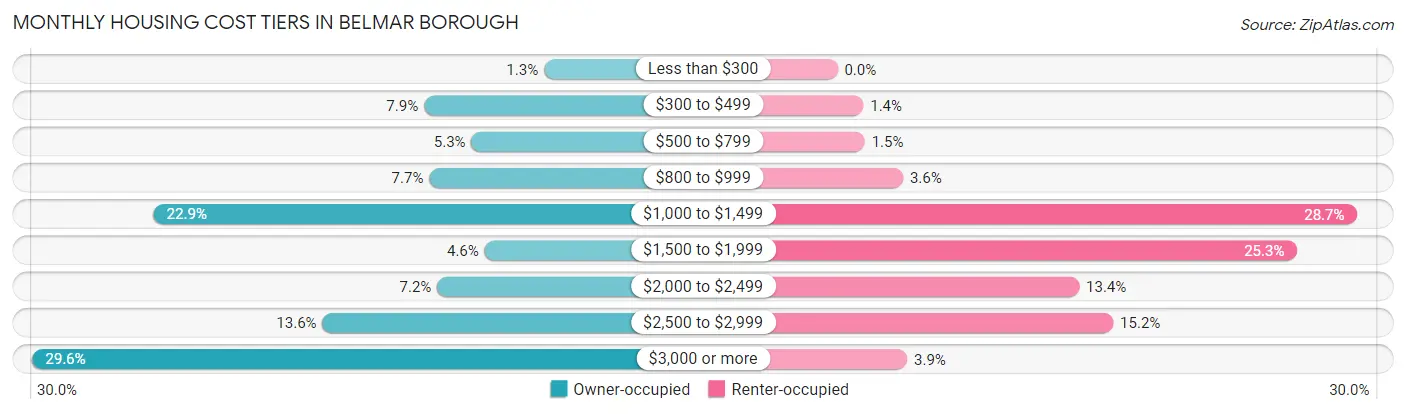
| Monthly Cost | Owner-occupied | Renter-occupied |
| Less than $300 | 18 (1.3%) | 0 (0.0%) |
| $300 to $499 | 109 (7.9%) | 19 (1.4%) |
| $500 to $799 | 73 (5.3%) | 20 (1.5%) |
| $800 to $999 | 105 (7.6%) | 48 (3.6%) |
| $1,000 to $1,499 | 314 (22.9%) | 380 (28.7%) |
| $1,500 to $1,999 | 63 (4.6%) | 336 (25.3%) |
| $2,000 to $2,499 | 99 (7.2%) | 177 (13.4%) |
| $2,500 to $2,999 | 186 (13.6%) | 202 (15.2%) |
| $3,000 or more | 406 (29.6%) | 51 (3.8%) |
| Total | 1,373 (100.0%) | 1,326 (100.0%) |
Physical Housing Characteristics in Belmar borough
Housing Structures in Belmar borough
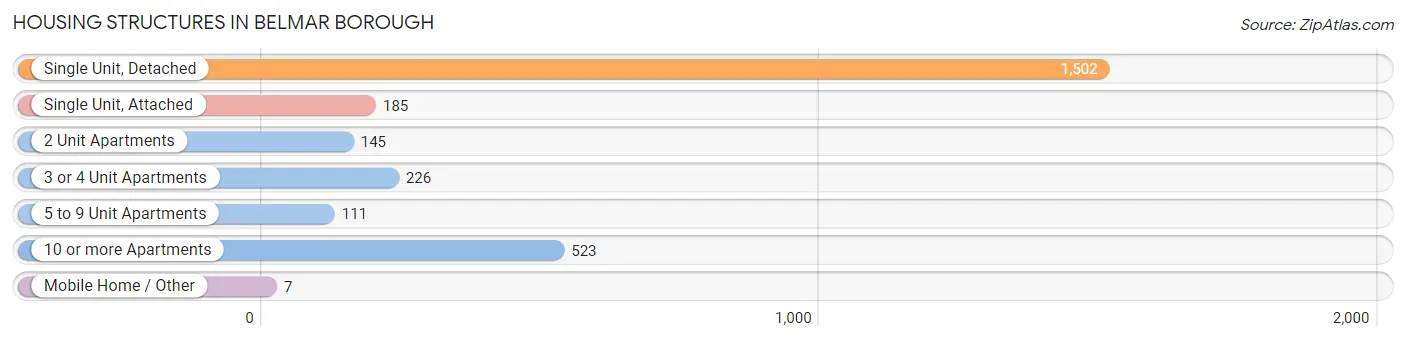
| Structure Type | # Housing Units | % Housing Units |
| Single Unit, Detached | 1,502 | 55.6% |
| Single Unit, Attached | 185 | 6.9% |
| 2 Unit Apartments | 145 | 5.4% |
| 3 or 4 Unit Apartments | 226 | 8.4% |
| 5 to 9 Unit Apartments | 111 | 4.1% |
| 10 or more Apartments | 523 | 19.4% |
| Mobile Home / Other | 7 | 0.3% |
| Total | 2,699 | 100.0% |
Housing Structures by Occupancy in Belmar borough
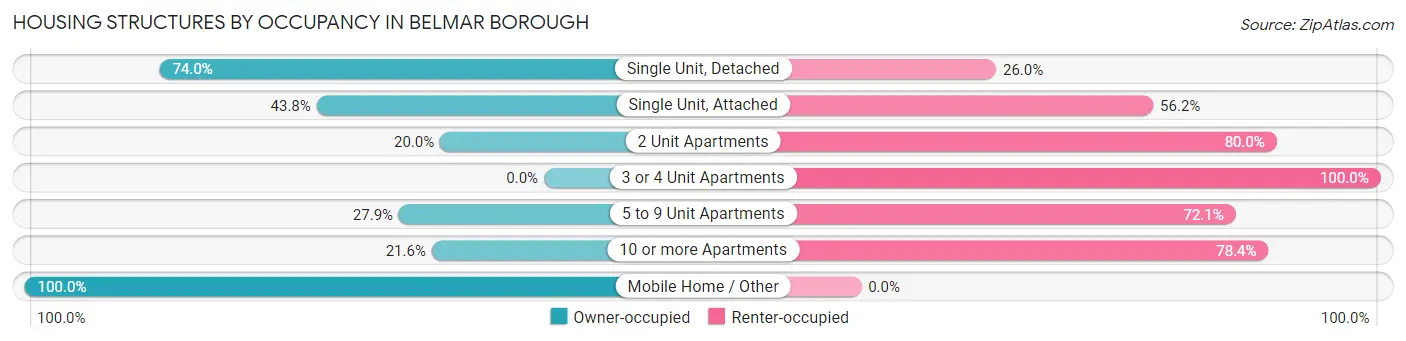
| Structure Type | Owner-occupied | Renter-occupied |
| Single Unit, Detached | 1,112 (74.0%) | 390 (26.0%) |
| Single Unit, Attached | 81 (43.8%) | 104 (56.2%) |
| 2 Unit Apartments | 29 (20.0%) | 116 (80.0%) |
| 3 or 4 Unit Apartments | 0 (0.0%) | 226 (100.0%) |
| 5 to 9 Unit Apartments | 31 (27.9%) | 80 (72.1%) |
| 10 or more Apartments | 113 (21.6%) | 410 (78.4%) |
| Mobile Home / Other | 7 (100.0%) | 0 (0.0%) |
| Total | 1,373 (50.9%) | 1,326 (49.1%) |
Housing Structures by Number of Rooms in Belmar borough
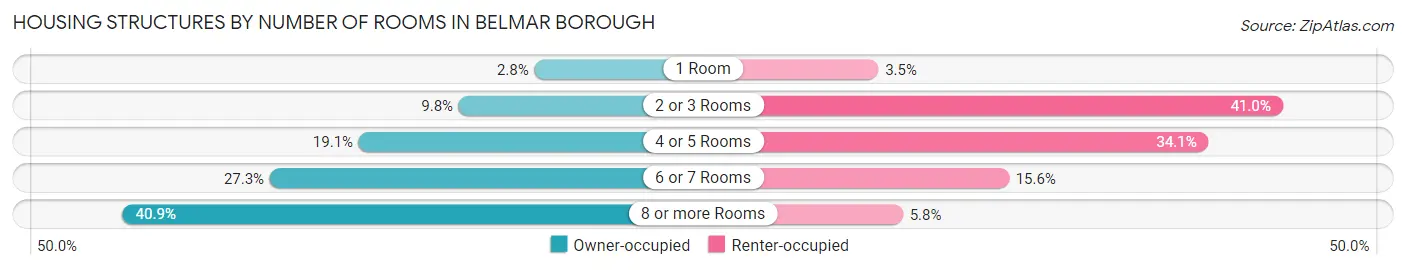
| Number of Rooms | Owner-occupied | Renter-occupied |
| 1 Room | 39 (2.8%) | 47 (3.5%) |
| 2 or 3 Rooms | 135 (9.8%) | 543 (40.9%) |
| 4 or 5 Rooms | 262 (19.1%) | 452 (34.1%) |
| 6 or 7 Rooms | 375 (27.3%) | 207 (15.6%) |
| 8 or more Rooms | 562 (40.9%) | 77 (5.8%) |
| Total | 1,373 (100.0%) | 1,326 (100.0%) |
Housing Structure by Heating Type in Belmar borough
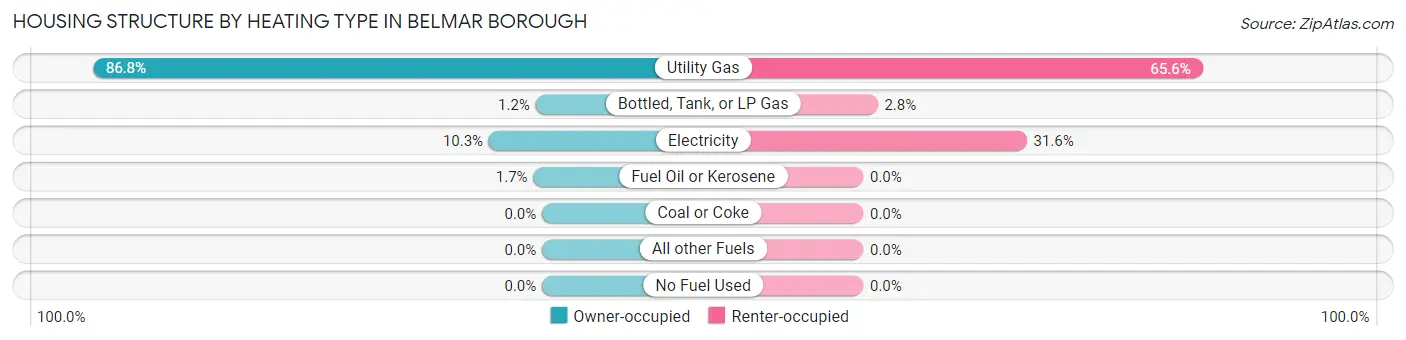
| Heating Type | Owner-occupied | Renter-occupied |
| Utility Gas | 1,192 (86.8%) | 870 (65.6%) |
| Bottled, Tank, or LP Gas | 17 (1.2%) | 37 (2.8%) |
| Electricity | 141 (10.3%) | 419 (31.6%) |
| Fuel Oil or Kerosene | 23 (1.7%) | 0 (0.0%) |
| Coal or Coke | 0 (0.0%) | 0 (0.0%) |
| All other Fuels | 0 (0.0%) | 0 (0.0%) |
| No Fuel Used | 0 (0.0%) | 0 (0.0%) |
| Total | 1,373 (100.0%) | 1,326 (100.0%) |
Household Vehicle Usage in Belmar borough
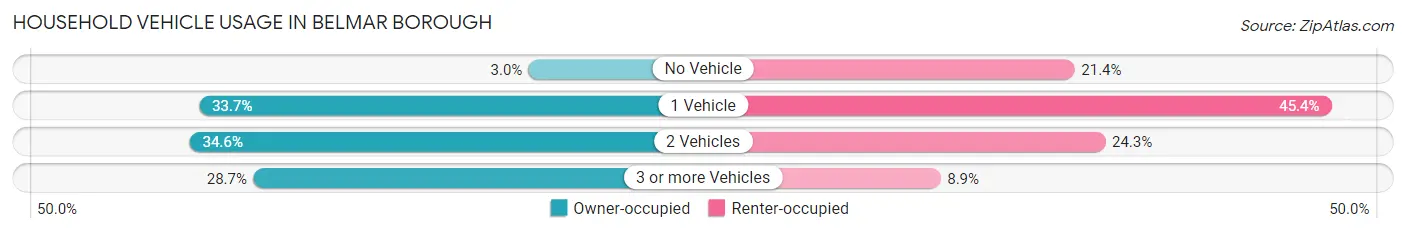
| Vehicles per Household | Owner-occupied | Renter-occupied |
| No Vehicle | 41 (3.0%) | 284 (21.4%) |
| 1 Vehicle | 463 (33.7%) | 602 (45.4%) |
| 2 Vehicles | 475 (34.6%) | 322 (24.3%) |
| 3 or more Vehicles | 394 (28.7%) | 118 (8.9%) |
| Total | 1,373 (100.0%) | 1,326 (100.0%) |
Real Estate & Mortgages in Belmar borough
Real Estate and Mortgage Overview in Belmar borough
| Characteristic | Without Mortgage | With Mortgage |
| Housing Units | 672 | 701 |
| Median Property Value | $652,400 | $773,100 |
| Median Household Income | $89,911 | $343 |
| Monthly Housing Costs | $1,051 | $392 |
| Real Estate Taxes | $8,306 | $0 |
Property Value by Mortgage Status in Belmar borough
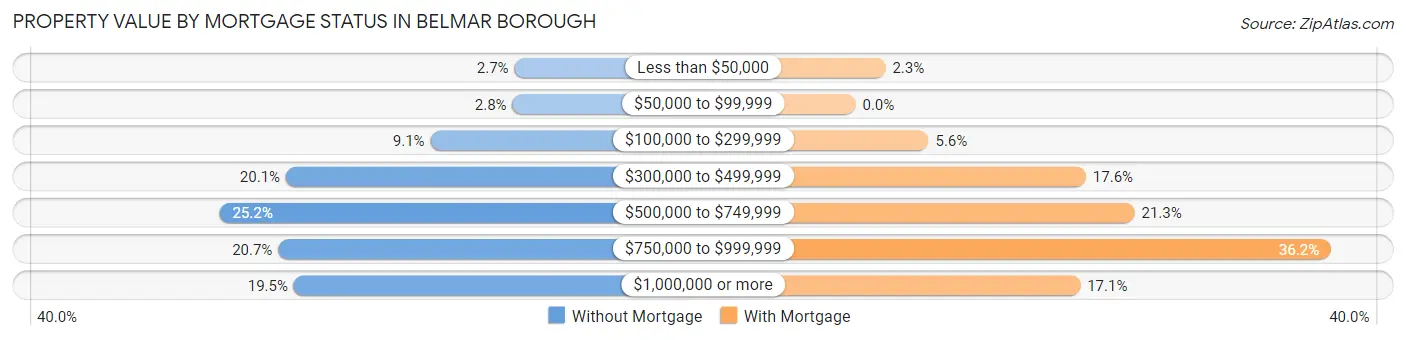
| Property Value | Without Mortgage | With Mortgage |
| Less than $50,000 | 18 (2.7%) | 16 (2.3%) |
| $50,000 to $99,999 | 19 (2.8%) | 0 (0.0%) |
| $100,000 to $299,999 | 61 (9.1%) | 39 (5.6%) |
| $300,000 to $499,999 | 135 (20.1%) | 123 (17.5%) |
| $500,000 to $749,999 | 169 (25.2%) | 149 (21.3%) |
| $750,000 to $999,999 | 139 (20.7%) | 254 (36.2%) |
| $1,000,000 or more | 131 (19.5%) | 120 (17.1%) |
| Total | 672 (100.0%) | 701 (100.0%) |
Household Income by Mortgage Status in Belmar borough
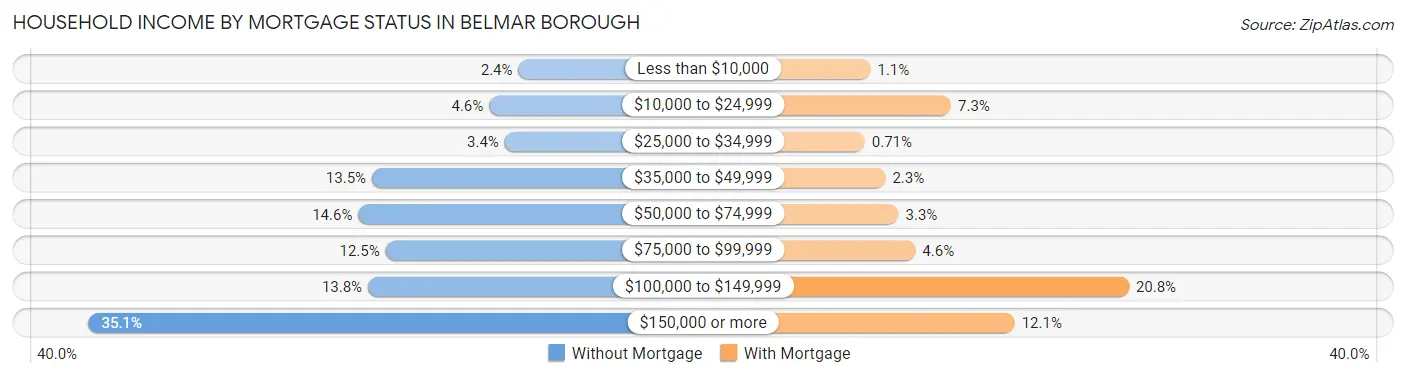
| Household Income | Without Mortgage | With Mortgage |
| Less than $10,000 | 16 (2.4%) | 8 (1.1%) |
| $10,000 to $24,999 | 31 (4.6%) | 51 (7.3%) |
| $25,000 to $34,999 | 23 (3.4%) | 5 (0.7%) |
| $35,000 to $49,999 | 91 (13.5%) | 16 (2.3%) |
| $50,000 to $74,999 | 98 (14.6%) | 23 (3.3%) |
| $75,000 to $99,999 | 84 (12.5%) | 32 (4.6%) |
| $100,000 to $149,999 | 93 (13.8%) | 146 (20.8%) |
| $150,000 or more | 236 (35.1%) | 85 (12.1%) |
| Total | 672 (100.0%) | 701 (100.0%) |
Property Value to Household Income Ratio in Belmar borough
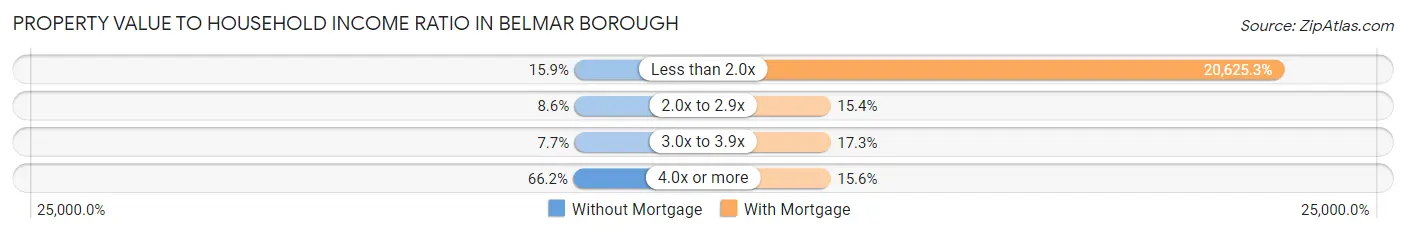
| Value-to-Income Ratio | Without Mortgage | With Mortgage |
| Less than 2.0x | 107 (15.9%) | 144,583 (20,625.2%) |
| 2.0x to 2.9x | 58 (8.6%) | 108 (15.4%) |
| 3.0x to 3.9x | 52 (7.7%) | 121 (17.3%) |
| 4.0x or more | 445 (66.2%) | 109 (15.5%) |
| Total | 672 (100.0%) | 701 (100.0%) |
Real Estate Taxes by Mortgage Status in Belmar borough
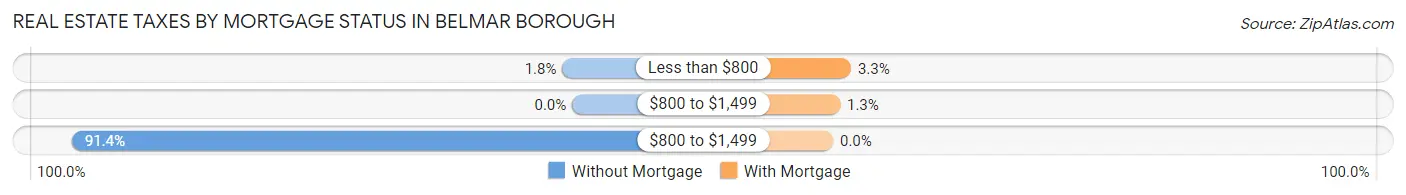
| Property Taxes | Without Mortgage | With Mortgage |
| Less than $800 | 12 (1.8%) | 23 (3.3%) |
| $800 to $1,499 | 0 (0.0%) | 9 (1.3%) |
| $800 to $1,499 | 614 (91.4%) | 0 (0.0%) |
| Total | 672 (100.0%) | 701 (100.0%) |
Health & Disability in Belmar borough
Health Insurance Coverage by Age in Belmar borough
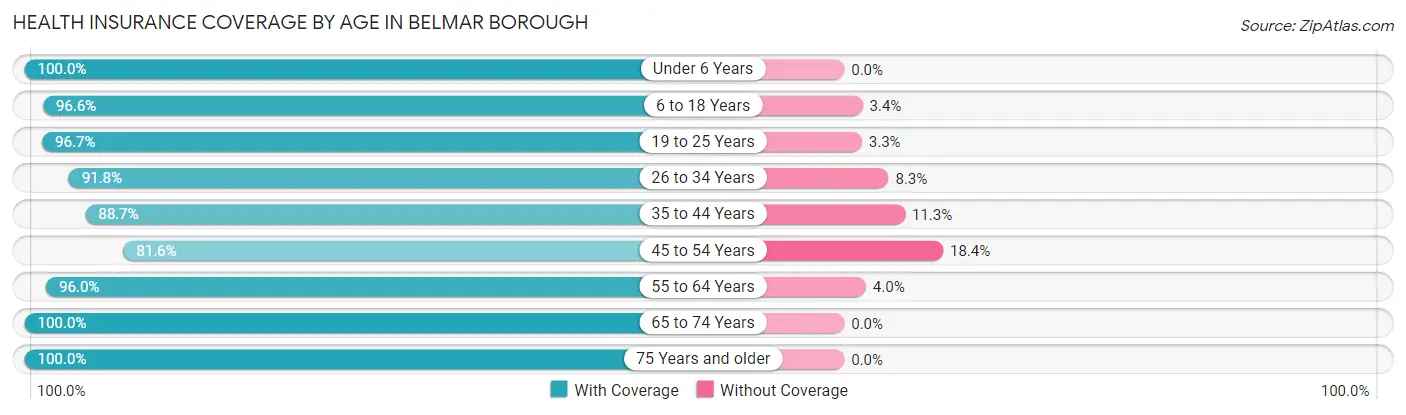
| Age Bracket | With Coverage | Without Coverage |
| Under 6 Years | 232 (100.0%) | 0 (0.0%) |
| 6 to 18 Years | 565 (96.6%) | 20 (3.4%) |
| 19 to 25 Years | 413 (96.7%) | 14 (3.3%) |
| 26 to 34 Years | 934 (91.7%) | 84 (8.3%) |
| 35 to 44 Years | 572 (88.7%) | 73 (11.3%) |
| 45 to 54 Years | 691 (81.6%) | 156 (18.4%) |
| 55 to 64 Years | 1,049 (96.0%) | 44 (4.0%) |
| 65 to 74 Years | 689 (100.0%) | 0 (0.0%) |
| 75 Years and older | 341 (100.0%) | 0 (0.0%) |
| Total | 5,486 (93.3%) | 391 (6.7%) |
Health Insurance Coverage by Citizenship Status in Belmar borough
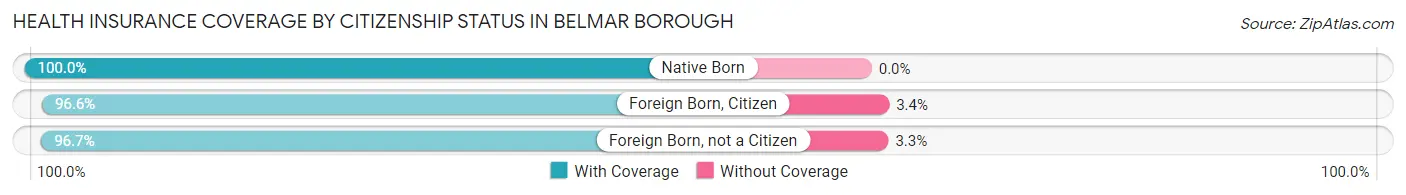
| Citizenship Status | With Coverage | Without Coverage |
| Native Born | 232 (100.0%) | 0 (0.0%) |
| Foreign Born, Citizen | 565 (96.6%) | 20 (3.4%) |
| Foreign Born, not a Citizen | 413 (96.7%) | 14 (3.3%) |
Health Insurance Coverage by Household Income in Belmar borough
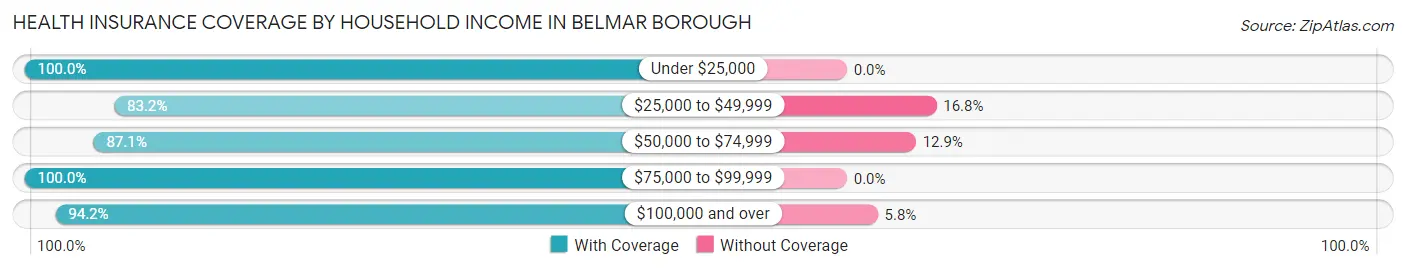
| Household Income | With Coverage | Without Coverage |
| Under $25,000 | 359 (100.0%) | 0 (0.0%) |
| $25,000 to $49,999 | 531 (83.2%) | 107 (16.8%) |
| $50,000 to $74,999 | 533 (87.1%) | 79 (12.9%) |
| $75,000 to $99,999 | 703 (100.0%) | 0 (0.0%) |
| $100,000 and over | 3,350 (94.2%) | 205 (5.8%) |
Public vs Private Health Insurance Coverage by Age in Belmar borough
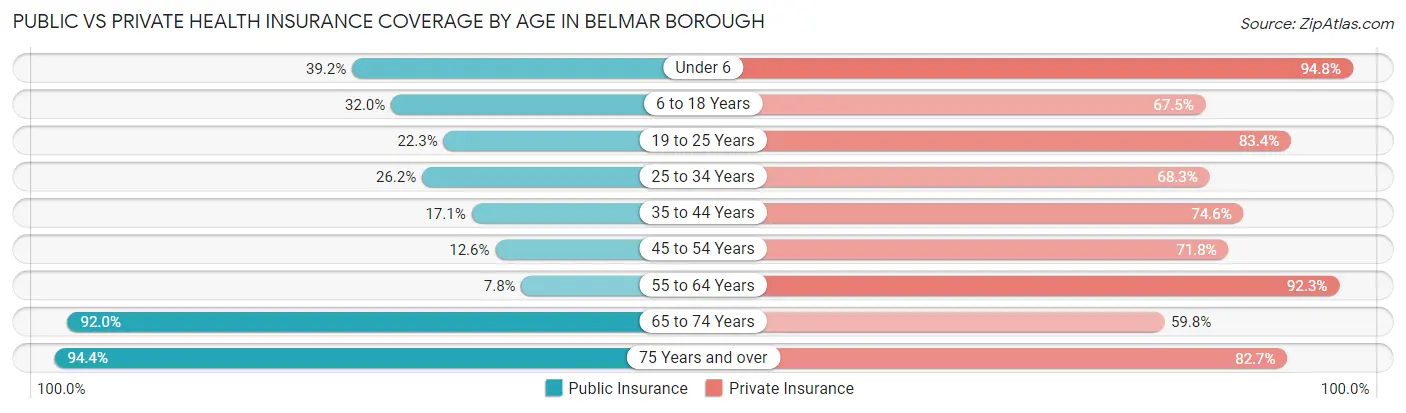
| Age Bracket | Public Insurance | Private Insurance |
| Under 6 | 91 (39.2%) | 220 (94.8%) |
| 6 to 18 Years | 187 (32.0%) | 395 (67.5%) |
| 19 to 25 Years | 95 (22.3%) | 356 (83.4%) |
| 25 to 34 Years | 267 (26.2%) | 695 (68.3%) |
| 35 to 44 Years | 110 (17.1%) | 481 (74.6%) |
| 45 to 54 Years | 107 (12.6%) | 608 (71.8%) |
| 55 to 64 Years | 85 (7.8%) | 1,009 (92.3%) |
| 65 to 74 Years | 634 (92.0%) | 412 (59.8%) |
| 75 Years and over | 322 (94.4%) | 282 (82.7%) |
| Total | 1,898 (32.3%) | 4,458 (75.9%) |
Disability Status by Sex by Age in Belmar borough
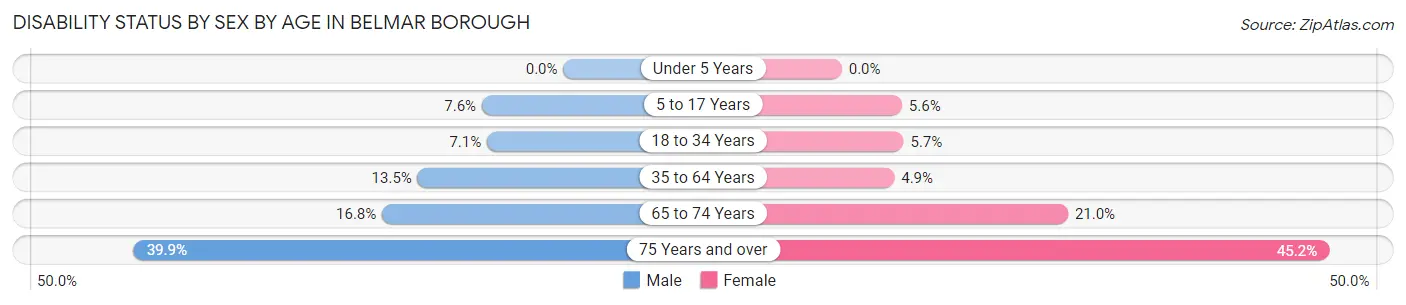
| Age Bracket | Male | Female |
| Under 5 Years | 0 (0.0%) | 0 (0.0%) |
| 5 to 17 Years | 26 (7.6%) | 13 (5.6%) |
| 18 to 34 Years | 70 (7.1%) | 28 (5.7%) |
| 35 to 64 Years | 208 (13.5%) | 51 (4.9%) |
| 65 to 74 Years | 55 (16.8%) | 76 (21.0%) |
| 75 Years and over | 61 (39.9%) | 85 (45.2%) |
Disability Class by Sex by Age in Belmar borough
Disability Class: Hearing Difficulty
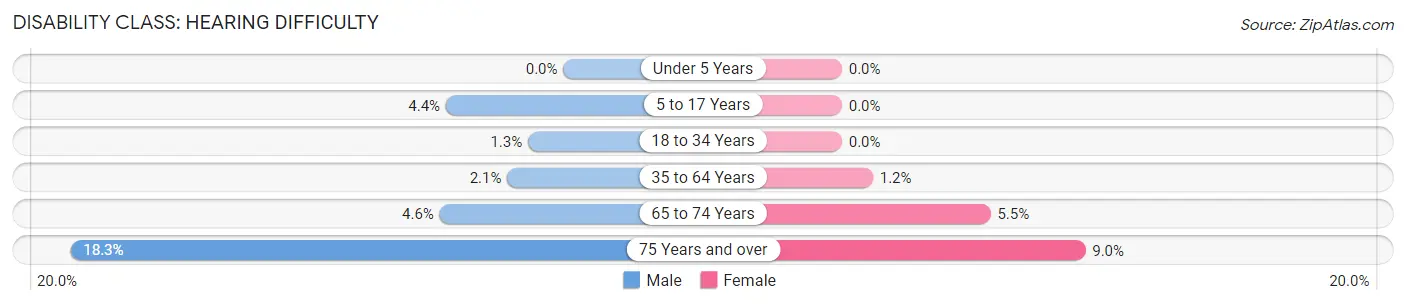
| Age Bracket | Male | Female |
| Under 5 Years | 0 (0.0%) | 0 (0.0%) |
| 5 to 17 Years | 15 (4.4%) | 0 (0.0%) |
| 18 to 34 Years | 13 (1.3%) | 0 (0.0%) |
| 35 to 64 Years | 32 (2.1%) | 12 (1.1%) |
| 65 to 74 Years | 15 (4.6%) | 20 (5.5%) |
| 75 Years and over | 28 (18.3%) | 17 (9.0%) |
Disability Class: Vision Difficulty
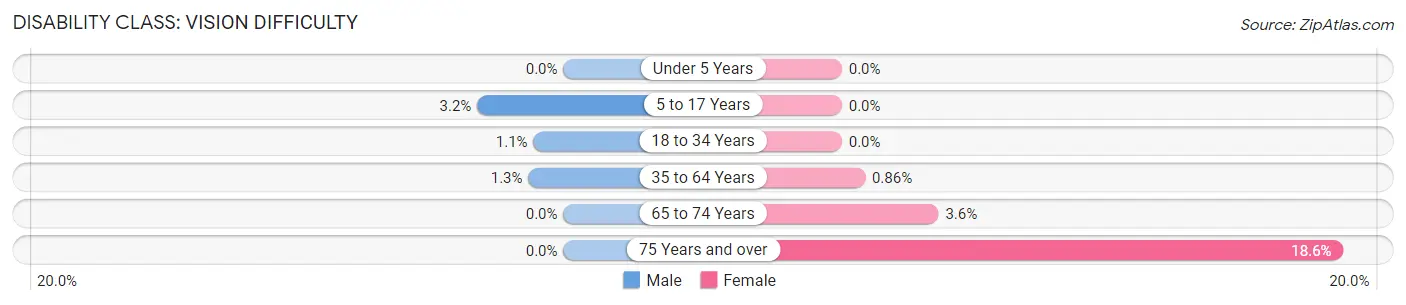
| Age Bracket | Male | Female |
| Under 5 Years | 0 (0.0%) | 0 (0.0%) |
| 5 to 17 Years | 11 (3.2%) | 0 (0.0%) |
| 18 to 34 Years | 11 (1.1%) | 0 (0.0%) |
| 35 to 64 Years | 20 (1.3%) | 9 (0.9%) |
| 65 to 74 Years | 0 (0.0%) | 13 (3.6%) |
| 75 Years and over | 0 (0.0%) | 35 (18.6%) |
Disability Class: Cognitive Difficulty
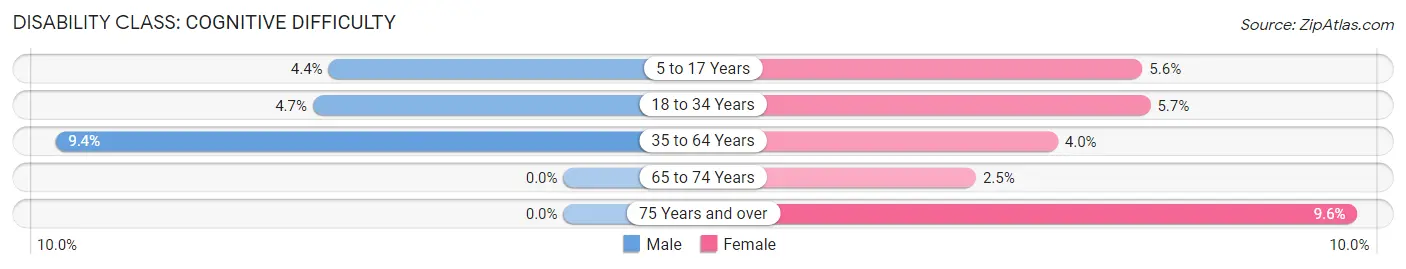
| Age Bracket | Male | Female |
| 5 to 17 Years | 15 (4.4%) | 13 (5.6%) |
| 18 to 34 Years | 46 (4.6%) | 28 (5.7%) |
| 35 to 64 Years | 145 (9.4%) | 42 (4.0%) |
| 65 to 74 Years | 0 (0.0%) | 9 (2.5%) |
| 75 Years and over | 0 (0.0%) | 18 (9.6%) |
Disability Class: Ambulatory Difficulty
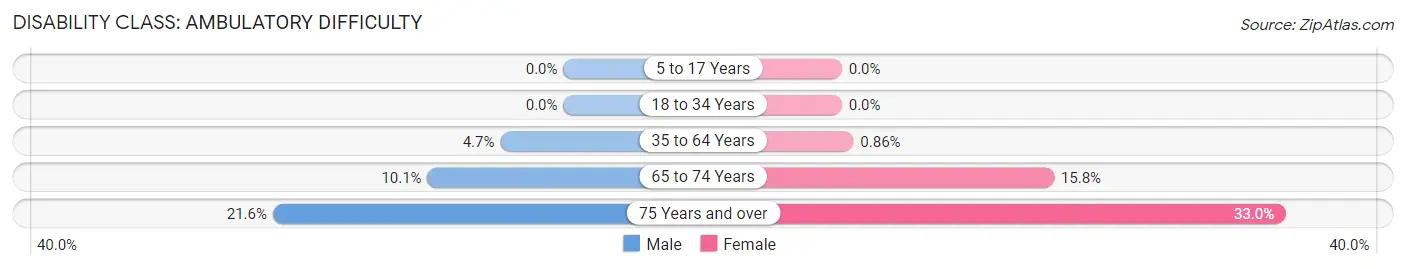
| Age Bracket | Male | Female |
| 5 to 17 Years | 0 (0.0%) | 0 (0.0%) |
| 18 to 34 Years | 0 (0.0%) | 0 (0.0%) |
| 35 to 64 Years | 72 (4.7%) | 9 (0.9%) |
| 65 to 74 Years | 33 (10.1%) | 57 (15.8%) |
| 75 Years and over | 33 (21.6%) | 62 (33.0%) |
Disability Class: Self-Care Difficulty
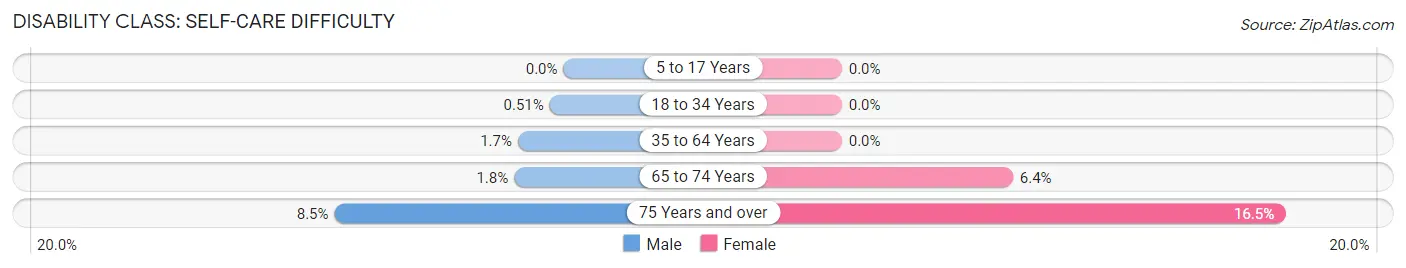
| Age Bracket | Male | Female |
| 5 to 17 Years | 0 (0.0%) | 0 (0.0%) |
| 18 to 34 Years | 5 (0.5%) | 0 (0.0%) |
| 35 to 64 Years | 26 (1.7%) | 0 (0.0%) |
| 65 to 74 Years | 6 (1.8%) | 23 (6.4%) |
| 75 Years and over | 13 (8.5%) | 31 (16.5%) |
Technology Access in Belmar borough
Computing Device Access in Belmar borough
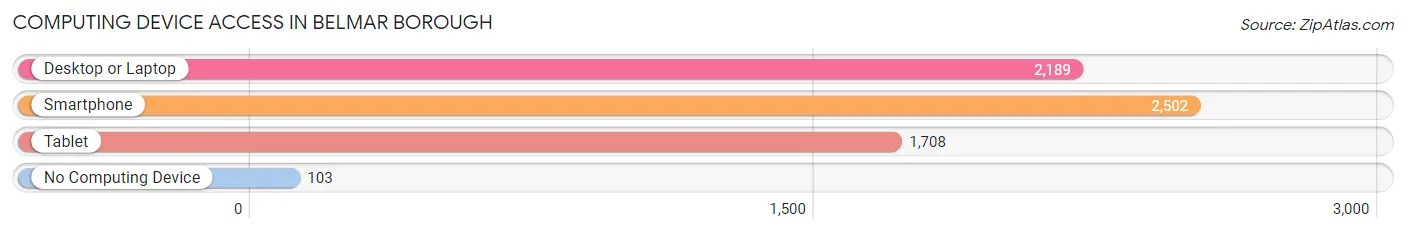
| Device Type | # Households | % Households |
| Desktop or Laptop | 2,189 | 81.1% |
| Smartphone | 2,502 | 92.7% |
| Tablet | 1,708 | 63.3% |
| No Computing Device | 103 | 3.8% |
| Total | 2,699 | 100.0% |
Internet Access in Belmar borough
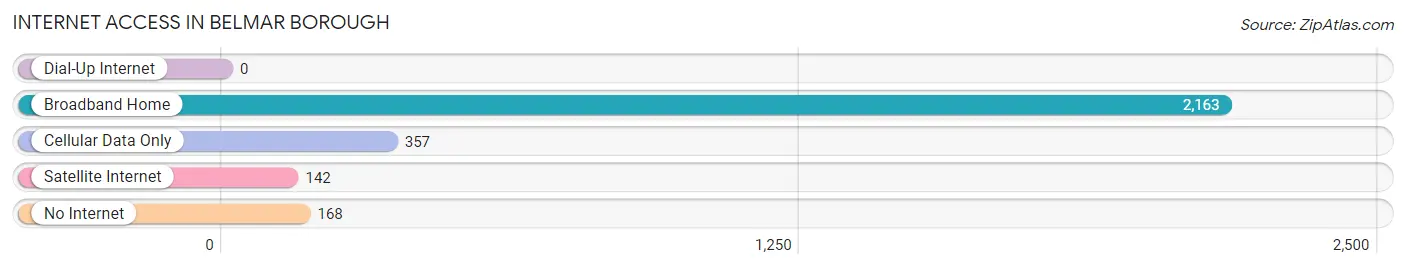
| Internet Type | # Households | % Households |
| Dial-Up Internet | 0 | 0.0% |
| Broadband Home | 2,163 | 80.1% |
| Cellular Data Only | 357 | 13.2% |
| Satellite Internet | 142 | 5.3% |
| No Internet | 168 | 6.2% |
| Total | 2,699 | 100.0% |
Belmar borough Summary
Belmar Borough is a small borough located in Monmouth County, New Jersey. It is situated on the Atlantic Ocean, just south of the Manasquan Inlet. The borough is home to a population of approximately 5,000 people, and is a popular summer destination for tourists and beachgoers.
History
Belmar was originally known as Ocean Beach, and was founded in 1885 by James A. Bradley. Bradley was a real estate developer who had purchased the land from the estate of John B. Colford. He renamed the area Belmar, which is derived from the Italian words “bel” and “mar”, meaning “beautiful sea”.
The borough was incorporated in 1891, and was originally a resort town. It was a popular destination for wealthy New Yorkers, who would come to the area to enjoy the beaches and the ocean.
In the early 1900s, Belmar began to develop into a more permanent community. The town was home to a variety of businesses, including a hotel, a movie theater, and a boardwalk. The boardwalk was a popular destination for tourists and locals alike, and was the site of many events and activities.
In the 1950s, Belmar began to experience a decline in popularity. The town was hit hard by the Great Depression, and many of the businesses closed. However, in the 1960s, the town began to experience a resurgence in popularity. The town was revitalized by the construction of a new boardwalk, and the opening of a new marina.
Geography
Belmar is located in Monmouth County, New Jersey. It is situated on the Atlantic Ocean, just south of the Manasquan Inlet. The borough is bordered by the boroughs of Lake Como, Avon-by-the-Sea, and Spring Lake.
The borough is divided into two sections, the north and south sides. The north side is home to the main business district, while the south side is primarily residential. The borough is home to a variety of parks and beaches, including Silver Lake Park, Shark River Park, and Belmar Beach.
Economy
Belmar’s economy is largely based on tourism. The borough is home to a variety of hotels, restaurants, and shops, which cater to the large number of tourists who visit the area each year. The borough is also home to a number of marinas, which provide services to boaters and fishermen.
In addition to tourism, Belmar is home to a variety of businesses, including manufacturing, retail, and professional services. The borough is also home to a number of government offices, including the Monmouth County Courthouse and the Belmar Police Department.
Demographics
As of the 2010 census, Belmar had a population of 5,794 people. The racial makeup of the borough was 87.3% White, 5.2% African American, 0.3% Native American, 1.7% Asian, and 4.5% from other races. Hispanic or Latino of any race were 8.3% of the population.
The median household income in Belmar was $62,813, and the median family income was $76,945. The per capita income for the borough was $32,945. About 5.2% of families and 7.2% of the population were below the poverty line, including 8.3% of those under age 18 and 5.2% of those age 65 or over.
Belmar is a small borough with a rich history and a vibrant economy. It is a popular destination for tourists and beachgoers, and is home to a variety of businesses and services. The borough is also home to a diverse population, with a variety of racial and ethnic backgrounds.
Common Questions
What is Per Capita Income in Belmar borough?
Per Capita income in Belmar borough is $66,508.
What is the Median Family Income in Belmar borough?
Median Family Income in Belmar borough is $141,293.
What is the Median Household income in Belmar borough?
Median Household Income in Belmar borough is $89,736.
What is Income or Wage Gap in Belmar borough?
Income or Wage Gap in Belmar borough is 18.3%.
Women in Belmar borough earn 81.7 cents for every dollar earned by a man.
What is Inequality or Gini Index in Belmar borough?
Inequality or Gini Index in Belmar borough is 0.50.
What is the Total Population of Belmar borough?
Total Population of Belmar borough is 5,877.
What is the Total Male Population of Belmar borough?
Total Male Population of Belmar borough is 3,462.
What is the Total Female Population of Belmar borough?
Total Female Population of Belmar borough is 2,415.
What is the Ratio of Males per 100 Females in Belmar borough?
There are 143.35 Males per 100 Females in Belmar borough.
What is the Ratio of Females per 100 Males in Belmar borough?
There are 69.76 Females per 100 Males in Belmar borough.
What is the Median Population Age in Belmar borough?
Median Population Age in Belmar borough is 45.3 Years.
What is the Average Family Size in Belmar borough
Average Family Size in Belmar borough is 3.1 People.
What is the Average Household Size in Belmar borough
Average Household Size in Belmar borough is 2.2 People.
How Large is the Labor Force in Belmar borough?
There are 3,708 People in the Labor Forcein in Belmar borough.
What is the Percentage of People in the Labor Force in Belmar borough?
71.4% of People are in the Labor Force in Belmar borough.
What is the Unemployment Rate in Belmar borough?
Unemployment Rate in Belmar borough is 6.8%.