Stanhope borough, NJ Map & Demographics
Stanhope borough Overview
$47,073
PER CAPITA INCOME
$130,329
AVG FAMILY INCOME
$125,938
AVG HOUSEHOLD INCOME
10.3%
WAGE / INCOME GAP [ % ]
89.7¢/ $1
WAGE / INCOME GAP [ $ ]
0.30
INEQUALITY / GINI INDEX
3,533
TOTAL POPULATION
1,697
MALE POPULATION
1,836
FEMALE POPULATION
92.43
MALES / 100 FEMALES
108.19
FEMALES / 100 MALES
40.3
MEDIAN AGE
3.1
AVG FAMILY SIZE
2.8
AVG HOUSEHOLD SIZE
2,197
LABOR FORCE [ PEOPLE ]
79.3%
PERCENT IN LABOR FORCE
3.2%
UNEMPLOYMENT RATE
Income in Stanhope borough
Income Overview in Stanhope borough
Per Capita Income in Stanhope borough is $47,073, while median incomes of families and households are $130,329 and $125,938 respectively.
| Characteristic | Number | Measure |
| Per Capita Income | 3,533 | $47,073 |
| Median Family Income | 986 | $130,329 |
| Mean Family Income | 986 | $136,650 |
| Median Household Income | 1,266 | $125,938 |
| Mean Household Income | 1,266 | $127,157 |
| Income Deficit | 986 | $0 |
| Wage / Income Gap (%) | 3,533 | 10.31% |
| Wage / Income Gap ($) | 3,533 | 89.69¢ per $1 |
| Gini / Inequality Index | 3,533 | 0.30 |
Earnings by Sex in Stanhope borough
Average Earnings in Stanhope borough are $60,375, $64,375 for men and $57,737 for women, a difference of 10.3%.
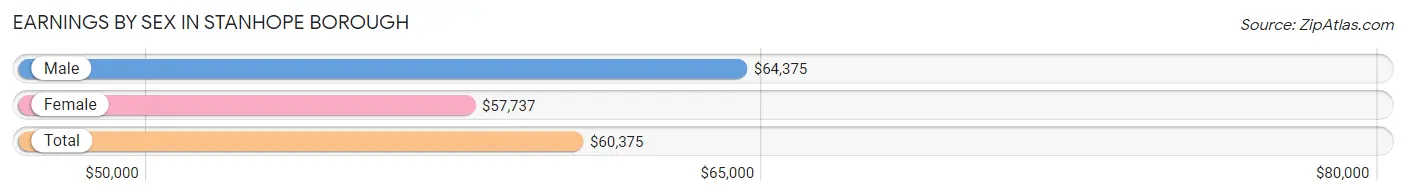
| Sex | Number | Average Earnings |
| Male | 1,133 (51.1%) | $64,375 |
| Female | 1,083 (48.9%) | $57,737 |
| Total | 2,216 (100.0%) | $60,375 |
Earnings by Sex by Income Bracket in Stanhope borough
The most common earnings brackets in Stanhope borough are $100,000+ for men (253 | 22.3%) and $75,000 to $99,999 for women (151 | 13.9%).
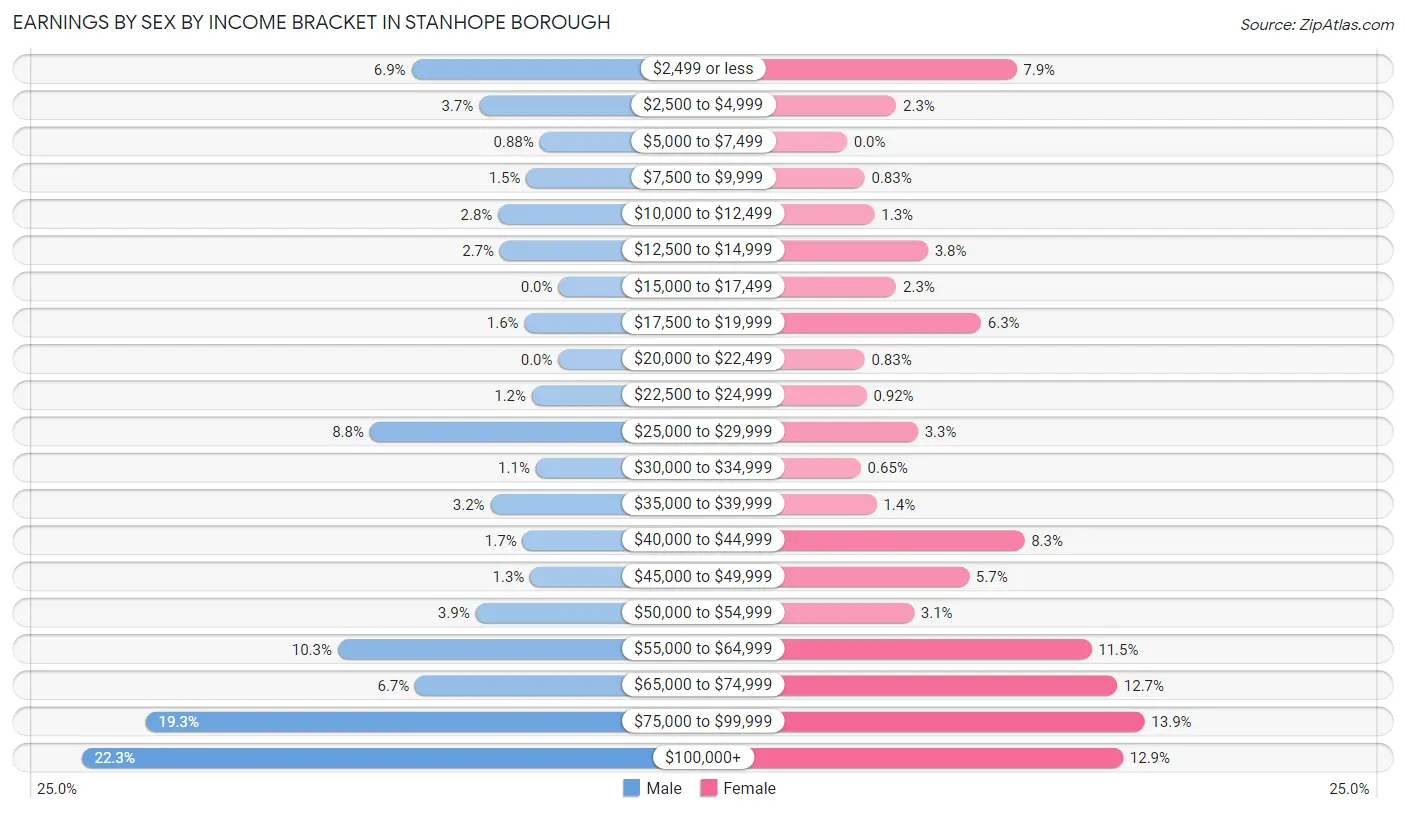
| Income | Male | Female |
| $2,499 or less | 78 (6.9%) | 86 (7.9%) |
| $2,500 to $4,999 | 42 (3.7%) | 25 (2.3%) |
| $5,000 to $7,499 | 10 (0.9%) | 0 (0.0%) |
| $7,500 to $9,999 | 17 (1.5%) | 9 (0.8%) |
| $10,000 to $12,499 | 32 (2.8%) | 14 (1.3%) |
| $12,500 to $14,999 | 31 (2.7%) | 41 (3.8%) |
| $15,000 to $17,499 | 0 (0.0%) | 25 (2.3%) |
| $17,500 to $19,999 | 18 (1.6%) | 68 (6.3%) |
| $20,000 to $22,499 | 0 (0.0%) | 9 (0.8%) |
| $22,500 to $24,999 | 14 (1.2%) | 10 (0.9%) |
| $25,000 to $29,999 | 100 (8.8%) | 36 (3.3%) |
| $30,000 to $34,999 | 12 (1.1%) | 7 (0.6%) |
| $35,000 to $39,999 | 36 (3.2%) | 15 (1.4%) |
| $40,000 to $44,999 | 19 (1.7%) | 90 (8.3%) |
| $45,000 to $49,999 | 15 (1.3%) | 62 (5.7%) |
| $50,000 to $54,999 | 44 (3.9%) | 34 (3.1%) |
| $55,000 to $64,999 | 117 (10.3%) | 124 (11.5%) |
| $65,000 to $74,999 | 76 (6.7%) | 137 (12.7%) |
| $75,000 to $99,999 | 219 (19.3%) | 151 (13.9%) |
| $100,000+ | 253 (22.3%) | 140 (12.9%) |
| Total | 1,133 (100.0%) | 1,083 (100.0%) |
Earnings by Sex by Educational Attainment in Stanhope borough
Average earnings in Stanhope borough are $69,659 for men and $60,250 for women, a difference of 13.5%. Men with an educational attainment of bachelor's degree enjoy the highest average annual earnings of $85,234, while those with high school diploma education earn the least with $49,306. Women with an educational attainment of graduate degree earn the most with the average annual earnings of $72,965, while those with high school diploma education have the smallest earnings of $47,401.
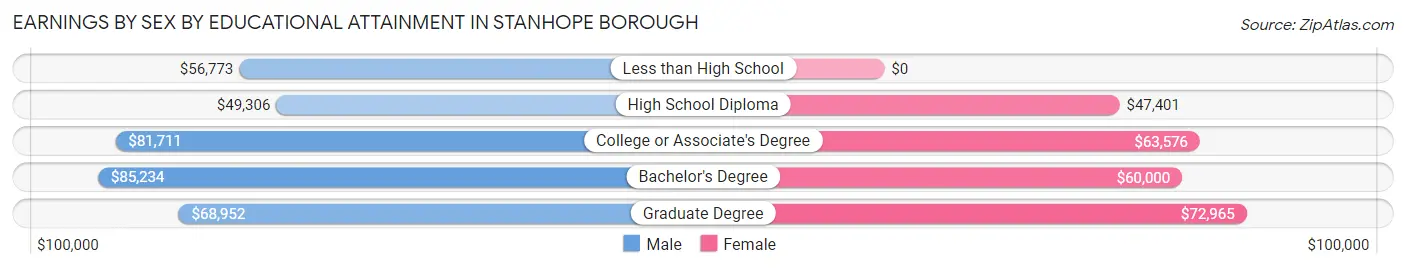
| Educational Attainment | Male Income | Female Income |
| Less than High School | $56,773 | $0 |
| High School Diploma | $49,306 | $47,401 |
| College or Associate's Degree | $81,711 | $63,576 |
| Bachelor's Degree | $85,234 | $60,000 |
| Graduate Degree | $68,952 | $72,965 |
| Total | $69,659 | $60,250 |
Family Income in Stanhope borough
Family Income Brackets in Stanhope borough
According to the Stanhope borough family income data, there are 316 families falling into the $100,000 to $149,999 income range, which is the most common income bracket and makes up 32.1% of all families.
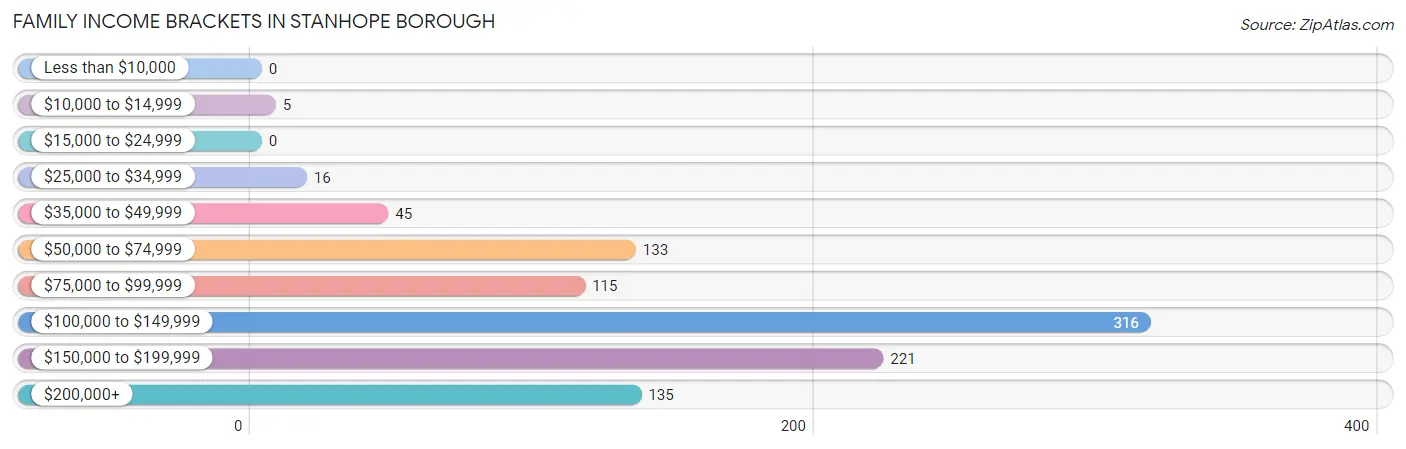
| Income Bracket | # Families | % Families |
| Less than $10,000 | 0 | 0.0% |
| $10,000 to $14,999 | 5 | 0.5% |
| $15,000 to $24,999 | 0 | 0.0% |
| $25,000 to $34,999 | 16 | 1.6% |
| $35,000 to $49,999 | 45 | 4.6% |
| $50,000 to $74,999 | 133 | 13.5% |
| $75,000 to $99,999 | 115 | 11.7% |
| $100,000 to $149,999 | 316 | 32.0% |
| $150,000 to $199,999 | 221 | 22.4% |
| $200,000+ | 135 | 13.7% |
Family Income by Famaliy Size in Stanhope borough
5-person families (63 | 6.4%) account for the highest median family income in Stanhope borough with $183,603 per family, while 2-person families (451 | 45.7%) have the highest median income of $56,696 per family member.
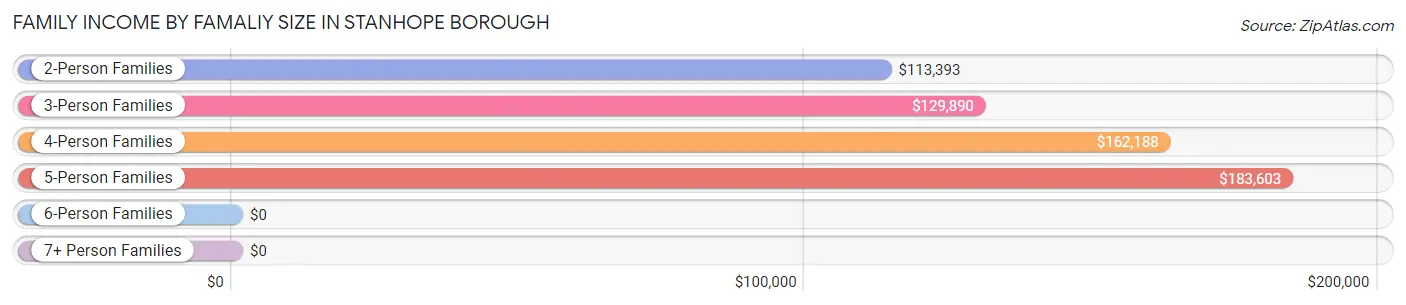
| Income Bracket | # Families | Median Income |
| 2-Person Families | 451 (45.7%) | $113,393 |
| 3-Person Families | 251 (25.5%) | $129,890 |
| 4-Person Families | 203 (20.6%) | $162,188 |
| 5-Person Families | 63 (6.4%) | $183,603 |
| 6-Person Families | 18 (1.8%) | $0 |
| 7+ Person Families | 0 (0.0%) | $0 |
| Total | 986 (100.0%) | $130,329 |
Family Income by Number of Earners in Stanhope borough
The median family income in Stanhope borough is $130,329, with families comprising 3+ earners (151) having the highest median family income of $175,050, while families with 1 earner (163) have the lowest median family income of $69,740, accounting for 15.3% and 16.5% of families, respectively.
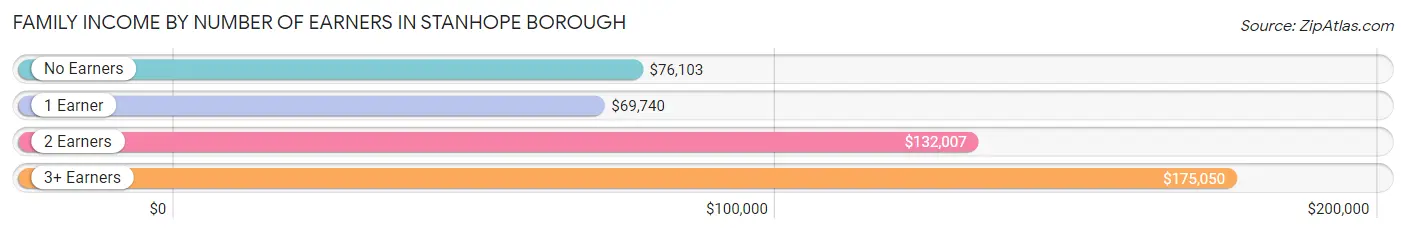
| Number of Earners | # Families | Median Income |
| No Earners | 89 (9.0%) | $76,103 |
| 1 Earner | 163 (16.5%) | $69,740 |
| 2 Earners | 583 (59.1%) | $132,007 |
| 3+ Earners | 151 (15.3%) | $175,050 |
| Total | 986 (100.0%) | $130,329 |
Household Income in Stanhope borough
Household Income Brackets in Stanhope borough
With 368 households falling in the category, the $100,000 to $149,999 income range is the most frequent in Stanhope borough, accounting for 29.1% of all households.
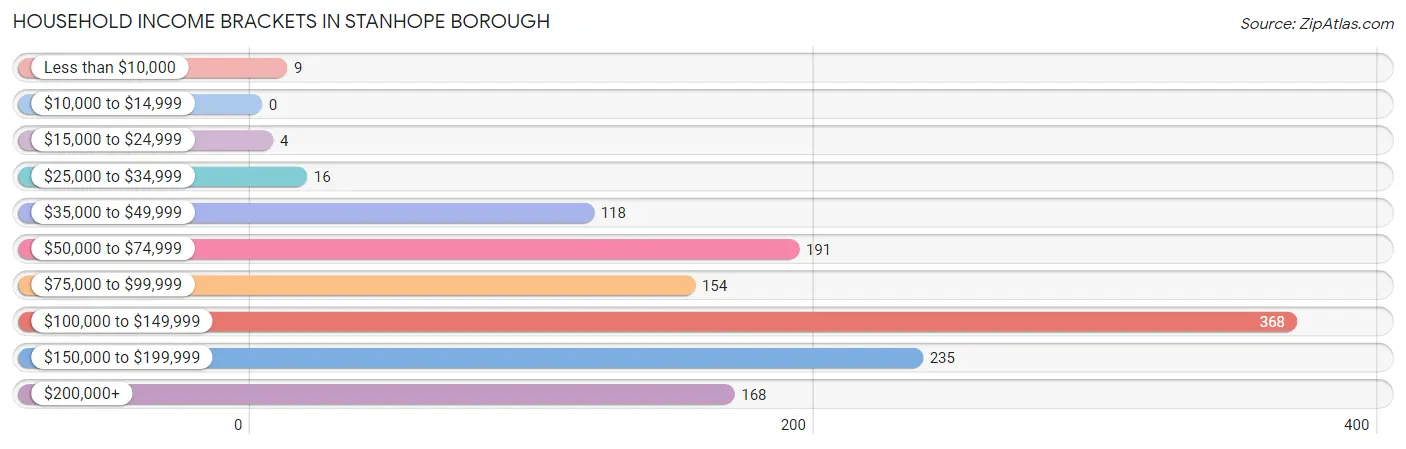
| Income Bracket | # Households | % Households |
| Less than $10,000 | 9 | 0.7% |
| $10,000 to $14,999 | 0 | 0.0% |
| $15,000 to $24,999 | 4 | 0.3% |
| $25,000 to $34,999 | 16 | 1.3% |
| $35,000 to $49,999 | 118 | 9.3% |
| $50,000 to $74,999 | 191 | 15.1% |
| $75,000 to $99,999 | 154 | 12.2% |
| $100,000 to $149,999 | 368 | 29.1% |
| $150,000 to $199,999 | 235 | 18.6% |
| $200,000+ | 168 | 13.3% |
Household Income by Householder Age in Stanhope borough
The median household income in Stanhope borough is $125,938, with the highest median household income of $156,250 found in the 25 to 44 years age bracket for the primary householder. A total of 359 households (28.4%) fall into this category.
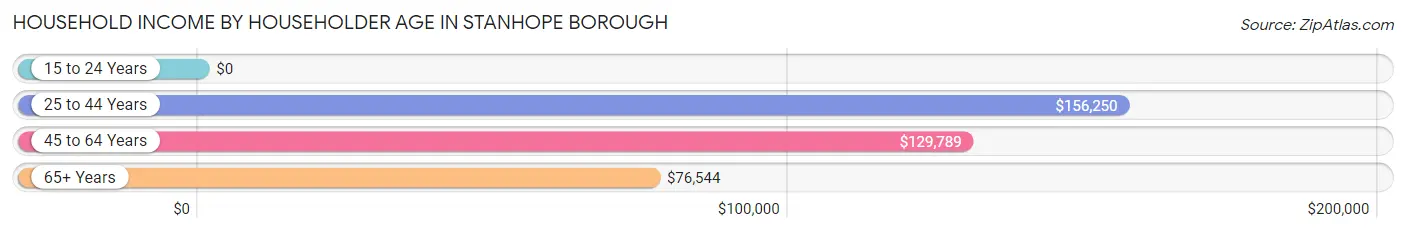
| Income Bracket | # Households | Median Income |
| 15 to 24 Years | 0 (0.0%) | $0 |
| 25 to 44 Years | 359 (28.4%) | $156,250 |
| 45 to 64 Years | 622 (49.1%) | $129,789 |
| 65+ Years | 285 (22.5%) | $76,544 |
| Total | 1,266 (100.0%) | $125,938 |
Poverty in Stanhope borough
Income Below Poverty by Sex and Age in Stanhope borough
With 2.4% poverty level for males and 0.7% for females among the residents of Stanhope borough, 16 and 17 year old males and 6 to 11 year old females are the most vulnerable to poverty, with 18 males (16.8%) and 4 females (4.3%) in their respective age groups living below the poverty level.
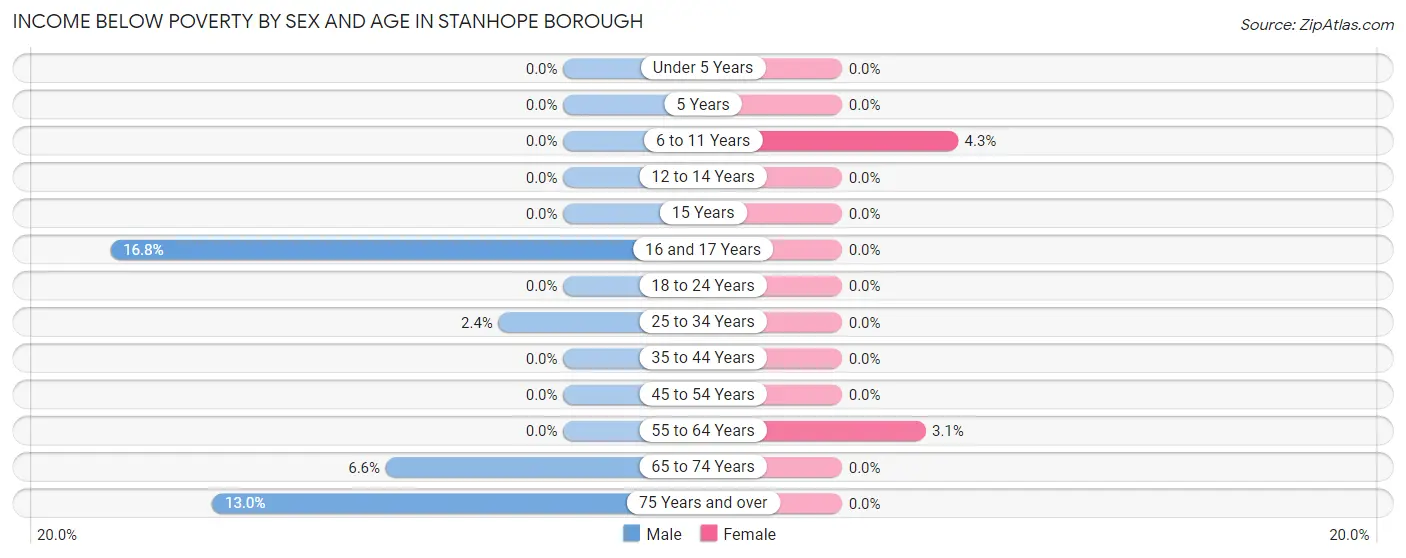
| Age Bracket | Male | Female |
| Under 5 Years | 0 (0.0%) | 0 (0.0%) |
| 5 Years | 0 (0.0%) | 0 (0.0%) |
| 6 to 11 Years | 0 (0.0%) | 4 (4.3%) |
| 12 to 14 Years | 0 (0.0%) | 0 (0.0%) |
| 15 Years | 0 (0.0%) | 0 (0.0%) |
| 16 and 17 Years | 18 (16.8%) | 0 (0.0%) |
| 18 to 24 Years | 0 (0.0%) | 0 (0.0%) |
| 25 to 34 Years | 5 (2.4%) | 0 (0.0%) |
| 35 to 44 Years | 0 (0.0%) | 0 (0.0%) |
| 45 to 54 Years | 0 (0.0%) | 0 (0.0%) |
| 55 to 64 Years | 0 (0.0%) | 9 (3.1%) |
| 65 to 74 Years | 11 (6.6%) | 0 (0.0%) |
| 75 Years and over | 6 (13.0%) | 0 (0.0%) |
| Total | 40 (2.4%) | 13 (0.7%) |
Income Above Poverty by Sex and Age in Stanhope borough
According to the poverty statistics in Stanhope borough, males aged under 5 years and females aged under 5 years are the age groups that are most secure financially, with 100.0% of males and 100.0% of females in these age groups living above the poverty line.
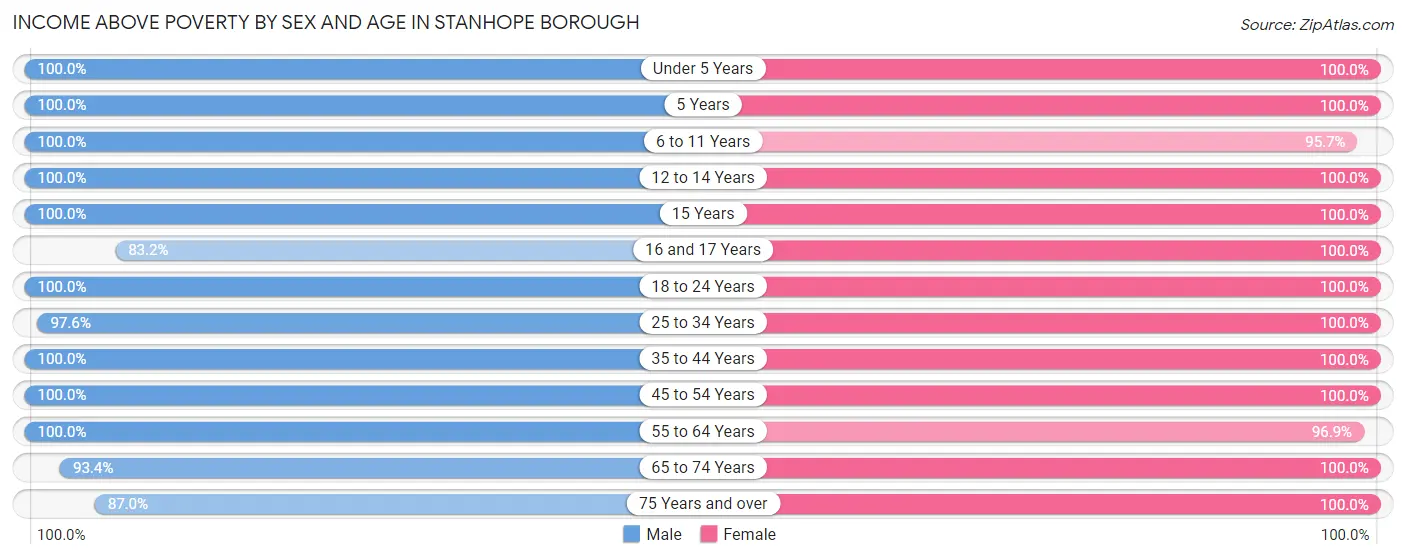
| Age Bracket | Male | Female |
| Under 5 Years | 68 (100.0%) | 201 (100.0%) |
| 5 Years | 26 (100.0%) | 23 (100.0%) |
| 6 to 11 Years | 132 (100.0%) | 89 (95.7%) |
| 12 to 14 Years | 54 (100.0%) | 85 (100.0%) |
| 15 Years | 33 (100.0%) | 33 (100.0%) |
| 16 and 17 Years | 89 (83.2%) | 14 (100.0%) |
| 18 to 24 Years | 124 (100.0%) | 146 (100.0%) |
| 25 to 34 Years | 203 (97.6%) | 170 (100.0%) |
| 35 to 44 Years | 279 (100.0%) | 215 (100.0%) |
| 45 to 54 Years | 243 (100.0%) | 326 (100.0%) |
| 55 to 64 Years | 196 (100.0%) | 282 (96.9%) |
| 65 to 74 Years | 156 (93.4%) | 157 (100.0%) |
| 75 Years and over | 40 (87.0%) | 82 (100.0%) |
| Total | 1,643 (97.6%) | 1,823 (99.3%) |
Income Below Poverty Among Married-Couple Families in Stanhope borough
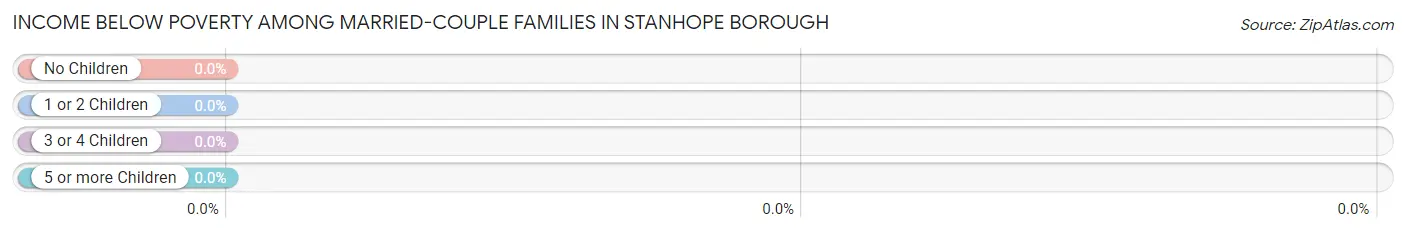
| Children | Above Poverty | Below Poverty |
| No Children | 385 (100.0%) | 0 (0.0%) |
| 1 or 2 Children | 247 (100.0%) | 0 (0.0%) |
| 3 or 4 Children | 36 (100.0%) | 0 (0.0%) |
| 5 or more Children | 0 (0.0%) | 0 (0.0%) |
| Total | 668 (100.0%) | 0 (0.0%) |
Income Below Poverty Among Single-Parent Households in Stanhope borough
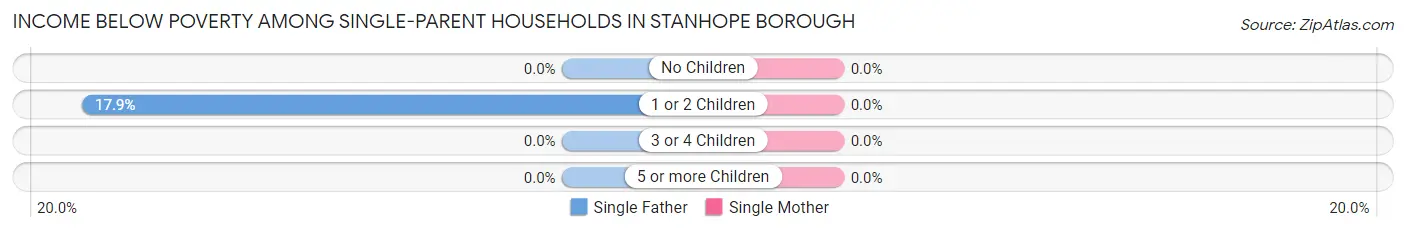
| Children | Single Father | Single Mother |
| No Children | 0 (0.0%) | 0 (0.0%) |
| 1 or 2 Children | 5 (17.9%) | 0 (0.0%) |
| 3 or 4 Children | 0 (0.0%) | 0 (0.0%) |
| 5 or more Children | 0 (0.0%) | 0 (0.0%) |
| Total | 5 (6.3%) | 0 (0.0%) |
Income Below Poverty Among Married-Couple vs Single-Parent Households in Stanhope borough
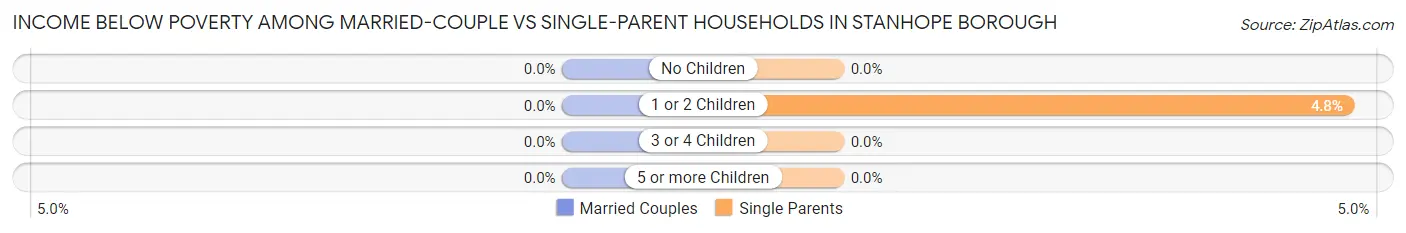
| Children | Married-Couple Families | Single-Parent Households |
| No Children | 0 (0.0%) | 0 (0.0%) |
| 1 or 2 Children | 0 (0.0%) | 5 (4.8%) |
| 3 or 4 Children | 0 (0.0%) | 0 (0.0%) |
| 5 or more Children | 0 (0.0%) | 0 (0.0%) |
| Total | 0 (0.0%) | 5 (1.6%) |
Race in Stanhope borough
The most populous races in Stanhope borough are White / Caucasian (3,076 | 87.1%), Two or more Races (320 | 9.1%), and Hispanic or Latino (278 | 7.9%).
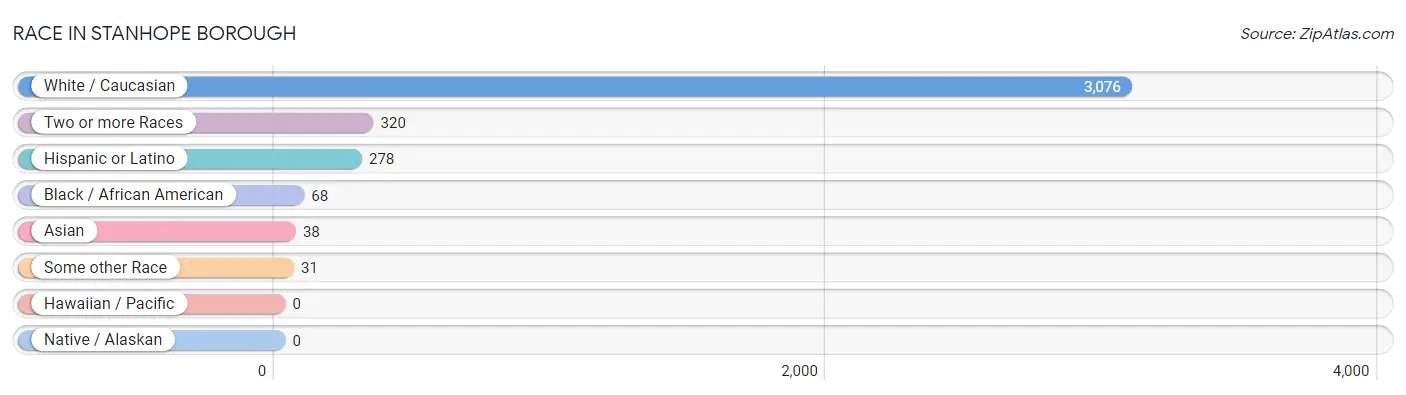
| Race | # Population | % Population |
| Asian | 38 | 1.1% |
| Black / African American | 68 | 1.9% |
| Hawaiian / Pacific | 0 | 0.0% |
| Hispanic or Latino | 278 | 7.9% |
| Native / Alaskan | 0 | 0.0% |
| White / Caucasian | 3,076 | 87.1% |
| Two or more Races | 320 | 9.1% |
| Some other Race | 31 | 0.9% |
| Total | 3,533 | 100.0% |
Ancestry in Stanhope borough
The most populous ancestries reported in Stanhope borough are Italian (1,150 | 32.6%), Irish (878 | 24.8%), German (785 | 22.2%), English (291 | 8.2%), and American (192 | 5.4%), together accounting for 93.3% of all Stanhope borough residents.
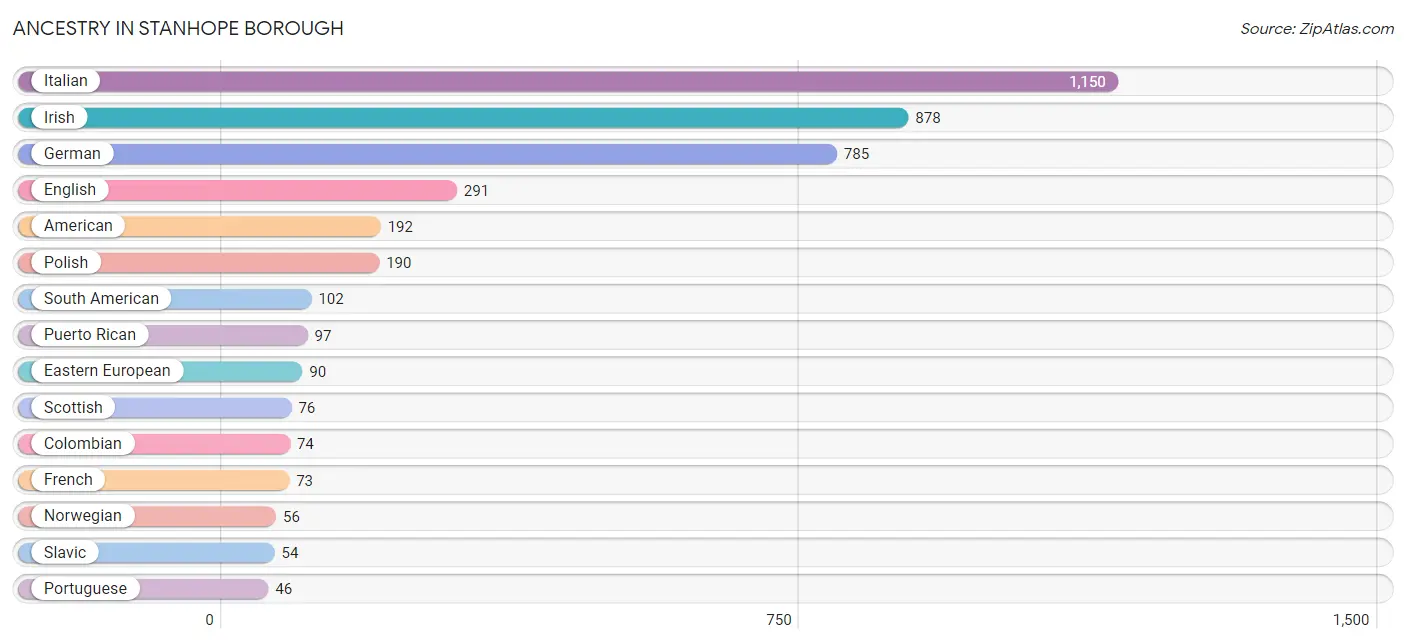
| Ancestry | # Population | % Population |
| African | 8 | 0.2% |
| American | 192 | 5.4% |
| Argentinean | 11 | 0.3% |
| Basque | 9 | 0.3% |
| Burmese | 45 | 1.3% |
| Canadian | 8 | 0.2% |
| Celtic | 9 | 0.3% |
| Central American | 29 | 0.8% |
| Colombian | 74 | 2.1% |
| Costa Rican | 29 | 0.8% |
| Dominican | 13 | 0.4% |
| Dutch | 25 | 0.7% |
| Eastern European | 90 | 2.5% |
| English | 291 | 8.2% |
| Filipino | 5 | 0.1% |
| French | 73 | 2.1% |
| French Canadian | 26 | 0.7% |
| German | 785 | 22.2% |
| Hungarian | 40 | 1.1% |
| Indian (Asian) | 32 | 0.9% |
| Irish | 878 | 24.8% |
| Italian | 1,150 | 32.6% |
| Mexican | 12 | 0.3% |
| Norwegian | 56 | 1.6% |
| Peruvian | 17 | 0.5% |
| Polish | 190 | 5.4% |
| Portuguese | 46 | 1.3% |
| Puerto Rican | 97 | 2.8% |
| Romanian | 24 | 0.7% |
| Russian | 46 | 1.3% |
| Scotch-Irish | 7 | 0.2% |
| Scottish | 76 | 2.1% |
| Slavic | 54 | 1.5% |
| South American | 102 | 2.9% |
| Spaniard | 25 | 0.7% |
| Subsaharan African | 8 | 0.2% |
| Swedish | 25 | 0.7% |
| Swiss | 12 | 0.3% |
| Turkish | 32 | 0.9% |
| Ukrainian | 24 | 0.7% |
| Welsh | 11 | 0.3% |
| Yugoslavian | 6 | 0.2% | View All 42 Rows |
Immigrants in Stanhope borough
The most numerous immigrant groups reported in Stanhope borough came from Europe (136 | 3.8%), Latin America (80 | 2.3%), South America (56 | 1.6%), Eastern Europe (52 | 1.5%), and Northern Europe (52 | 1.5%), together accounting for 10.6% of all Stanhope borough residents.
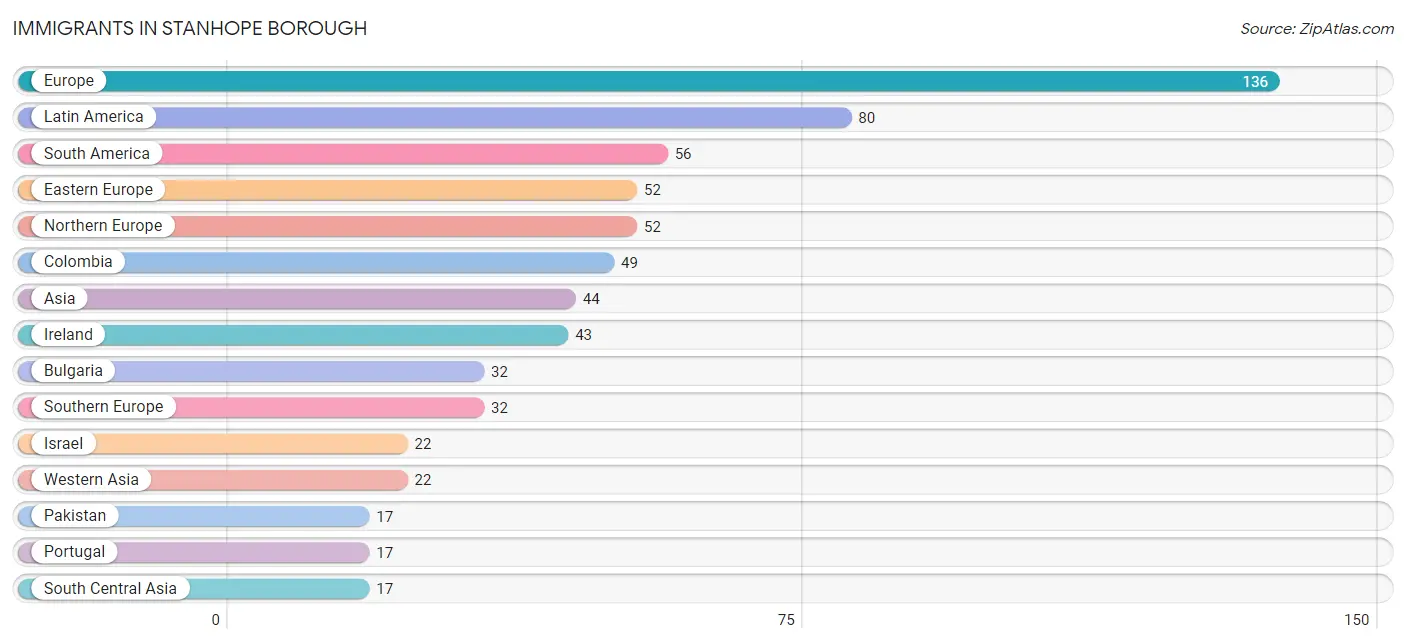
| Immigration Origin | # Population | % Population |
| Africa | 8 | 0.2% |
| Asia | 44 | 1.3% |
| Bosnia and Herzegovina | 6 | 0.2% |
| Bulgaria | 32 | 0.9% |
| Caribbean | 15 | 0.4% |
| Central America | 9 | 0.3% |
| China | 5 | 0.1% |
| Colombia | 49 | 1.4% |
| Costa Rica | 9 | 0.3% |
| Eastern Asia | 5 | 0.1% |
| Eastern Europe | 52 | 1.5% |
| England | 9 | 0.3% |
| Europe | 136 | 3.8% |
| Ireland | 43 | 1.2% |
| Israel | 22 | 0.6% |
| Italy | 15 | 0.4% |
| Jamaica | 15 | 0.4% |
| Latin America | 80 | 2.3% |
| Nigeria | 8 | 0.2% |
| Northern Europe | 52 | 1.5% |
| Pakistan | 17 | 0.5% |
| Peru | 7 | 0.2% |
| Portugal | 17 | 0.5% |
| South America | 56 | 1.6% |
| South Central Asia | 17 | 0.5% |
| Southern Europe | 32 | 0.9% |
| Taiwan | 5 | 0.1% |
| Ukraine | 14 | 0.4% |
| Western Africa | 8 | 0.2% |
| Western Asia | 22 | 0.6% | View All 30 Rows |
Sex and Age in Stanhope borough
Sex and Age in Stanhope borough
The most populous age groups in Stanhope borough are 15 to 19 Years (168 | 9.9%) for men and Under 5 Years (201 | 11.0%) for women.
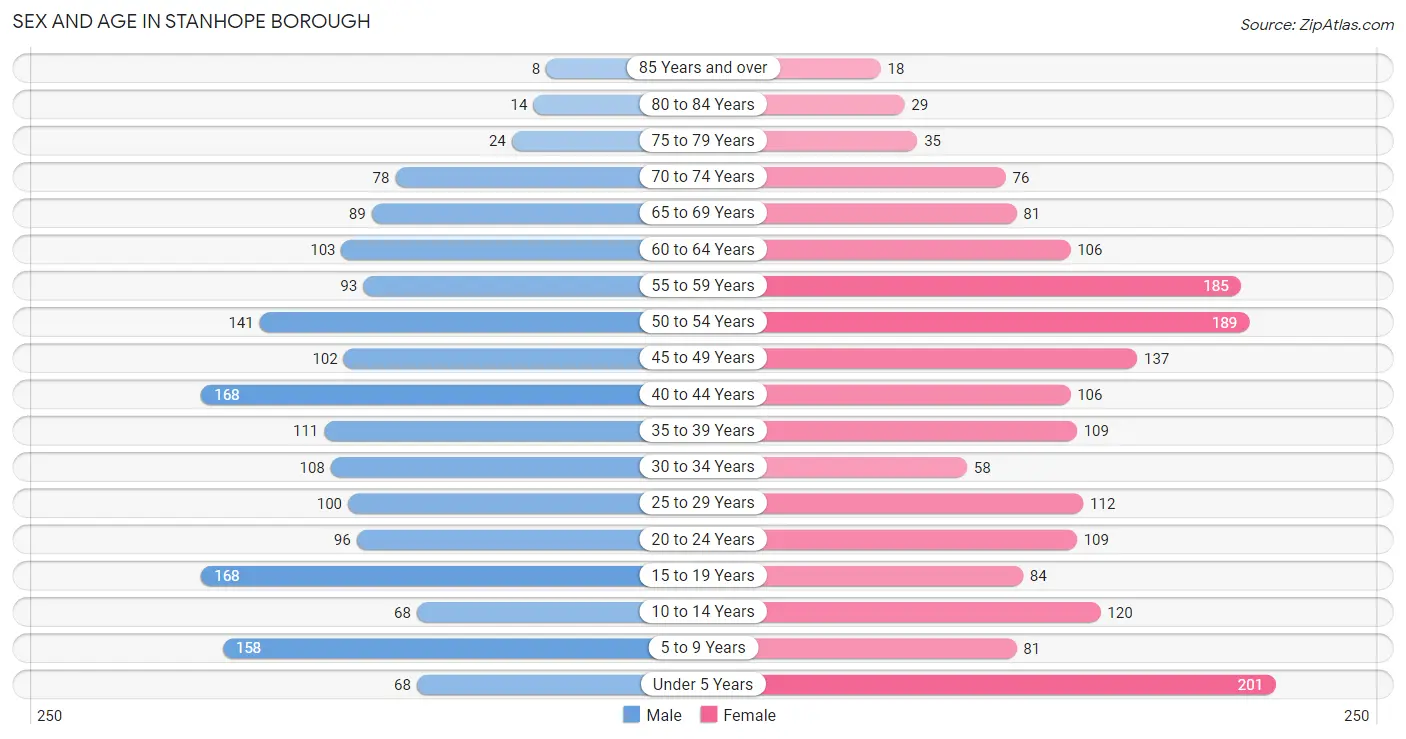
| Age Bracket | Male | Female |
| Under 5 Years | 68 (4.0%) | 201 (11.0%) |
| 5 to 9 Years | 158 (9.3%) | 81 (4.4%) |
| 10 to 14 Years | 68 (4.0%) | 120 (6.5%) |
| 15 to 19 Years | 168 (9.9%) | 84 (4.6%) |
| 20 to 24 Years | 96 (5.7%) | 109 (5.9%) |
| 25 to 29 Years | 100 (5.9%) | 112 (6.1%) |
| 30 to 34 Years | 108 (6.4%) | 58 (3.2%) |
| 35 to 39 Years | 111 (6.5%) | 109 (5.9%) |
| 40 to 44 Years | 168 (9.9%) | 106 (5.8%) |
| 45 to 49 Years | 102 (6.0%) | 137 (7.5%) |
| 50 to 54 Years | 141 (8.3%) | 189 (10.3%) |
| 55 to 59 Years | 93 (5.5%) | 185 (10.1%) |
| 60 to 64 Years | 103 (6.1%) | 106 (5.8%) |
| 65 to 69 Years | 89 (5.2%) | 81 (4.4%) |
| 70 to 74 Years | 78 (4.6%) | 76 (4.1%) |
| 75 to 79 Years | 24 (1.4%) | 35 (1.9%) |
| 80 to 84 Years | 14 (0.8%) | 29 (1.6%) |
| 85 Years and over | 8 (0.5%) | 18 (1.0%) |
| Total | 1,697 (100.0%) | 1,836 (100.0%) |
Families and Households in Stanhope borough
Median Family Size in Stanhope borough
The median family size in Stanhope borough is 3.15 persons per family, with single male/father families (79 | 8.0%) accounting for the largest median family size of 3.95 persons per family. On the other hand, single female/mother families (239 | 24.2%) represent the smallest median family size with 2.83 persons per family.
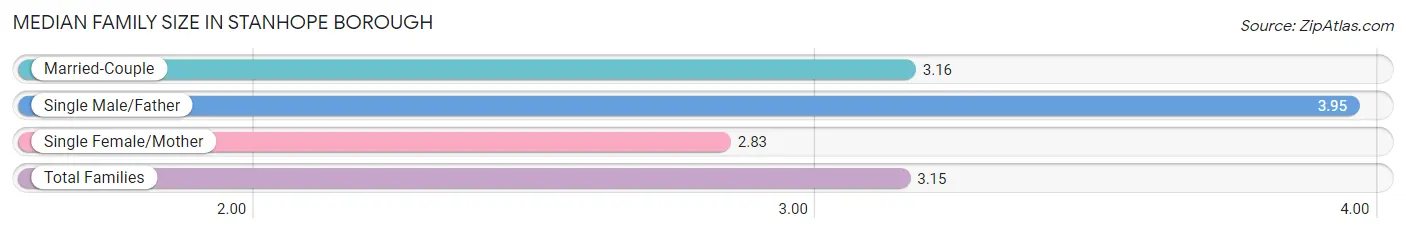
| Family Type | # Families | Family Size |
| Married-Couple | 668 (67.7%) | 3.16 |
| Single Male/Father | 79 (8.0%) | 3.95 |
| Single Female/Mother | 239 (24.2%) | 2.83 |
| Total Families | 986 (100.0%) | 3.15 |
Median Household Size in Stanhope borough
The median household size in Stanhope borough is 2.78 persons per household, with single male/father households (79 | 6.2%) accounting for the largest median household size of 3.96 persons per household. non-family households (280 | 22.1%) represent the smallest median household size with 1.49 persons per household.
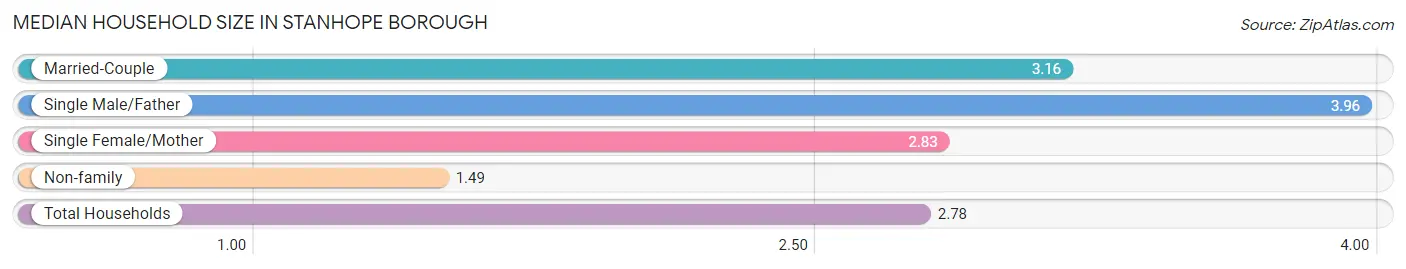
| Household Type | # Households | Household Size |
| Married-Couple | 668 (52.8%) | 3.16 |
| Single Male/Father | 79 (6.2%) | 3.96 |
| Single Female/Mother | 239 (18.9%) | 2.83 |
| Non-family | 280 (22.1%) | 1.49 |
| Total Households | 1,266 (100.0%) | 2.78 |
Household Size by Marriage Status in Stanhope borough
Out of a total of 1,266 households in Stanhope borough, 986 (77.9%) are family households, while 280 (22.1%) are nonfamily households. The most numerous type of family households are 2-person households, comprising 446, and the most common type of nonfamily households are 1-person households, comprising 193.
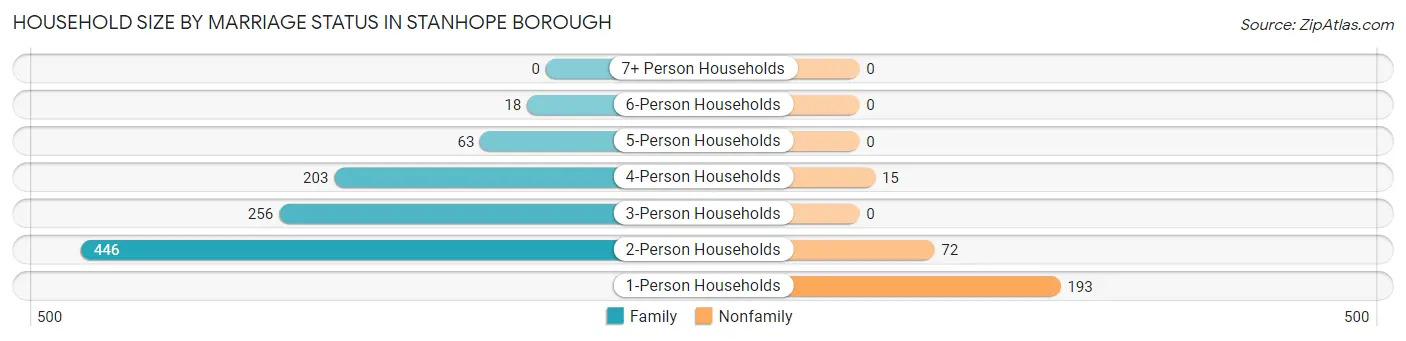
| Household Size | Family Households | Nonfamily Households |
| 1-Person Households | - | 193 (15.2%) |
| 2-Person Households | 446 (35.2%) | 72 (5.7%) |
| 3-Person Households | 256 (20.2%) | 0 (0.0%) |
| 4-Person Households | 203 (16.0%) | 15 (1.2%) |
| 5-Person Households | 63 (5.0%) | 0 (0.0%) |
| 6-Person Households | 18 (1.4%) | 0 (0.0%) |
| 7+ Person Households | 0 (0.0%) | 0 (0.0%) |
| Total | 986 (77.9%) | 280 (22.1%) |
Female Fertility in Stanhope borough
Fertility by Age in Stanhope borough
Average fertility rate in Stanhope borough is 74.0 births per 1,000 women. Women in the age bracket of 35 to 50 years have the highest fertility rate with 139.0 births per 1,000 women. Women in the age bracket of 35 to 50 years acount for 100.0% of all women with births.
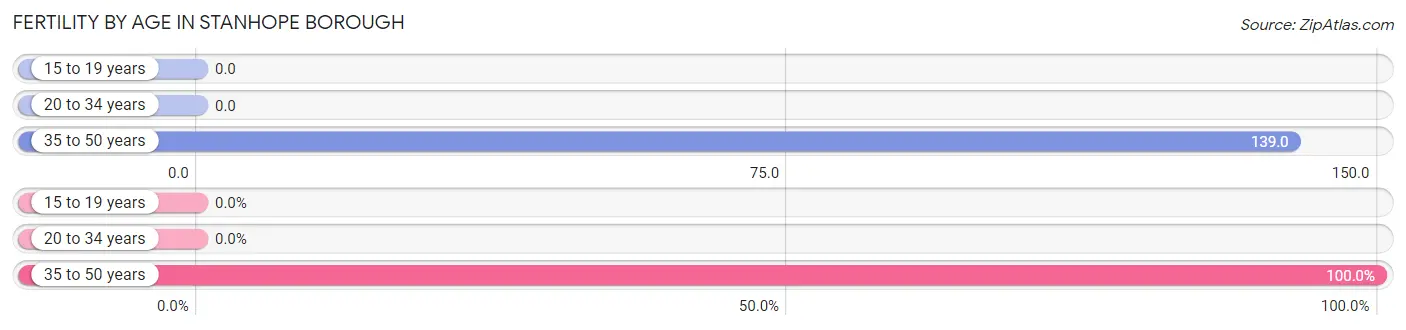
| Age Bracket | Women with Births | Births / 1,000 Women |
| 15 to 19 years | 0 (0.0%) | 0.0 |
| 20 to 34 years | 0 (0.0%) | 0.0 |
| 35 to 50 years | 57 (100.0%) | 139.0 |
| Total | 57 (100.0%) | 74.0 |
Fertility by Age by Marriage Status in Stanhope borough
78.9% of women with births (57) in Stanhope borough are married. The highest percentage of unmarried women with births falls into 35 to 50 years age bracket with 21.0% of them unmarried at the time of birth, while the lowest percentage of unmarried women with births belong to 35 to 50 years age bracket with 21.1% of them unmarried.
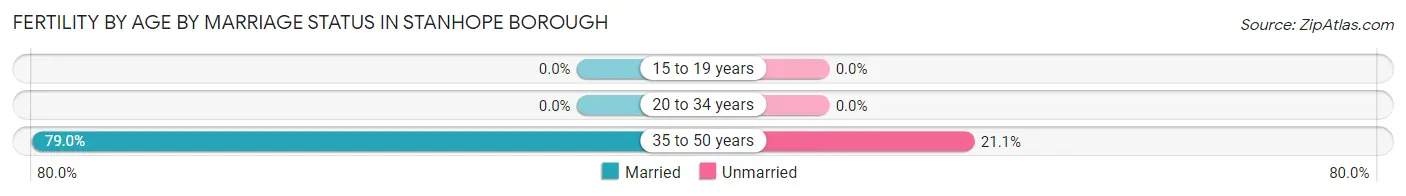
| Age Bracket | Married | Unmarried |
| 15 to 19 years | 0 (0.0%) | 0 (0.0%) |
| 20 to 34 years | 0 (0.0%) | 0 (0.0%) |
| 35 to 50 years | 45 (78.9%) | 12 (21.0%) |
| Total | 45 (78.9%) | 12 (21.0%) |
Fertility by Education in Stanhope borough
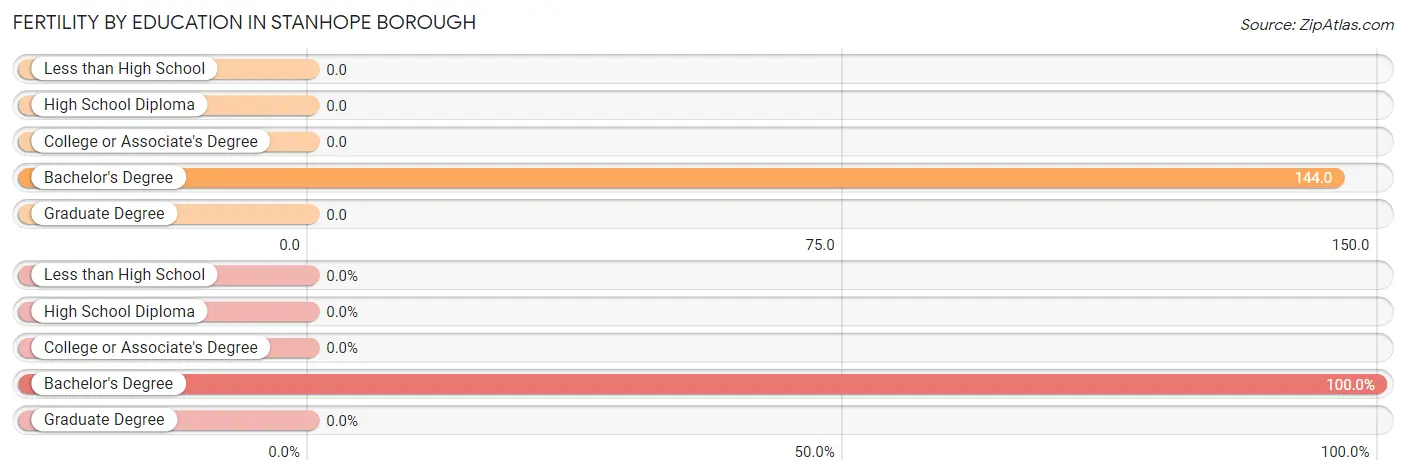
| Educational Attainment | Women with Births | Births / 1,000 Women |
| Less than High School | 0 (0.0%) | 0.0 |
| High School Diploma | 0 (0.0%) | 0.0 |
| College or Associate's Degree | 0 (0.0%) | 0.0 |
| Bachelor's Degree | 57 (100.0%) | 144.0 |
| Graduate Degree | 0 (0.0%) | 0.0 |
| Total | 57 (100.0%) | 74.0 |
Fertility by Education by Marriage Status in Stanhope borough
21.0% of women with births in Stanhope borough are unmarried. Women with the educational attainment of bachelor's degree are most likely to be married with 78.9% of them married at childbirth, while women with the educational attainment of bachelor's degree are least likely to be married with 21.0% of them unmarried at childbirth.
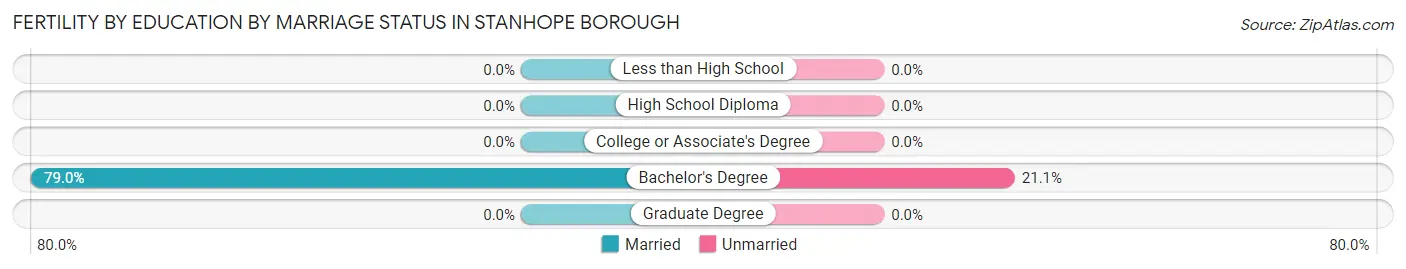
| Educational Attainment | Married | Unmarried |
| Less than High School | 0 (0.0%) | 0 (0.0%) |
| High School Diploma | 0 (0.0%) | 0 (0.0%) |
| College or Associate's Degree | 0 (0.0%) | 0 (0.0%) |
| Bachelor's Degree | 45 (78.9%) | 12 (21.0%) |
| Graduate Degree | 0 (0.0%) | 0 (0.0%) |
| Total | 45 (78.9%) | 12 (21.0%) |
Employment Characteristics in Stanhope borough
Employment by Class of Employer in Stanhope borough
Among the 2,119 employed individuals in Stanhope borough, private company employees (1,465 | 69.1%), local government employees (293 | 13.8%), and self-employed (not incorporated) (98 | 4.6%) make up the most common classes of employment.
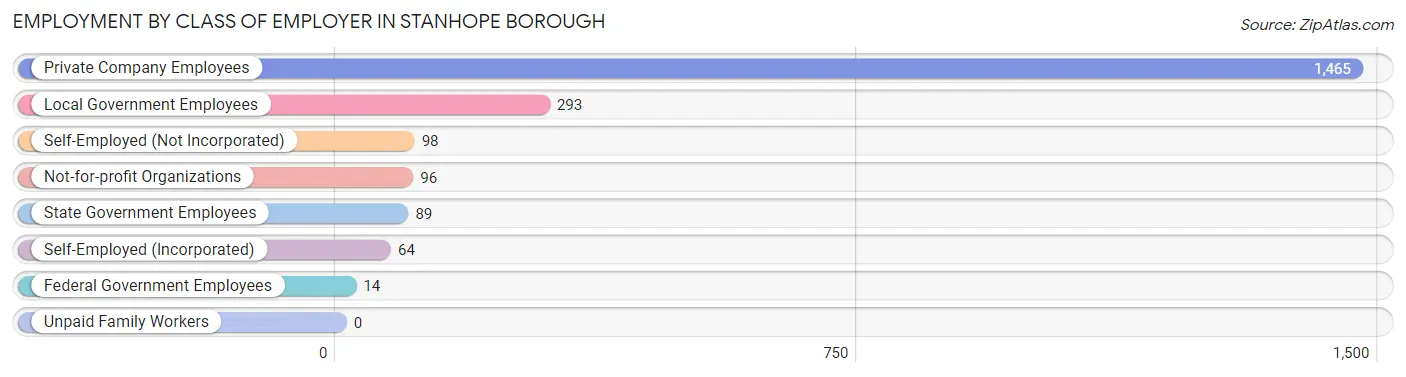
| Employer Class | # Employees | % Employees |
| Private Company Employees | 1,465 | 69.1% |
| Self-Employed (Incorporated) | 64 | 3.0% |
| Self-Employed (Not Incorporated) | 98 | 4.6% |
| Not-for-profit Organizations | 96 | 4.5% |
| Local Government Employees | 293 | 13.8% |
| State Government Employees | 89 | 4.2% |
| Federal Government Employees | 14 | 0.7% |
| Unpaid Family Workers | 0 | 0.0% |
| Total | 2,119 | 100.0% |
Employment Status by Age in Stanhope borough
According to the labor force statistics for Stanhope borough, out of the total population over 16 years of age (2,771), 79.3% or 2,197 individuals are in the labor force, with 3.2% or 70 of them unemployed. The age group with the highest labor force participation rate is 25 to 29 years, with 100.0% or 212 individuals in the labor force. Within the labor force, the 65 to 74 years age range has the highest percentage of unemployed individuals, with 14.4% or 17 of them being unemployed.
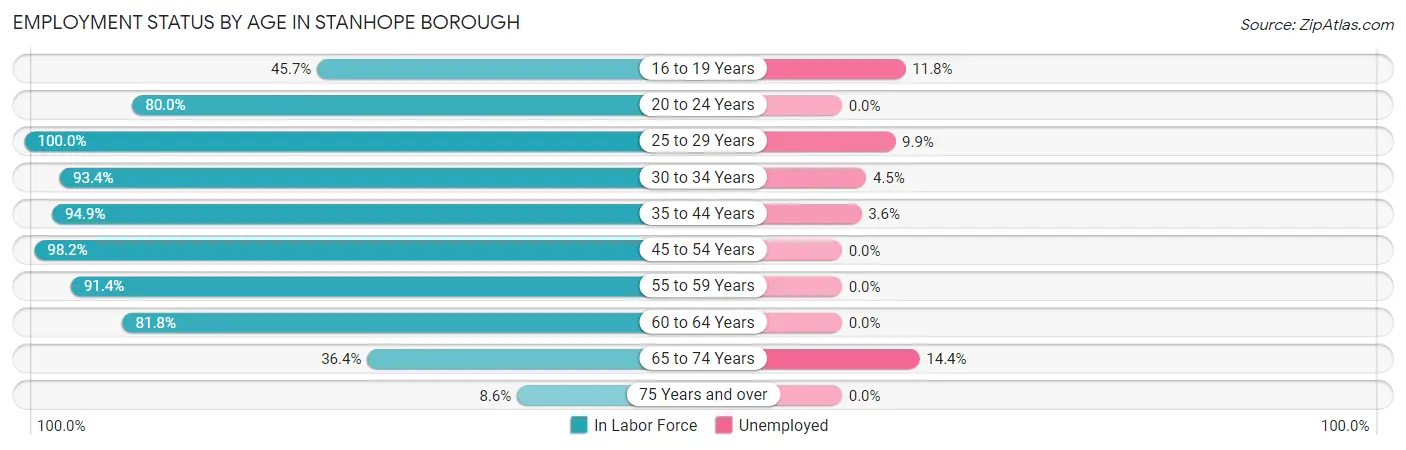
| Age Bracket | In Labor Force | Unemployed |
| 16 to 19 Years | 85 (45.7%) | 10 (11.8%) |
| 20 to 24 Years | 164 (80.0%) | 0 (0.0%) |
| 25 to 29 Years | 212 (100.0%) | 21 (9.9%) |
| 30 to 34 Years | 155 (93.4%) | 7 (4.5%) |
| 35 to 44 Years | 469 (94.9%) | 17 (3.6%) |
| 45 to 54 Years | 559 (98.2%) | 0 (0.0%) |
| 55 to 59 Years | 254 (91.4%) | 0 (0.0%) |
| 60 to 64 Years | 171 (81.8%) | 0 (0.0%) |
| 65 to 74 Years | 118 (36.4%) | 17 (14.4%) |
| 75 Years and over | 11 (8.6%) | 0 (0.0%) |
| Total | 2,197 (79.3%) | 70 (3.2%) |
Employment Status by Educational Attainment in Stanhope borough
According to labor force statistics for Stanhope borough, 94.4% of individuals (1,820) out of the total population between 25 and 64 years of age (1,928) are in the labor force, with 2.5% or 46 of them being unemployed. The group with the highest labor force participation rate are those with the educational attainment of bachelor's degree or higher, with 98.4% or 852 individuals in the labor force. Within the labor force, individuals with less than high school education have the highest percentage of unemployment, with 23.3% or 20 of them being unemployed.
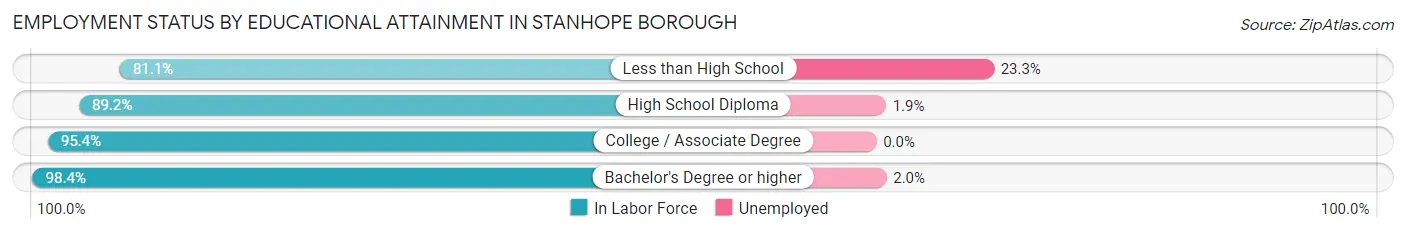
| Educational Attainment | In Labor Force | Unemployed |
| Less than High School | 86 (81.1%) | 25 (23.3%) |
| High School Diploma | 428 (89.2%) | 9 (1.9%) |
| College / Associate Degree | 454 (95.4%) | 0 (0.0%) |
| Bachelor's Degree or higher | 852 (98.4%) | 17 (2.0%) |
| Total | 1,820 (94.4%) | 48 (2.5%) |
Employment Occupations by Sex in Stanhope borough
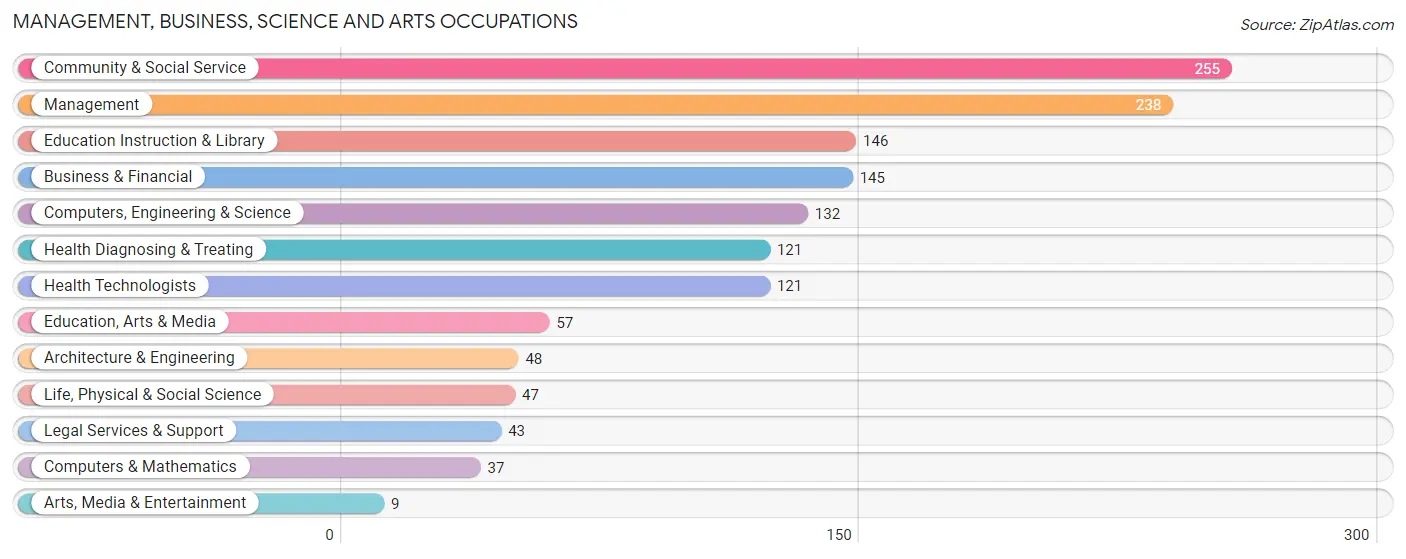
Management, Business, Science and Arts Occupations
The most common Management, Business, Science and Arts occupations in Stanhope borough are Community & Social Service (255 | 12.0%), Management (238 | 11.2%), Education Instruction & Library (146 | 6.9%), Business & Financial (145 | 6.9%), and Computers, Engineering & Science (132 | 6.2%).
Management, Business, Science and Arts Occupations by Sex
Within the Management, Business, Science and Arts occupations in Stanhope borough, the most male-oriented occupations are Architecture & Engineering (100.0%), Arts, Media & Entertainment (100.0%), and Computers & Mathematics (86.5%), while the most female-oriented occupations are Life, Physical & Social Science (100.0%), Health Diagnosing & Treating (100.0%), and Health Technologists (100.0%).
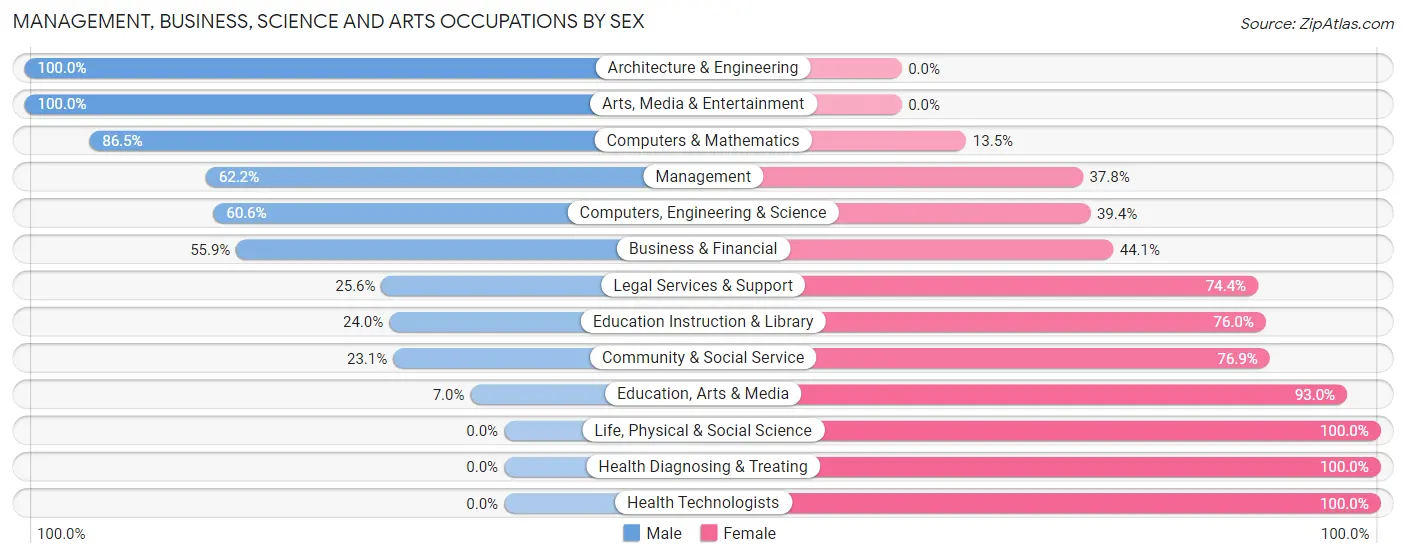
| Occupation | Male | Female |
| Management | 148 (62.2%) | 90 (37.8%) |
| Business & Financial | 81 (55.9%) | 64 (44.1%) |
| Computers, Engineering & Science | 80 (60.6%) | 52 (39.4%) |
| Computers & Mathematics | 32 (86.5%) | 5 (13.5%) |
| Architecture & Engineering | 48 (100.0%) | 0 (0.0%) |
| Life, Physical & Social Science | 0 (0.0%) | 47 (100.0%) |
| Community & Social Service | 59 (23.1%) | 196 (76.9%) |
| Education, Arts & Media | 4 (7.0%) | 53 (93.0%) |
| Legal Services & Support | 11 (25.6%) | 32 (74.4%) |
| Education Instruction & Library | 35 (24.0%) | 111 (76.0%) |
| Arts, Media & Entertainment | 9 (100.0%) | 0 (0.0%) |
| Health Diagnosing & Treating | 0 (0.0%) | 121 (100.0%) |
| Health Technologists | 0 (0.0%) | 121 (100.0%) |
| Total (Category) | 368 (41.3%) | 523 (58.7%) |
| Total (Overall) | 1,071 (50.6%) | 1,047 (49.4%) |
Services Occupations
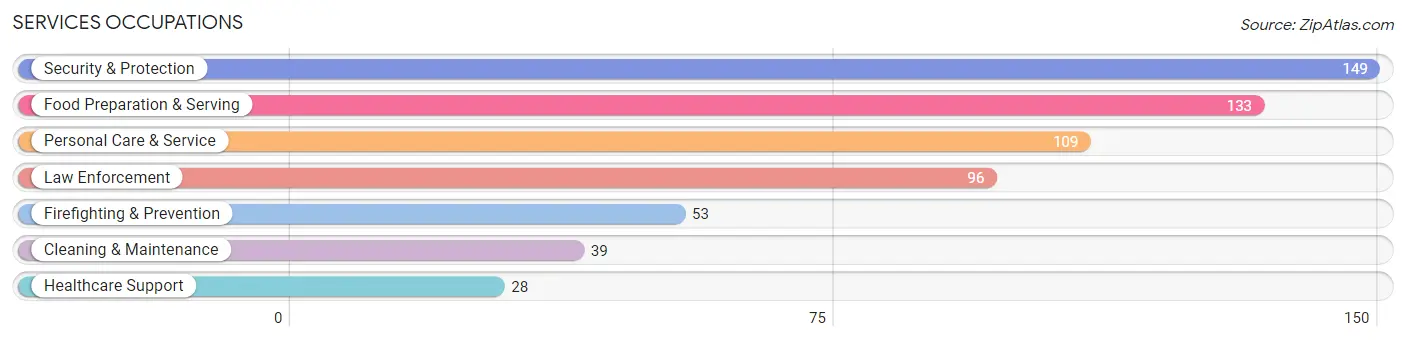
The most common Services occupations in Stanhope borough are Security & Protection (149 | 7.0%), Food Preparation & Serving (133 | 6.3%), Personal Care & Service (109 | 5.1%), Law Enforcement (96 | 4.5%), and Firefighting & Prevention (53 | 2.5%).
Services Occupations by Sex
Within the Services occupations in Stanhope borough, the most male-oriented occupations are Law Enforcement (100.0%), Cleaning & Maintenance (100.0%), and Security & Protection (72.5%), while the most female-oriented occupations are Healthcare Support (100.0%), Firefighting & Prevention (77.4%), and Personal Care & Service (42.2%).
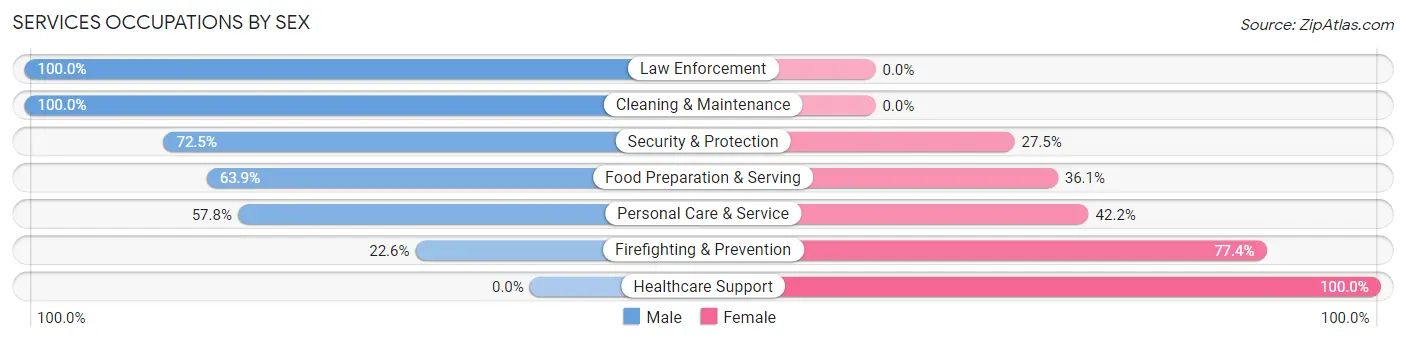
| Occupation | Male | Female |
| Healthcare Support | 0 (0.0%) | 28 (100.0%) |
| Security & Protection | 108 (72.5%) | 41 (27.5%) |
| Firefighting & Prevention | 12 (22.6%) | 41 (77.4%) |
| Law Enforcement | 96 (100.0%) | 0 (0.0%) |
| Food Preparation & Serving | 85 (63.9%) | 48 (36.1%) |
| Cleaning & Maintenance | 39 (100.0%) | 0 (0.0%) |
| Personal Care & Service | 63 (57.8%) | 46 (42.2%) |
| Total (Category) | 295 (64.4%) | 163 (35.6%) |
| Total (Overall) | 1,071 (50.6%) | 1,047 (49.4%) |
Sales and Office Occupations
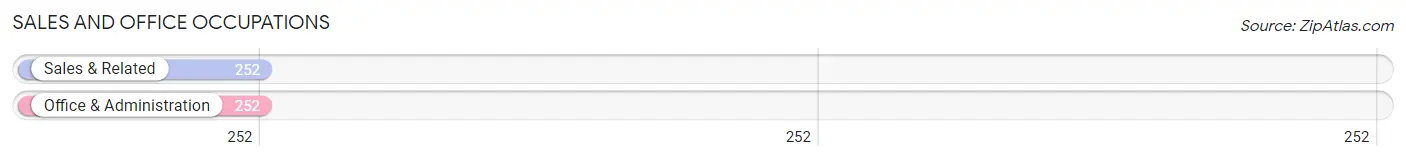
The most common Sales and Office occupations in Stanhope borough are Sales & Related (252 | 11.9%), and Office & Administration (252 | 11.9%).
Sales and Office Occupations by Sex
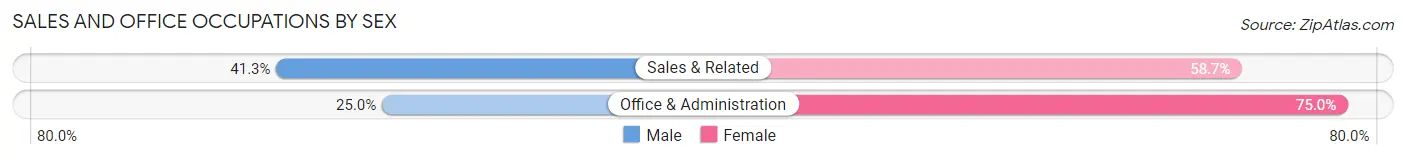
| Occupation | Male | Female |
| Sales & Related | 104 (41.3%) | 148 (58.7%) |
| Office & Administration | 63 (25.0%) | 189 (75.0%) |
| Total (Category) | 167 (33.1%) | 337 (66.9%) |
| Total (Overall) | 1,071 (50.6%) | 1,047 (49.4%) |
Natural Resources, Construction and Maintenance Occupations
The most common Natural Resources, Construction and Maintenance occupations in Stanhope borough are Construction & Extraction (147 | 6.9%), and Installation, Maintenance & Repair (31 | 1.5%).
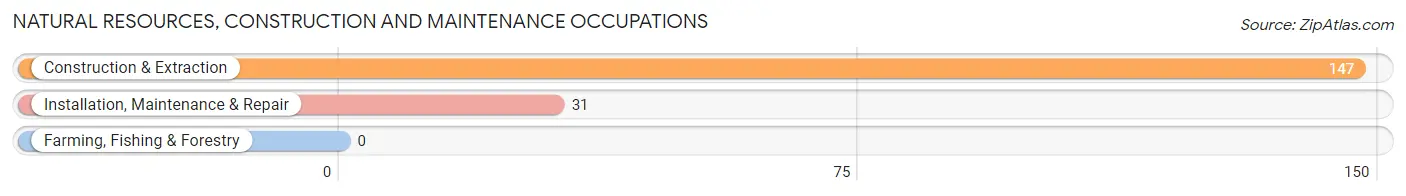
Natural Resources, Construction and Maintenance Occupations by Sex

| Occupation | Male | Female |
| Farming, Fishing & Forestry | 0 (0.0%) | 0 (0.0%) |
| Construction & Extraction | 147 (100.0%) | 0 (0.0%) |
| Installation, Maintenance & Repair | 31 (100.0%) | 0 (0.0%) |
| Total (Category) | 178 (100.0%) | 0 (0.0%) |
| Total (Overall) | 1,071 (50.6%) | 1,047 (49.4%) |
Production, Transportation and Moving Occupations
The most common Production, Transportation and Moving occupations in Stanhope borough are Production (35 | 1.7%), Transportation (26 | 1.2%), and Material Moving (26 | 1.2%).
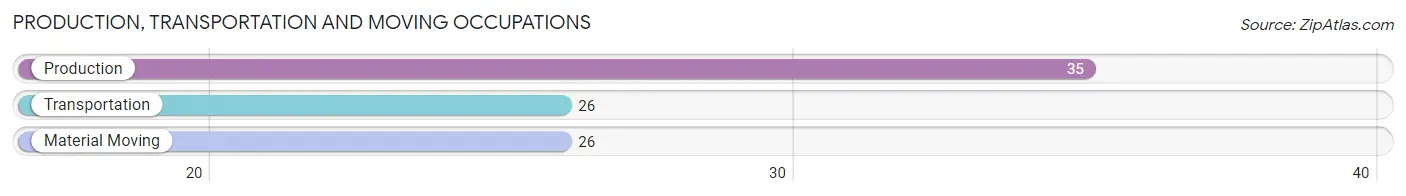
Production, Transportation and Moving Occupations by Sex
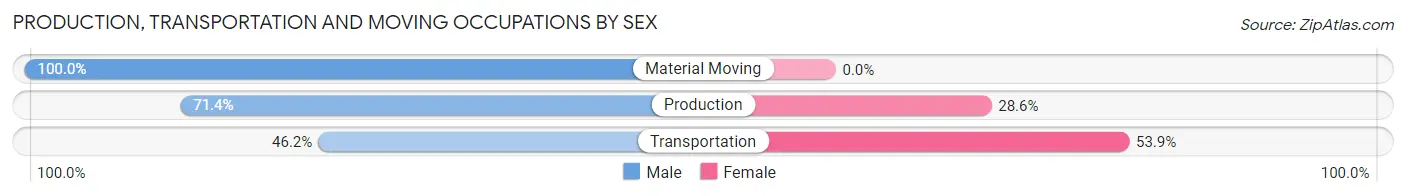
| Occupation | Male | Female |
| Production | 25 (71.4%) | 10 (28.6%) |
| Transportation | 12 (46.2%) | 14 (53.8%) |
| Material Moving | 26 (100.0%) | 0 (0.0%) |
| Total (Category) | 63 (72.4%) | 24 (27.6%) |
| Total (Overall) | 1,071 (50.6%) | 1,047 (49.4%) |
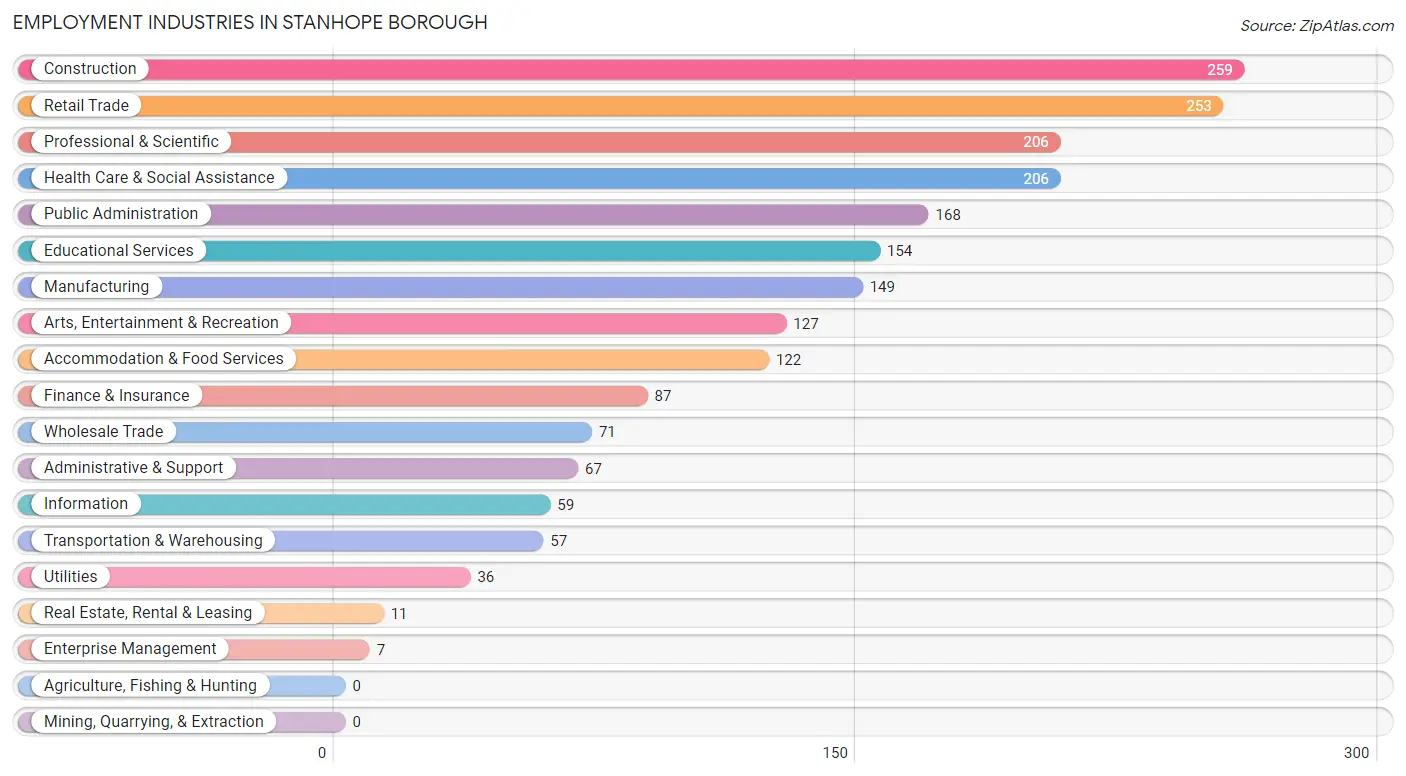
Employment Industries by Sex in Stanhope borough
Employment Industries in Stanhope borough
The major employment industries in Stanhope borough include Construction (259 | 12.2%), Retail Trade (253 | 11.9%), Professional & Scientific (206 | 9.7%), Health Care & Social Assistance (206 | 9.7%), and Public Administration (168 | 7.9%).
Employment Industries by Sex in Stanhope borough
The Stanhope borough industries that see more men than women are Utilities (100.0%), Administrative & Support (100.0%), and Construction (95.0%), whereas the industries that tend to have a higher number of women are Real Estate, Rental & Leasing (100.0%), Enterprise Management (100.0%), and Health Care & Social Assistance (97.1%).
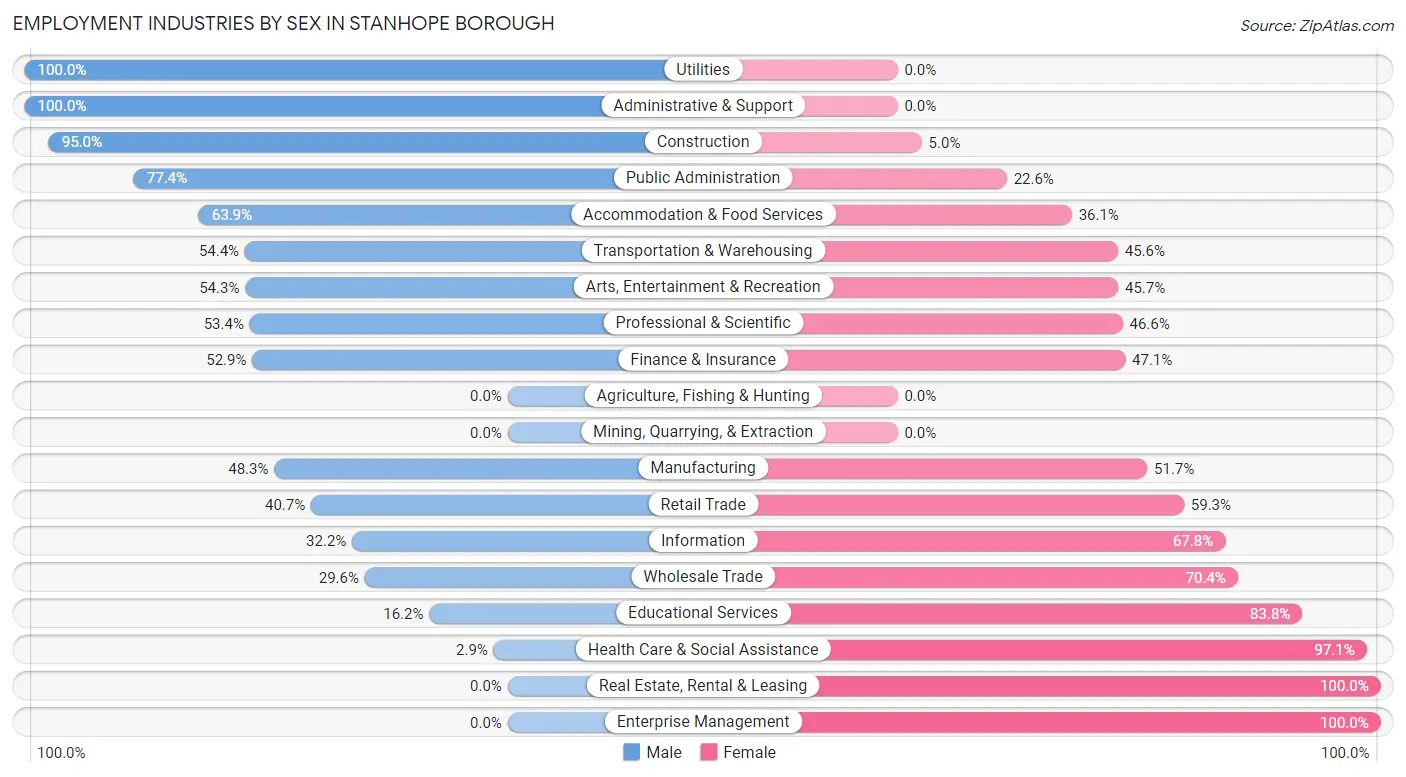
| Industry | Male | Female |
| Agriculture, Fishing & Hunting | 0 (0.0%) | 0 (0.0%) |
| Mining, Quarrying, & Extraction | 0 (0.0%) | 0 (0.0%) |
| Construction | 246 (95.0%) | 13 (5.0%) |
| Manufacturing | 72 (48.3%) | 77 (51.7%) |
| Wholesale Trade | 21 (29.6%) | 50 (70.4%) |
| Retail Trade | 103 (40.7%) | 150 (59.3%) |
| Transportation & Warehousing | 31 (54.4%) | 26 (45.6%) |
| Utilities | 36 (100.0%) | 0 (0.0%) |
| Information | 19 (32.2%) | 40 (67.8%) |
| Finance & Insurance | 46 (52.9%) | 41 (47.1%) |
| Real Estate, Rental & Leasing | 0 (0.0%) | 11 (100.0%) |
| Professional & Scientific | 110 (53.4%) | 96 (46.6%) |
| Enterprise Management | 0 (0.0%) | 7 (100.0%) |
| Administrative & Support | 67 (100.0%) | 0 (0.0%) |
| Educational Services | 25 (16.2%) | 129 (83.8%) |
| Health Care & Social Assistance | 6 (2.9%) | 200 (97.1%) |
| Arts, Entertainment & Recreation | 69 (54.3%) | 58 (45.7%) |
| Accommodation & Food Services | 78 (63.9%) | 44 (36.1%) |
| Public Administration | 130 (77.4%) | 38 (22.6%) |
| Total | 1,071 (50.6%) | 1,047 (49.4%) |
Education in Stanhope borough
School Enrollment in Stanhope borough
The most common levels of schooling among the 845 students in Stanhope borough are high school (226 | 26.8%), elementary school (172 | 20.4%), and middle school (166 | 19.6%).
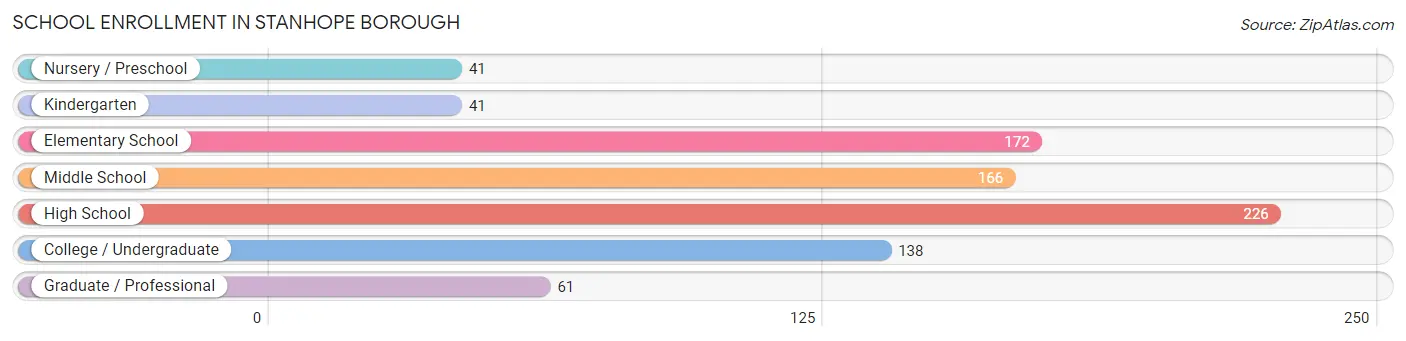
| School Level | # Students | % Students |
| Nursery / Preschool | 41 | 4.9% |
| Kindergarten | 41 | 4.9% |
| Elementary School | 172 | 20.4% |
| Middle School | 166 | 19.6% |
| High School | 226 | 26.8% |
| College / Undergraduate | 138 | 16.3% |
| Graduate / Professional | 61 | 7.2% |
| Total | 845 | 100.0% |
School Enrollment by Age by Funding Source in Stanhope borough
Out of a total of 845 students who are enrolled in schools in Stanhope borough, 83 (9.8%) attend a private institution, while the remaining 762 (90.2%) are enrolled in public schools. The age group of 3 to 4 year olds has the highest likelihood of being enrolled in private schools, with 8 (53.3% in the age bracket) enrolled. Conversely, the age group of 15 to 17 year olds has the lowest likelihood of being enrolled in a private school, with 187 (100.0% in the age bracket) attending a public institution.
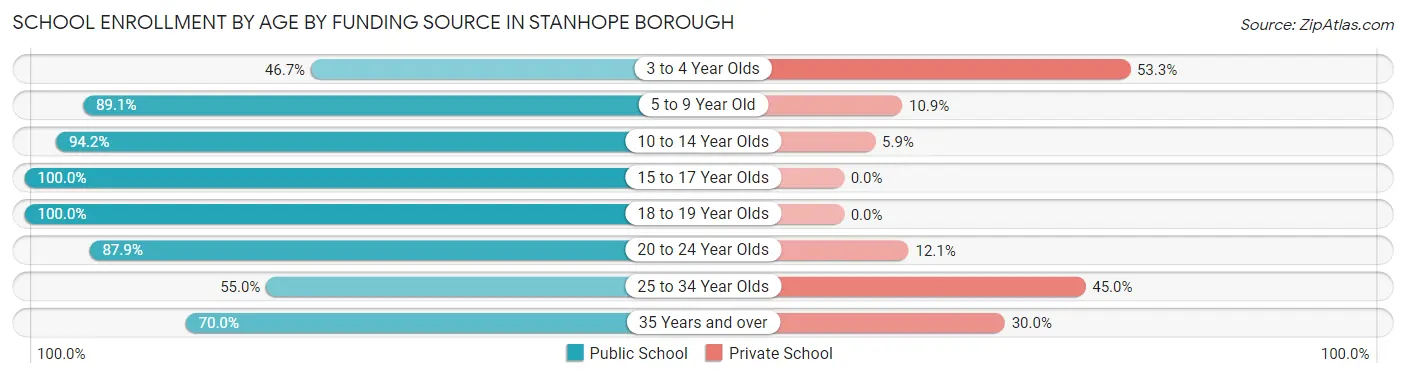
| Age Bracket | Public School | Private School |
| 3 to 4 Year Olds | 7 (46.7%) | 8 (53.3%) |
| 5 to 9 Year Old | 213 (89.1%) | 26 (10.9%) |
| 10 to 14 Year Olds | 177 (94.2%) | 11 (5.9%) |
| 15 to 17 Year Olds | 187 (100.0%) | 0 (0.0%) |
| 18 to 19 Year Olds | 55 (100.0%) | 0 (0.0%) |
| 20 to 24 Year Olds | 80 (87.9%) | 11 (12.1%) |
| 25 to 34 Year Olds | 22 (55.0%) | 18 (45.0%) |
| 35 Years and over | 21 (70.0%) | 9 (30.0%) |
| Total | 762 (90.2%) | 83 (9.8%) |
Educational Attainment by Field of Study in Stanhope borough
Business (232 | 22.6%), education (156 | 15.2%), social sciences (133 | 12.9%), science & technology (97 | 9.4%), and computers & mathematics (90 | 8.7%) are the most common fields of study among 1,029 individuals in Stanhope borough who have obtained a bachelor's degree or higher.
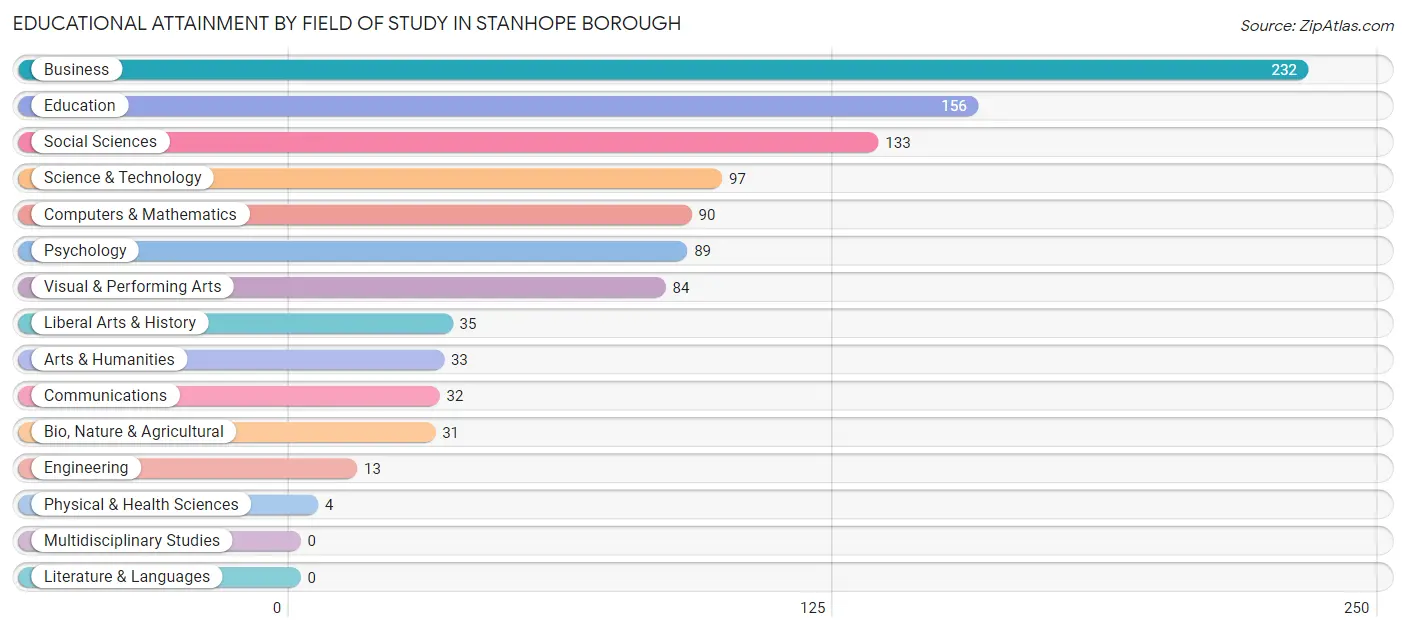
| Field of Study | # Graduates | % Graduates |
| Computers & Mathematics | 90 | 8.7% |
| Bio, Nature & Agricultural | 31 | 3.0% |
| Physical & Health Sciences | 4 | 0.4% |
| Psychology | 89 | 8.6% |
| Social Sciences | 133 | 12.9% |
| Engineering | 13 | 1.3% |
| Multidisciplinary Studies | 0 | 0.0% |
| Science & Technology | 97 | 9.4% |
| Business | 232 | 22.6% |
| Education | 156 | 15.2% |
| Literature & Languages | 0 | 0.0% |
| Liberal Arts & History | 35 | 3.4% |
| Visual & Performing Arts | 84 | 8.2% |
| Communications | 32 | 3.1% |
| Arts & Humanities | 33 | 3.2% |
| Total | 1,029 | 100.0% |
Transportation & Commute in Stanhope borough
Vehicle Availability by Sex in Stanhope borough
The most prevalent vehicle ownership categories in Stanhope borough are males with 2 vehicles (536, accounting for 50.2%) and females with 2 vehicles (506, making up 50.9%).
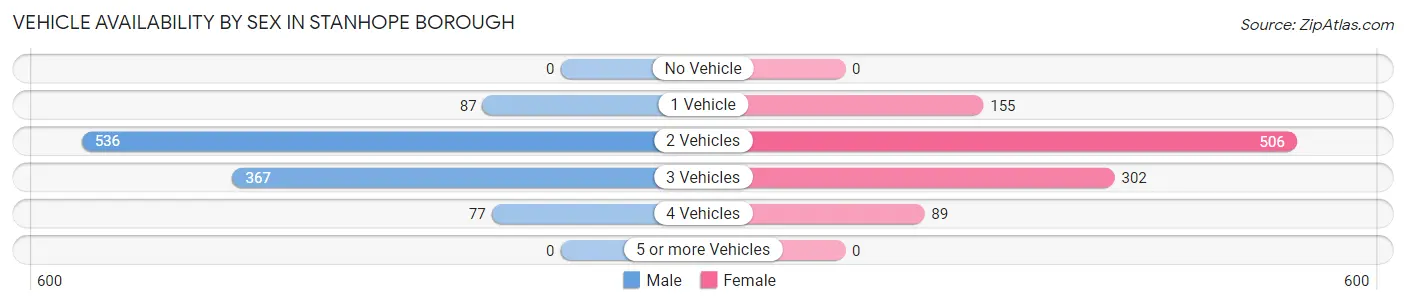
| Vehicles Available | Male | Female |
| No Vehicle | 0 (0.0%) | 0 (0.0%) |
| 1 Vehicle | 87 (8.2%) | 155 (14.7%) |
| 2 Vehicles | 536 (50.2%) | 506 (48.1%) |
| 3 Vehicles | 367 (34.4%) | 302 (28.7%) |
| 4 Vehicles | 77 (7.2%) | 89 (8.5%) |
| 5 or more Vehicles | 0 (0.0%) | 0 (0.0%) |
| Total | 1,067 (100.0%) | 1,052 (100.0%) |
Commute Time in Stanhope borough
The most frequently occuring commute durations in Stanhope borough are 45 to 59 minutes (405 commuters, 21.4%), 30 to 34 minutes (239 commuters, 12.6%), and 15 to 19 minutes (208 commuters, 11.0%).
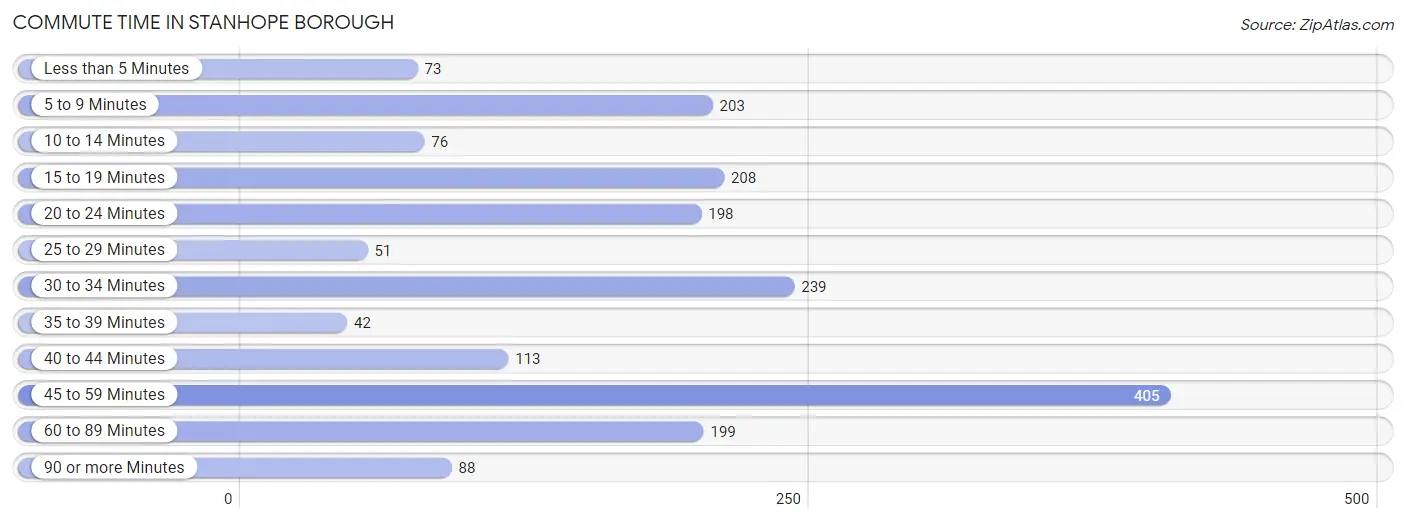
| Commute Time | # Commuters | % Commuters |
| Less than 5 Minutes | 73 | 3.8% |
| 5 to 9 Minutes | 203 | 10.7% |
| 10 to 14 Minutes | 76 | 4.0% |
| 15 to 19 Minutes | 208 | 11.0% |
| 20 to 24 Minutes | 198 | 10.4% |
| 25 to 29 Minutes | 51 | 2.7% |
| 30 to 34 Minutes | 239 | 12.6% |
| 35 to 39 Minutes | 42 | 2.2% |
| 40 to 44 Minutes | 113 | 6.0% |
| 45 to 59 Minutes | 405 | 21.4% |
| 60 to 89 Minutes | 199 | 10.5% |
| 90 or more Minutes | 88 | 4.6% |
Commute Time by Sex in Stanhope borough
The most common commute times in Stanhope borough are 45 to 59 minutes (204 commuters, 21.3%) for males and 30 to 34 minutes (203 commuters, 21.6%) for females.
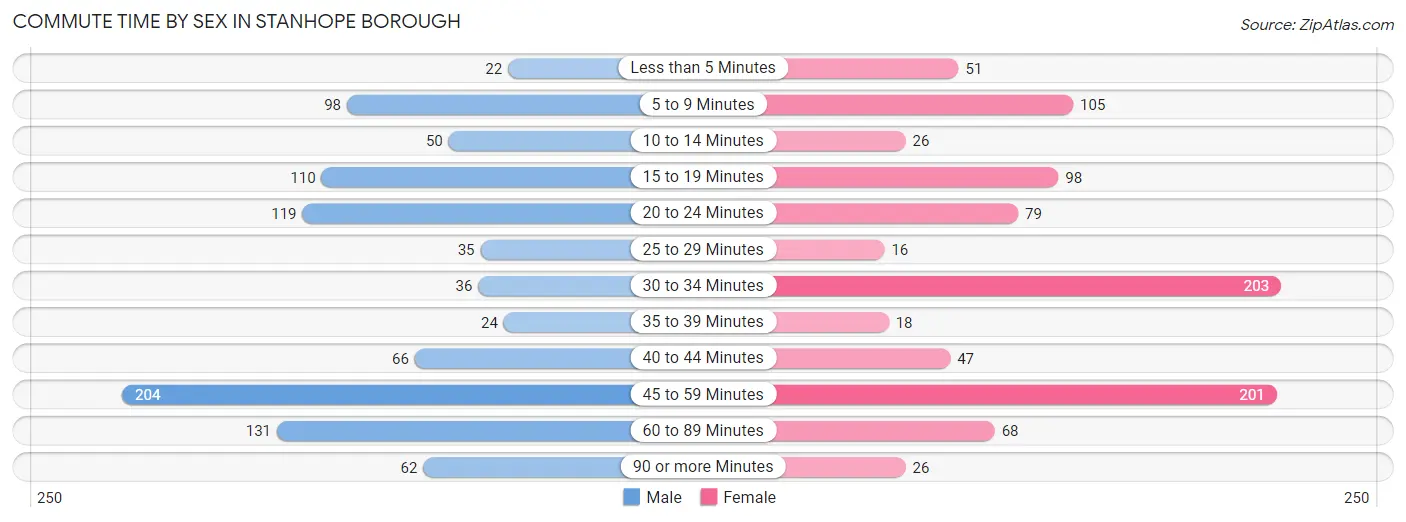
| Commute Time | Male | Female |
| Less than 5 Minutes | 22 (2.3%) | 51 (5.4%) |
| 5 to 9 Minutes | 98 (10.2%) | 105 (11.2%) |
| 10 to 14 Minutes | 50 (5.2%) | 26 (2.8%) |
| 15 to 19 Minutes | 110 (11.5%) | 98 (10.4%) |
| 20 to 24 Minutes | 119 (12.4%) | 79 (8.4%) |
| 25 to 29 Minutes | 35 (3.7%) | 16 (1.7%) |
| 30 to 34 Minutes | 36 (3.8%) | 203 (21.6%) |
| 35 to 39 Minutes | 24 (2.5%) | 18 (1.9%) |
| 40 to 44 Minutes | 66 (6.9%) | 47 (5.0%) |
| 45 to 59 Minutes | 204 (21.3%) | 201 (21.4%) |
| 60 to 89 Minutes | 131 (13.7%) | 68 (7.2%) |
| 90 or more Minutes | 62 (6.5%) | 26 (2.8%) |
Time of Departure to Work by Sex in Stanhope borough
The most frequent times of departure to work in Stanhope borough are 12:00 PM to 3:59 PM (150, 15.7%) for males and 8:00 AM to 8:29 AM (186, 19.8%) for females.
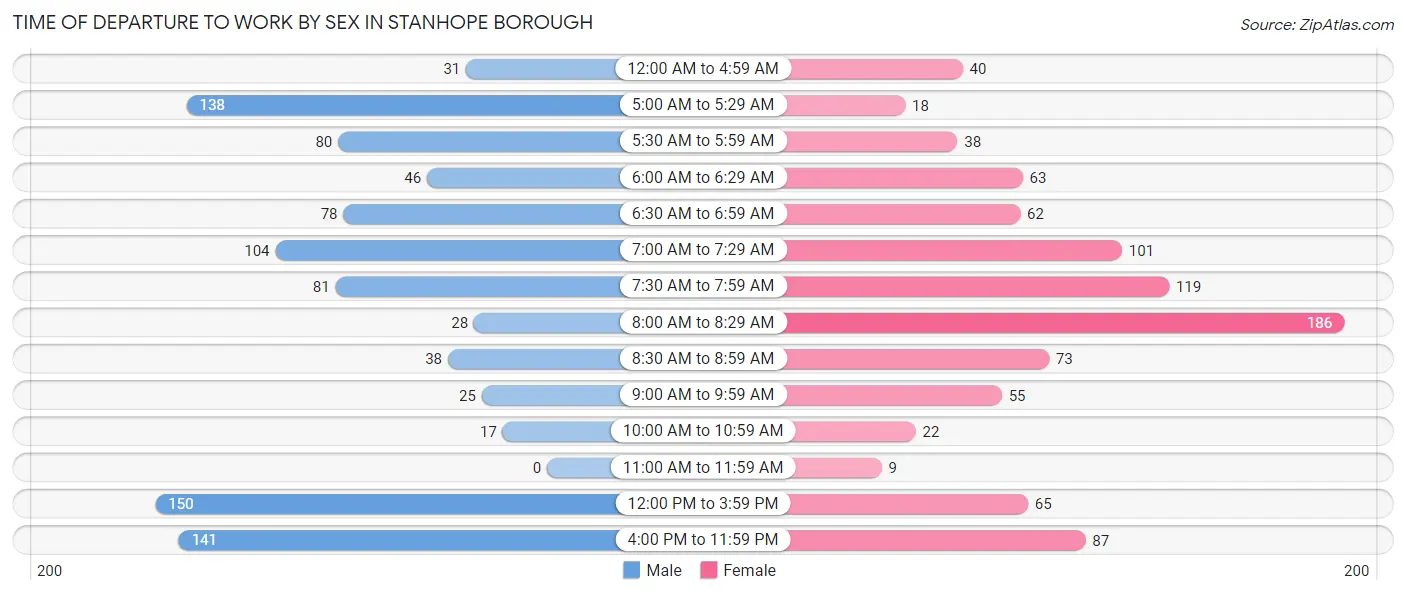
| Time of Departure | Male | Female |
| 12:00 AM to 4:59 AM | 31 (3.2%) | 40 (4.3%) |
| 5:00 AM to 5:29 AM | 138 (14.4%) | 18 (1.9%) |
| 5:30 AM to 5:59 AM | 80 (8.4%) | 38 (4.1%) |
| 6:00 AM to 6:29 AM | 46 (4.8%) | 63 (6.7%) |
| 6:30 AM to 6:59 AM | 78 (8.2%) | 62 (6.6%) |
| 7:00 AM to 7:29 AM | 104 (10.9%) | 101 (10.8%) |
| 7:30 AM to 7:59 AM | 81 (8.5%) | 119 (12.7%) |
| 8:00 AM to 8:29 AM | 28 (2.9%) | 186 (19.8%) |
| 8:30 AM to 8:59 AM | 38 (4.0%) | 73 (7.8%) |
| 9:00 AM to 9:59 AM | 25 (2.6%) | 55 (5.9%) |
| 10:00 AM to 10:59 AM | 17 (1.8%) | 22 (2.4%) |
| 11:00 AM to 11:59 AM | 0 (0.0%) | 9 (1.0%) |
| 12:00 PM to 3:59 PM | 150 (15.7%) | 65 (6.9%) |
| 4:00 PM to 11:59 PM | 141 (14.7%) | 87 (9.3%) |
| Total | 957 (100.0%) | 938 (100.0%) |
Housing Occupancy in Stanhope borough
Occupancy by Ownership in Stanhope borough
Of the total 1,266 dwellings in Stanhope borough, owner-occupied units account for 1,047 (82.7%), while renter-occupied units make up 219 (17.3%).
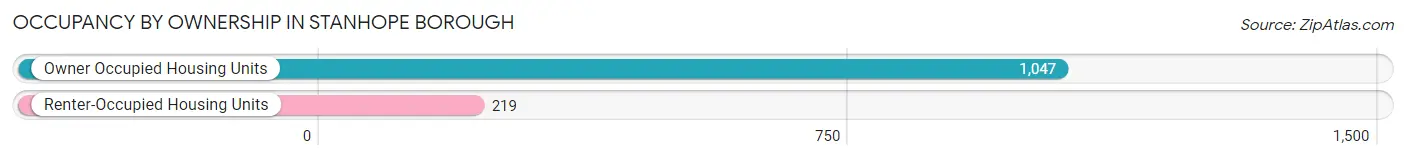
| Occupancy | # Housing Units | % Housing Units |
| Owner Occupied Housing Units | 1,047 | 82.7% |
| Renter-Occupied Housing Units | 219 | 17.3% |
| Total Occupied Housing Units | 1,266 | 100.0% |
Occupancy by Household Size in Stanhope borough
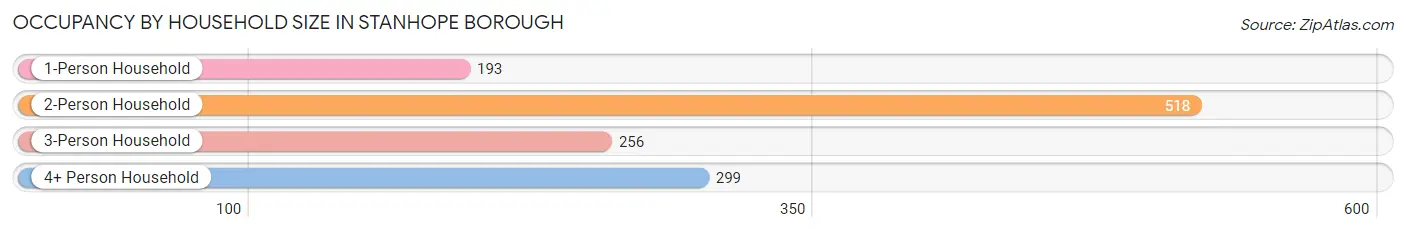
| Household Size | # Housing Units | % Housing Units |
| 1-Person Household | 193 | 15.2% |
| 2-Person Household | 518 | 40.9% |
| 3-Person Household | 256 | 20.2% |
| 4+ Person Household | 299 | 23.6% |
| Total Housing Units | 1,266 | 100.0% |
Occupancy by Ownership by Household Size in Stanhope borough
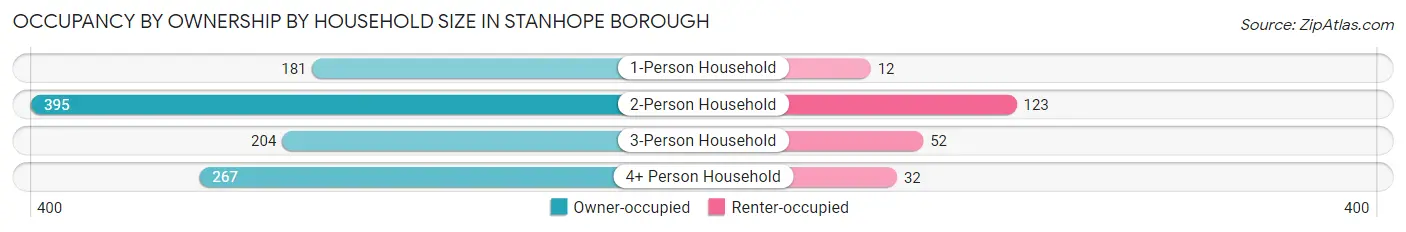
| Household Size | Owner-occupied | Renter-occupied |
| 1-Person Household | 181 (93.8%) | 12 (6.2%) |
| 2-Person Household | 395 (76.2%) | 123 (23.7%) |
| 3-Person Household | 204 (79.7%) | 52 (20.3%) |
| 4+ Person Household | 267 (89.3%) | 32 (10.7%) |
| Total Housing Units | 1,047 (82.7%) | 219 (17.3%) |
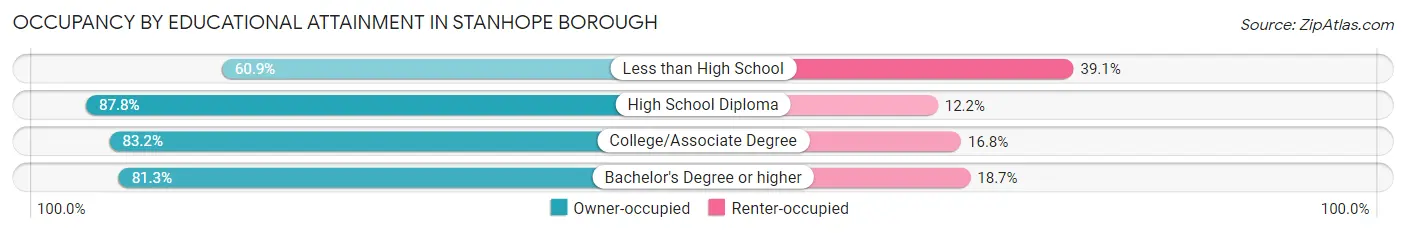
Occupancy by Educational Attainment in Stanhope borough
| Household Size | Owner-occupied | Renter-occupied |
| Less than High School | 28 (60.9%) | 18 (39.1%) |
| High School Diploma | 266 (87.8%) | 37 (12.2%) |
| College/Associate Degree | 326 (83.2%) | 66 (16.8%) |
| Bachelor's Degree or higher | 427 (81.3%) | 98 (18.7%) |
Occupancy by Age of Householder in Stanhope borough
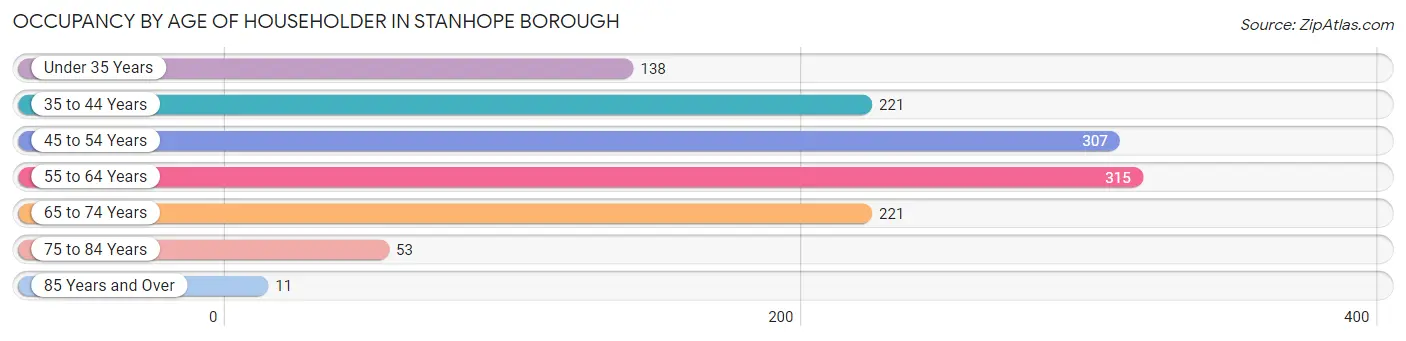
| Age Bracket | # Households | % Households |
| Under 35 Years | 138 | 10.9% |
| 35 to 44 Years | 221 | 17.5% |
| 45 to 54 Years | 307 | 24.2% |
| 55 to 64 Years | 315 | 24.9% |
| 65 to 74 Years | 221 | 17.5% |
| 75 to 84 Years | 53 | 4.2% |
| 85 Years and Over | 11 | 0.9% |
| Total | 1,266 | 100.0% |
Housing Finances in Stanhope borough
Median Income by Occupancy in Stanhope borough
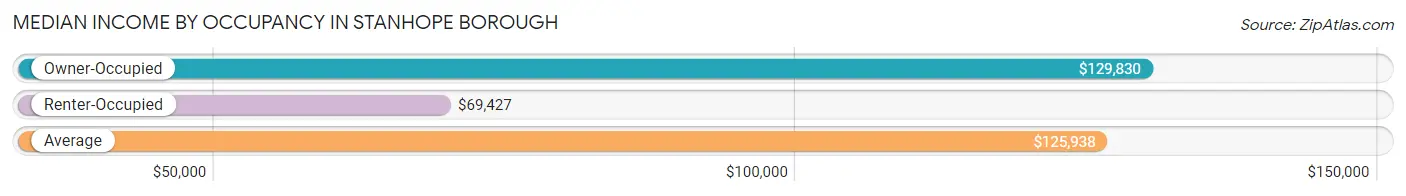
| Occupancy Type | # Households | Median Income |
| Owner-Occupied | 1,047 (82.7%) | $129,830 |
| Renter-Occupied | 219 (17.3%) | $69,427 |
| Average | 1,266 (100.0%) | $125,938 |
Occupancy by Householder Income Bracket in Stanhope borough
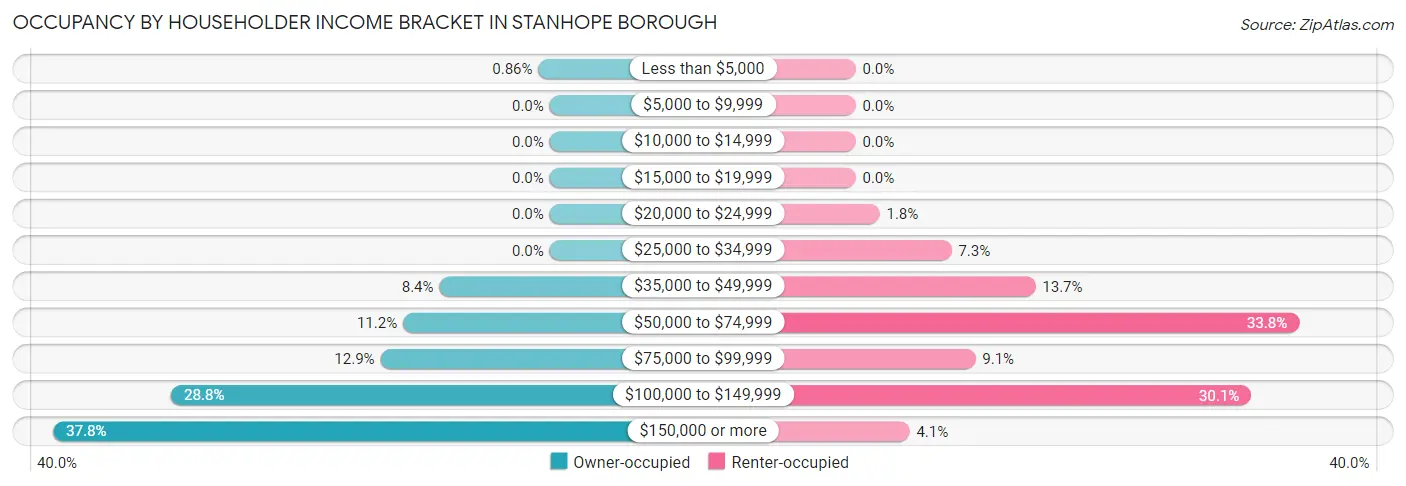
| Income Bracket | Owner-occupied | Renter-occupied |
| Less than $5,000 | 9 (0.9%) | 0 (0.0%) |
| $5,000 to $9,999 | 0 (0.0%) | 0 (0.0%) |
| $10,000 to $14,999 | 0 (0.0%) | 0 (0.0%) |
| $15,000 to $19,999 | 0 (0.0%) | 0 (0.0%) |
| $20,000 to $24,999 | 0 (0.0%) | 4 (1.8%) |
| $25,000 to $34,999 | 0 (0.0%) | 16 (7.3%) |
| $35,000 to $49,999 | 88 (8.4%) | 30 (13.7%) |
| $50,000 to $74,999 | 117 (11.2%) | 74 (33.8%) |
| $75,000 to $99,999 | 135 (12.9%) | 20 (9.1%) |
| $100,000 to $149,999 | 302 (28.8%) | 66 (30.1%) |
| $150,000 or more | 396 (37.8%) | 9 (4.1%) |
| Total | 1,047 (100.0%) | 219 (100.0%) |
Monthly Housing Cost Tiers in Stanhope borough
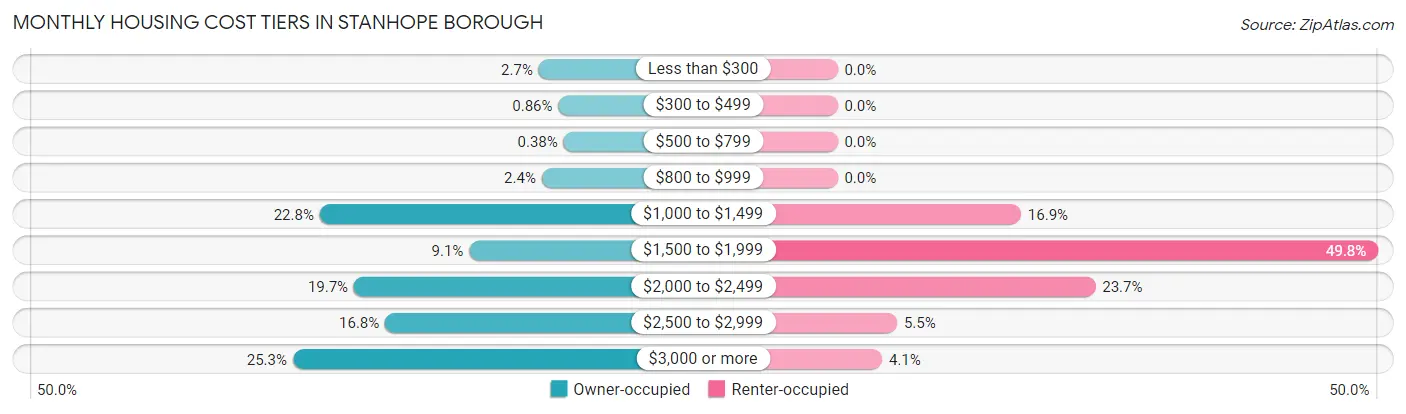
| Monthly Cost | Owner-occupied | Renter-occupied |
| Less than $300 | 28 (2.7%) | 0 (0.0%) |
| $300 to $499 | 9 (0.9%) | 0 (0.0%) |
| $500 to $799 | 4 (0.4%) | 0 (0.0%) |
| $800 to $999 | 25 (2.4%) | 0 (0.0%) |
| $1,000 to $1,499 | 239 (22.8%) | 37 (16.9%) |
| $1,500 to $1,999 | 95 (9.1%) | 109 (49.8%) |
| $2,000 to $2,499 | 206 (19.7%) | 52 (23.7%) |
| $2,500 to $2,999 | 176 (16.8%) | 12 (5.5%) |
| $3,000 or more | 265 (25.3%) | 9 (4.1%) |
| Total | 1,047 (100.0%) | 219 (100.0%) |
Physical Housing Characteristics in Stanhope borough
Housing Structures in Stanhope borough
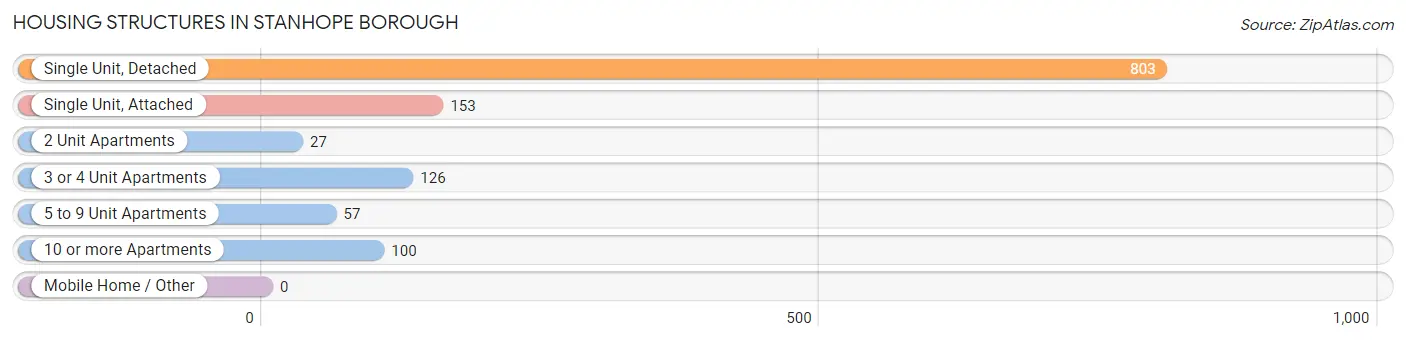
| Structure Type | # Housing Units | % Housing Units |
| Single Unit, Detached | 803 | 63.4% |
| Single Unit, Attached | 153 | 12.1% |
| 2 Unit Apartments | 27 | 2.1% |
| 3 or 4 Unit Apartments | 126 | 10.0% |
| 5 to 9 Unit Apartments | 57 | 4.5% |
| 10 or more Apartments | 100 | 7.9% |
| Mobile Home / Other | 0 | 0.0% |
| Total | 1,266 | 100.0% |
Housing Structures by Occupancy in Stanhope borough
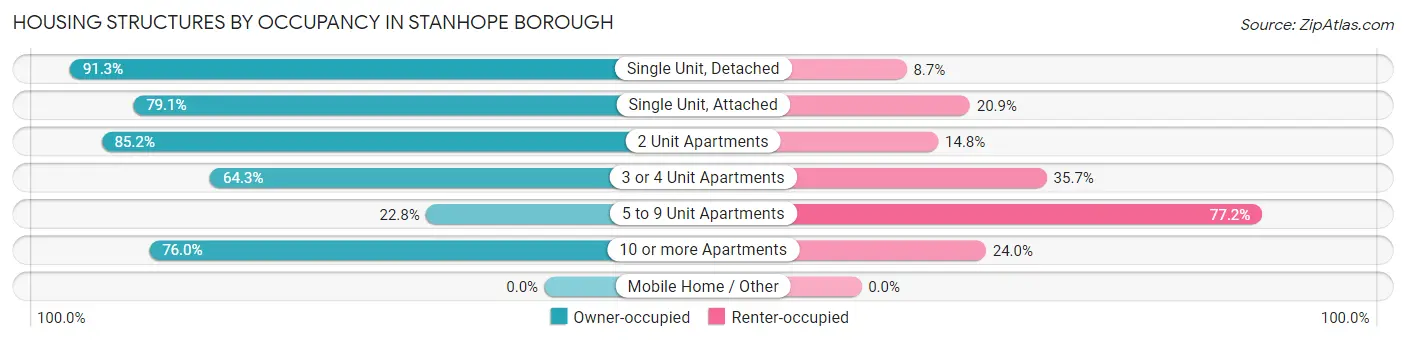
| Structure Type | Owner-occupied | Renter-occupied |
| Single Unit, Detached | 733 (91.3%) | 70 (8.7%) |
| Single Unit, Attached | 121 (79.1%) | 32 (20.9%) |
| 2 Unit Apartments | 23 (85.2%) | 4 (14.8%) |
| 3 or 4 Unit Apartments | 81 (64.3%) | 45 (35.7%) |
| 5 to 9 Unit Apartments | 13 (22.8%) | 44 (77.2%) |
| 10 or more Apartments | 76 (76.0%) | 24 (24.0%) |
| Mobile Home / Other | 0 (0.0%) | 0 (0.0%) |
| Total | 1,047 (82.7%) | 219 (17.3%) |
Housing Structures by Number of Rooms in Stanhope borough
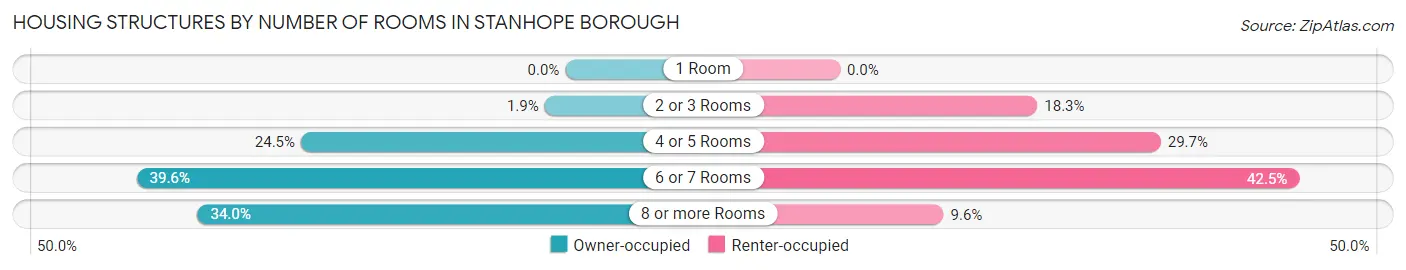
| Number of Rooms | Owner-occupied | Renter-occupied |
| 1 Room | 0 (0.0%) | 0 (0.0%) |
| 2 or 3 Rooms | 20 (1.9%) | 40 (18.3%) |
| 4 or 5 Rooms | 256 (24.4%) | 65 (29.7%) |
| 6 or 7 Rooms | 415 (39.6%) | 93 (42.5%) |
| 8 or more Rooms | 356 (34.0%) | 21 (9.6%) |
| Total | 1,047 (100.0%) | 219 (100.0%) |
Housing Structure by Heating Type in Stanhope borough
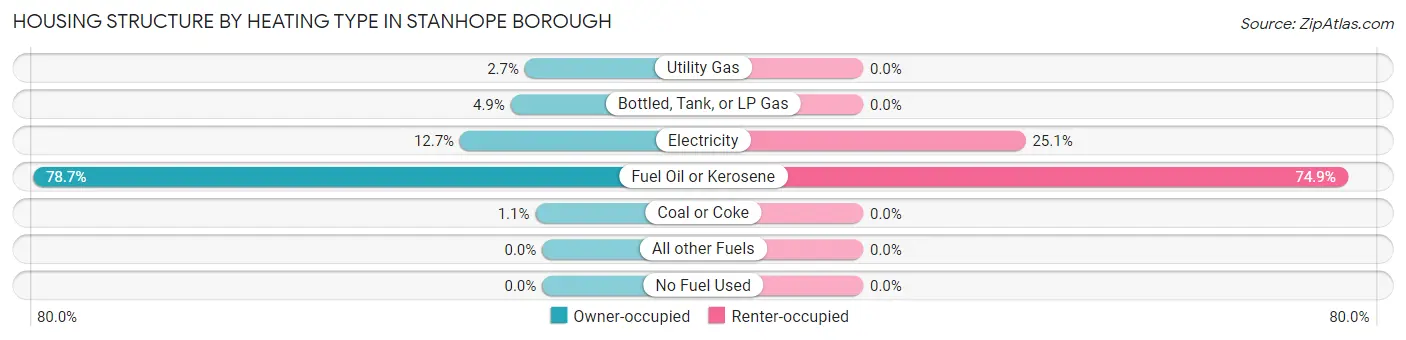
| Heating Type | Owner-occupied | Renter-occupied |
| Utility Gas | 28 (2.7%) | 0 (0.0%) |
| Bottled, Tank, or LP Gas | 51 (4.9%) | 0 (0.0%) |
| Electricity | 133 (12.7%) | 55 (25.1%) |
| Fuel Oil or Kerosene | 824 (78.7%) | 164 (74.9%) |
| Coal or Coke | 11 (1.1%) | 0 (0.0%) |
| All other Fuels | 0 (0.0%) | 0 (0.0%) |
| No Fuel Used | 0 (0.0%) | 0 (0.0%) |
| Total | 1,047 (100.0%) | 219 (100.0%) |
Household Vehicle Usage in Stanhope borough
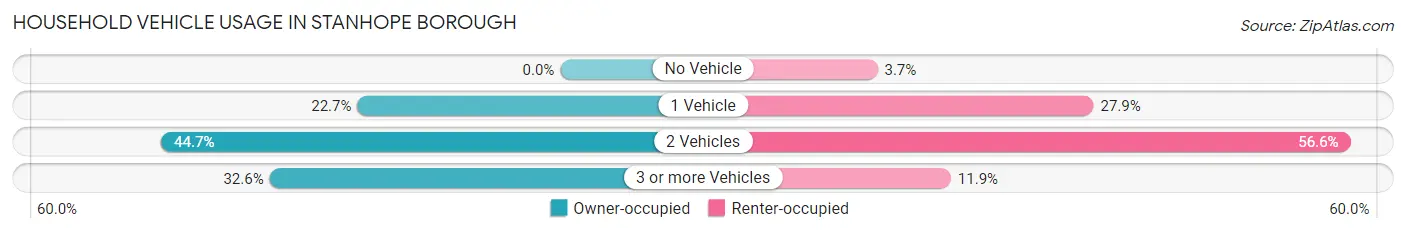
| Vehicles per Household | Owner-occupied | Renter-occupied |
| No Vehicle | 0 (0.0%) | 8 (3.6%) |
| 1 Vehicle | 238 (22.7%) | 61 (27.9%) |
| 2 Vehicles | 468 (44.7%) | 124 (56.6%) |
| 3 or more Vehicles | 341 (32.6%) | 26 (11.9%) |
| Total | 1,047 (100.0%) | 219 (100.0%) |
Real Estate & Mortgages in Stanhope borough
Real Estate and Mortgage Overview in Stanhope borough
| Characteristic | Without Mortgage | With Mortgage |
| Housing Units | 259 | 788 |
| Median Property Value | $260,700 | $296,900 |
| Median Household Income | $83,977 | $347 |
| Monthly Housing Costs | $1,115 | $265 |
| Real Estate Taxes | $8,585 | $0 |
Property Value by Mortgage Status in Stanhope borough
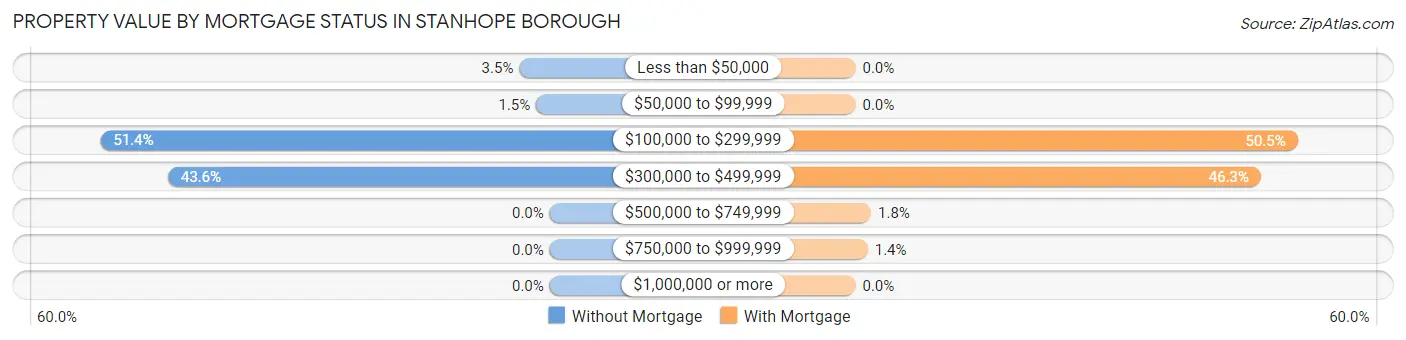
| Property Value | Without Mortgage | With Mortgage |
| Less than $50,000 | 9 (3.5%) | 0 (0.0%) |
| $50,000 to $99,999 | 4 (1.5%) | 0 (0.0%) |
| $100,000 to $299,999 | 133 (51.3%) | 398 (50.5%) |
| $300,000 to $499,999 | 113 (43.6%) | 365 (46.3%) |
| $500,000 to $749,999 | 0 (0.0%) | 14 (1.8%) |
| $750,000 to $999,999 | 0 (0.0%) | 11 (1.4%) |
| $1,000,000 or more | 0 (0.0%) | 0 (0.0%) |
| Total | 259 (100.0%) | 788 (100.0%) |
Household Income by Mortgage Status in Stanhope borough
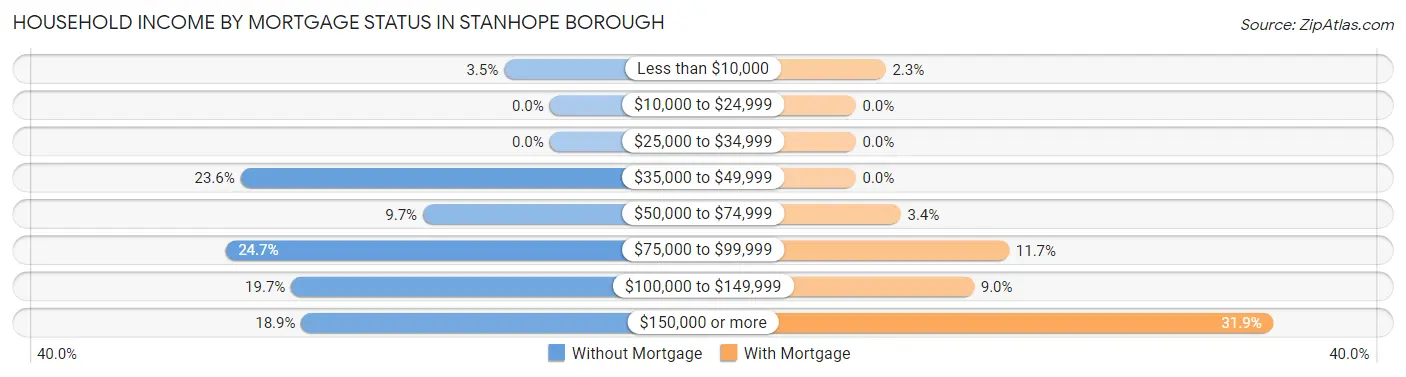
| Household Income | Without Mortgage | With Mortgage |
| Less than $10,000 | 9 (3.5%) | 18 (2.3%) |
| $10,000 to $24,999 | 0 (0.0%) | 0 (0.0%) |
| $25,000 to $34,999 | 0 (0.0%) | 0 (0.0%) |
| $35,000 to $49,999 | 61 (23.5%) | 0 (0.0%) |
| $50,000 to $74,999 | 25 (9.7%) | 27 (3.4%) |
| $75,000 to $99,999 | 64 (24.7%) | 92 (11.7%) |
| $100,000 to $149,999 | 51 (19.7%) | 71 (9.0%) |
| $150,000 or more | 49 (18.9%) | 251 (31.9%) |
| Total | 259 (100.0%) | 788 (100.0%) |
Property Value to Household Income Ratio in Stanhope borough
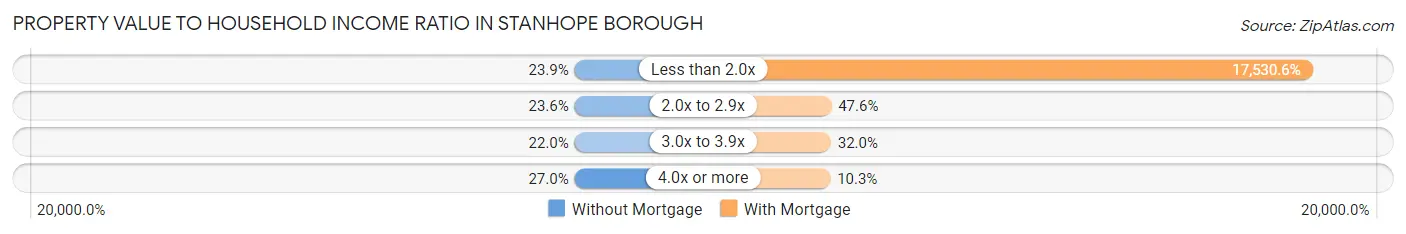
| Value-to-Income Ratio | Without Mortgage | With Mortgage |
| Less than 2.0x | 62 (23.9%) | 138,141 (17,530.6%) |
| 2.0x to 2.9x | 61 (23.5%) | 375 (47.6%) |
| 3.0x to 3.9x | 57 (22.0%) | 252 (32.0%) |
| 4.0x or more | 70 (27.0%) | 81 (10.3%) |
| Total | 259 (100.0%) | 788 (100.0%) |
Real Estate Taxes by Mortgage Status in Stanhope borough
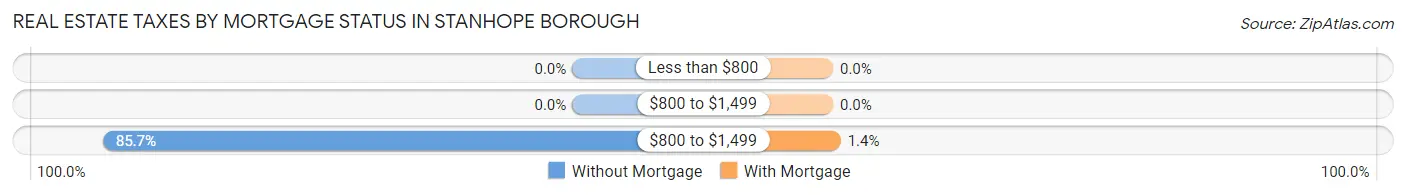
| Property Taxes | Without Mortgage | With Mortgage |
| Less than $800 | 0 (0.0%) | 0 (0.0%) |
| $800 to $1,499 | 0 (0.0%) | 0 (0.0%) |
| $800 to $1,499 | 222 (85.7%) | 11 (1.4%) |
| Total | 259 (100.0%) | 788 (100.0%) |
Health & Disability in Stanhope borough
Health Insurance Coverage by Age in Stanhope borough
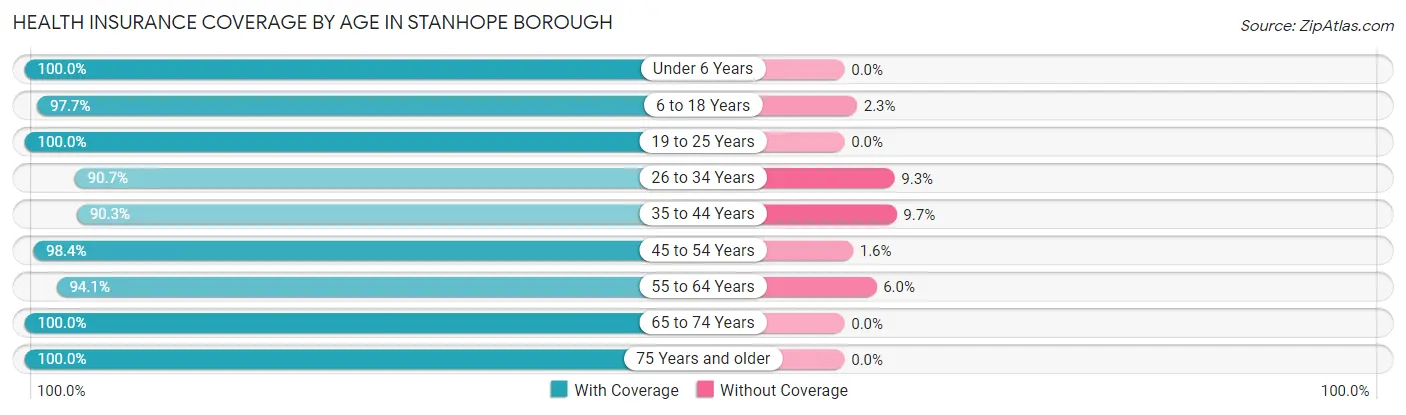
| Age Bracket | With Coverage | Without Coverage |
| Under 6 Years | 318 (100.0%) | 0 (0.0%) |
| 6 to 18 Years | 588 (97.7%) | 14 (2.3%) |
| 19 to 25 Years | 238 (100.0%) | 0 (0.0%) |
| 26 to 34 Years | 330 (90.7%) | 34 (9.3%) |
| 35 to 44 Years | 446 (90.3%) | 48 (9.7%) |
| 45 to 54 Years | 560 (98.4%) | 9 (1.6%) |
| 55 to 64 Years | 458 (94.1%) | 29 (5.9%) |
| 65 to 74 Years | 324 (100.0%) | 0 (0.0%) |
| 75 Years and older | 128 (100.0%) | 0 (0.0%) |
| Total | 3,390 (96.2%) | 134 (3.8%) |
Health Insurance Coverage by Citizenship Status in Stanhope borough
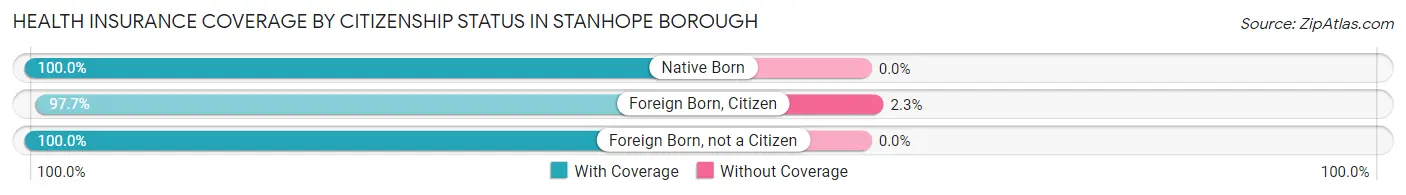
| Citizenship Status | With Coverage | Without Coverage |
| Native Born | 318 (100.0%) | 0 (0.0%) |
| Foreign Born, Citizen | 588 (97.7%) | 14 (2.3%) |
| Foreign Born, not a Citizen | 238 (100.0%) | 0 (0.0%) |
Health Insurance Coverage by Household Income in Stanhope borough
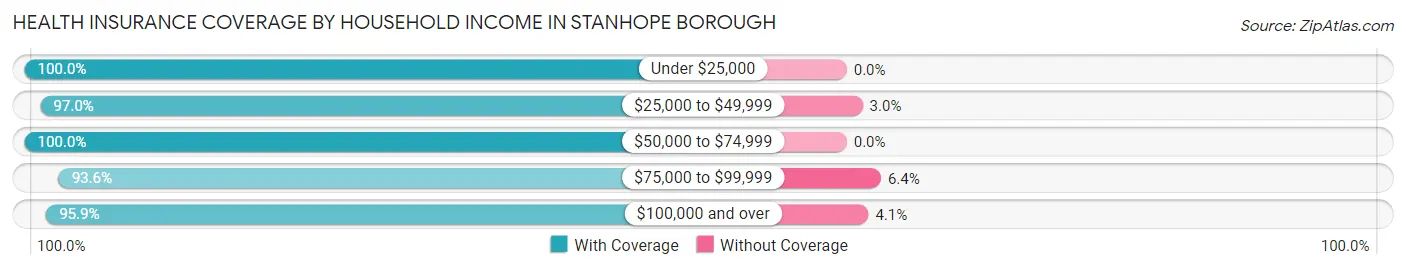
| Household Income | With Coverage | Without Coverage |
| Under $25,000 | 13 (100.0%) | 0 (0.0%) |
| $25,000 to $49,999 | 229 (97.0%) | 7 (3.0%) |
| $50,000 to $74,999 | 353 (100.0%) | 0 (0.0%) |
| $75,000 to $99,999 | 351 (93.6%) | 24 (6.4%) |
| $100,000 and over | 2,431 (95.9%) | 103 (4.1%) |
Public vs Private Health Insurance Coverage by Age in Stanhope borough
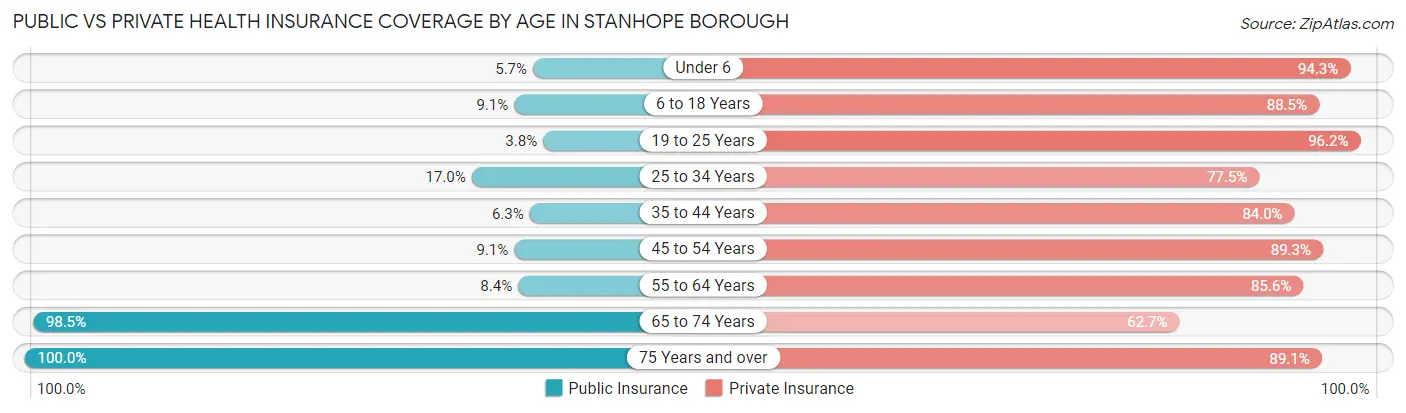
| Age Bracket | Public Insurance | Private Insurance |
| Under 6 | 18 (5.7%) | 300 (94.3%) |
| 6 to 18 Years | 55 (9.1%) | 533 (88.5%) |
| 19 to 25 Years | 9 (3.8%) | 229 (96.2%) |
| 25 to 34 Years | 62 (17.0%) | 282 (77.5%) |
| 35 to 44 Years | 31 (6.3%) | 415 (84.0%) |
| 45 to 54 Years | 52 (9.1%) | 508 (89.3%) |
| 55 to 64 Years | 41 (8.4%) | 417 (85.6%) |
| 65 to 74 Years | 319 (98.5%) | 203 (62.6%) |
| 75 Years and over | 128 (100.0%) | 114 (89.1%) |
| Total | 715 (20.3%) | 3,001 (85.2%) |
Disability Status by Sex by Age in Stanhope borough
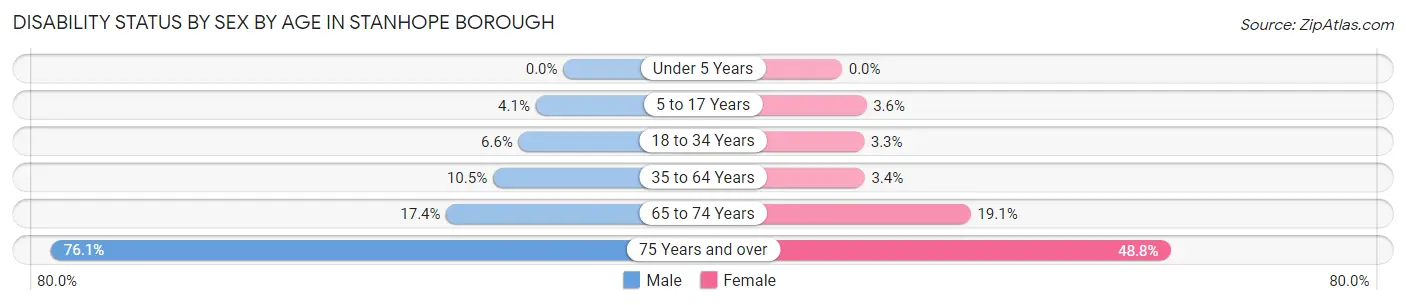
| Age Bracket | Male | Female |
| Under 5 Years | 0 (0.0%) | 0 (0.0%) |
| 5 to 17 Years | 15 (4.1%) | 9 (3.6%) |
| 18 to 34 Years | 22 (6.6%) | 10 (3.3%) |
| 35 to 64 Years | 75 (10.4%) | 28 (3.4%) |
| 65 to 74 Years | 29 (17.4%) | 30 (19.1%) |
| 75 Years and over | 35 (76.1%) | 40 (48.8%) |
Disability Class by Sex by Age in Stanhope borough
Disability Class: Hearing Difficulty
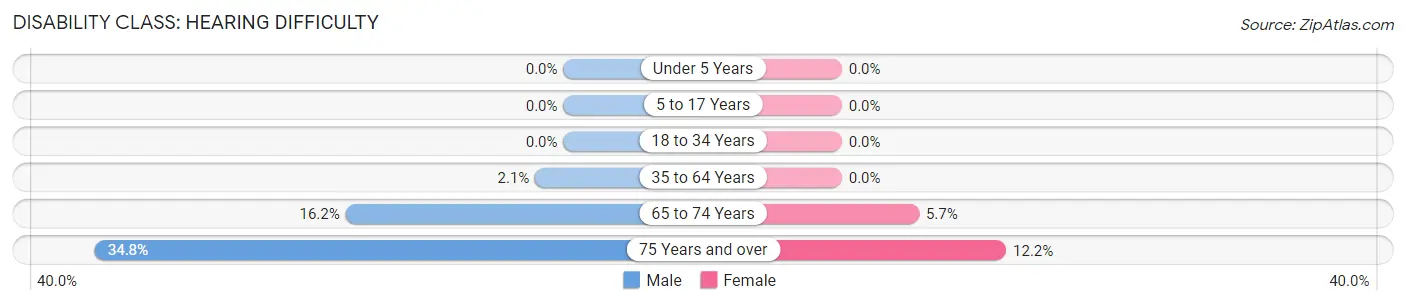
| Age Bracket | Male | Female |
| Under 5 Years | 0 (0.0%) | 0 (0.0%) |
| 5 to 17 Years | 0 (0.0%) | 0 (0.0%) |
| 18 to 34 Years | 0 (0.0%) | 0 (0.0%) |
| 35 to 64 Years | 15 (2.1%) | 0 (0.0%) |
| 65 to 74 Years | 27 (16.2%) | 9 (5.7%) |
| 75 Years and over | 16 (34.8%) | 10 (12.2%) |
Disability Class: Vision Difficulty
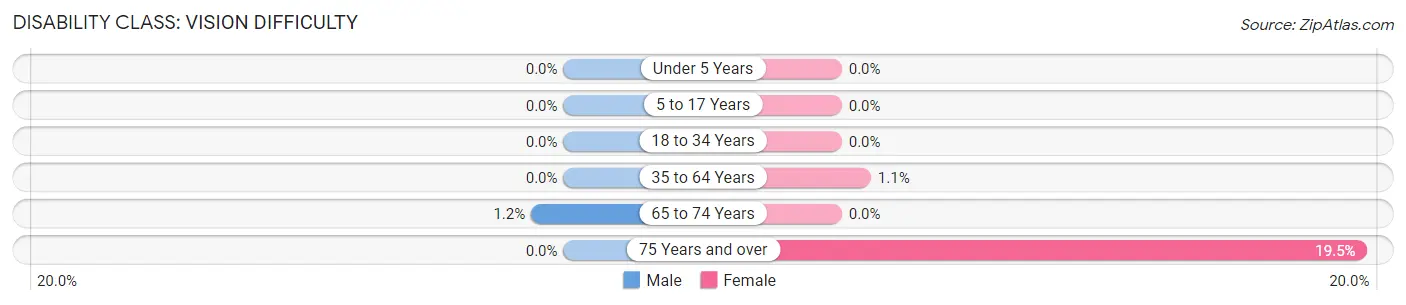
| Age Bracket | Male | Female |
| Under 5 Years | 0 (0.0%) | 0 (0.0%) |
| 5 to 17 Years | 0 (0.0%) | 0 (0.0%) |
| 18 to 34 Years | 0 (0.0%) | 0 (0.0%) |
| 35 to 64 Years | 0 (0.0%) | 9 (1.1%) |
| 65 to 74 Years | 2 (1.2%) | 0 (0.0%) |
| 75 Years and over | 0 (0.0%) | 16 (19.5%) |
Disability Class: Cognitive Difficulty
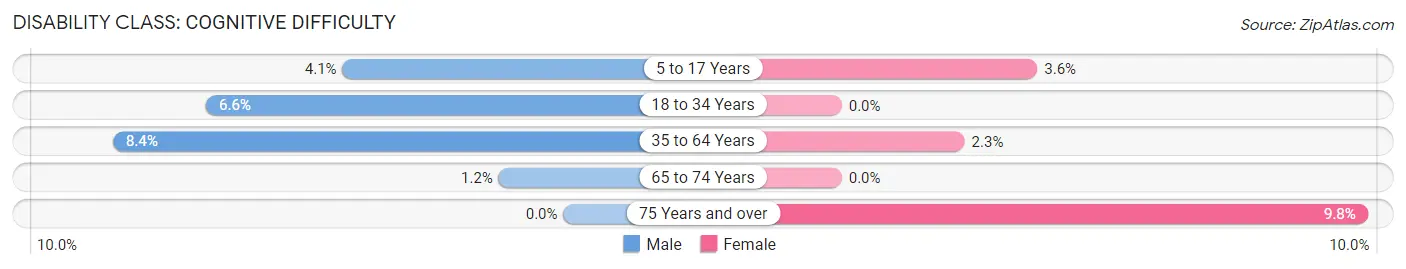
| Age Bracket | Male | Female |
| 5 to 17 Years | 15 (4.1%) | 9 (3.6%) |
| 18 to 34 Years | 22 (6.6%) | 0 (0.0%) |
| 35 to 64 Years | 60 (8.4%) | 19 (2.3%) |
| 65 to 74 Years | 2 (1.2%) | 0 (0.0%) |
| 75 Years and over | 0 (0.0%) | 8 (9.8%) |
Disability Class: Ambulatory Difficulty
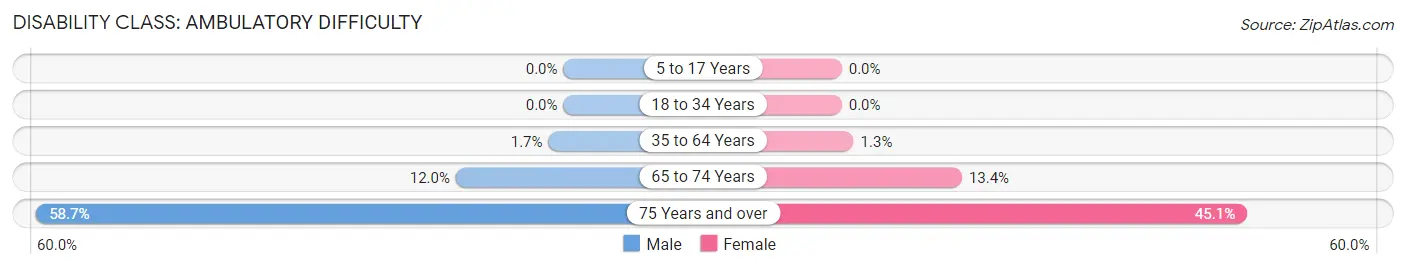
| Age Bracket | Male | Female |
| 5 to 17 Years | 0 (0.0%) | 0 (0.0%) |
| 18 to 34 Years | 0 (0.0%) | 0 (0.0%) |
| 35 to 64 Years | 12 (1.7%) | 11 (1.3%) |
| 65 to 74 Years | 20 (12.0%) | 21 (13.4%) |
| 75 Years and over | 27 (58.7%) | 37 (45.1%) |
Disability Class: Self-Care Difficulty
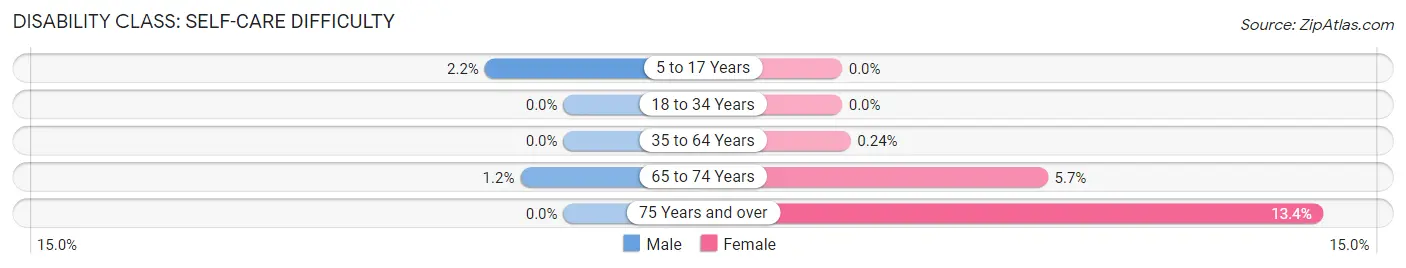
| Age Bracket | Male | Female |
| 5 to 17 Years | 8 (2.2%) | 0 (0.0%) |
| 18 to 34 Years | 0 (0.0%) | 0 (0.0%) |
| 35 to 64 Years | 0 (0.0%) | 2 (0.2%) |
| 65 to 74 Years | 2 (1.2%) | 9 (5.7%) |
| 75 Years and over | 0 (0.0%) | 11 (13.4%) |
Technology Access in Stanhope borough
Computing Device Access in Stanhope borough
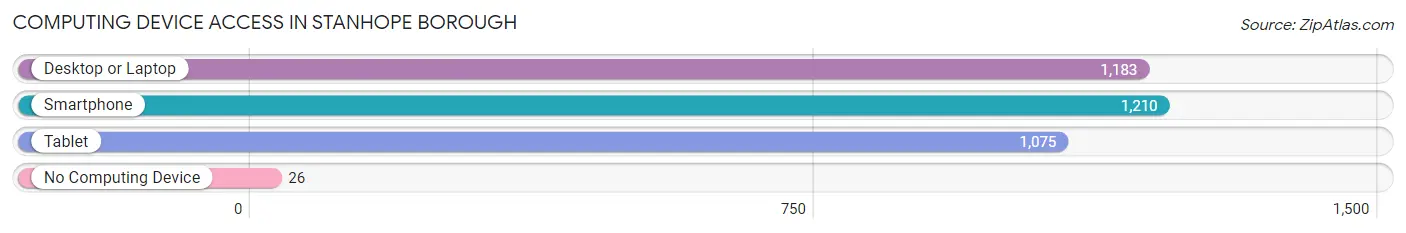
| Device Type | # Households | % Households |
| Desktop or Laptop | 1,183 | 93.4% |
| Smartphone | 1,210 | 95.6% |
| Tablet | 1,075 | 84.9% |
| No Computing Device | 26 | 2.1% |
| Total | 1,266 | 100.0% |
Internet Access in Stanhope borough
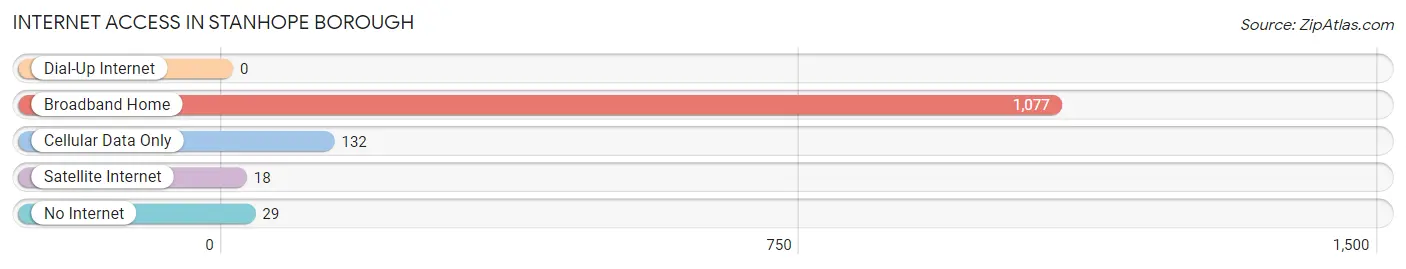
| Internet Type | # Households | % Households |
| Dial-Up Internet | 0 | 0.0% |
| Broadband Home | 1,077 | 85.1% |
| Cellular Data Only | 132 | 10.4% |
| Satellite Internet | 18 | 1.4% |
| No Internet | 29 | 2.3% |
| Total | 1,266 | 100.0% |
Stanhope borough Summary
Stanhope Borough is a small borough located in Sussex County, New Jersey. It is situated in the Kittatinny Valley, which is part of the Great Appalachian Valley. The borough is bordered by Byram Township to the north, Hopatcong Borough to the east, Netcong Borough to the south, and Mount Olive Township to the west. Stanhope Borough covers an area of 1.3 square miles and has a population of 2,717 as of the 2010 census.
History
The area that is now Stanhope Borough was originally inhabited by the Lenape Native Americans. The first European settlers arrived in the area in the late 17th century. The area was part of the Morris Canal, which was built in the early 19th century to transport coal and other goods from Pennsylvania to New York City. The canal was a major factor in the development of the area, as it provided a means of transportation for goods and people.
In 1882, the area was incorporated as a borough and named Stanhope, after the Stanhope family, who had owned much of the land in the area. The borough was originally a farming community, but it began to grow in the early 20th century with the development of the Morris Canal. The canal was eventually replaced by the Lackawanna Railroad, which provided transportation for commuters to and from New York City.
Geography
Stanhope Borough is located in the Kittatinny Valley, which is part of the Great Appalachian Valley. The borough is bordered by Byram Township to the north, Hopatcong Borough to the east, Netcong Borough to the south, and Mount Olive Township to the west. Stanhope Borough covers an area of 1.3 square miles and has a population of 2,717 as of the 2010 census.
The borough is located in the Kittatinny Valley, which is part of the Great Appalachian Valley. The valley is characterized by rolling hills and valleys, with the highest point in the borough being the summit of Mount Tammany, which is 1,067 feet above sea level. The borough is located in the Kittatinny Valley, which is part of the Great Appalachian Valley. The valley is characterized by rolling hills and valleys, with the highest point in the borough being the summit of Mount Tammany, which is 1,067 feet above sea level.
Economy
Stanhope Borough has a diverse economy, with a mix of manufacturing, retail, and service industries. The borough is home to several small businesses, including a bakery, a hardware store, a pharmacy, and a variety of restaurants. The borough is also home to several large employers, including a manufacturing plant, a distribution center, and a medical center.
The borough is also home to several tourist attractions, including the Stanhope House, a historic house museum, and the Stanhope Railroad Museum, which features a collection of vintage railroad equipment.
Demographics
As of the 2010 census, Stanhope Borough had a population of 2,717. The racial makeup of the borough was 94.3% White, 1.7% African American, 0.2% Native American, 1.2% Asian, 0.1% Pacific Islander, 1.2% from other races, and 1.5% from two or more races. Hispanic or Latino of any race were 4.2% of the population.
The median household income in Stanhope Borough was $68,958, and the median family income was $77,917. The per capita income was $30,945. About 4.2% of families and 5.3% of the population were below the poverty line, including 6.3% of those under age 18 and 4.2% of those age 65 or over.
Common Questions
What is Per Capita Income in Stanhope borough?
Per Capita income in Stanhope borough is $47,073.
What is the Median Family Income in Stanhope borough?
Median Family Income in Stanhope borough is $130,329.
What is the Median Household income in Stanhope borough?
Median Household Income in Stanhope borough is $125,938.
What is Income or Wage Gap in Stanhope borough?
Income or Wage Gap in Stanhope borough is 10.3%.
Women in Stanhope borough earn 89.7 cents for every dollar earned by a man.
What is Inequality or Gini Index in Stanhope borough?
Inequality or Gini Index in Stanhope borough is 0.30.
What is the Total Population of Stanhope borough?
Total Population of Stanhope borough is 3,533.
What is the Total Male Population of Stanhope borough?
Total Male Population of Stanhope borough is 1,697.
What is the Total Female Population of Stanhope borough?
Total Female Population of Stanhope borough is 1,836.
What is the Ratio of Males per 100 Females in Stanhope borough?
There are 92.43 Males per 100 Females in Stanhope borough.
What is the Ratio of Females per 100 Males in Stanhope borough?
There are 108.19 Females per 100 Males in Stanhope borough.
What is the Median Population Age in Stanhope borough?
Median Population Age in Stanhope borough is 40.3 Years.
What is the Average Family Size in Stanhope borough
Average Family Size in Stanhope borough is 3.1 People.
What is the Average Household Size in Stanhope borough
Average Household Size in Stanhope borough is 2.8 People.
How Large is the Labor Force in Stanhope borough?
There are 2,197 People in the Labor Forcein in Stanhope borough.
What is the Percentage of People in the Labor Force in Stanhope borough?
79.3% of People are in the Labor Force in Stanhope borough.
What is the Unemployment Rate in Stanhope borough?
Unemployment Rate in Stanhope borough is 3.2%.