Carteret borough, NJ Map & Demographics
Carteret borough Overview
$31,861
PER CAPITA INCOME
$90,685
AVG FAMILY INCOME
$79,049
AVG HOUSEHOLD INCOME
29.0%
WAGE / INCOME GAP [ % ]
71.0¢/ $1
WAGE / INCOME GAP [ $ ]
0.42
INEQUALITY / GINI INDEX
25,161
TOTAL POPULATION
12,606
MALE POPULATION
12,555
FEMALE POPULATION
100.41
MALES / 100 FEMALES
99.60
FEMALES / 100 MALES
37.6
MEDIAN AGE
3.6
AVG FAMILY SIZE
3.1
AVG HOUSEHOLD SIZE
12,703
LABOR FORCE [ PEOPLE ]
64.0%
PERCENT IN LABOR FORCE
7.3%
UNEMPLOYMENT RATE
Income in Carteret borough
Income Overview in Carteret borough
Per Capita Income in Carteret borough is $31,861, while median incomes of families and households are $90,685 and $79,049 respectively.
| Characteristic | Number | Measure |
| Per Capita Income | 25,161 | $31,861 |
| Median Family Income | 6,049 | $90,685 |
| Mean Family Income | 6,049 | $111,201 |
| Median Household Income | 8,153 | $79,049 |
| Mean Household Income | 8,153 | $99,724 |
| Income Deficit | 6,049 | $0 |
| Wage / Income Gap (%) | 25,161 | 29.02% |
| Wage / Income Gap ($) | 25,161 | 70.98¢ per $1 |
| Gini / Inequality Index | 25,161 | 0.42 |
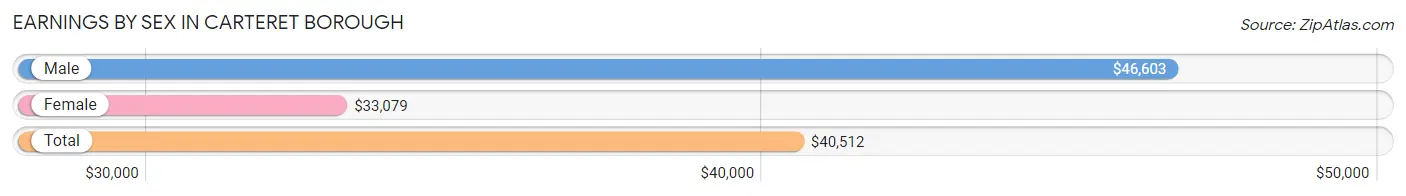
Earnings by Sex in Carteret borough
Average Earnings in Carteret borough are $40,512, $46,603 for men and $33,079 for women, a difference of 29.0%.
| Sex | Number | Average Earnings |
| Male | 6,789 (51.7%) | $46,603 |
| Female | 6,350 (48.3%) | $33,079 |
| Total | 13,139 (100.0%) | $40,512 |
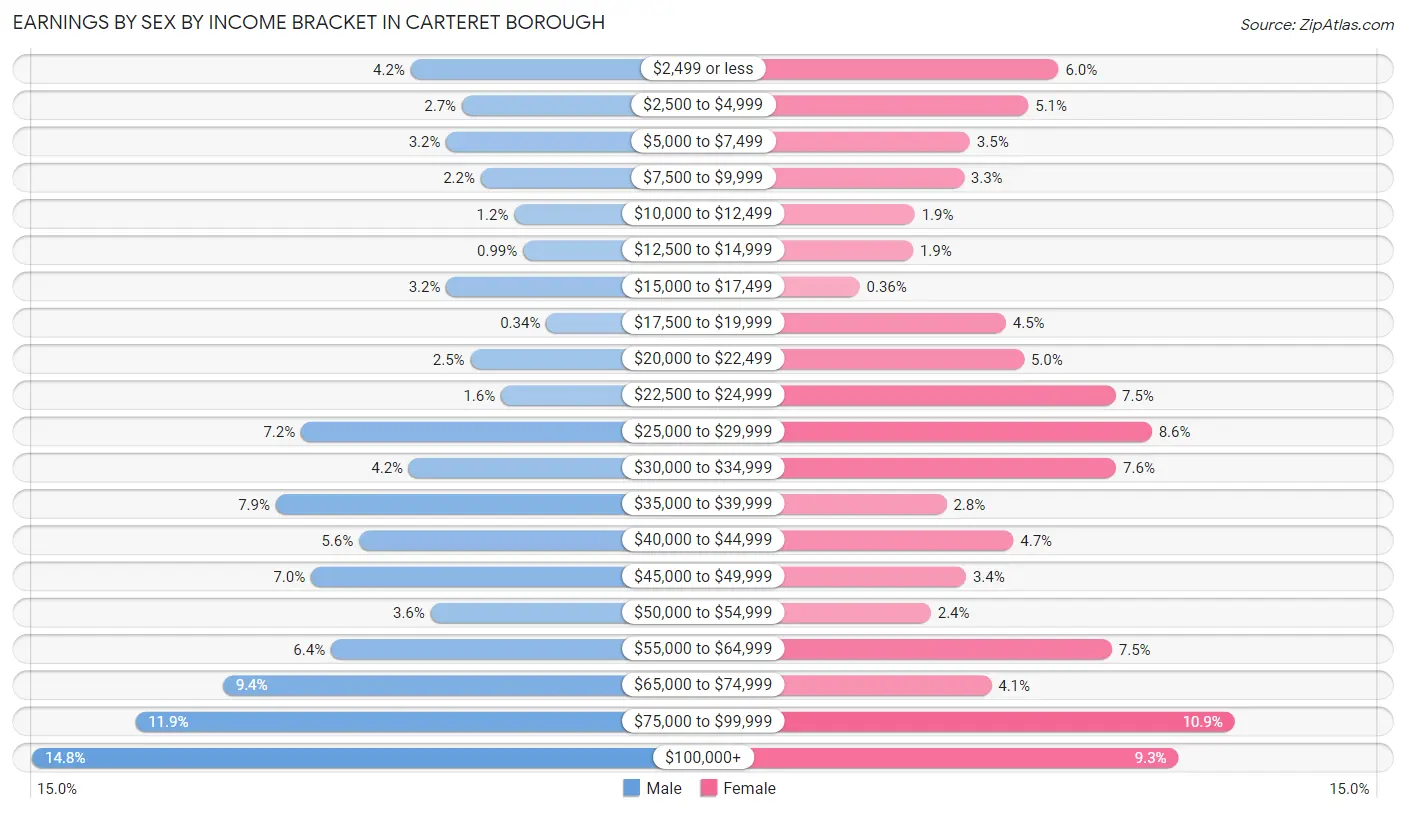
Earnings by Sex by Income Bracket in Carteret borough
The most common earnings brackets in Carteret borough are $100,000+ for men (1,004 | 14.8%) and $75,000 to $99,999 for women (692 | 10.9%).
| Income | Male | Female |
| $2,499 or less | 282 (4.2%) | 378 (5.9%) |
| $2,500 to $4,999 | 184 (2.7%) | 324 (5.1%) |
| $5,000 to $7,499 | 214 (3.2%) | 220 (3.5%) |
| $7,500 to $9,999 | 148 (2.2%) | 209 (3.3%) |
| $10,000 to $12,499 | 84 (1.2%) | 121 (1.9%) |
| $12,500 to $14,999 | 67 (1.0%) | 118 (1.9%) |
| $15,000 to $17,499 | 214 (3.2%) | 23 (0.4%) |
| $17,500 to $19,999 | 23 (0.3%) | 284 (4.5%) |
| $20,000 to $22,499 | 168 (2.5%) | 316 (5.0%) |
| $22,500 to $24,999 | 109 (1.6%) | 479 (7.5%) |
| $25,000 to $29,999 | 491 (7.2%) | 544 (8.6%) |
| $30,000 to $34,999 | 285 (4.2%) | 481 (7.6%) |
| $35,000 to $39,999 | 539 (7.9%) | 178 (2.8%) |
| $40,000 to $44,999 | 380 (5.6%) | 297 (4.7%) |
| $45,000 to $49,999 | 472 (7.0%) | 213 (3.4%) |
| $50,000 to $54,999 | 244 (3.6%) | 150 (2.4%) |
| $55,000 to $64,999 | 434 (6.4%) | 473 (7.4%) |
| $65,000 to $74,999 | 640 (9.4%) | 258 (4.1%) |
| $75,000 to $99,999 | 807 (11.9%) | 692 (10.9%) |
| $100,000+ | 1,004 (14.8%) | 592 (9.3%) |
| Total | 6,789 (100.0%) | 6,350 (100.0%) |
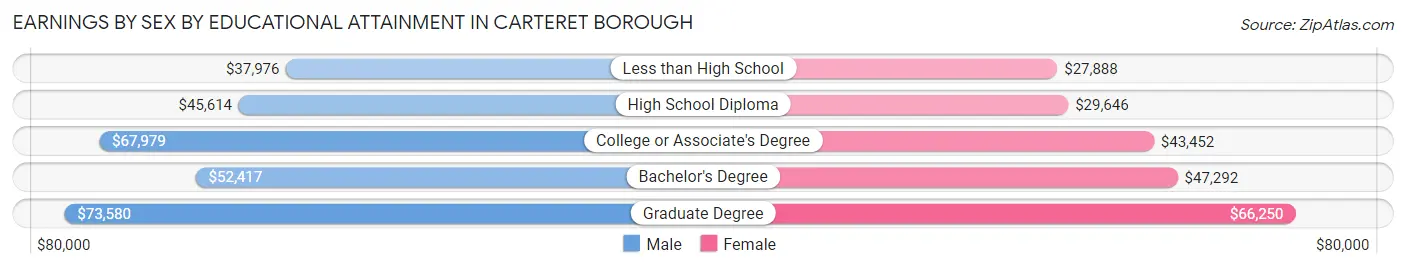
Earnings by Sex by Educational Attainment in Carteret borough
Average earnings in Carteret borough are $50,524 for men and $40,595 for women, a difference of 19.7%. Men with an educational attainment of graduate degree enjoy the highest average annual earnings of $73,580, while those with less than high school education earn the least with $37,976. Women with an educational attainment of graduate degree earn the most with the average annual earnings of $66,250, while those with less than high school education have the smallest earnings of $27,888.
| Educational Attainment | Male Income | Female Income |
| Less than High School | $37,976 | $27,888 |
| High School Diploma | $45,614 | $29,646 |
| College or Associate's Degree | $67,979 | $43,452 |
| Bachelor's Degree | $52,417 | $47,292 |
| Graduate Degree | $73,580 | $66,250 |
| Total | $50,524 | $40,595 |
Family Income in Carteret borough
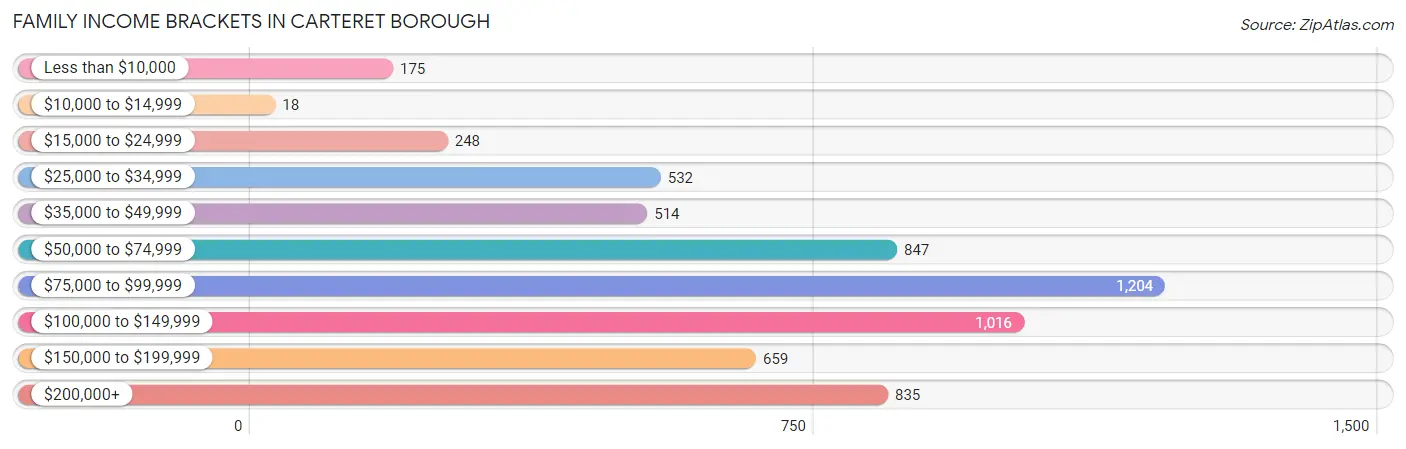
Family Income Brackets in Carteret borough
According to the Carteret borough family income data, there are 1,204 families falling into the $75,000 to $99,999 income range, which is the most common income bracket and makes up 19.9% of all families. Conversely, the $10,000 to $14,999 income bracket is the least frequent group with only 18 families (0.3%) belonging to this category.
| Income Bracket | # Families | % Families |
| Less than $10,000 | 175 | 2.9% |
| $10,000 to $14,999 | 18 | 0.3% |
| $15,000 to $24,999 | 248 | 4.1% |
| $25,000 to $34,999 | 532 | 8.8% |
| $35,000 to $49,999 | 514 | 8.5% |
| $50,000 to $74,999 | 847 | 14.0% |
| $75,000 to $99,999 | 1,204 | 19.9% |
| $100,000 to $149,999 | 1,016 | 16.8% |
| $150,000 to $199,999 | 659 | 10.9% |
| $200,000+ | 835 | 13.8% |
Family Income by Famaliy Size in Carteret borough
7+ person families (429 | 7.1%) account for the highest median family income in Carteret borough with $250,001 per family, while 7+ person families (429 | 7.1%) have the highest median income of $35,714 per family member.
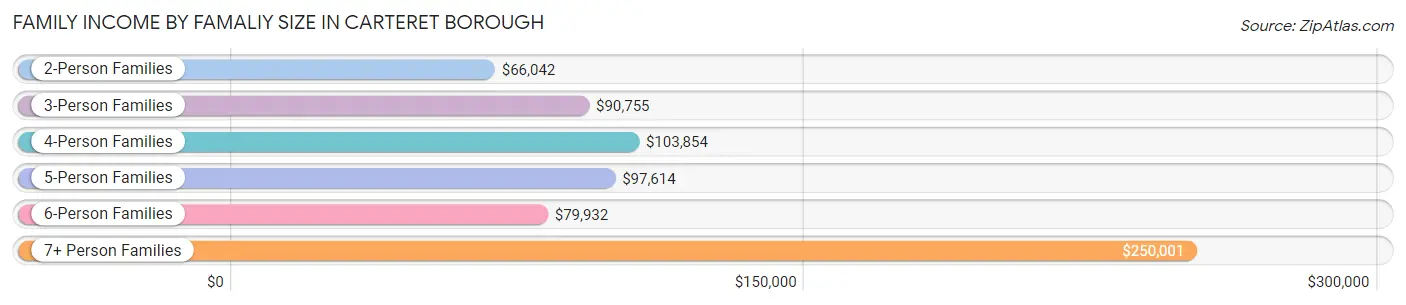
| Income Bracket | # Families | Median Income |
| 2-Person Families | 1,760 (29.1%) | $66,042 |
| 3-Person Families | 1,718 (28.4%) | $90,755 |
| 4-Person Families | 983 (16.3%) | $103,854 |
| 5-Person Families | 913 (15.1%) | $97,614 |
| 6-Person Families | 246 (4.1%) | $79,932 |
| 7+ Person Families | 429 (7.1%) | $250,001 |
| Total | 6,049 (100.0%) | $90,685 |
Family Income by Number of Earners in Carteret borough
The median family income in Carteret borough is $90,685, with families comprising 3+ earners (1,671) having the highest median family income of $156,148, while families with no earners (699) have the lowest median family income of $41,003, accounting for 27.6% and 11.6% of families, respectively.
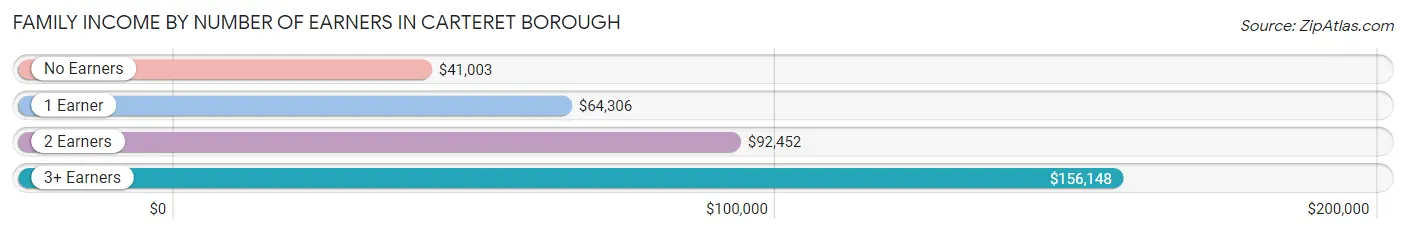
| Number of Earners | # Families | Median Income |
| No Earners | 699 (11.6%) | $41,003 |
| 1 Earner | 1,789 (29.6%) | $64,306 |
| 2 Earners | 1,890 (31.2%) | $92,452 |
| 3+ Earners | 1,671 (27.6%) | $156,148 |
| Total | 6,049 (100.0%) | $90,685 |
Household Income in Carteret borough
Household Income Brackets in Carteret borough
With 1,468 households falling in the category, the $50,000 to $74,999 income range is the most frequent in Carteret borough, accounting for 18.0% of all households. In contrast, only 236 households (2.9%) fall into the less than $10,000 income bracket, making it the least populous group.
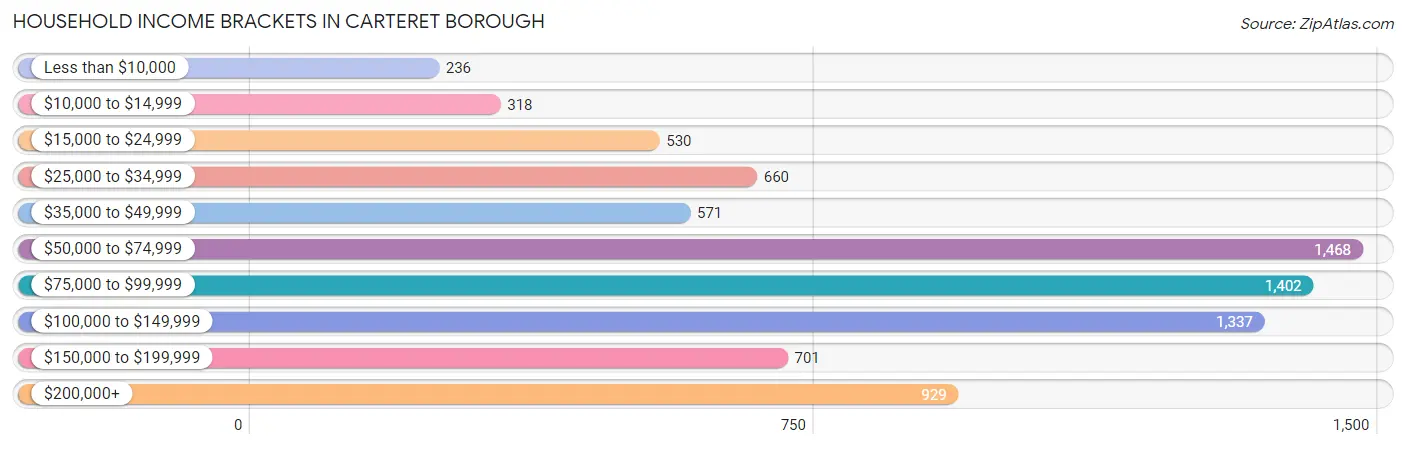
| Income Bracket | # Households | % Households |
| Less than $10,000 | 236 | 2.9% |
| $10,000 to $14,999 | 318 | 3.9% |
| $15,000 to $24,999 | 530 | 6.5% |
| $25,000 to $34,999 | 660 | 8.1% |
| $35,000 to $49,999 | 571 | 7.0% |
| $50,000 to $74,999 | 1,468 | 18.0% |
| $75,000 to $99,999 | 1,402 | 17.2% |
| $100,000 to $149,999 | 1,337 | 16.4% |
| $150,000 to $199,999 | 701 | 8.6% |
| $200,000+ | 929 | 11.4% |
Household Income by Householder Age in Carteret borough
The median household income in Carteret borough is $79,049, with the highest median household income of $92,316 found in the 25 to 44 years age bracket for the primary householder. A total of 2,681 households (32.9%) fall into this category. Meanwhile, the 15 to 24 years age bracket for the primary householder has the lowest median household income of $0, with 164 households (2.0%) in this group.
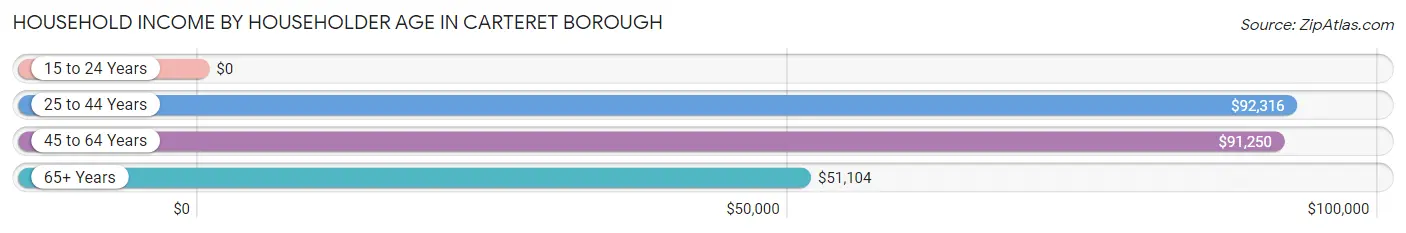
| Income Bracket | # Households | Median Income |
| 15 to 24 Years | 164 (2.0%) | $0 |
| 25 to 44 Years | 2,681 (32.9%) | $92,316 |
| 45 to 64 Years | 3,068 (37.6%) | $91,250 |
| 65+ Years | 2,240 (27.5%) | $51,104 |
| Total | 8,153 (100.0%) | $79,049 |
Poverty in Carteret borough
Income Below Poverty by Sex and Age in Carteret borough
With 9.3% poverty level for males and 11.0% for females among the residents of Carteret borough, under 5 year old males and 75 year old and over females are the most vulnerable to poverty, with 205 males (19.9%) and 272 females (23.4%) in their respective age groups living below the poverty level.
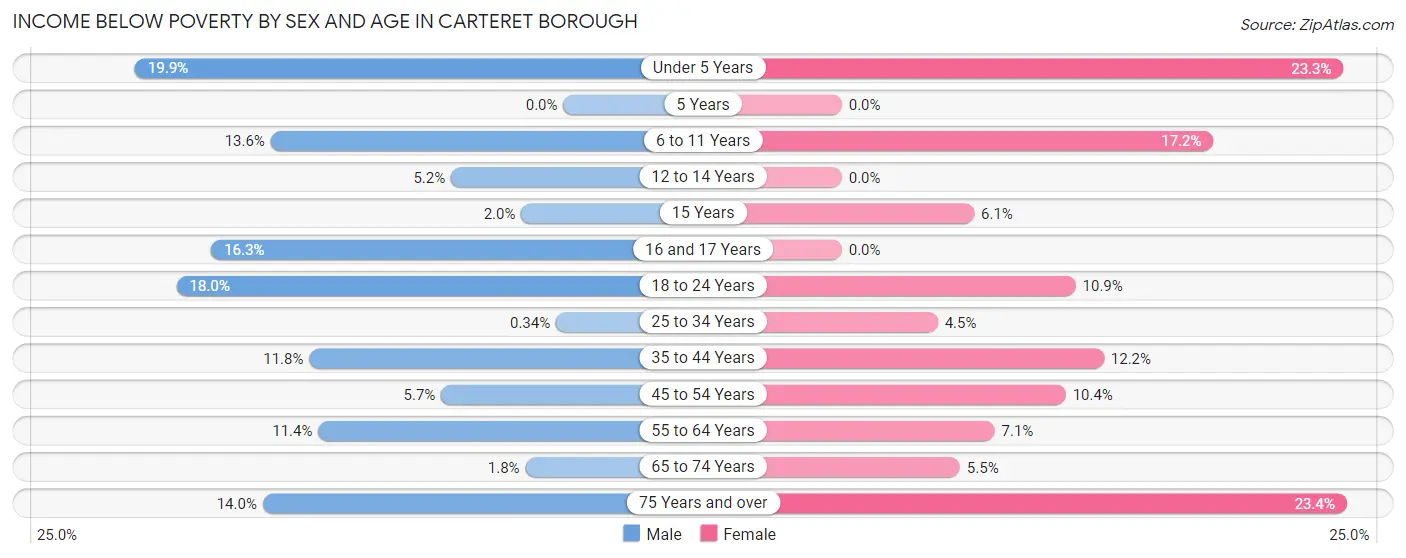
| Age Bracket | Male | Female |
| Under 5 Years | 205 (19.9%) | 195 (23.3%) |
| 5 Years | 0 (0.0%) | 0 (0.0%) |
| 6 to 11 Years | 115 (13.6%) | 126 (17.2%) |
| 12 to 14 Years | 34 (5.2%) | 0 (0.0%) |
| 15 Years | 8 (1.9%) | 14 (6.1%) |
| 16 and 17 Years | 58 (16.3%) | 0 (0.0%) |
| 18 to 24 Years | 175 (17.9%) | 165 (10.8%) |
| 25 to 34 Years | 6 (0.3%) | 76 (4.4%) |
| 35 to 44 Years | 165 (11.8%) | 216 (12.2%) |
| 45 to 54 Years | 79 (5.7%) | 155 (10.4%) |
| 55 to 64 Years | 220 (11.4%) | 112 (7.1%) |
| 65 to 74 Years | 17 (1.8%) | 47 (5.5%) |
| 75 Years and over | 84 (14.0%) | 272 (23.4%) |
| Total | 1,166 (9.3%) | 1,378 (11.0%) |
Income Above Poverty by Sex and Age in Carteret borough
According to the poverty statistics in Carteret borough, males aged 5 years and females aged 5 years are the age groups that are most secure financially, with 100.0% of males and 100.0% of females in these age groups living above the poverty line.
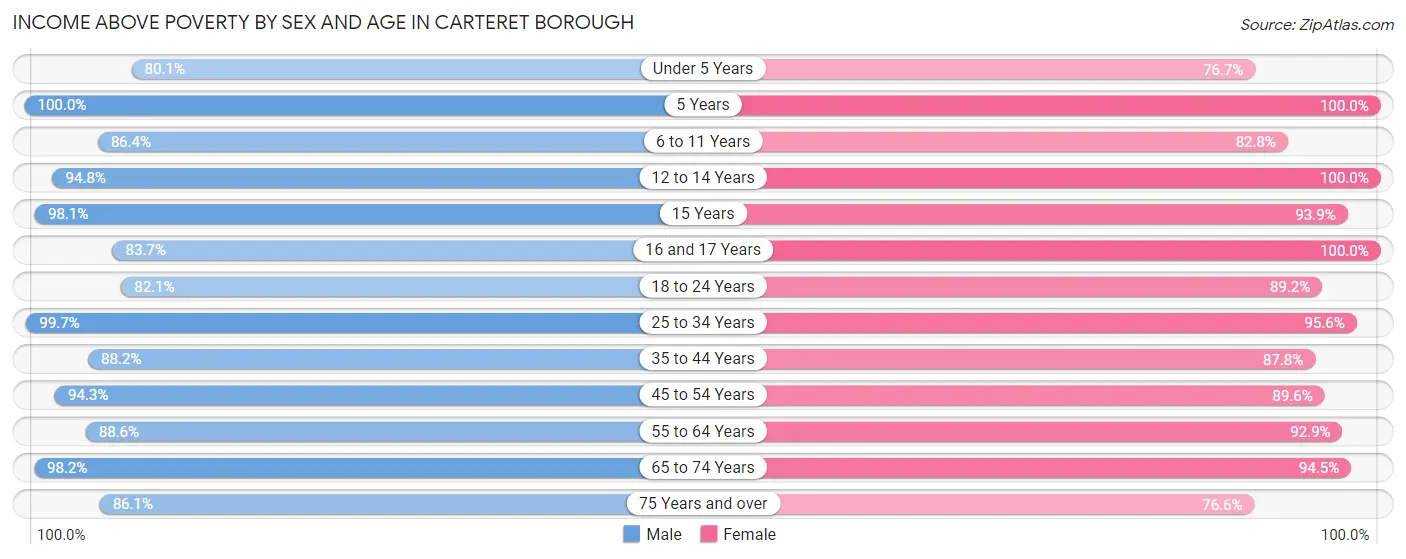
| Age Bracket | Male | Female |
| Under 5 Years | 826 (80.1%) | 643 (76.7%) |
| 5 Years | 230 (100.0%) | 69 (100.0%) |
| 6 to 11 Years | 732 (86.4%) | 605 (82.8%) |
| 12 to 14 Years | 619 (94.8%) | 197 (100.0%) |
| 15 Years | 403 (98.1%) | 214 (93.9%) |
| 16 and 17 Years | 297 (83.7%) | 356 (100.0%) |
| 18 to 24 Years | 800 (82.1%) | 1,356 (89.1%) |
| 25 to 34 Years | 1,768 (99.7%) | 1,632 (95.6%) |
| 35 to 44 Years | 1,234 (88.2%) | 1,560 (87.8%) |
| 45 to 54 Years | 1,314 (94.3%) | 1,337 (89.6%) |
| 55 to 64 Years | 1,715 (88.6%) | 1,467 (92.9%) |
| 65 to 74 Years | 948 (98.2%) | 810 (94.5%) |
| 75 Years and over | 518 (86.1%) | 889 (76.6%) |
| Total | 11,404 (90.7%) | 11,135 (89.0%) |
Income Below Poverty Among Married-Couple Families in Carteret borough
The poverty statistics for married-couple families in Carteret borough show that 6.4% or 269 of the total 4,235 families live below the poverty line. Families with 3 or 4 children have the highest poverty rate of 18.3%, comprising of 60 families. On the other hand, families with 5 or more children have the lowest poverty rate of 0.0%, which includes 0 families.
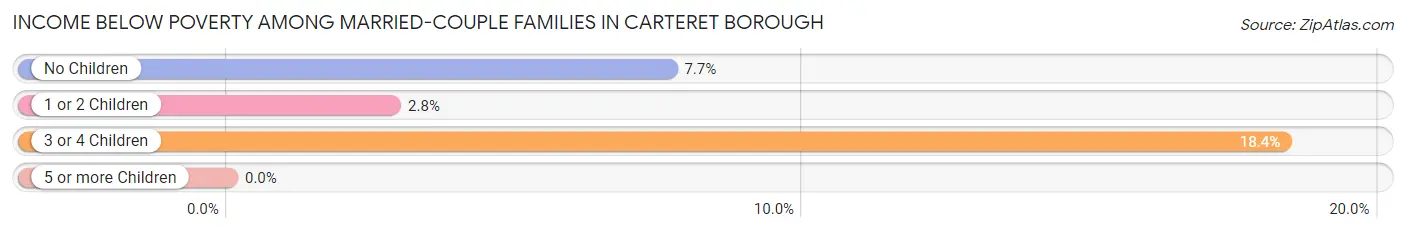
| Children | Above Poverty | Below Poverty |
| No Children | 1,908 (92.3%) | 158 (7.6%) |
| 1 or 2 Children | 1,745 (97.2%) | 51 (2.8%) |
| 3 or 4 Children | 267 (81.7%) | 60 (18.3%) |
| 5 or more Children | 46 (100.0%) | 0 (0.0%) |
| Total | 3,966 (93.6%) | 269 (6.4%) |
Income Below Poverty Among Single-Parent Households in Carteret borough
According to the poverty data in Carteret borough, 3.9% or 12 single-father households and 18.0% or 272 single-mother households are living below the poverty line. Among single-father households, those with 1 or 2 children have the highest poverty rate, with 10 households (25.0%) experiencing poverty. Likewise, among single-mother households, those with 3 or 4 children have the highest poverty rate, with 24 households (26.7%) falling below the poverty line.
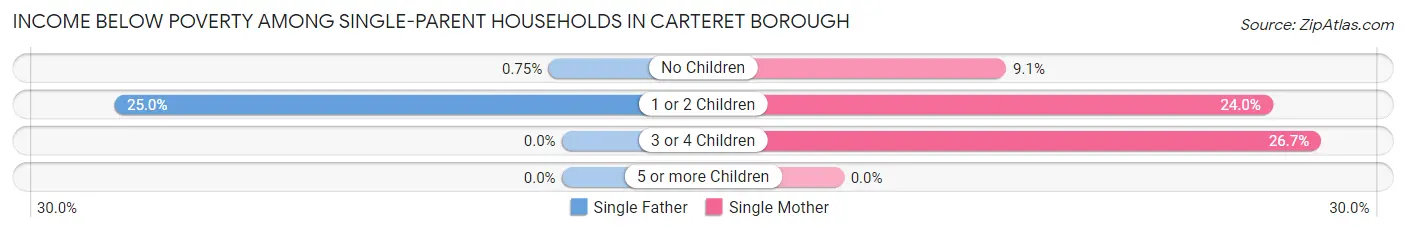
| Children | Single Father | Single Mother |
| No Children | 2 (0.7%) | 56 (9.1%) |
| 1 or 2 Children | 10 (25.0%) | 192 (24.0%) |
| 3 or 4 Children | 0 (0.0%) | 24 (26.7%) |
| 5 or more Children | 0 (0.0%) | 0 (0.0%) |
| Total | 12 (3.9%) | 272 (18.0%) |
Income Below Poverty Among Married-Couple vs Single-Parent Households in Carteret borough
The poverty data for Carteret borough shows that 269 of the married-couple family households (6.4%) and 284 of the single-parent households (15.7%) are living below the poverty level. Within the married-couple family households, those with 3 or 4 children have the highest poverty rate, with 60 households (18.3%) falling below the poverty line. Among the single-parent households, those with 3 or 4 children have the highest poverty rate, with 24 household (26.7%) living below poverty.
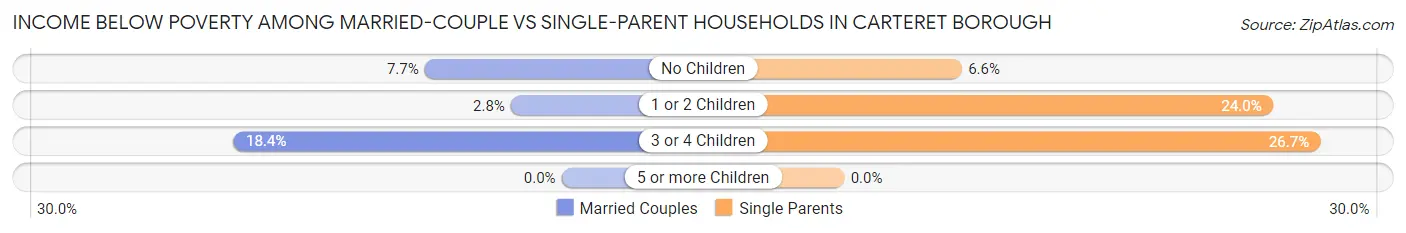
| Children | Married-Couple Families | Single-Parent Households |
| No Children | 158 (7.6%) | 58 (6.6%) |
| 1 or 2 Children | 51 (2.8%) | 202 (24.0%) |
| 3 or 4 Children | 60 (18.3%) | 24 (26.7%) |
| 5 or more Children | 0 (0.0%) | 0 (0.0%) |
| Total | 269 (6.4%) | 284 (15.7%) |
Race in Carteret borough
The most populous races in Carteret borough are Hispanic or Latino (8,868 | 35.2%), White / Caucasian (8,002 | 31.8%), and Asian (6,280 | 25.0%).
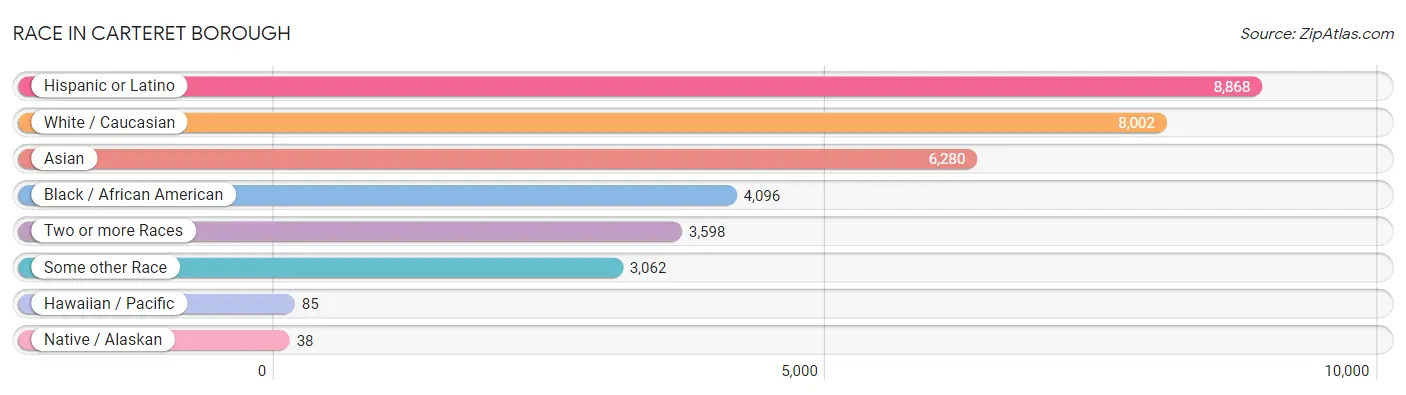
| Race | # Population | % Population |
| Asian | 6,280 | 25.0% |
| Black / African American | 4,096 | 16.3% |
| Hawaiian / Pacific | 85 | 0.3% |
| Hispanic or Latino | 8,868 | 35.2% |
| Native / Alaskan | 38 | 0.2% |
| White / Caucasian | 8,002 | 31.8% |
| Two or more Races | 3,598 | 14.3% |
| Some other Race | 3,062 | 12.2% |
| Total | 25,161 | 100.0% |
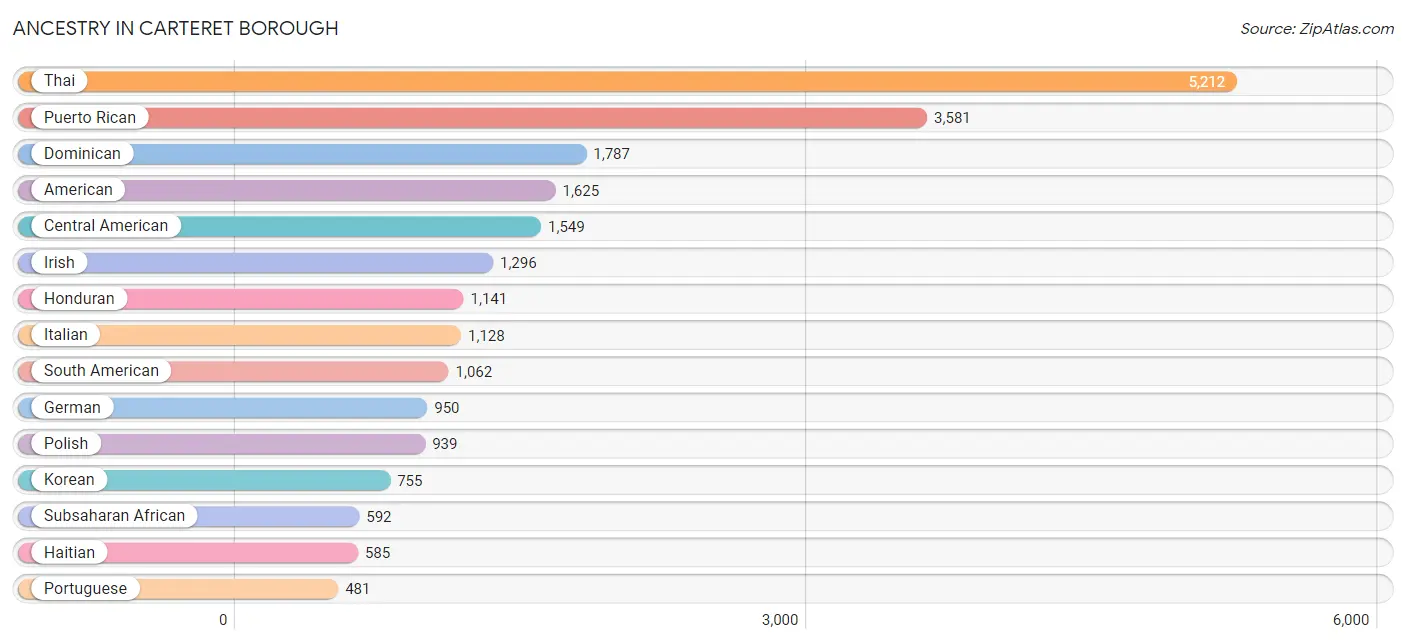
Ancestry in Carteret borough
The most populous ancestries reported in Carteret borough are Thai (5,212 | 20.7%), Puerto Rican (3,581 | 14.2%), Dominican (1,787 | 7.1%), American (1,625 | 6.5%), and Central American (1,549 | 6.2%), together accounting for 54.7% of all Carteret borough residents.
| Ancestry | # Population | % Population |
| African | 224 | 0.9% |
| American | 1,625 | 6.5% |
| Arab | 108 | 0.4% |
| Argentinean | 9 | 0.0% |
| Austrian | 12 | 0.1% |
| Barbadian | 8 | 0.0% |
| Bhutanese | 10 | 0.0% |
| Brazilian | 65 | 0.3% |
| Burmese | 70 | 0.3% |
| Cambodian | 4 | 0.0% |
| Central American | 1,549 | 6.2% |
| Central American Indian | 51 | 0.2% |
| Colombian | 422 | 1.7% |
| Cuban | 262 | 1.0% |
| Czech | 12 | 0.1% |
| Czechoslovakian | 12 | 0.1% |
| Danish | 5 | 0.0% |
| Dominican | 1,787 | 7.1% |
| Dutch | 117 | 0.5% |
| Eastern European | 91 | 0.4% |
| Ecuadorian | 100 | 0.4% |
| English | 277 | 1.1% |
| European | 41 | 0.2% |
| French | 87 | 0.4% |
| French Canadian | 30 | 0.1% |
| German | 950 | 3.8% |
| Ghanaian | 241 | 1.0% |
| Greek | 16 | 0.1% |
| Guatemalan | 110 | 0.4% |
| Guyanese | 49 | 0.2% |
| Haitian | 585 | 2.3% |
| Honduran | 1,141 | 4.5% |
| Hungarian | 373 | 1.5% |
| Indian (Asian) | 67 | 0.3% |
| Irish | 1,296 | 5.1% |
| Italian | 1,128 | 4.5% |
| Jamaican | 146 | 0.6% |
| Korean | 755 | 3.0% |
| Lithuanian | 12 | 0.1% |
| Mexican | 302 | 1.2% |
| Nigerian | 81 | 0.3% |
| Panamanian | 166 | 0.7% |
| Peruvian | 463 | 1.8% |
| Polish | 939 | 3.7% |
| Portuguese | 481 | 1.9% |
| Puerto Rican | 3,581 | 14.2% |
| Russian | 65 | 0.3% |
| Salvadoran | 132 | 0.5% |
| Scandinavian | 17 | 0.1% |
| Scotch-Irish | 26 | 0.1% |
| Scottish | 35 | 0.1% |
| Slavic | 76 | 0.3% |
| Slovak | 118 | 0.5% |
| Slovene | 9 | 0.0% |
| South American | 1,062 | 4.2% |
| South American Indian | 17 | 0.1% |
| Spaniard | 146 | 0.6% |
| Spanish | 95 | 0.4% |
| Subsaharan African | 592 | 2.4% |
| Swedish | 45 | 0.2% |
| Syrian | 29 | 0.1% |
| Thai | 5,212 | 20.7% |
| Ugandan | 25 | 0.1% |
| Ukrainian | 165 | 0.7% |
| Uruguayan | 32 | 0.1% |
| Venezuelan | 36 | 0.1% |
| Vietnamese | 8 | 0.0% |
| West Indian | 111 | 0.4% | View All 68 Rows |
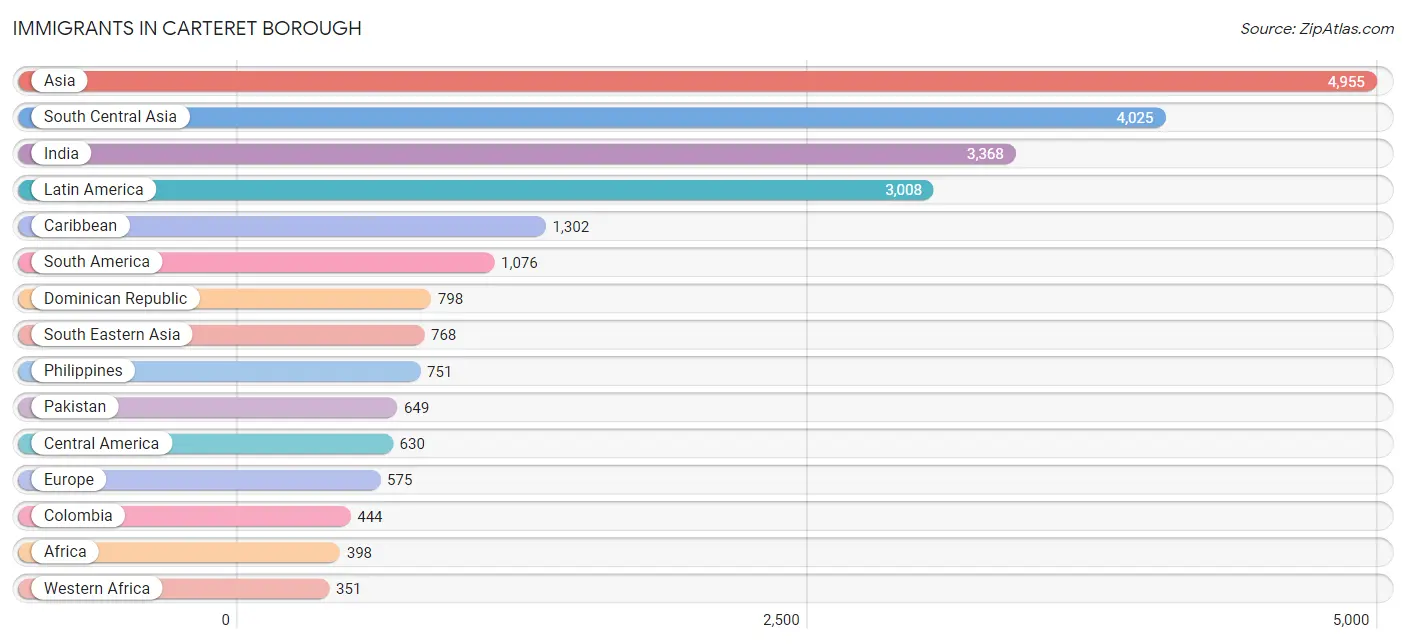
Immigrants in Carteret borough
The most numerous immigrant groups reported in Carteret borough came from Asia (4,955 | 19.7%), South Central Asia (4,025 | 16.0%), India (3,368 | 13.4%), Latin America (3,008 | 12.0%), and Caribbean (1,302 | 5.2%), together accounting for 66.2% of all Carteret borough residents.
| Immigration Origin | # Population | % Population |
| Africa | 398 | 1.6% |
| Argentina | 33 | 0.1% |
| Asia | 4,955 | 19.7% |
| Bangladesh | 8 | 0.0% |
| Brazil | 72 | 0.3% |
| Cambodia | 17 | 0.1% |
| Caribbean | 1,302 | 5.2% |
| Central America | 630 | 2.5% |
| China | 33 | 0.1% |
| Colombia | 444 | 1.8% |
| Cuba | 176 | 0.7% |
| Dominican Republic | 798 | 3.2% |
| Eastern Africa | 47 | 0.2% |
| Eastern Asia | 57 | 0.2% |
| Eastern Europe | 247 | 1.0% |
| Ecuador | 67 | 0.3% |
| El Salvador | 51 | 0.2% |
| Ethiopia | 11 | 0.0% |
| Europe | 575 | 2.3% |
| Germany | 47 | 0.2% |
| Ghana | 233 | 0.9% |
| Guatemala | 95 | 0.4% |
| Guyana | 80 | 0.3% |
| Haiti | 223 | 0.9% |
| Honduras | 299 | 1.2% |
| Hungary | 14 | 0.1% |
| India | 3,368 | 13.4% |
| Italy | 43 | 0.2% |
| Jamaica | 83 | 0.3% |
| Korea | 24 | 0.1% |
| Latin America | 3,008 | 12.0% |
| Mexico | 96 | 0.4% |
| Nigeria | 63 | 0.3% |
| Northern Europe | 8 | 0.0% |
| Pakistan | 649 | 2.6% |
| Panama | 89 | 0.4% |
| Peru | 312 | 1.2% |
| Philippines | 751 | 3.0% |
| Poland | 112 | 0.4% |
| Portugal | 230 | 0.9% |
| Russia | 55 | 0.2% |
| Saudi Arabia | 42 | 0.2% |
| South America | 1,076 | 4.3% |
| South Central Asia | 4,025 | 16.0% |
| South Eastern Asia | 768 | 3.0% |
| Southern Europe | 273 | 1.1% |
| Uganda | 25 | 0.1% |
| Ukraine | 66 | 0.3% |
| Uruguay | 32 | 0.1% |
| Venezuela | 36 | 0.1% |
| Western Africa | 351 | 1.4% |
| Western Asia | 66 | 0.3% |
| Western Europe | 47 | 0.2% |
| Zimbabwe | 11 | 0.0% | View All 54 Rows |
Sex and Age in Carteret borough
Sex and Age in Carteret borough
The most populous age groups in Carteret borough are Under 5 Years (1,067 | 8.5%) for men and 40 to 44 Years (1,110 | 8.8%) for women.
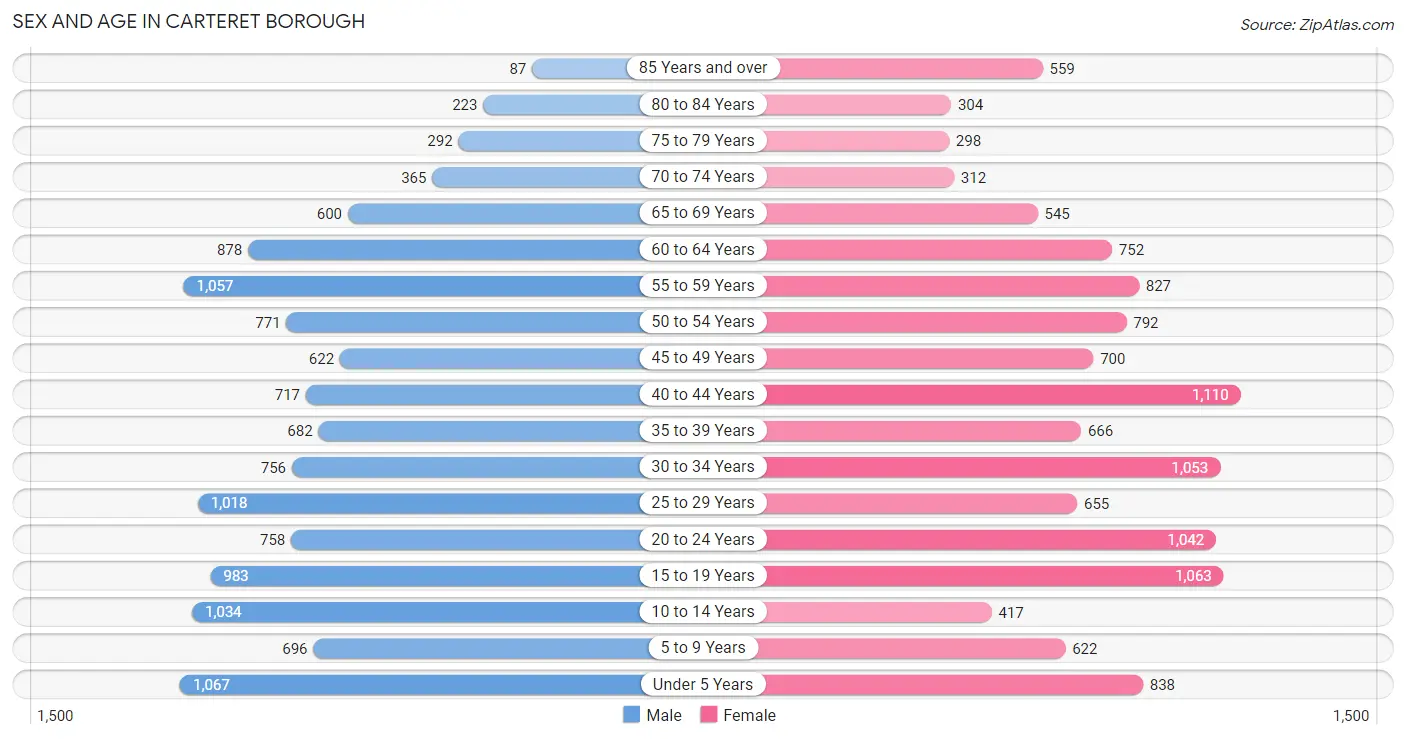
| Age Bracket | Male | Female |
| Under 5 Years | 1,067 (8.5%) | 838 (6.7%) |
| 5 to 9 Years | 696 (5.5%) | 622 (5.0%) |
| 10 to 14 Years | 1,034 (8.2%) | 417 (3.3%) |
| 15 to 19 Years | 983 (7.8%) | 1,063 (8.5%) |
| 20 to 24 Years | 758 (6.0%) | 1,042 (8.3%) |
| 25 to 29 Years | 1,018 (8.1%) | 655 (5.2%) |
| 30 to 34 Years | 756 (6.0%) | 1,053 (8.4%) |
| 35 to 39 Years | 682 (5.4%) | 666 (5.3%) |
| 40 to 44 Years | 717 (5.7%) | 1,110 (8.8%) |
| 45 to 49 Years | 622 (4.9%) | 700 (5.6%) |
| 50 to 54 Years | 771 (6.1%) | 792 (6.3%) |
| 55 to 59 Years | 1,057 (8.4%) | 827 (6.6%) |
| 60 to 64 Years | 878 (7.0%) | 752 (6.0%) |
| 65 to 69 Years | 600 (4.8%) | 545 (4.3%) |
| 70 to 74 Years | 365 (2.9%) | 312 (2.5%) |
| 75 to 79 Years | 292 (2.3%) | 298 (2.4%) |
| 80 to 84 Years | 223 (1.8%) | 304 (2.4%) |
| 85 Years and over | 87 (0.7%) | 559 (4.4%) |
| Total | 12,606 (100.0%) | 12,555 (100.0%) |
Families and Households in Carteret borough
Median Family Size in Carteret borough
The median family size in Carteret borough is 3.65 persons per family, with married-couple families (4,235 | 70.0%) accounting for the largest median family size of 3.92 persons per family. On the other hand, single male/father families (306 | 5.1%) represent the smallest median family size with 2.55 persons per family.
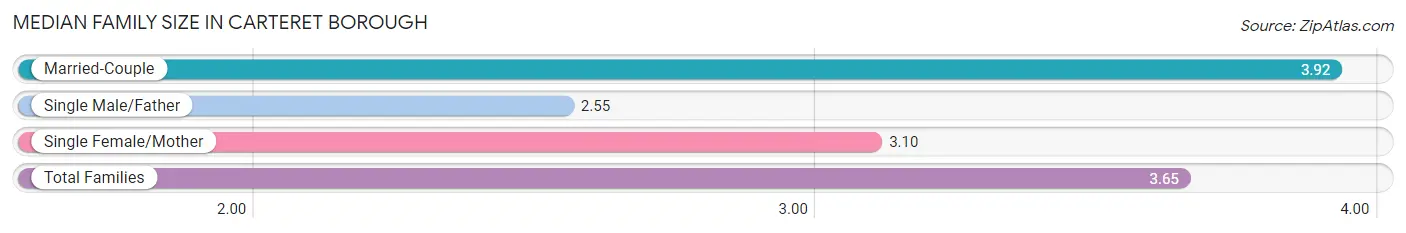
| Family Type | # Families | Family Size |
| Married-Couple | 4,235 (70.0%) | 3.92 |
| Single Male/Father | 306 (5.1%) | 2.55 |
| Single Female/Mother | 1,508 (24.9%) | 3.10 |
| Total Families | 6,049 (100.0%) | 3.65 |
Median Household Size in Carteret borough
The median household size in Carteret borough is 3.08 persons per household, with married-couple households (4,235 | 51.9%) accounting for the largest median household size of 3.95 persons per household. non-family households (2,104 | 25.8%) represent the smallest median household size with 1.11 persons per household.
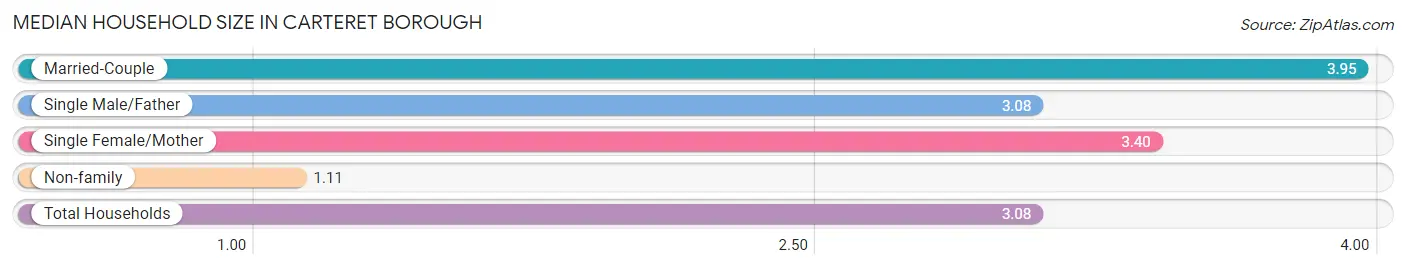
| Household Type | # Households | Household Size |
| Married-Couple | 4,235 (51.9%) | 3.95 |
| Single Male/Father | 306 (3.7%) | 3.08 |
| Single Female/Mother | 1,508 (18.5%) | 3.40 |
| Non-family | 2,104 (25.8%) | 1.11 |
| Total Households | 8,153 (100.0%) | 3.08 |
Household Size by Marriage Status in Carteret borough
Out of a total of 8,153 households in Carteret borough, 6,049 (74.2%) are family households, while 2,104 (25.8%) are nonfamily households. The most numerous type of family households are 3-person households, comprising 1,745, and the most common type of nonfamily households are 1-person households, comprising 1,907.
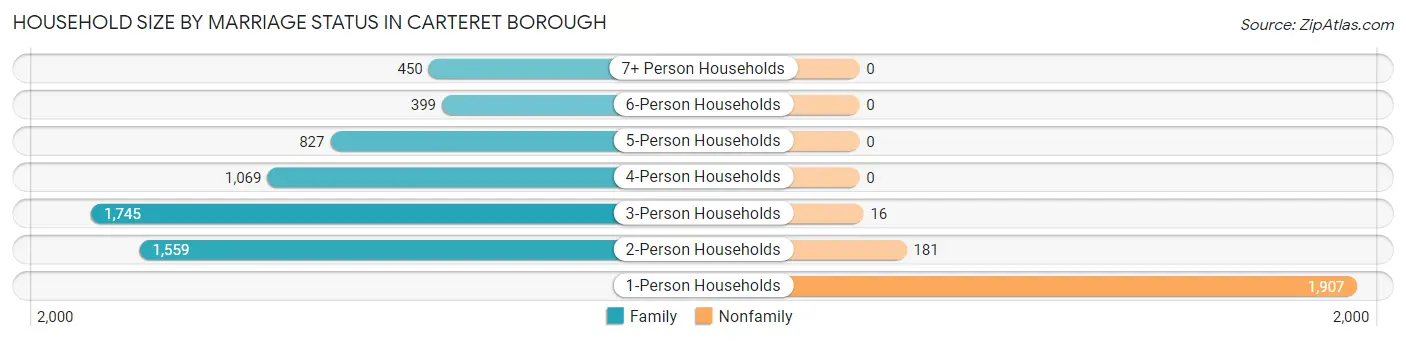
| Household Size | Family Households | Nonfamily Households |
| 1-Person Households | - | 1,907 (23.4%) |
| 2-Person Households | 1,559 (19.1%) | 181 (2.2%) |
| 3-Person Households | 1,745 (21.4%) | 16 (0.2%) |
| 4-Person Households | 1,069 (13.1%) | 0 (0.0%) |
| 5-Person Households | 827 (10.1%) | 0 (0.0%) |
| 6-Person Households | 399 (4.9%) | 0 (0.0%) |
| 7+ Person Households | 450 (5.5%) | 0 (0.0%) |
| Total | 6,049 (74.2%) | 2,104 (25.8%) |
Female Fertility in Carteret borough
Fertility by Age in Carteret borough
Average fertility rate in Carteret borough is 73.0 births per 1,000 women. Women in the age bracket of 20 to 34 years have the highest fertility rate with 149.0 births per 1,000 women. Women in the age bracket of 20 to 34 years acount for 87.4% of all women with births.
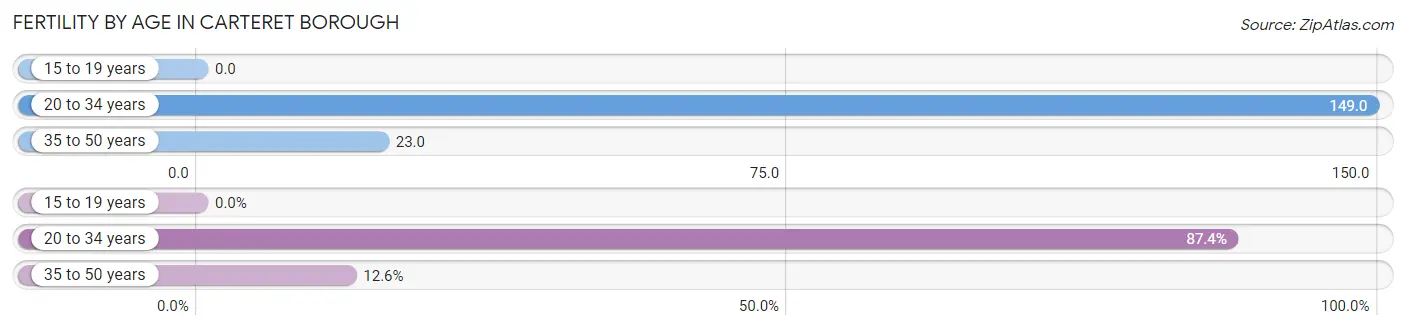
| Age Bracket | Women with Births | Births / 1,000 Women |
| 15 to 19 years | 0 (0.0%) | 0.0 |
| 20 to 34 years | 410 (87.4%) | 149.0 |
| 35 to 50 years | 59 (12.6%) | 23.0 |
| Total | 469 (100.0%) | 73.0 |
Fertility by Age by Marriage Status in Carteret borough
64.6% of women with births (469) in Carteret borough are married. The highest percentage of unmarried women with births falls into 35 to 50 years age bracket with 64.4% of them unmarried at the time of birth, while the lowest percentage of unmarried women with births belong to 20 to 34 years age bracket with 31.2% of them unmarried.
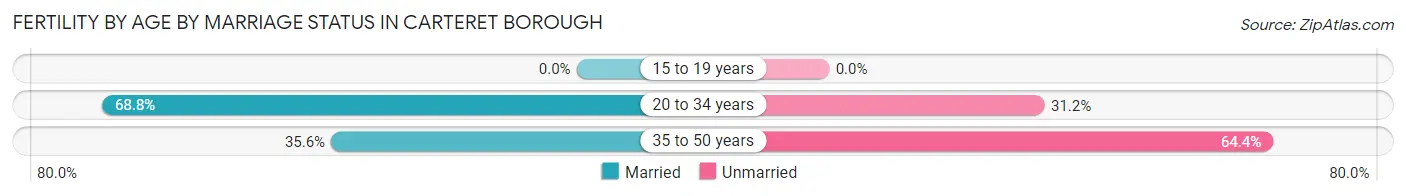
| Age Bracket | Married | Unmarried |
| 15 to 19 years | 0 (0.0%) | 0 (0.0%) |
| 20 to 34 years | 282 (68.8%) | 128 (31.2%) |
| 35 to 50 years | 21 (35.6%) | 38 (64.4%) |
| Total | 303 (64.6%) | 166 (35.4%) |
Fertility by Education in Carteret borough
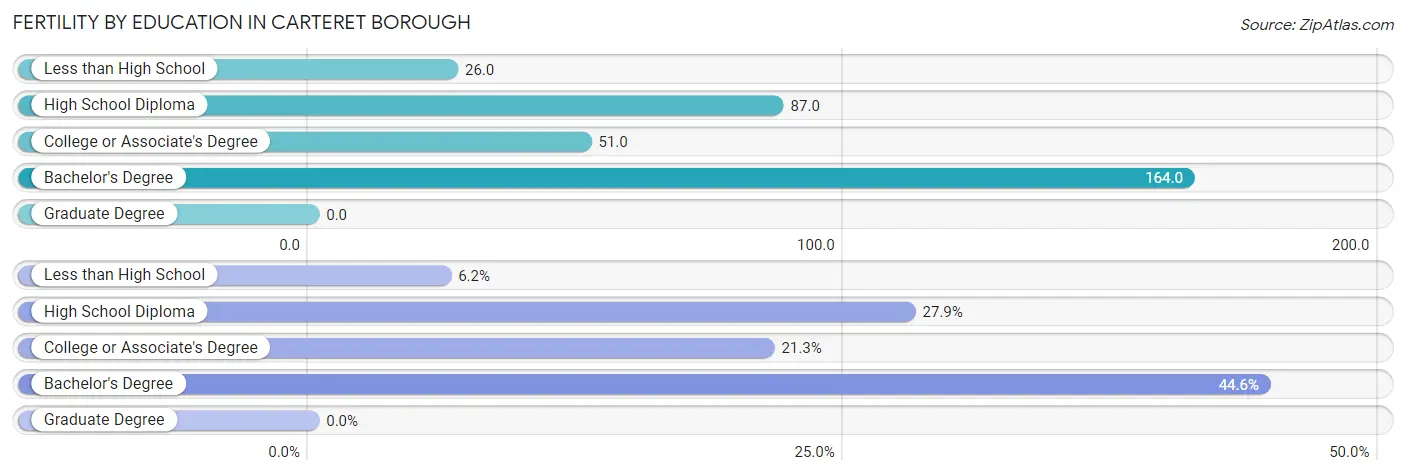
| Educational Attainment | Women with Births | Births / 1,000 Women |
| Less than High School | 29 (6.2%) | 26.0 |
| High School Diploma | 131 (27.9%) | 87.0 |
| College or Associate's Degree | 100 (21.3%) | 51.0 |
| Bachelor's Degree | 209 (44.6%) | 164.0 |
| Graduate Degree | 0 (0.0%) | 0.0 |
| Total | 469 (100.0%) | 73.0 |
Fertility by Education by Marriage Status in Carteret borough
35.4% of women with births in Carteret borough are unmarried. Women with the educational attainment of less than high school are most likely to be married with 100.0% of them married at childbirth, while women with the educational attainment of high school diploma are least likely to be married with 97.7% of them unmarried at childbirth.
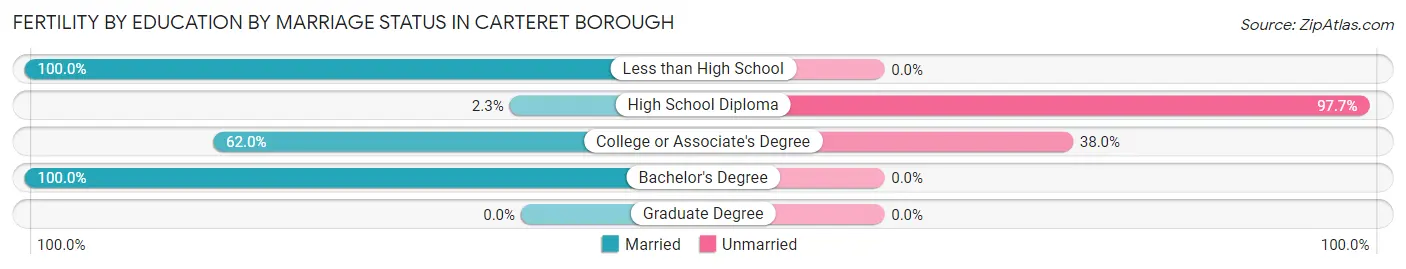
| Educational Attainment | Married | Unmarried |
| Less than High School | 29 (100.0%) | 0 (0.0%) |
| High School Diploma | 3 (2.3%) | 128 (97.7%) |
| College or Associate's Degree | 62 (62.0%) | 38 (38.0%) |
| Bachelor's Degree | 209 (100.0%) | 0 (0.0%) |
| Graduate Degree | 0 (0.0%) | 0 (0.0%) |
| Total | 303 (64.6%) | 166 (35.4%) |
Employment Characteristics in Carteret borough
Employment by Class of Employer in Carteret borough
Among the 11,598 employed individuals in Carteret borough, private company employees (8,254 | 71.2%), state government employees (843 | 7.3%), and not-for-profit organizations (768 | 6.6%) make up the most common classes of employment.
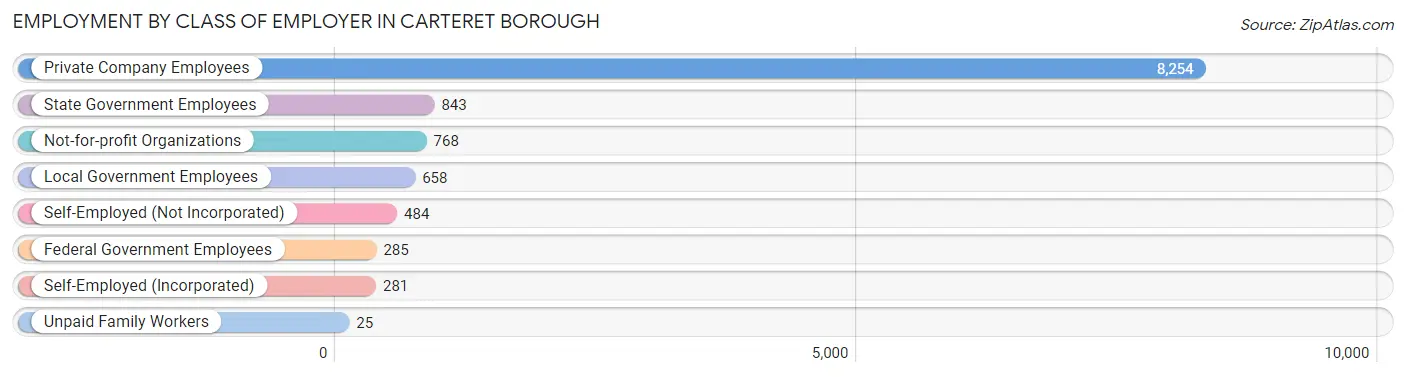
| Employer Class | # Employees | % Employees |
| Private Company Employees | 8,254 | 71.2% |
| Self-Employed (Incorporated) | 281 | 2.4% |
| Self-Employed (Not Incorporated) | 484 | 4.2% |
| Not-for-profit Organizations | 768 | 6.6% |
| Local Government Employees | 658 | 5.7% |
| State Government Employees | 843 | 7.3% |
| Federal Government Employees | 285 | 2.5% |
| Unpaid Family Workers | 25 | 0.2% |
| Total | 11,598 | 100.0% |
Employment Status by Age in Carteret borough
According to the labor force statistics for Carteret borough, out of the total population over 16 years of age (19,848), 64.0% or 12,703 individuals are in the labor force, with 7.3% or 927 of them unemployed. The age group with the highest labor force participation rate is 35 to 44 years, with 89.8% or 2,851 individuals in the labor force. Within the labor force, the 65 to 74 years age range has the highest percentage of unemployed individuals, with 33.4% or 206 of them being unemployed.
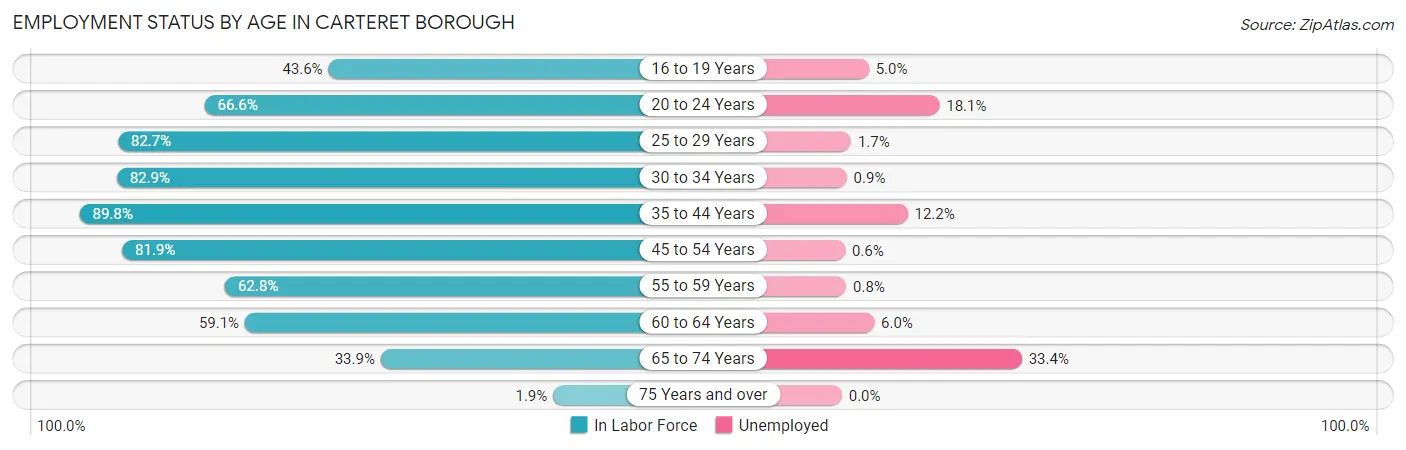
| Age Bracket | In Labor Force | Unemployed |
| 16 to 19 Years | 613 (43.6%) | 31 (5.0%) |
| 20 to 24 Years | 1,199 (66.6%) | 217 (18.1%) |
| 25 to 29 Years | 1,384 (82.7%) | 24 (1.7%) |
| 30 to 34 Years | 1,500 (82.9%) | 14 (0.9%) |
| 35 to 44 Years | 2,851 (89.8%) | 348 (12.2%) |
| 45 to 54 Years | 2,363 (81.9%) | 14 (0.6%) |
| 55 to 59 Years | 1,183 (62.8%) | 9 (0.8%) |
| 60 to 64 Years | 963 (59.1%) | 58 (6.0%) |
| 65 to 74 Years | 618 (33.9%) | 206 (33.4%) |
| 75 Years and over | 33 (1.9%) | 0 (0.0%) |
| Total | 12,703 (64.0%) | 927 (7.3%) |
Employment Status by Educational Attainment in Carteret borough
According to labor force statistics for Carteret borough, 78.5% of individuals (10,249) out of the total population between 25 and 64 years of age (13,056) are in the labor force, with 4.6% or 471 of them being unemployed. The group with the highest labor force participation rate are those with the educational attainment of bachelor's degree or higher, with 85.8% or 3,367 individuals in the labor force. Within the labor force, individuals with college / associate degree education have the highest percentage of unemployment, with 10.8% or 278 of them being unemployed.
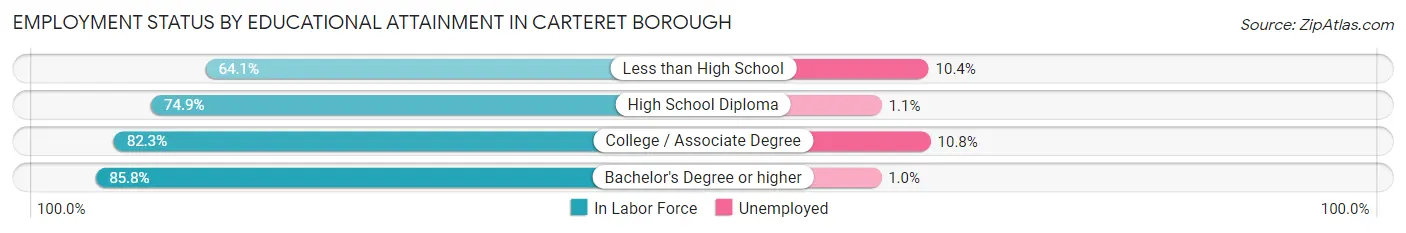
| Educational Attainment | In Labor Force | Unemployed |
| Less than High School | 1,167 (64.1%) | 189 (10.4%) |
| High School Diploma | 3,135 (74.9%) | 46 (1.1%) |
| College / Associate Degree | 2,572 (82.3%) | 338 (10.8%) |
| Bachelor's Degree or higher | 3,367 (85.8%) | 39 (1.0%) |
| Total | 10,249 (78.5%) | 601 (4.6%) |
Employment Occupations by Sex in Carteret borough
Management, Business, Science and Arts Occupations
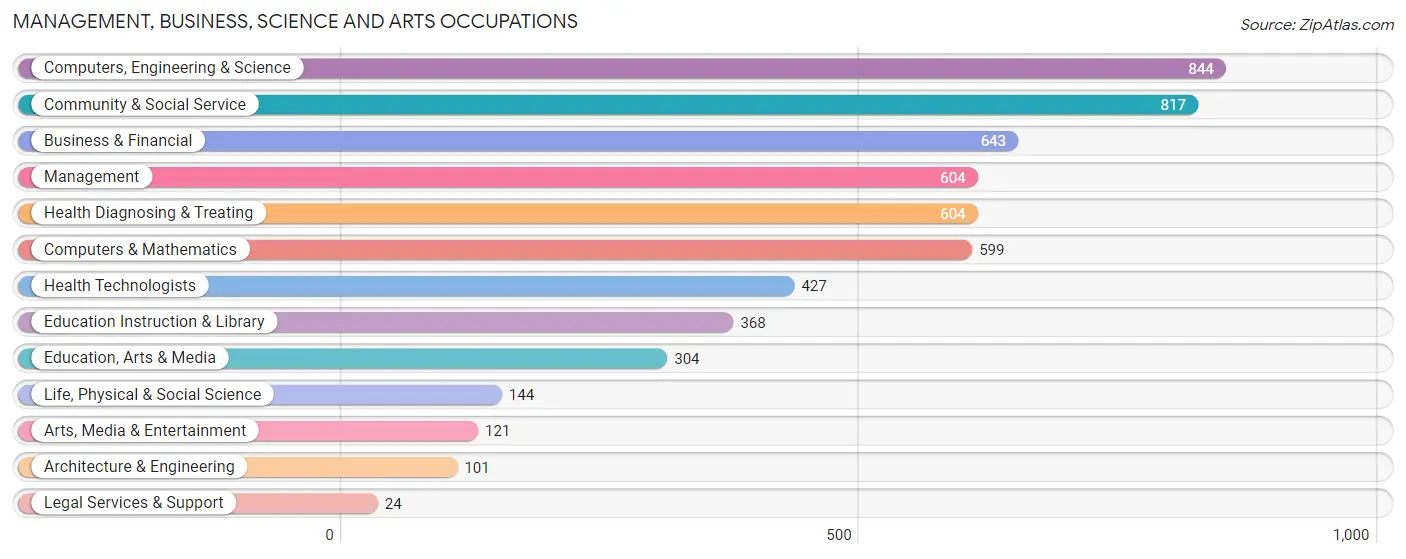
The most common Management, Business, Science and Arts occupations in Carteret borough are Computers, Engineering & Science (844 | 7.2%), Community & Social Service (817 | 6.9%), Business & Financial (643 | 5.5%), Management (604 | 5.1%), and Health Diagnosing & Treating (604 | 5.1%).
Management, Business, Science and Arts Occupations by Sex
Within the Management, Business, Science and Arts occupations in Carteret borough, the most male-oriented occupations are Legal Services & Support (100.0%), Arts, Media & Entertainment (94.2%), and Architecture & Engineering (87.1%), while the most female-oriented occupations are Life, Physical & Social Science (84.7%), Health Diagnosing & Treating (83.6%), and Education Instruction & Library (82.1%).
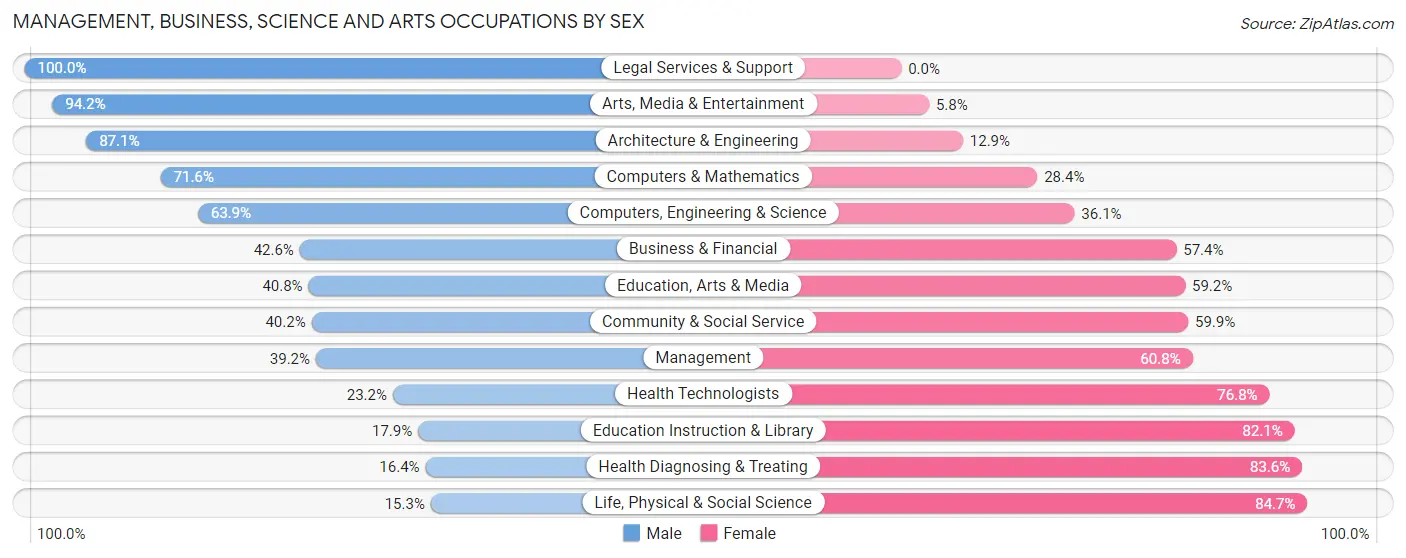
| Occupation | Male | Female |
| Management | 237 (39.2%) | 367 (60.8%) |
| Business & Financial | 274 (42.6%) | 369 (57.4%) |
| Computers, Engineering & Science | 539 (63.9%) | 305 (36.1%) |
| Computers & Mathematics | 429 (71.6%) | 170 (28.4%) |
| Architecture & Engineering | 88 (87.1%) | 13 (12.9%) |
| Life, Physical & Social Science | 22 (15.3%) | 122 (84.7%) |
| Community & Social Service | 328 (40.2%) | 489 (59.9%) |
| Education, Arts & Media | 124 (40.8%) | 180 (59.2%) |
| Legal Services & Support | 24 (100.0%) | 0 (0.0%) |
| Education Instruction & Library | 66 (17.9%) | 302 (82.1%) |
| Arts, Media & Entertainment | 114 (94.2%) | 7 (5.8%) |
| Health Diagnosing & Treating | 99 (16.4%) | 505 (83.6%) |
| Health Technologists | 99 (23.2%) | 328 (76.8%) |
| Total (Category) | 1,477 (42.1%) | 2,035 (57.9%) |
| Total (Overall) | 6,051 (51.3%) | 5,732 (48.6%) |
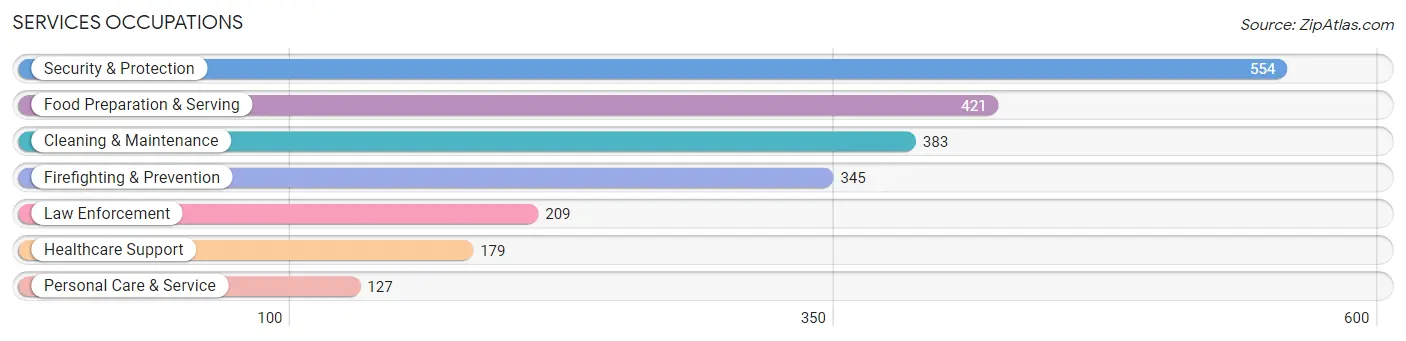
Services Occupations
The most common Services occupations in Carteret borough are Security & Protection (554 | 4.7%), Food Preparation & Serving (421 | 3.6%), Cleaning & Maintenance (383 | 3.3%), Firefighting & Prevention (345 | 2.9%), and Law Enforcement (209 | 1.8%).
Services Occupations by Sex
Within the Services occupations in Carteret borough, the most male-oriented occupations are Security & Protection (100.0%), Firefighting & Prevention (100.0%), and Law Enforcement (100.0%), while the most female-oriented occupations are Healthcare Support (92.7%), Cleaning & Maintenance (56.4%), and Food Preparation & Serving (27.3%).
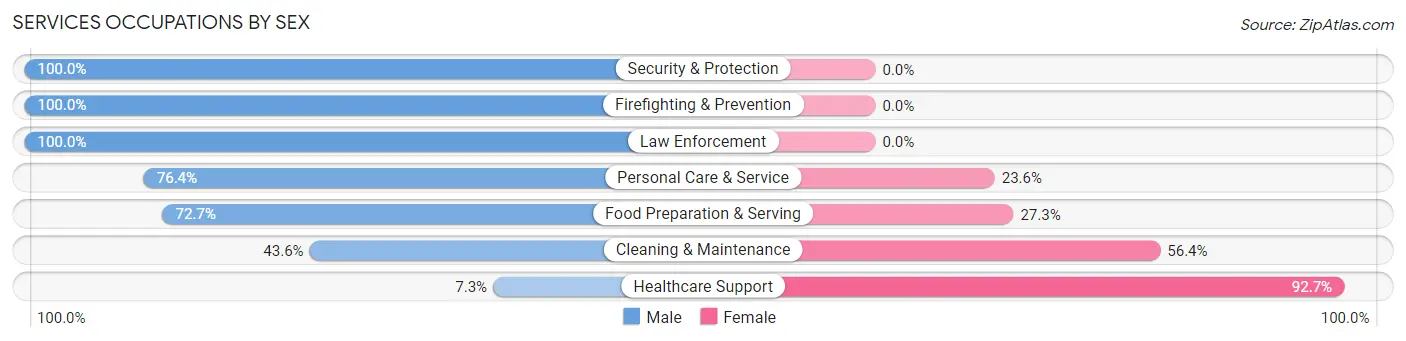
| Occupation | Male | Female |
| Healthcare Support | 13 (7.3%) | 166 (92.7%) |
| Security & Protection | 554 (100.0%) | 0 (0.0%) |
| Firefighting & Prevention | 345 (100.0%) | 0 (0.0%) |
| Law Enforcement | 209 (100.0%) | 0 (0.0%) |
| Food Preparation & Serving | 306 (72.7%) | 115 (27.3%) |
| Cleaning & Maintenance | 167 (43.6%) | 216 (56.4%) |
| Personal Care & Service | 97 (76.4%) | 30 (23.6%) |
| Total (Category) | 1,137 (68.3%) | 527 (31.7%) |
| Total (Overall) | 6,051 (51.3%) | 5,732 (48.6%) |
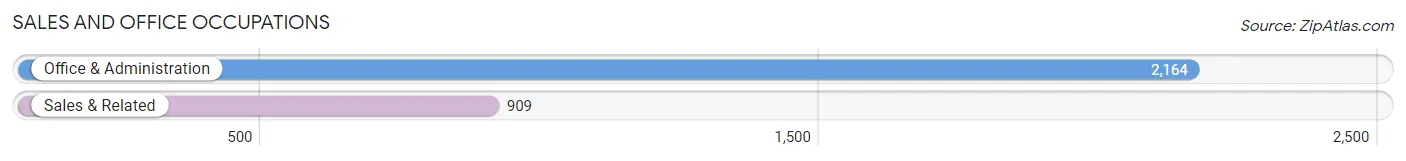
Sales and Office Occupations
The most common Sales and Office occupations in Carteret borough are Office & Administration (2,164 | 18.4%), and Sales & Related (909 | 7.7%).
Sales and Office Occupations by Sex
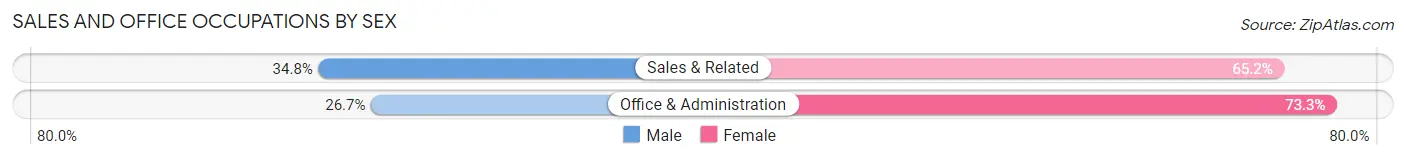
| Occupation | Male | Female |
| Sales & Related | 316 (34.8%) | 593 (65.2%) |
| Office & Administration | 577 (26.7%) | 1,587 (73.3%) |
| Total (Category) | 893 (29.1%) | 2,180 (70.9%) |
| Total (Overall) | 6,051 (51.3%) | 5,732 (48.6%) |
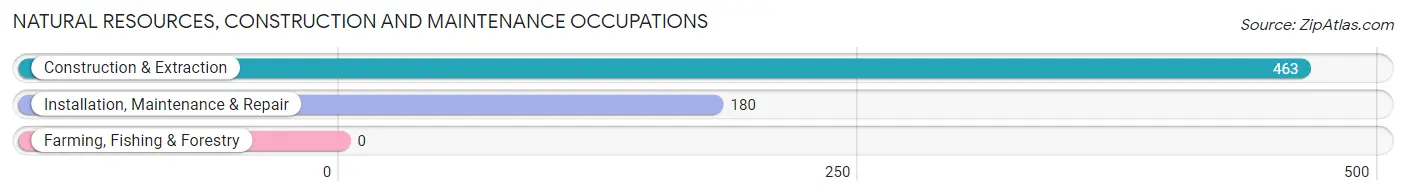
Natural Resources, Construction and Maintenance Occupations
The most common Natural Resources, Construction and Maintenance occupations in Carteret borough are Construction & Extraction (463 | 3.9%), and Installation, Maintenance & Repair (180 | 1.5%).
Natural Resources, Construction and Maintenance Occupations by Sex
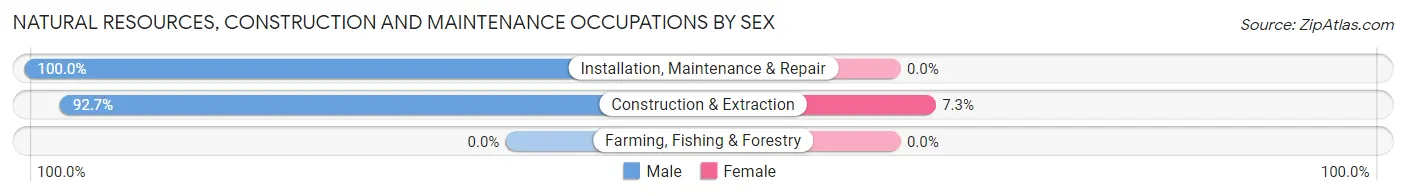
| Occupation | Male | Female |
| Farming, Fishing & Forestry | 0 (0.0%) | 0 (0.0%) |
| Construction & Extraction | 429 (92.7%) | 34 (7.3%) |
| Installation, Maintenance & Repair | 180 (100.0%) | 0 (0.0%) |
| Total (Category) | 609 (94.7%) | 34 (5.3%) |
| Total (Overall) | 6,051 (51.3%) | 5,732 (48.6%) |
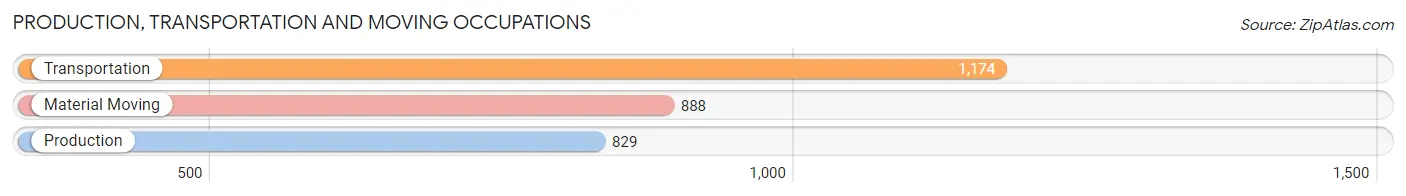
Production, Transportation and Moving Occupations
The most common Production, Transportation and Moving occupations in Carteret borough are Transportation (1,174 | 10.0%), Material Moving (888 | 7.5%), and Production (829 | 7.0%).
Production, Transportation and Moving Occupations by Sex
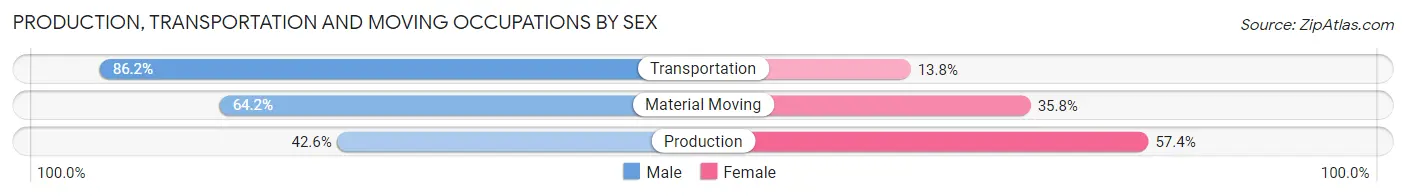
| Occupation | Male | Female |
| Production | 353 (42.6%) | 476 (57.4%) |
| Transportation | 1,012 (86.2%) | 162 (13.8%) |
| Material Moving | 570 (64.2%) | 318 (35.8%) |
| Total (Category) | 1,935 (66.9%) | 956 (33.1%) |
| Total (Overall) | 6,051 (51.3%) | 5,732 (48.6%) |
Employment Industries by Sex in Carteret borough
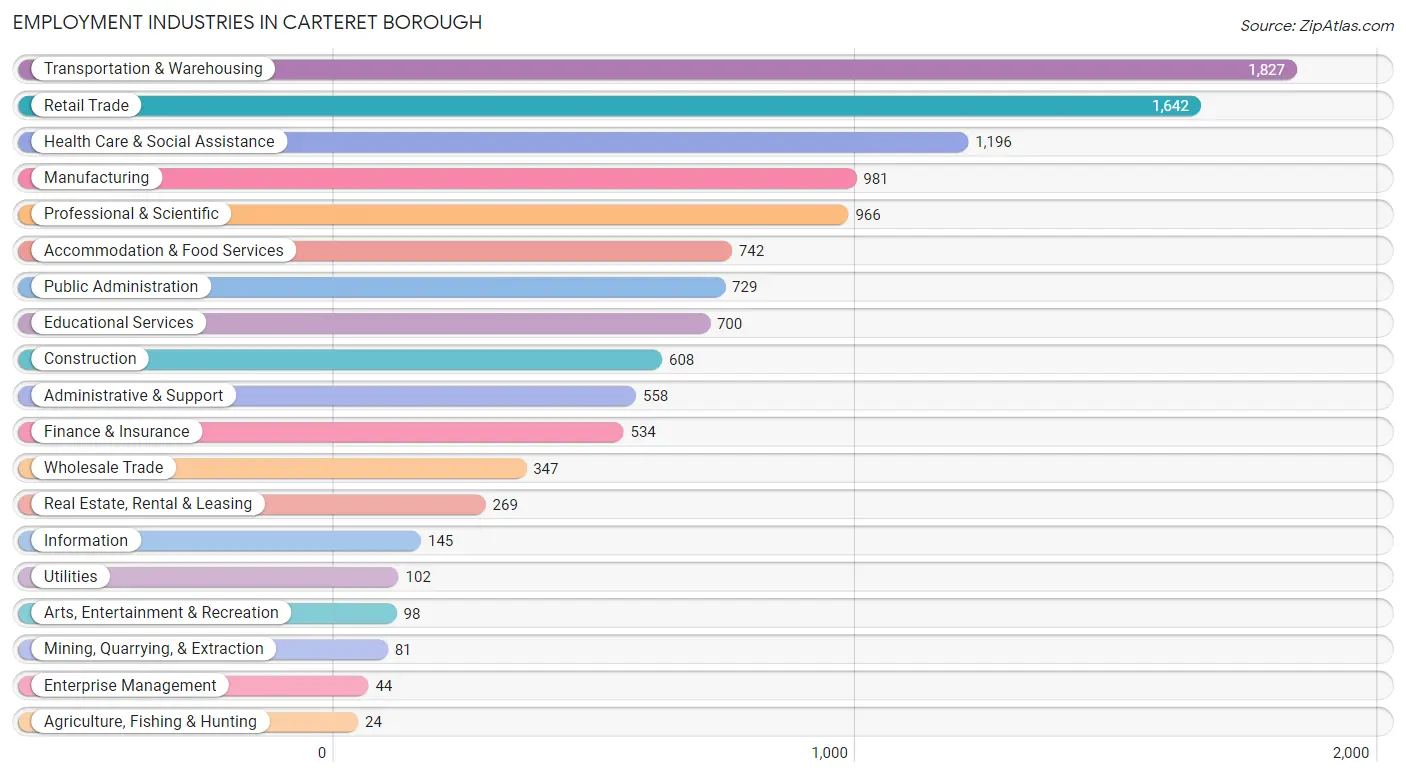
Employment Industries in Carteret borough
The major employment industries in Carteret borough include Transportation & Warehousing (1,827 | 15.5%), Retail Trade (1,642 | 13.9%), Health Care & Social Assistance (1,196 | 10.2%), Manufacturing (981 | 8.3%), and Professional & Scientific (966 | 8.2%).
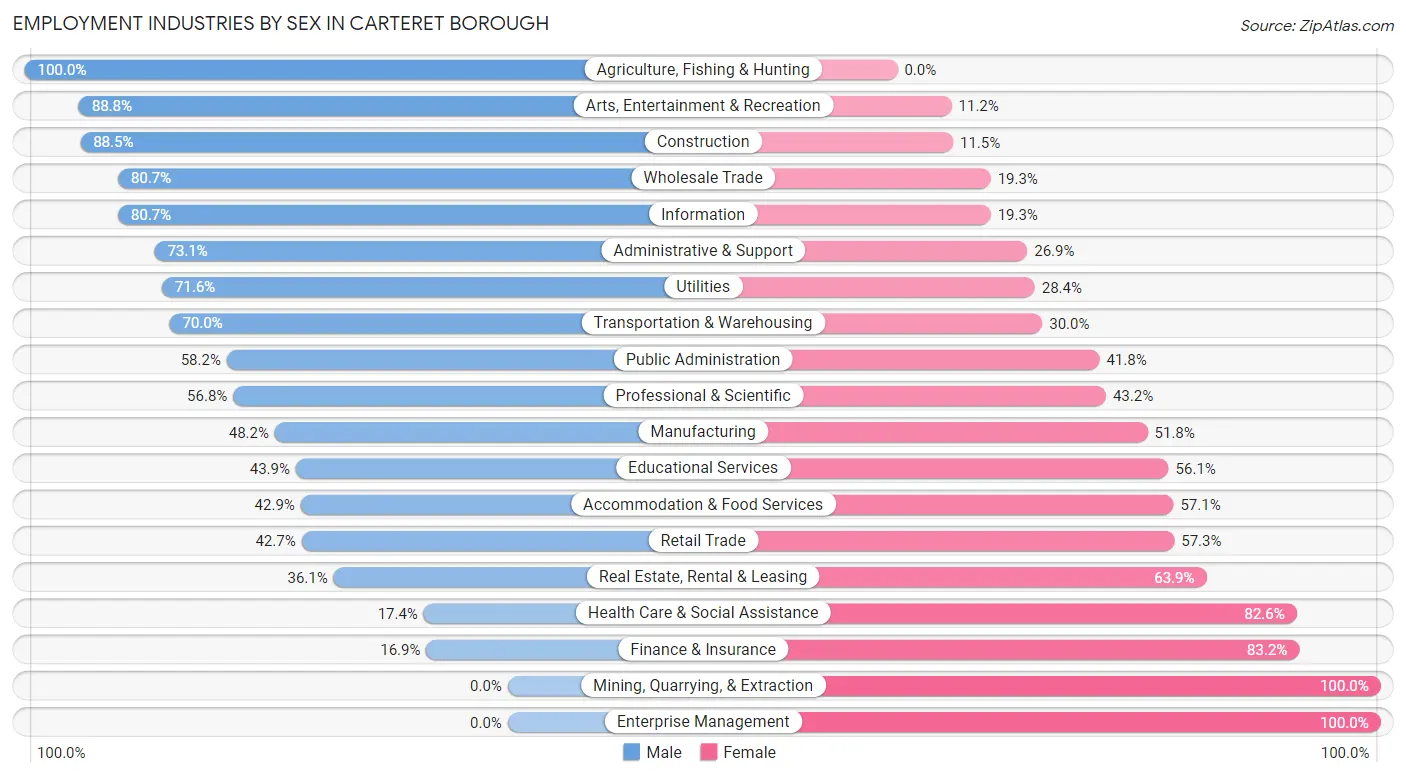
Employment Industries by Sex in Carteret borough
The Carteret borough industries that see more men than women are Agriculture, Fishing & Hunting (100.0%), Arts, Entertainment & Recreation (88.8%), and Construction (88.5%), whereas the industries that tend to have a higher number of women are Mining, Quarrying, & Extraction (100.0%), Enterprise Management (100.0%), and Finance & Insurance (83.2%).
| Industry | Male | Female |
| Agriculture, Fishing & Hunting | 24 (100.0%) | 0 (0.0%) |
| Mining, Quarrying, & Extraction | 0 (0.0%) | 81 (100.0%) |
| Construction | 538 (88.5%) | 70 (11.5%) |
| Manufacturing | 473 (48.2%) | 508 (51.8%) |
| Wholesale Trade | 280 (80.7%) | 67 (19.3%) |
| Retail Trade | 701 (42.7%) | 941 (57.3%) |
| Transportation & Warehousing | 1,279 (70.0%) | 548 (30.0%) |
| Utilities | 73 (71.6%) | 29 (28.4%) |
| Information | 117 (80.7%) | 28 (19.3%) |
| Finance & Insurance | 90 (16.9%) | 444 (83.2%) |
| Real Estate, Rental & Leasing | 97 (36.1%) | 172 (63.9%) |
| Professional & Scientific | 549 (56.8%) | 417 (43.2%) |
| Enterprise Management | 0 (0.0%) | 44 (100.0%) |
| Administrative & Support | 408 (73.1%) | 150 (26.9%) |
| Educational Services | 307 (43.9%) | 393 (56.1%) |
| Health Care & Social Assistance | 208 (17.4%) | 988 (82.6%) |
| Arts, Entertainment & Recreation | 87 (88.8%) | 11 (11.2%) |
| Accommodation & Food Services | 318 (42.9%) | 424 (57.1%) |
| Public Administration | 424 (58.2%) | 305 (41.8%) |
| Total | 6,051 (51.3%) | 5,732 (48.6%) |
Education in Carteret borough
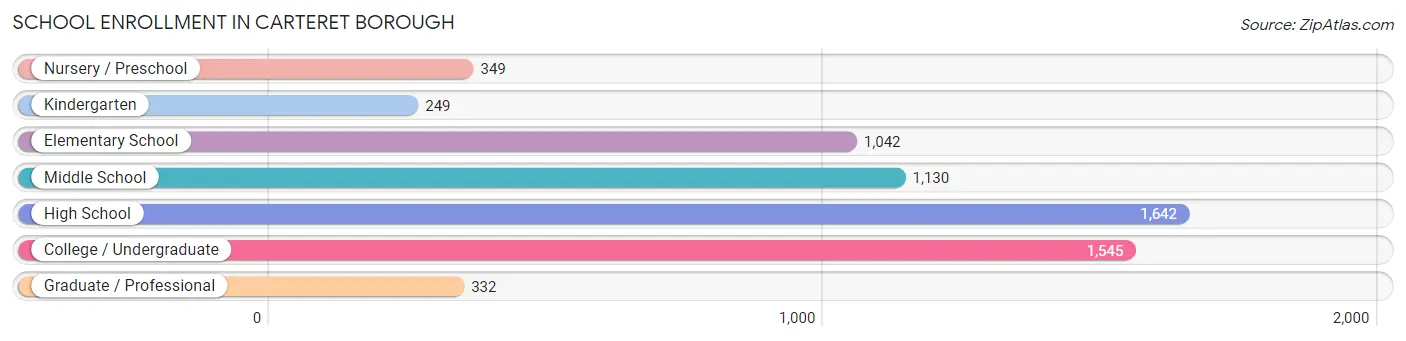
School Enrollment in Carteret borough
The most common levels of schooling among the 6,289 students in Carteret borough are high school (1,642 | 26.1%), college / undergraduate (1,545 | 24.6%), and middle school (1,130 | 18.0%).
| School Level | # Students | % Students |
| Nursery / Preschool | 349 | 5.6% |
| Kindergarten | 249 | 4.0% |
| Elementary School | 1,042 | 16.6% |
| Middle School | 1,130 | 18.0% |
| High School | 1,642 | 26.1% |
| College / Undergraduate | 1,545 | 24.6% |
| Graduate / Professional | 332 | 5.3% |
| Total | 6,289 | 100.0% |
School Enrollment by Age by Funding Source in Carteret borough
Out of a total of 6,289 students who are enrolled in schools in Carteret borough, 1,138 (18.1%) attend a private institution, while the remaining 5,151 (81.9%) are enrolled in public schools. The age group of 3 to 4 year olds has the highest likelihood of being enrolled in private schools, with 121 (66.8% in the age bracket) enrolled. Conversely, the age group of 5 to 9 year old has the lowest likelihood of being enrolled in a private school, with 1,267 (96.9% in the age bracket) attending a public institution.
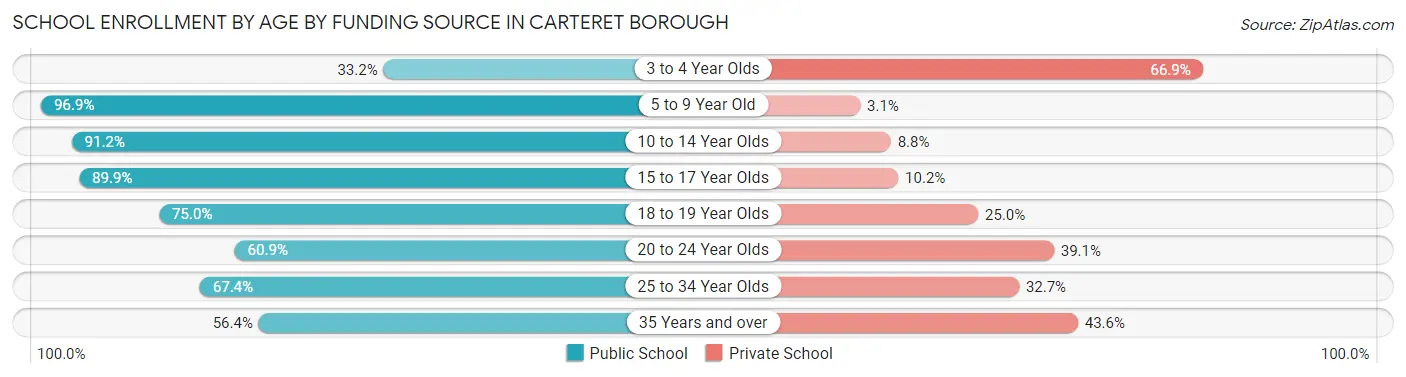
| Age Bracket | Public School | Private School |
| 3 to 4 Year Olds | 60 (33.2%) | 121 (66.8%) |
| 5 to 9 Year Old | 1,267 (96.9%) | 40 (3.1%) |
| 10 to 14 Year Olds | 1,270 (91.2%) | 122 (8.8%) |
| 15 to 17 Year Olds | 1,213 (89.8%) | 137 (10.2%) |
| 18 to 19 Year Olds | 431 (75.0%) | 144 (25.0%) |
| 20 to 24 Year Olds | 588 (60.9%) | 378 (39.1%) |
| 25 to 34 Year Olds | 196 (67.3%) | 95 (32.7%) |
| 35 Years and over | 128 (56.4%) | 99 (43.6%) |
| Total | 5,151 (81.9%) | 1,138 (18.1%) |
Educational Attainment by Field of Study in Carteret borough
Business (1,018 | 20.8%), science & technology (666 | 13.6%), engineering (605 | 12.3%), computers & mathematics (454 | 9.3%), and education (371 | 7.6%) are the most common fields of study among 4,903 individuals in Carteret borough who have obtained a bachelor's degree or higher.
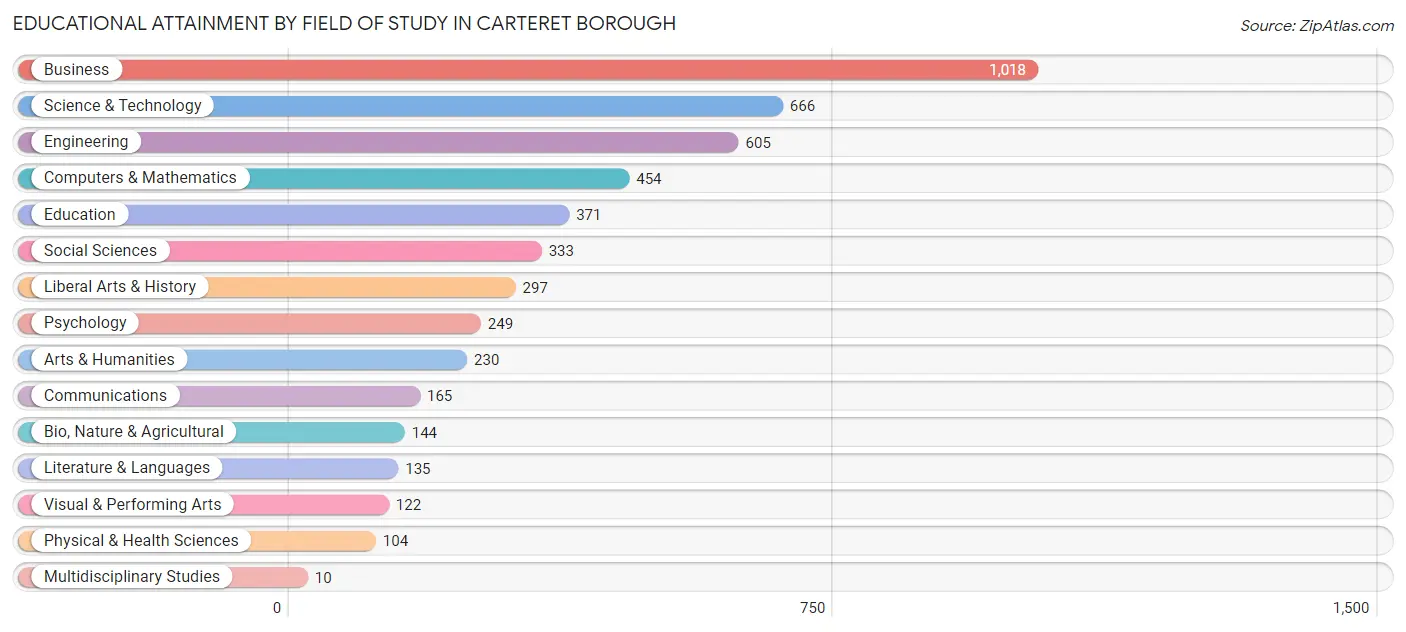
| Field of Study | # Graduates | % Graduates |
| Computers & Mathematics | 454 | 9.3% |
| Bio, Nature & Agricultural | 144 | 2.9% |
| Physical & Health Sciences | 104 | 2.1% |
| Psychology | 249 | 5.1% |
| Social Sciences | 333 | 6.8% |
| Engineering | 605 | 12.3% |
| Multidisciplinary Studies | 10 | 0.2% |
| Science & Technology | 666 | 13.6% |
| Business | 1,018 | 20.8% |
| Education | 371 | 7.6% |
| Literature & Languages | 135 | 2.8% |
| Liberal Arts & History | 297 | 6.1% |
| Visual & Performing Arts | 122 | 2.5% |
| Communications | 165 | 3.4% |
| Arts & Humanities | 230 | 4.7% |
| Total | 4,903 | 100.0% |
Transportation & Commute in Carteret borough
Vehicle Availability by Sex in Carteret borough
The most prevalent vehicle ownership categories in Carteret borough are males with 2 vehicles (1,989, accounting for 33.6%) and females with 2 vehicles (1,745, making up 35.1%).
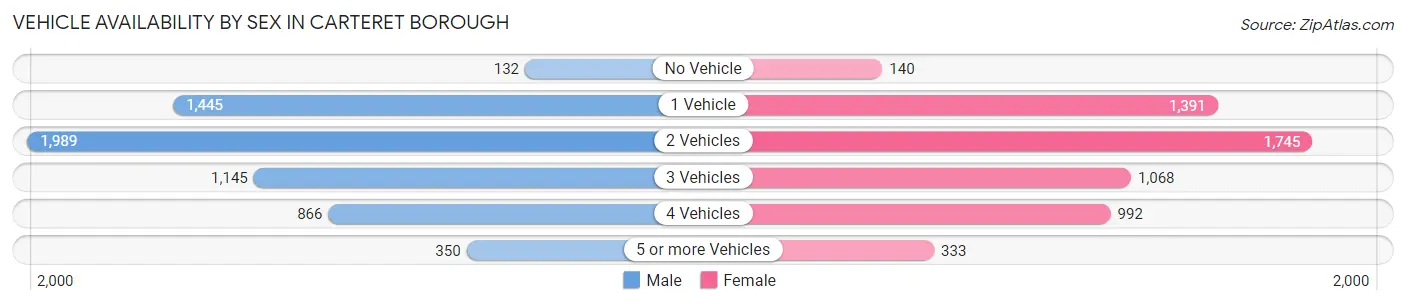
| Vehicles Available | Male | Female |
| No Vehicle | 132 (2.2%) | 140 (2.5%) |
| 1 Vehicle | 1,445 (24.4%) | 1,391 (24.5%) |
| 2 Vehicles | 1,989 (33.6%) | 1,745 (30.8%) |
| 3 Vehicles | 1,145 (19.3%) | 1,068 (18.8%) |
| 4 Vehicles | 866 (14.6%) | 992 (17.5%) |
| 5 or more Vehicles | 350 (5.9%) | 333 (5.9%) |
| Total | 5,927 (100.0%) | 5,669 (100.0%) |
Commute Time in Carteret borough
The most frequently occuring commute durations in Carteret borough are 30 to 34 minutes (1,956 commuters, 18.2%), 45 to 59 minutes (1,214 commuters, 11.3%), and 15 to 19 minutes (1,165 commuters, 10.8%).
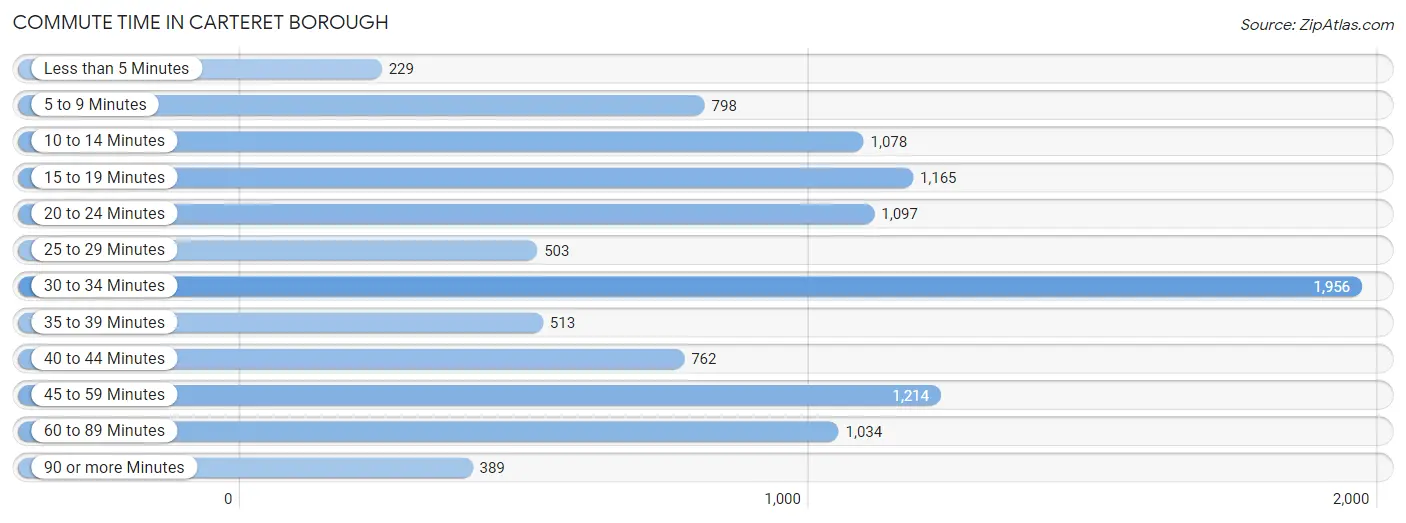
| Commute Time | # Commuters | % Commuters |
| Less than 5 Minutes | 229 | 2.1% |
| 5 to 9 Minutes | 798 | 7.4% |
| 10 to 14 Minutes | 1,078 | 10.0% |
| 15 to 19 Minutes | 1,165 | 10.8% |
| 20 to 24 Minutes | 1,097 | 10.2% |
| 25 to 29 Minutes | 503 | 4.7% |
| 30 to 34 Minutes | 1,956 | 18.2% |
| 35 to 39 Minutes | 513 | 4.8% |
| 40 to 44 Minutes | 762 | 7.1% |
| 45 to 59 Minutes | 1,214 | 11.3% |
| 60 to 89 Minutes | 1,034 | 9.6% |
| 90 or more Minutes | 389 | 3.6% |
Commute Time by Sex in Carteret borough
The most common commute times in Carteret borough are 10 to 14 minutes (673 commuters, 12.0%) for males and 30 to 34 minutes (1,335 commuters, 25.9%) for females.
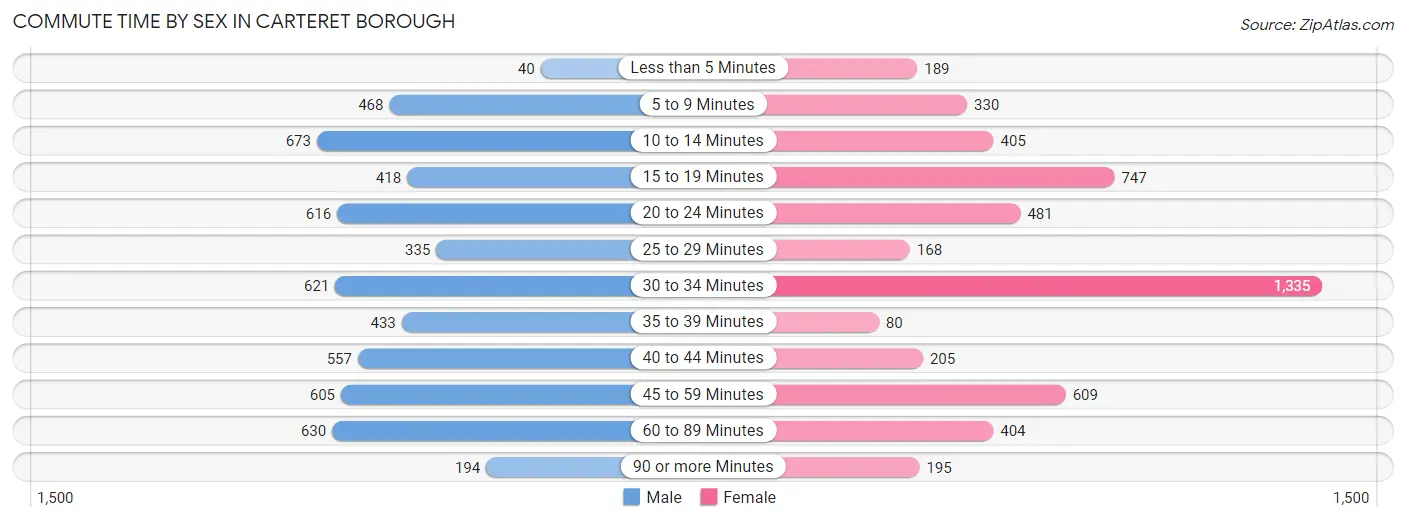
| Commute Time | Male | Female |
| Less than 5 Minutes | 40 (0.7%) | 189 (3.7%) |
| 5 to 9 Minutes | 468 (8.4%) | 330 (6.4%) |
| 10 to 14 Minutes | 673 (12.0%) | 405 (7.9%) |
| 15 to 19 Minutes | 418 (7.5%) | 747 (14.5%) |
| 20 to 24 Minutes | 616 (11.0%) | 481 (9.3%) |
| 25 to 29 Minutes | 335 (6.0%) | 168 (3.3%) |
| 30 to 34 Minutes | 621 (11.1%) | 1,335 (25.9%) |
| 35 to 39 Minutes | 433 (7.7%) | 80 (1.5%) |
| 40 to 44 Minutes | 557 (10.0%) | 205 (4.0%) |
| 45 to 59 Minutes | 605 (10.8%) | 609 (11.8%) |
| 60 to 89 Minutes | 630 (11.3%) | 404 (7.9%) |
| 90 or more Minutes | 194 (3.5%) | 195 (3.8%) |
Time of Departure to Work by Sex in Carteret borough
The most frequent times of departure to work in Carteret borough are 8:00 AM to 8:29 AM (739, 13.2%) for males and 12:00 PM to 3:59 PM (640, 12.4%) for females.
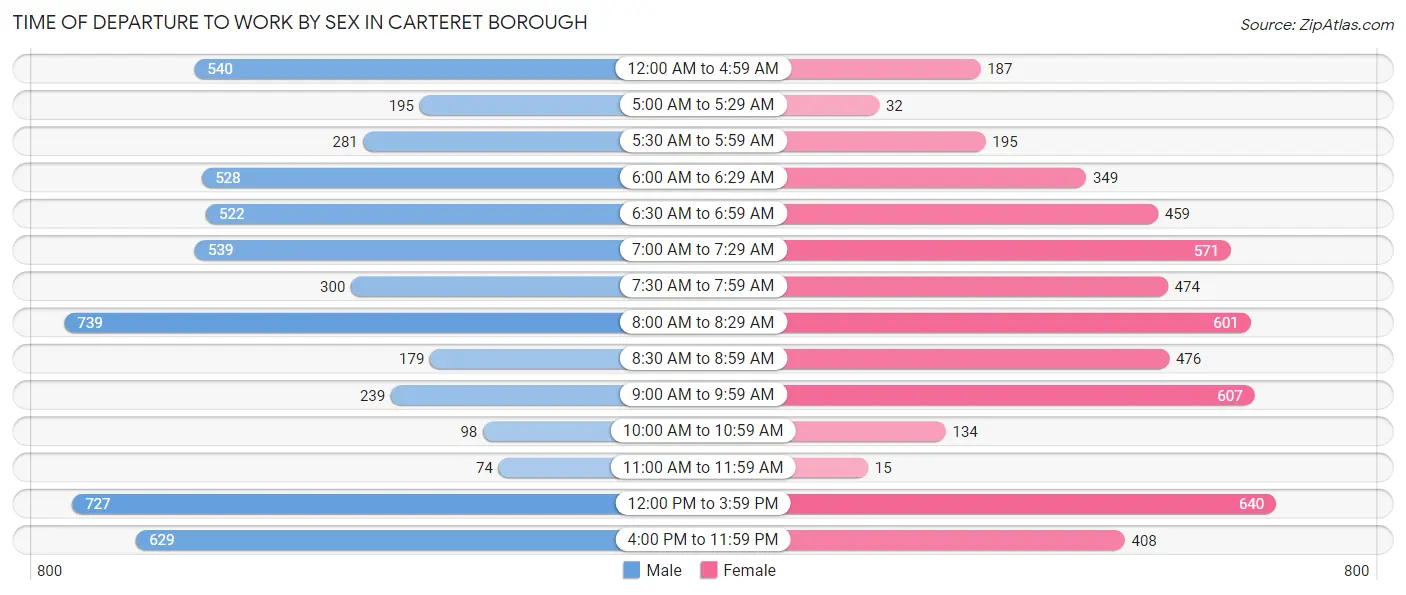
| Time of Departure | Male | Female |
| 12:00 AM to 4:59 AM | 540 (9.7%) | 187 (3.6%) |
| 5:00 AM to 5:29 AM | 195 (3.5%) | 32 (0.6%) |
| 5:30 AM to 5:59 AM | 281 (5.0%) | 195 (3.8%) |
| 6:00 AM to 6:29 AM | 528 (9.5%) | 349 (6.8%) |
| 6:30 AM to 6:59 AM | 522 (9.3%) | 459 (8.9%) |
| 7:00 AM to 7:29 AM | 539 (9.6%) | 571 (11.1%) |
| 7:30 AM to 7:59 AM | 300 (5.4%) | 474 (9.2%) |
| 8:00 AM to 8:29 AM | 739 (13.2%) | 601 (11.7%) |
| 8:30 AM to 8:59 AM | 179 (3.2%) | 476 (9.2%) |
| 9:00 AM to 9:59 AM | 239 (4.3%) | 607 (11.8%) |
| 10:00 AM to 10:59 AM | 98 (1.8%) | 134 (2.6%) |
| 11:00 AM to 11:59 AM | 74 (1.3%) | 15 (0.3%) |
| 12:00 PM to 3:59 PM | 727 (13.0%) | 640 (12.4%) |
| 4:00 PM to 11:59 PM | 629 (11.3%) | 408 (7.9%) |
| Total | 5,590 (100.0%) | 5,148 (100.0%) |
Housing Occupancy in Carteret borough
Occupancy by Ownership in Carteret borough
Of the total 8,153 dwellings in Carteret borough, owner-occupied units account for 4,435 (54.4%), while renter-occupied units make up 3,718 (45.6%).
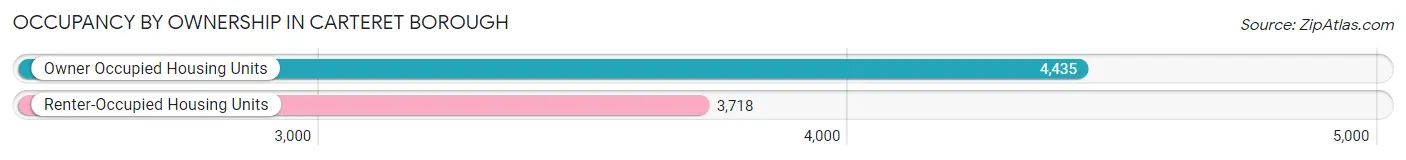
| Occupancy | # Housing Units | % Housing Units |
| Owner Occupied Housing Units | 4,435 | 54.4% |
| Renter-Occupied Housing Units | 3,718 | 45.6% |
| Total Occupied Housing Units | 8,153 | 100.0% |
Occupancy by Household Size in Carteret borough
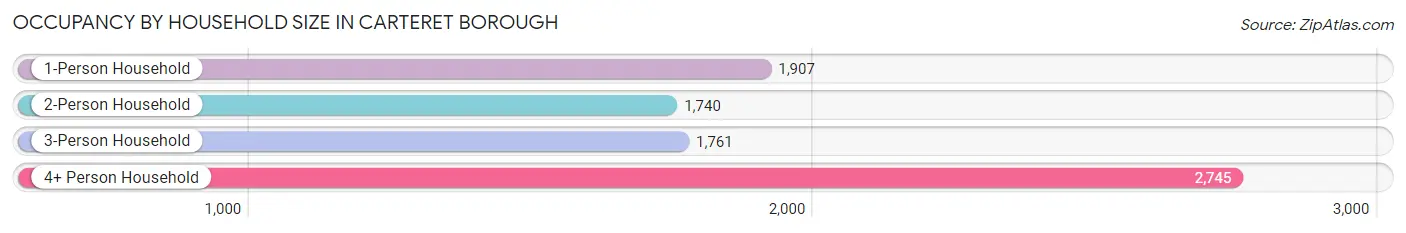
| Household Size | # Housing Units | % Housing Units |
| 1-Person Household | 1,907 | 23.4% |
| 2-Person Household | 1,740 | 21.3% |
| 3-Person Household | 1,761 | 21.6% |
| 4+ Person Household | 2,745 | 33.7% |
| Total Housing Units | 8,153 | 100.0% |
Occupancy by Ownership by Household Size in Carteret borough
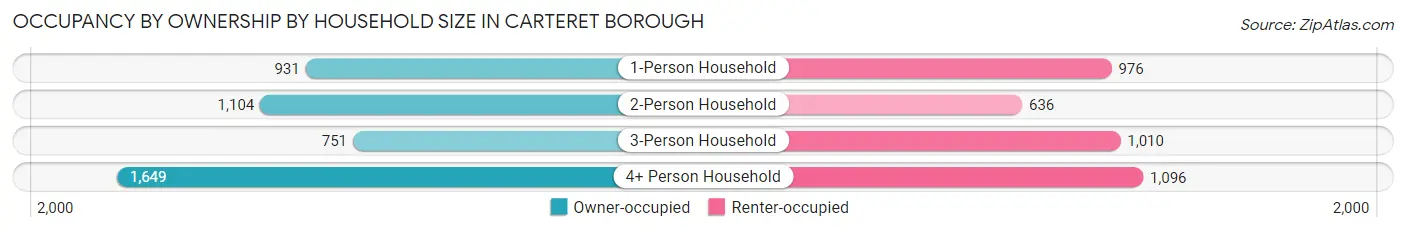
| Household Size | Owner-occupied | Renter-occupied |
| 1-Person Household | 931 (48.8%) | 976 (51.2%) |
| 2-Person Household | 1,104 (63.4%) | 636 (36.5%) |
| 3-Person Household | 751 (42.6%) | 1,010 (57.4%) |
| 4+ Person Household | 1,649 (60.1%) | 1,096 (39.9%) |
| Total Housing Units | 4,435 (54.4%) | 3,718 (45.6%) |
Occupancy by Educational Attainment in Carteret borough
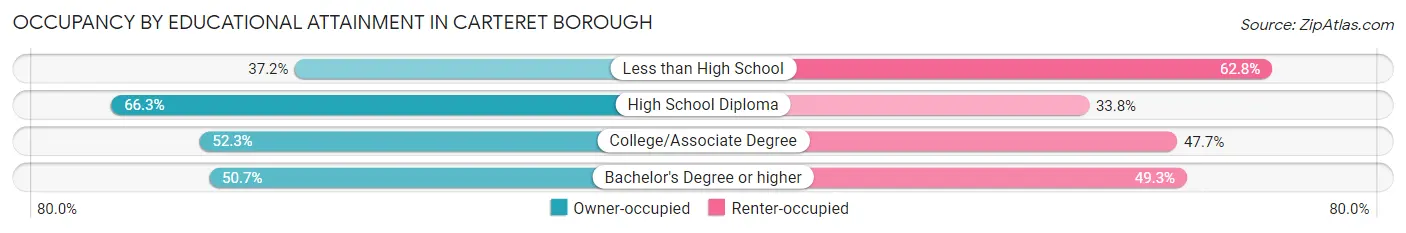
| Household Size | Owner-occupied | Renter-occupied |
| Less than High School | 390 (37.2%) | 658 (62.8%) |
| High School Diploma | 1,755 (66.2%) | 894 (33.8%) |
| College/Associate Degree | 1,014 (52.3%) | 926 (47.7%) |
| Bachelor's Degree or higher | 1,276 (50.7%) | 1,240 (49.3%) |
Occupancy by Age of Householder in Carteret borough
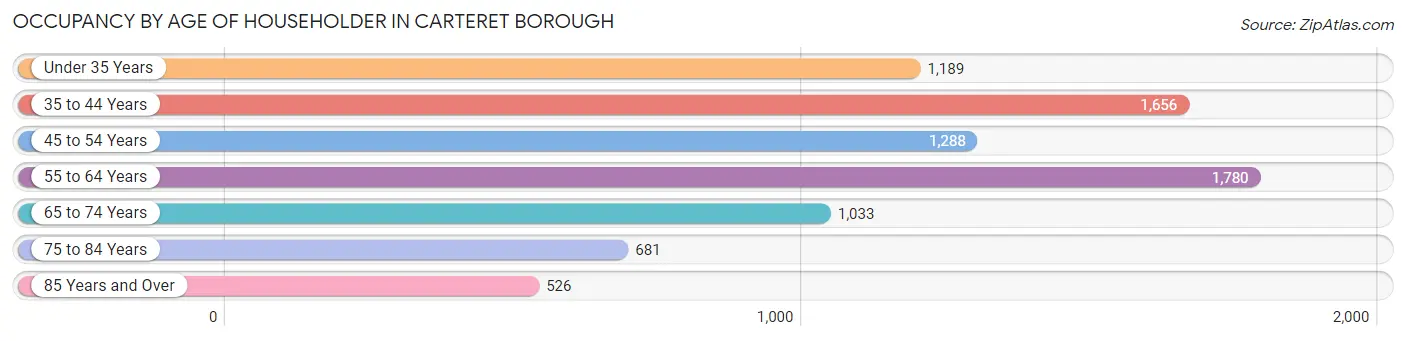
| Age Bracket | # Households | % Households |
| Under 35 Years | 1,189 | 14.6% |
| 35 to 44 Years | 1,656 | 20.3% |
| 45 to 54 Years | 1,288 | 15.8% |
| 55 to 64 Years | 1,780 | 21.8% |
| 65 to 74 Years | 1,033 | 12.7% |
| 75 to 84 Years | 681 | 8.4% |
| 85 Years and Over | 526 | 6.5% |
| Total | 8,153 | 100.0% |
Housing Finances in Carteret borough
Median Income by Occupancy in Carteret borough
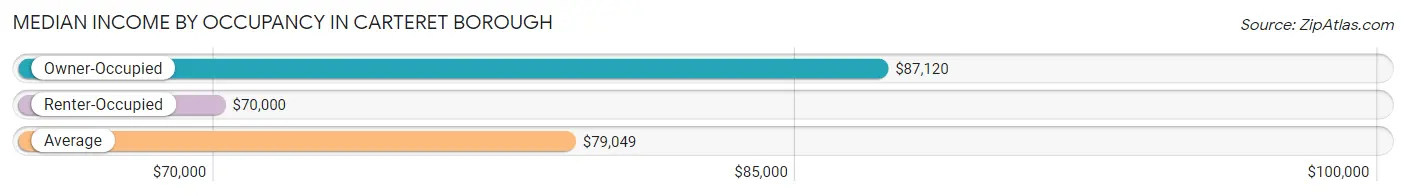
| Occupancy Type | # Households | Median Income |
| Owner-Occupied | 4,435 (54.4%) | $87,120 |
| Renter-Occupied | 3,718 (45.6%) | $70,000 |
| Average | 8,153 (100.0%) | $79,049 |
Occupancy by Householder Income Bracket in Carteret borough
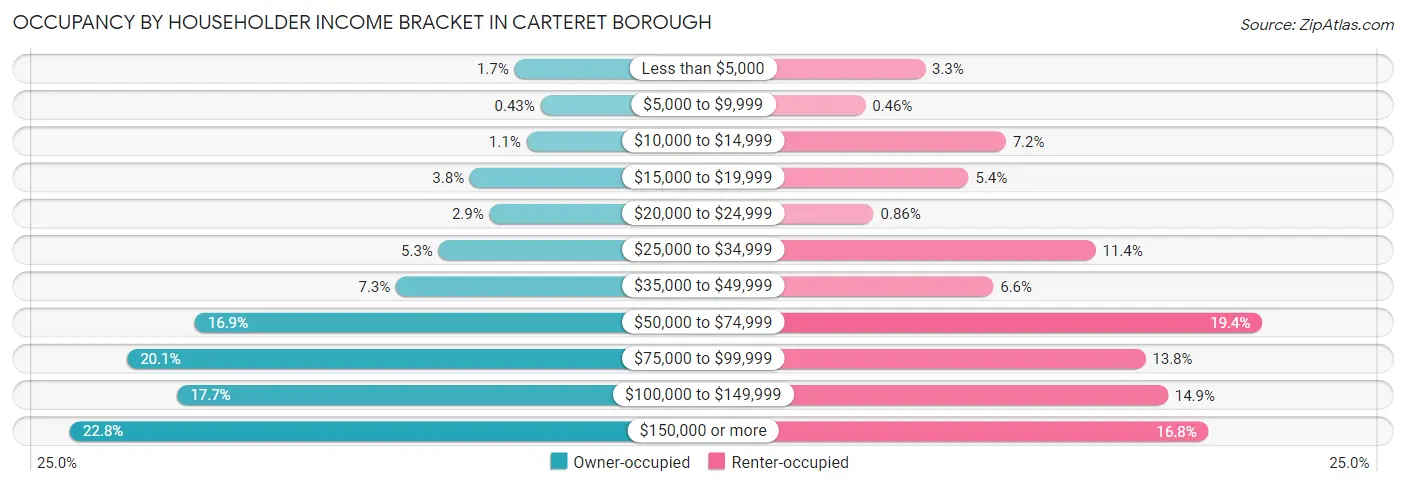
| Income Bracket | Owner-occupied | Renter-occupied |
| Less than $5,000 | 74 (1.7%) | 123 (3.3%) |
| $5,000 to $9,999 | 19 (0.4%) | 17 (0.5%) |
| $10,000 to $14,999 | 49 (1.1%) | 266 (7.1%) |
| $15,000 to $19,999 | 168 (3.8%) | 200 (5.4%) |
| $20,000 to $24,999 | 127 (2.9%) | 32 (0.9%) |
| $25,000 to $34,999 | 234 (5.3%) | 425 (11.4%) |
| $35,000 to $49,999 | 324 (7.3%) | 244 (6.6%) |
| $50,000 to $74,999 | 749 (16.9%) | 720 (19.4%) |
| $75,000 to $99,999 | 892 (20.1%) | 513 (13.8%) |
| $100,000 to $149,999 | 786 (17.7%) | 553 (14.9%) |
| $150,000 or more | 1,013 (22.8%) | 625 (16.8%) |
| Total | 4,435 (100.0%) | 3,718 (100.0%) |
Monthly Housing Cost Tiers in Carteret borough
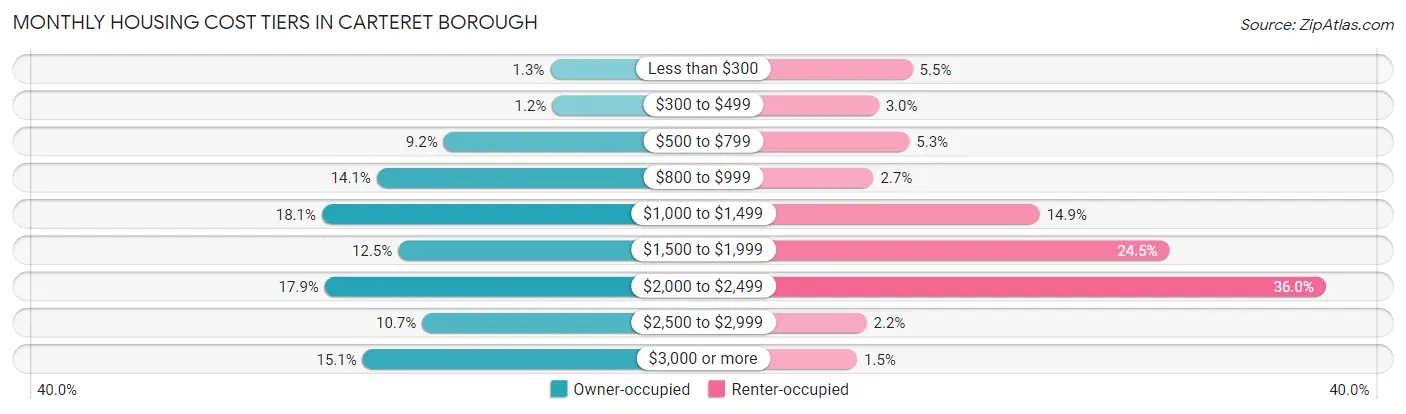
| Monthly Cost | Owner-occupied | Renter-occupied |
| Less than $300 | 57 (1.3%) | 206 (5.5%) |
| $300 to $499 | 51 (1.1%) | 113 (3.0%) |
| $500 to $799 | 406 (9.1%) | 197 (5.3%) |
| $800 to $999 | 624 (14.1%) | 99 (2.7%) |
| $1,000 to $1,499 | 803 (18.1%) | 554 (14.9%) |
| $1,500 to $1,999 | 554 (12.5%) | 909 (24.4%) |
| $2,000 to $2,499 | 794 (17.9%) | 1,337 (36.0%) |
| $2,500 to $2,999 | 476 (10.7%) | 80 (2.1%) |
| $3,000 or more | 670 (15.1%) | 54 (1.5%) |
| Total | 4,435 (100.0%) | 3,718 (100.0%) |
Physical Housing Characteristics in Carteret borough
Housing Structures in Carteret borough
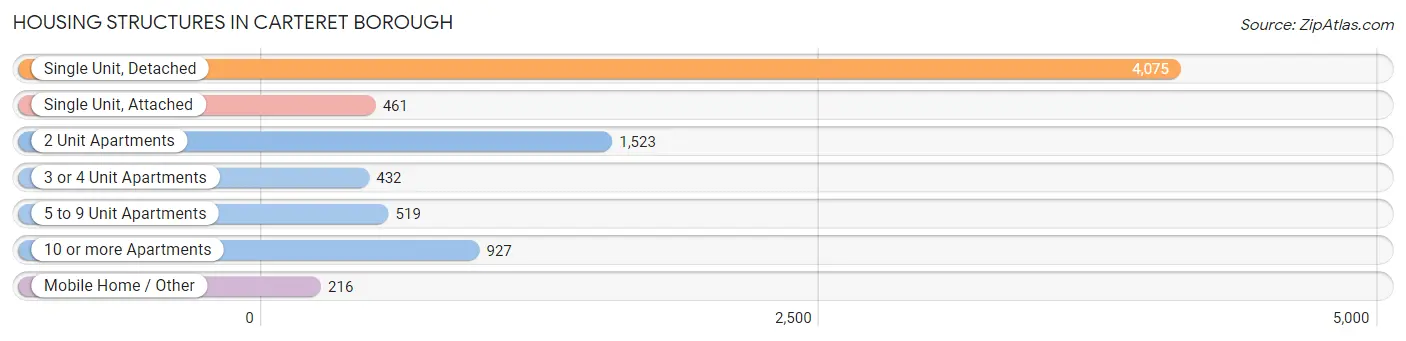
| Structure Type | # Housing Units | % Housing Units |
| Single Unit, Detached | 4,075 | 50.0% |
| Single Unit, Attached | 461 | 5.7% |
| 2 Unit Apartments | 1,523 | 18.7% |
| 3 or 4 Unit Apartments | 432 | 5.3% |
| 5 to 9 Unit Apartments | 519 | 6.4% |
| 10 or more Apartments | 927 | 11.4% |
| Mobile Home / Other | 216 | 2.6% |
| Total | 8,153 | 100.0% |
Housing Structures by Occupancy in Carteret borough
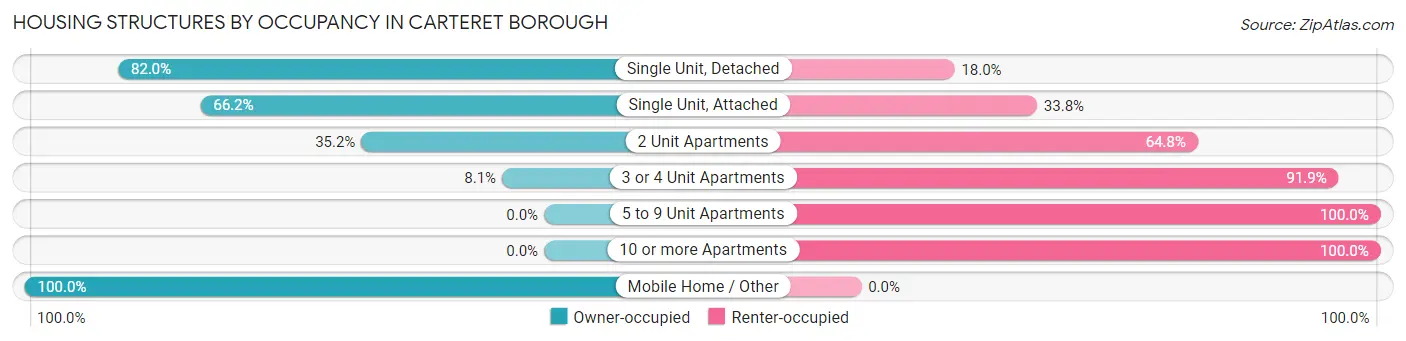
| Structure Type | Owner-occupied | Renter-occupied |
| Single Unit, Detached | 3,343 (82.0%) | 732 (18.0%) |
| Single Unit, Attached | 305 (66.2%) | 156 (33.8%) |
| 2 Unit Apartments | 536 (35.2%) | 987 (64.8%) |
| 3 or 4 Unit Apartments | 35 (8.1%) | 397 (91.9%) |
| 5 to 9 Unit Apartments | 0 (0.0%) | 519 (100.0%) |
| 10 or more Apartments | 0 (0.0%) | 927 (100.0%) |
| Mobile Home / Other | 216 (100.0%) | 0 (0.0%) |
| Total | 4,435 (54.4%) | 3,718 (45.6%) |
Housing Structures by Number of Rooms in Carteret borough
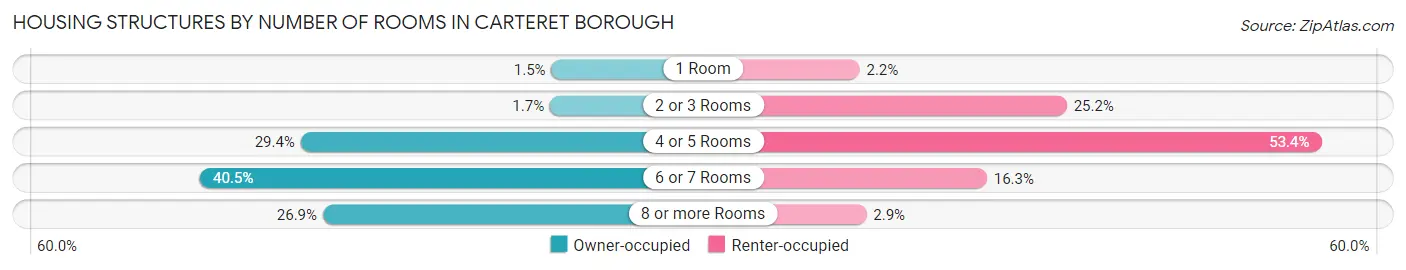
| Number of Rooms | Owner-occupied | Renter-occupied |
| 1 Room | 68 (1.5%) | 81 (2.2%) |
| 2 or 3 Rooms | 75 (1.7%) | 936 (25.2%) |
| 4 or 5 Rooms | 1,302 (29.4%) | 1,986 (53.4%) |
| 6 or 7 Rooms | 1,797 (40.5%) | 606 (16.3%) |
| 8 or more Rooms | 1,193 (26.9%) | 109 (2.9%) |
| Total | 4,435 (100.0%) | 3,718 (100.0%) |
Housing Structure by Heating Type in Carteret borough
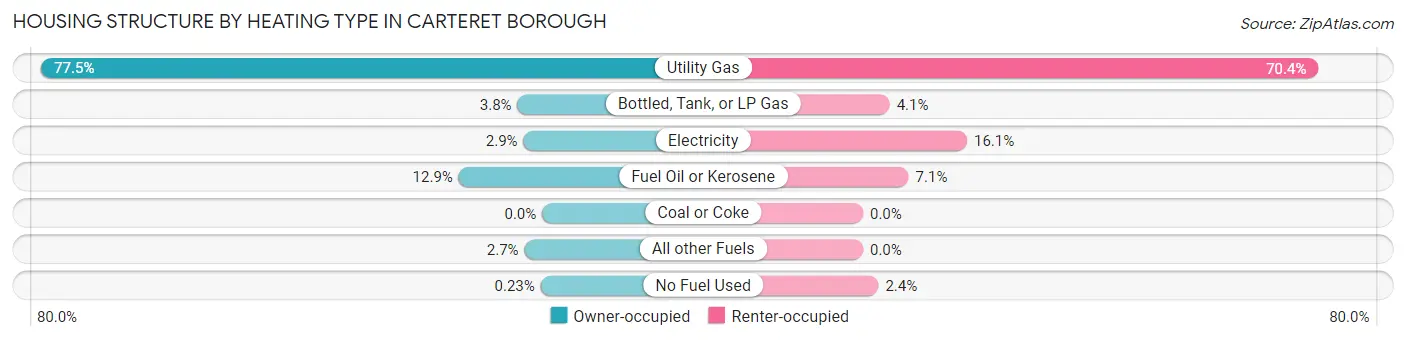
| Heating Type | Owner-occupied | Renter-occupied |
| Utility Gas | 3,435 (77.4%) | 2,616 (70.4%) |
| Bottled, Tank, or LP Gas | 169 (3.8%) | 153 (4.1%) |
| Electricity | 128 (2.9%) | 598 (16.1%) |
| Fuel Oil or Kerosene | 572 (12.9%) | 262 (7.0%) |
| Coal or Coke | 0 (0.0%) | 0 (0.0%) |
| All other Fuels | 121 (2.7%) | 0 (0.0%) |
| No Fuel Used | 10 (0.2%) | 89 (2.4%) |
| Total | 4,435 (100.0%) | 3,718 (100.0%) |
Household Vehicle Usage in Carteret borough
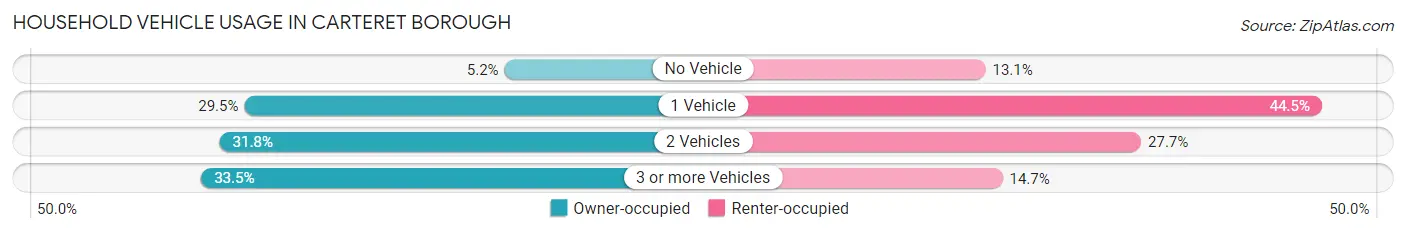
| Vehicles per Household | Owner-occupied | Renter-occupied |
| No Vehicle | 231 (5.2%) | 488 (13.1%) |
| 1 Vehicle | 1,308 (29.5%) | 1,655 (44.5%) |
| 2 Vehicles | 1,410 (31.8%) | 1,028 (27.7%) |
| 3 or more Vehicles | 1,486 (33.5%) | 547 (14.7%) |
| Total | 4,435 (100.0%) | 3,718 (100.0%) |
Real Estate & Mortgages in Carteret borough
Real Estate and Mortgage Overview in Carteret borough
| Characteristic | Without Mortgage | With Mortgage |
| Housing Units | 1,907 | 2,528 |
| Median Property Value | $315,300 | $346,800 |
| Median Household Income | $62,031 | $773 |
| Monthly Housing Costs | $958 | $666 |
| Real Estate Taxes | $7,144 | $129 |
Property Value by Mortgage Status in Carteret borough
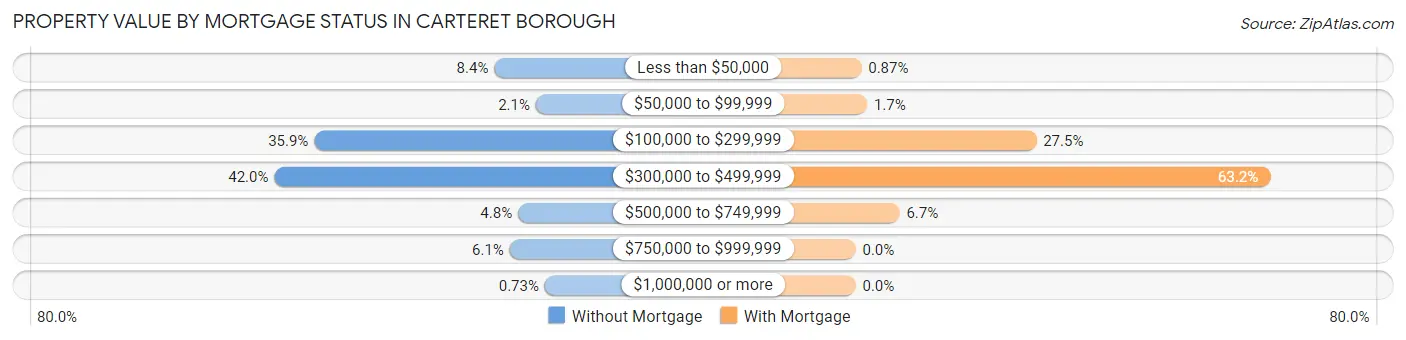
| Property Value | Without Mortgage | With Mortgage |
| Less than $50,000 | 161 (8.4%) | 22 (0.9%) |
| $50,000 to $99,999 | 40 (2.1%) | 44 (1.7%) |
| $100,000 to $299,999 | 684 (35.9%) | 696 (27.5%) |
| $300,000 to $499,999 | 800 (41.9%) | 1,597 (63.2%) |
| $500,000 to $749,999 | 92 (4.8%) | 169 (6.7%) |
| $750,000 to $999,999 | 116 (6.1%) | 0 (0.0%) |
| $1,000,000 or more | 14 (0.7%) | 0 (0.0%) |
| Total | 1,907 (100.0%) | 2,528 (100.0%) |
Household Income by Mortgage Status in Carteret borough
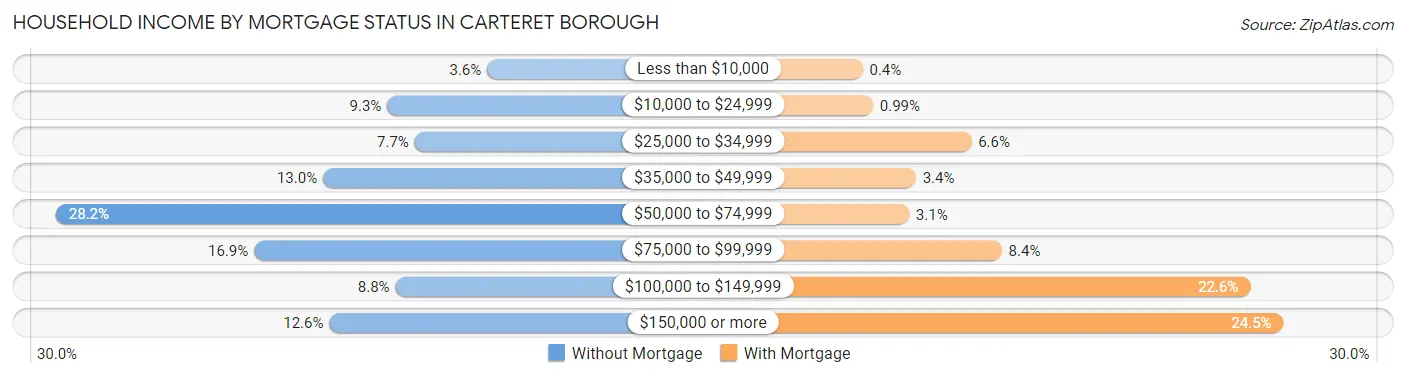
| Household Income | Without Mortgage | With Mortgage |
| Less than $10,000 | 68 (3.6%) | 10 (0.4%) |
| $10,000 to $24,999 | 177 (9.3%) | 25 (1.0%) |
| $25,000 to $34,999 | 147 (7.7%) | 167 (6.6%) |
| $35,000 to $49,999 | 247 (13.0%) | 87 (3.4%) |
| $50,000 to $74,999 | 538 (28.2%) | 77 (3.0%) |
| $75,000 to $99,999 | 322 (16.9%) | 211 (8.4%) |
| $100,000 to $149,999 | 168 (8.8%) | 570 (22.6%) |
| $150,000 or more | 240 (12.6%) | 618 (24.4%) |
| Total | 1,907 (100.0%) | 2,528 (100.0%) |
Property Value to Household Income Ratio in Carteret borough
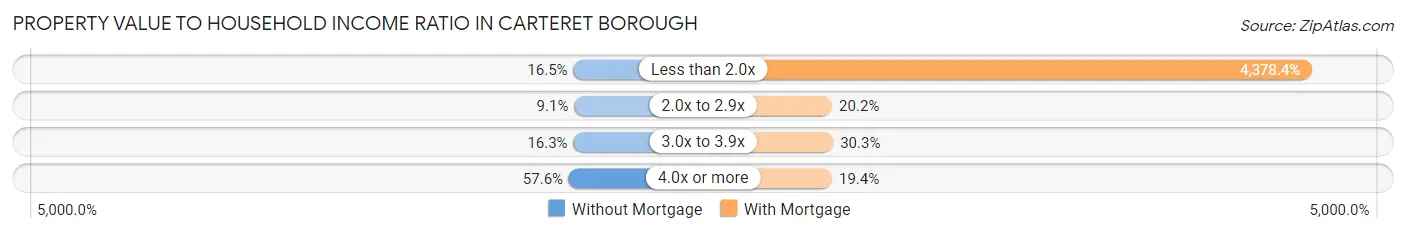
| Value-to-Income Ratio | Without Mortgage | With Mortgage |
| Less than 2.0x | 314 (16.5%) | 110,687 (4,378.4%) |
| 2.0x to 2.9x | 174 (9.1%) | 510 (20.2%) |
| 3.0x to 3.9x | 310 (16.3%) | 766 (30.3%) |
| 4.0x or more | 1,099 (57.6%) | 491 (19.4%) |
| Total | 1,907 (100.0%) | 2,528 (100.0%) |
Real Estate Taxes by Mortgage Status in Carteret borough
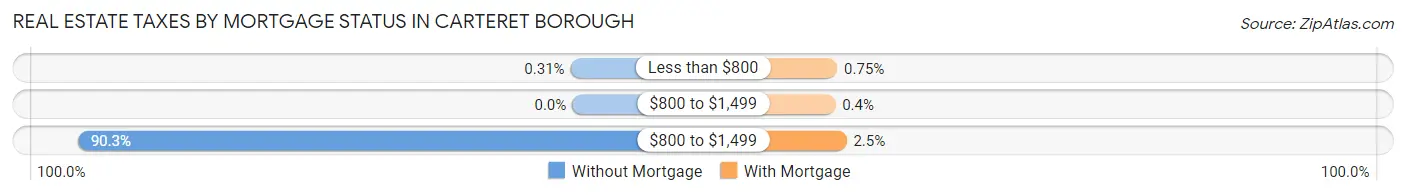
| Property Taxes | Without Mortgage | With Mortgage |
| Less than $800 | 6 (0.3%) | 19 (0.7%) |
| $800 to $1,499 | 0 (0.0%) | 10 (0.4%) |
| $800 to $1,499 | 1,722 (90.3%) | 62 (2.5%) |
| Total | 1,907 (100.0%) | 2,528 (100.0%) |
Health & Disability in Carteret borough
Health Insurance Coverage by Age in Carteret borough
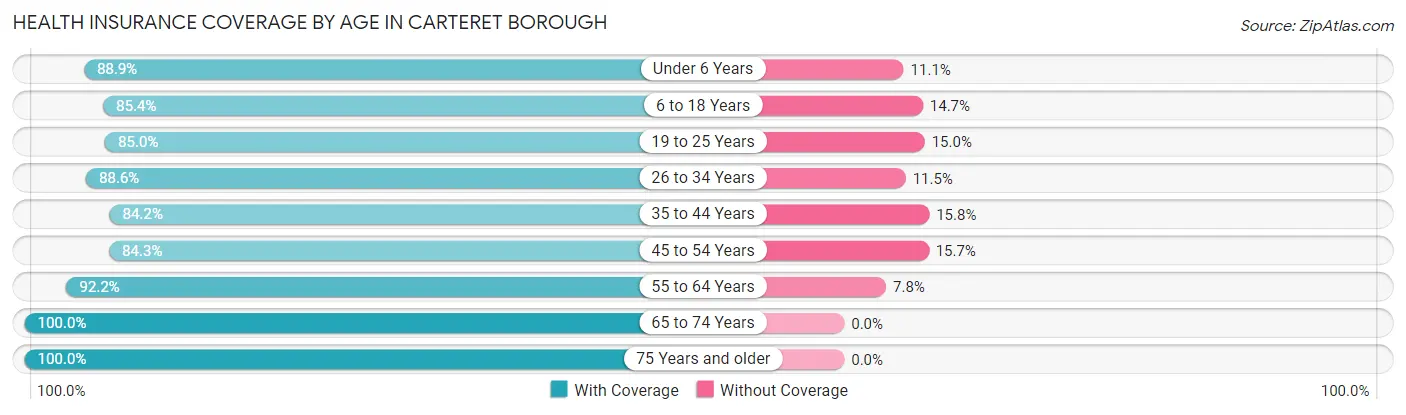
| Age Bracket | With Coverage | Without Coverage |
| Under 6 Years | 1,960 (88.9%) | 244 (11.1%) |
| 6 to 18 Years | 3,535 (85.4%) | 607 (14.6%) |
| 19 to 25 Years | 2,165 (85.0%) | 382 (15.0%) |
| 26 to 34 Years | 2,753 (88.5%) | 356 (11.5%) |
| 35 to 44 Years | 2,672 (84.2%) | 503 (15.8%) |
| 45 to 54 Years | 2,431 (84.3%) | 454 (15.7%) |
| 55 to 64 Years | 3,240 (92.2%) | 274 (7.8%) |
| 65 to 74 Years | 1,822 (100.0%) | 0 (0.0%) |
| 75 Years and older | 1,763 (100.0%) | 0 (0.0%) |
| Total | 22,341 (88.8%) | 2,820 (11.2%) |
Health Insurance Coverage by Citizenship Status in Carteret borough
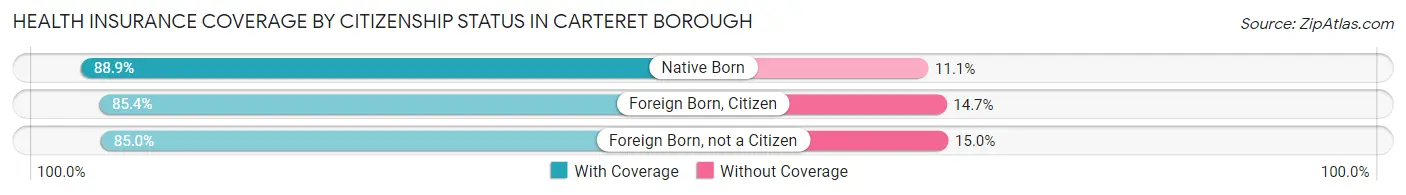
| Citizenship Status | With Coverage | Without Coverage |
| Native Born | 1,960 (88.9%) | 244 (11.1%) |
| Foreign Born, Citizen | 3,535 (85.4%) | 607 (14.6%) |
| Foreign Born, not a Citizen | 2,165 (85.0%) | 382 (15.0%) |
Health Insurance Coverage by Household Income in Carteret borough
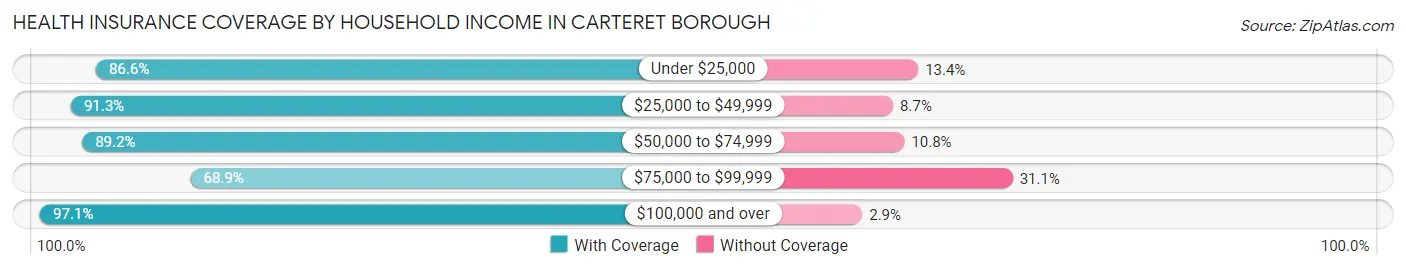
| Household Income | With Coverage | Without Coverage |
| Under $25,000 | 1,450 (86.6%) | 224 (13.4%) |
| $25,000 to $49,999 | 3,553 (91.3%) | 338 (8.7%) |
| $50,000 to $74,999 | 2,842 (89.2%) | 344 (10.8%) |
| $75,000 to $99,999 | 3,515 (68.9%) | 1,585 (31.1%) |
| $100,000 and over | 10,969 (97.1%) | 328 (2.9%) |
Public vs Private Health Insurance Coverage by Age in Carteret borough
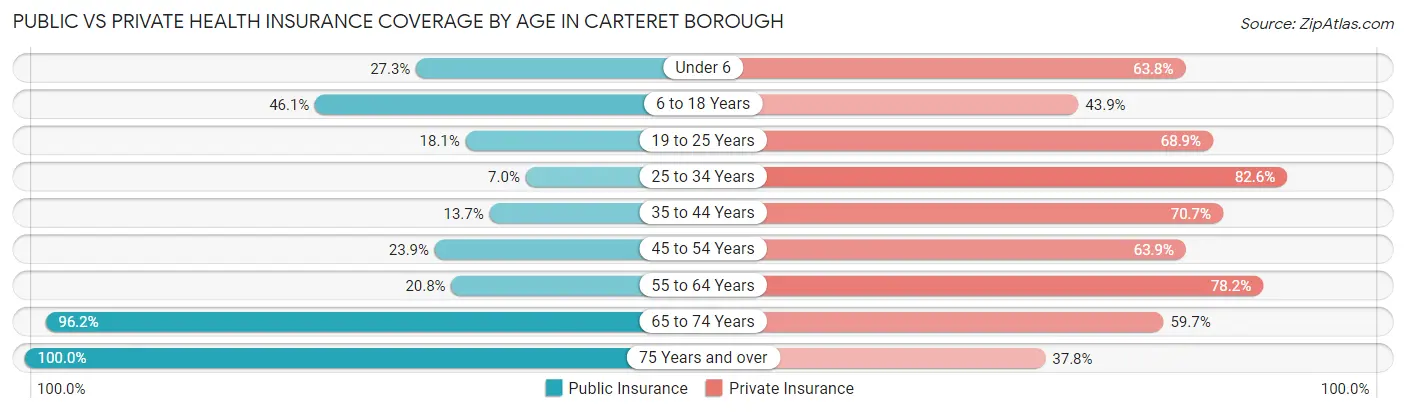
| Age Bracket | Public Insurance | Private Insurance |
| Under 6 | 602 (27.3%) | 1,405 (63.7%) |
| 6 to 18 Years | 1,908 (46.1%) | 1,819 (43.9%) |
| 19 to 25 Years | 462 (18.1%) | 1,754 (68.9%) |
| 25 to 34 Years | 217 (7.0%) | 2,569 (82.6%) |
| 35 to 44 Years | 435 (13.7%) | 2,245 (70.7%) |
| 45 to 54 Years | 688 (23.8%) | 1,842 (63.8%) |
| 55 to 64 Years | 730 (20.8%) | 2,747 (78.2%) |
| 65 to 74 Years | 1,752 (96.2%) | 1,088 (59.7%) |
| 75 Years and over | 1,763 (100.0%) | 666 (37.8%) |
| Total | 8,557 (34.0%) | 16,135 (64.1%) |
Disability Status by Sex by Age in Carteret borough
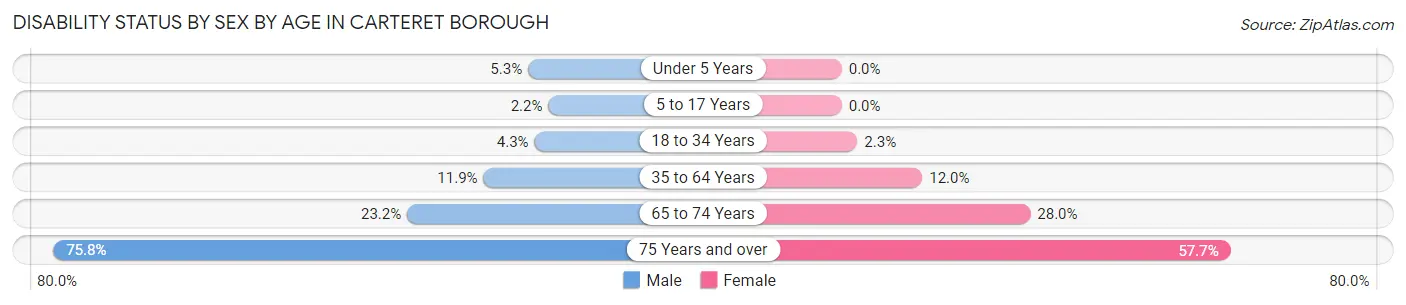
| Age Bracket | Male | Female |
| Under 5 Years | 56 (5.2%) | 0 (0.0%) |
| 5 to 17 Years | 56 (2.2%) | 0 (0.0%) |
| 18 to 34 Years | 118 (4.3%) | 75 (2.3%) |
| 35 to 64 Years | 561 (11.9%) | 579 (11.9%) |
| 65 to 74 Years | 224 (23.2%) | 240 (28.0%) |
| 75 Years and over | 456 (75.7%) | 670 (57.7%) |
Disability Class by Sex by Age in Carteret borough
Disability Class: Hearing Difficulty
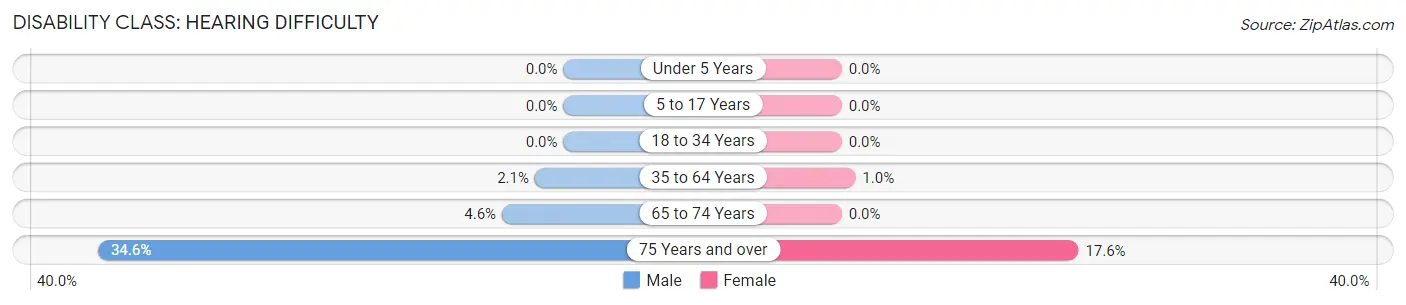
| Age Bracket | Male | Female |
| Under 5 Years | 0 (0.0%) | 0 (0.0%) |
| 5 to 17 Years | 0 (0.0%) | 0 (0.0%) |
| 18 to 34 Years | 0 (0.0%) | 0 (0.0%) |
| 35 to 64 Years | 100 (2.1%) | 49 (1.0%) |
| 65 to 74 Years | 44 (4.6%) | 0 (0.0%) |
| 75 Years and over | 208 (34.5%) | 204 (17.6%) |
Disability Class: Vision Difficulty
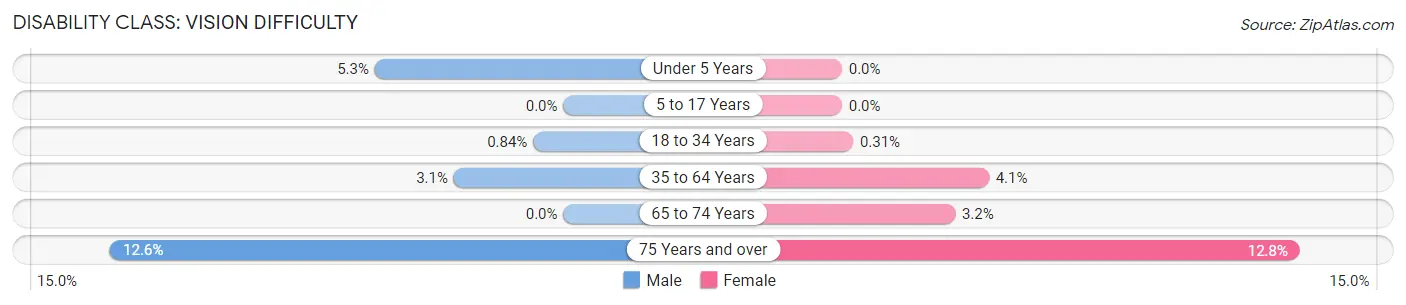
| Age Bracket | Male | Female |
| Under 5 Years | 56 (5.2%) | 0 (0.0%) |
| 5 to 17 Years | 0 (0.0%) | 0 (0.0%) |
| 18 to 34 Years | 23 (0.8%) | 10 (0.3%) |
| 35 to 64 Years | 144 (3.0%) | 198 (4.1%) |
| 65 to 74 Years | 0 (0.0%) | 27 (3.2%) |
| 75 Years and over | 76 (12.6%) | 148 (12.8%) |
Disability Class: Cognitive Difficulty
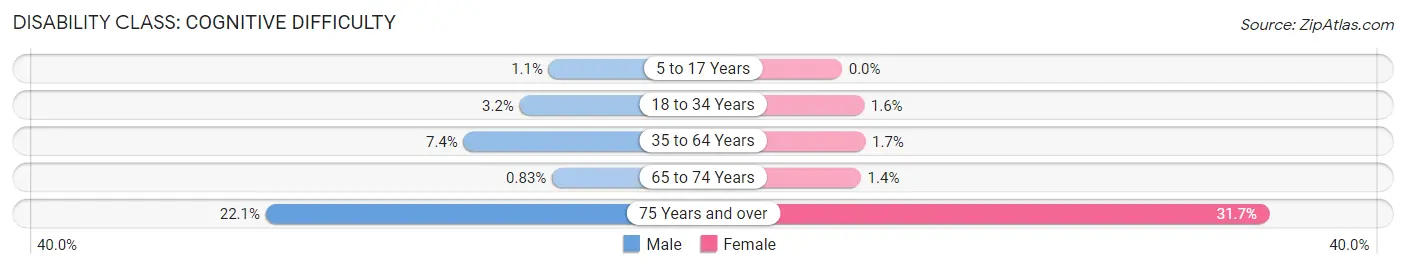
| Age Bracket | Male | Female |
| 5 to 17 Years | 27 (1.1%) | 0 (0.0%) |
| 18 to 34 Years | 89 (3.2%) | 53 (1.6%) |
| 35 to 64 Years | 350 (7.4%) | 84 (1.7%) |
| 65 to 74 Years | 8 (0.8%) | 12 (1.4%) |
| 75 Years and over | 133 (22.1%) | 368 (31.7%) |
Disability Class: Ambulatory Difficulty
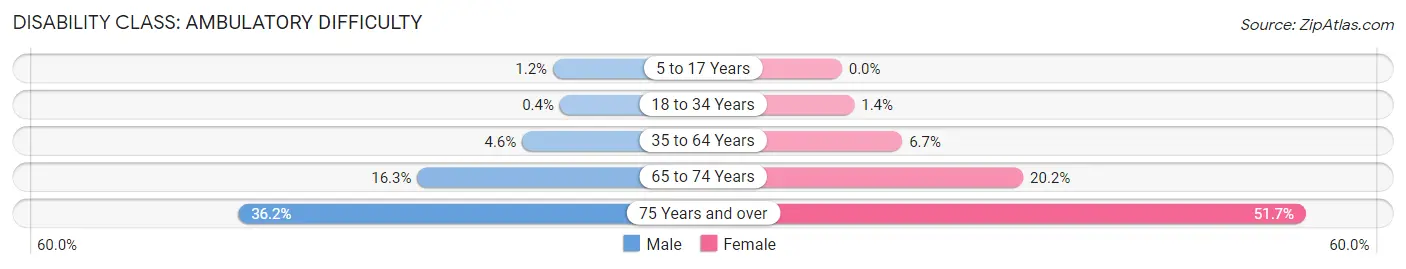
| Age Bracket | Male | Female |
| 5 to 17 Years | 29 (1.2%) | 0 (0.0%) |
| 18 to 34 Years | 11 (0.4%) | 45 (1.4%) |
| 35 to 64 Years | 217 (4.6%) | 326 (6.7%) |
| 65 to 74 Years | 157 (16.3%) | 173 (20.2%) |
| 75 Years and over | 218 (36.2%) | 600 (51.7%) |
Disability Class: Self-Care Difficulty
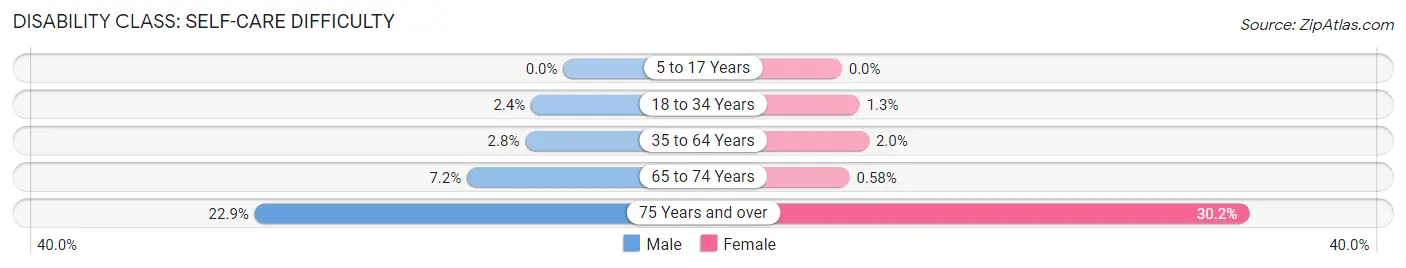
| Age Bracket | Male | Female |
| 5 to 17 Years | 0 (0.0%) | 0 (0.0%) |
| 18 to 34 Years | 66 (2.4%) | 43 (1.3%) |
| 35 to 64 Years | 134 (2.8%) | 98 (2.0%) |
| 65 to 74 Years | 69 (7.1%) | 5 (0.6%) |
| 75 Years and over | 138 (22.9%) | 351 (30.2%) |
Technology Access in Carteret borough
Computing Device Access in Carteret borough
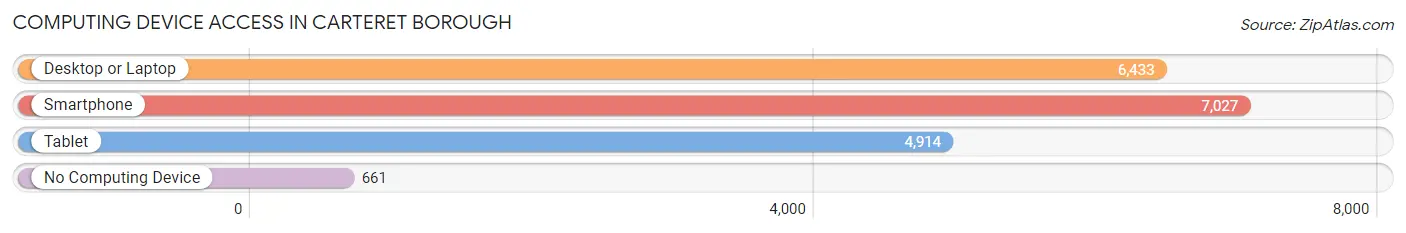
| Device Type | # Households | % Households |
| Desktop or Laptop | 6,433 | 78.9% |
| Smartphone | 7,027 | 86.2% |
| Tablet | 4,914 | 60.3% |
| No Computing Device | 661 | 8.1% |
| Total | 8,153 | 100.0% |
Internet Access in Carteret borough
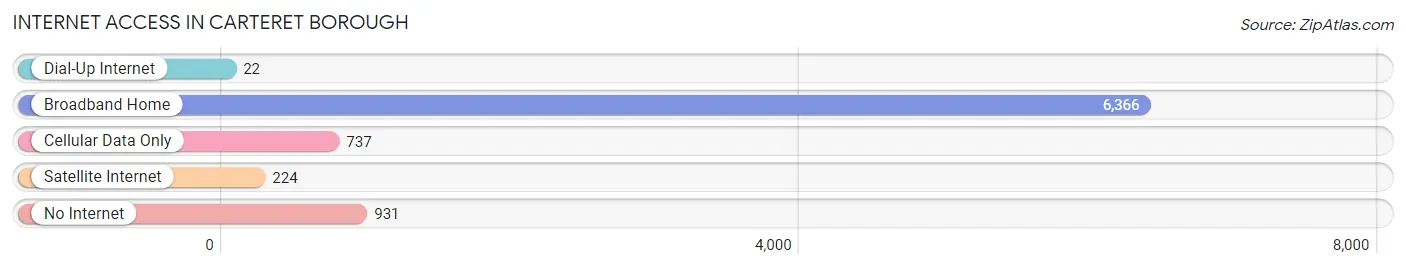
| Internet Type | # Households | % Households |
| Dial-Up Internet | 22 | 0.3% |
| Broadband Home | 6,366 | 78.1% |
| Cellular Data Only | 737 | 9.0% |
| Satellite Internet | 224 | 2.8% |
| No Internet | 931 | 11.4% |
| Total | 8,153 | 100.0% |
Carteret borough Summary
Carteret Borough is a small borough located in Middlesex County, New Jersey. It is situated on the Raritan Bay, and is part of the larger New York metropolitan area. The borough has a population of approximately 22,000 people, and is home to a diverse population of immigrants from all over the world.
History
Carteret Borough was first settled in 1667 by Dutch settlers, who named it after Sir George Carteret, one of the original proprietors of the Province of New Jersey. The borough was officially incorporated in 1887, and has since grown to become a vibrant and diverse community.
Geography
Carteret Borough is located in the Raritan Bay region of New Jersey, and is bordered by the towns of Rahway, Woodbridge, and Perth Amboy. The borough is situated on the Arthur Kill, a tidal strait that separates Staten Island from New Jersey. The borough is approximately 5.5 square miles in size, and is home to a variety of parks, including the Carteret Waterfront Park, which offers views of the Raritan Bay.
Economy
Carteret Borough is home to a variety of businesses, including manufacturing, retail, and service industries. The borough is also home to a number of corporate headquarters, including the headquarters of the pharmaceutical company Merck & Co. and the telecommunications company AT&T. The borough is also home to a number of small businesses, including restaurants, shops, and other services.
Demographics
As of the 2010 census, Carteret Borough had a population of 22,844 people. The population is diverse, with a majority of the population being of Hispanic or Latino origin. The borough also has a large Asian population, with a majority of the population being of Indian or Pakistani descent. The median household income in the borough is $60,945, and the median home value is $269,000.
Conclusion
Carteret Borough is a small borough located in Middlesex County, New Jersey. It is situated on the Raritan Bay, and is part of the larger New York metropolitan area. The borough has a population of approximately 22,000 people, and is home to a diverse population of immigrants from all over the world. The borough is home to a variety of businesses, including manufacturing, retail, and service industries. The population is diverse, with a majority of the population being of Hispanic or Latino origin. The median household income in the borough is $60,945, and the median home value is $269,000.
Common Questions
What is Per Capita Income in Carteret borough?
Per Capita income in Carteret borough is $31,861.
What is the Median Family Income in Carteret borough?
Median Family Income in Carteret borough is $90,685.
What is the Median Household income in Carteret borough?
Median Household Income in Carteret borough is $79,049.
What is Income or Wage Gap in Carteret borough?
Income or Wage Gap in Carteret borough is 29.0%.
Women in Carteret borough earn 71.0 cents for every dollar earned by a man.
What is Inequality or Gini Index in Carteret borough?
Inequality or Gini Index in Carteret borough is 0.42.
What is the Total Population of Carteret borough?
Total Population of Carteret borough is 25,161.
What is the Total Male Population of Carteret borough?
Total Male Population of Carteret borough is 12,606.
What is the Total Female Population of Carteret borough?
Total Female Population of Carteret borough is 12,555.
What is the Ratio of Males per 100 Females in Carteret borough?
There are 100.41 Males per 100 Females in Carteret borough.
What is the Ratio of Females per 100 Males in Carteret borough?
There are 99.60 Females per 100 Males in Carteret borough.
What is the Median Population Age in Carteret borough?
Median Population Age in Carteret borough is 37.6 Years.
What is the Average Family Size in Carteret borough
Average Family Size in Carteret borough is 3.6 People.
What is the Average Household Size in Carteret borough
Average Household Size in Carteret borough is 3.1 People.
How Large is the Labor Force in Carteret borough?
There are 12,703 People in the Labor Forcein in Carteret borough.
What is the Percentage of People in the Labor Force in Carteret borough?
64.0% of People are in the Labor Force in Carteret borough.
What is the Unemployment Rate in Carteret borough?
Unemployment Rate in Carteret borough is 7.3%.