Shrewsbury borough, NJ Map & Demographics
Shrewsbury borough Overview
$67,892
PER CAPITA INCOME
$182,222
AVG FAMILY INCOME
$158,065
AVG HOUSEHOLD INCOME
72.7%
WAGE / INCOME GAP [ % ]
27.3¢/ $1
WAGE / INCOME GAP [ $ ]
0.48
INEQUALITY / GINI INDEX
4,138
TOTAL POPULATION
1,922
MALE POPULATION
2,216
FEMALE POPULATION
86.73
MALES / 100 FEMALES
115.30
FEMALES / 100 MALES
41.7
MEDIAN AGE
3.3
AVG FAMILY SIZE
2.9
AVG HOUSEHOLD SIZE
1,840
LABOR FORCE [ PEOPLE ]
58.7%
PERCENT IN LABOR FORCE
4.0%
UNEMPLOYMENT RATE
Income in Shrewsbury borough
Income Overview in Shrewsbury borough
Per Capita Income in Shrewsbury borough is $67,892, while median incomes of families and households are $182,222 and $158,065 respectively.
| Characteristic | Number | Measure |
| Per Capita Income | 4,138 | $67,892 |
| Median Family Income | 1,124 | $182,222 |
| Mean Family Income | 1,124 | $234,311 |
| Median Household Income | 1,388 | $158,065 |
| Mean Household Income | 1,388 | $202,192 |
| Income Deficit | 1,124 | $0 |
| Wage / Income Gap (%) | 4,138 | 72.67% |
| Wage / Income Gap ($) | 4,138 | 27.33¢ per $1 |
| Gini / Inequality Index | 4,138 | 0.48 |
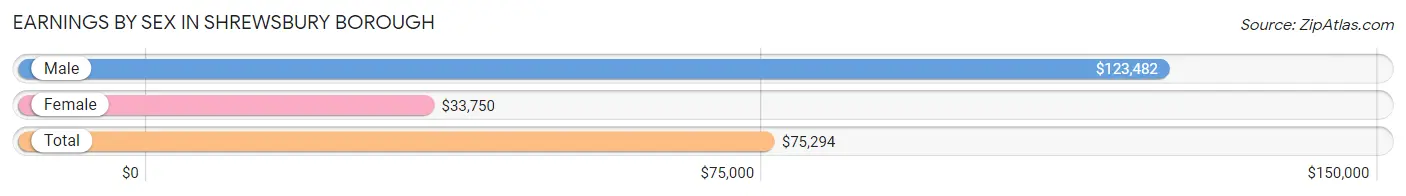
Earnings by Sex in Shrewsbury borough
Average Earnings in Shrewsbury borough are $75,294, $123,482 for men and $33,750 for women, a difference of 72.7%.
| Sex | Number | Average Earnings |
| Male | 1,033 (51.6%) | $123,482 |
| Female | 967 (48.3%) | $33,750 |
| Total | 2,000 (100.0%) | $75,294 |
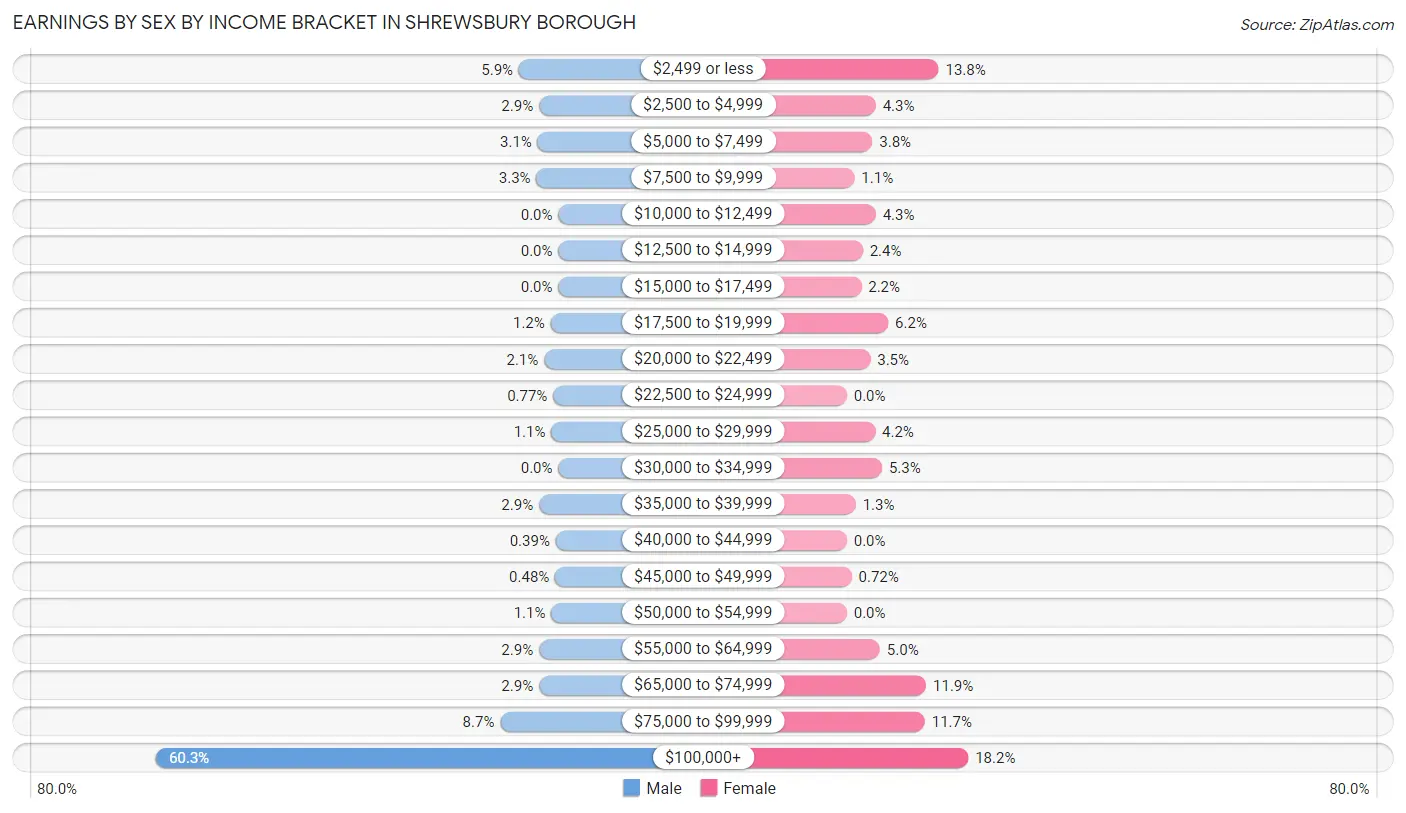
Earnings by Sex by Income Bracket in Shrewsbury borough
The most common earnings brackets in Shrewsbury borough are $100,000+ for men (623 | 60.3%) and $100,000+ for women (176 | 18.2%).
| Income | Male | Female |
| $2,499 or less | 61 (5.9%) | 133 (13.8%) |
| $2,500 to $4,999 | 30 (2.9%) | 42 (4.3%) |
| $5,000 to $7,499 | 32 (3.1%) | 37 (3.8%) |
| $7,500 to $9,999 | 34 (3.3%) | 11 (1.1%) |
| $10,000 to $12,499 | 0 (0.0%) | 42 (4.3%) |
| $12,500 to $14,999 | 0 (0.0%) | 23 (2.4%) |
| $15,000 to $17,499 | 0 (0.0%) | 21 (2.2%) |
| $17,500 to $19,999 | 12 (1.2%) | 60 (6.2%) |
| $20,000 to $22,499 | 22 (2.1%) | 34 (3.5%) |
| $22,500 to $24,999 | 8 (0.8%) | 0 (0.0%) |
| $25,000 to $29,999 | 11 (1.1%) | 41 (4.2%) |
| $30,000 to $34,999 | 0 (0.0%) | 51 (5.3%) |
| $35,000 to $39,999 | 30 (2.9%) | 13 (1.3%) |
| $40,000 to $44,999 | 4 (0.4%) | 0 (0.0%) |
| $45,000 to $49,999 | 5 (0.5%) | 7 (0.7%) |
| $50,000 to $54,999 | 11 (1.1%) | 0 (0.0%) |
| $55,000 to $64,999 | 30 (2.9%) | 48 (5.0%) |
| $65,000 to $74,999 | 30 (2.9%) | 115 (11.9%) |
| $75,000 to $99,999 | 90 (8.7%) | 113 (11.7%) |
| $100,000+ | 623 (60.3%) | 176 (18.2%) |
| Total | 1,033 (100.0%) | 967 (100.0%) |
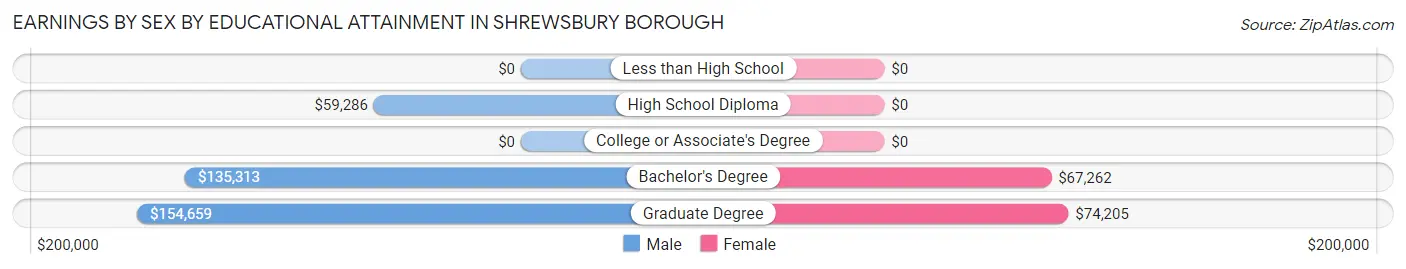
Earnings by Sex by Educational Attainment in Shrewsbury borough
Average earnings in Shrewsbury borough are $133,125 for men and $65,565 for women, a difference of 50.7%. Men with an educational attainment of graduate degree enjoy the highest average annual earnings of $154,659, while those with high school diploma education earn the least with $59,286. Women with an educational attainment of graduate degree earn the most with the average annual earnings of $74,205, while those with bachelor's degree education have the smallest earnings of $67,262.
| Educational Attainment | Male Income | Female Income |
| Less than High School | - | - |
| High School Diploma | $59,286 | $0 |
| College or Associate's Degree | - | - |
| Bachelor's Degree | $135,313 | $67,262 |
| Graduate Degree | $154,659 | $74,205 |
| Total | $133,125 | $65,565 |
Family Income in Shrewsbury borough
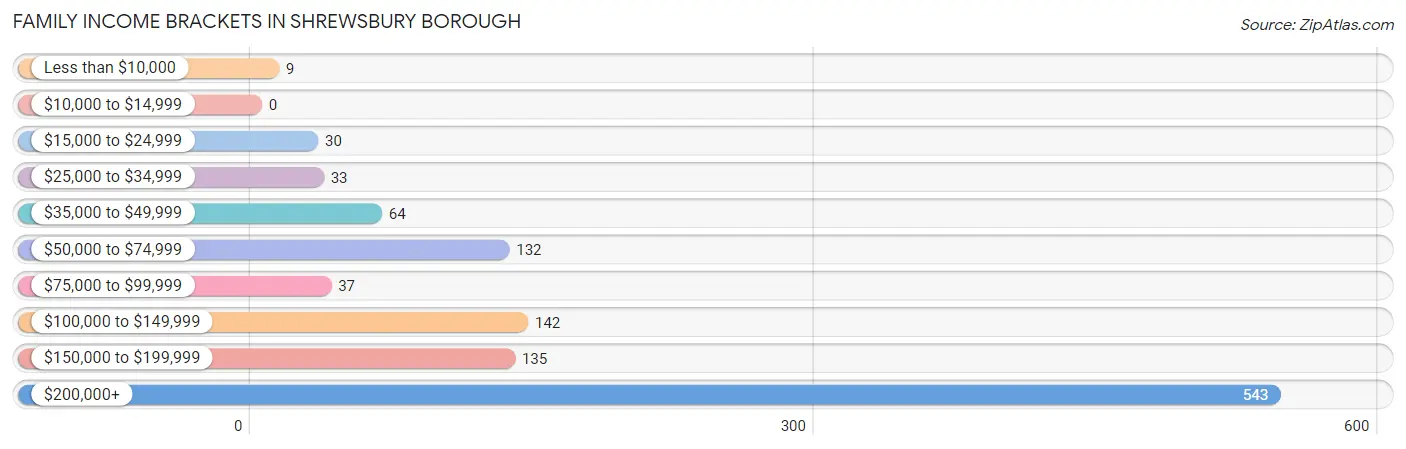
Family Income Brackets in Shrewsbury borough
According to the Shrewsbury borough family income data, there are 543 families falling into the $200,000+ income range, which is the most common income bracket and makes up 48.3% of all families.
| Income Bracket | # Families | % Families |
| Less than $10,000 | 9 | 0.8% |
| $10,000 to $14,999 | 0 | 0.0% |
| $15,000 to $24,999 | 30 | 2.7% |
| $25,000 to $34,999 | 33 | 2.9% |
| $35,000 to $49,999 | 64 | 5.7% |
| $50,000 to $74,999 | 132 | 11.7% |
| $75,000 to $99,999 | 37 | 3.3% |
| $100,000 to $149,999 | 142 | 12.6% |
| $150,000 to $199,999 | 135 | 12.0% |
| $200,000+ | 543 | 48.3% |
Family Income by Famaliy Size in Shrewsbury borough
5-person families (148 | 13.2%) account for the highest median family income in Shrewsbury borough with $235,000 per family, while 2-person families (436 | 38.8%) have the highest median income of $69,750 per family member.
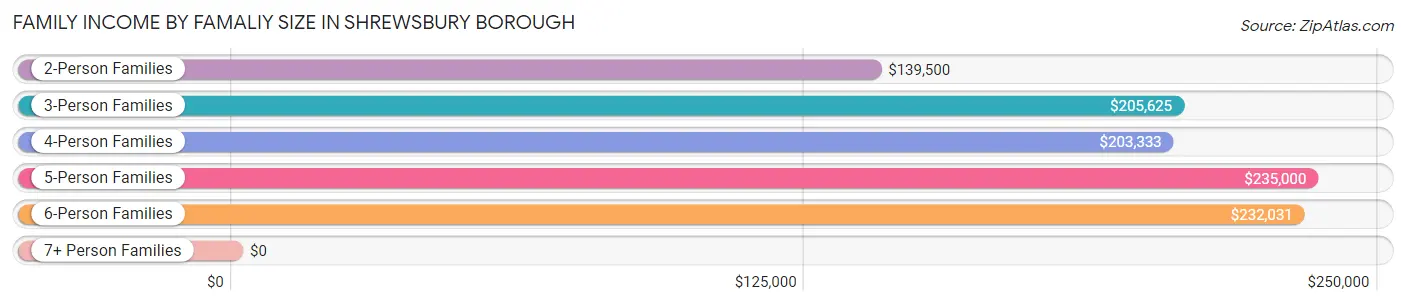
| Income Bracket | # Families | Median Income |
| 2-Person Families | 436 (38.8%) | $139,500 |
| 3-Person Families | 225 (20.0%) | $205,625 |
| 4-Person Families | 236 (21.0%) | $203,333 |
| 5-Person Families | 148 (13.2%) | $235,000 |
| 6-Person Families | 79 (7.0%) | $232,031 |
| 7+ Person Families | 0 (0.0%) | $0 |
| Total | 1,124 (100.0%) | $182,222 |
Family Income by Number of Earners in Shrewsbury borough
The median family income in Shrewsbury borough is $182,222, with families comprising 3+ earners (171) having the highest median family income of $250,001, while families with no earners (159) have the lowest median family income of $59,732, accounting for 15.2% and 14.1% of families, respectively.
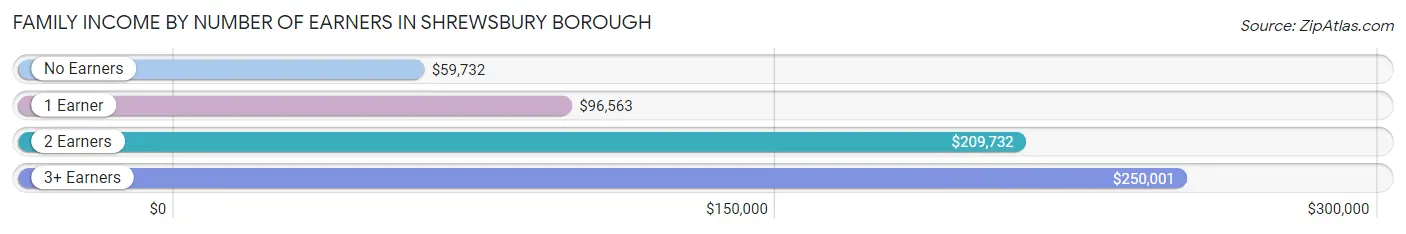
| Number of Earners | # Families | Median Income |
| No Earners | 159 (14.1%) | $59,732 |
| 1 Earner | 308 (27.4%) | $96,563 |
| 2 Earners | 486 (43.2%) | $209,732 |
| 3+ Earners | 171 (15.2%) | $250,001 |
| Total | 1,124 (100.0%) | $182,222 |
Household Income in Shrewsbury borough
Household Income Brackets in Shrewsbury borough
With 557 households falling in the category, the $200,000+ income range is the most frequent in Shrewsbury borough, accounting for 40.1% of all households.
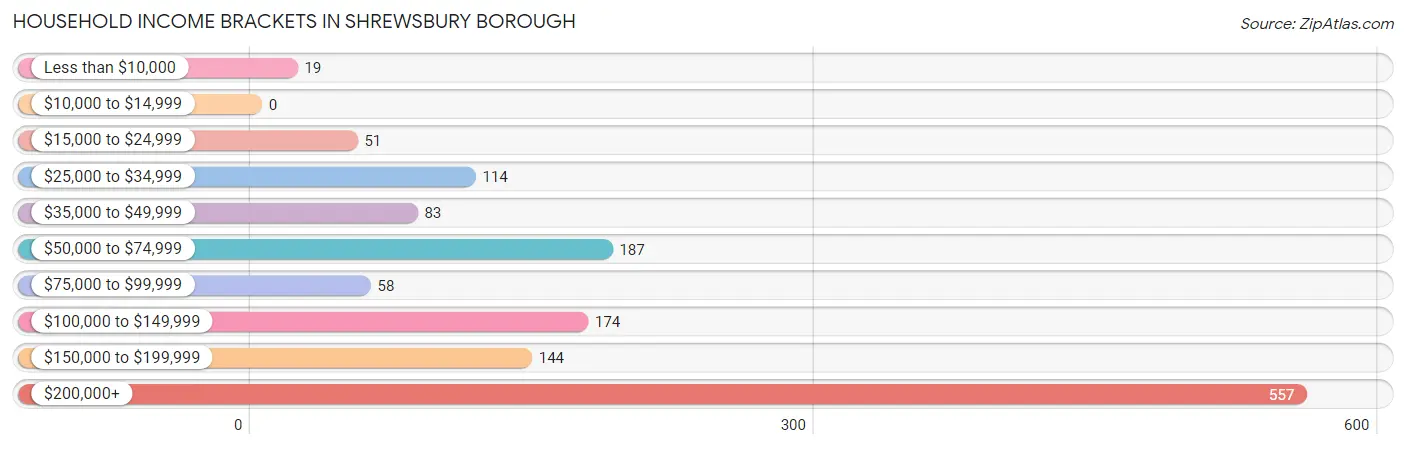
| Income Bracket | # Households | % Households |
| Less than $10,000 | 19 | 1.4% |
| $10,000 to $14,999 | 0 | 0.0% |
| $15,000 to $24,999 | 51 | 3.7% |
| $25,000 to $34,999 | 114 | 8.2% |
| $35,000 to $49,999 | 83 | 6.0% |
| $50,000 to $74,999 | 187 | 13.5% |
| $75,000 to $99,999 | 58 | 4.2% |
| $100,000 to $149,999 | 174 | 12.5% |
| $150,000 to $199,999 | 144 | 10.4% |
| $200,000+ | 557 | 40.1% |
Household Income by Householder Age in Shrewsbury borough
The median household income in Shrewsbury borough is $158,065, with the highest median household income of $207,991 found in the 25 to 44 years age bracket for the primary householder. A total of 397 households (28.6%) fall into this category.
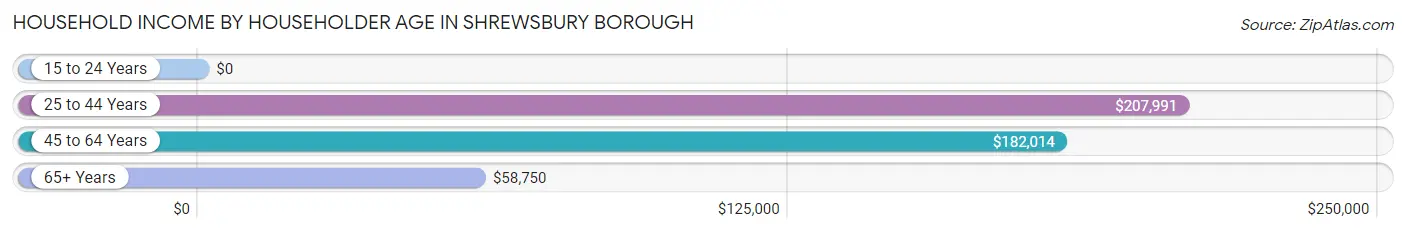
| Income Bracket | # Households | Median Income |
| 15 to 24 Years | 0 (0.0%) | $0 |
| 25 to 44 Years | 397 (28.6%) | $207,991 |
| 45 to 64 Years | 525 (37.8%) | $182,014 |
| 65+ Years | 466 (33.6%) | $58,750 |
| Total | 1,388 (100.0%) | $158,065 |
Poverty in Shrewsbury borough
Income Below Poverty by Sex and Age in Shrewsbury borough
With 2.4% poverty level for males and 3.6% for females among the residents of Shrewsbury borough, 12 to 14 year old males and 15 year old females are the most vulnerable to poverty, with 9 males (10.5%) and 9 females (24.3%) in their respective age groups living below the poverty level.
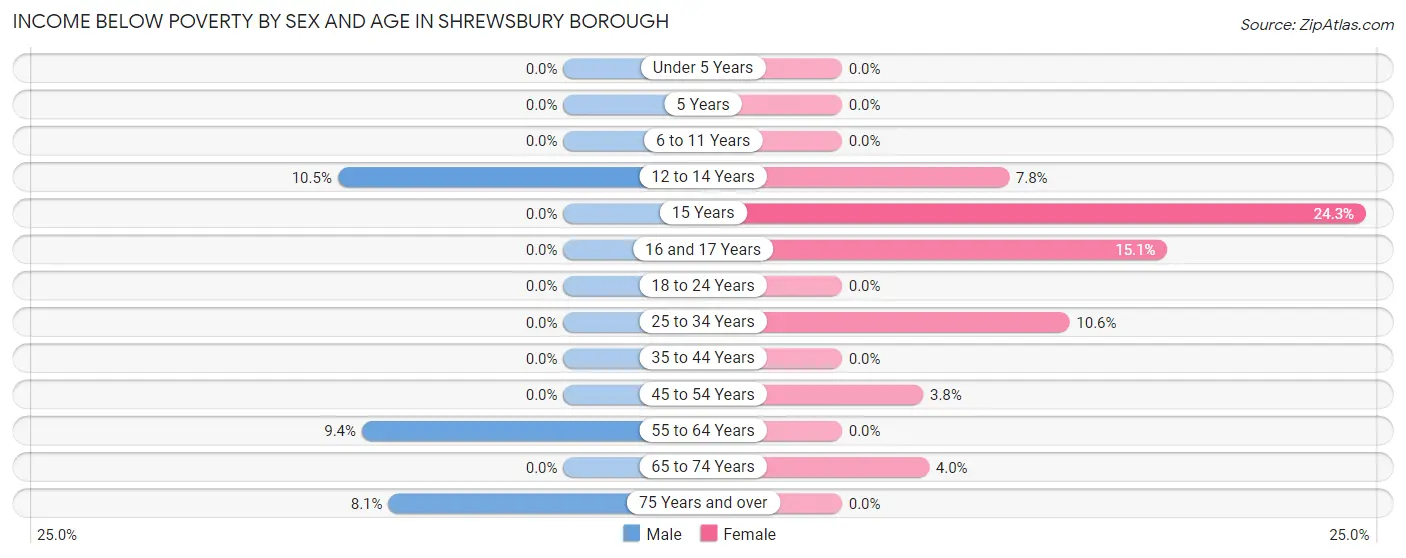
| Age Bracket | Male | Female |
| Under 5 Years | 0 (0.0%) | 0 (0.0%) |
| 5 Years | 0 (0.0%) | 0 (0.0%) |
| 6 to 11 Years | 0 (0.0%) | 0 (0.0%) |
| 12 to 14 Years | 9 (10.5%) | 10 (7.7%) |
| 15 Years | 0 (0.0%) | 9 (24.3%) |
| 16 and 17 Years | 0 (0.0%) | 21 (15.1%) |
| 18 to 24 Years | 0 (0.0%) | 0 (0.0%) |
| 25 to 34 Years | 0 (0.0%) | 17 (10.6%) |
| 35 to 44 Years | 0 (0.0%) | 0 (0.0%) |
| 45 to 54 Years | 0 (0.0%) | 10 (3.8%) |
| 55 to 64 Years | 20 (9.3%) | 0 (0.0%) |
| 65 to 74 Years | 0 (0.0%) | 11 (4.0%) |
| 75 Years and over | 16 (8.1%) | 0 (0.0%) |
| Total | 45 (2.4%) | 78 (3.6%) |
Income Above Poverty by Sex and Age in Shrewsbury borough
According to the poverty statistics in Shrewsbury borough, males aged under 5 years and females aged under 5 years are the age groups that are most secure financially, with 100.0% of males and 100.0% of females in these age groups living above the poverty line.
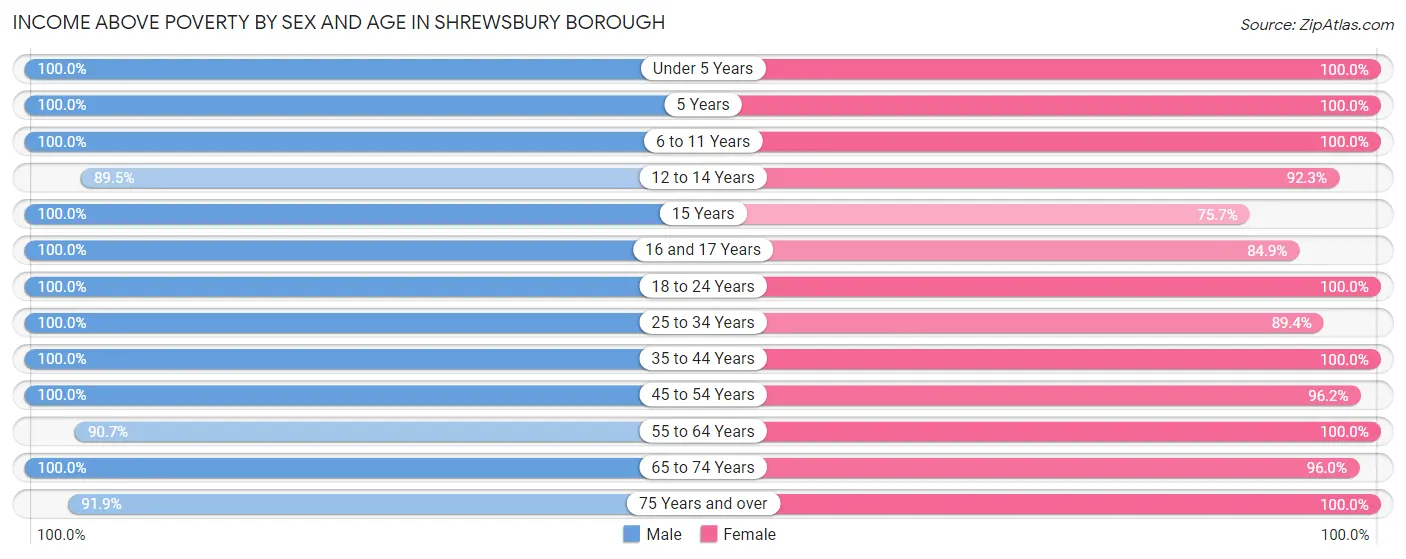
| Age Bracket | Male | Female |
| Under 5 Years | 230 (100.0%) | 182 (100.0%) |
| 5 Years | 15 (100.0%) | 23 (100.0%) |
| 6 to 11 Years | 92 (100.0%) | 137 (100.0%) |
| 12 to 14 Years | 77 (89.5%) | 119 (92.2%) |
| 15 Years | 72 (100.0%) | 28 (75.7%) |
| 16 and 17 Years | 36 (100.0%) | 118 (84.9%) |
| 18 to 24 Years | 117 (100.0%) | 135 (100.0%) |
| 25 to 34 Years | 174 (100.0%) | 144 (89.4%) |
| 35 to 44 Years | 286 (100.0%) | 269 (100.0%) |
| 45 to 54 Years | 236 (100.0%) | 255 (96.2%) |
| 55 to 64 Years | 194 (90.6%) | 200 (100.0%) |
| 65 to 74 Years | 110 (100.0%) | 261 (96.0%) |
| 75 Years and over | 181 (91.9%) | 192 (100.0%) |
| Total | 1,820 (97.6%) | 2,063 (96.4%) |
Income Below Poverty Among Married-Couple Families in Shrewsbury borough
The poverty statistics for married-couple families in Shrewsbury borough show that 0.9% or 9 of the total 974 families live below the poverty line. Families with 3 or 4 children have the highest poverty rate of 5.6%, comprising of 9 families. On the other hand, families with no children have the lowest poverty rate of 0.0%, which includes 0 families.
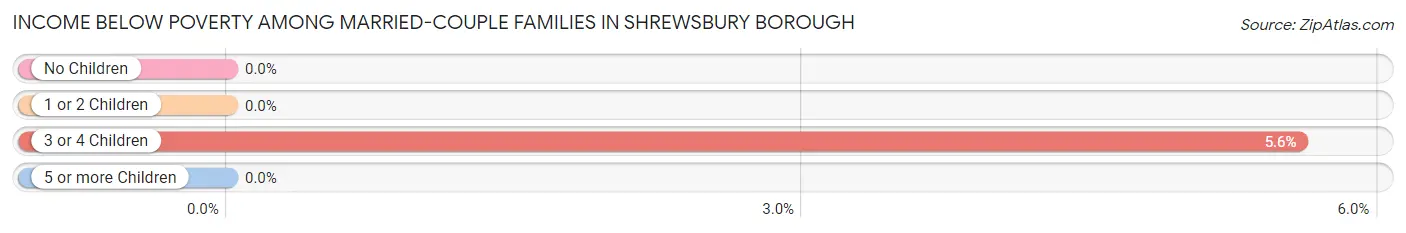
| Children | Above Poverty | Below Poverty |
| No Children | 531 (100.0%) | 0 (0.0%) |
| 1 or 2 Children | 282 (100.0%) | 0 (0.0%) |
| 3 or 4 Children | 152 (94.4%) | 9 (5.6%) |
| 5 or more Children | 0 (0.0%) | 0 (0.0%) |
| Total | 965 (99.1%) | 9 (0.9%) |
Income Below Poverty Among Single-Parent Households in Shrewsbury borough
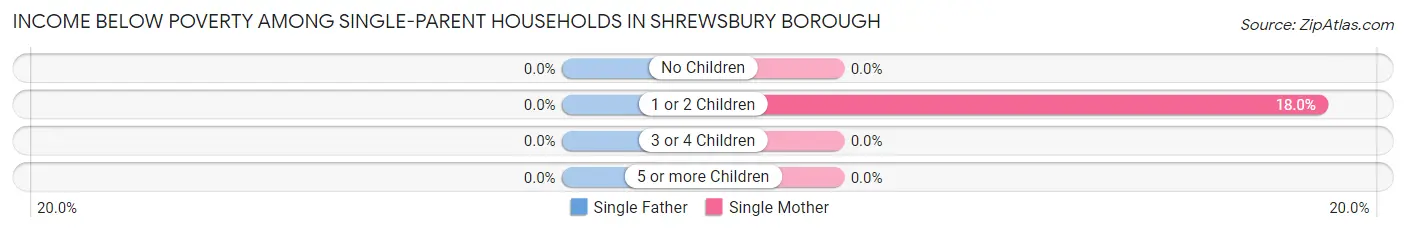
| Children | Single Father | Single Mother |
| No Children | 0 (0.0%) | 0 (0.0%) |
| 1 or 2 Children | 0 (0.0%) | 11 (18.0%) |
| 3 or 4 Children | 0 (0.0%) | 0 (0.0%) |
| 5 or more Children | 0 (0.0%) | 0 (0.0%) |
| Total | 0 (0.0%) | 11 (12.8%) |
Income Below Poverty Among Married-Couple vs Single-Parent Households in Shrewsbury borough
The poverty data for Shrewsbury borough shows that 9 of the married-couple family households (0.9%) and 11 of the single-parent households (7.3%) are living below the poverty level. Within the married-couple family households, those with 3 or 4 children have the highest poverty rate, with 9 households (5.6%) falling below the poverty line. Among the single-parent households, those with 1 or 2 children have the highest poverty rate, with 11 household (15.7%) living below poverty.
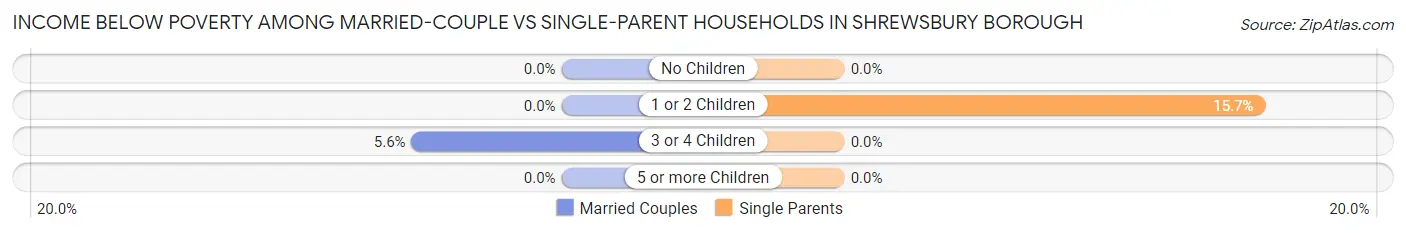
| Children | Married-Couple Families | Single-Parent Households |
| No Children | 0 (0.0%) | 0 (0.0%) |
| 1 or 2 Children | 0 (0.0%) | 11 (15.7%) |
| 3 or 4 Children | 9 (5.6%) | 0 (0.0%) |
| 5 or more Children | 0 (0.0%) | 0 (0.0%) |
| Total | 9 (0.9%) | 11 (7.3%) |
Race in Shrewsbury borough
The most populous races in Shrewsbury borough are White / Caucasian (3,691 | 89.2%), Two or more Races (191 | 4.6%), and Asian (188 | 4.5%).
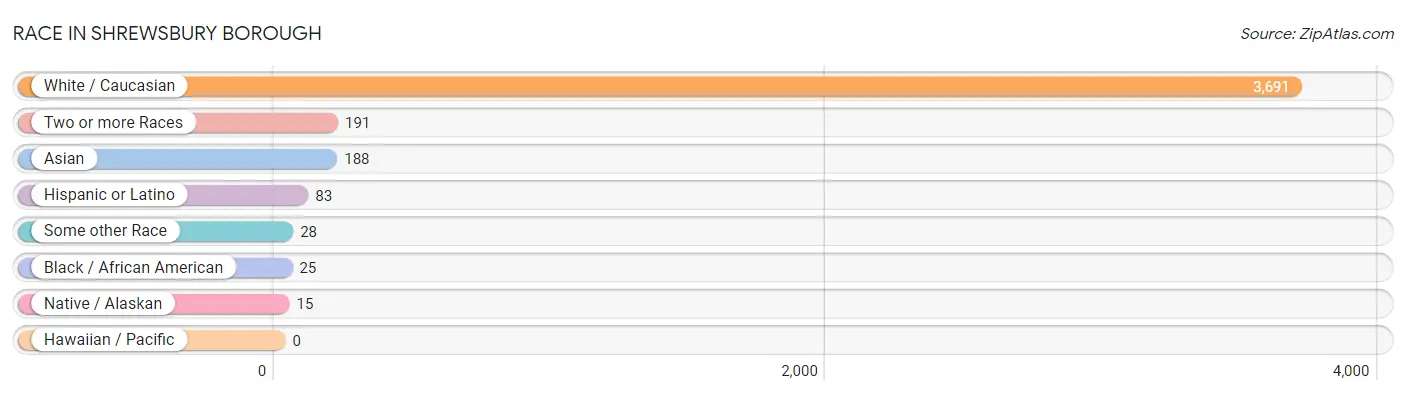
| Race | # Population | % Population |
| Asian | 188 | 4.5% |
| Black / African American | 25 | 0.6% |
| Hawaiian / Pacific | 0 | 0.0% |
| Hispanic or Latino | 83 | 2.0% |
| Native / Alaskan | 15 | 0.4% |
| White / Caucasian | 3,691 | 89.2% |
| Two or more Races | 191 | 4.6% |
| Some other Race | 28 | 0.7% |
| Total | 4,138 | 100.0% |
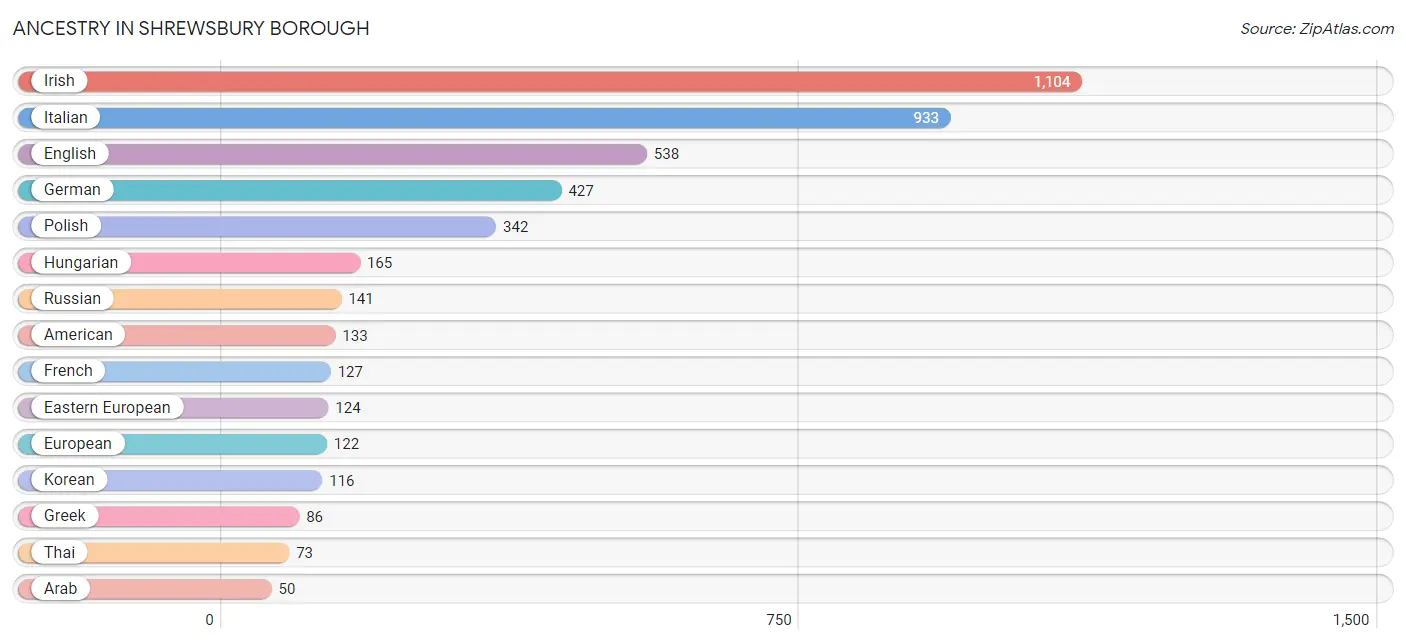
Ancestry in Shrewsbury borough
The most populous ancestries reported in Shrewsbury borough are Irish (1,104 | 26.7%), Italian (933 | 22.6%), English (538 | 13.0%), German (427 | 10.3%), and Polish (342 | 8.3%), together accounting for 80.8% of all Shrewsbury borough residents.
| Ancestry | # Population | % Population |
| American | 133 | 3.2% |
| Arab | 50 | 1.2% |
| Armenian | 8 | 0.2% |
| Austrian | 13 | 0.3% |
| Burmese | 27 | 0.6% |
| Canadian | 12 | 0.3% |
| Celtic | 21 | 0.5% |
| Central American | 49 | 1.2% |
| Colombian | 13 | 0.3% |
| Cuban | 12 | 0.3% |
| Czechoslovakian | 5 | 0.1% |
| Dutch | 44 | 1.1% |
| Eastern European | 124 | 3.0% |
| Egyptian | 50 | 1.2% |
| English | 538 | 13.0% |
| European | 122 | 2.9% |
| French | 127 | 3.1% |
| French Canadian | 10 | 0.2% |
| German | 427 | 10.3% |
| Greek | 86 | 2.1% |
| Guatemalan | 21 | 0.5% |
| Hungarian | 165 | 4.0% |
| Indian (Asian) | 16 | 0.4% |
| Irish | 1,104 | 26.7% |
| Italian | 933 | 22.6% |
| Korean | 116 | 2.8% |
| Norwegian | 10 | 0.2% |
| Polish | 342 | 8.3% |
| Portuguese | 29 | 0.7% |
| Puerto Rican | 9 | 0.2% |
| Romanian | 12 | 0.3% |
| Russian | 141 | 3.4% |
| Salvadoran | 28 | 0.7% |
| Scotch-Irish | 9 | 0.2% |
| Scottish | 38 | 0.9% |
| South American | 13 | 0.3% |
| Sri Lankan | 14 | 0.3% |
| Swedish | 10 | 0.2% |
| Thai | 73 | 1.8% |
| Ukrainian | 15 | 0.4% | View All 40 Rows |
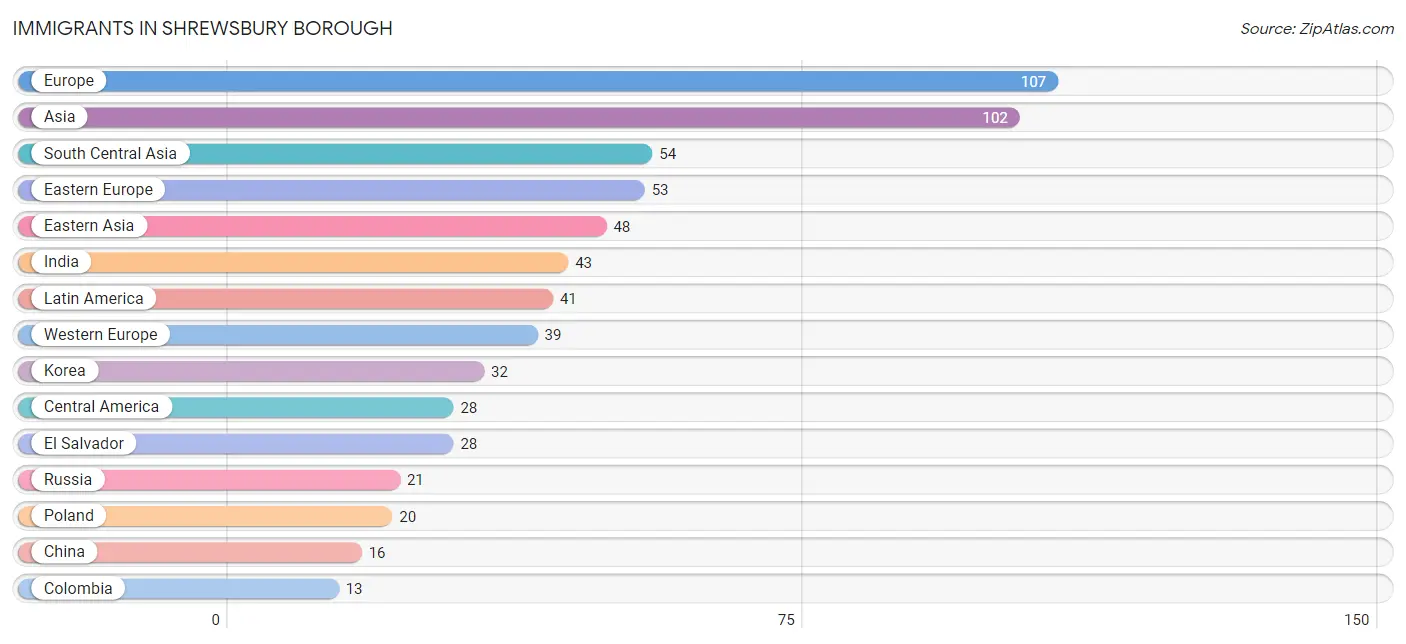
Immigrants in Shrewsbury borough
The most numerous immigrant groups reported in Shrewsbury borough came from Europe (107 | 2.6%), Asia (102 | 2.5%), South Central Asia (54 | 1.3%), Eastern Europe (53 | 1.3%), and Eastern Asia (48 | 1.2%), together accounting for 8.8% of all Shrewsbury borough residents.
| Immigration Origin | # Population | % Population |
| Africa | 8 | 0.2% |
| Asia | 102 | 2.5% |
| Austria | 6 | 0.1% |
| Belarus | 12 | 0.3% |
| Central America | 28 | 0.7% |
| China | 16 | 0.4% |
| Colombia | 13 | 0.3% |
| Eastern Asia | 48 | 1.2% |
| Eastern Europe | 53 | 1.3% |
| Egypt | 8 | 0.2% |
| El Salvador | 28 | 0.7% |
| Europe | 107 | 2.6% |
| France | 9 | 0.2% |
| Germany | 13 | 0.3% |
| India | 43 | 1.0% |
| Italy | 6 | 0.1% |
| Kazakhstan | 11 | 0.3% |
| Korea | 32 | 0.8% |
| Latin America | 41 | 1.0% |
| Netherlands | 11 | 0.3% |
| Northern Africa | 8 | 0.2% |
| Northern Europe | 9 | 0.2% |
| Poland | 20 | 0.5% |
| Russia | 21 | 0.5% |
| South America | 13 | 0.3% |
| South Central Asia | 54 | 1.3% |
| Southern Europe | 6 | 0.1% |
| Western Europe | 39 | 0.9% | View All 28 Rows |
Sex and Age in Shrewsbury borough
Sex and Age in Shrewsbury borough
The most populous age groups in Shrewsbury borough are Under 5 Years (230 | 12.0%) for men and 15 to 19 Years (242 | 10.9%) for women.
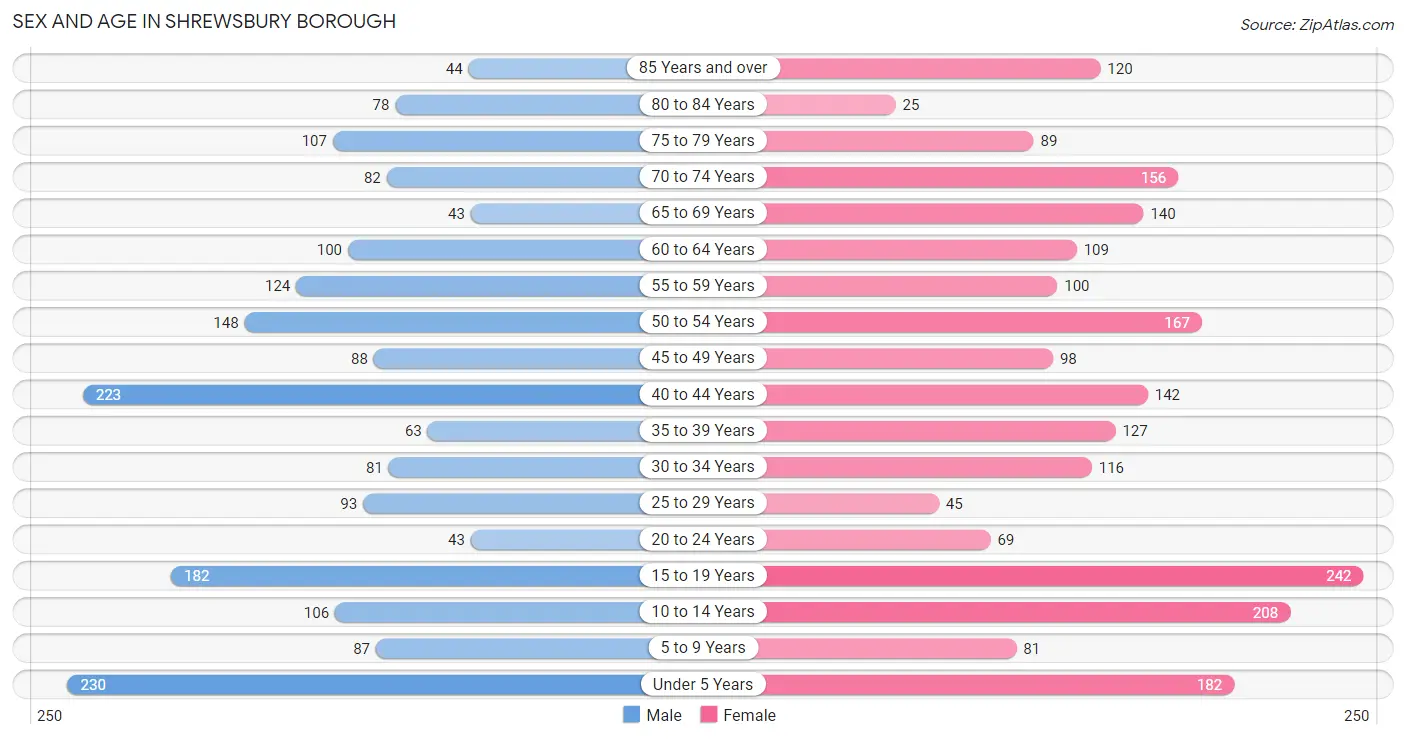
| Age Bracket | Male | Female |
| Under 5 Years | 230 (12.0%) | 182 (8.2%) |
| 5 to 9 Years | 87 (4.5%) | 81 (3.7%) |
| 10 to 14 Years | 106 (5.5%) | 208 (9.4%) |
| 15 to 19 Years | 182 (9.5%) | 242 (10.9%) |
| 20 to 24 Years | 43 (2.2%) | 69 (3.1%) |
| 25 to 29 Years | 93 (4.8%) | 45 (2.0%) |
| 30 to 34 Years | 81 (4.2%) | 116 (5.2%) |
| 35 to 39 Years | 63 (3.3%) | 127 (5.7%) |
| 40 to 44 Years | 223 (11.6%) | 142 (6.4%) |
| 45 to 49 Years | 88 (4.6%) | 98 (4.4%) |
| 50 to 54 Years | 148 (7.7%) | 167 (7.5%) |
| 55 to 59 Years | 124 (6.5%) | 100 (4.5%) |
| 60 to 64 Years | 100 (5.2%) | 109 (4.9%) |
| 65 to 69 Years | 43 (2.2%) | 140 (6.3%) |
| 70 to 74 Years | 82 (4.3%) | 156 (7.0%) |
| 75 to 79 Years | 107 (5.6%) | 89 (4.0%) |
| 80 to 84 Years | 78 (4.1%) | 25 (1.1%) |
| 85 Years and over | 44 (2.3%) | 120 (5.4%) |
| Total | 1,922 (100.0%) | 2,216 (100.0%) |
Families and Households in Shrewsbury borough
Median Family Size in Shrewsbury borough
The median family size in Shrewsbury borough is 3.28 persons per family, with married-couple families (974 | 86.7%) accounting for the largest median family size of 3.34 persons per family. On the other hand, single female/mother families (86 | 7.6%) represent the smallest median family size with 2.74 persons per family.
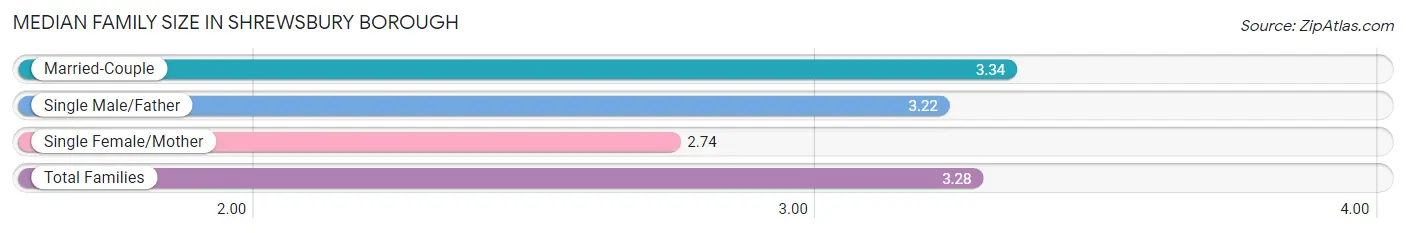
| Family Type | # Families | Family Size |
| Married-Couple | 974 (86.7%) | 3.34 |
| Single Male/Father | 64 (5.7%) | 3.22 |
| Single Female/Mother | 86 (7.6%) | 2.74 |
| Total Families | 1,124 (100.0%) | 3.28 |
Median Household Size in Shrewsbury borough
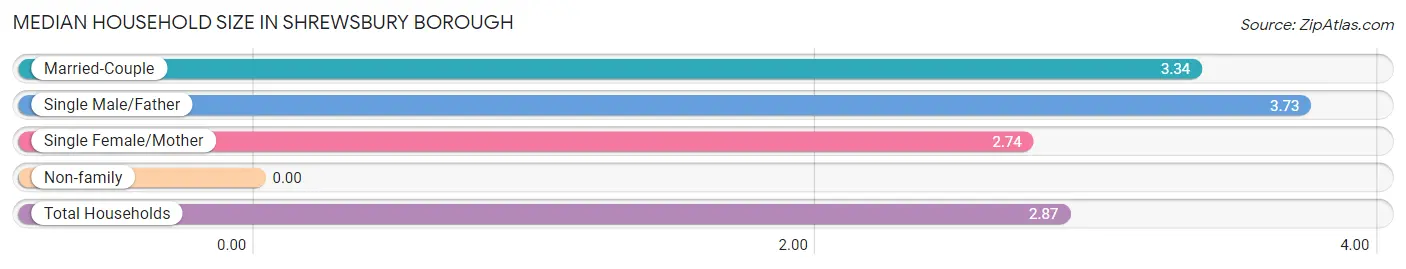
| Household Type | # Households | Household Size |
| Married-Couple | 974 (70.2%) | 3.34 |
| Single Male/Father | 64 (4.6%) | 3.73 |
| Single Female/Mother | 86 (6.2%) | 2.74 |
| Non-family | 264 (19.0%) | - |
| Total Households | 1,388 (100.0%) | 2.87 |
Household Size by Marriage Status in Shrewsbury borough
Out of a total of 1,388 households in Shrewsbury borough, 1,124 (81.0%) are family households, while 264 (19.0%) are nonfamily households. The most numerous type of family households are 2-person households, comprising 436, and the most common type of nonfamily households are 1-person households, comprising 264.
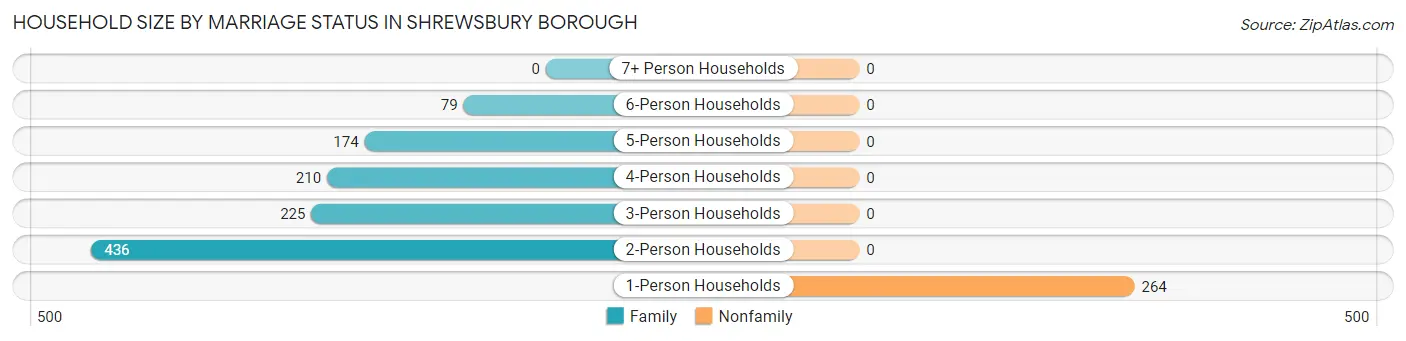
| Household Size | Family Households | Nonfamily Households |
| 1-Person Households | - | 264 (19.0%) |
| 2-Person Households | 436 (31.4%) | 0 (0.0%) |
| 3-Person Households | 225 (16.2%) | 0 (0.0%) |
| 4-Person Households | 210 (15.1%) | 0 (0.0%) |
| 5-Person Households | 174 (12.5%) | 0 (0.0%) |
| 6-Person Households | 79 (5.7%) | 0 (0.0%) |
| 7+ Person Households | 0 (0.0%) | 0 (0.0%) |
| Total | 1,124 (81.0%) | 264 (19.0%) |
Female Fertility in Shrewsbury borough
Fertility by Age in Shrewsbury borough
Average fertility rate in Shrewsbury borough is 143.0 births per 1,000 women. Women in the age bracket of 35 to 50 years have the highest fertility rate with 259.0 births per 1,000 women. Women in the age bracket of 35 to 50 years acount for 83.2% of all women with births.
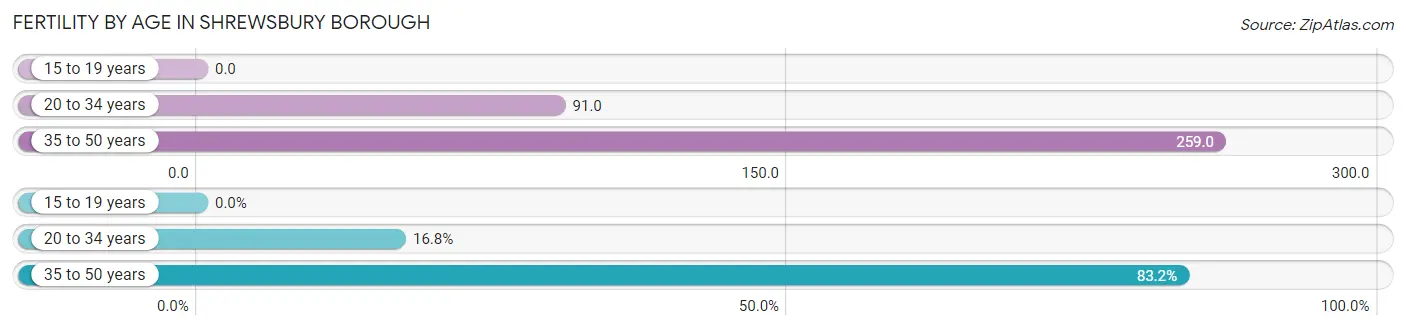
| Age Bracket | Women with Births | Births / 1,000 Women |
| 15 to 19 years | 0 (0.0%) | 0.0 |
| 20 to 34 years | 21 (16.8%) | 91.0 |
| 35 to 50 years | 104 (83.2%) | 259.0 |
| Total | 125 (100.0%) | 143.0 |
Fertility by Age by Marriage Status in Shrewsbury borough
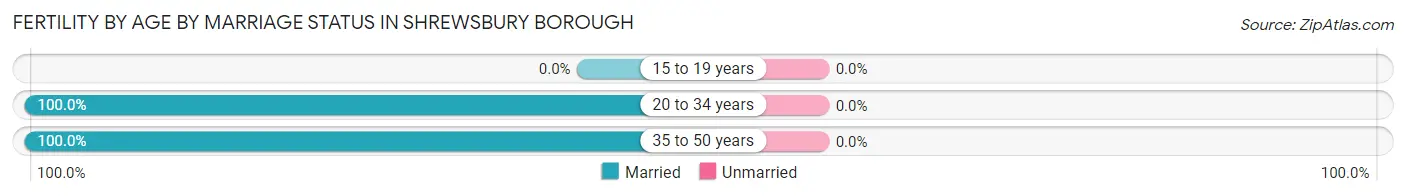
| Age Bracket | Married | Unmarried |
| 15 to 19 years | 0 (0.0%) | 0 (0.0%) |
| 20 to 34 years | 21 (100.0%) | 0 (0.0%) |
| 35 to 50 years | 104 (100.0%) | 0 (0.0%) |
| Total | 125 (100.0%) | 0 (0.0%) |
Fertility by Education in Shrewsbury borough
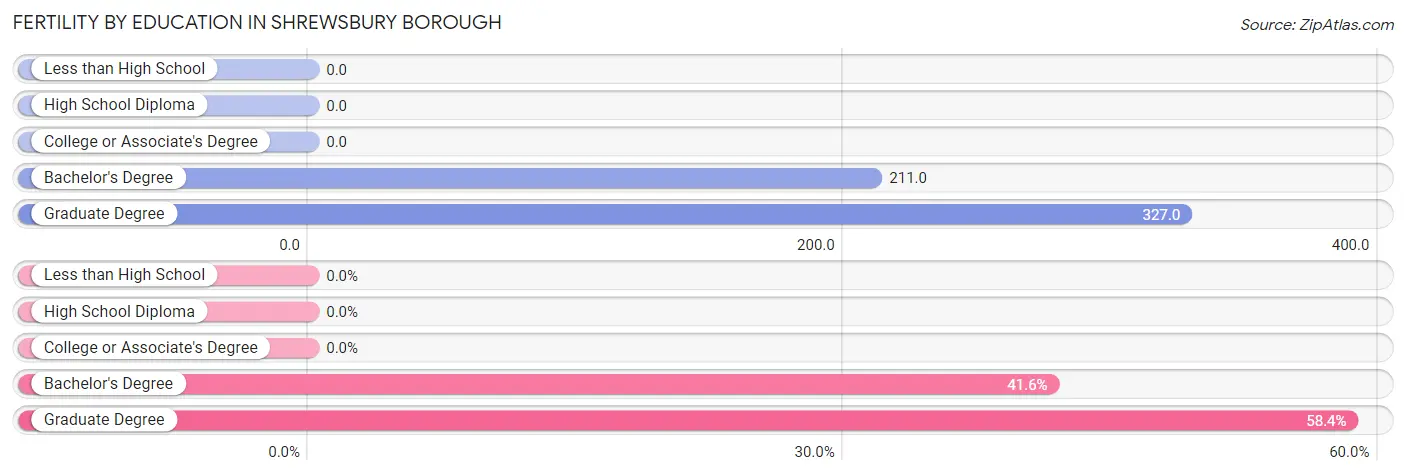
| Educational Attainment | Women with Births | Births / 1,000 Women |
| Less than High School | 0 (0.0%) | 0.0 |
| High School Diploma | 0 (0.0%) | 0.0 |
| College or Associate's Degree | 0 (0.0%) | 0.0 |
| Bachelor's Degree | 52 (41.6%) | 211.0 |
| Graduate Degree | 73 (58.4%) | 327.0 |
| Total | 125 (100.0%) | 143.0 |
Fertility by Education by Marriage Status in Shrewsbury borough
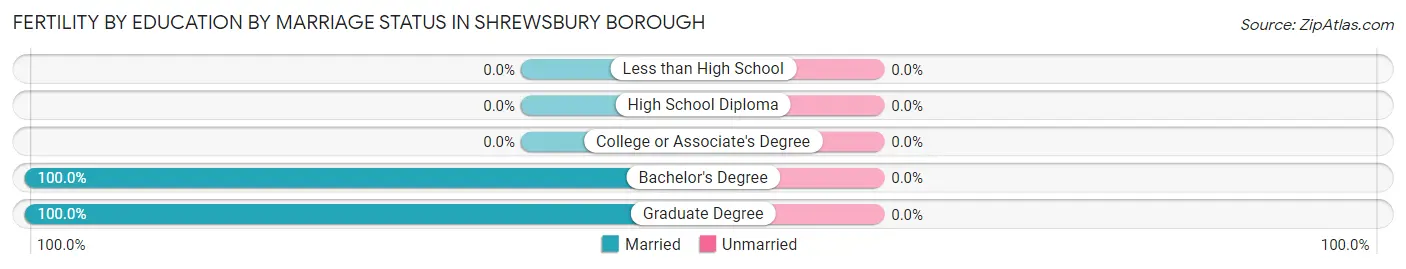
| Educational Attainment | Married | Unmarried |
| Less than High School | 0 (0.0%) | 0 (0.0%) |
| High School Diploma | 0 (0.0%) | 0 (0.0%) |
| College or Associate's Degree | 0 (0.0%) | 0 (0.0%) |
| Bachelor's Degree | 52 (100.0%) | 0 (0.0%) |
| Graduate Degree | 73 (100.0%) | 0 (0.0%) |
| Total | 125 (100.0%) | 0 (0.0%) |
Employment Characteristics in Shrewsbury borough
Employment by Class of Employer in Shrewsbury borough
Among the 1,751 employed individuals in Shrewsbury borough, private company employees (1,049 | 59.9%), local government employees (247 | 14.1%), and self-employed (not incorporated) (147 | 8.4%) make up the most common classes of employment.
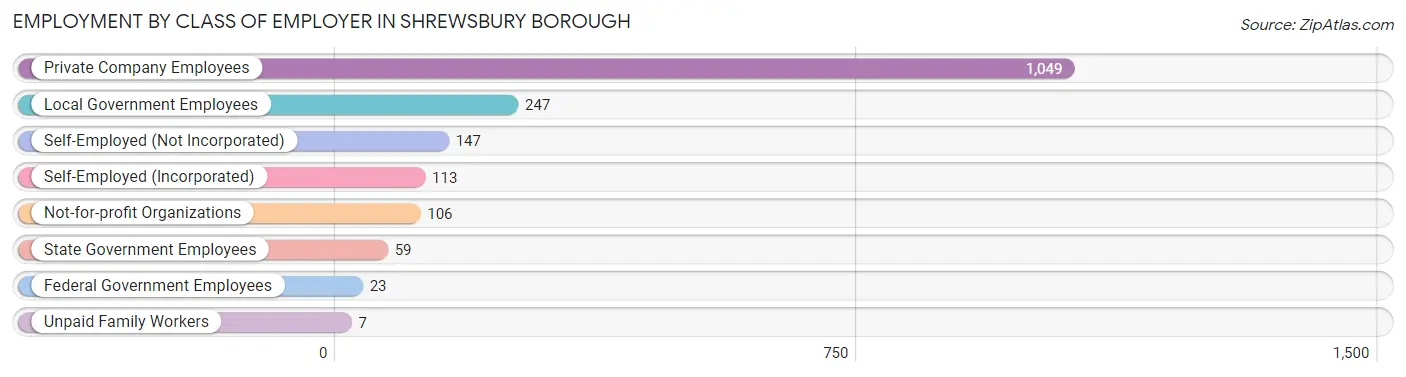
| Employer Class | # Employees | % Employees |
| Private Company Employees | 1,049 | 59.9% |
| Self-Employed (Incorporated) | 113 | 6.5% |
| Self-Employed (Not Incorporated) | 147 | 8.4% |
| Not-for-profit Organizations | 106 | 6.0% |
| Local Government Employees | 247 | 14.1% |
| State Government Employees | 59 | 3.4% |
| Federal Government Employees | 23 | 1.3% |
| Unpaid Family Workers | 7 | 0.4% |
| Total | 1,751 | 100.0% |
Employment Status by Age in Shrewsbury borough
According to the labor force statistics for Shrewsbury borough, out of the total population over 16 years of age (3,135), 58.7% or 1,840 individuals are in the labor force, with 4.0% or 74 of them unemployed. The age group with the highest labor force participation rate is 25 to 29 years, with 100.0% or 138 individuals in the labor force. Within the labor force, the 16 to 19 years age range has the highest percentage of unemployed individuals, with 18.0% or 24 of them being unemployed.
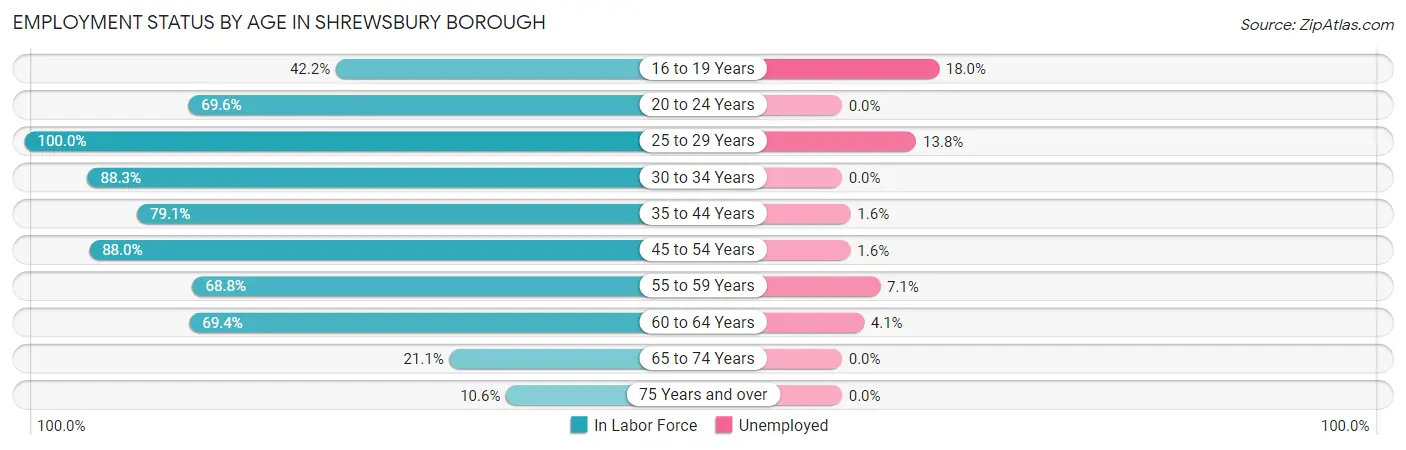
| Age Bracket | In Labor Force | Unemployed |
| 16 to 19 Years | 133 (42.2%) | 24 (18.0%) |
| 20 to 24 Years | 78 (69.6%) | 0 (0.0%) |
| 25 to 29 Years | 138 (100.0%) | 19 (13.8%) |
| 30 to 34 Years | 174 (88.3%) | 0 (0.0%) |
| 35 to 44 Years | 439 (79.1%) | 7 (1.6%) |
| 45 to 54 Years | 441 (88.0%) | 7 (1.6%) |
| 55 to 59 Years | 154 (68.8%) | 11 (7.1%) |
| 60 to 64 Years | 145 (69.4%) | 6 (4.1%) |
| 65 to 74 Years | 89 (21.1%) | 0 (0.0%) |
| 75 Years and over | 49 (10.6%) | 0 (0.0%) |
| Total | 1,840 (58.7%) | 74 (4.0%) |
Employment Status by Educational Attainment in Shrewsbury borough
According to labor force statistics for Shrewsbury borough, 81.7% of individuals (1,490) out of the total population between 25 and 64 years of age (1,824) are in the labor force, with 3.4% or 51 of them being unemployed. The group with the highest labor force participation rate are those with the educational attainment of less than high school, with 100.0% or 16 individuals in the labor force. Within the labor force, individuals with college / associate degree education have the highest percentage of unemployment, with 9.4% or 18 of them being unemployed.
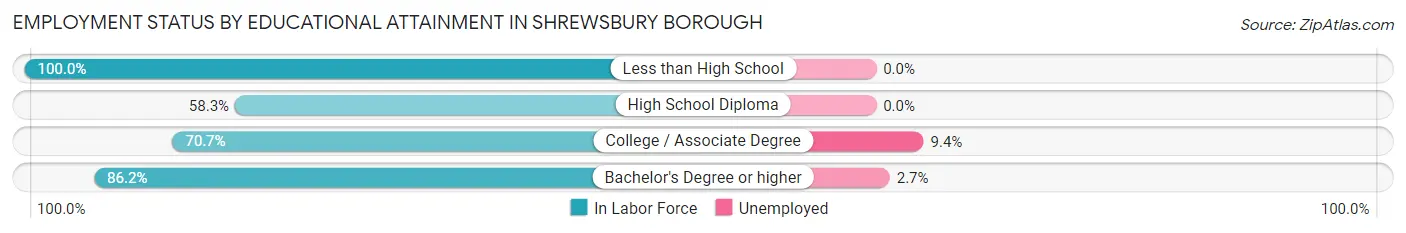
| Educational Attainment | In Labor Force | Unemployed |
| Less than High School | 16 (100.0%) | 0 (0.0%) |
| High School Diploma | 88 (58.3%) | 0 (0.0%) |
| College / Associate Degree | 191 (70.7%) | 25 (9.4%) |
| Bachelor's Degree or higher | 1,196 (86.2%) | 37 (2.7%) |
| Total | 1,490 (81.7%) | 62 (3.4%) |
Employment Occupations by Sex in Shrewsbury borough
Management, Business, Science and Arts Occupations
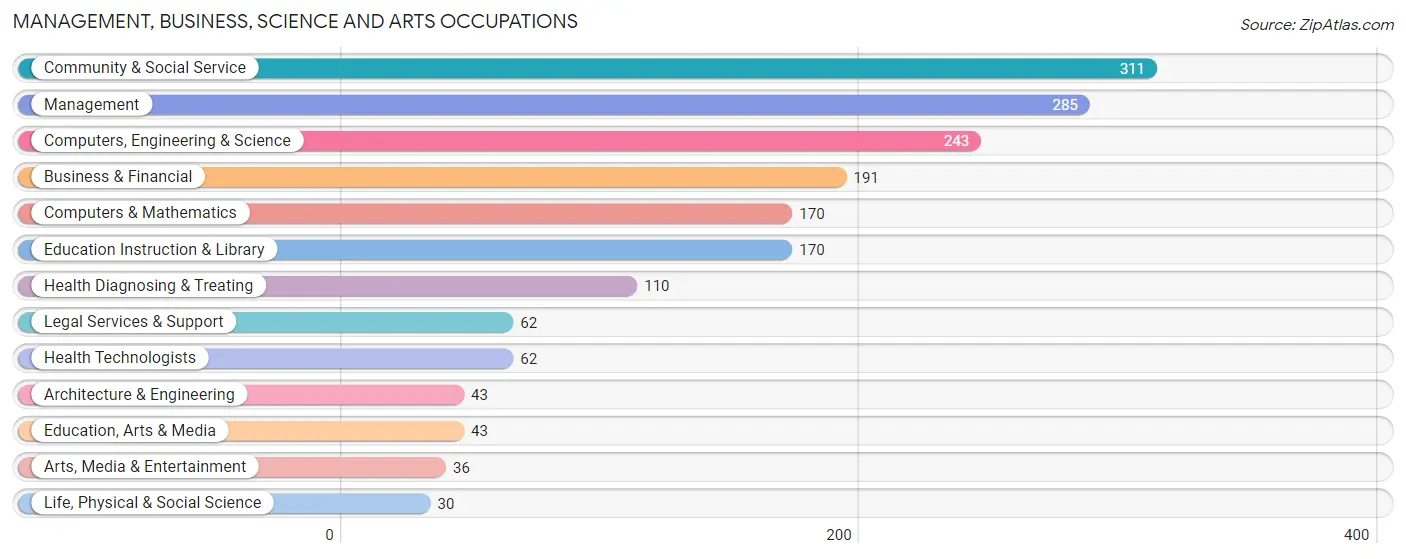
The most common Management, Business, Science and Arts occupations in Shrewsbury borough are Community & Social Service (311 | 17.6%), Management (285 | 16.1%), Computers, Engineering & Science (243 | 13.8%), Business & Financial (191 | 10.8%), and Computers & Mathematics (170 | 9.6%).
Management, Business, Science and Arts Occupations by Sex
Within the Management, Business, Science and Arts occupations in Shrewsbury borough, the most male-oriented occupations are Architecture & Engineering (100.0%), Business & Financial (81.7%), and Arts, Media & Entertainment (72.2%), while the most female-oriented occupations are Life, Physical & Social Science (100.0%), Education Instruction & Library (87.1%), and Legal Services & Support (75.8%).
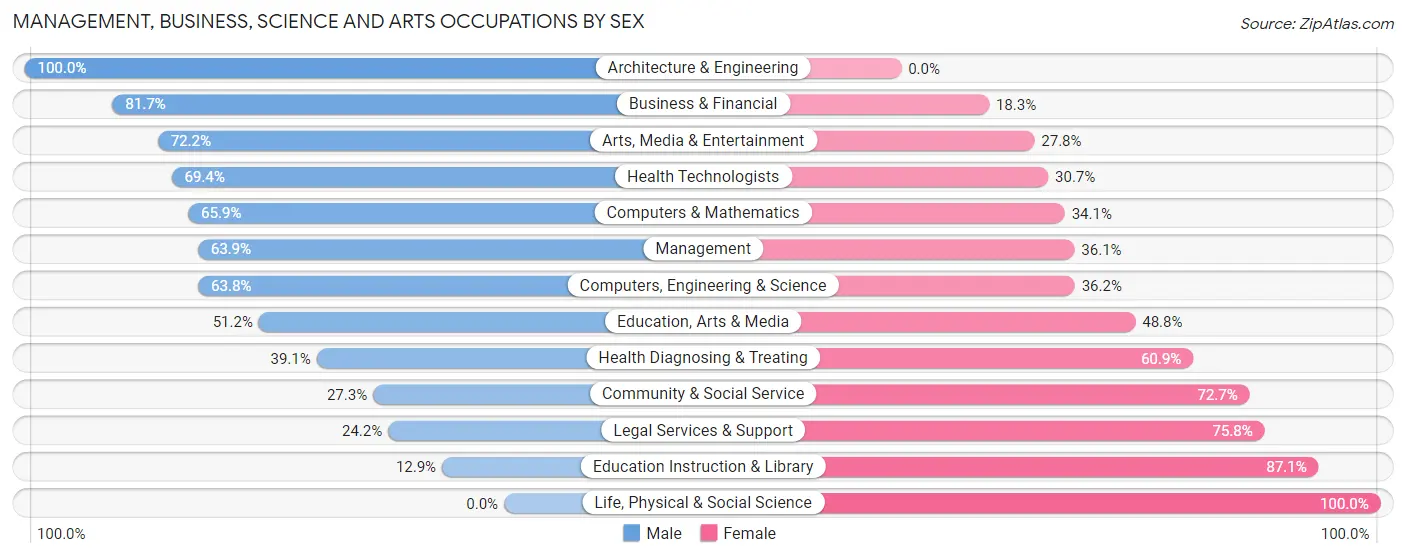
| Occupation | Male | Female |
| Management | 182 (63.9%) | 103 (36.1%) |
| Business & Financial | 156 (81.7%) | 35 (18.3%) |
| Computers, Engineering & Science | 155 (63.8%) | 88 (36.2%) |
| Computers & Mathematics | 112 (65.9%) | 58 (34.1%) |
| Architecture & Engineering | 43 (100.0%) | 0 (0.0%) |
| Life, Physical & Social Science | 0 (0.0%) | 30 (100.0%) |
| Community & Social Service | 85 (27.3%) | 226 (72.7%) |
| Education, Arts & Media | 22 (51.2%) | 21 (48.8%) |
| Legal Services & Support | 15 (24.2%) | 47 (75.8%) |
| Education Instruction & Library | 22 (12.9%) | 148 (87.1%) |
| Arts, Media & Entertainment | 26 (72.2%) | 10 (27.8%) |
| Health Diagnosing & Treating | 43 (39.1%) | 67 (60.9%) |
| Health Technologists | 43 (69.4%) | 19 (30.6%) |
| Total (Category) | 621 (54.5%) | 519 (45.5%) |
| Total (Overall) | 953 (54.0%) | 813 (46.0%) |
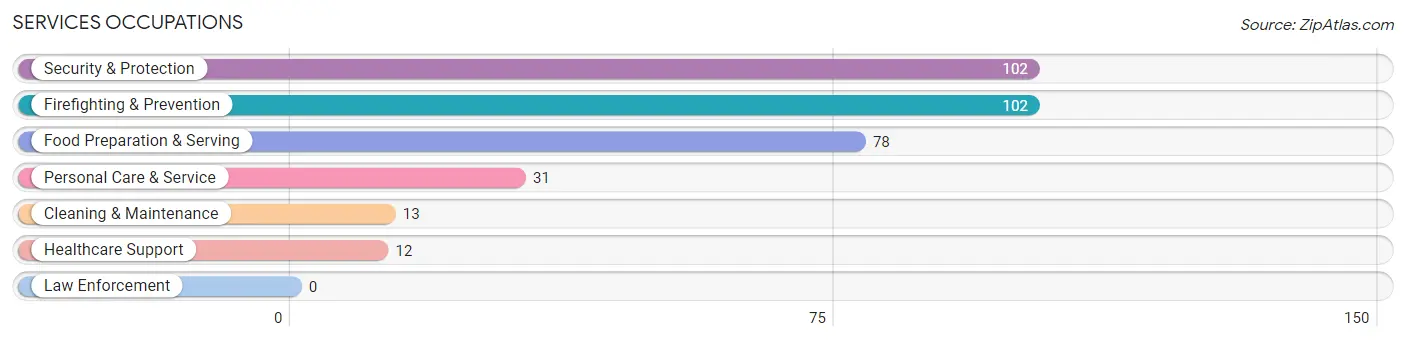
Services Occupations
The most common Services occupations in Shrewsbury borough are Security & Protection (102 | 5.8%), Firefighting & Prevention (102 | 5.8%), Food Preparation & Serving (78 | 4.4%), Personal Care & Service (31 | 1.8%), and Cleaning & Maintenance (13 | 0.7%).
Services Occupations by Sex
Within the Services occupations in Shrewsbury borough, the most male-oriented occupations are Healthcare Support (100.0%), Security & Protection (78.4%), and Firefighting & Prevention (78.4%), while the most female-oriented occupations are Cleaning & Maintenance (100.0%), Personal Care & Service (100.0%), and Food Preparation & Serving (75.6%).
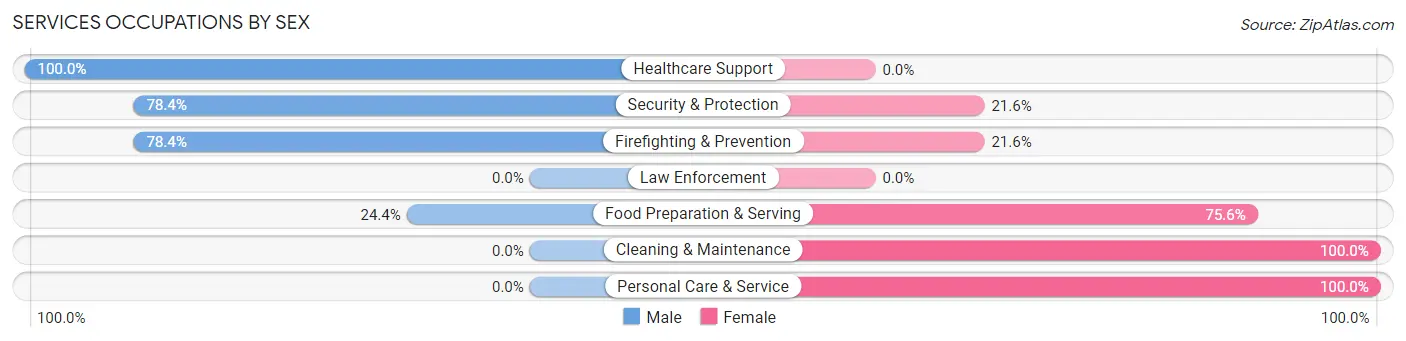
| Occupation | Male | Female |
| Healthcare Support | 12 (100.0%) | 0 (0.0%) |
| Security & Protection | 80 (78.4%) | 22 (21.6%) |
| Firefighting & Prevention | 80 (78.4%) | 22 (21.6%) |
| Law Enforcement | 0 (0.0%) | 0 (0.0%) |
| Food Preparation & Serving | 19 (24.4%) | 59 (75.6%) |
| Cleaning & Maintenance | 0 (0.0%) | 13 (100.0%) |
| Personal Care & Service | 0 (0.0%) | 31 (100.0%) |
| Total (Category) | 111 (47.0%) | 125 (53.0%) |
| Total (Overall) | 953 (54.0%) | 813 (46.0%) |
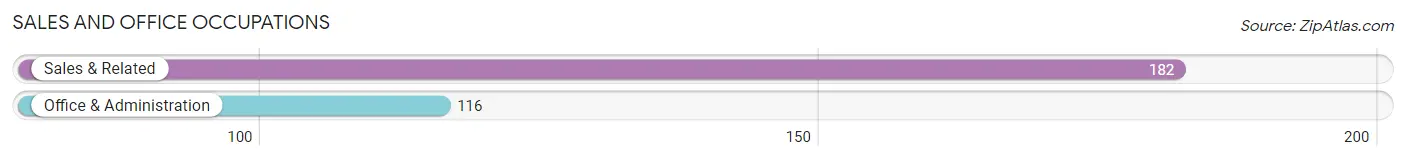
Sales and Office Occupations
The most common Sales and Office occupations in Shrewsbury borough are Sales & Related (182 | 10.3%), and Office & Administration (116 | 6.6%).
Sales and Office Occupations by Sex
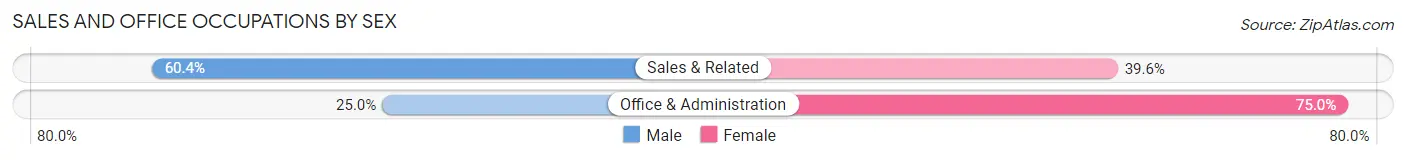
| Occupation | Male | Female |
| Sales & Related | 110 (60.4%) | 72 (39.6%) |
| Office & Administration | 29 (25.0%) | 87 (75.0%) |
| Total (Category) | 139 (46.6%) | 159 (53.4%) |
| Total (Overall) | 953 (54.0%) | 813 (46.0%) |
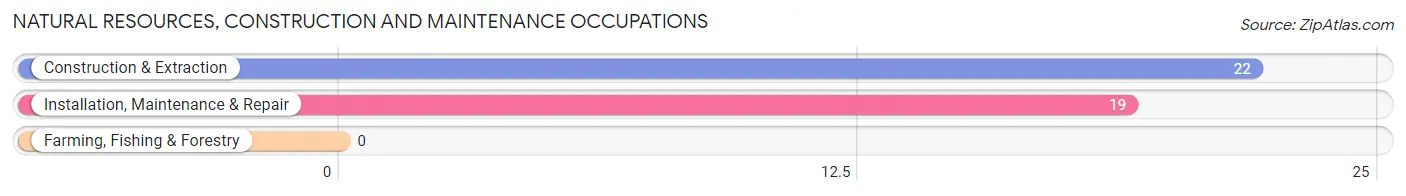
Natural Resources, Construction and Maintenance Occupations
The most common Natural Resources, Construction and Maintenance occupations in Shrewsbury borough are Construction & Extraction (22 | 1.3%), and Installation, Maintenance & Repair (19 | 1.1%).
Natural Resources, Construction and Maintenance Occupations by Sex
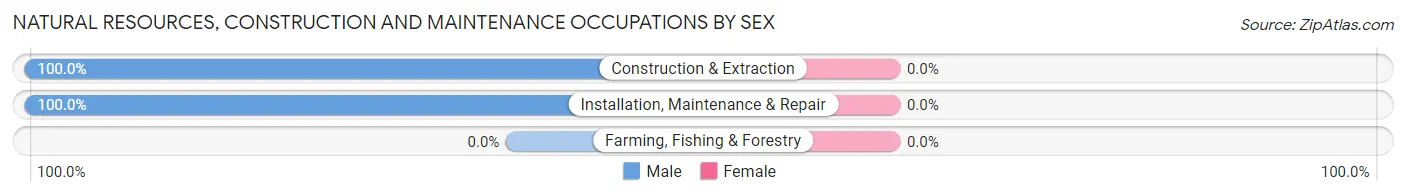
| Occupation | Male | Female |
| Farming, Fishing & Forestry | 0 (0.0%) | 0 (0.0%) |
| Construction & Extraction | 22 (100.0%) | 0 (0.0%) |
| Installation, Maintenance & Repair | 19 (100.0%) | 0 (0.0%) |
| Total (Category) | 41 (100.0%) | 0 (0.0%) |
| Total (Overall) | 953 (54.0%) | 813 (46.0%) |
Production, Transportation and Moving Occupations
The most common Production, Transportation and Moving occupations in Shrewsbury borough are Transportation (41 | 2.3%), and Material Moving (10 | 0.6%).
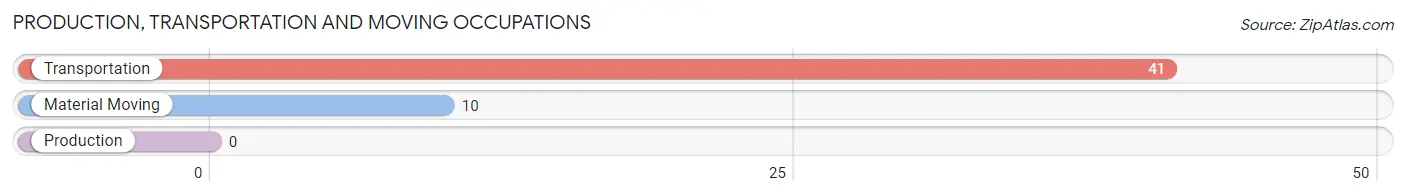
Production, Transportation and Moving Occupations by Sex
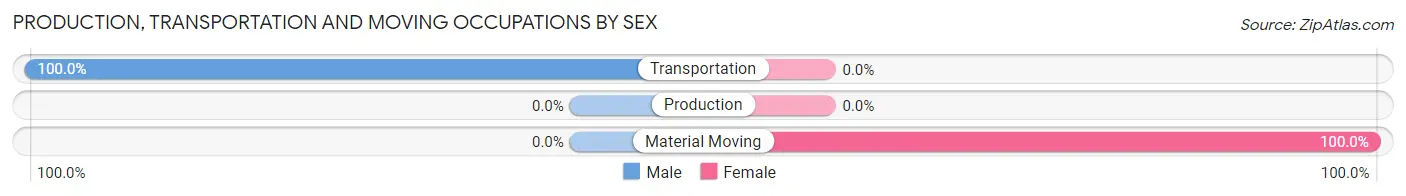
| Occupation | Male | Female |
| Production | 0 (0.0%) | 0 (0.0%) |
| Transportation | 41 (100.0%) | 0 (0.0%) |
| Material Moving | 0 (0.0%) | 10 (100.0%) |
| Total (Category) | 41 (80.4%) | 10 (19.6%) |
| Total (Overall) | 953 (54.0%) | 813 (46.0%) |
Employment Industries by Sex in Shrewsbury borough
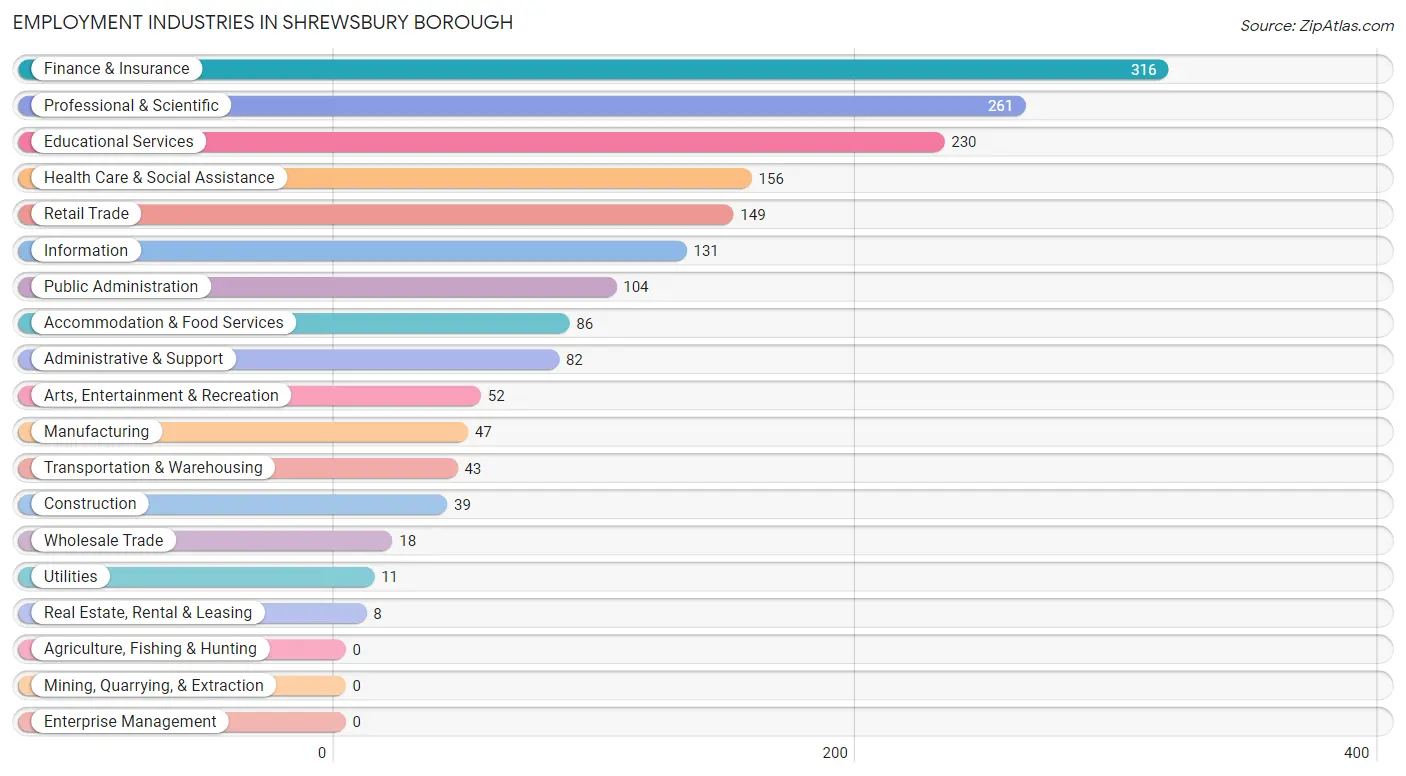
Employment Industries in Shrewsbury borough
The major employment industries in Shrewsbury borough include Finance & Insurance (316 | 17.9%), Professional & Scientific (261 | 14.8%), Educational Services (230 | 13.0%), Health Care & Social Assistance (156 | 8.8%), and Retail Trade (149 | 8.4%).
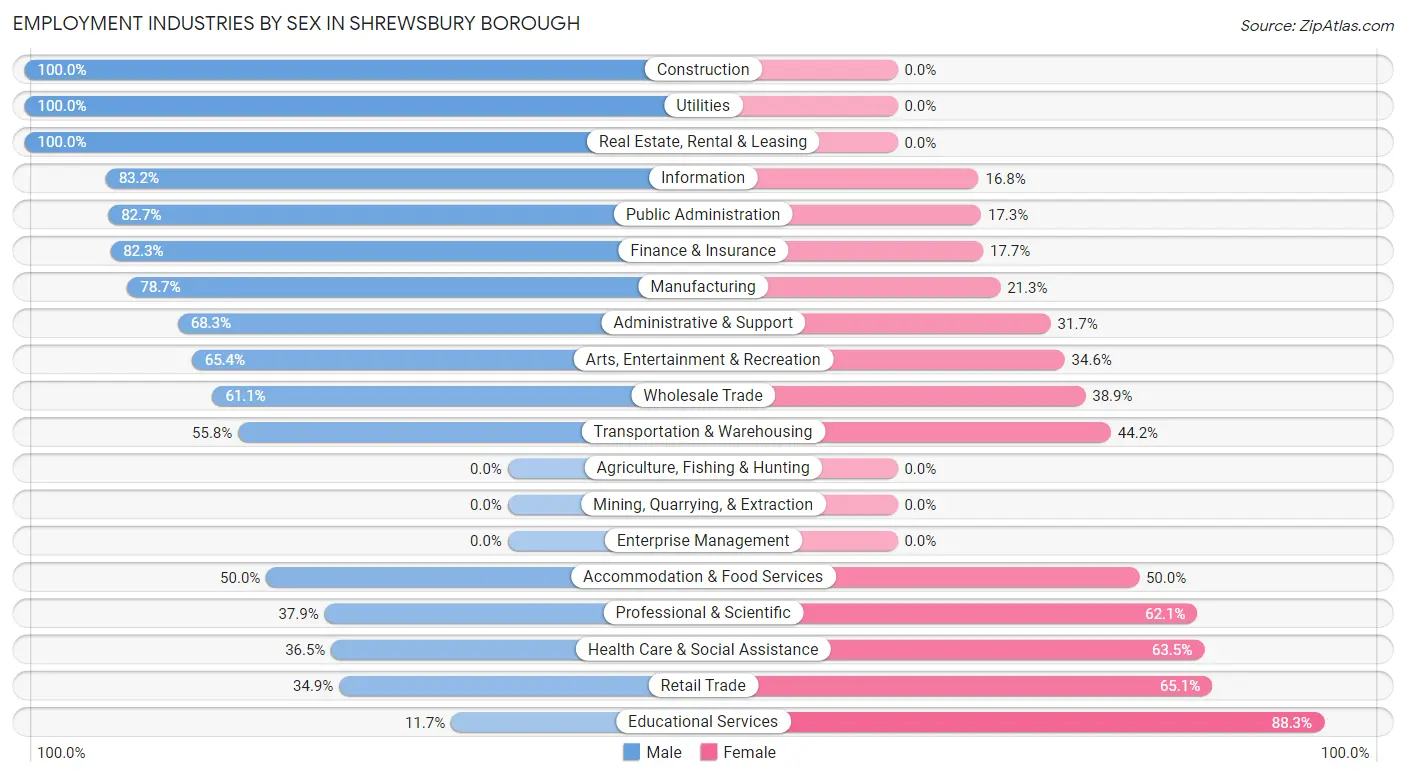
Employment Industries by Sex in Shrewsbury borough
The Shrewsbury borough industries that see more men than women are Construction (100.0%), Utilities (100.0%), and Real Estate, Rental & Leasing (100.0%), whereas the industries that tend to have a higher number of women are Educational Services (88.3%), Retail Trade (65.1%), and Health Care & Social Assistance (63.5%).
| Industry | Male | Female |
| Agriculture, Fishing & Hunting | 0 (0.0%) | 0 (0.0%) |
| Mining, Quarrying, & Extraction | 0 (0.0%) | 0 (0.0%) |
| Construction | 39 (100.0%) | 0 (0.0%) |
| Manufacturing | 37 (78.7%) | 10 (21.3%) |
| Wholesale Trade | 11 (61.1%) | 7 (38.9%) |
| Retail Trade | 52 (34.9%) | 97 (65.1%) |
| Transportation & Warehousing | 24 (55.8%) | 19 (44.2%) |
| Utilities | 11 (100.0%) | 0 (0.0%) |
| Information | 109 (83.2%) | 22 (16.8%) |
| Finance & Insurance | 260 (82.3%) | 56 (17.7%) |
| Real Estate, Rental & Leasing | 8 (100.0%) | 0 (0.0%) |
| Professional & Scientific | 99 (37.9%) | 162 (62.1%) |
| Enterprise Management | 0 (0.0%) | 0 (0.0%) |
| Administrative & Support | 56 (68.3%) | 26 (31.7%) |
| Educational Services | 27 (11.7%) | 203 (88.3%) |
| Health Care & Social Assistance | 57 (36.5%) | 99 (63.5%) |
| Arts, Entertainment & Recreation | 34 (65.4%) | 18 (34.6%) |
| Accommodation & Food Services | 43 (50.0%) | 43 (50.0%) |
| Public Administration | 86 (82.7%) | 18 (17.3%) |
| Total | 953 (54.0%) | 813 (46.0%) |
Education in Shrewsbury borough
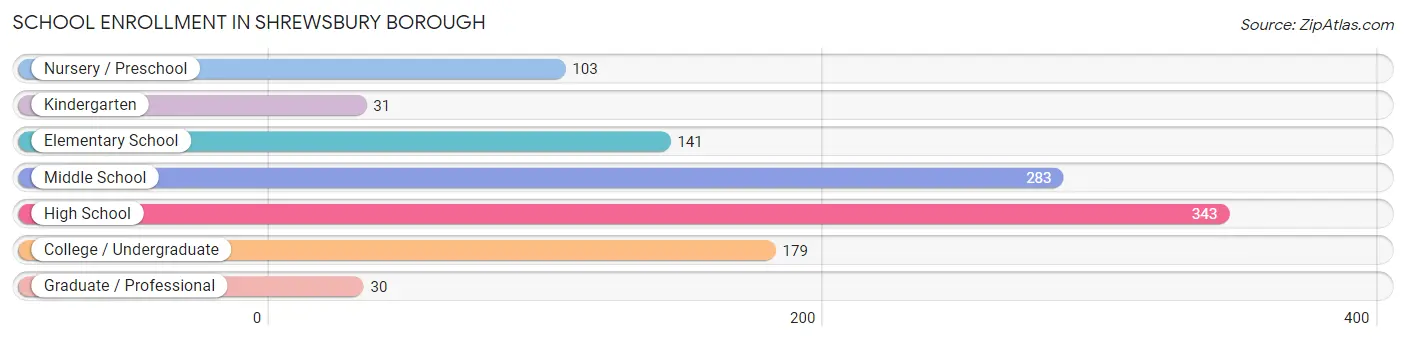
School Enrollment in Shrewsbury borough
The most common levels of schooling among the 1,110 students in Shrewsbury borough are high school (343 | 30.9%), middle school (283 | 25.5%), and college / undergraduate (179 | 16.1%).
| School Level | # Students | % Students |
| Nursery / Preschool | 103 | 9.3% |
| Kindergarten | 31 | 2.8% |
| Elementary School | 141 | 12.7% |
| Middle School | 283 | 25.5% |
| High School | 343 | 30.9% |
| College / Undergraduate | 179 | 16.1% |
| Graduate / Professional | 30 | 2.7% |
| Total | 1,110 | 100.0% |
School Enrollment by Age by Funding Source in Shrewsbury borough
Out of a total of 1,110 students who are enrolled in schools in Shrewsbury borough, 210 (18.9%) attend a private institution, while the remaining 900 (81.1%) are enrolled in public schools. The age group of 35 years and over has the highest likelihood of being enrolled in private schools, with 11 (100.0% in the age bracket) enrolled. Conversely, the age group of 15 to 17 year olds has the lowest likelihood of being enrolled in a private school, with 274 (96.5% in the age bracket) attending a public institution.
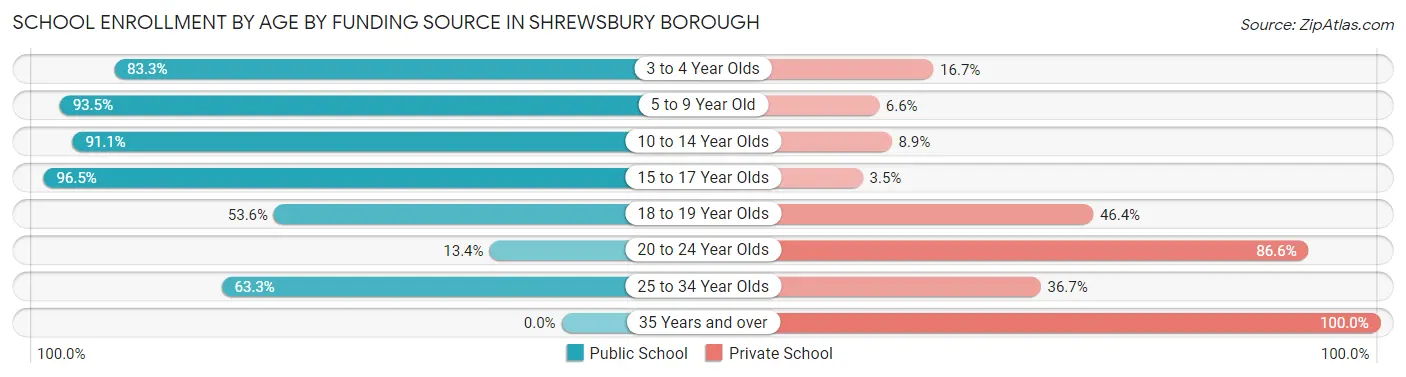
| Age Bracket | Public School | Private School |
| 3 to 4 Year Olds | 80 (83.3%) | 16 (16.7%) |
| 5 to 9 Year Old | 157 (93.4%) | 11 (6.6%) |
| 10 to 14 Year Olds | 286 (91.1%) | 28 (8.9%) |
| 15 to 17 Year Olds | 274 (96.5%) | 10 (3.5%) |
| 18 to 19 Year Olds | 75 (53.6%) | 65 (46.4%) |
| 20 to 24 Year Olds | 9 (13.4%) | 58 (86.6%) |
| 25 to 34 Year Olds | 19 (63.3%) | 11 (36.7%) |
| 35 Years and over | 0 (0.0%) | 11 (100.0%) |
| Total | 900 (81.1%) | 210 (18.9%) |
Educational Attainment by Field of Study in Shrewsbury borough
Business (382 | 19.5%), social sciences (350 | 17.8%), education (215 | 11.0%), liberal arts & history (151 | 7.7%), and communications (139 | 7.1%) are the most common fields of study among 1,963 individuals in Shrewsbury borough who have obtained a bachelor's degree or higher.
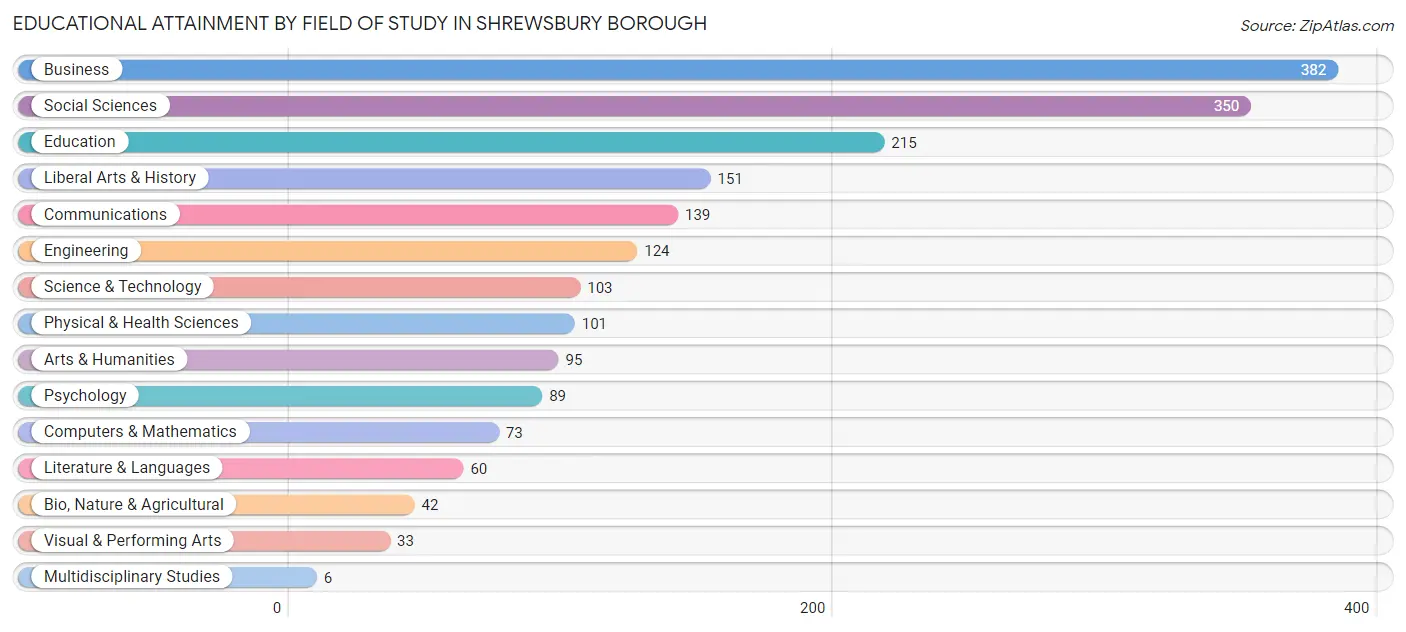
| Field of Study | # Graduates | % Graduates |
| Computers & Mathematics | 73 | 3.7% |
| Bio, Nature & Agricultural | 42 | 2.1% |
| Physical & Health Sciences | 101 | 5.1% |
| Psychology | 89 | 4.5% |
| Social Sciences | 350 | 17.8% |
| Engineering | 124 | 6.3% |
| Multidisciplinary Studies | 6 | 0.3% |
| Science & Technology | 103 | 5.2% |
| Business | 382 | 19.5% |
| Education | 215 | 11.0% |
| Literature & Languages | 60 | 3.1% |
| Liberal Arts & History | 151 | 7.7% |
| Visual & Performing Arts | 33 | 1.7% |
| Communications | 139 | 7.1% |
| Arts & Humanities | 95 | 4.8% |
| Total | 1,963 | 100.0% |
Transportation & Commute in Shrewsbury borough
Vehicle Availability by Sex in Shrewsbury borough
The most prevalent vehicle ownership categories in Shrewsbury borough are males with 2 vehicles (357, accounting for 37.5%) and females with 2 vehicles (330, making up 44.7%).
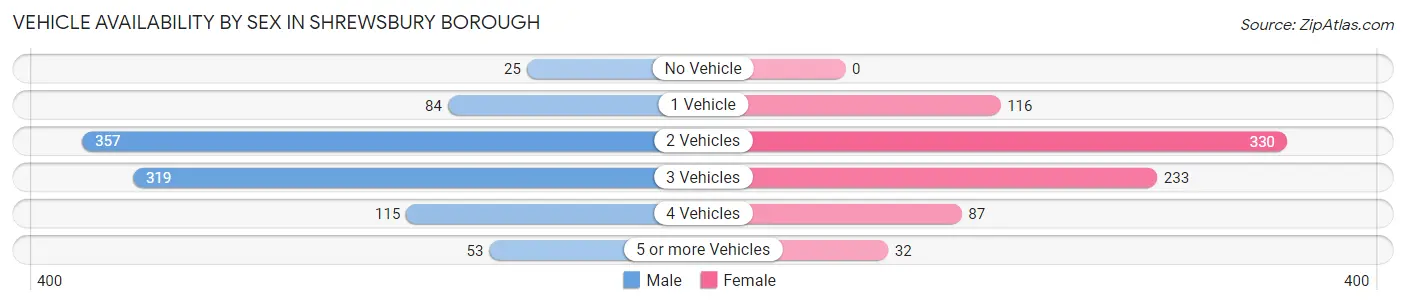
| Vehicles Available | Male | Female |
| No Vehicle | 25 (2.6%) | 0 (0.0%) |
| 1 Vehicle | 84 (8.8%) | 116 (14.5%) |
| 2 Vehicles | 357 (37.5%) | 330 (41.3%) |
| 3 Vehicles | 319 (33.5%) | 233 (29.2%) |
| 4 Vehicles | 115 (12.1%) | 87 (10.9%) |
| 5 or more Vehicles | 53 (5.6%) | 32 (4.0%) |
| Total | 953 (100.0%) | 798 (100.0%) |
Commute Time in Shrewsbury borough
The most frequently occuring commute durations in Shrewsbury borough are 5 to 9 minutes (232 commuters, 17.7%), 10 to 14 minutes (223 commuters, 17.0%), and 20 to 24 minutes (193 commuters, 14.7%).
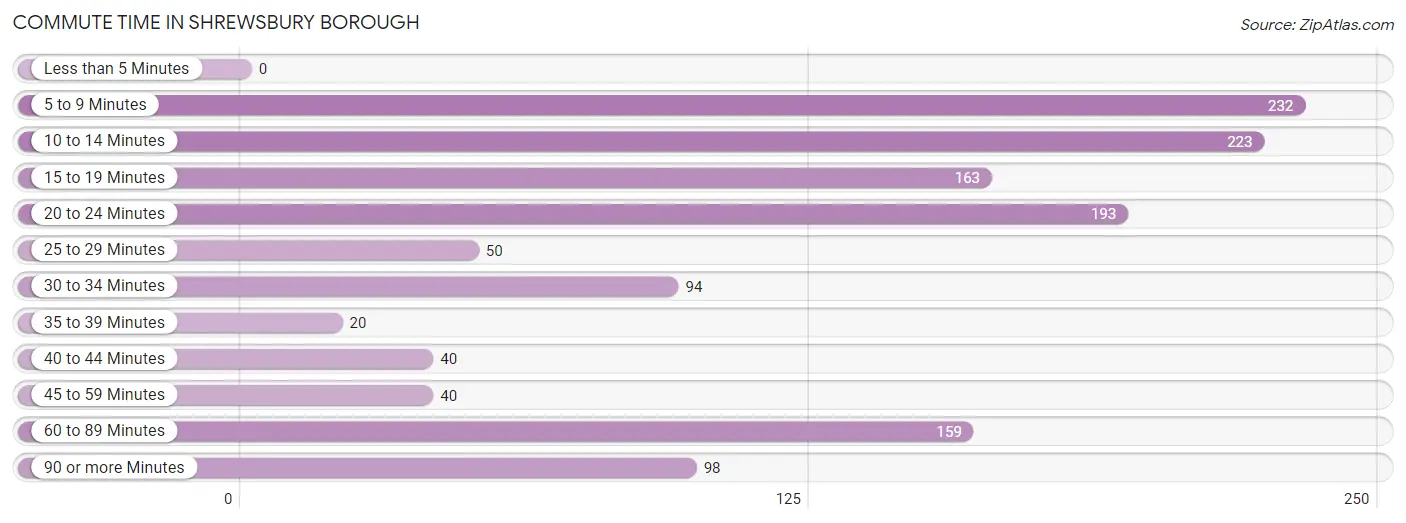
| Commute Time | # Commuters | % Commuters |
| Less than 5 Minutes | 0 | 0.0% |
| 5 to 9 Minutes | 232 | 17.7% |
| 10 to 14 Minutes | 223 | 17.0% |
| 15 to 19 Minutes | 163 | 12.4% |
| 20 to 24 Minutes | 193 | 14.7% |
| 25 to 29 Minutes | 50 | 3.8% |
| 30 to 34 Minutes | 94 | 7.2% |
| 35 to 39 Minutes | 20 | 1.5% |
| 40 to 44 Minutes | 40 | 3.0% |
| 45 to 59 Minutes | 40 | 3.0% |
| 60 to 89 Minutes | 159 | 12.1% |
| 90 or more Minutes | 98 | 7.5% |
Commute Time by Sex in Shrewsbury borough
The most common commute times in Shrewsbury borough are 60 to 89 minutes (139 commuters, 19.8%) for males and 10 to 14 minutes (162 commuters, 26.6%) for females.
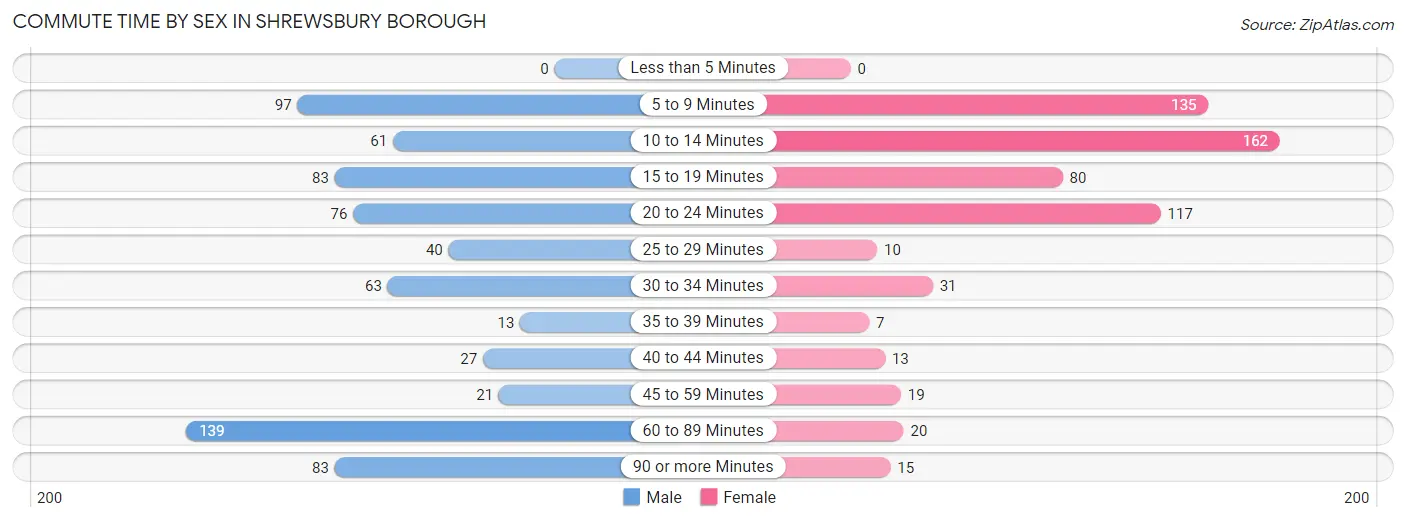
| Commute Time | Male | Female |
| Less than 5 Minutes | 0 (0.0%) | 0 (0.0%) |
| 5 to 9 Minutes | 97 (13.8%) | 135 (22.2%) |
| 10 to 14 Minutes | 61 (8.7%) | 162 (26.6%) |
| 15 to 19 Minutes | 83 (11.8%) | 80 (13.1%) |
| 20 to 24 Minutes | 76 (10.8%) | 117 (19.2%) |
| 25 to 29 Minutes | 40 (5.7%) | 10 (1.6%) |
| 30 to 34 Minutes | 63 (9.0%) | 31 (5.1%) |
| 35 to 39 Minutes | 13 (1.8%) | 7 (1.1%) |
| 40 to 44 Minutes | 27 (3.8%) | 13 (2.1%) |
| 45 to 59 Minutes | 21 (3.0%) | 19 (3.1%) |
| 60 to 89 Minutes | 139 (19.8%) | 20 (3.3%) |
| 90 or more Minutes | 83 (11.8%) | 15 (2.5%) |
Time of Departure to Work by Sex in Shrewsbury borough
The most frequent times of departure to work in Shrewsbury borough are 8:00 AM to 8:29 AM (176, 25.0%) for males and 8:00 AM to 8:29 AM (189, 31.0%) for females.
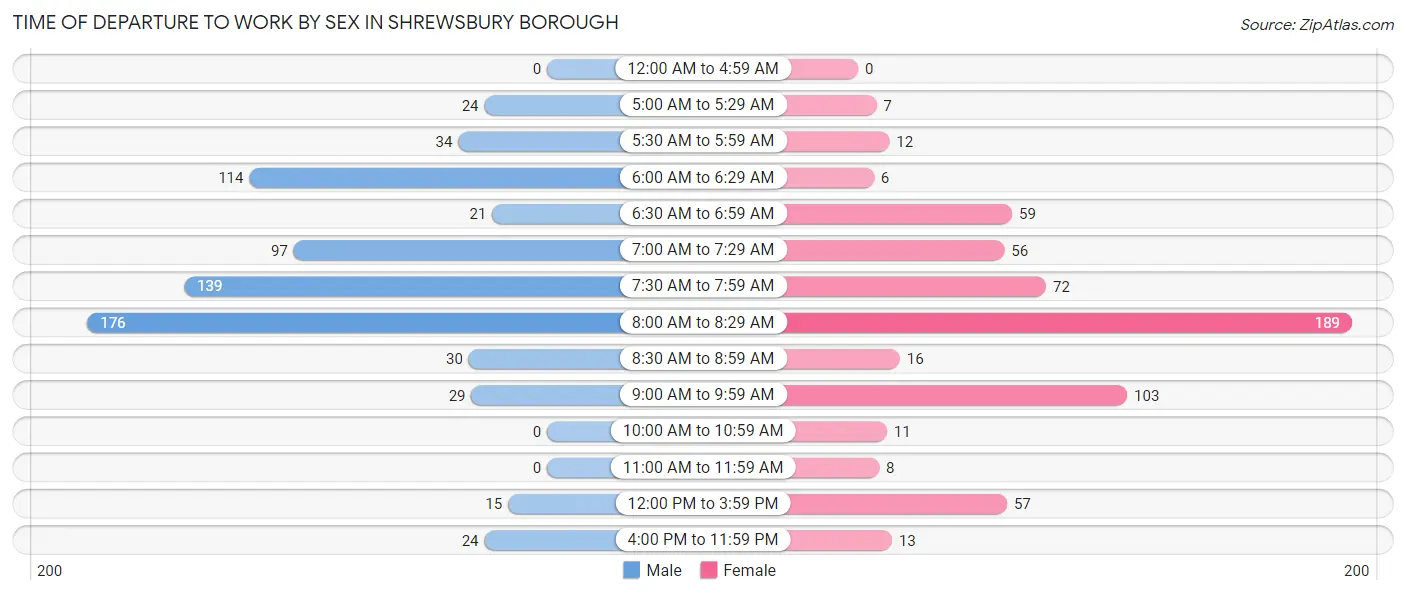
| Time of Departure | Male | Female |
| 12:00 AM to 4:59 AM | 0 (0.0%) | 0 (0.0%) |
| 5:00 AM to 5:29 AM | 24 (3.4%) | 7 (1.1%) |
| 5:30 AM to 5:59 AM | 34 (4.8%) | 12 (2.0%) |
| 6:00 AM to 6:29 AM | 114 (16.2%) | 6 (1.0%) |
| 6:30 AM to 6:59 AM | 21 (3.0%) | 59 (9.7%) |
| 7:00 AM to 7:29 AM | 97 (13.8%) | 56 (9.2%) |
| 7:30 AM to 7:59 AM | 139 (19.8%) | 72 (11.8%) |
| 8:00 AM to 8:29 AM | 176 (25.0%) | 189 (31.0%) |
| 8:30 AM to 8:59 AM | 30 (4.3%) | 16 (2.6%) |
| 9:00 AM to 9:59 AM | 29 (4.1%) | 103 (16.9%) |
| 10:00 AM to 10:59 AM | 0 (0.0%) | 11 (1.8%) |
| 11:00 AM to 11:59 AM | 0 (0.0%) | 8 (1.3%) |
| 12:00 PM to 3:59 PM | 15 (2.1%) | 57 (9.4%) |
| 4:00 PM to 11:59 PM | 24 (3.4%) | 13 (2.1%) |
| Total | 703 (100.0%) | 609 (100.0%) |
Housing Occupancy in Shrewsbury borough
Occupancy by Ownership in Shrewsbury borough
Of the total 1,388 dwellings in Shrewsbury borough, owner-occupied units account for 1,201 (86.5%), while renter-occupied units make up 187 (13.5%).
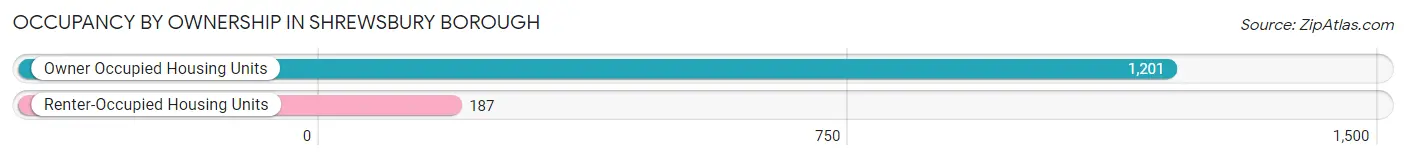
| Occupancy | # Housing Units | % Housing Units |
| Owner Occupied Housing Units | 1,201 | 86.5% |
| Renter-Occupied Housing Units | 187 | 13.5% |
| Total Occupied Housing Units | 1,388 | 100.0% |
Occupancy by Household Size in Shrewsbury borough
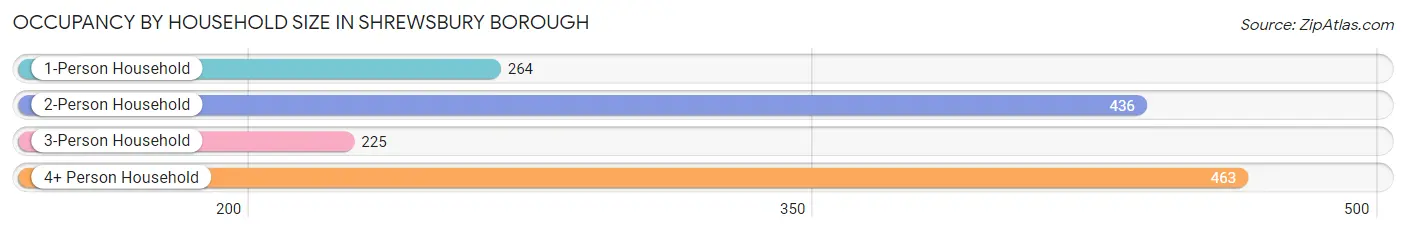
| Household Size | # Housing Units | % Housing Units |
| 1-Person Household | 264 | 19.0% |
| 2-Person Household | 436 | 31.4% |
| 3-Person Household | 225 | 16.2% |
| 4+ Person Household | 463 | 33.4% |
| Total Housing Units | 1,388 | 100.0% |
Occupancy by Ownership by Household Size in Shrewsbury borough
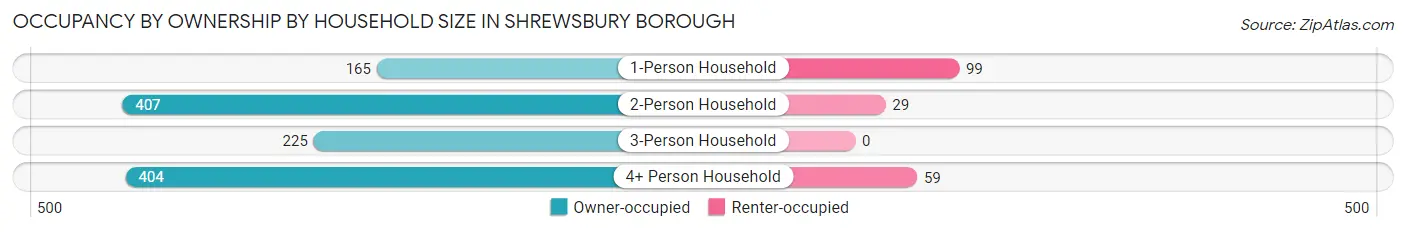
| Household Size | Owner-occupied | Renter-occupied |
| 1-Person Household | 165 (62.5%) | 99 (37.5%) |
| 2-Person Household | 407 (93.3%) | 29 (6.7%) |
| 3-Person Household | 225 (100.0%) | 0 (0.0%) |
| 4+ Person Household | 404 (87.3%) | 59 (12.7%) |
| Total Housing Units | 1,201 (86.5%) | 187 (13.5%) |
Occupancy by Educational Attainment in Shrewsbury borough
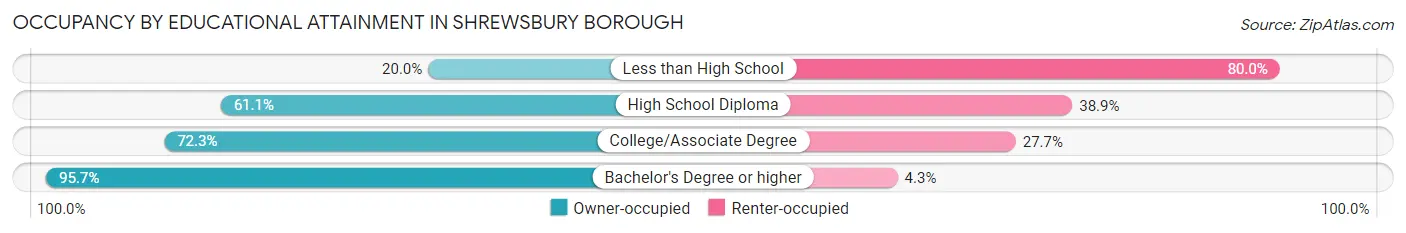
| Household Size | Owner-occupied | Renter-occupied |
| Less than High School | 8 (20.0%) | 32 (80.0%) |
| High School Diploma | 99 (61.1%) | 63 (38.9%) |
| College/Associate Degree | 128 (72.3%) | 49 (27.7%) |
| Bachelor's Degree or higher | 966 (95.7%) | 43 (4.3%) |
Occupancy by Age of Householder in Shrewsbury borough
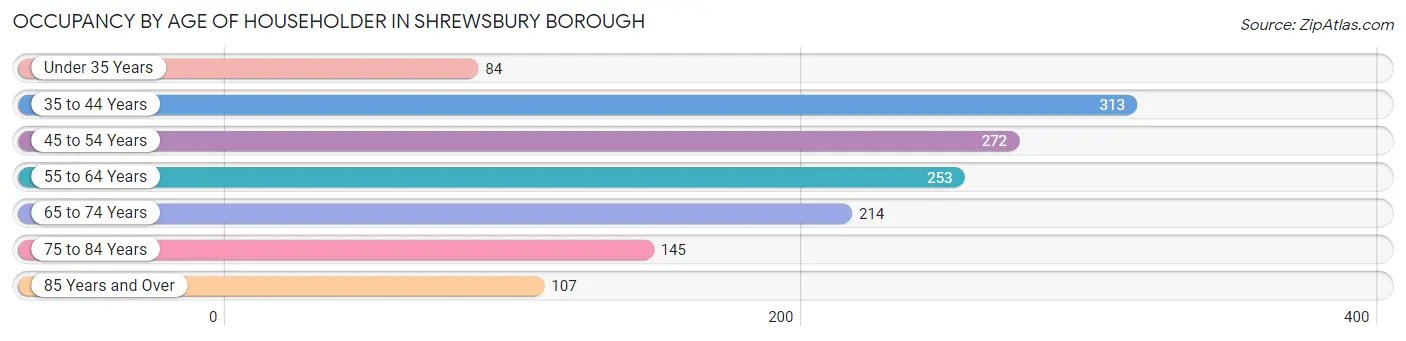
| Age Bracket | # Households | % Households |
| Under 35 Years | 84 | 6.0% |
| 35 to 44 Years | 313 | 22.6% |
| 45 to 54 Years | 272 | 19.6% |
| 55 to 64 Years | 253 | 18.2% |
| 65 to 74 Years | 214 | 15.4% |
| 75 to 84 Years | 145 | 10.4% |
| 85 Years and Over | 107 | 7.7% |
| Total | 1,388 | 100.0% |
Housing Finances in Shrewsbury borough
Median Income by Occupancy in Shrewsbury borough
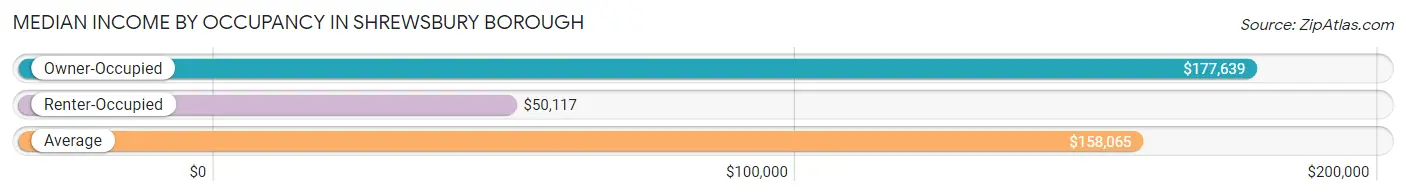
| Occupancy Type | # Households | Median Income |
| Owner-Occupied | 1,201 (86.5%) | $177,639 |
| Renter-Occupied | 187 (13.5%) | $50,117 |
| Average | 1,388 (100.0%) | $158,065 |
Occupancy by Householder Income Bracket in Shrewsbury borough
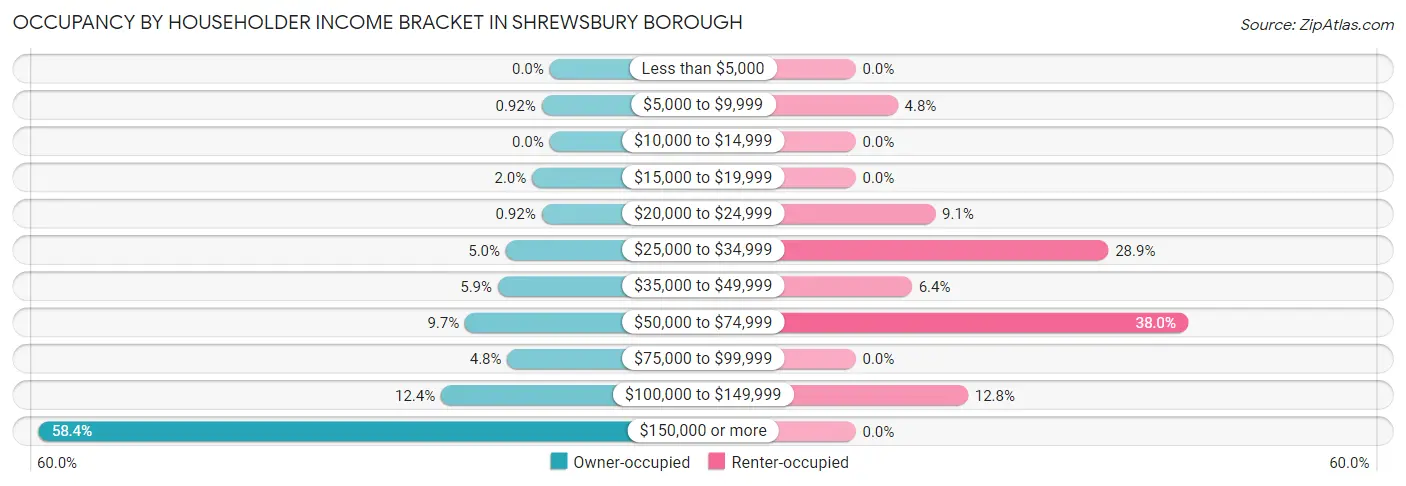
| Income Bracket | Owner-occupied | Renter-occupied |
| Less than $5,000 | 0 (0.0%) | 0 (0.0%) |
| $5,000 to $9,999 | 11 (0.9%) | 9 (4.8%) |
| $10,000 to $14,999 | 0 (0.0%) | 0 (0.0%) |
| $15,000 to $19,999 | 24 (2.0%) | 0 (0.0%) |
| $20,000 to $24,999 | 11 (0.9%) | 17 (9.1%) |
| $25,000 to $34,999 | 60 (5.0%) | 54 (28.9%) |
| $35,000 to $49,999 | 71 (5.9%) | 12 (6.4%) |
| $50,000 to $74,999 | 116 (9.7%) | 71 (38.0%) |
| $75,000 to $99,999 | 58 (4.8%) | 0 (0.0%) |
| $100,000 to $149,999 | 149 (12.4%) | 24 (12.8%) |
| $150,000 or more | 701 (58.4%) | 0 (0.0%) |
| Total | 1,201 (100.0%) | 187 (100.0%) |
Monthly Housing Cost Tiers in Shrewsbury borough
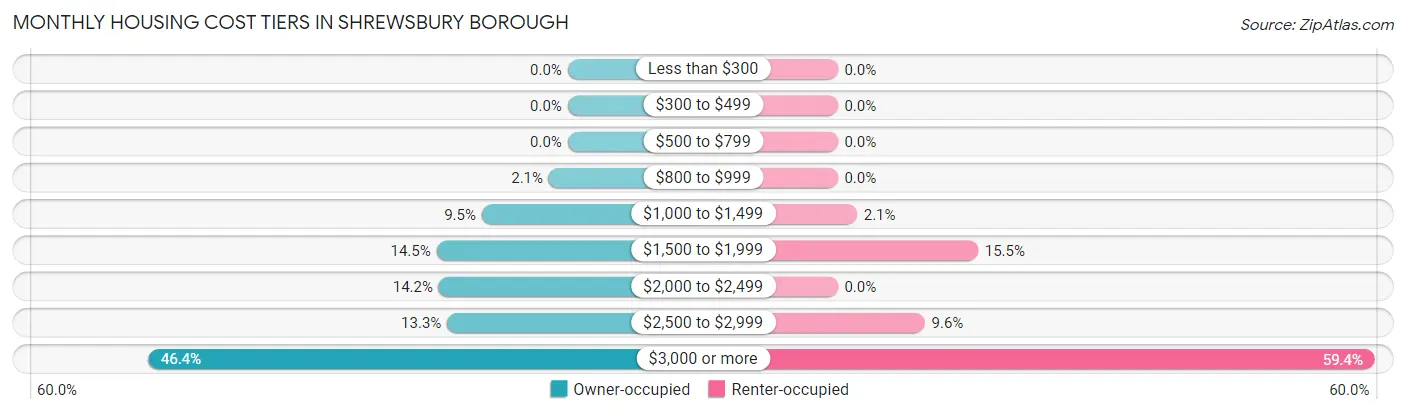
| Monthly Cost | Owner-occupied | Renter-occupied |
| Less than $300 | 0 (0.0%) | 0 (0.0%) |
| $300 to $499 | 0 (0.0%) | 0 (0.0%) |
| $500 to $799 | 0 (0.0%) | 0 (0.0%) |
| $800 to $999 | 25 (2.1%) | 0 (0.0%) |
| $1,000 to $1,499 | 114 (9.5%) | 4 (2.1%) |
| $1,500 to $1,999 | 174 (14.5%) | 29 (15.5%) |
| $2,000 to $2,499 | 171 (14.2%) | 0 (0.0%) |
| $2,500 to $2,999 | 160 (13.3%) | 18 (9.6%) |
| $3,000 or more | 557 (46.4%) | 111 (59.4%) |
| Total | 1,201 (100.0%) | 187 (100.0%) |
Physical Housing Characteristics in Shrewsbury borough
Housing Structures in Shrewsbury borough
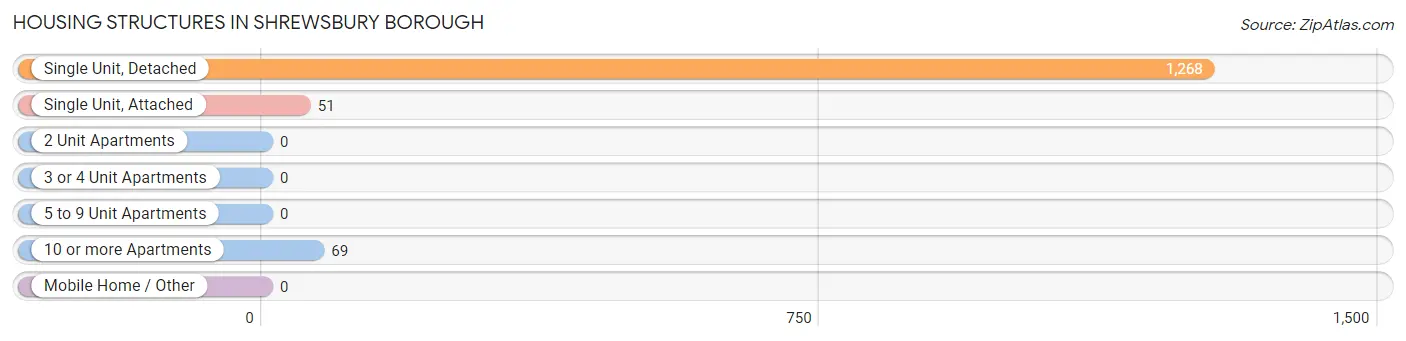
| Structure Type | # Housing Units | % Housing Units |
| Single Unit, Detached | 1,268 | 91.3% |
| Single Unit, Attached | 51 | 3.7% |
| 2 Unit Apartments | 0 | 0.0% |
| 3 or 4 Unit Apartments | 0 | 0.0% |
| 5 to 9 Unit Apartments | 0 | 0.0% |
| 10 or more Apartments | 69 | 5.0% |
| Mobile Home / Other | 0 | 0.0% |
| Total | 1,388 | 100.0% |
Housing Structures by Occupancy in Shrewsbury borough
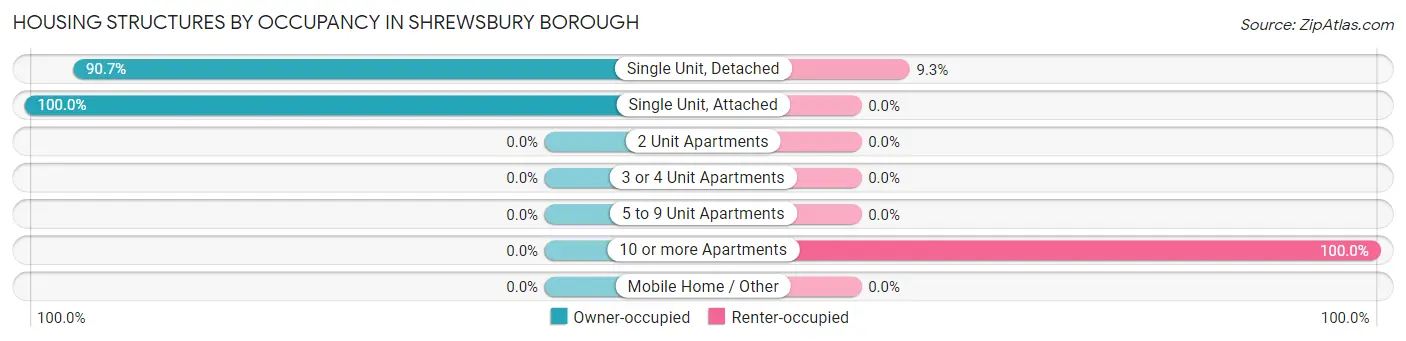
| Structure Type | Owner-occupied | Renter-occupied |
| Single Unit, Detached | 1,150 (90.7%) | 118 (9.3%) |
| Single Unit, Attached | 51 (100.0%) | 0 (0.0%) |
| 2 Unit Apartments | 0 (0.0%) | 0 (0.0%) |
| 3 or 4 Unit Apartments | 0 (0.0%) | 0 (0.0%) |
| 5 to 9 Unit Apartments | 0 (0.0%) | 0 (0.0%) |
| 10 or more Apartments | 0 (0.0%) | 69 (100.0%) |
| Mobile Home / Other | 0 (0.0%) | 0 (0.0%) |
| Total | 1,201 (86.5%) | 187 (13.5%) |
Housing Structures by Number of Rooms in Shrewsbury borough
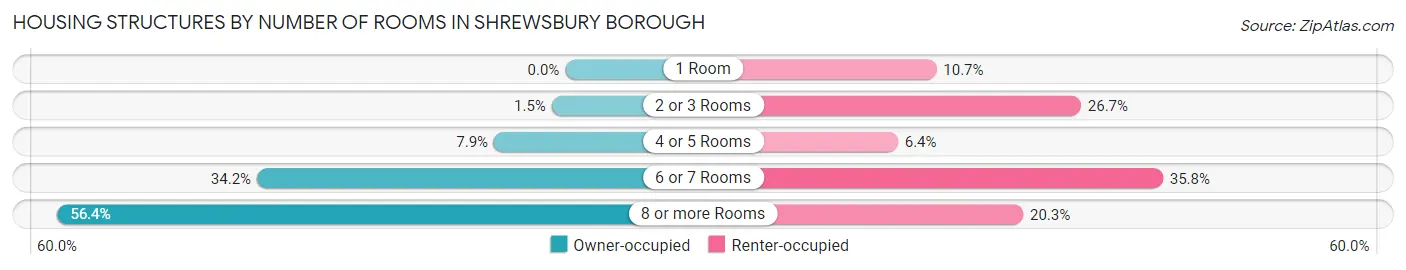
| Number of Rooms | Owner-occupied | Renter-occupied |
| 1 Room | 0 (0.0%) | 20 (10.7%) |
| 2 or 3 Rooms | 18 (1.5%) | 50 (26.7%) |
| 4 or 5 Rooms | 95 (7.9%) | 12 (6.4%) |
| 6 or 7 Rooms | 411 (34.2%) | 67 (35.8%) |
| 8 or more Rooms | 677 (56.4%) | 38 (20.3%) |
| Total | 1,201 (100.0%) | 187 (100.0%) |
Housing Structure by Heating Type in Shrewsbury borough
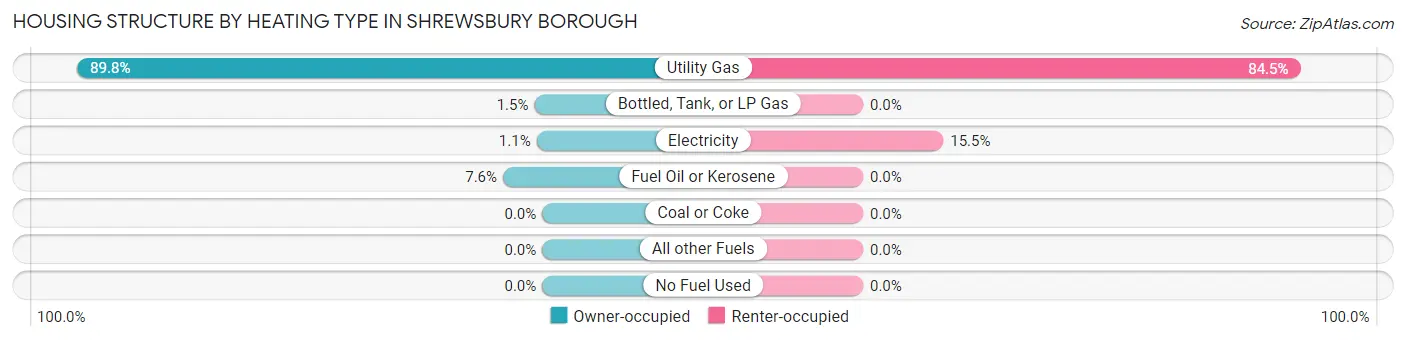
| Heating Type | Owner-occupied | Renter-occupied |
| Utility Gas | 1,079 (89.8%) | 158 (84.5%) |
| Bottled, Tank, or LP Gas | 18 (1.5%) | 0 (0.0%) |
| Electricity | 13 (1.1%) | 29 (15.5%) |
| Fuel Oil or Kerosene | 91 (7.6%) | 0 (0.0%) |
| Coal or Coke | 0 (0.0%) | 0 (0.0%) |
| All other Fuels | 0 (0.0%) | 0 (0.0%) |
| No Fuel Used | 0 (0.0%) | 0 (0.0%) |
| Total | 1,201 (100.0%) | 187 (100.0%) |
Household Vehicle Usage in Shrewsbury borough
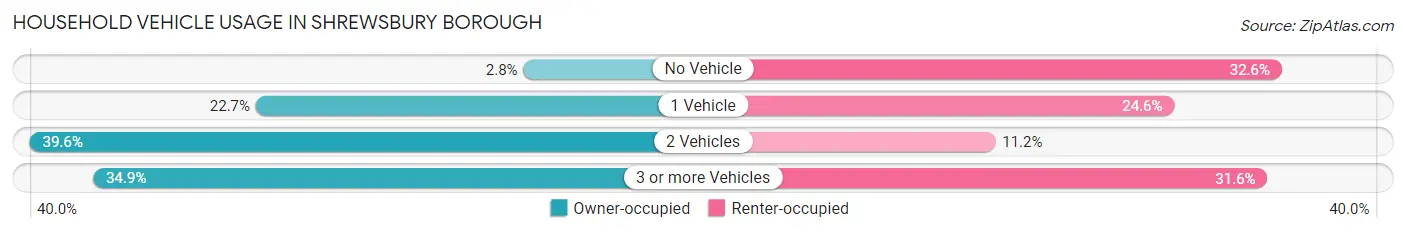
| Vehicles per Household | Owner-occupied | Renter-occupied |
| No Vehicle | 33 (2.8%) | 61 (32.6%) |
| 1 Vehicle | 273 (22.7%) | 46 (24.6%) |
| 2 Vehicles | 476 (39.6%) | 21 (11.2%) |
| 3 or more Vehicles | 419 (34.9%) | 59 (31.6%) |
| Total | 1,201 (100.0%) | 187 (100.0%) |
Real Estate & Mortgages in Shrewsbury borough
Real Estate and Mortgage Overview in Shrewsbury borough
| Characteristic | Without Mortgage | With Mortgage |
| Housing Units | 408 | 793 |
| Median Property Value | $708,300 | $694,800 |
| Median Household Income | $86,250 | $572 |
| Monthly Housing Costs | $1,501 | $557 |
| Real Estate Taxes | $10,001 | $10 |
Property Value by Mortgage Status in Shrewsbury borough
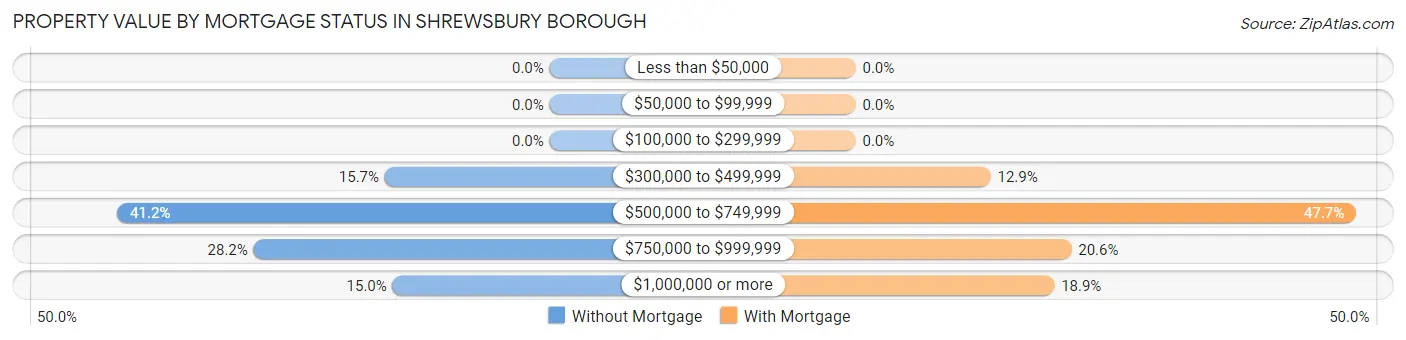
| Property Value | Without Mortgage | With Mortgage |
| Less than $50,000 | 0 (0.0%) | 0 (0.0%) |
| $50,000 to $99,999 | 0 (0.0%) | 0 (0.0%) |
| $100,000 to $299,999 | 0 (0.0%) | 0 (0.0%) |
| $300,000 to $499,999 | 64 (15.7%) | 102 (12.9%) |
| $500,000 to $749,999 | 168 (41.2%) | 378 (47.7%) |
| $750,000 to $999,999 | 115 (28.2%) | 163 (20.5%) |
| $1,000,000 or more | 61 (14.9%) | 150 (18.9%) |
| Total | 408 (100.0%) | 793 (100.0%) |
Household Income by Mortgage Status in Shrewsbury borough
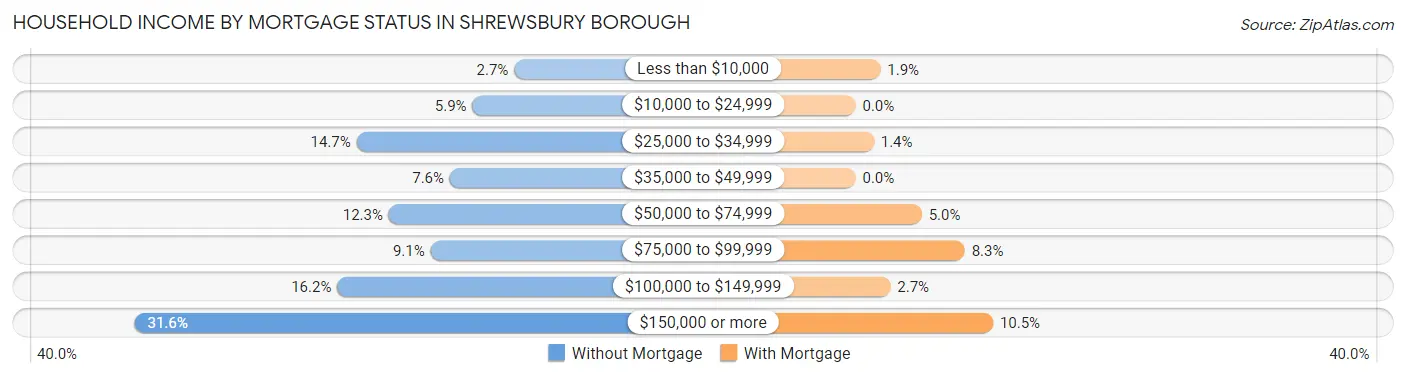
| Household Income | Without Mortgage | With Mortgage |
| Less than $10,000 | 11 (2.7%) | 15 (1.9%) |
| $10,000 to $24,999 | 24 (5.9%) | 0 (0.0%) |
| $25,000 to $34,999 | 60 (14.7%) | 11 (1.4%) |
| $35,000 to $49,999 | 31 (7.6%) | 0 (0.0%) |
| $50,000 to $74,999 | 50 (12.2%) | 40 (5.0%) |
| $75,000 to $99,999 | 37 (9.1%) | 66 (8.3%) |
| $100,000 to $149,999 | 66 (16.2%) | 21 (2.6%) |
| $150,000 or more | 129 (31.6%) | 83 (10.5%) |
| Total | 408 (100.0%) | 793 (100.0%) |
Property Value to Household Income Ratio in Shrewsbury borough
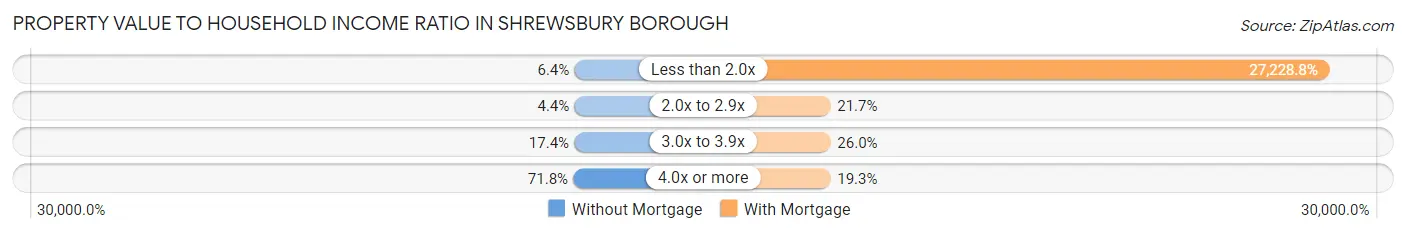
| Value-to-Income Ratio | Without Mortgage | With Mortgage |
| Less than 2.0x | 26 (6.4%) | 215,924 (27,228.8%) |
| 2.0x to 2.9x | 18 (4.4%) | 172 (21.7%) |
| 3.0x to 3.9x | 71 (17.4%) | 206 (26.0%) |
| 4.0x or more | 293 (71.8%) | 153 (19.3%) |
| Total | 408 (100.0%) | 793 (100.0%) |
Real Estate Taxes by Mortgage Status in Shrewsbury borough
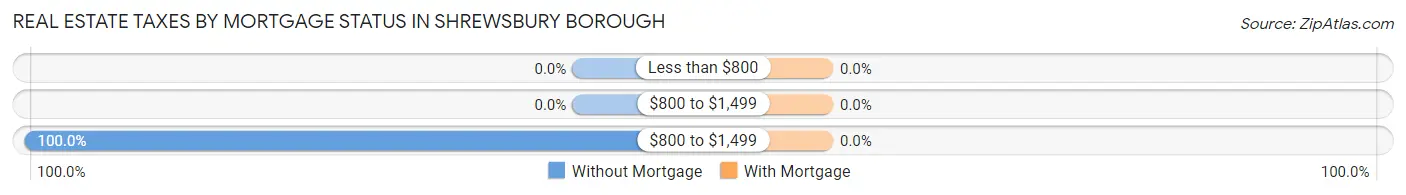
| Property Taxes | Without Mortgage | With Mortgage |
| Less than $800 | 0 (0.0%) | 0 (0.0%) |
| $800 to $1,499 | 0 (0.0%) | 0 (0.0%) |
| $800 to $1,499 | 408 (100.0%) | 0 (0.0%) |
| Total | 408 (100.0%) | 793 (100.0%) |
Health & Disability in Shrewsbury borough
Health Insurance Coverage by Age in Shrewsbury borough
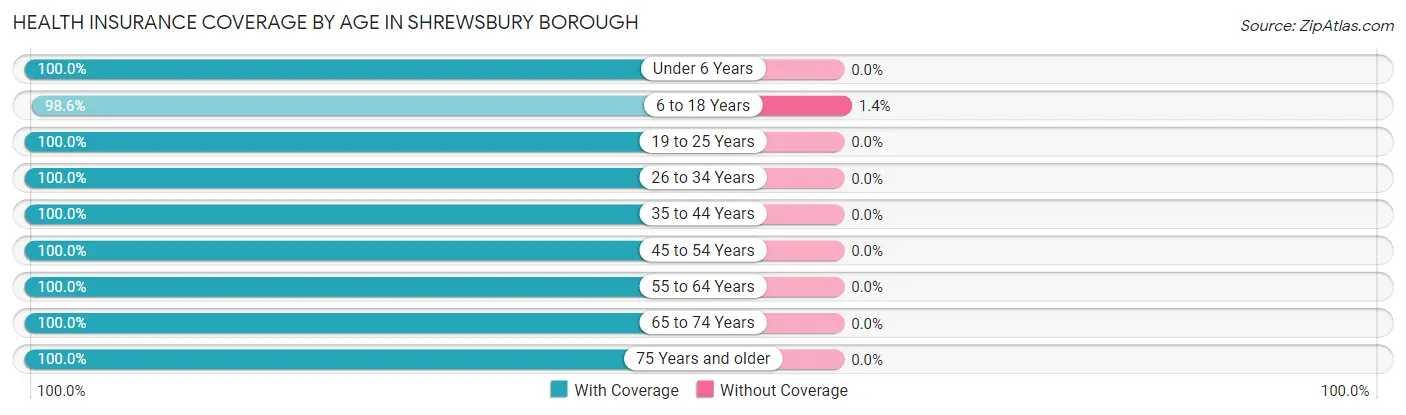
| Age Bracket | With Coverage | Without Coverage |
| Under 6 Years | 450 (100.0%) | 0 (0.0%) |
| 6 to 18 Years | 769 (98.6%) | 11 (1.4%) |
| 19 to 25 Years | 230 (100.0%) | 0 (0.0%) |
| 26 to 34 Years | 305 (100.0%) | 0 (0.0%) |
| 35 to 44 Years | 555 (100.0%) | 0 (0.0%) |
| 45 to 54 Years | 501 (100.0%) | 0 (0.0%) |
| 55 to 64 Years | 414 (100.0%) | 0 (0.0%) |
| 65 to 74 Years | 382 (100.0%) | 0 (0.0%) |
| 75 Years and older | 389 (100.0%) | 0 (0.0%) |
| Total | 3,995 (99.7%) | 11 (0.3%) |
Health Insurance Coverage by Citizenship Status in Shrewsbury borough
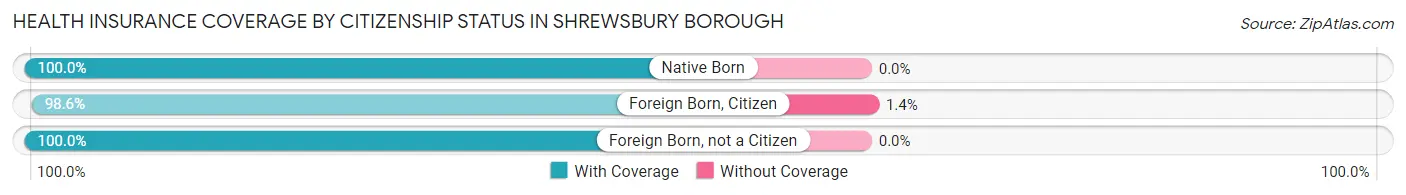
| Citizenship Status | With Coverage | Without Coverage |
| Native Born | 450 (100.0%) | 0 (0.0%) |
| Foreign Born, Citizen | 769 (98.6%) | 11 (1.4%) |
| Foreign Born, not a Citizen | 230 (100.0%) | 0 (0.0%) |
Health Insurance Coverage by Household Income in Shrewsbury borough
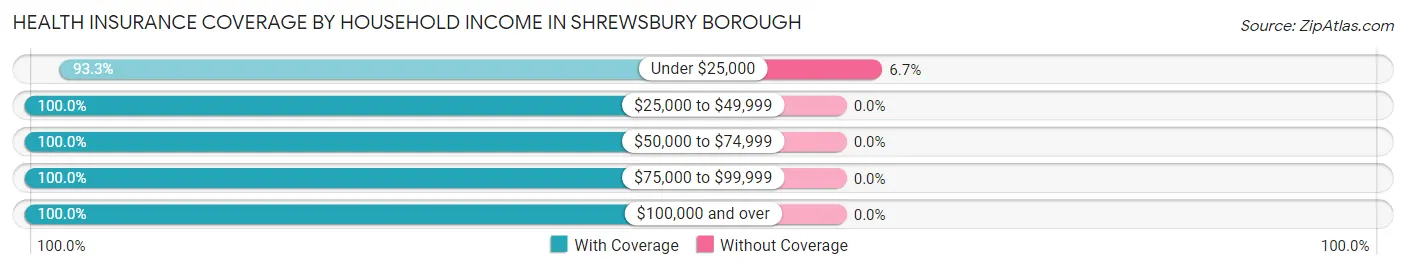
| Household Income | With Coverage | Without Coverage |
| Under $25,000 | 154 (93.3%) | 11 (6.7%) |
| $25,000 to $49,999 | 336 (100.0%) | 0 (0.0%) |
| $50,000 to $74,999 | 463 (100.0%) | 0 (0.0%) |
| $75,000 to $99,999 | 153 (100.0%) | 0 (0.0%) |
| $100,000 and over | 2,872 (100.0%) | 0 (0.0%) |
Public vs Private Health Insurance Coverage by Age in Shrewsbury borough
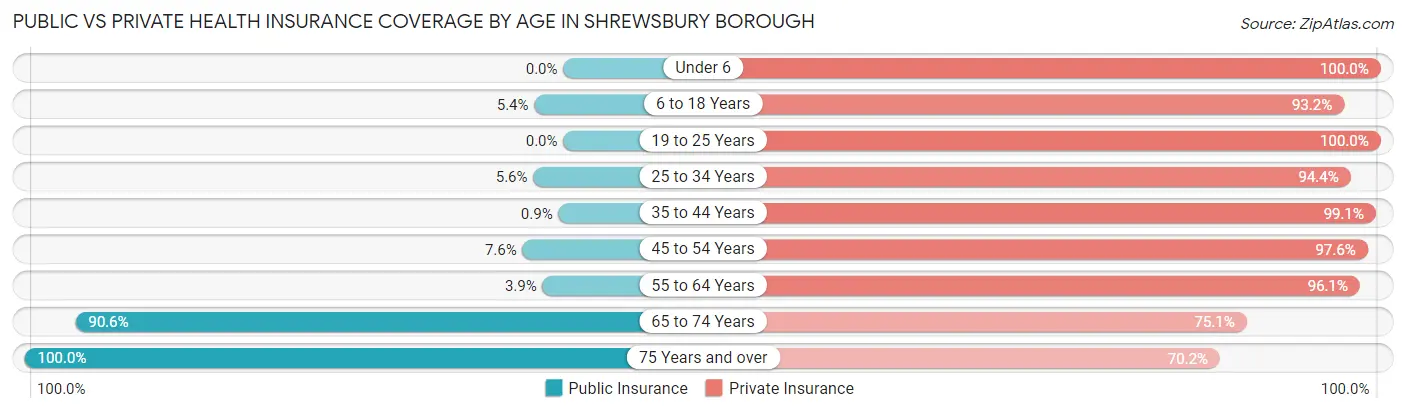
| Age Bracket | Public Insurance | Private Insurance |
| Under 6 | 0 (0.0%) | 450 (100.0%) |
| 6 to 18 Years | 42 (5.4%) | 727 (93.2%) |
| 19 to 25 Years | 0 (0.0%) | 230 (100.0%) |
| 25 to 34 Years | 17 (5.6%) | 288 (94.4%) |
| 35 to 44 Years | 5 (0.9%) | 550 (99.1%) |
| 45 to 54 Years | 38 (7.6%) | 489 (97.6%) |
| 55 to 64 Years | 16 (3.9%) | 398 (96.1%) |
| 65 to 74 Years | 346 (90.6%) | 287 (75.1%) |
| 75 Years and over | 389 (100.0%) | 273 (70.2%) |
| Total | 853 (21.3%) | 3,692 (92.2%) |
Disability Status by Sex by Age in Shrewsbury borough
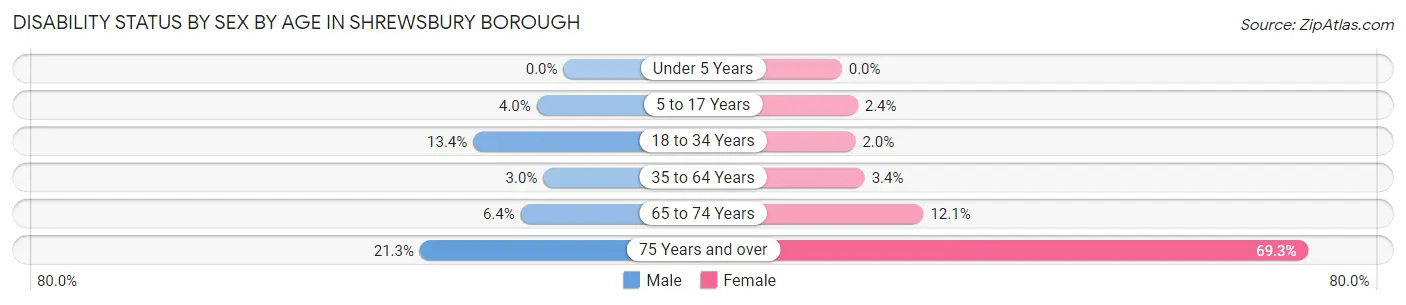
| Age Bracket | Male | Female |
| Under 5 Years | 0 (0.0%) | 0 (0.0%) |
| 5 to 17 Years | 12 (4.0%) | 11 (2.4%) |
| 18 to 34 Years | 39 (13.4%) | 6 (2.0%) |
| 35 to 64 Years | 22 (3.0%) | 25 (3.4%) |
| 65 to 74 Years | 7 (6.4%) | 33 (12.1%) |
| 75 Years and over | 42 (21.3%) | 133 (69.3%) |
Disability Class by Sex by Age in Shrewsbury borough
Disability Class: Hearing Difficulty
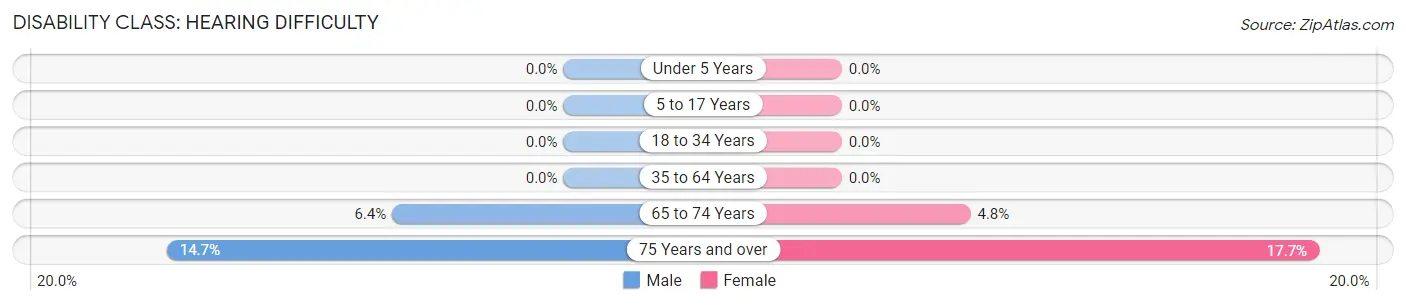
| Age Bracket | Male | Female |
| Under 5 Years | 0 (0.0%) | 0 (0.0%) |
| 5 to 17 Years | 0 (0.0%) | 0 (0.0%) |
| 18 to 34 Years | 0 (0.0%) | 0 (0.0%) |
| 35 to 64 Years | 0 (0.0%) | 0 (0.0%) |
| 65 to 74 Years | 7 (6.4%) | 13 (4.8%) |
| 75 Years and over | 29 (14.7%) | 34 (17.7%) |
Disability Class: Vision Difficulty
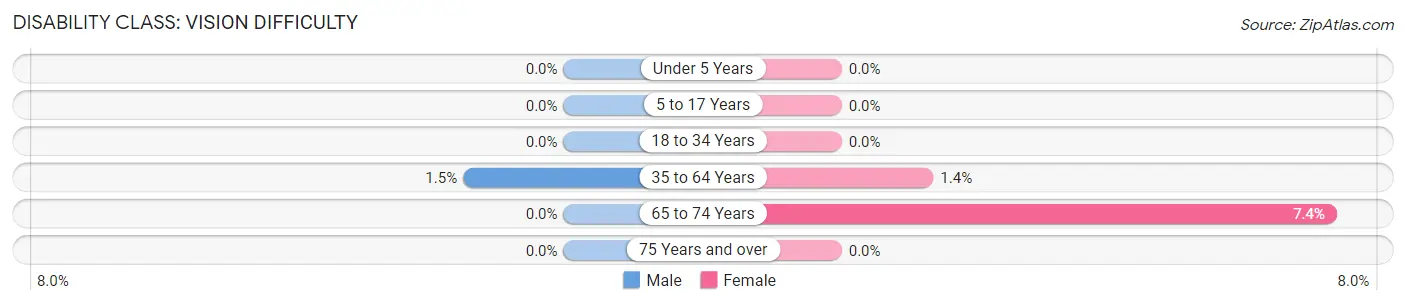
| Age Bracket | Male | Female |
| Under 5 Years | 0 (0.0%) | 0 (0.0%) |
| 5 to 17 Years | 0 (0.0%) | 0 (0.0%) |
| 18 to 34 Years | 0 (0.0%) | 0 (0.0%) |
| 35 to 64 Years | 11 (1.5%) | 10 (1.4%) |
| 65 to 74 Years | 0 (0.0%) | 20 (7.3%) |
| 75 Years and over | 0 (0.0%) | 0 (0.0%) |
Disability Class: Cognitive Difficulty
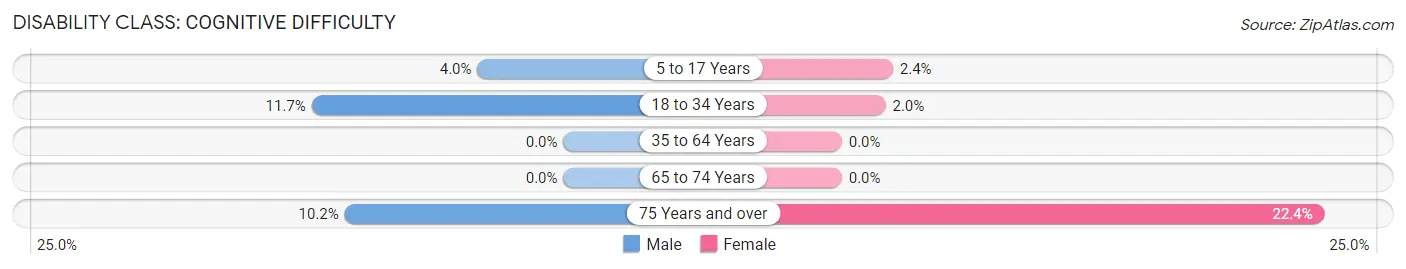
| Age Bracket | Male | Female |
| 5 to 17 Years | 12 (4.0%) | 11 (2.4%) |
| 18 to 34 Years | 34 (11.7%) | 6 (2.0%) |
| 35 to 64 Years | 0 (0.0%) | 0 (0.0%) |
| 65 to 74 Years | 0 (0.0%) | 0 (0.0%) |
| 75 Years and over | 20 (10.2%) | 43 (22.4%) |
Disability Class: Ambulatory Difficulty
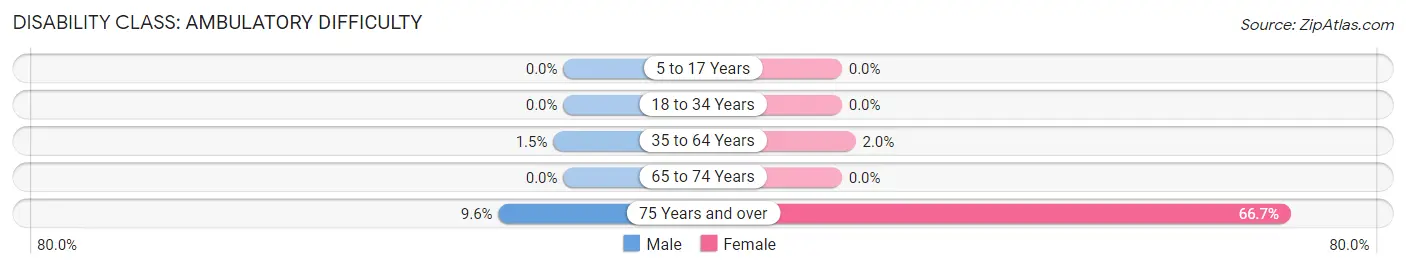
| Age Bracket | Male | Female |
| 5 to 17 Years | 0 (0.0%) | 0 (0.0%) |
| 18 to 34 Years | 0 (0.0%) | 0 (0.0%) |
| 35 to 64 Years | 11 (1.5%) | 15 (2.0%) |
| 65 to 74 Years | 0 (0.0%) | 0 (0.0%) |
| 75 Years and over | 19 (9.6%) | 128 (66.7%) |
Disability Class: Self-Care Difficulty
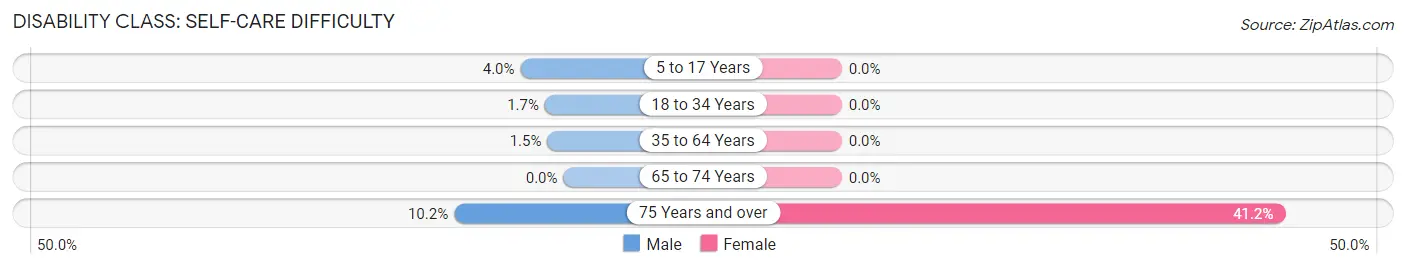
| Age Bracket | Male | Female |
| 5 to 17 Years | 12 (4.0%) | 0 (0.0%) |
| 18 to 34 Years | 5 (1.7%) | 0 (0.0%) |
| 35 to 64 Years | 11 (1.5%) | 0 (0.0%) |
| 65 to 74 Years | 0 (0.0%) | 0 (0.0%) |
| 75 Years and over | 20 (10.2%) | 79 (41.1%) |
Technology Access in Shrewsbury borough
Computing Device Access in Shrewsbury borough
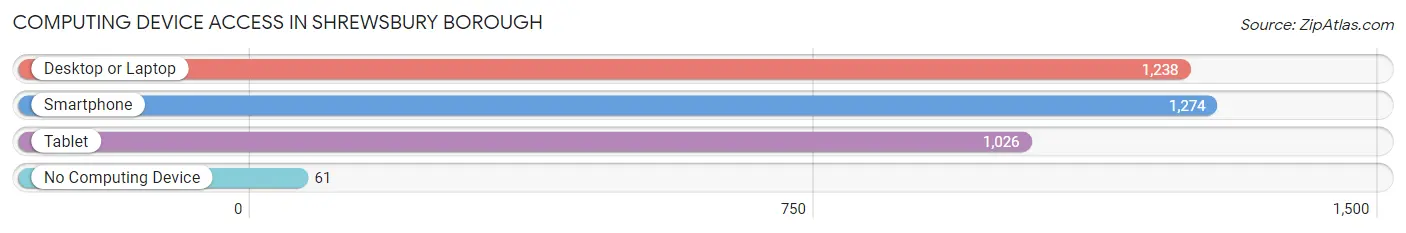
| Device Type | # Households | % Households |
| Desktop or Laptop | 1,238 | 89.2% |
| Smartphone | 1,274 | 91.8% |
| Tablet | 1,026 | 73.9% |
| No Computing Device | 61 | 4.4% |
| Total | 1,388 | 100.0% |
Internet Access in Shrewsbury borough
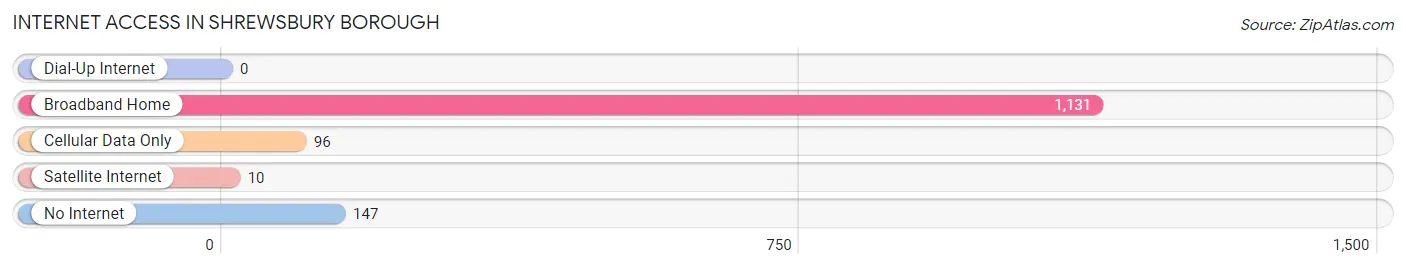
| Internet Type | # Households | % Households |
| Dial-Up Internet | 0 | 0.0% |
| Broadband Home | 1,131 | 81.5% |
| Cellular Data Only | 96 | 6.9% |
| Satellite Internet | 10 | 0.7% |
| No Internet | 147 | 10.6% |
| Total | 1,388 | 100.0% |
Shrewsbury borough Summary
Shrewsbury Borough is a small borough located in Monmouth County, New Jersey. It is situated on the Navesink River, and is part of the larger New York metropolitan area. The borough has a population of approximately 5,000 people, and is home to a variety of businesses, including a number of small shops and restaurants.
History
Shrewsbury Borough was originally part of Shrewsbury Township, which was established in 1693. The area was originally inhabited by the Lenape Native Americans, and was later settled by Dutch and English colonists. The borough was officially incorporated in 1926, and was named after the town of Shrewsbury in England.
Geography
Shrewsbury Borough is located in Monmouth County, New Jersey. It is situated on the Navesink River, and is part of the larger New York metropolitan area. The borough has a total area of 1.3 square miles, all of which is land. The borough is bordered by Shrewsbury Township to the north, Red Bank to the east, and Middletown Township to the south and west.
Economy
Shrewsbury Borough has a diverse economy, with a variety of businesses located in the area. The borough is home to a number of small shops and restaurants, as well as a few larger businesses. The borough also has a number of professional services, such as law firms, accounting firms, and medical offices. The borough is also home to a number of financial institutions, including banks and credit unions.
Demographics
As of the 2010 census, Shrewsbury Borough had a population of 5,077 people. The racial makeup of the borough was 87.3% White, 5.2% African American, 0.3% Native American, 3.2% Asian, and 3.9% from other races. Hispanic or Latino of any race were 8.2% of the population.
The median household income in Shrewsbury Borough was $76,944, and the median family income was $90,917. The per capita income for the borough was $37,945. About 4.2% of families and 5.7% of the population were below the poverty line, including 6.3% of those under age 18 and 4.2% of those age 65 or over.
Conclusion
Shrewsbury Borough is a small borough located in Monmouth County, New Jersey. It is situated on the Navesink River, and is part of the larger New York metropolitan area. The borough has a population of approximately 5,000 people, and is home to a variety of businesses, including a number of small shops and restaurants. The borough has a diverse economy, with a variety of businesses located in the area. The racial makeup of the borough is predominantly White, with a small percentage of African American, Native American, Asian, and other races. The median household income in Shrewsbury Borough is $76,944, and the median family income is $90,917.
Common Questions
What is Per Capita Income in Shrewsbury borough?
Per Capita income in Shrewsbury borough is $67,892.
What is the Median Family Income in Shrewsbury borough?
Median Family Income in Shrewsbury borough is $182,222.
What is the Median Household income in Shrewsbury borough?
Median Household Income in Shrewsbury borough is $158,065.
What is Income or Wage Gap in Shrewsbury borough?
Income or Wage Gap in Shrewsbury borough is 72.7%.
Women in Shrewsbury borough earn 27.3 cents for every dollar earned by a man.
What is Inequality or Gini Index in Shrewsbury borough?
Inequality or Gini Index in Shrewsbury borough is 0.48.
What is the Total Population of Shrewsbury borough?
Total Population of Shrewsbury borough is 4,138.
What is the Total Male Population of Shrewsbury borough?
Total Male Population of Shrewsbury borough is 1,922.
What is the Total Female Population of Shrewsbury borough?
Total Female Population of Shrewsbury borough is 2,216.
What is the Ratio of Males per 100 Females in Shrewsbury borough?
There are 86.73 Males per 100 Females in Shrewsbury borough.
What is the Ratio of Females per 100 Males in Shrewsbury borough?
There are 115.30 Females per 100 Males in Shrewsbury borough.
What is the Median Population Age in Shrewsbury borough?
Median Population Age in Shrewsbury borough is 41.7 Years.
What is the Average Family Size in Shrewsbury borough
Average Family Size in Shrewsbury borough is 3.3 People.
What is the Average Household Size in Shrewsbury borough
Average Household Size in Shrewsbury borough is 2.9 People.
How Large is the Labor Force in Shrewsbury borough?
There are 1,840 People in the Labor Forcein in Shrewsbury borough.
What is the Percentage of People in the Labor Force in Shrewsbury borough?
58.7% of People are in the Labor Force in Shrewsbury borough.
What is the Unemployment Rate in Shrewsbury borough?
Unemployment Rate in Shrewsbury borough is 4.0%.