Mystic Island, NJ Map & Demographics
Mystic Island Map
Mystic Island Overview
$38,091
PER CAPITA INCOME
$85,172
AVG FAMILY INCOME
$65,194
AVG HOUSEHOLD INCOME
44.7%
WAGE / INCOME GAP [ % ]
55.3¢/ $1
WAGE / INCOME GAP [ $ ]
0.42
INEQUALITY / GINI INDEX
7,635
TOTAL POPULATION
3,557
MALE POPULATION
4,078
FEMALE POPULATION
87.22
MALES / 100 FEMALES
114.65
FEMALES / 100 MALES
58.6
MEDIAN AGE
2.5
AVG FAMILY SIZE
2.1
AVG HOUSEHOLD SIZE
3,437
LABOR FORCE [ PEOPLE ]
50.8%
PERCENT IN LABOR FORCE
7.6%
UNEMPLOYMENT RATE
Income in Mystic Island
Income Overview in Mystic Island
Per Capita Income in Mystic Island is $38,091, while median incomes of families and households are $85,172 and $65,194 respectively.
| Characteristic | Number | Measure |
| Per Capita Income | 7,635 | $38,091 |
| Median Family Income | 2,176 | $85,172 |
| Mean Family Income | 2,176 | $90,193 |
| Median Household Income | 3,537 | $65,194 |
| Mean Household Income | 3,537 | $80,770 |
| Income Deficit | 2,176 | $0 |
| Wage / Income Gap (%) | 7,635 | 44.74% |
| Wage / Income Gap ($) | 7,635 | 55.26¢ per $1 |
| Gini / Inequality Index | 7,635 | 0.42 |
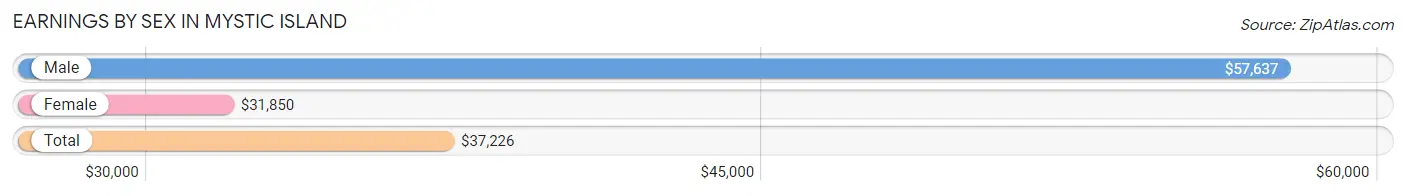
Earnings by Sex in Mystic Island
Average Earnings in Mystic Island are $37,226, $57,637 for men and $31,850 for women, a difference of 44.7%.
| Sex | Number | Average Earnings |
| Male | 1,949 (53.2%) | $57,637 |
| Female | 1,715 (46.8%) | $31,850 |
| Total | 3,664 (100.0%) | $37,226 |
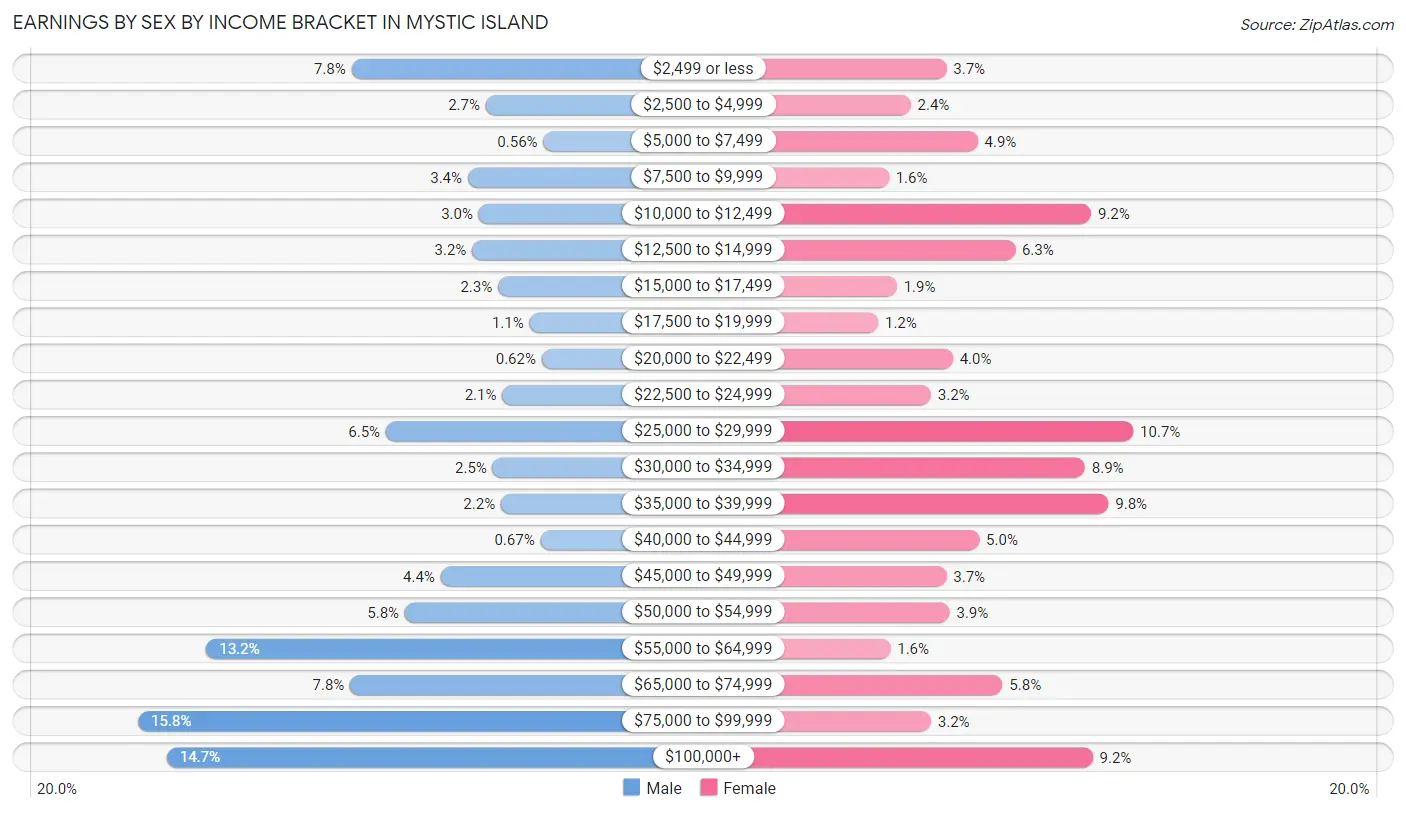
Earnings by Sex by Income Bracket in Mystic Island
The most common earnings brackets in Mystic Island are $75,000 to $99,999 for men (307 | 15.8%) and $25,000 to $29,999 for women (184 | 10.7%).
| Income | Male | Female |
| $2,499 or less | 151 (7.7%) | 64 (3.7%) |
| $2,500 to $4,999 | 53 (2.7%) | 41 (2.4%) |
| $5,000 to $7,499 | 11 (0.6%) | 84 (4.9%) |
| $7,500 to $9,999 | 66 (3.4%) | 27 (1.6%) |
| $10,000 to $12,499 | 58 (3.0%) | 157 (9.1%) |
| $12,500 to $14,999 | 63 (3.2%) | 108 (6.3%) |
| $15,000 to $17,499 | 44 (2.3%) | 32 (1.9%) |
| $17,500 to $19,999 | 21 (1.1%) | 20 (1.2%) |
| $20,000 to $22,499 | 12 (0.6%) | 68 (4.0%) |
| $22,500 to $24,999 | 41 (2.1%) | 54 (3.2%) |
| $25,000 to $29,999 | 126 (6.5%) | 184 (10.7%) |
| $30,000 to $34,999 | 48 (2.5%) | 153 (8.9%) |
| $35,000 to $39,999 | 42 (2.1%) | 168 (9.8%) |
| $40,000 to $44,999 | 13 (0.7%) | 85 (5.0%) |
| $45,000 to $49,999 | 86 (4.4%) | 64 (3.7%) |
| $50,000 to $54,999 | 112 (5.8%) | 66 (3.8%) |
| $55,000 to $64,999 | 257 (13.2%) | 28 (1.6%) |
| $65,000 to $74,999 | 152 (7.8%) | 100 (5.8%) |
| $75,000 to $99,999 | 307 (15.8%) | 54 (3.2%) |
| $100,000+ | 286 (14.7%) | 158 (9.2%) |
| Total | 1,949 (100.0%) | 1,715 (100.0%) |
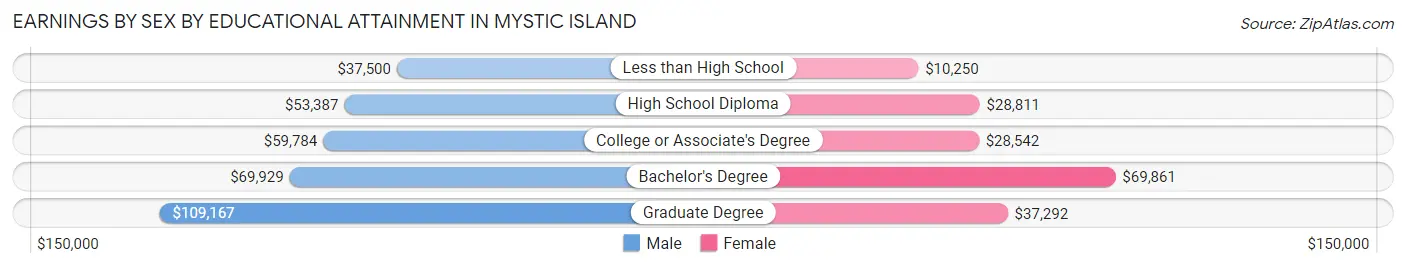
Earnings by Sex by Educational Attainment in Mystic Island
Average earnings in Mystic Island are $59,405 for men and $32,979 for women, a difference of 44.5%. Men with an educational attainment of graduate degree enjoy the highest average annual earnings of $109,167, while those with less than high school education earn the least with $37,500. Women with an educational attainment of bachelor's degree earn the most with the average annual earnings of $69,861, while those with less than high school education have the smallest earnings of $10,250.
| Educational Attainment | Male Income | Female Income |
| Less than High School | $37,500 | $10,250 |
| High School Diploma | $53,387 | $28,811 |
| College or Associate's Degree | $59,784 | $28,542 |
| Bachelor's Degree | $69,929 | $69,861 |
| Graduate Degree | $109,167 | $37,292 |
| Total | $59,405 | $32,979 |
Family Income in Mystic Island
Family Income Brackets in Mystic Island
According to the Mystic Island family income data, there are 705 families falling into the $100,000 to $149,999 income range, which is the most common income bracket and makes up 32.4% of all families. Conversely, the less than $10,000 income bracket is the least frequent group with only 30 families (1.4%) belonging to this category.
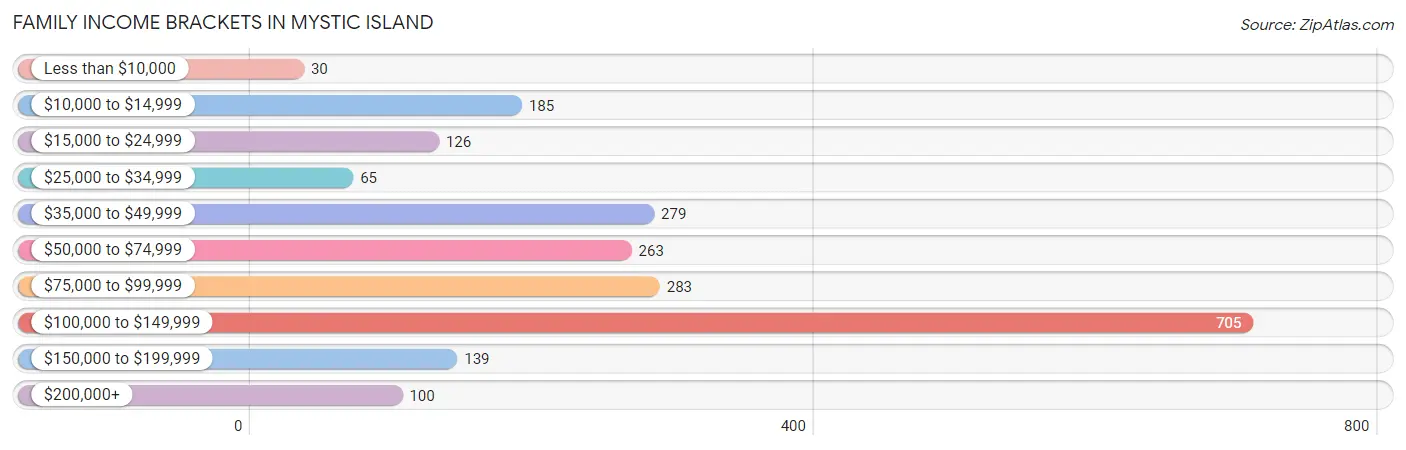
| Income Bracket | # Families | % Families |
| Less than $10,000 | 30 | 1.4% |
| $10,000 to $14,999 | 185 | 8.5% |
| $15,000 to $24,999 | 126 | 5.8% |
| $25,000 to $34,999 | 65 | 3.0% |
| $35,000 to $49,999 | 279 | 12.8% |
| $50,000 to $74,999 | 263 | 12.1% |
| $75,000 to $99,999 | 283 | 13.0% |
| $100,000 to $149,999 | 705 | 32.4% |
| $150,000 to $199,999 | 139 | 6.4% |
| $200,000+ | 100 | 4.6% |
Family Income by Famaliy Size in Mystic Island
4-person families (295 | 13.6%) account for the highest median family income in Mystic Island with $115,953 per family, while 2-person families (1,443 | 66.3%) have the highest median income of $36,068 per family member.
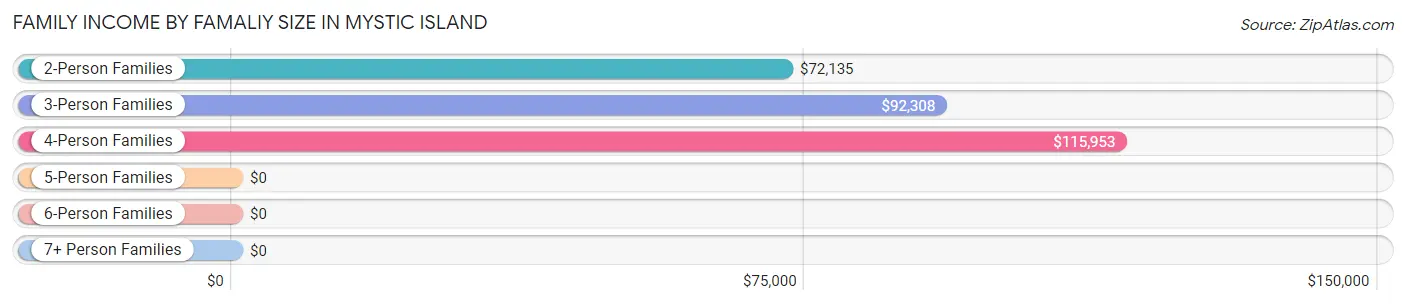
| Income Bracket | # Families | Median Income |
| 2-Person Families | 1,443 (66.3%) | $72,135 |
| 3-Person Families | 438 (20.1%) | $92,308 |
| 4-Person Families | 295 (13.6%) | $115,953 |
| 5-Person Families | 0 (0.0%) | $0 |
| 6-Person Families | 0 (0.0%) | $0 |
| 7+ Person Families | 0 (0.0%) | $0 |
| Total | 2,176 (100.0%) | $85,172 |
Family Income by Number of Earners in Mystic Island
The median family income in Mystic Island is $85,172, with families comprising 3+ earners (66) having the highest median family income of $142,708, while families with no earners (613) have the lowest median family income of $48,295, accounting for 3.0% and 28.2% of families, respectively.
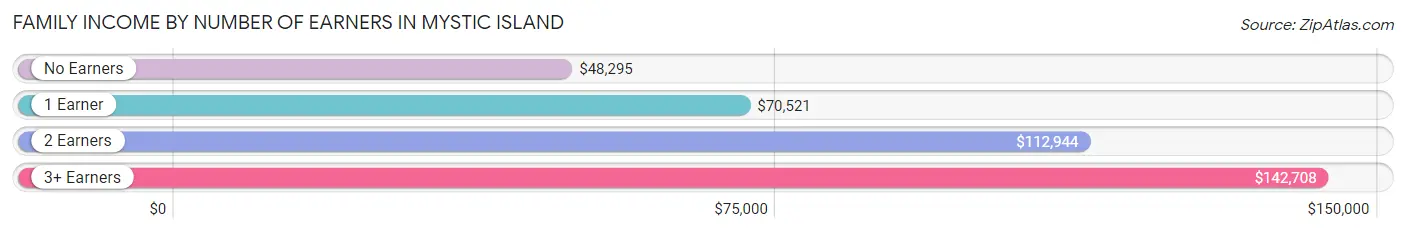
| Number of Earners | # Families | Median Income |
| No Earners | 613 (28.2%) | $48,295 |
| 1 Earner | 619 (28.4%) | $70,521 |
| 2 Earners | 878 (40.4%) | $112,944 |
| 3+ Earners | 66 (3.0%) | $142,708 |
| Total | 2,176 (100.0%) | $85,172 |
Household Income in Mystic Island
Household Income Brackets in Mystic Island
With 835 households falling in the category, the $100,000 to $149,999 income range is the most frequent in Mystic Island, accounting for 23.6% of all households. In contrast, only 156 households (4.4%) fall into the $200,000+ income bracket, making it the least populous group.
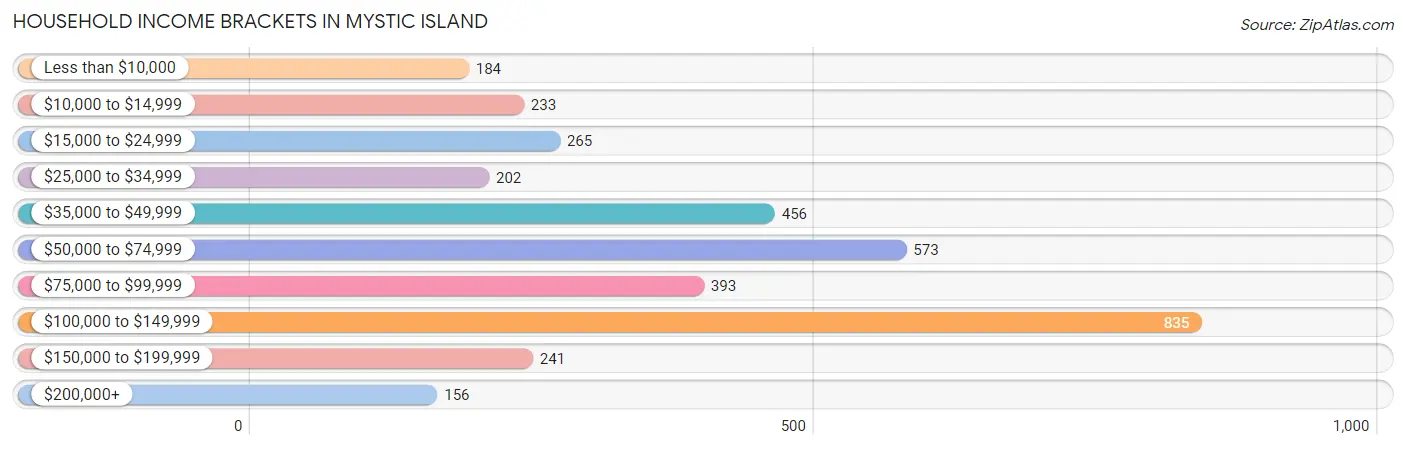
| Income Bracket | # Households | % Households |
| Less than $10,000 | 184 | 5.2% |
| $10,000 to $14,999 | 233 | 6.6% |
| $15,000 to $24,999 | 265 | 7.5% |
| $25,000 to $34,999 | 202 | 5.7% |
| $35,000 to $49,999 | 456 | 12.9% |
| $50,000 to $74,999 | 573 | 16.2% |
| $75,000 to $99,999 | 393 | 11.1% |
| $100,000 to $149,999 | 835 | 23.6% |
| $150,000 to $199,999 | 241 | 6.8% |
| $200,000+ | 156 | 4.4% |
Household Income by Householder Age in Mystic Island
The median household income in Mystic Island is $65,194, with the highest median household income of $90,673 found in the 25 to 44 years age bracket for the primary householder. A total of 543 households (15.3%) fall into this category. Meanwhile, the 15 to 24 years age bracket for the primary householder has the lowest median household income of $0, with 25 households (0.7%) in this group.
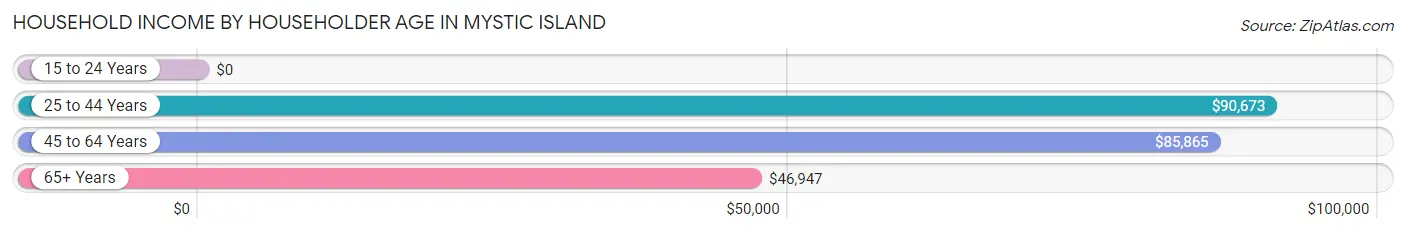
| Income Bracket | # Households | Median Income |
| 15 to 24 Years | 25 (0.7%) | $0 |
| 25 to 44 Years | 543 (15.3%) | $90,673 |
| 45 to 64 Years | 1,478 (41.8%) | $85,865 |
| 65+ Years | 1,491 (42.1%) | $46,947 |
| Total | 3,537 (100.0%) | $65,194 |
Poverty in Mystic Island
Income Below Poverty by Sex and Age in Mystic Island
With 11.7% poverty level for males and 19.6% for females among the residents of Mystic Island, 12 to 14 year old males and 15 year old females are the most vulnerable to poverty, with 92 males (74.8%) and 45 females (62.5%) in their respective age groups living below the poverty level.
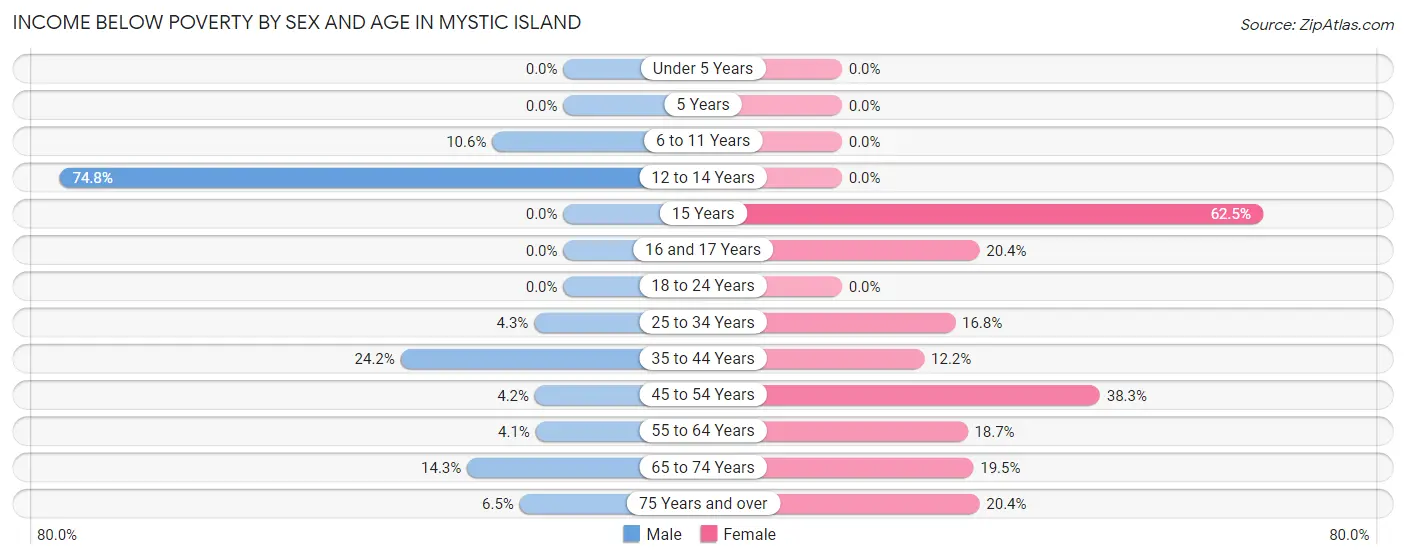
| Age Bracket | Male | Female |
| Under 5 Years | 0 (0.0%) | 0 (0.0%) |
| 5 Years | 0 (0.0%) | 0 (0.0%) |
| 6 to 11 Years | 19 (10.6%) | 0 (0.0%) |
| 12 to 14 Years | 92 (74.8%) | 0 (0.0%) |
| 15 Years | 0 (0.0%) | 45 (62.5%) |
| 16 and 17 Years | 0 (0.0%) | 19 (20.4%) |
| 18 to 24 Years | 0 (0.0%) | 0 (0.0%) |
| 25 to 34 Years | 12 (4.3%) | 38 (16.8%) |
| 35 to 44 Years | 116 (24.2%) | 50 (12.2%) |
| 45 to 54 Years | 13 (4.2%) | 177 (38.3%) |
| 55 to 64 Years | 35 (4.1%) | 172 (18.7%) |
| 65 to 74 Years | 88 (14.3%) | 124 (19.5%) |
| 75 Years and over | 25 (6.5%) | 153 (20.4%) |
| Total | 400 (11.7%) | 778 (19.6%) |
Income Above Poverty by Sex and Age in Mystic Island
According to the poverty statistics in Mystic Island, males aged under 5 years and females aged under 5 years are the age groups that are most secure financially, with 100.0% of males and 100.0% of females in these age groups living above the poverty line.
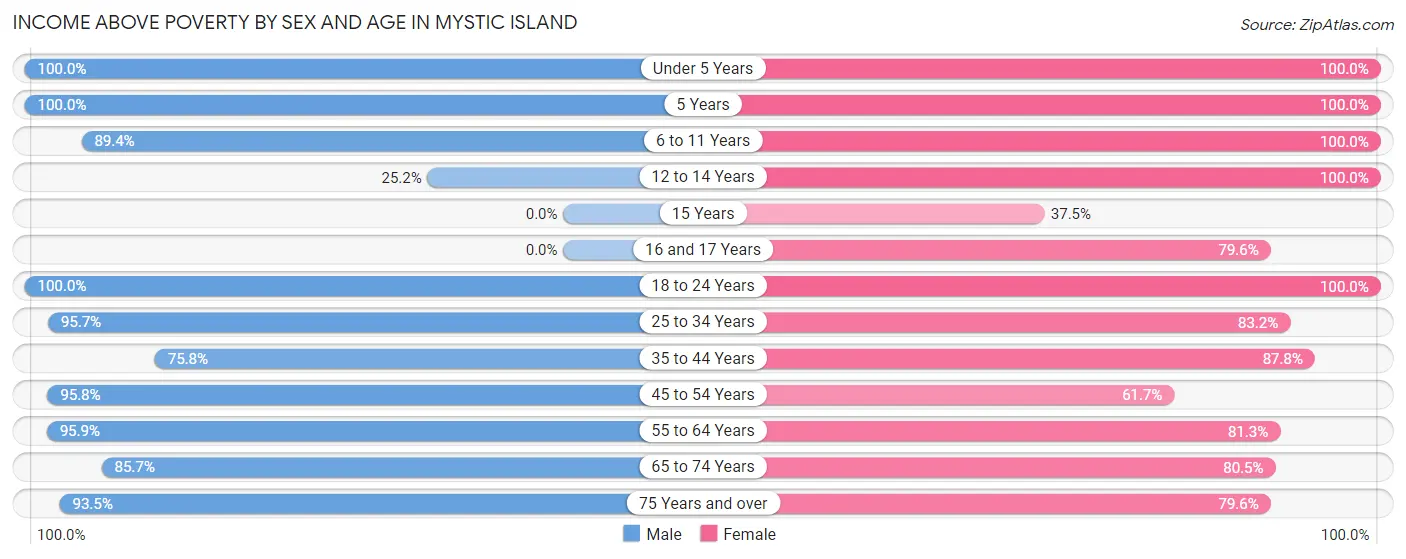
| Age Bracket | Male | Female |
| Under 5 Years | 42 (100.0%) | 70 (100.0%) |
| 5 Years | 19 (100.0%) | 73 (100.0%) |
| 6 to 11 Years | 161 (89.4%) | 91 (100.0%) |
| 12 to 14 Years | 31 (25.2%) | 64 (100.0%) |
| 15 Years | 0 (0.0%) | 27 (37.5%) |
| 16 and 17 Years | 0 (0.0%) | 74 (79.6%) |
| 18 to 24 Years | 146 (100.0%) | 100 (100.0%) |
| 25 to 34 Years | 265 (95.7%) | 188 (83.2%) |
| 35 to 44 Years | 364 (75.8%) | 359 (87.8%) |
| 45 to 54 Years | 294 (95.8%) | 285 (61.7%) |
| 55 to 64 Years | 816 (95.9%) | 750 (81.3%) |
| 65 to 74 Years | 528 (85.7%) | 511 (80.5%) |
| 75 Years and over | 360 (93.5%) | 596 (79.6%) |
| Total | 3,026 (88.3%) | 3,188 (80.4%) |
Income Below Poverty Among Married-Couple Families in Mystic Island
The poverty statistics for married-couple families in Mystic Island show that 2.0% or 32 of the total 1,630 families live below the poverty line. Families with no children have the highest poverty rate of 2.6%, comprising of 32 families. On the other hand, families with 1 or 2 children have the lowest poverty rate of 0.0%, which includes 0 families.
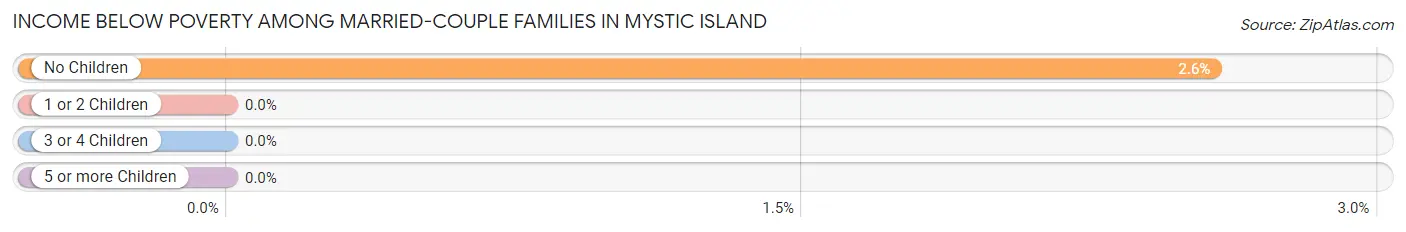
| Children | Above Poverty | Below Poverty |
| No Children | 1,213 (97.4%) | 32 (2.6%) |
| 1 or 2 Children | 385 (100.0%) | 0 (0.0%) |
| 3 or 4 Children | 0 (0.0%) | 0 (0.0%) |
| 5 or more Children | 0 (0.0%) | 0 (0.0%) |
| Total | 1,598 (98.0%) | 32 (2.0%) |
Income Below Poverty Among Single-Parent Households in Mystic Island
According to the poverty data in Mystic Island, 17.6% or 22 single-father households and 53.9% or 227 single-mother households are living below the poverty line. Among single-father households, those with no children have the highest poverty rate, with 22 households (19.8%) experiencing poverty. Likewise, among single-mother households, those with 1 or 2 children have the highest poverty rate, with 109 households (100.0%) falling below the poverty line.
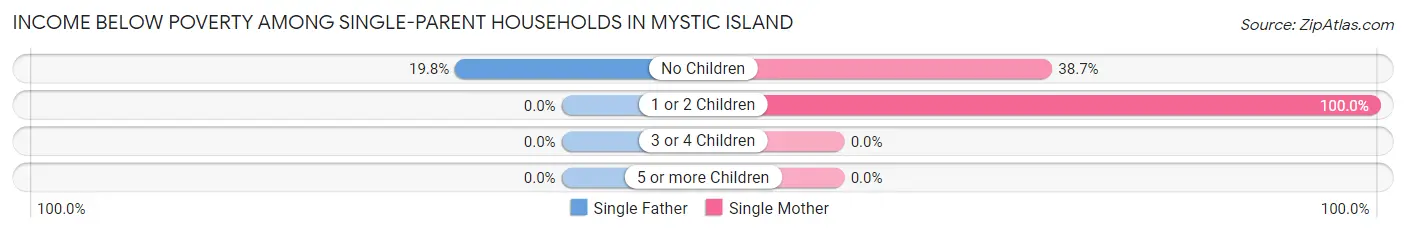
| Children | Single Father | Single Mother |
| No Children | 22 (19.8%) | 118 (38.7%) |
| 1 or 2 Children | 0 (0.0%) | 109 (100.0%) |
| 3 or 4 Children | 0 (0.0%) | 0 (0.0%) |
| 5 or more Children | 0 (0.0%) | 0 (0.0%) |
| Total | 22 (17.6%) | 227 (53.9%) |
Income Below Poverty Among Married-Couple vs Single-Parent Households in Mystic Island
The poverty data for Mystic Island shows that 32 of the married-couple family households (2.0%) and 249 of the single-parent households (45.6%) are living below the poverty level. Within the married-couple family households, those with no children have the highest poverty rate, with 32 households (2.6%) falling below the poverty line. Among the single-parent households, those with 1 or 2 children have the highest poverty rate, with 109 household (88.6%) living below poverty.
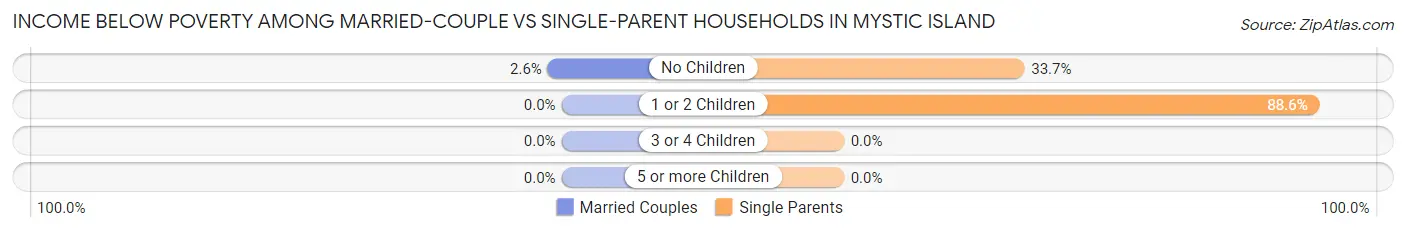
| Children | Married-Couple Families | Single-Parent Households |
| No Children | 32 (2.6%) | 140 (33.7%) |
| 1 or 2 Children | 0 (0.0%) | 109 (88.6%) |
| 3 or 4 Children | 0 (0.0%) | 0 (0.0%) |
| 5 or more Children | 0 (0.0%) | 0 (0.0%) |
| Total | 32 (2.0%) | 249 (45.6%) |
Race in Mystic Island
The most populous races in Mystic Island are White / Caucasian (6,980 | 91.4%), Hispanic or Latino (428 | 5.6%), and Two or more Races (322 | 4.2%).
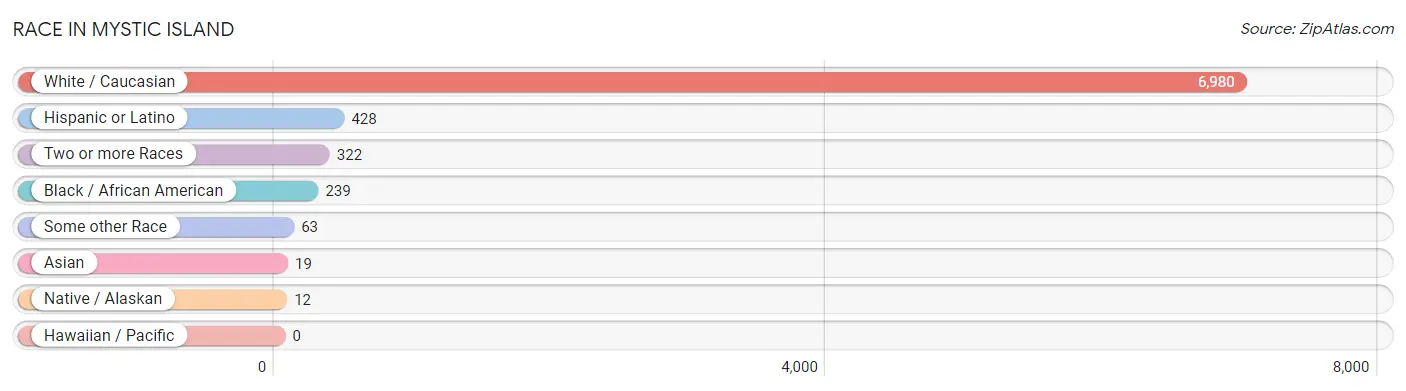
| Race | # Population | % Population |
| Asian | 19 | 0.3% |
| Black / African American | 239 | 3.1% |
| Hawaiian / Pacific | 0 | 0.0% |
| Hispanic or Latino | 428 | 5.6% |
| Native / Alaskan | 12 | 0.2% |
| White / Caucasian | 6,980 | 91.4% |
| Two or more Races | 322 | 4.2% |
| Some other Race | 63 | 0.8% |
| Total | 7,635 | 100.0% |
Ancestry in Mystic Island
The most populous ancestries reported in Mystic Island are Irish (1,766 | 23.1%), Italian (1,715 | 22.5%), German (1,527 | 20.0%), English (1,336 | 17.5%), and Polish (815 | 10.7%), together accounting for 93.8% of all Mystic Island residents.
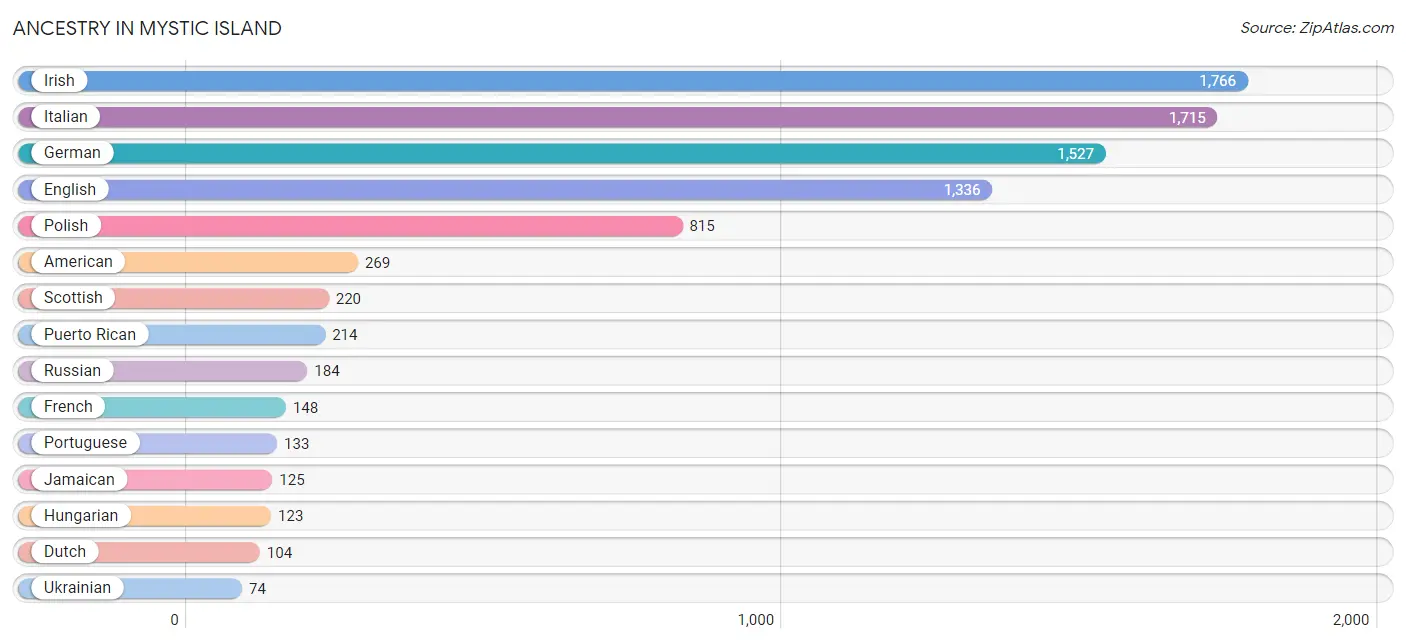
| Ancestry | # Population | % Population |
| Alsatian | 8 | 0.1% |
| American | 269 | 3.5% |
| Arab | 33 | 0.4% |
| Austrian | 13 | 0.2% |
| Belgian | 12 | 0.2% |
| Burmese | 42 | 0.5% |
| Central American | 41 | 0.5% |
| Costa Rican | 14 | 0.2% |
| Cuban | 21 | 0.3% |
| Czech | 27 | 0.4% |
| Czechoslovakian | 45 | 0.6% |
| Danish | 17 | 0.2% |
| Delaware | 18 | 0.2% |
| Dominican | 54 | 0.7% |
| Dutch | 104 | 1.4% |
| Eastern European | 22 | 0.3% |
| Ecuadorian | 13 | 0.2% |
| English | 1,336 | 17.5% |
| European | 27 | 0.4% |
| French | 148 | 1.9% |
| French Canadian | 69 | 0.9% |
| German | 1,527 | 20.0% |
| Greek | 8 | 0.1% |
| Hungarian | 123 | 1.6% |
| Indian (Asian) | 21 | 0.3% |
| Irish | 1,766 | 23.1% |
| Italian | 1,715 | 22.5% |
| Jamaican | 125 | 1.6% |
| Lebanese | 12 | 0.2% |
| Lithuanian | 21 | 0.3% |
| Norwegian | 18 | 0.2% |
| Panamanian | 27 | 0.4% |
| Peruvian | 9 | 0.1% |
| Polish | 815 | 10.7% |
| Portuguese | 133 | 1.7% |
| Puerto Rican | 214 | 2.8% |
| Russian | 184 | 2.4% |
| Scotch-Irish | 16 | 0.2% |
| Scottish | 220 | 2.9% |
| Slovak | 28 | 0.4% |
| South African | 9 | 0.1% |
| South American | 22 | 0.3% |
| Spaniard | 72 | 0.9% |
| Sri Lankan | 9 | 0.1% |
| Subsaharan African | 9 | 0.1% |
| Swedish | 41 | 0.5% |
| Swiss | 65 | 0.9% |
| Syrian | 12 | 0.2% |
| Ukrainian | 74 | 1.0% |
| Yugoslavian | 29 | 0.4% | View All 50 Rows |
Immigrants in Mystic Island
The most numerous immigrant groups reported in Mystic Island came from Europe (187 | 2.5%), Latin America (86 | 1.1%), Caribbean (74 | 1.0%), Eastern Europe (64 | 0.8%), and England (44 | 0.6%), together accounting for 6.0% of all Mystic Island residents.
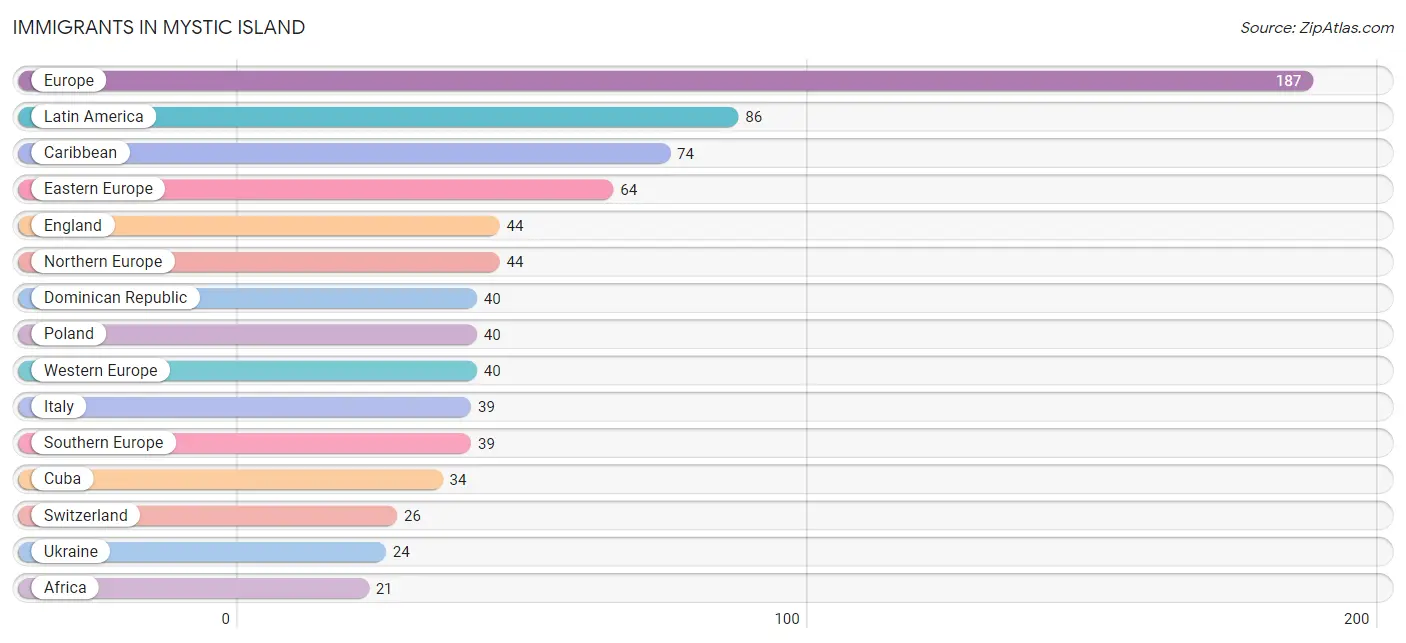
| Immigration Origin | # Population | % Population |
| Africa | 21 | 0.3% |
| Asia | 19 | 0.3% |
| Canada | 12 | 0.2% |
| Caribbean | 74 | 1.0% |
| Central America | 12 | 0.2% |
| China | 2 | 0.0% |
| Cuba | 34 | 0.4% |
| Dominican Republic | 40 | 0.5% |
| Eastern Asia | 2 | 0.0% |
| Eastern Europe | 64 | 0.8% |
| England | 44 | 0.6% |
| Europe | 187 | 2.5% |
| Germany | 14 | 0.2% |
| Italy | 39 | 0.5% |
| Latin America | 86 | 1.1% |
| Northern Europe | 44 | 0.6% |
| Panama | 12 | 0.2% |
| Poland | 40 | 0.5% |
| South Africa | 9 | 0.1% |
| South Central Asia | 8 | 0.1% |
| South Eastern Asia | 9 | 0.1% |
| Southern Europe | 39 | 0.5% |
| Sri Lanka | 8 | 0.1% |
| Switzerland | 26 | 0.3% |
| Taiwan | 2 | 0.0% |
| Ukraine | 24 | 0.3% |
| Vietnam | 9 | 0.1% |
| Western Europe | 40 | 0.5% | View All 28 Rows |
Sex and Age in Mystic Island
Sex and Age in Mystic Island
The most populous age groups in Mystic Island are 60 to 64 Years (540 | 15.2%) for men and 60 to 64 Years (615 | 15.1%) for women.
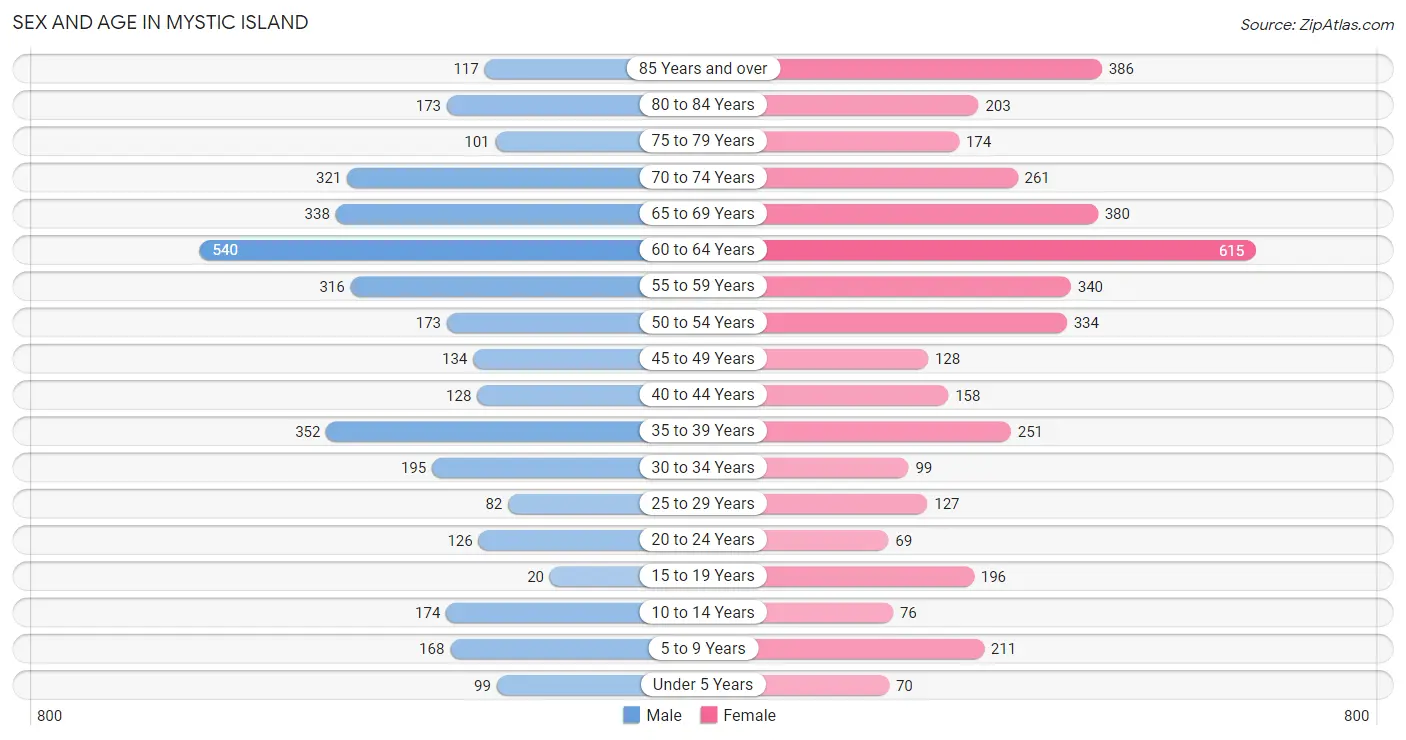
| Age Bracket | Male | Female |
| Under 5 Years | 99 (2.8%) | 70 (1.7%) |
| 5 to 9 Years | 168 (4.7%) | 211 (5.2%) |
| 10 to 14 Years | 174 (4.9%) | 76 (1.9%) |
| 15 to 19 Years | 20 (0.6%) | 196 (4.8%) |
| 20 to 24 Years | 126 (3.5%) | 69 (1.7%) |
| 25 to 29 Years | 82 (2.3%) | 127 (3.1%) |
| 30 to 34 Years | 195 (5.5%) | 99 (2.4%) |
| 35 to 39 Years | 352 (9.9%) | 251 (6.1%) |
| 40 to 44 Years | 128 (3.6%) | 158 (3.9%) |
| 45 to 49 Years | 134 (3.8%) | 128 (3.1%) |
| 50 to 54 Years | 173 (4.9%) | 334 (8.2%) |
| 55 to 59 Years | 316 (8.9%) | 340 (8.3%) |
| 60 to 64 Years | 540 (15.2%) | 615 (15.1%) |
| 65 to 69 Years | 338 (9.5%) | 380 (9.3%) |
| 70 to 74 Years | 321 (9.0%) | 261 (6.4%) |
| 75 to 79 Years | 101 (2.8%) | 174 (4.3%) |
| 80 to 84 Years | 173 (4.9%) | 203 (5.0%) |
| 85 Years and over | 117 (3.3%) | 386 (9.5%) |
| Total | 3,557 (100.0%) | 4,078 (100.0%) |
Families and Households in Mystic Island
Median Family Size in Mystic Island
The median family size in Mystic Island is 2.51 persons per family, with married-couple families (1,630 | 74.9%) accounting for the largest median family size of 2.57 persons per family. On the other hand, single male/father families (125 | 5.7%) represent the smallest median family size with 2.18 persons per family.
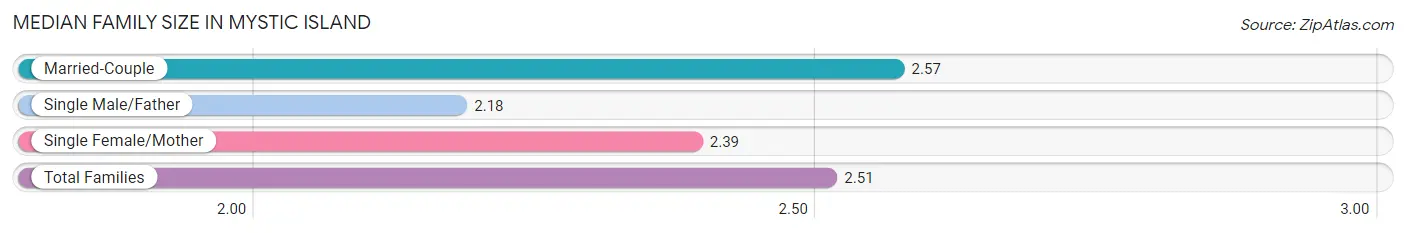
| Family Type | # Families | Family Size |
| Married-Couple | 1,630 (74.9%) | 2.57 |
| Single Male/Father | 125 (5.7%) | 2.18 |
| Single Female/Mother | 421 (19.4%) | 2.39 |
| Total Families | 2,176 (100.0%) | 2.51 |
Median Household Size in Mystic Island
The median household size in Mystic Island is 2.12 persons per household, with married-couple households (1,630 | 46.1%) accounting for the largest median household size of 2.64 persons per household. non-family households (1,361 | 38.5%) represent the smallest median household size with 1.38 persons per household.
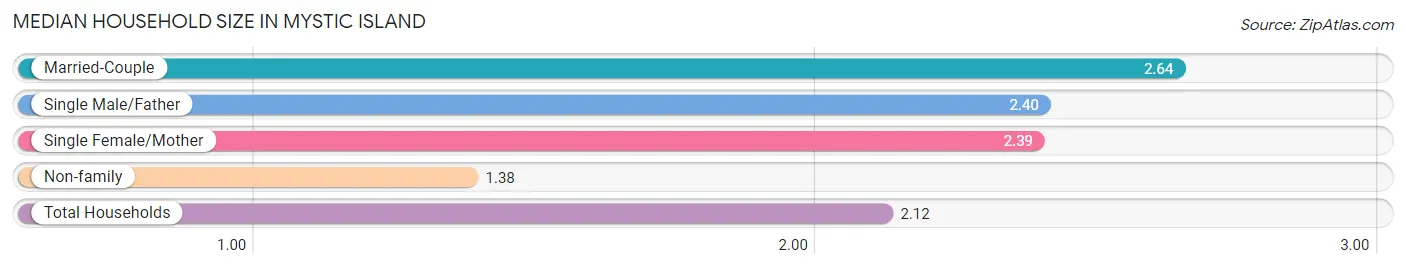
| Household Type | # Households | Household Size |
| Married-Couple | 1,630 (46.1%) | 2.64 |
| Single Male/Father | 125 (3.5%) | 2.40 |
| Single Female/Mother | 421 (11.9%) | 2.39 |
| Non-family | 1,361 (38.5%) | 1.38 |
| Total Households | 3,537 (100.0%) | 2.12 |
Household Size by Marriage Status in Mystic Island
Out of a total of 3,537 households in Mystic Island, 2,176 (61.5%) are family households, while 1,361 (38.5%) are nonfamily households. The most numerous type of family households are 2-person households, comprising 1,396, and the most common type of nonfamily households are 1-person households, comprising 1,056.
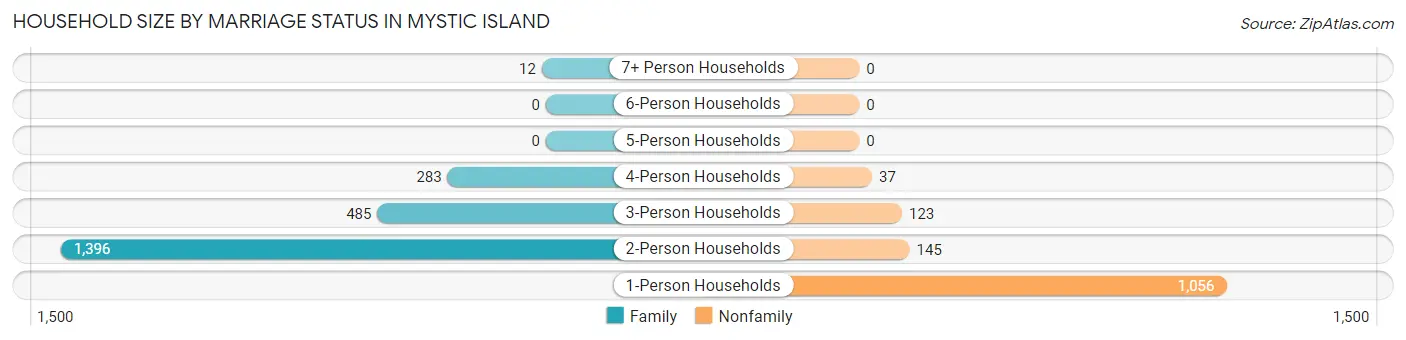
| Household Size | Family Households | Nonfamily Households |
| 1-Person Households | - | 1,056 (29.9%) |
| 2-Person Households | 1,396 (39.5%) | 145 (4.1%) |
| 3-Person Households | 485 (13.7%) | 123 (3.5%) |
| 4-Person Households | 283 (8.0%) | 37 (1.1%) |
| 5-Person Households | 0 (0.0%) | 0 (0.0%) |
| 6-Person Households | 0 (0.0%) | 0 (0.0%) |
| 7+ Person Households | 12 (0.3%) | 0 (0.0%) |
| Total | 2,176 (61.5%) | 1,361 (38.5%) |
Female Fertility in Mystic Island
Fertility by Age in Mystic Island
Average fertility rate in Mystic Island is 8.0 births per 1,000 women. Women in the age bracket of 20 to 34 years have the highest fertility rate with 31.0 births per 1,000 women. Women in the age bracket of 20 to 34 years acount for 100.0% of all women with births.
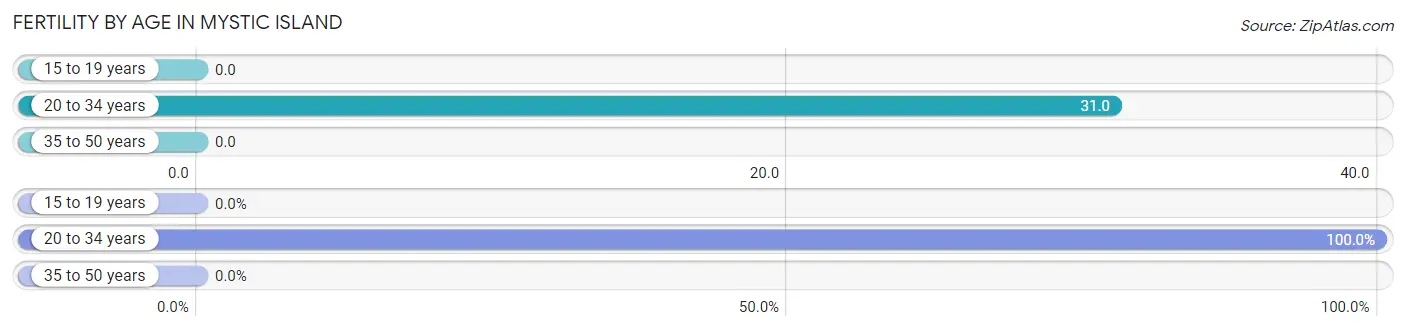
| Age Bracket | Women with Births | Births / 1,000 Women |
| 15 to 19 years | 0 (0.0%) | 0.0 |
| 20 to 34 years | 9 (100.0%) | 31.0 |
| 35 to 50 years | 0 (0.0%) | 0.0 |
| Total | 9 (100.0%) | 8.0 |
Fertility by Age by Marriage Status in Mystic Island
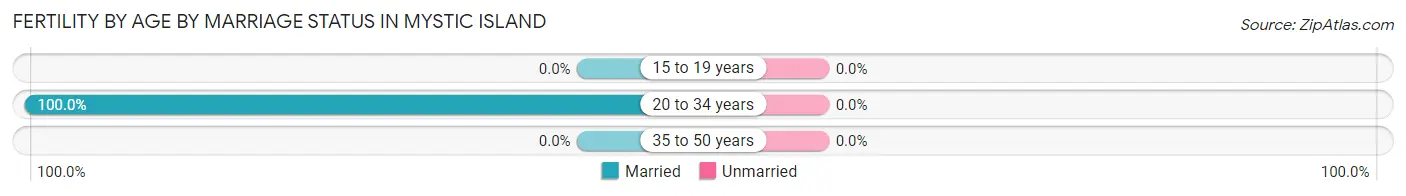
| Age Bracket | Married | Unmarried |
| 15 to 19 years | 0 (0.0%) | 0 (0.0%) |
| 20 to 34 years | 9 (100.0%) | 0 (0.0%) |
| 35 to 50 years | 0 (0.0%) | 0 (0.0%) |
| Total | 9 (100.0%) | 0 (0.0%) |
Fertility by Education in Mystic Island
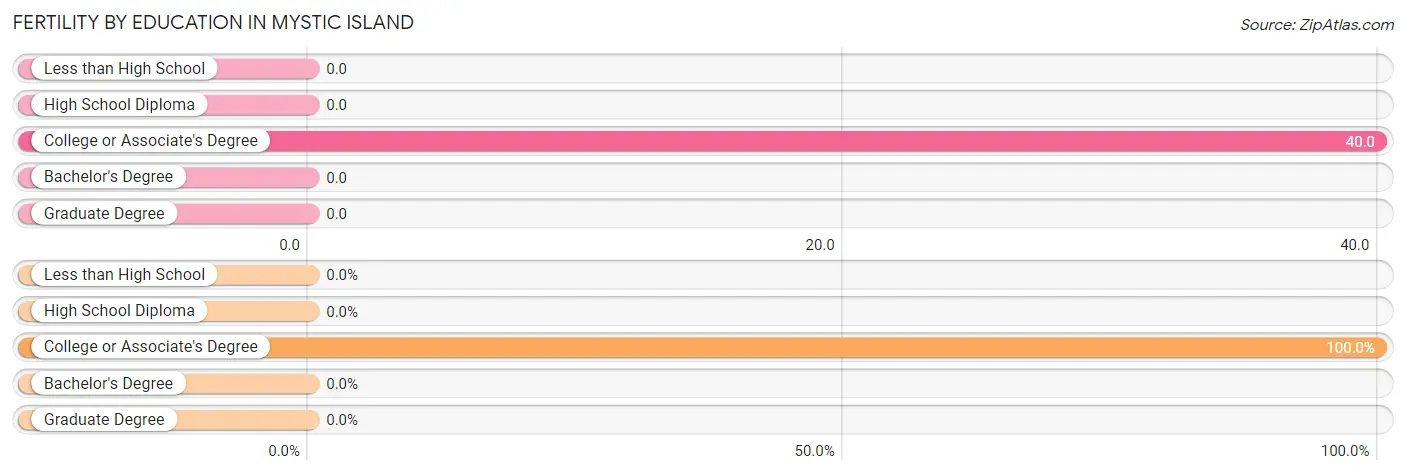
| Educational Attainment | Women with Births | Births / 1,000 Women |
| Less than High School | 0 (0.0%) | 0.0 |
| High School Diploma | 0 (0.0%) | 0.0 |
| College or Associate's Degree | 9 (100.0%) | 40.0 |
| Bachelor's Degree | 0 (0.0%) | 0.0 |
| Graduate Degree | 0 (0.0%) | 0.0 |
| Total | 9 (100.0%) | 8.0 |
Fertility by Education by Marriage Status in Mystic Island
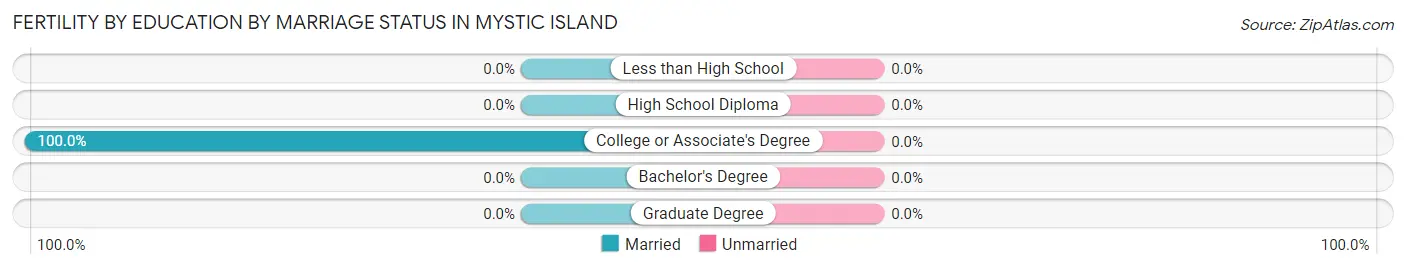
| Educational Attainment | Married | Unmarried |
| Less than High School | 0 (0.0%) | 0 (0.0%) |
| High School Diploma | 0 (0.0%) | 0 (0.0%) |
| College or Associate's Degree | 9 (100.0%) | 0 (0.0%) |
| Bachelor's Degree | 0 (0.0%) | 0 (0.0%) |
| Graduate Degree | 0 (0.0%) | 0 (0.0%) |
| Total | 9 (100.0%) | 0 (0.0%) |
Employment Characteristics in Mystic Island
Employment by Class of Employer in Mystic Island
Among the 3,026 employed individuals in Mystic Island, private company employees (2,059 | 68.0%), local government employees (328 | 10.8%), and self-employed (not incorporated) (239 | 7.9%) make up the most common classes of employment.
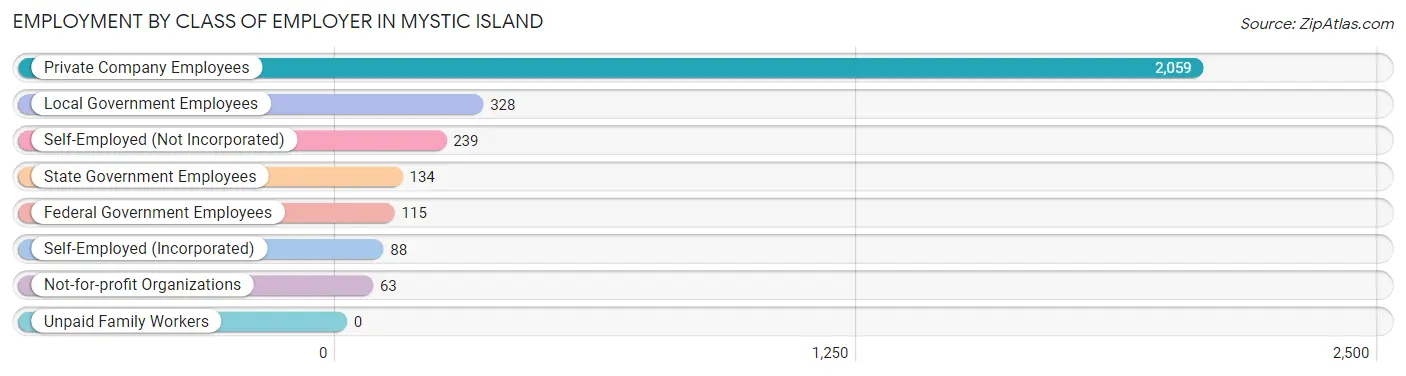
| Employer Class | # Employees | % Employees |
| Private Company Employees | 2,059 | 68.0% |
| Self-Employed (Incorporated) | 88 | 2.9% |
| Self-Employed (Not Incorporated) | 239 | 7.9% |
| Not-for-profit Organizations | 63 | 2.1% |
| Local Government Employees | 328 | 10.8% |
| State Government Employees | 134 | 4.4% |
| Federal Government Employees | 115 | 3.8% |
| Unpaid Family Workers | 0 | 0.0% |
| Total | 3,026 | 100.0% |
Employment Status by Age in Mystic Island
According to the labor force statistics for Mystic Island, out of the total population over 16 years of age (6,765), 50.8% or 3,437 individuals are in the labor force, with 7.6% or 261 of them unemployed. The age group with the highest labor force participation rate is 35 to 44 years, with 90.4% or 804 individuals in the labor force. Within the labor force, the 16 to 19 years age range has the highest percentage of unemployed individuals, with 43.2% or 16 of them being unemployed.
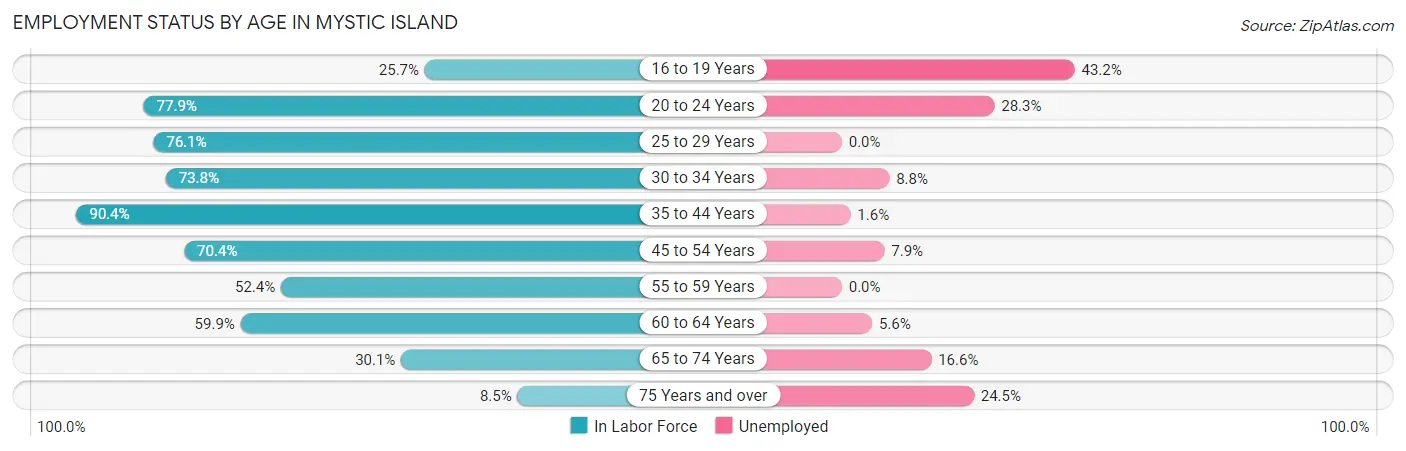
| Age Bracket | In Labor Force | Unemployed |
| 16 to 19 Years | 37 (25.7%) | 16 (43.2%) |
| 20 to 24 Years | 152 (77.9%) | 43 (28.3%) |
| 25 to 29 Years | 159 (76.1%) | 0 (0.0%) |
| 30 to 34 Years | 217 (73.8%) | 19 (8.8%) |
| 35 to 44 Years | 804 (90.4%) | 13 (1.6%) |
| 45 to 54 Years | 541 (70.4%) | 43 (7.9%) |
| 55 to 59 Years | 344 (52.4%) | 0 (0.0%) |
| 60 to 64 Years | 692 (59.9%) | 39 (5.6%) |
| 65 to 74 Years | 391 (30.1%) | 65 (16.6%) |
| 75 Years and over | 98 (8.5%) | 24 (24.5%) |
| Total | 3,437 (50.8%) | 261 (7.6%) |
Employment Status by Educational Attainment in Mystic Island
According to labor force statistics for Mystic Island, 69.4% of individuals (2,757) out of the total population between 25 and 64 years of age (3,972) are in the labor force, with 4.1% or 113 of them being unemployed. The group with the highest labor force participation rate are those with the educational attainment of college / associate degree, with 81.1% or 834 individuals in the labor force. Within the labor force, individuals with bachelor's degree or higher education have the highest percentage of unemployment, with 8.6% or 56 of them being unemployed.
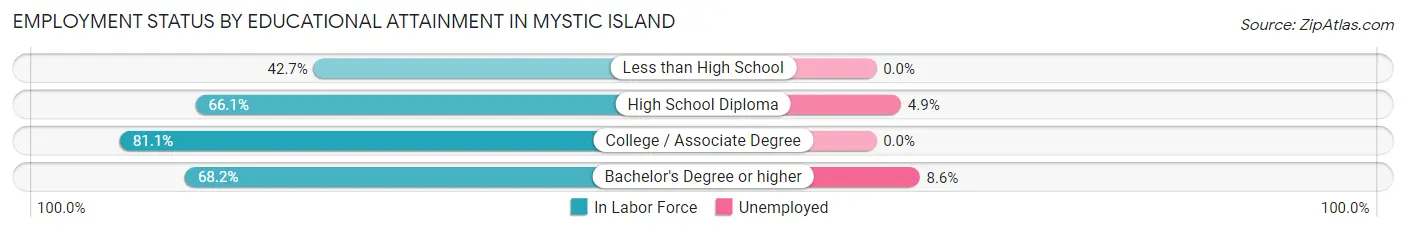
| Educational Attainment | In Labor Force | Unemployed |
| Less than High School | 79 (42.7%) | 0 (0.0%) |
| High School Diploma | 1,192 (66.1%) | 88 (4.9%) |
| College / Associate Degree | 834 (81.1%) | 0 (0.0%) |
| Bachelor's Degree or higher | 652 (68.2%) | 82 (8.6%) |
| Total | 2,757 (69.4%) | 163 (4.1%) |
Employment Occupations by Sex in Mystic Island
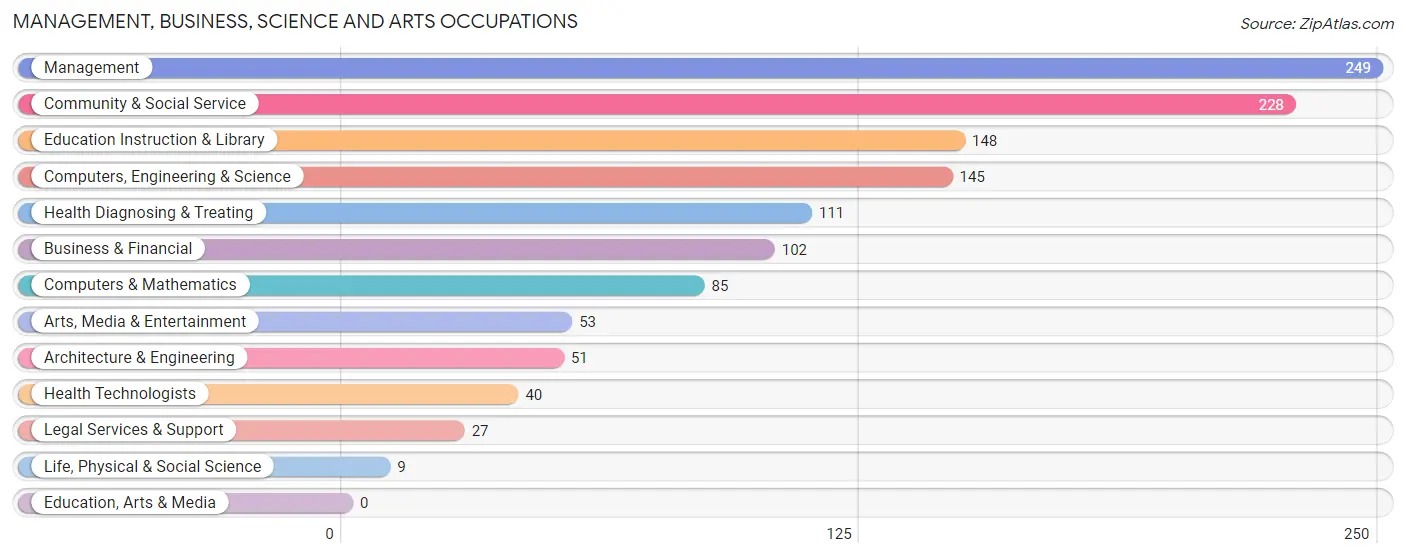
Management, Business, Science and Arts Occupations
The most common Management, Business, Science and Arts occupations in Mystic Island are Management (249 | 7.9%), Community & Social Service (228 | 7.2%), Education Instruction & Library (148 | 4.7%), Computers, Engineering & Science (145 | 4.6%), and Health Diagnosing & Treating (111 | 3.5%).
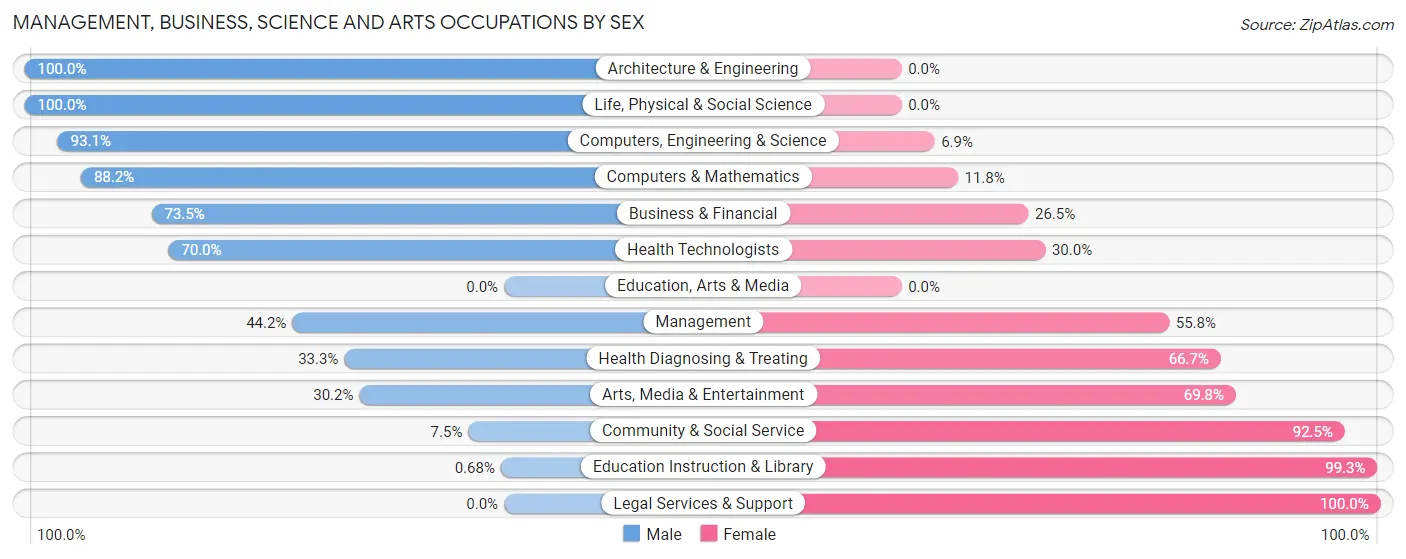
Management, Business, Science and Arts Occupations by Sex
Within the Management, Business, Science and Arts occupations in Mystic Island, the most male-oriented occupations are Architecture & Engineering (100.0%), Life, Physical & Social Science (100.0%), and Computers, Engineering & Science (93.1%), while the most female-oriented occupations are Legal Services & Support (100.0%), Education Instruction & Library (99.3%), and Community & Social Service (92.5%).
| Occupation | Male | Female |
| Management | 110 (44.2%) | 139 (55.8%) |
| Business & Financial | 75 (73.5%) | 27 (26.5%) |
| Computers, Engineering & Science | 135 (93.1%) | 10 (6.9%) |
| Computers & Mathematics | 75 (88.2%) | 10 (11.8%) |
| Architecture & Engineering | 51 (100.0%) | 0 (0.0%) |
| Life, Physical & Social Science | 9 (100.0%) | 0 (0.0%) |
| Community & Social Service | 17 (7.5%) | 211 (92.5%) |
| Education, Arts & Media | 0 (0.0%) | 0 (0.0%) |
| Legal Services & Support | 0 (0.0%) | 27 (100.0%) |
| Education Instruction & Library | 1 (0.7%) | 147 (99.3%) |
| Arts, Media & Entertainment | 16 (30.2%) | 37 (69.8%) |
| Health Diagnosing & Treating | 37 (33.3%) | 74 (66.7%) |
| Health Technologists | 28 (70.0%) | 12 (30.0%) |
| Total (Category) | 374 (44.8%) | 461 (55.2%) |
| Total (Overall) | 1,724 (54.3%) | 1,449 (45.7%) |
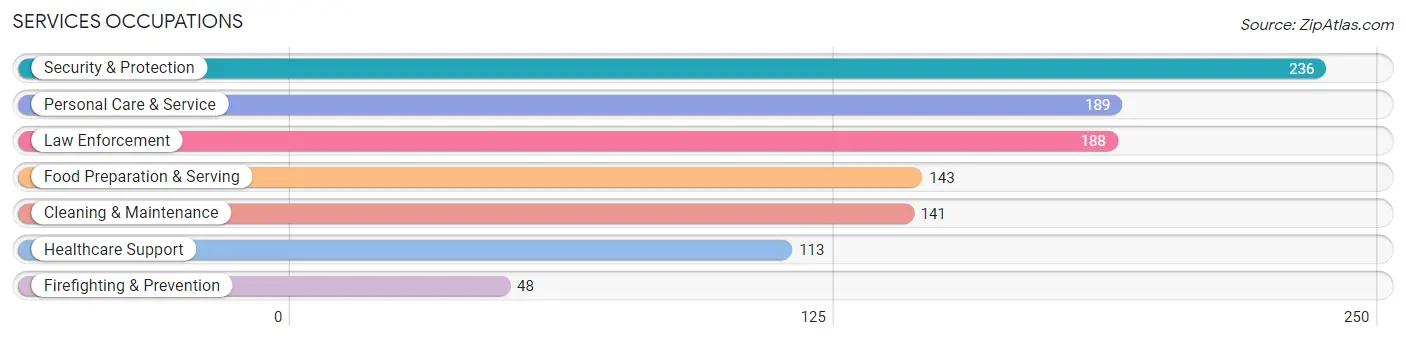
Services Occupations
The most common Services occupations in Mystic Island are Security & Protection (236 | 7.4%), Personal Care & Service (189 | 6.0%), Law Enforcement (188 | 5.9%), Food Preparation & Serving (143 | 4.5%), and Cleaning & Maintenance (141 | 4.4%).
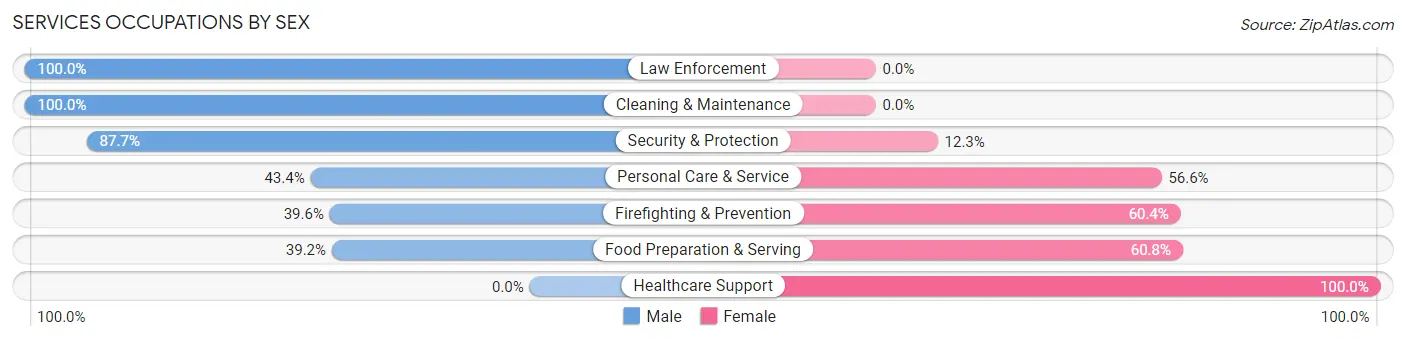
Services Occupations by Sex
Within the Services occupations in Mystic Island, the most male-oriented occupations are Law Enforcement (100.0%), Cleaning & Maintenance (100.0%), and Security & Protection (87.7%), while the most female-oriented occupations are Healthcare Support (100.0%), Food Preparation & Serving (60.8%), and Firefighting & Prevention (60.4%).
| Occupation | Male | Female |
| Healthcare Support | 0 (0.0%) | 113 (100.0%) |
| Security & Protection | 207 (87.7%) | 29 (12.3%) |
| Firefighting & Prevention | 19 (39.6%) | 29 (60.4%) |
| Law Enforcement | 188 (100.0%) | 0 (0.0%) |
| Food Preparation & Serving | 56 (39.2%) | 87 (60.8%) |
| Cleaning & Maintenance | 141 (100.0%) | 0 (0.0%) |
| Personal Care & Service | 82 (43.4%) | 107 (56.6%) |
| Total (Category) | 486 (59.1%) | 336 (40.9%) |
| Total (Overall) | 1,724 (54.3%) | 1,449 (45.7%) |
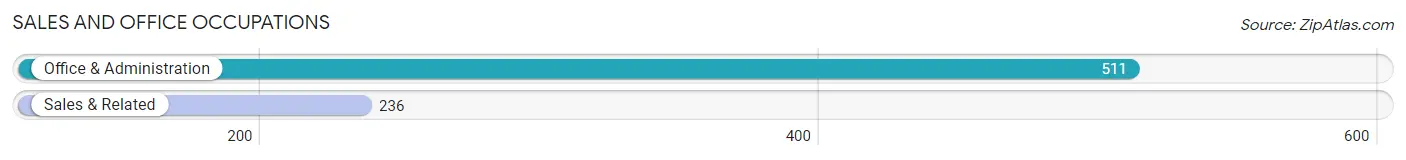
Sales and Office Occupations
The most common Sales and Office occupations in Mystic Island are Office & Administration (511 | 16.1%), and Sales & Related (236 | 7.4%).
Sales and Office Occupations by Sex
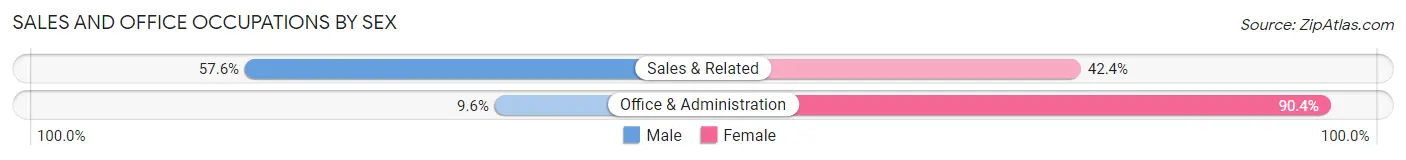
| Occupation | Male | Female |
| Sales & Related | 136 (57.6%) | 100 (42.4%) |
| Office & Administration | 49 (9.6%) | 462 (90.4%) |
| Total (Category) | 185 (24.8%) | 562 (75.2%) |
| Total (Overall) | 1,724 (54.3%) | 1,449 (45.7%) |
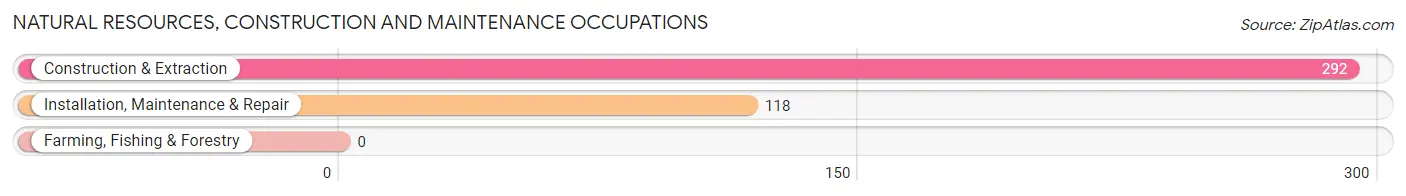
Natural Resources, Construction and Maintenance Occupations
The most common Natural Resources, Construction and Maintenance occupations in Mystic Island are Construction & Extraction (292 | 9.2%), and Installation, Maintenance & Repair (118 | 3.7%).
Natural Resources, Construction and Maintenance Occupations by Sex
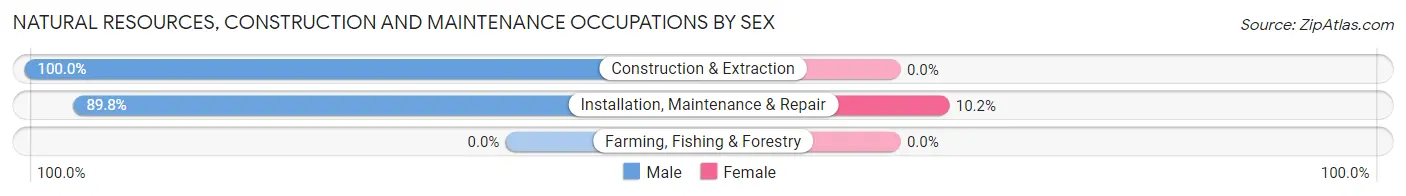
| Occupation | Male | Female |
| Farming, Fishing & Forestry | 0 (0.0%) | 0 (0.0%) |
| Construction & Extraction | 292 (100.0%) | 0 (0.0%) |
| Installation, Maintenance & Repair | 106 (89.8%) | 12 (10.2%) |
| Total (Category) | 398 (97.1%) | 12 (2.9%) |
| Total (Overall) | 1,724 (54.3%) | 1,449 (45.7%) |
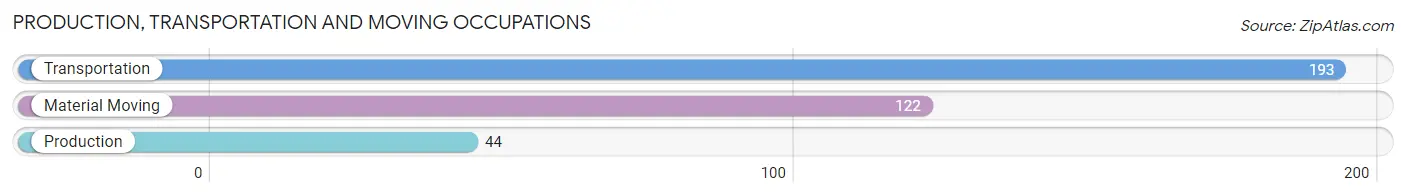
Production, Transportation and Moving Occupations
The most common Production, Transportation and Moving occupations in Mystic Island are Transportation (193 | 6.1%), Material Moving (122 | 3.8%), and Production (44 | 1.4%).
Production, Transportation and Moving Occupations by Sex
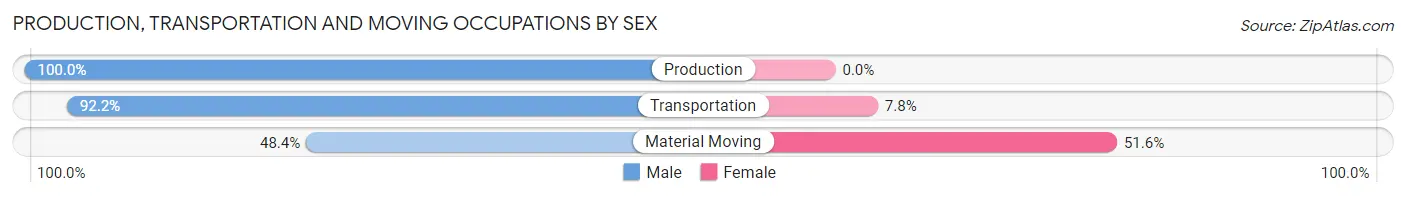
| Occupation | Male | Female |
| Production | 44 (100.0%) | 0 (0.0%) |
| Transportation | 178 (92.2%) | 15 (7.8%) |
| Material Moving | 59 (48.4%) | 63 (51.6%) |
| Total (Category) | 281 (78.3%) | 78 (21.7%) |
| Total (Overall) | 1,724 (54.3%) | 1,449 (45.7%) |
Employment Industries by Sex in Mystic Island
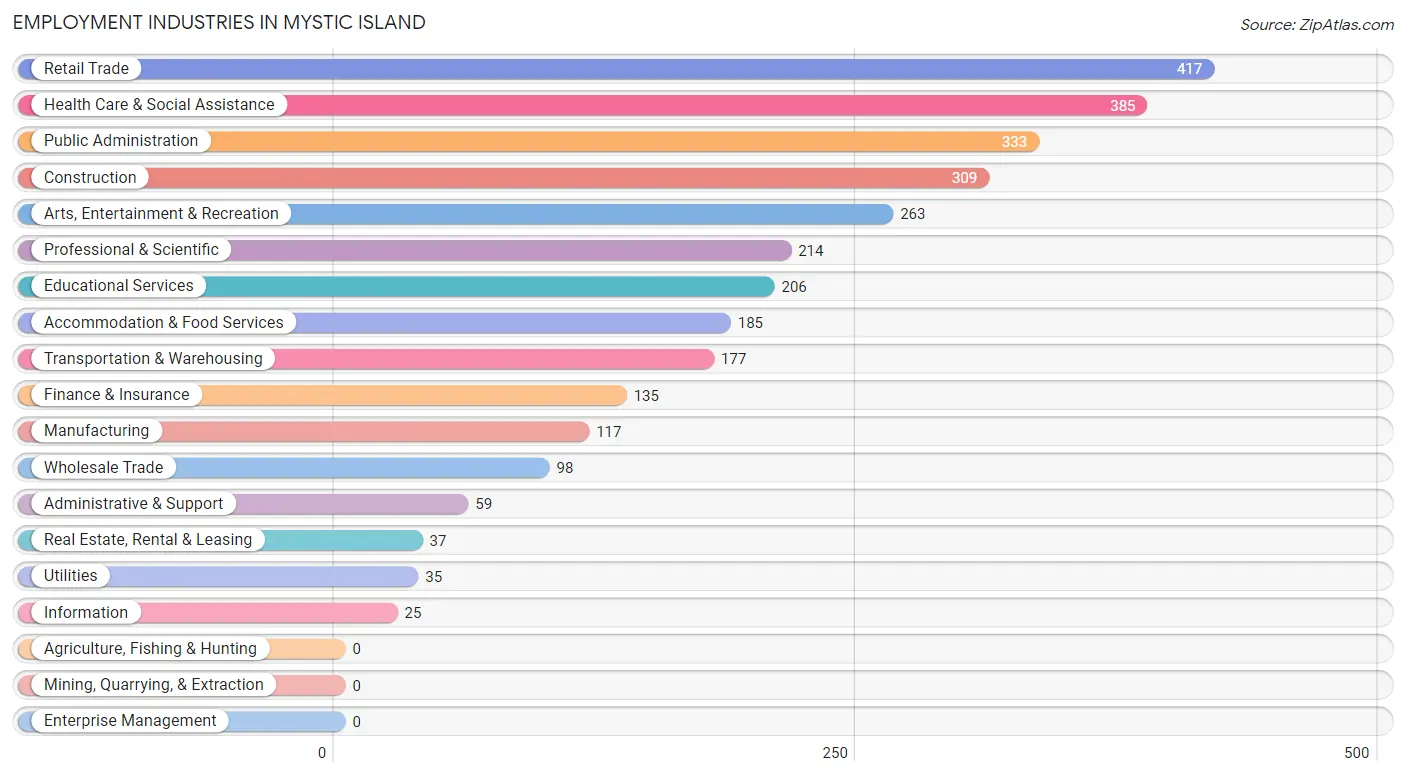
Employment Industries in Mystic Island
The major employment industries in Mystic Island include Retail Trade (417 | 13.1%), Health Care & Social Assistance (385 | 12.1%), Public Administration (333 | 10.5%), Construction (309 | 9.7%), and Arts, Entertainment & Recreation (263 | 8.3%).
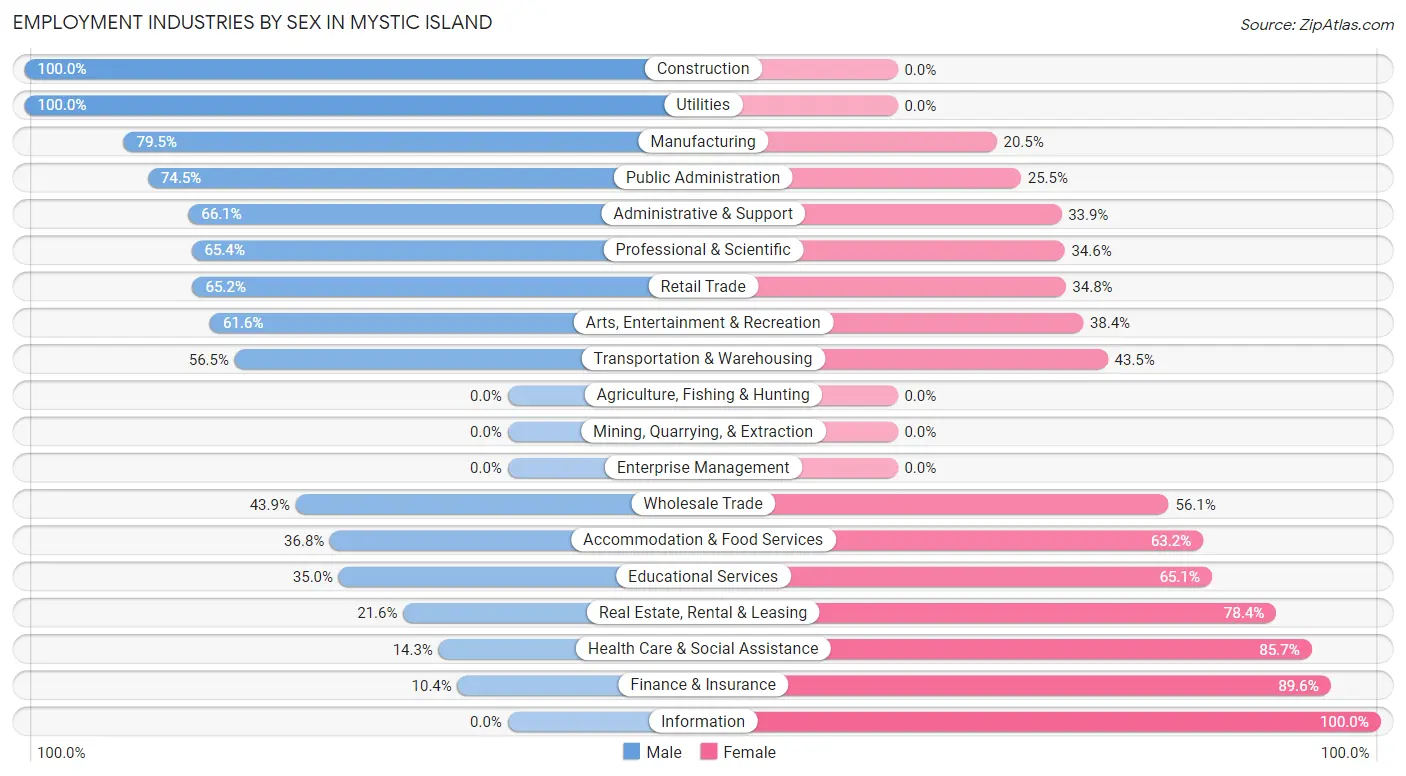
Employment Industries by Sex in Mystic Island
The Mystic Island industries that see more men than women are Construction (100.0%), Utilities (100.0%), and Manufacturing (79.5%), whereas the industries that tend to have a higher number of women are Information (100.0%), Finance & Insurance (89.6%), and Health Care & Social Assistance (85.7%).
| Industry | Male | Female |
| Agriculture, Fishing & Hunting | 0 (0.0%) | 0 (0.0%) |
| Mining, Quarrying, & Extraction | 0 (0.0%) | 0 (0.0%) |
| Construction | 309 (100.0%) | 0 (0.0%) |
| Manufacturing | 93 (79.5%) | 24 (20.5%) |
| Wholesale Trade | 43 (43.9%) | 55 (56.1%) |
| Retail Trade | 272 (65.2%) | 145 (34.8%) |
| Transportation & Warehousing | 100 (56.5%) | 77 (43.5%) |
| Utilities | 35 (100.0%) | 0 (0.0%) |
| Information | 0 (0.0%) | 25 (100.0%) |
| Finance & Insurance | 14 (10.4%) | 121 (89.6%) |
| Real Estate, Rental & Leasing | 8 (21.6%) | 29 (78.4%) |
| Professional & Scientific | 140 (65.4%) | 74 (34.6%) |
| Enterprise Management | 0 (0.0%) | 0 (0.0%) |
| Administrative & Support | 39 (66.1%) | 20 (33.9%) |
| Educational Services | 72 (34.9%) | 134 (65.0%) |
| Health Care & Social Assistance | 55 (14.3%) | 330 (85.7%) |
| Arts, Entertainment & Recreation | 162 (61.6%) | 101 (38.4%) |
| Accommodation & Food Services | 68 (36.8%) | 117 (63.2%) |
| Public Administration | 248 (74.5%) | 85 (25.5%) |
| Total | 1,724 (54.3%) | 1,449 (45.7%) |
Education in Mystic Island
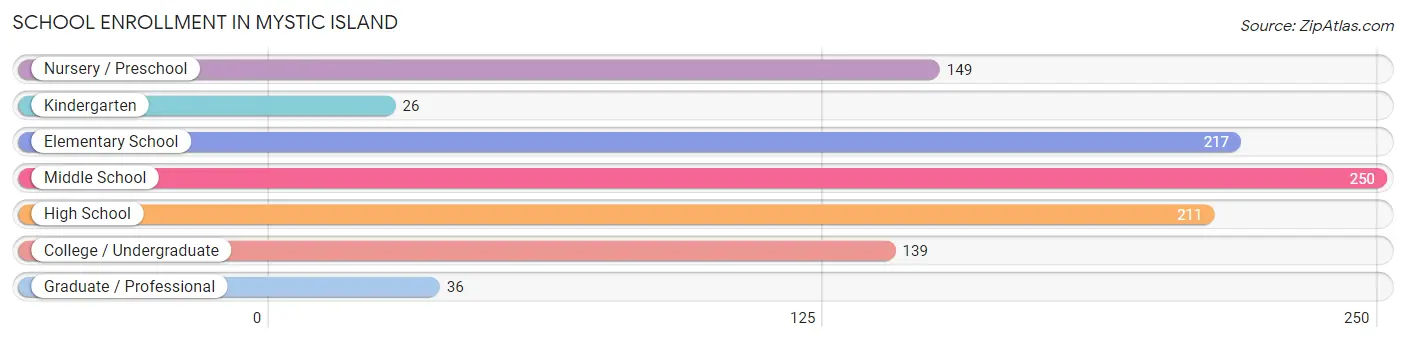
School Enrollment in Mystic Island
The most common levels of schooling among the 1,028 students in Mystic Island are middle school (250 | 24.3%), elementary school (217 | 21.1%), and high school (211 | 20.5%).
| School Level | # Students | % Students |
| Nursery / Preschool | 149 | 14.5% |
| Kindergarten | 26 | 2.5% |
| Elementary School | 217 | 21.1% |
| Middle School | 250 | 24.3% |
| High School | 211 | 20.5% |
| College / Undergraduate | 139 | 13.5% |
| Graduate / Professional | 36 | 3.5% |
| Total | 1,028 | 100.0% |
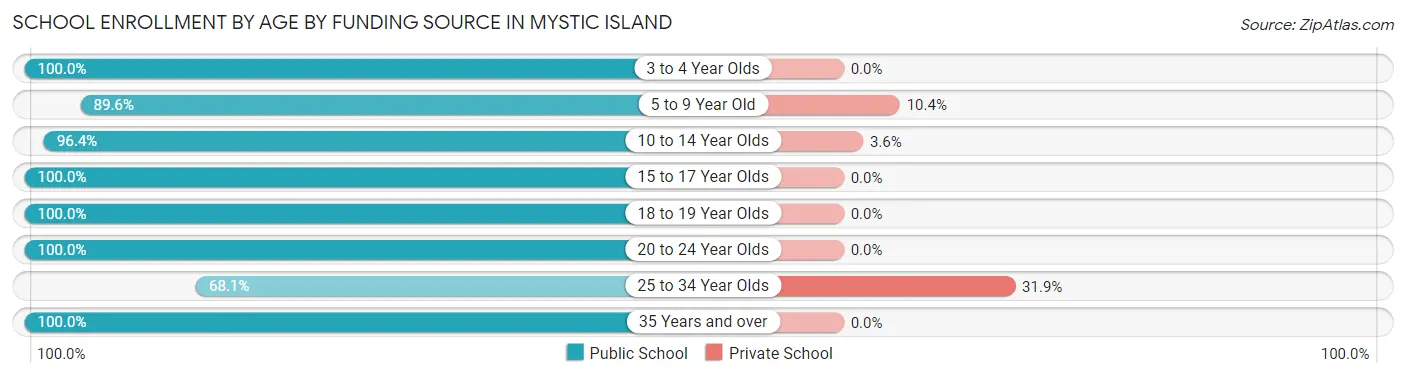
School Enrollment by Age by Funding Source in Mystic Island
Out of a total of 1,028 students who are enrolled in schools in Mystic Island, 65 (6.3%) attend a private institution, while the remaining 963 (93.7%) are enrolled in public schools. The age group of 25 to 34 year olds has the highest likelihood of being enrolled in private schools, with 23 (31.9% in the age bracket) enrolled. Conversely, the age group of 3 to 4 year olds has the lowest likelihood of being enrolled in a private school, with 76 (100.0% in the age bracket) attending a public institution.
| Age Bracket | Public School | Private School |
| 3 to 4 Year Olds | 76 (100.0%) | 0 (0.0%) |
| 5 to 9 Year Old | 283 (89.6%) | 33 (10.4%) |
| 10 to 14 Year Olds | 241 (96.4%) | 9 (3.6%) |
| 15 to 17 Year Olds | 165 (100.0%) | 0 (0.0%) |
| 18 to 19 Year Olds | 23 (100.0%) | 0 (0.0%) |
| 20 to 24 Year Olds | 54 (100.0%) | 0 (0.0%) |
| 25 to 34 Year Olds | 49 (68.1%) | 23 (31.9%) |
| 35 Years and over | 72 (100.0%) | 0 (0.0%) |
| Total | 963 (93.7%) | 65 (6.3%) |
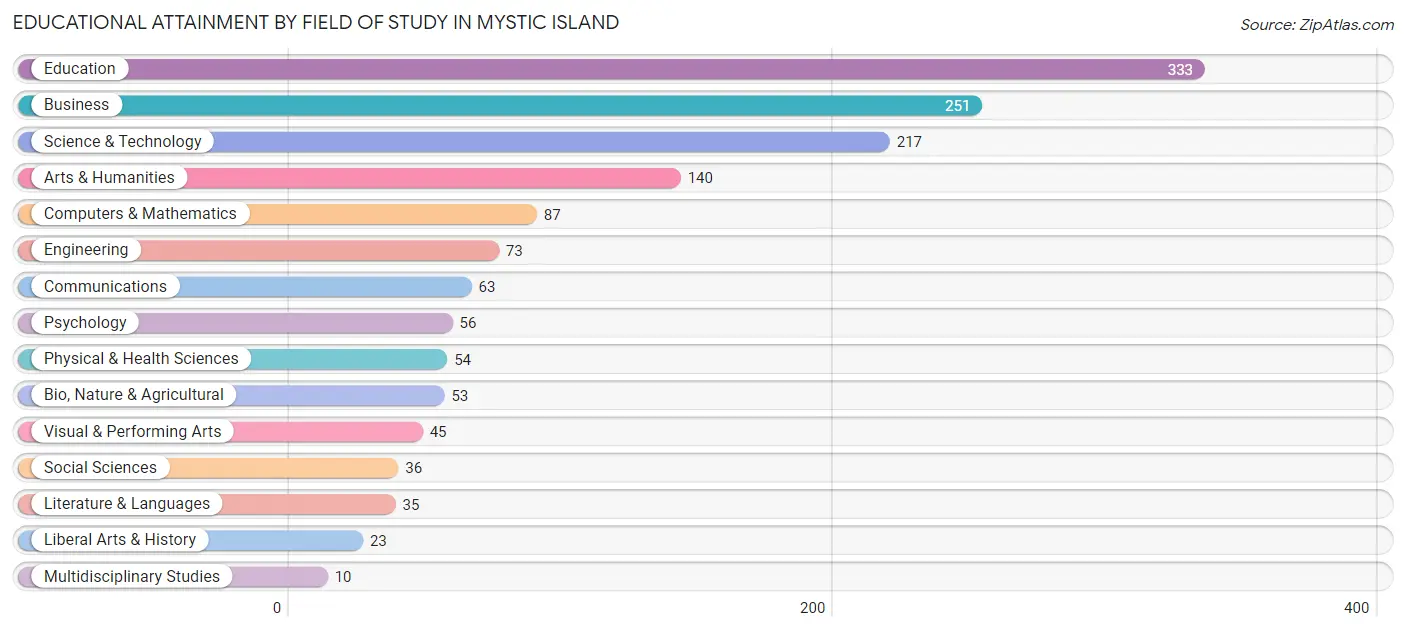
Educational Attainment by Field of Study in Mystic Island
Education (333 | 22.6%), business (251 | 17.0%), science & technology (217 | 14.7%), arts & humanities (140 | 9.5%), and computers & mathematics (87 | 5.9%) are the most common fields of study among 1,476 individuals in Mystic Island who have obtained a bachelor's degree or higher.
| Field of Study | # Graduates | % Graduates |
| Computers & Mathematics | 87 | 5.9% |
| Bio, Nature & Agricultural | 53 | 3.6% |
| Physical & Health Sciences | 54 | 3.7% |
| Psychology | 56 | 3.8% |
| Social Sciences | 36 | 2.4% |
| Engineering | 73 | 5.0% |
| Multidisciplinary Studies | 10 | 0.7% |
| Science & Technology | 217 | 14.7% |
| Business | 251 | 17.0% |
| Education | 333 | 22.6% |
| Literature & Languages | 35 | 2.4% |
| Liberal Arts & History | 23 | 1.6% |
| Visual & Performing Arts | 45 | 3.0% |
| Communications | 63 | 4.3% |
| Arts & Humanities | 140 | 9.5% |
| Total | 1,476 | 100.0% |
Transportation & Commute in Mystic Island
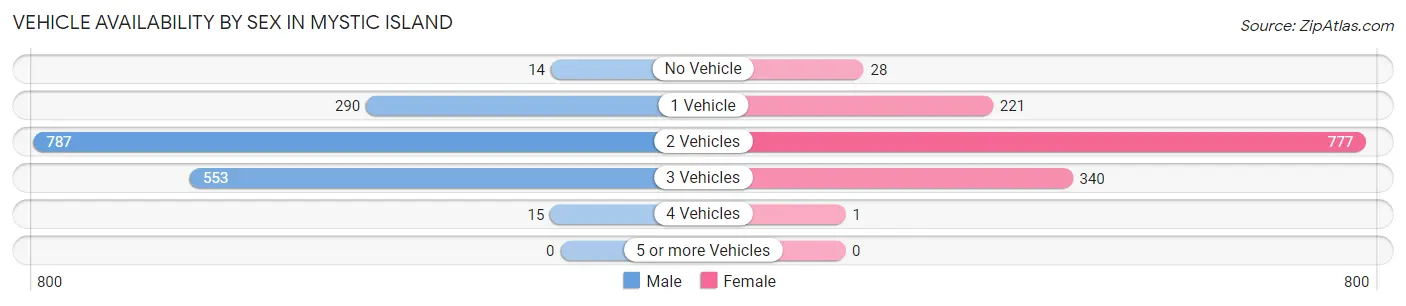
Vehicle Availability by Sex in Mystic Island
The most prevalent vehicle ownership categories in Mystic Island are males with 2 vehicles (787, accounting for 47.4%) and females with 2 vehicles (777, making up 57.6%).
| Vehicles Available | Male | Female |
| No Vehicle | 14 (0.8%) | 28 (2.1%) |
| 1 Vehicle | 290 (17.5%) | 221 (16.2%) |
| 2 Vehicles | 787 (47.4%) | 777 (56.8%) |
| 3 Vehicles | 553 (33.3%) | 340 (24.9%) |
| 4 Vehicles | 15 (0.9%) | 1 (0.1%) |
| 5 or more Vehicles | 0 (0.0%) | 0 (0.0%) |
| Total | 1,659 (100.0%) | 1,367 (100.0%) |
Commute Time in Mystic Island
The most frequently occuring commute durations in Mystic Island are 45 to 59 minutes (510 commuters, 17.7%), 30 to 34 minutes (505 commuters, 17.5%), and 90 or more minutes (289 commuters, 10.0%).
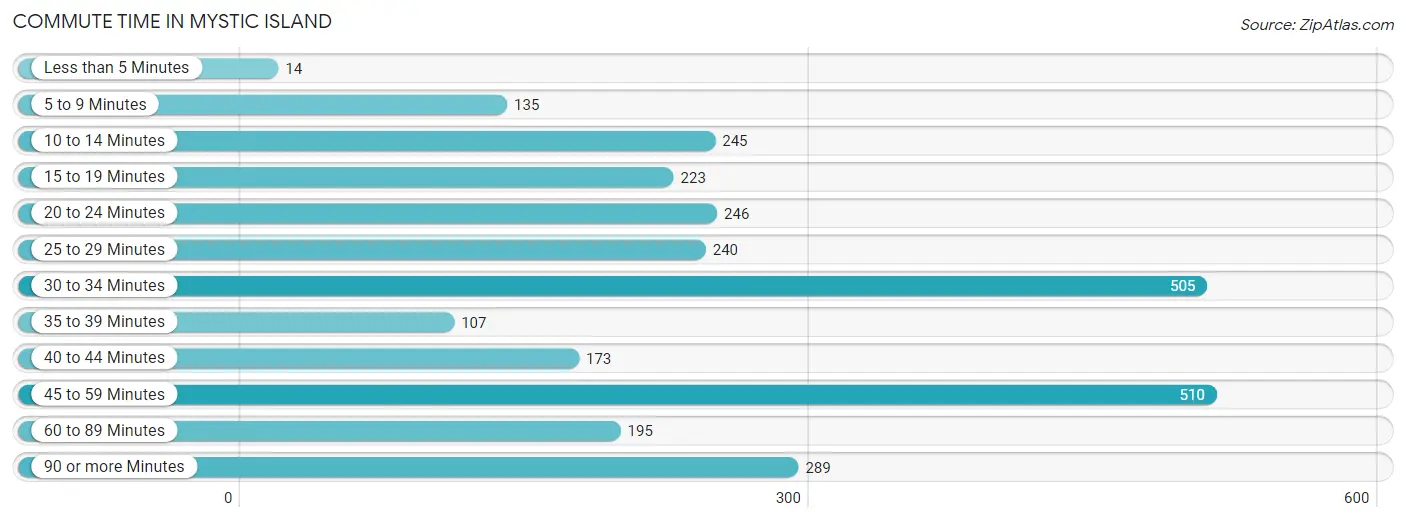
| Commute Time | # Commuters | % Commuters |
| Less than 5 Minutes | 14 | 0.5% |
| 5 to 9 Minutes | 135 | 4.7% |
| 10 to 14 Minutes | 245 | 8.5% |
| 15 to 19 Minutes | 223 | 7.7% |
| 20 to 24 Minutes | 246 | 8.5% |
| 25 to 29 Minutes | 240 | 8.3% |
| 30 to 34 Minutes | 505 | 17.5% |
| 35 to 39 Minutes | 107 | 3.7% |
| 40 to 44 Minutes | 173 | 6.0% |
| 45 to 59 Minutes | 510 | 17.7% |
| 60 to 89 Minutes | 195 | 6.8% |
| 90 or more Minutes | 289 | 10.0% |
Commute Time by Sex in Mystic Island
The most common commute times in Mystic Island are 45 to 59 minutes (372 commuters, 23.3%) for males and 30 to 34 minutes (266 commuters, 20.6%) for females.
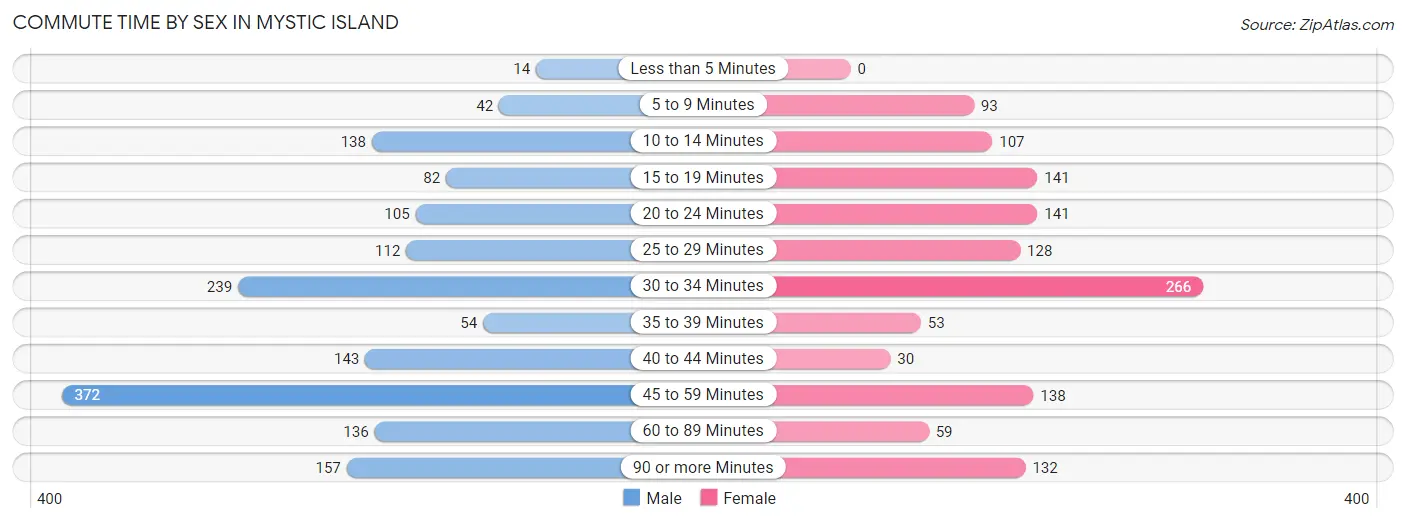
| Commute Time | Male | Female |
| Less than 5 Minutes | 14 (0.9%) | 0 (0.0%) |
| 5 to 9 Minutes | 42 (2.6%) | 93 (7.2%) |
| 10 to 14 Minutes | 138 (8.7%) | 107 (8.3%) |
| 15 to 19 Minutes | 82 (5.1%) | 141 (11.0%) |
| 20 to 24 Minutes | 105 (6.6%) | 141 (11.0%) |
| 25 to 29 Minutes | 112 (7.0%) | 128 (9.9%) |
| 30 to 34 Minutes | 239 (15.0%) | 266 (20.6%) |
| 35 to 39 Minutes | 54 (3.4%) | 53 (4.1%) |
| 40 to 44 Minutes | 143 (9.0%) | 30 (2.3%) |
| 45 to 59 Minutes | 372 (23.3%) | 138 (10.7%) |
| 60 to 89 Minutes | 136 (8.5%) | 59 (4.6%) |
| 90 or more Minutes | 157 (9.9%) | 132 (10.2%) |
Time of Departure to Work by Sex in Mystic Island
The most frequent times of departure to work in Mystic Island are 6:00 AM to 6:29 AM (281, 17.6%) for males and 8:30 AM to 8:59 AM (210, 16.3%) for females.
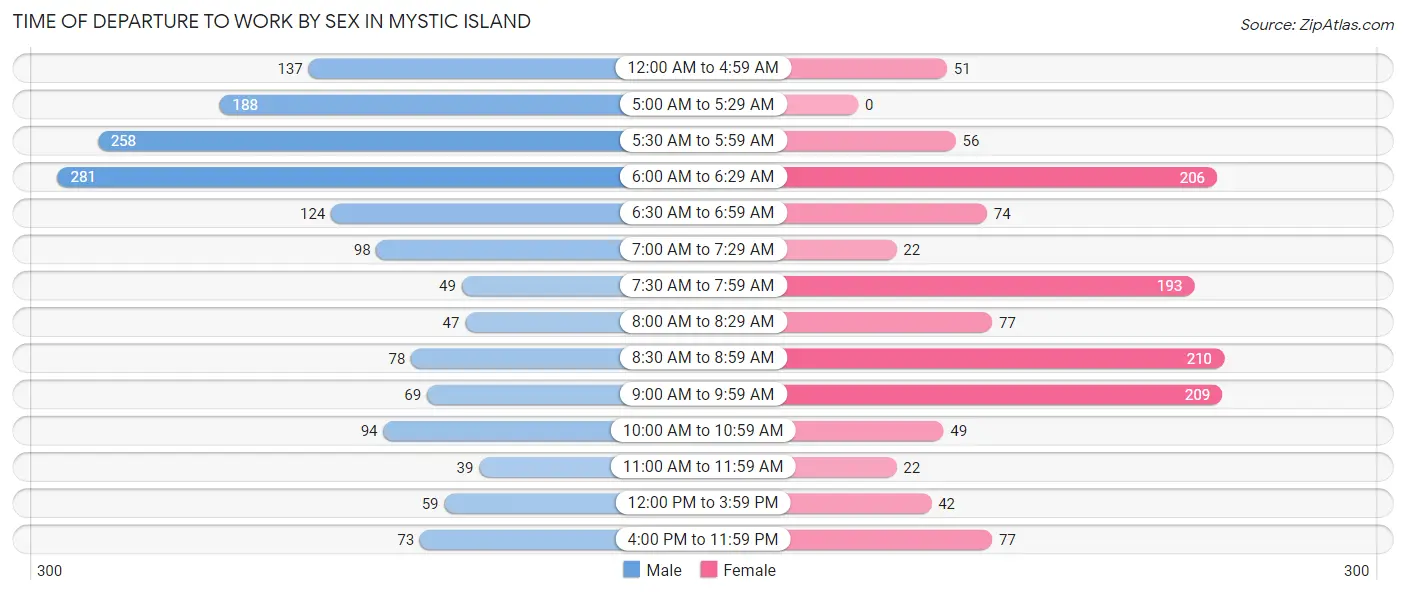
| Time of Departure | Male | Female |
| 12:00 AM to 4:59 AM | 137 (8.6%) | 51 (4.0%) |
| 5:00 AM to 5:29 AM | 188 (11.8%) | 0 (0.0%) |
| 5:30 AM to 5:59 AM | 258 (16.2%) | 56 (4.3%) |
| 6:00 AM to 6:29 AM | 281 (17.6%) | 206 (16.0%) |
| 6:30 AM to 6:59 AM | 124 (7.8%) | 74 (5.8%) |
| 7:00 AM to 7:29 AM | 98 (6.1%) | 22 (1.7%) |
| 7:30 AM to 7:59 AM | 49 (3.1%) | 193 (15.0%) |
| 8:00 AM to 8:29 AM | 47 (2.9%) | 77 (6.0%) |
| 8:30 AM to 8:59 AM | 78 (4.9%) | 210 (16.3%) |
| 9:00 AM to 9:59 AM | 69 (4.3%) | 209 (16.2%) |
| 10:00 AM to 10:59 AM | 94 (5.9%) | 49 (3.8%) |
| 11:00 AM to 11:59 AM | 39 (2.5%) | 22 (1.7%) |
| 12:00 PM to 3:59 PM | 59 (3.7%) | 42 (3.3%) |
| 4:00 PM to 11:59 PM | 73 (4.6%) | 77 (6.0%) |
| Total | 1,594 (100.0%) | 1,288 (100.0%) |
Housing Occupancy in Mystic Island
Occupancy by Ownership in Mystic Island
Of the total 3,537 dwellings in Mystic Island, owner-occupied units account for 3,183 (90.0%), while renter-occupied units make up 354 (10.0%).
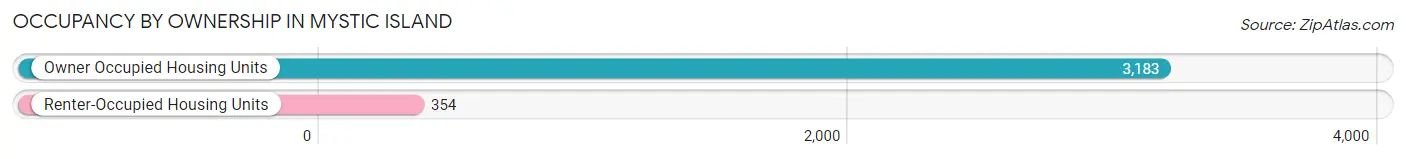
| Occupancy | # Housing Units | % Housing Units |
| Owner Occupied Housing Units | 3,183 | 90.0% |
| Renter-Occupied Housing Units | 354 | 10.0% |
| Total Occupied Housing Units | 3,537 | 100.0% |
Occupancy by Household Size in Mystic Island
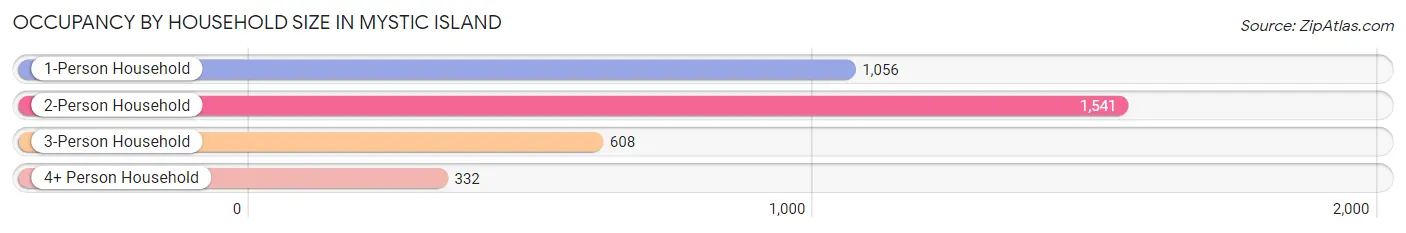
| Household Size | # Housing Units | % Housing Units |
| 1-Person Household | 1,056 | 29.9% |
| 2-Person Household | 1,541 | 43.6% |
| 3-Person Household | 608 | 17.2% |
| 4+ Person Household | 332 | 9.4% |
| Total Housing Units | 3,537 | 100.0% |
Occupancy by Ownership by Household Size in Mystic Island
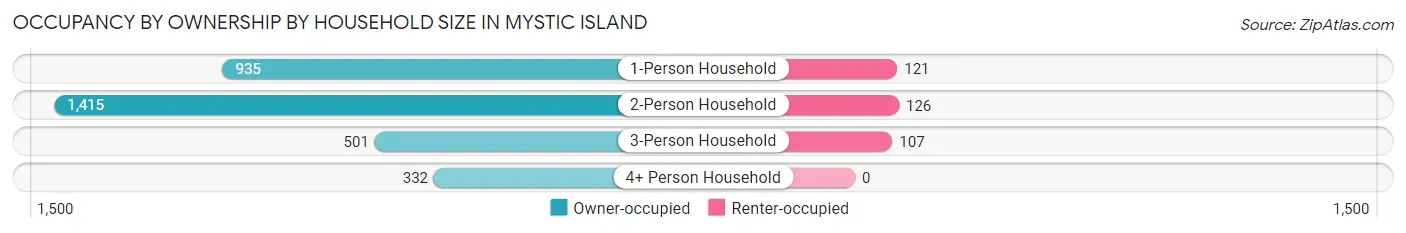
| Household Size | Owner-occupied | Renter-occupied |
| 1-Person Household | 935 (88.5%) | 121 (11.5%) |
| 2-Person Household | 1,415 (91.8%) | 126 (8.2%) |
| 3-Person Household | 501 (82.4%) | 107 (17.6%) |
| 4+ Person Household | 332 (100.0%) | 0 (0.0%) |
| Total Housing Units | 3,183 (90.0%) | 354 (10.0%) |
Occupancy by Educational Attainment in Mystic Island
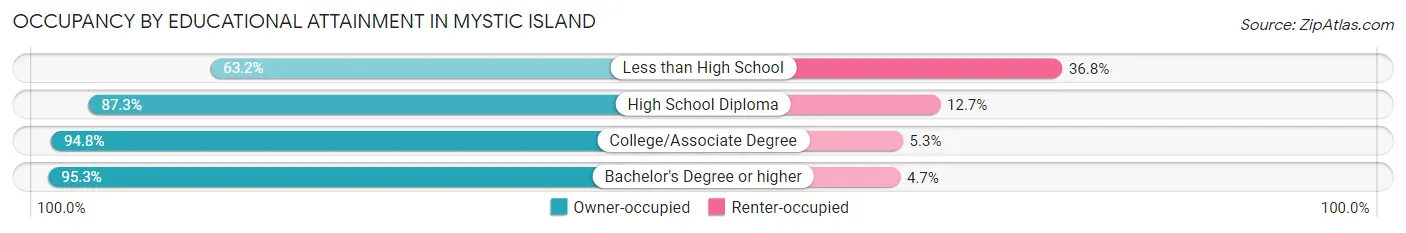
| Household Size | Owner-occupied | Renter-occupied |
| Less than High School | 120 (63.2%) | 70 (36.8%) |
| High School Diploma | 1,329 (87.3%) | 193 (12.7%) |
| College/Associate Degree | 867 (94.8%) | 48 (5.2%) |
| Bachelor's Degree or higher | 867 (95.3%) | 43 (4.7%) |
Occupancy by Age of Householder in Mystic Island
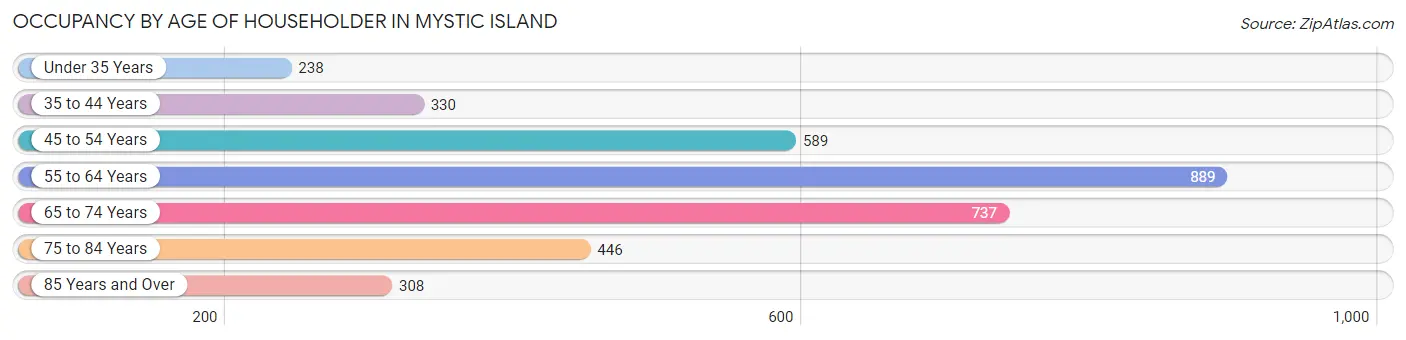
| Age Bracket | # Households | % Households |
| Under 35 Years | 238 | 6.7% |
| 35 to 44 Years | 330 | 9.3% |
| 45 to 54 Years | 589 | 16.7% |
| 55 to 64 Years | 889 | 25.1% |
| 65 to 74 Years | 737 | 20.8% |
| 75 to 84 Years | 446 | 12.6% |
| 85 Years and Over | 308 | 8.7% |
| Total | 3,537 | 100.0% |
Housing Finances in Mystic Island
Median Income by Occupancy in Mystic Island
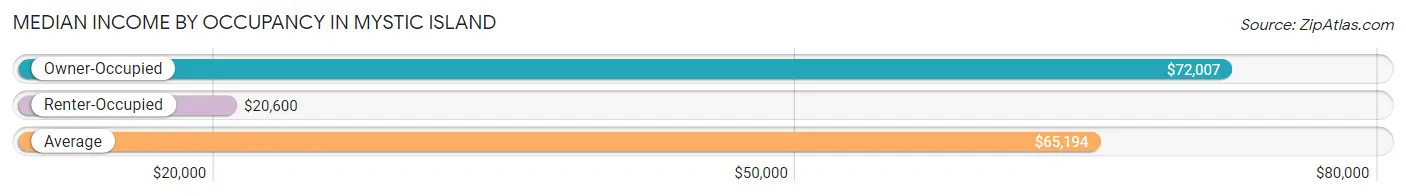
| Occupancy Type | # Households | Median Income |
| Owner-Occupied | 3,183 (90.0%) | $72,007 |
| Renter-Occupied | 354 (10.0%) | $20,600 |
| Average | 3,537 (100.0%) | $65,194 |
Occupancy by Householder Income Bracket in Mystic Island
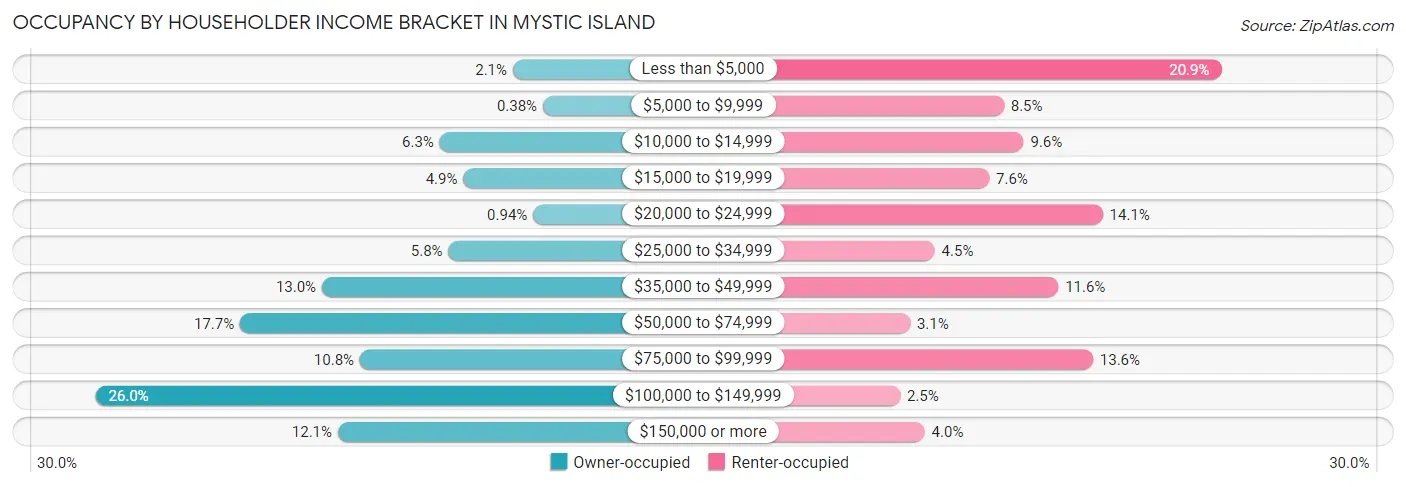
| Income Bracket | Owner-occupied | Renter-occupied |
| Less than $5,000 | 67 (2.1%) | 74 (20.9%) |
| $5,000 to $9,999 | 12 (0.4%) | 30 (8.5%) |
| $10,000 to $14,999 | 200 (6.3%) | 34 (9.6%) |
| $15,000 to $19,999 | 157 (4.9%) | 27 (7.6%) |
| $20,000 to $24,999 | 30 (0.9%) | 50 (14.1%) |
| $25,000 to $34,999 | 184 (5.8%) | 16 (4.5%) |
| $35,000 to $49,999 | 414 (13.0%) | 41 (11.6%) |
| $50,000 to $74,999 | 563 (17.7%) | 11 (3.1%) |
| $75,000 to $99,999 | 345 (10.8%) | 48 (13.6%) |
| $100,000 to $149,999 | 826 (26.0%) | 9 (2.5%) |
| $150,000 or more | 385 (12.1%) | 14 (4.0%) |
| Total | 3,183 (100.0%) | 354 (100.0%) |
Monthly Housing Cost Tiers in Mystic Island
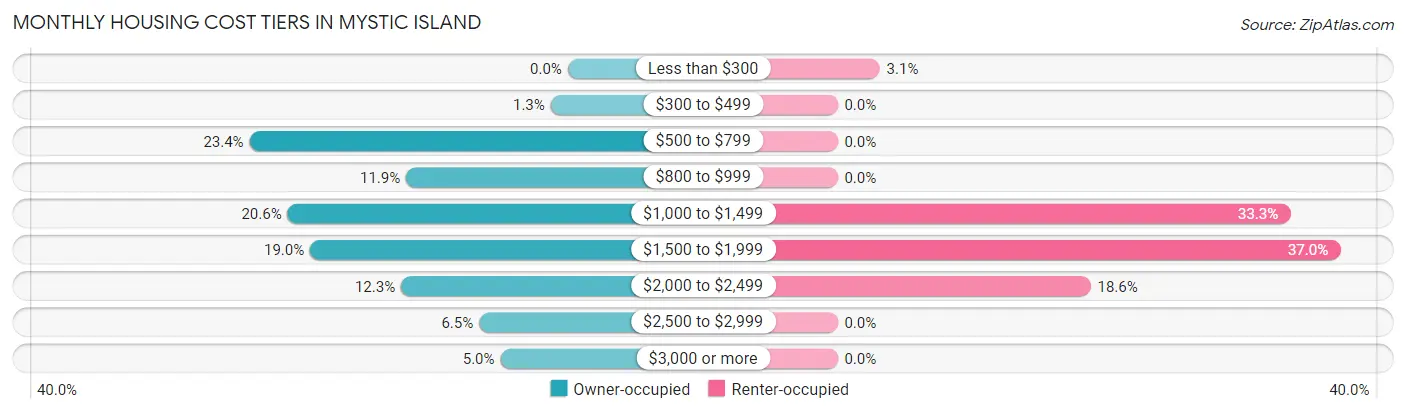
| Monthly Cost | Owner-occupied | Renter-occupied |
| Less than $300 | 0 (0.0%) | 11 (3.1%) |
| $300 to $499 | 40 (1.3%) | 0 (0.0%) |
| $500 to $799 | 746 (23.4%) | 0 (0.0%) |
| $800 to $999 | 379 (11.9%) | 0 (0.0%) |
| $1,000 to $1,499 | 657 (20.6%) | 118 (33.3%) |
| $1,500 to $1,999 | 604 (19.0%) | 131 (37.0%) |
| $2,000 to $2,499 | 391 (12.3%) | 66 (18.6%) |
| $2,500 to $2,999 | 208 (6.5%) | 0 (0.0%) |
| $3,000 or more | 158 (5.0%) | 0 (0.0%) |
| Total | 3,183 (100.0%) | 354 (100.0%) |
Physical Housing Characteristics in Mystic Island
Housing Structures in Mystic Island
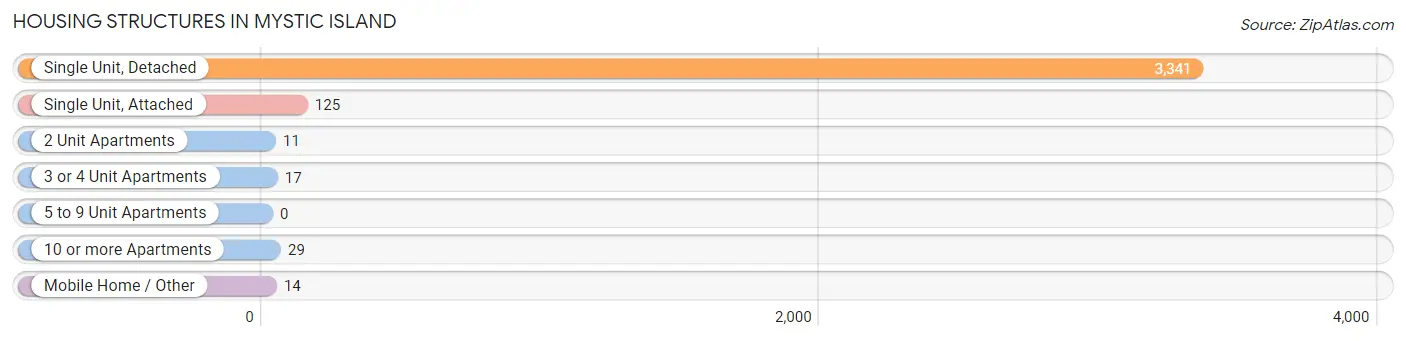
| Structure Type | # Housing Units | % Housing Units |
| Single Unit, Detached | 3,341 | 94.5% |
| Single Unit, Attached | 125 | 3.5% |
| 2 Unit Apartments | 11 | 0.3% |
| 3 or 4 Unit Apartments | 17 | 0.5% |
| 5 to 9 Unit Apartments | 0 | 0.0% |
| 10 or more Apartments | 29 | 0.8% |
| Mobile Home / Other | 14 | 0.4% |
| Total | 3,537 | 100.0% |
Housing Structures by Occupancy in Mystic Island
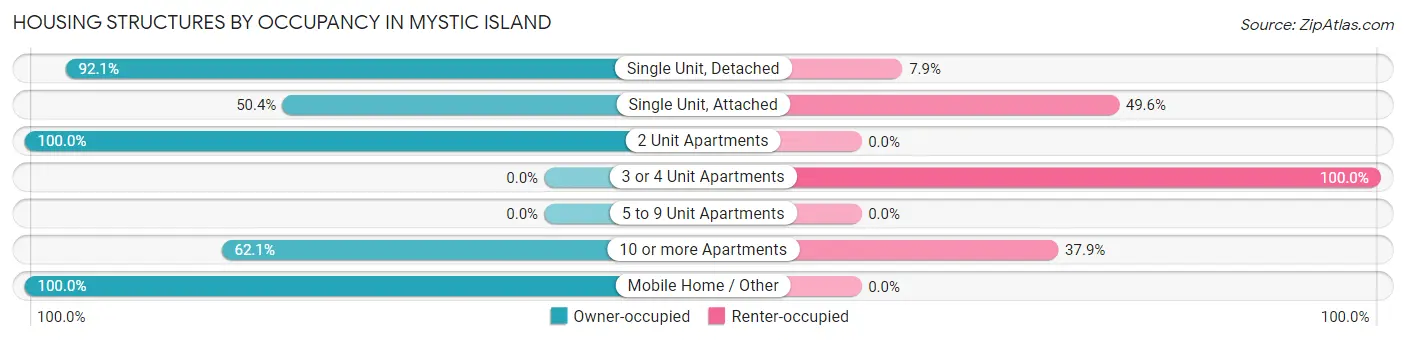
| Structure Type | Owner-occupied | Renter-occupied |
| Single Unit, Detached | 3,077 (92.1%) | 264 (7.9%) |
| Single Unit, Attached | 63 (50.4%) | 62 (49.6%) |
| 2 Unit Apartments | 11 (100.0%) | 0 (0.0%) |
| 3 or 4 Unit Apartments | 0 (0.0%) | 17 (100.0%) |
| 5 to 9 Unit Apartments | 0 (0.0%) | 0 (0.0%) |
| 10 or more Apartments | 18 (62.1%) | 11 (37.9%) |
| Mobile Home / Other | 14 (100.0%) | 0 (0.0%) |
| Total | 3,183 (90.0%) | 354 (10.0%) |
Housing Structures by Number of Rooms in Mystic Island
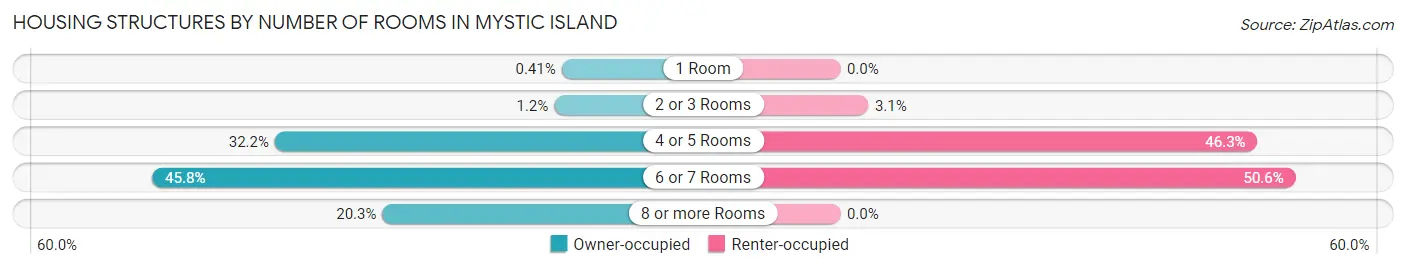
| Number of Rooms | Owner-occupied | Renter-occupied |
| 1 Room | 13 (0.4%) | 0 (0.0%) |
| 2 or 3 Rooms | 39 (1.2%) | 11 (3.1%) |
| 4 or 5 Rooms | 1,026 (32.2%) | 164 (46.3%) |
| 6 or 7 Rooms | 1,459 (45.8%) | 179 (50.6%) |
| 8 or more Rooms | 646 (20.3%) | 0 (0.0%) |
| Total | 3,183 (100.0%) | 354 (100.0%) |
Housing Structure by Heating Type in Mystic Island
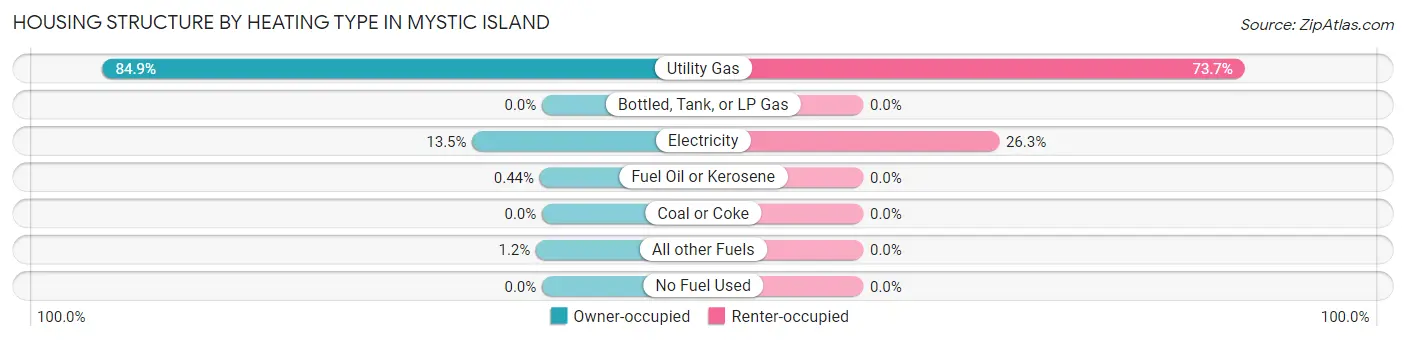
| Heating Type | Owner-occupied | Renter-occupied |
| Utility Gas | 2,703 (84.9%) | 261 (73.7%) |
| Bottled, Tank, or LP Gas | 0 (0.0%) | 0 (0.0%) |
| Electricity | 429 (13.5%) | 93 (26.3%) |
| Fuel Oil or Kerosene | 14 (0.4%) | 0 (0.0%) |
| Coal or Coke | 0 (0.0%) | 0 (0.0%) |
| All other Fuels | 37 (1.2%) | 0 (0.0%) |
| No Fuel Used | 0 (0.0%) | 0 (0.0%) |
| Total | 3,183 (100.0%) | 354 (100.0%) |
Household Vehicle Usage in Mystic Island
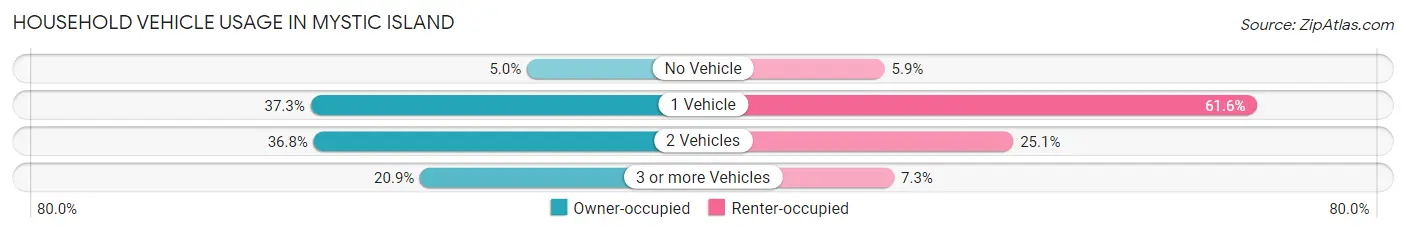
| Vehicles per Household | Owner-occupied | Renter-occupied |
| No Vehicle | 158 (5.0%) | 21 (5.9%) |
| 1 Vehicle | 1,187 (37.3%) | 218 (61.6%) |
| 2 Vehicles | 1,172 (36.8%) | 89 (25.1%) |
| 3 or more Vehicles | 666 (20.9%) | 26 (7.3%) |
| Total | 3,183 (100.0%) | 354 (100.0%) |
Real Estate & Mortgages in Mystic Island
Real Estate and Mortgage Overview in Mystic Island
| Characteristic | Without Mortgage | With Mortgage |
| Housing Units | 1,400 | 1,783 |
| Median Property Value | $242,000 | $283,600 |
| Median Household Income | $51,154 | $280 |
| Monthly Housing Costs | $781 | $158 |
| Real Estate Taxes | $4,751 | $0 |
Property Value by Mortgage Status in Mystic Island
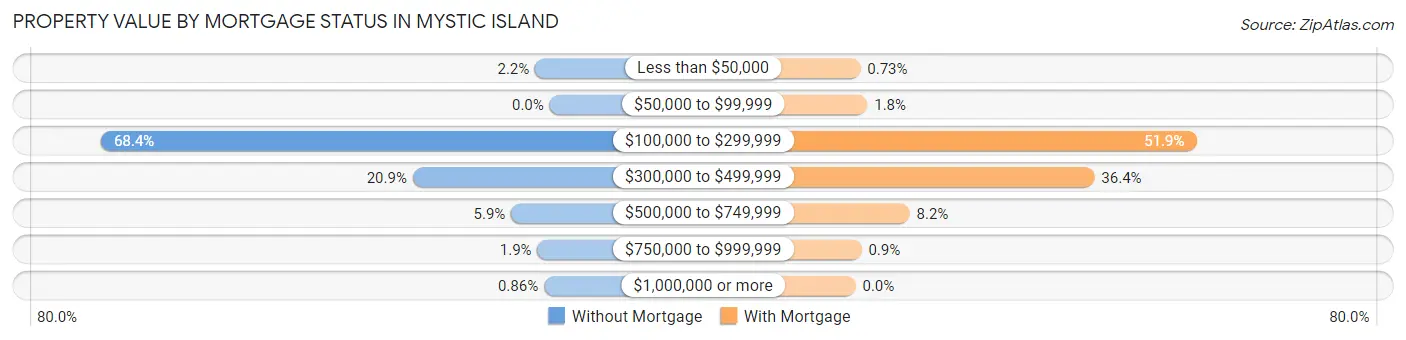
| Property Value | Without Mortgage | With Mortgage |
| Less than $50,000 | 31 (2.2%) | 13 (0.7%) |
| $50,000 to $99,999 | 0 (0.0%) | 32 (1.8%) |
| $100,000 to $299,999 | 957 (68.4%) | 926 (51.9%) |
| $300,000 to $499,999 | 292 (20.9%) | 649 (36.4%) |
| $500,000 to $749,999 | 82 (5.9%) | 147 (8.2%) |
| $750,000 to $999,999 | 26 (1.9%) | 16 (0.9%) |
| $1,000,000 or more | 12 (0.9%) | 0 (0.0%) |
| Total | 1,400 (100.0%) | 1,783 (100.0%) |
Household Income by Mortgage Status in Mystic Island
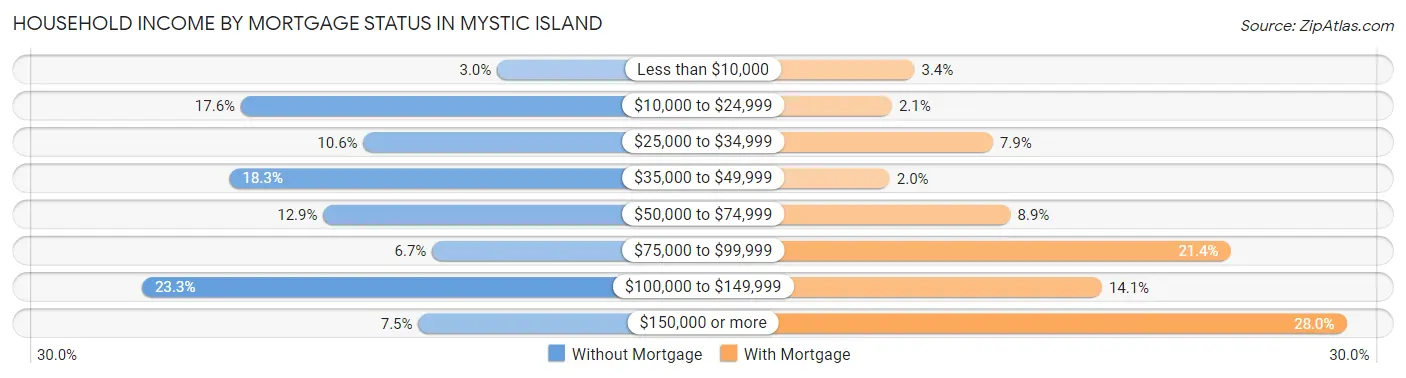
| Household Income | Without Mortgage | With Mortgage |
| Less than $10,000 | 42 (3.0%) | 60 (3.4%) |
| $10,000 to $24,999 | 247 (17.6%) | 37 (2.1%) |
| $25,000 to $34,999 | 149 (10.6%) | 140 (7.9%) |
| $35,000 to $49,999 | 256 (18.3%) | 35 (2.0%) |
| $50,000 to $74,999 | 181 (12.9%) | 158 (8.9%) |
| $75,000 to $99,999 | 94 (6.7%) | 382 (21.4%) |
| $100,000 to $149,999 | 326 (23.3%) | 251 (14.1%) |
| $150,000 or more | 105 (7.5%) | 500 (28.0%) |
| Total | 1,400 (100.0%) | 1,783 (100.0%) |
Property Value to Household Income Ratio in Mystic Island
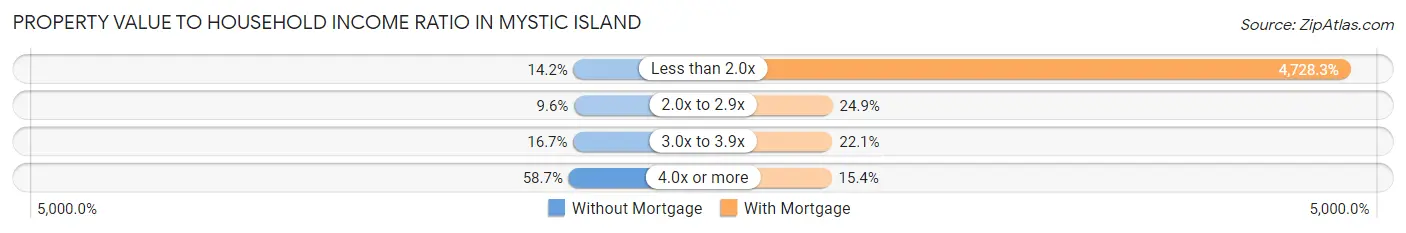
| Value-to-Income Ratio | Without Mortgage | With Mortgage |
| Less than 2.0x | 199 (14.2%) | 84,306 (4,728.3%) |
| 2.0x to 2.9x | 134 (9.6%) | 444 (24.9%) |
| 3.0x to 3.9x | 234 (16.7%) | 394 (22.1%) |
| 4.0x or more | 822 (58.7%) | 275 (15.4%) |
| Total | 1,400 (100.0%) | 1,783 (100.0%) |
Real Estate Taxes by Mortgage Status in Mystic Island
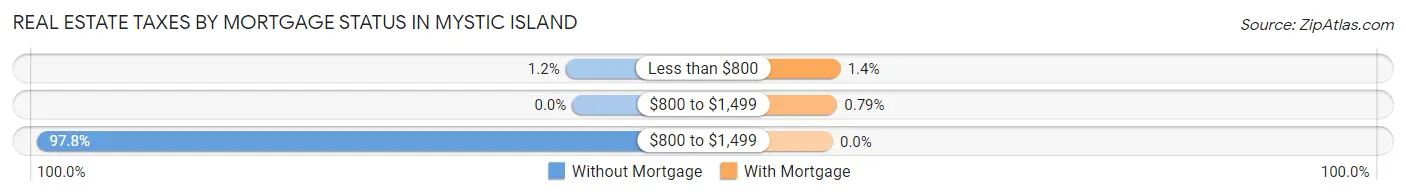
| Property Taxes | Without Mortgage | With Mortgage |
| Less than $800 | 17 (1.2%) | 25 (1.4%) |
| $800 to $1,499 | 0 (0.0%) | 14 (0.8%) |
| $800 to $1,499 | 1,369 (97.8%) | 0 (0.0%) |
| Total | 1,400 (100.0%) | 1,783 (100.0%) |
Health & Disability in Mystic Island
Health Insurance Coverage by Age in Mystic Island
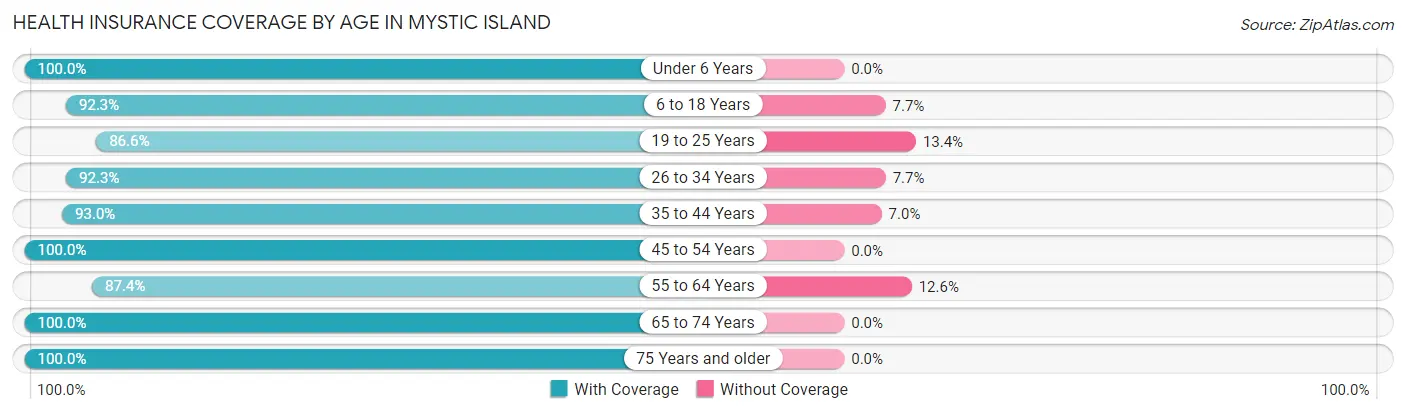
| Age Bracket | With Coverage | Without Coverage |
| Under 6 Years | 261 (100.0%) | 0 (0.0%) |
| 6 to 18 Years | 695 (92.3%) | 58 (7.7%) |
| 19 to 25 Years | 201 (86.6%) | 31 (13.4%) |
| 26 to 34 Years | 430 (92.3%) | 36 (7.7%) |
| 35 to 44 Years | 827 (93.0%) | 62 (7.0%) |
| 45 to 54 Years | 769 (100.0%) | 0 (0.0%) |
| 55 to 64 Years | 1,550 (87.4%) | 223 (12.6%) |
| 65 to 74 Years | 1,251 (100.0%) | 0 (0.0%) |
| 75 Years and older | 1,134 (100.0%) | 0 (0.0%) |
| Total | 7,118 (94.6%) | 410 (5.4%) |
Health Insurance Coverage by Citizenship Status in Mystic Island
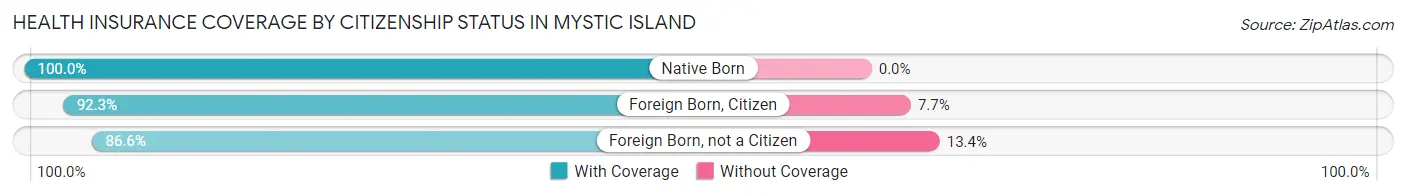
| Citizenship Status | With Coverage | Without Coverage |
| Native Born | 261 (100.0%) | 0 (0.0%) |
| Foreign Born, Citizen | 695 (92.3%) | 58 (7.7%) |
| Foreign Born, not a Citizen | 201 (86.6%) | 31 (13.4%) |
Health Insurance Coverage by Household Income in Mystic Island
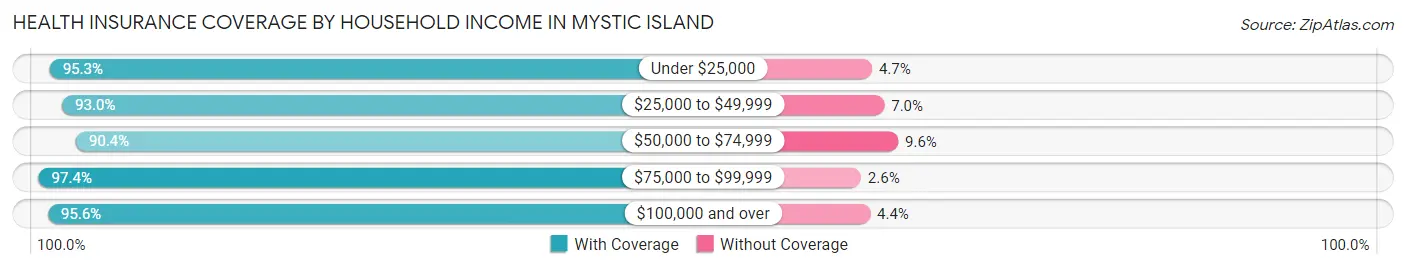
| Household Income | With Coverage | Without Coverage |
| Under $25,000 | 1,092 (95.3%) | 54 (4.7%) |
| $25,000 to $49,999 | 1,165 (93.0%) | 88 (7.0%) |
| $50,000 to $74,999 | 1,054 (90.4%) | 112 (9.6%) |
| $75,000 to $99,999 | 848 (97.4%) | 23 (2.6%) |
| $100,000 and over | 2,913 (95.6%) | 133 (4.4%) |
Public vs Private Health Insurance Coverage by Age in Mystic Island
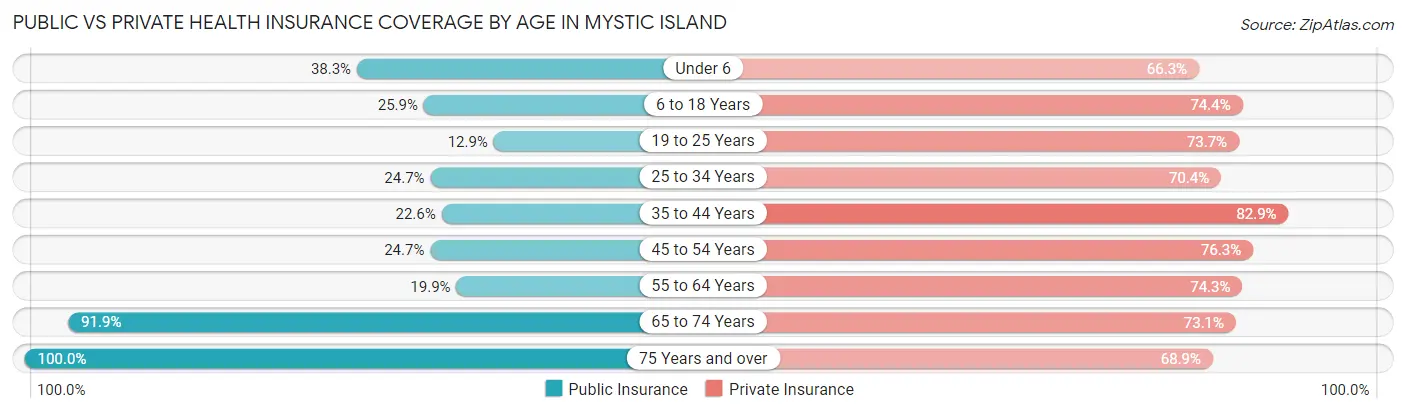
| Age Bracket | Public Insurance | Private Insurance |
| Under 6 | 100 (38.3%) | 173 (66.3%) |
| 6 to 18 Years | 195 (25.9%) | 560 (74.4%) |
| 19 to 25 Years | 30 (12.9%) | 171 (73.7%) |
| 25 to 34 Years | 115 (24.7%) | 328 (70.4%) |
| 35 to 44 Years | 201 (22.6%) | 737 (82.9%) |
| 45 to 54 Years | 190 (24.7%) | 587 (76.3%) |
| 55 to 64 Years | 352 (19.9%) | 1,318 (74.3%) |
| 65 to 74 Years | 1,150 (91.9%) | 915 (73.1%) |
| 75 Years and over | 1,134 (100.0%) | 781 (68.9%) |
| Total | 3,467 (46.1%) | 5,570 (74.0%) |
Disability Status by Sex by Age in Mystic Island
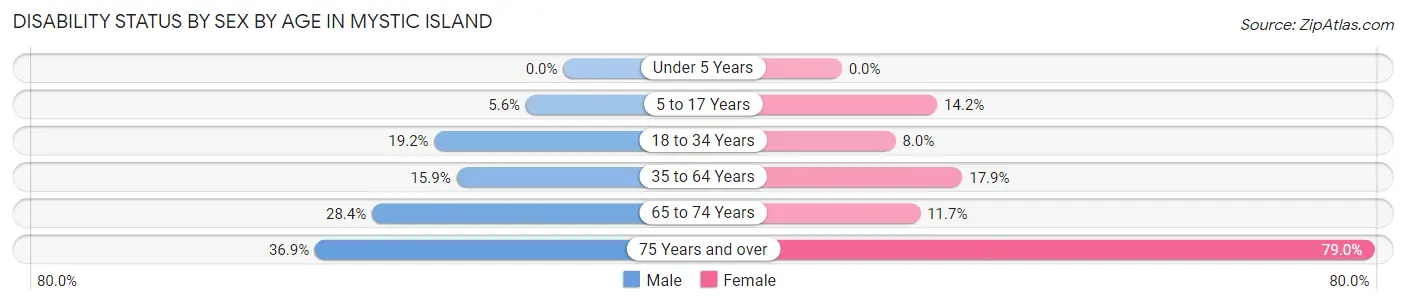
| Age Bracket | Male | Female |
| Under 5 Years | 0 (0.0%) | 0 (0.0%) |
| 5 to 17 Years | 19 (5.6%) | 64 (14.2%) |
| 18 to 34 Years | 81 (19.2%) | 26 (8.0%) |
| 35 to 64 Years | 260 (15.9%) | 321 (17.9%) |
| 65 to 74 Years | 175 (28.4%) | 74 (11.7%) |
| 75 Years and over | 142 (36.9%) | 592 (79.0%) |
Disability Class by Sex by Age in Mystic Island
Disability Class: Hearing Difficulty
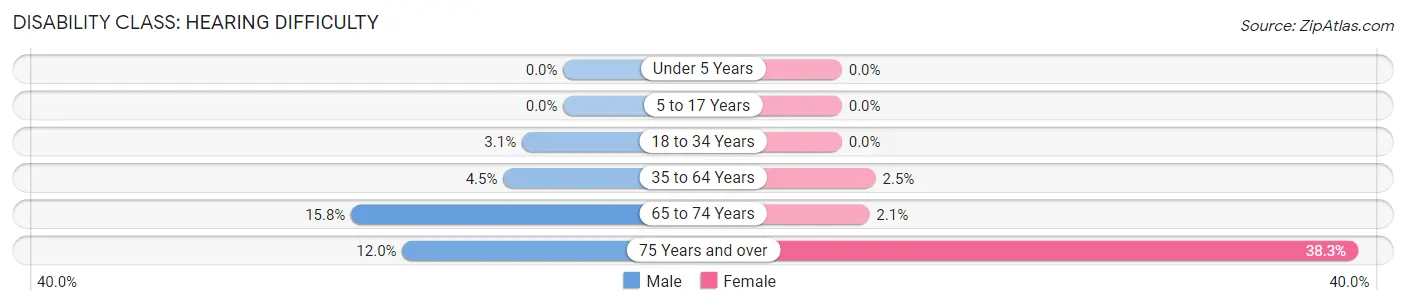
| Age Bracket | Male | Female |
| Under 5 Years | 0 (0.0%) | 0 (0.0%) |
| 5 to 17 Years | 0 (0.0%) | 0 (0.0%) |
| 18 to 34 Years | 13 (3.1%) | 0 (0.0%) |
| 35 to 64 Years | 73 (4.5%) | 45 (2.5%) |
| 65 to 74 Years | 97 (15.8%) | 13 (2.1%) |
| 75 Years and over | 46 (11.9%) | 287 (38.3%) |
Disability Class: Vision Difficulty
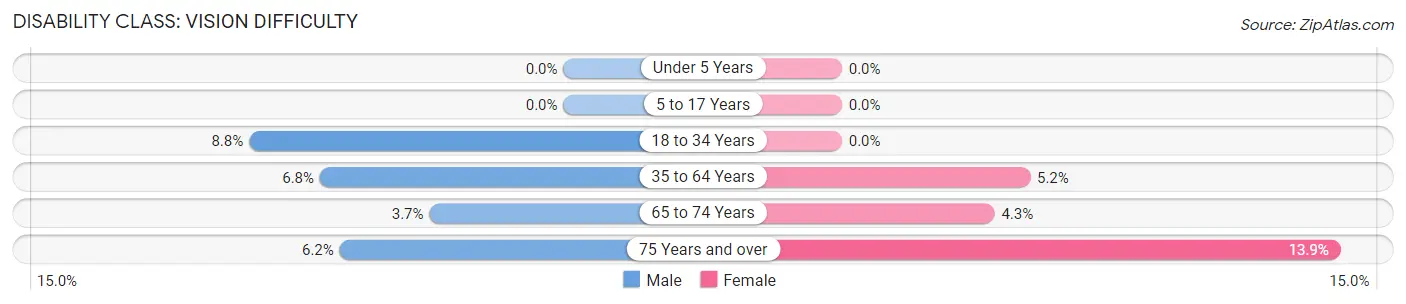
| Age Bracket | Male | Female |
| Under 5 Years | 0 (0.0%) | 0 (0.0%) |
| 5 to 17 Years | 0 (0.0%) | 0 (0.0%) |
| 18 to 34 Years | 37 (8.7%) | 0 (0.0%) |
| 35 to 64 Years | 111 (6.8%) | 94 (5.2%) |
| 65 to 74 Years | 23 (3.7%) | 27 (4.3%) |
| 75 Years and over | 24 (6.2%) | 104 (13.9%) |
Disability Class: Cognitive Difficulty
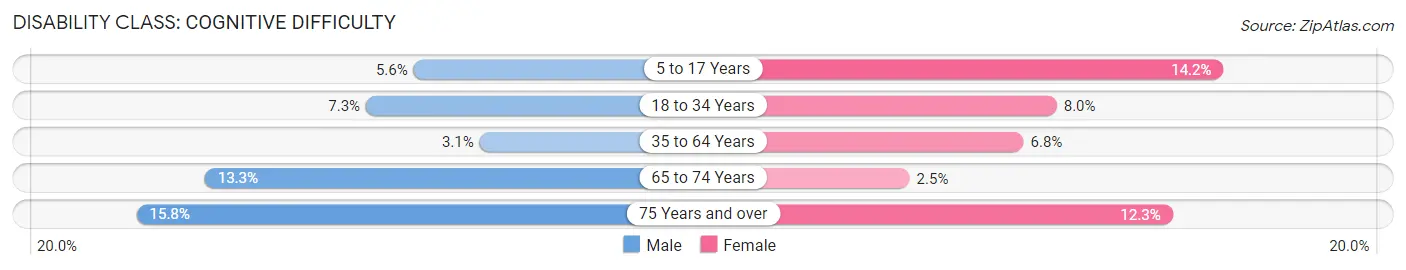
| Age Bracket | Male | Female |
| 5 to 17 Years | 19 (5.6%) | 64 (14.2%) |
| 18 to 34 Years | 31 (7.3%) | 26 (8.0%) |
| 35 to 64 Years | 51 (3.1%) | 121 (6.8%) |
| 65 to 74 Years | 82 (13.3%) | 16 (2.5%) |
| 75 Years and over | 61 (15.8%) | 92 (12.3%) |
Disability Class: Ambulatory Difficulty
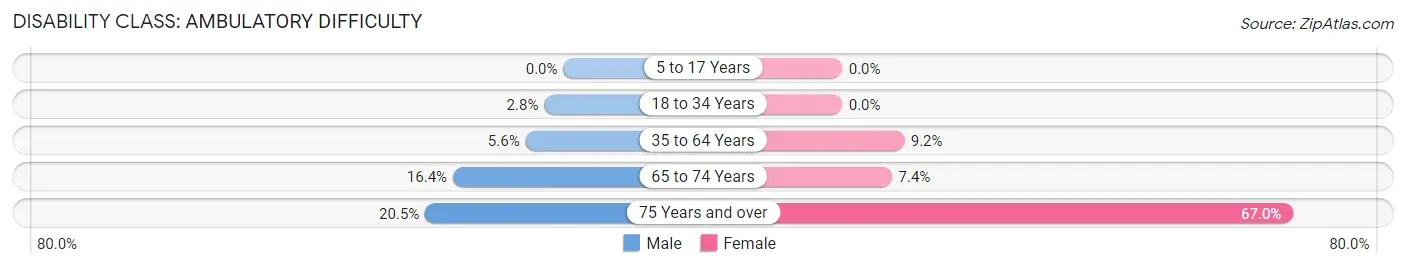
| Age Bracket | Male | Female |
| 5 to 17 Years | 0 (0.0%) | 0 (0.0%) |
| 18 to 34 Years | 12 (2.8%) | 0 (0.0%) |
| 35 to 64 Years | 92 (5.6%) | 165 (9.2%) |
| 65 to 74 Years | 101 (16.4%) | 47 (7.4%) |
| 75 Years and over | 79 (20.5%) | 502 (67.0%) |
Disability Class: Self-Care Difficulty
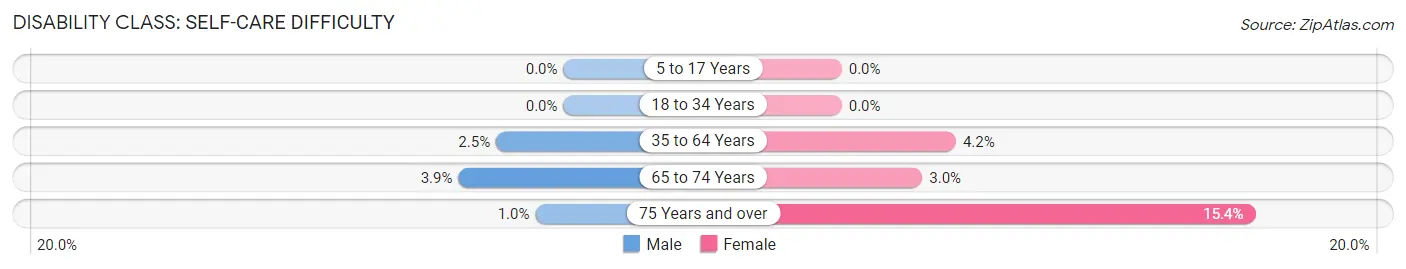
| Age Bracket | Male | Female |
| 5 to 17 Years | 0 (0.0%) | 0 (0.0%) |
| 18 to 34 Years | 0 (0.0%) | 0 (0.0%) |
| 35 to 64 Years | 41 (2.5%) | 76 (4.2%) |
| 65 to 74 Years | 24 (3.9%) | 19 (3.0%) |
| 75 Years and over | 4 (1.0%) | 115 (15.3%) |
Technology Access in Mystic Island
Computing Device Access in Mystic Island
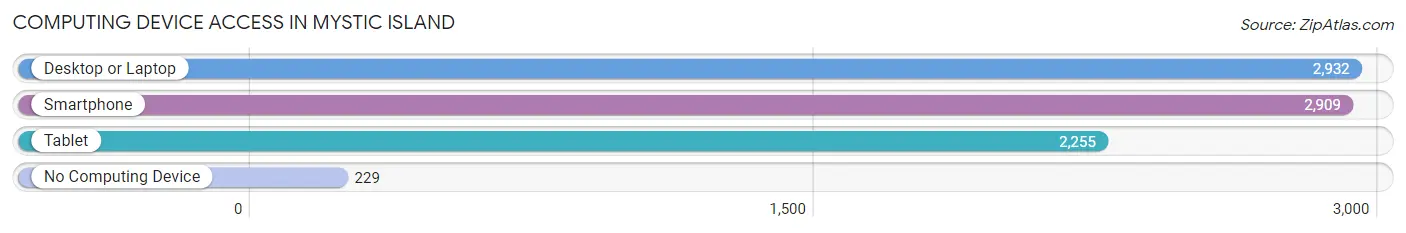
| Device Type | # Households | % Households |
| Desktop or Laptop | 2,932 | 82.9% |
| Smartphone | 2,909 | 82.2% |
| Tablet | 2,255 | 63.7% |
| No Computing Device | 229 | 6.5% |
| Total | 3,537 | 100.0% |
Internet Access in Mystic Island
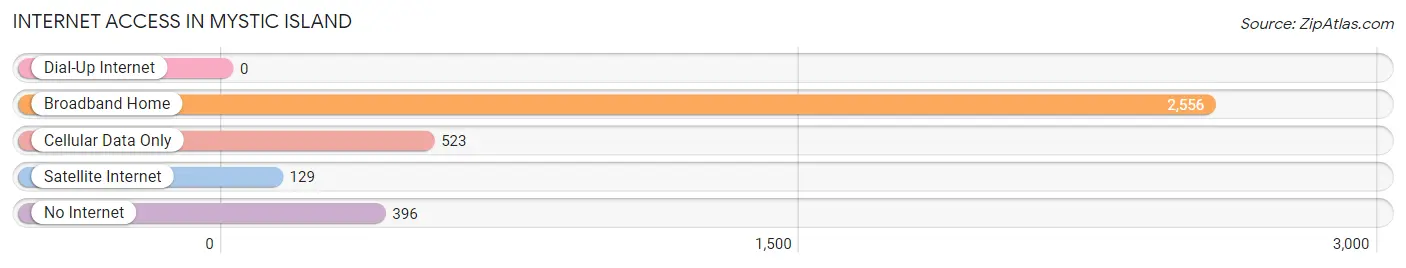
| Internet Type | # Households | % Households |
| Dial-Up Internet | 0 | 0.0% |
| Broadband Home | 2,556 | 72.3% |
| Cellular Data Only | 523 | 14.8% |
| Satellite Internet | 129 | 3.6% |
| No Internet | 396 | 11.2% |
| Total | 3,537 | 100.0% |
Mystic Island Summary
Mystic Island is a small unincorporated community located in Ocean County, New Jersey. It is situated on the Barnegat Bay, a part of the Atlantic Ocean, and is part of the Toms River Township. The community is located approximately 50 miles south of New York City and is a popular destination for vacationers and retirees.
History
Mystic Island was originally inhabited by the Lenape Native Americans. The area was first settled by Europeans in the late 17th century, when it was part of the Township of Dover. The area was known as “Mystic Island” by the early 19th century, and the name was officially adopted in 1891.
The area was primarily used for farming and fishing until the 1950s, when it began to be developed as a residential community. The first homes were built in the 1950s, and the population of Mystic Island has grown steadily since then.
Geography
Mystic Island is located in Ocean County, New Jersey, on the Barnegat Bay. It is part of the Toms River Township and is approximately 50 miles south of New York City. The area is bordered by the towns of Little Egg Harbor, Tuckerton, and Beach Haven.
The area is mostly flat, with some low hills and wetlands. The climate is humid subtropical, with hot, humid summers and mild winters.
Economy
Mystic Island is primarily a residential community, with most of its residents employed in nearby towns and cities. The area is also home to a number of small businesses, including restaurants, convenience stores, and marinas.
The area is also popular with vacationers and retirees, and there are a number of vacation rental properties in the area.
Demographics
As of the 2010 census, the population of Mystic Island was 8,493. The population is primarily white (90.2%), with a small percentage of African Americans (3.2%) and Hispanics (2.7%). The median household income is $68,944, and the median home value is $269,000.
The area is served by the Toms River Regional School District, which includes seven elementary schools, two middle schools, and one high school. The area is also home to a number of churches, including the Mystic Island United Methodist Church and the St. Thomas Episcopal Church.
Conclusion
Mystic Island is a small unincorporated community located in Ocean County, New Jersey. It is situated on the Barnegat Bay, a part of the Atlantic Ocean, and is part of the Toms River Township. The area was originally inhabited by the Lenape Native Americans and was first settled by Europeans in the late 17th century. The area is primarily residential, with most of its residents employed in nearby towns and cities. The population of Mystic Island is primarily white, with a median household income of $68,944 and a median home value of $269,000. The area is served by the Toms River Regional School District and is home to a number of churches. Mystic Island is a popular destination for vacationers and retirees, and is home to a number of small businesses.
Common Questions
What is Per Capita Income in Mystic Island?
Per Capita income in Mystic Island is $38,091.
What is the Median Family Income in Mystic Island?
Median Family Income in Mystic Island is $85,172.
What is the Median Household income in Mystic Island?
Median Household Income in Mystic Island is $65,194.
What is Income or Wage Gap in Mystic Island?
Income or Wage Gap in Mystic Island is 44.7%.
Women in Mystic Island earn 55.3 cents for every dollar earned by a man.
What is Inequality or Gini Index in Mystic Island?
Inequality or Gini Index in Mystic Island is 0.42.
What is the Total Population of Mystic Island?
Total Population of Mystic Island is 7,635.
What is the Total Male Population of Mystic Island?
Total Male Population of Mystic Island is 3,557.
What is the Total Female Population of Mystic Island?
Total Female Population of Mystic Island is 4,078.
What is the Ratio of Males per 100 Females in Mystic Island?
There are 87.22 Males per 100 Females in Mystic Island.
What is the Ratio of Females per 100 Males in Mystic Island?
There are 114.65 Females per 100 Males in Mystic Island.
What is the Median Population Age in Mystic Island?
Median Population Age in Mystic Island is 58.6 Years.
What is the Average Family Size in Mystic Island
Average Family Size in Mystic Island is 2.5 People.
What is the Average Household Size in Mystic Island
Average Household Size in Mystic Island is 2.1 People.
How Large is the Labor Force in Mystic Island?
There are 3,437 People in the Labor Forcein in Mystic Island.
What is the Percentage of People in the Labor Force in Mystic Island?
50.8% of People are in the Labor Force in Mystic Island.
What is the Unemployment Rate in Mystic Island?
Unemployment Rate in Mystic Island is 7.6%.