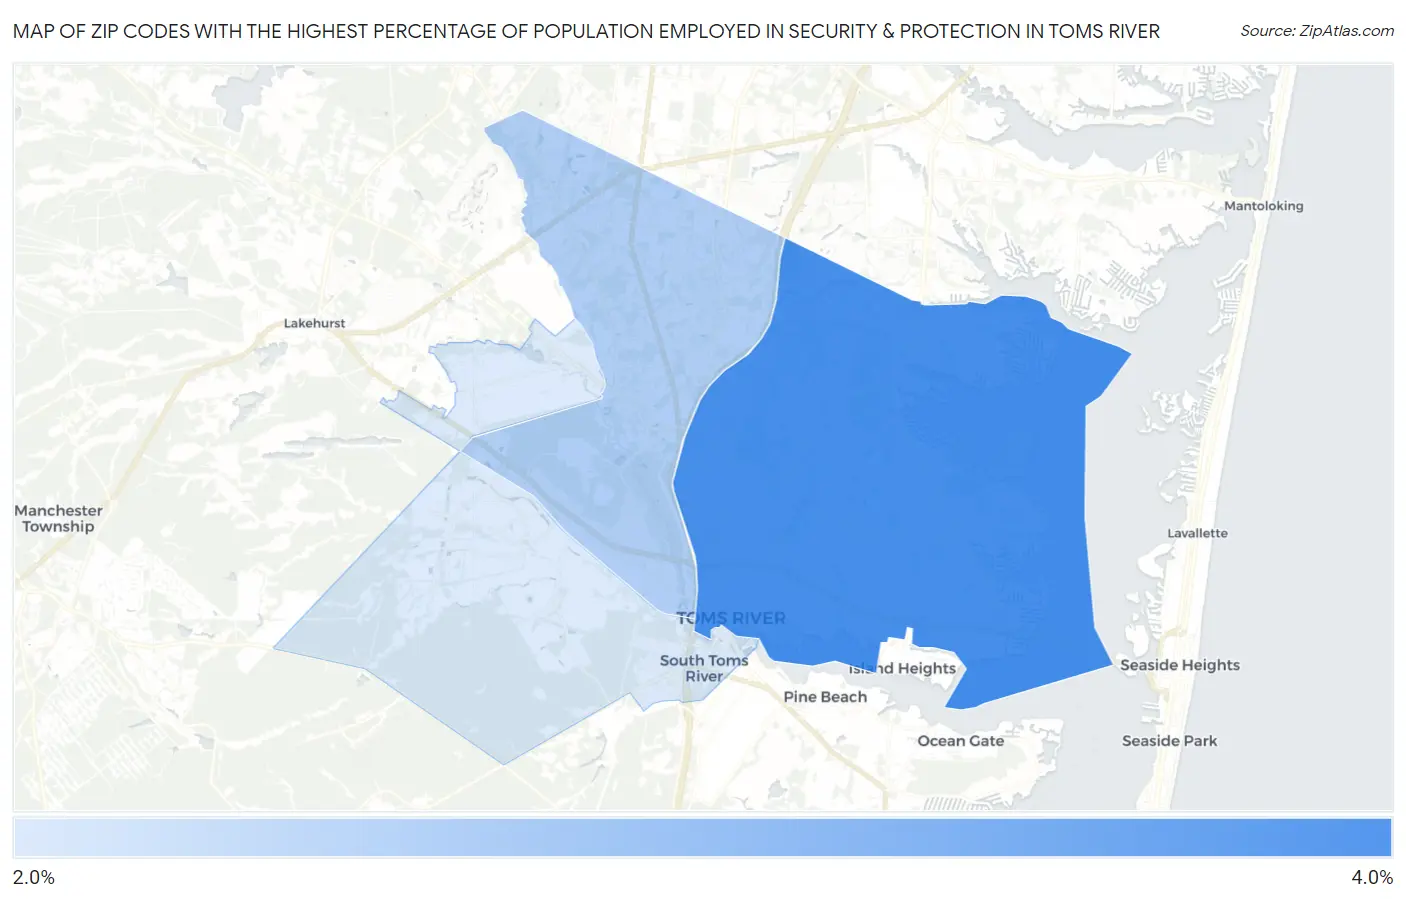
Zip Codes with the Highest Percentage of Population Employed in Security & Protection in Toms River, NJ
RELATED REPORTS & OPTIONS
Security & Protection
Toms River
Compare Zip Codes
Map of Zip Codes with the Highest Percentage of Population Employed in Security & Protection in Toms River
2.6%
3.6%
Zip Codes with the Highest Percentage of Population Employed in Security & Protection in Toms River, NJ
| Zip Code | % Employed | vs State | vs National | |
| 1. | 08753 | 3.6% | 2.4%(+1.17)#110 | 2.1%(+1.42)#5,466 |
| 2. | 08755 | 2.9% | 2.4%(+0.472)#181 | 2.1%(+0.726)#7,758 |
| 3. | 08757 | 2.6% | 2.4%(+0.158)#225 | 2.1%(+0.412)#9,205 |
1
Common Questions
What are the Top Zip Codes with the Highest Percentage of Population Employed in Security & Protection in Toms River, NJ?
Top Zip Codes with the Highest Percentage of Population Employed in Security & Protection in Toms River, NJ are:
What zip code has the Highest Percentage of Population Employed in Security & Protection in Toms River, NJ?
08753 has the Highest Percentage of Population Employed in Security & Protection in Toms River, NJ with 3.6%.
What is the Percentage of Population Employed in Security & Protection in Toms River, NJ?
Percentage of Population Employed in Security & Protection in Toms River is 3.4%.
What is the Percentage of Population Employed in Security & Protection in New Jersey?
Percentage of Population Employed in Security & Protection in New Jersey is 2.4%.
What is the Percentage of Population Employed in Security & Protection in the United States?
Percentage of Population Employed in Security & Protection in the United States is 2.1%.