Park Ridge borough, NJ Map & Demographics
Park Ridge borough Overview
$66,515
PER CAPITA INCOME
$196,523
AVG FAMILY INCOME
$164,241
AVG HOUSEHOLD INCOME
35.9%
WAGE / INCOME GAP [ % ]
64.1¢/ $1
WAGE / INCOME GAP [ $ ]
0.40
INEQUALITY / GINI INDEX
9,098
TOTAL POPULATION
4,364
MALE POPULATION
4,734
FEMALE POPULATION
92.18
MALES / 100 FEMALES
108.48
FEMALES / 100 MALES
47.8
MEDIAN AGE
3.2
AVG FAMILY SIZE
2.8
AVG HOUSEHOLD SIZE
5,173
LABOR FORCE [ PEOPLE ]
66.8%
PERCENT IN LABOR FORCE
3.0%
UNEMPLOYMENT RATE
Income in Park Ridge borough
Income Overview in Park Ridge borough
Per Capita Income in Park Ridge borough is $66,515, while median incomes of families and households are $196,523 and $164,241 respectively.
| Characteristic | Number | Measure |
| Per Capita Income | 9,098 | $66,515 |
| Median Family Income | 2,427 | $196,523 |
| Mean Family Income | 2,427 | $218,352 |
| Median Household Income | 3,203 | $164,241 |
| Mean Household Income | 3,203 | $184,675 |
| Income Deficit | 2,427 | $0 |
| Wage / Income Gap (%) | 9,098 | 35.93% |
| Wage / Income Gap ($) | 9,098 | 64.07¢ per $1 |
| Gini / Inequality Index | 9,098 | 0.40 |
Earnings by Sex in Park Ridge borough
Average Earnings in Park Ridge borough are $66,169, $84,478 for men and $54,125 for women, a difference of 35.9%.
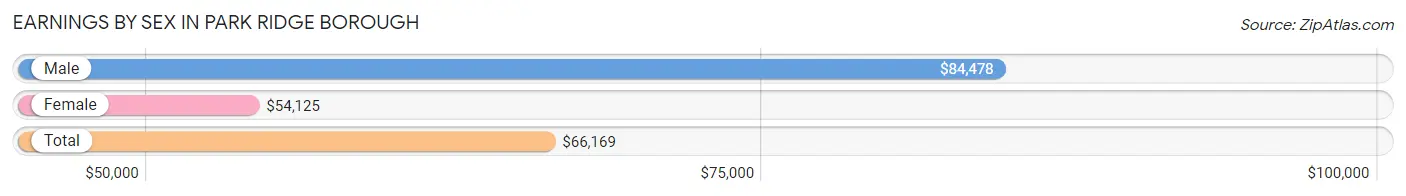
| Sex | Number | Average Earnings |
| Male | 2,877 (51.7%) | $84,478 |
| Female | 2,690 (48.3%) | $54,125 |
| Total | 5,567 (100.0%) | $66,169 |
Earnings by Sex by Income Bracket in Park Ridge borough
The most common earnings brackets in Park Ridge borough are $100,000+ for men (1,211 | 42.1%) and $100,000+ for women (615 | 22.9%).
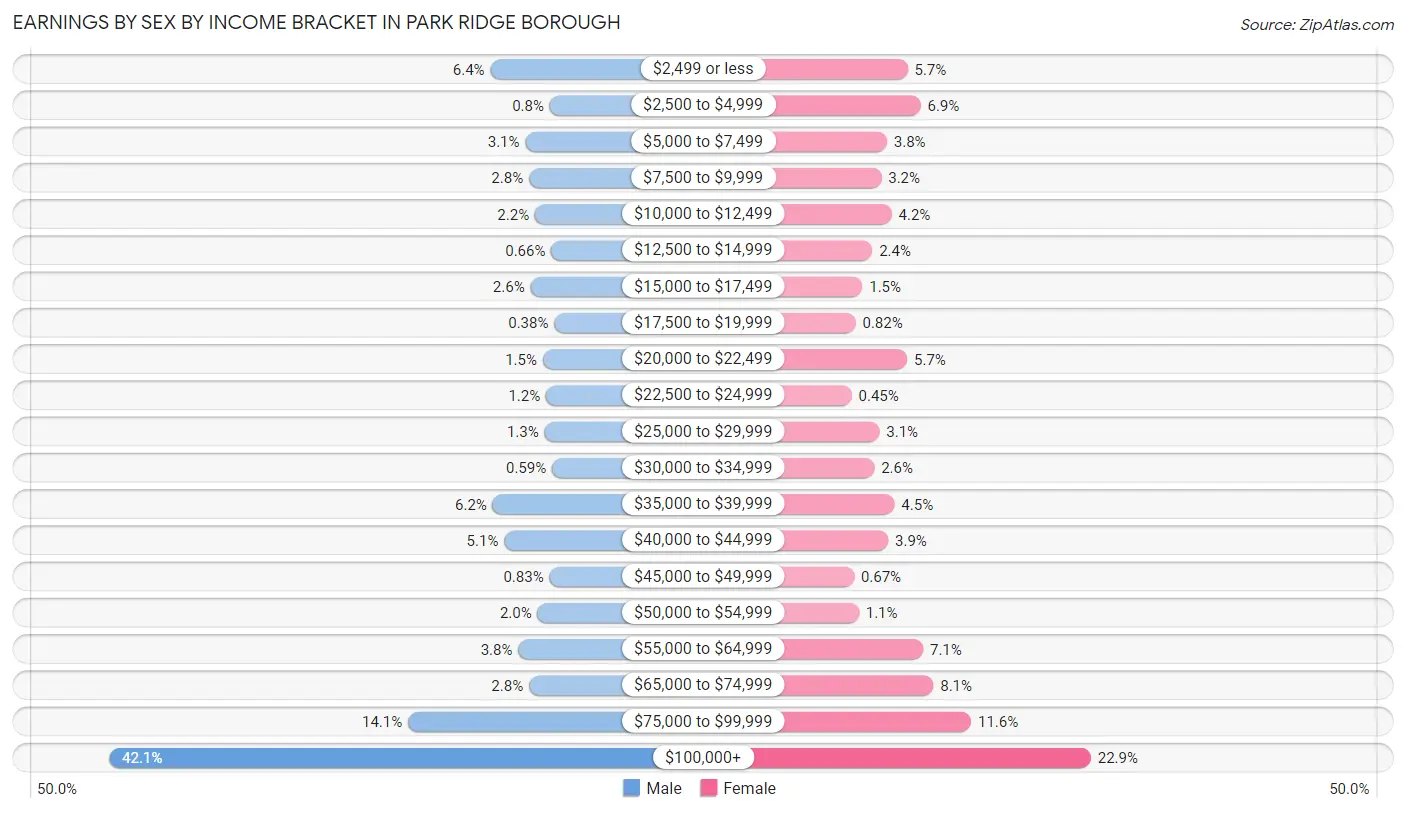
| Income | Male | Female |
| $2,499 or less | 183 (6.4%) | 153 (5.7%) |
| $2,500 to $4,999 | 23 (0.8%) | 186 (6.9%) |
| $5,000 to $7,499 | 89 (3.1%) | 101 (3.7%) |
| $7,500 to $9,999 | 79 (2.8%) | 87 (3.2%) |
| $10,000 to $12,499 | 63 (2.2%) | 113 (4.2%) |
| $12,500 to $14,999 | 19 (0.7%) | 64 (2.4%) |
| $15,000 to $17,499 | 75 (2.6%) | 39 (1.5%) |
| $17,500 to $19,999 | 11 (0.4%) | 22 (0.8%) |
| $20,000 to $22,499 | 42 (1.5%) | 152 (5.7%) |
| $22,500 to $24,999 | 33 (1.1%) | 12 (0.4%) |
| $25,000 to $29,999 | 37 (1.3%) | 82 (3.0%) |
| $30,000 to $34,999 | 17 (0.6%) | 69 (2.6%) |
| $35,000 to $39,999 | 177 (6.1%) | 120 (4.5%) |
| $40,000 to $44,999 | 146 (5.1%) | 104 (3.9%) |
| $45,000 to $49,999 | 24 (0.8%) | 18 (0.7%) |
| $50,000 to $54,999 | 56 (1.9%) | 30 (1.1%) |
| $55,000 to $64,999 | 108 (3.7%) | 192 (7.1%) |
| $65,000 to $74,999 | 79 (2.8%) | 218 (8.1%) |
| $75,000 to $99,999 | 405 (14.1%) | 313 (11.6%) |
| $100,000+ | 1,211 (42.1%) | 615 (22.9%) |
| Total | 2,877 (100.0%) | 2,690 (100.0%) |
Earnings by Sex by Educational Attainment in Park Ridge borough
Average earnings in Park Ridge borough are $94,950 for men and $65,722 for women, a difference of 30.8%. Men with an educational attainment of bachelor's degree enjoy the highest average annual earnings of $148,750, while those with high school diploma education earn the least with $39,213. Women with an educational attainment of graduate degree earn the most with the average annual earnings of $78,909, while those with college or associate's degree education have the smallest earnings of $39,583.
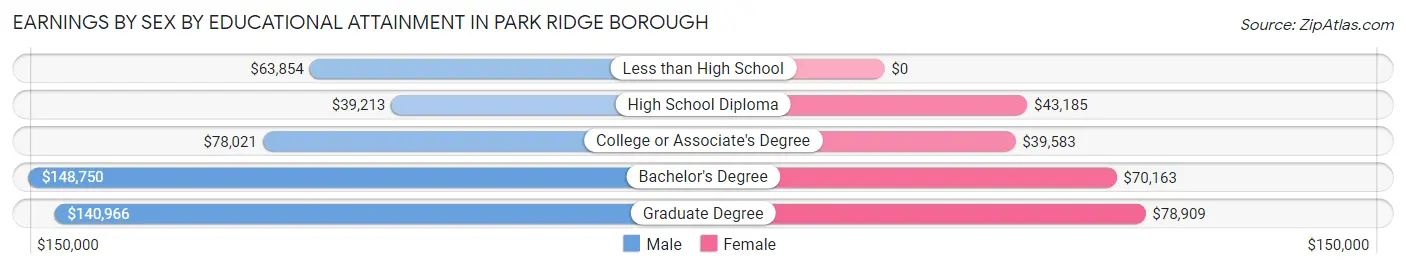
| Educational Attainment | Male Income | Female Income |
| Less than High School | $63,854 | $0 |
| High School Diploma | $39,213 | $43,185 |
| College or Associate's Degree | $78,021 | $39,583 |
| Bachelor's Degree | $148,750 | $70,163 |
| Graduate Degree | $140,966 | $78,909 |
| Total | $94,950 | $65,722 |
Family Income in Park Ridge borough
Family Income Brackets in Park Ridge borough
According to the Park Ridge borough family income data, there are 1,150 families falling into the $200,000+ income range, which is the most common income bracket and makes up 47.4% of all families. Conversely, the less than $10,000 income bracket is the least frequent group with only 12 families (0.5%) belonging to this category.
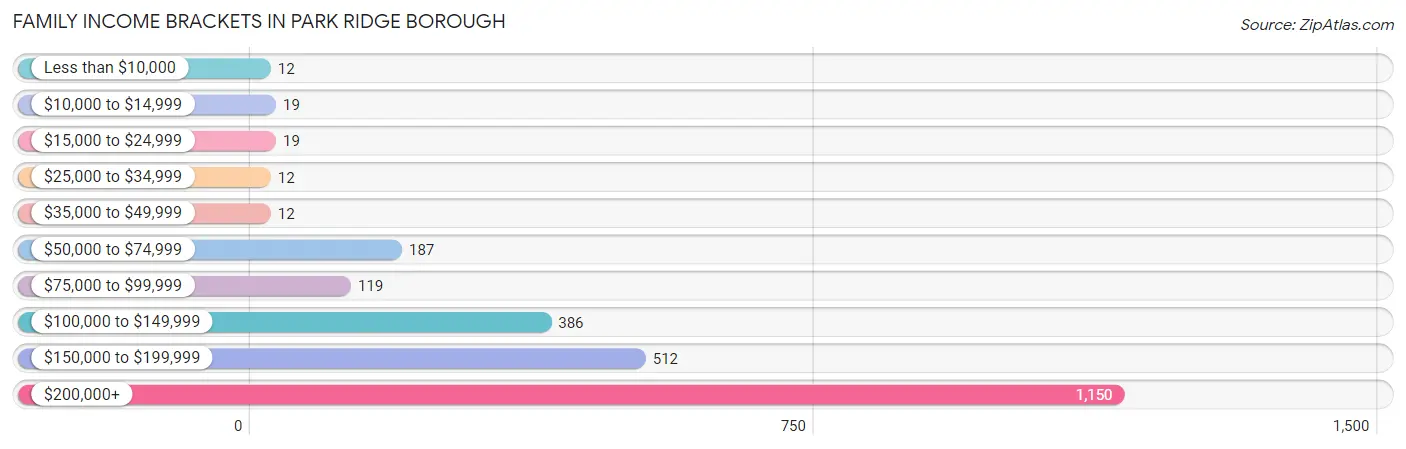
| Income Bracket | # Families | % Families |
| Less than $10,000 | 12 | 0.5% |
| $10,000 to $14,999 | 19 | 0.8% |
| $15,000 to $24,999 | 19 | 0.8% |
| $25,000 to $34,999 | 12 | 0.5% |
| $35,000 to $49,999 | 12 | 0.5% |
| $50,000 to $74,999 | 187 | 7.7% |
| $75,000 to $99,999 | 119 | 4.9% |
| $100,000 to $149,999 | 386 | 15.9% |
| $150,000 to $199,999 | 512 | 21.1% |
| $200,000+ | 1,150 | 47.4% |
Family Income by Famaliy Size in Park Ridge borough
4-person families (551 | 22.7%) account for the highest median family income in Park Ridge borough with $244,563 per family, while 2-person families (937 | 38.6%) have the highest median income of $70,744 per family member.
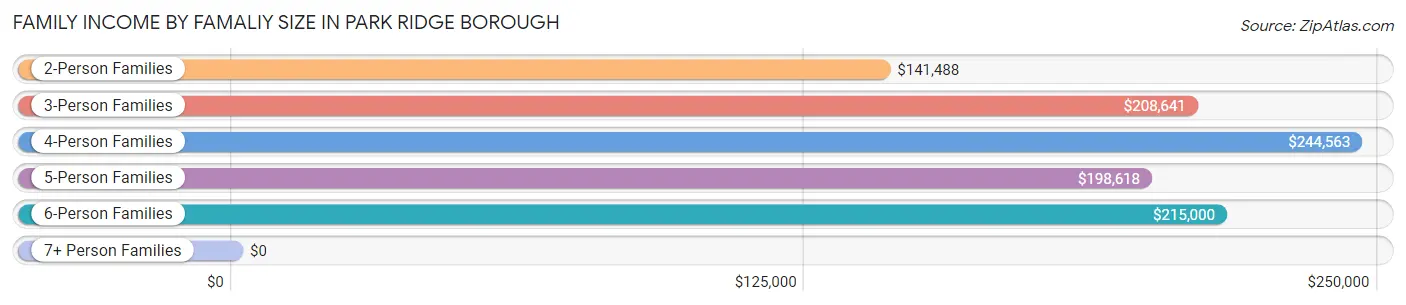
| Income Bracket | # Families | Median Income |
| 2-Person Families | 937 (38.6%) | $141,488 |
| 3-Person Families | 696 (28.7%) | $208,641 |
| 4-Person Families | 551 (22.7%) | $244,563 |
| 5-Person Families | 145 (6.0%) | $198,618 |
| 6-Person Families | 74 (3.0%) | $215,000 |
| 7+ Person Families | 24 (1.0%) | $0 |
| Total | 2,427 (100.0%) | $196,523 |
Family Income by Number of Earners in Park Ridge borough
The median family income in Park Ridge borough is $196,523, with families comprising 3+ earners (531) having the highest median family income of $248,750, while families with no earners (207) have the lowest median family income of $84,185, accounting for 21.9% and 8.5% of families, respectively.
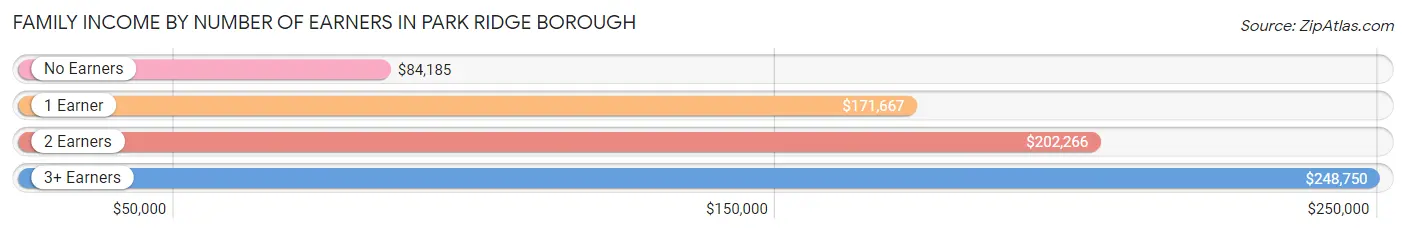
| Number of Earners | # Families | Median Income |
| No Earners | 207 (8.5%) | $84,185 |
| 1 Earner | 414 (17.1%) | $171,667 |
| 2 Earners | 1,275 (52.5%) | $202,266 |
| 3+ Earners | 531 (21.9%) | $248,750 |
| Total | 2,427 (100.0%) | $196,523 |
Household Income in Park Ridge borough
Household Income Brackets in Park Ridge borough
With 1,217 households falling in the category, the $200,000+ income range is the most frequent in Park Ridge borough, accounting for 38.0% of all households. In contrast, only 38 households (1.2%) fall into the $10,000 to $14,999 income bracket, making it the least populous group.
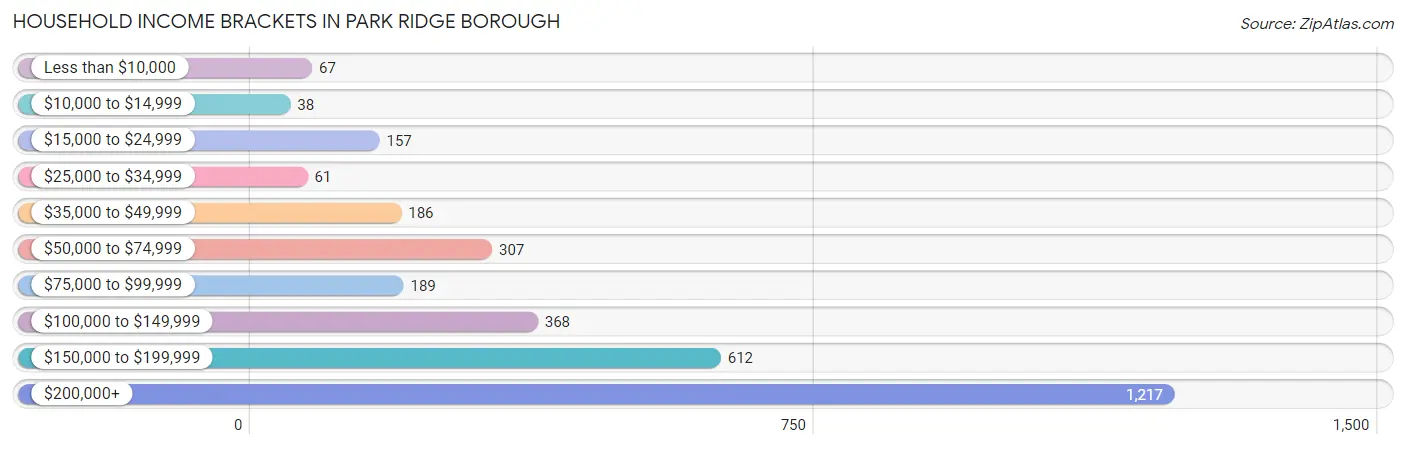
| Income Bracket | # Households | % Households |
| Less than $10,000 | 67 | 2.1% |
| $10,000 to $14,999 | 38 | 1.2% |
| $15,000 to $24,999 | 157 | 4.9% |
| $25,000 to $34,999 | 61 | 1.9% |
| $35,000 to $49,999 | 186 | 5.8% |
| $50,000 to $74,999 | 307 | 9.6% |
| $75,000 to $99,999 | 189 | 5.9% |
| $100,000 to $149,999 | 368 | 11.5% |
| $150,000 to $199,999 | 612 | 19.1% |
| $200,000+ | 1,217 | 38.0% |
Household Income by Householder Age in Park Ridge borough
The median household income in Park Ridge borough is $164,241, with the highest median household income of $191,250 found in the 25 to 44 years age bracket for the primary householder. A total of 692 households (21.6%) fall into this category. Meanwhile, the 15 to 24 years age bracket for the primary householder has the lowest median household income of $0, with 38 households (1.2%) in this group.
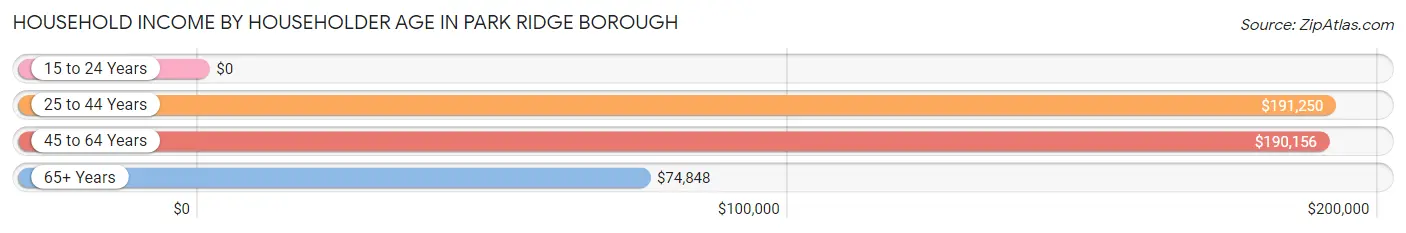
| Income Bracket | # Households | Median Income |
| 15 to 24 Years | 38 (1.2%) | $0 |
| 25 to 44 Years | 692 (21.6%) | $191,250 |
| 45 to 64 Years | 1,421 (44.4%) | $190,156 |
| 65+ Years | 1,052 (32.8%) | $74,848 |
| Total | 3,203 (100.0%) | $164,241 |
Poverty in Park Ridge borough
Income Below Poverty by Sex and Age in Park Ridge borough
With 1.5% poverty level for males and 3.4% for females among the residents of Park Ridge borough, 65 to 74 year old males and 65 to 74 year old females are the most vulnerable to poverty, with 34 males (6.9%) and 71 females (12.9%) in their respective age groups living below the poverty level.
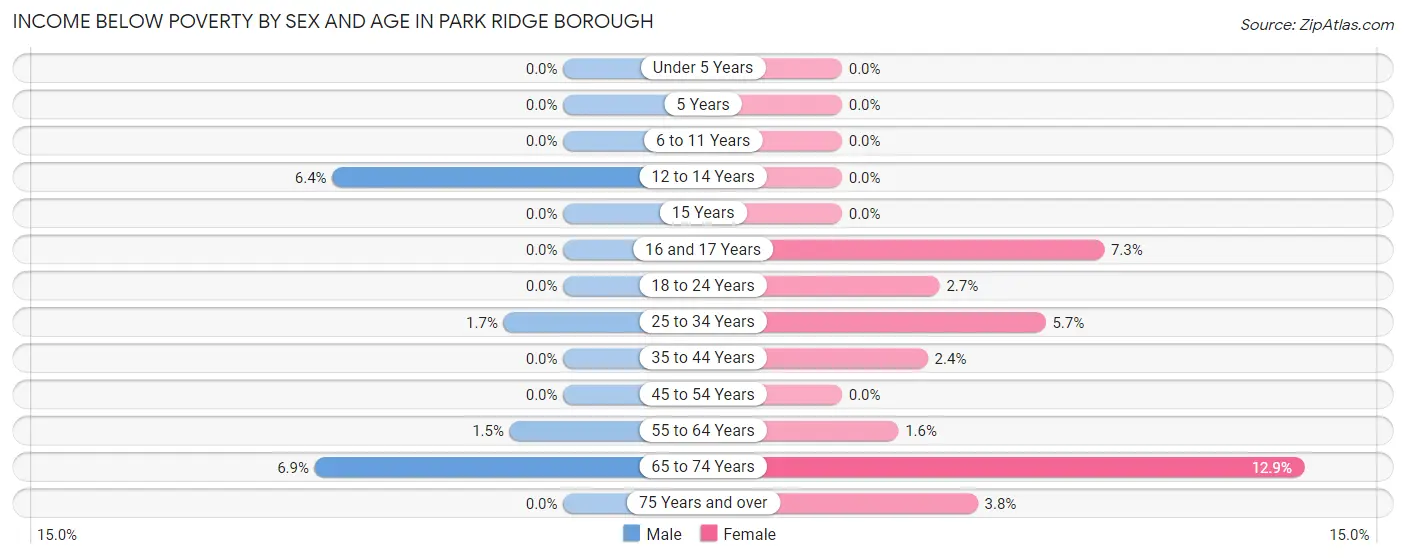
| Age Bracket | Male | Female |
| Under 5 Years | 0 (0.0%) | 0 (0.0%) |
| 5 Years | 0 (0.0%) | 0 (0.0%) |
| 6 to 11 Years | 0 (0.0%) | 0 (0.0%) |
| 12 to 14 Years | 11 (6.4%) | 0 (0.0%) |
| 15 Years | 0 (0.0%) | 0 (0.0%) |
| 16 and 17 Years | 0 (0.0%) | 13 (7.3%) |
| 18 to 24 Years | 0 (0.0%) | 12 (2.7%) |
| 25 to 34 Years | 6 (1.7%) | 24 (5.7%) |
| 35 to 44 Years | 0 (0.0%) | 11 (2.4%) |
| 45 to 54 Years | 0 (0.0%) | 0 (0.0%) |
| 55 to 64 Years | 12 (1.5%) | 10 (1.6%) |
| 65 to 74 Years | 34 (6.9%) | 71 (12.9%) |
| 75 Years and over | 0 (0.0%) | 16 (3.8%) |
| Total | 63 (1.5%) | 157 (3.4%) |
Income Above Poverty by Sex and Age in Park Ridge borough
According to the poverty statistics in Park Ridge borough, males aged under 5 years and females aged under 5 years are the age groups that are most secure financially, with 100.0% of males and 100.0% of females in these age groups living above the poverty line.
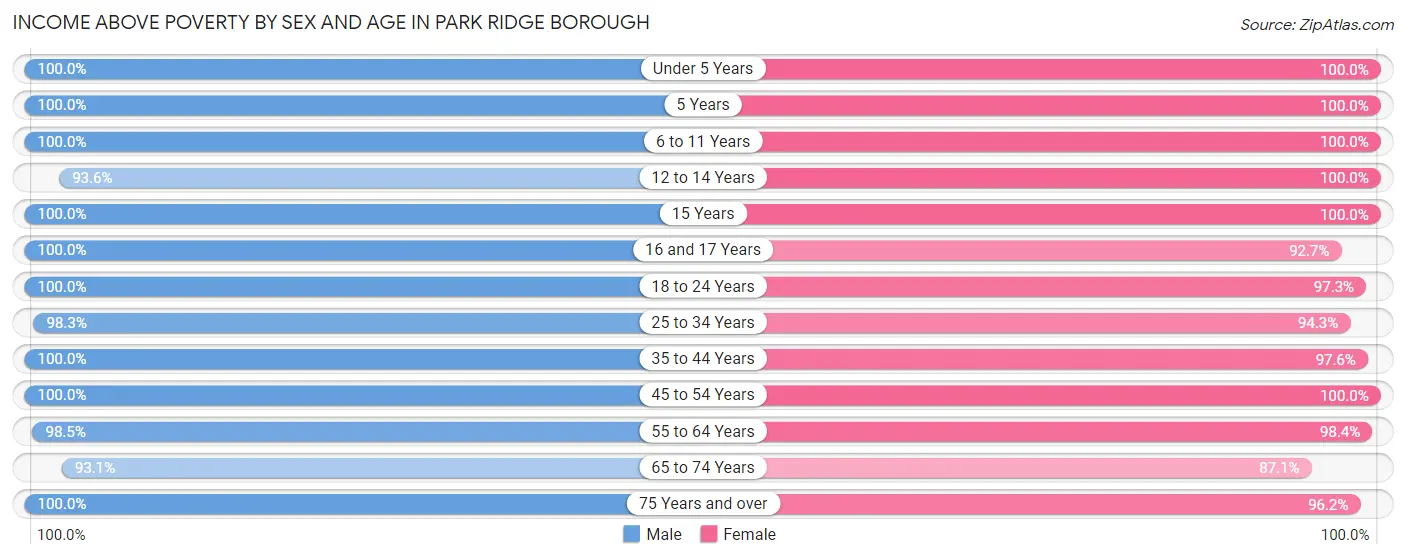
| Age Bracket | Male | Female |
| Under 5 Years | 136 (100.0%) | 176 (100.0%) |
| 5 Years | 24 (100.0%) | 36 (100.0%) |
| 6 to 11 Years | 316 (100.0%) | 216 (100.0%) |
| 12 to 14 Years | 160 (93.6%) | 203 (100.0%) |
| 15 Years | 43 (100.0%) | 32 (100.0%) |
| 16 and 17 Years | 163 (100.0%) | 165 (92.7%) |
| 18 to 24 Years | 483 (100.0%) | 429 (97.3%) |
| 25 to 34 Years | 355 (98.3%) | 399 (94.3%) |
| 35 to 44 Years | 423 (100.0%) | 449 (97.6%) |
| 45 to 54 Years | 614 (100.0%) | 821 (100.0%) |
| 55 to 64 Years | 791 (98.5%) | 625 (98.4%) |
| 65 to 74 Years | 457 (93.1%) | 481 (87.1%) |
| 75 Years and over | 277 (100.0%) | 407 (96.2%) |
| Total | 4,242 (98.5%) | 4,439 (96.6%) |
Income Below Poverty Among Married-Couple Families in Park Ridge borough
The poverty statistics for married-couple families in Park Ridge borough show that 0.9% or 20 of the total 2,227 families live below the poverty line. Families with no children have the highest poverty rate of 1.4%, comprising of 20 families. On the other hand, families with 1 or 2 children have the lowest poverty rate of 0.0%, which includes 0 families.
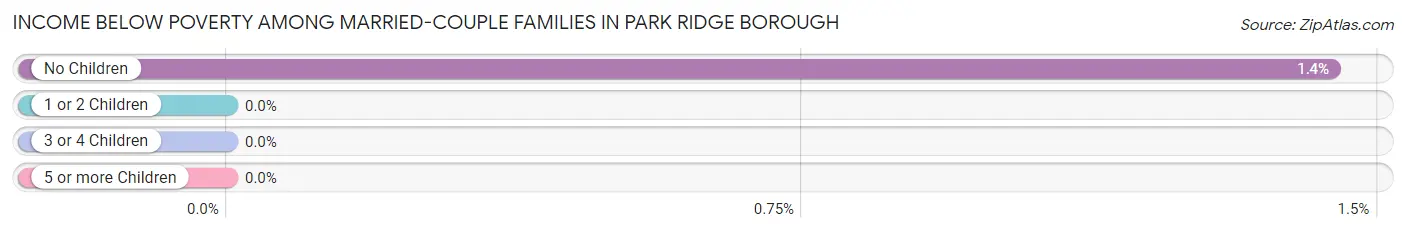
| Children | Above Poverty | Below Poverty |
| No Children | 1,368 (98.6%) | 20 (1.4%) |
| 1 or 2 Children | 718 (100.0%) | 0 (0.0%) |
| 3 or 4 Children | 121 (100.0%) | 0 (0.0%) |
| 5 or more Children | 0 (0.0%) | 0 (0.0%) |
| Total | 2,207 (99.1%) | 20 (0.9%) |
Income Below Poverty Among Single-Parent Households in Park Ridge borough
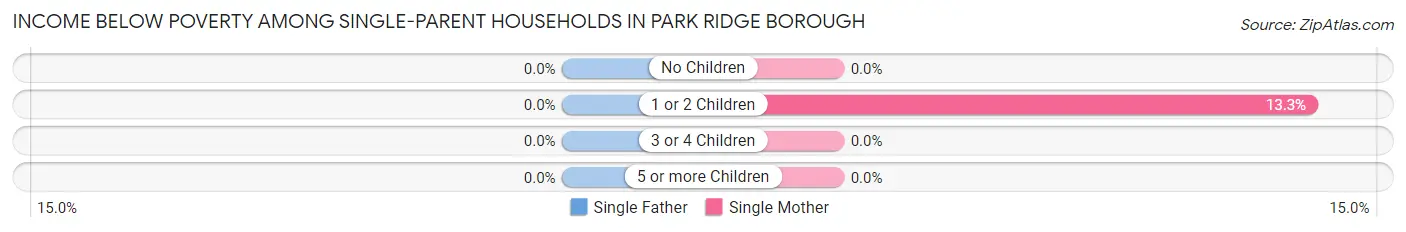
| Children | Single Father | Single Mother |
| No Children | 0 (0.0%) | 0 (0.0%) |
| 1 or 2 Children | 0 (0.0%) | 11 (13.3%) |
| 3 or 4 Children | 0 (0.0%) | 0 (0.0%) |
| 5 or more Children | 0 (0.0%) | 0 (0.0%) |
| Total | 0 (0.0%) | 11 (6.9%) |
Income Below Poverty Among Married-Couple vs Single-Parent Households in Park Ridge borough
The poverty data for Park Ridge borough shows that 20 of the married-couple family households (0.9%) and 11 of the single-parent households (5.5%) are living below the poverty level. Within the married-couple family households, those with no children have the highest poverty rate, with 20 households (1.4%) falling below the poverty line. Among the single-parent households, those with 1 or 2 children have the highest poverty rate, with 11 household (9.5%) living below poverty.
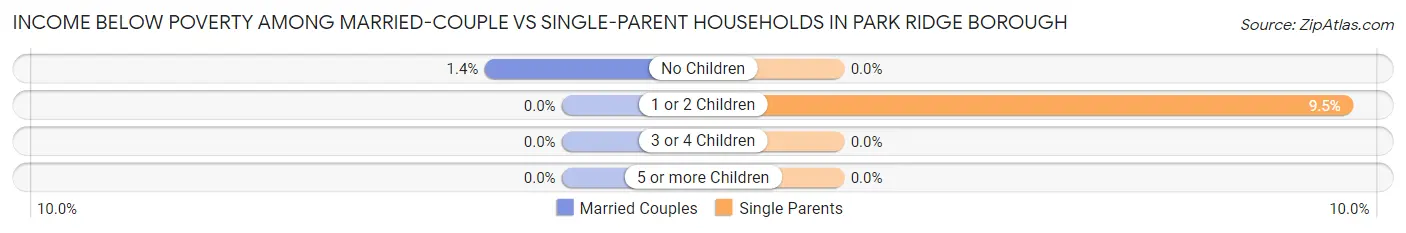
| Children | Married-Couple Families | Single-Parent Households |
| No Children | 20 (1.4%) | 0 (0.0%) |
| 1 or 2 Children | 0 (0.0%) | 11 (9.5%) |
| 3 or 4 Children | 0 (0.0%) | 0 (0.0%) |
| 5 or more Children | 0 (0.0%) | 0 (0.0%) |
| Total | 20 (0.9%) | 11 (5.5%) |
Race in Park Ridge borough
The most populous races in Park Ridge borough are White / Caucasian (7,752 | 85.2%), Hispanic or Latino (1,183 | 13.0%), and Two or more Races (449 | 4.9%).
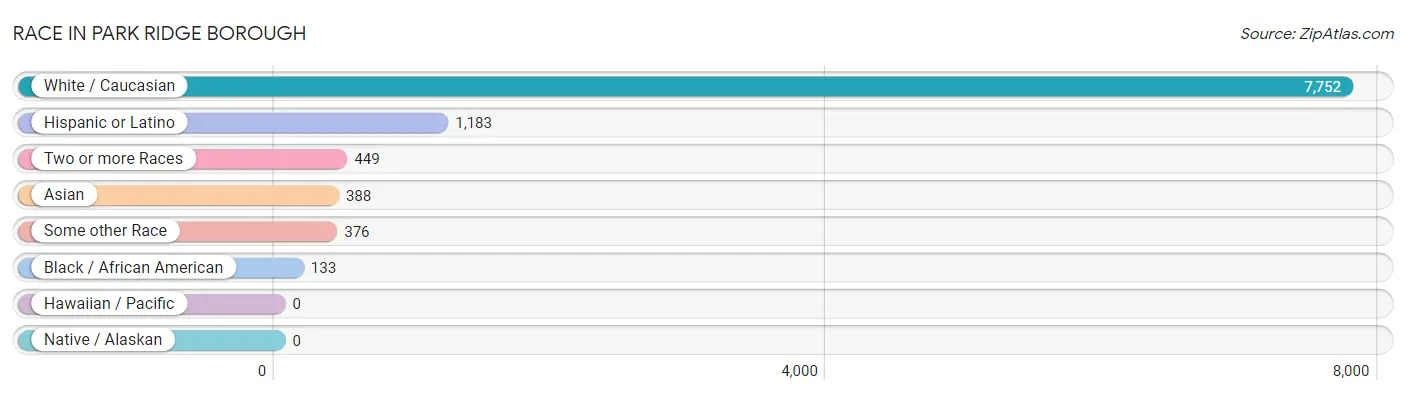
| Race | # Population | % Population |
| Asian | 388 | 4.3% |
| Black / African American | 133 | 1.5% |
| Hawaiian / Pacific | 0 | 0.0% |
| Hispanic or Latino | 1,183 | 13.0% |
| Native / Alaskan | 0 | 0.0% |
| White / Caucasian | 7,752 | 85.2% |
| Two or more Races | 449 | 4.9% |
| Some other Race | 376 | 4.1% |
| Total | 9,098 | 100.0% |
Ancestry in Park Ridge borough
The most populous ancestries reported in Park Ridge borough are Italian (2,745 | 30.2%), Irish (2,045 | 22.5%), German (1,341 | 14.7%), Polish (643 | 7.1%), and English (506 | 5.6%), together accounting for 80.0% of all Park Ridge borough residents.
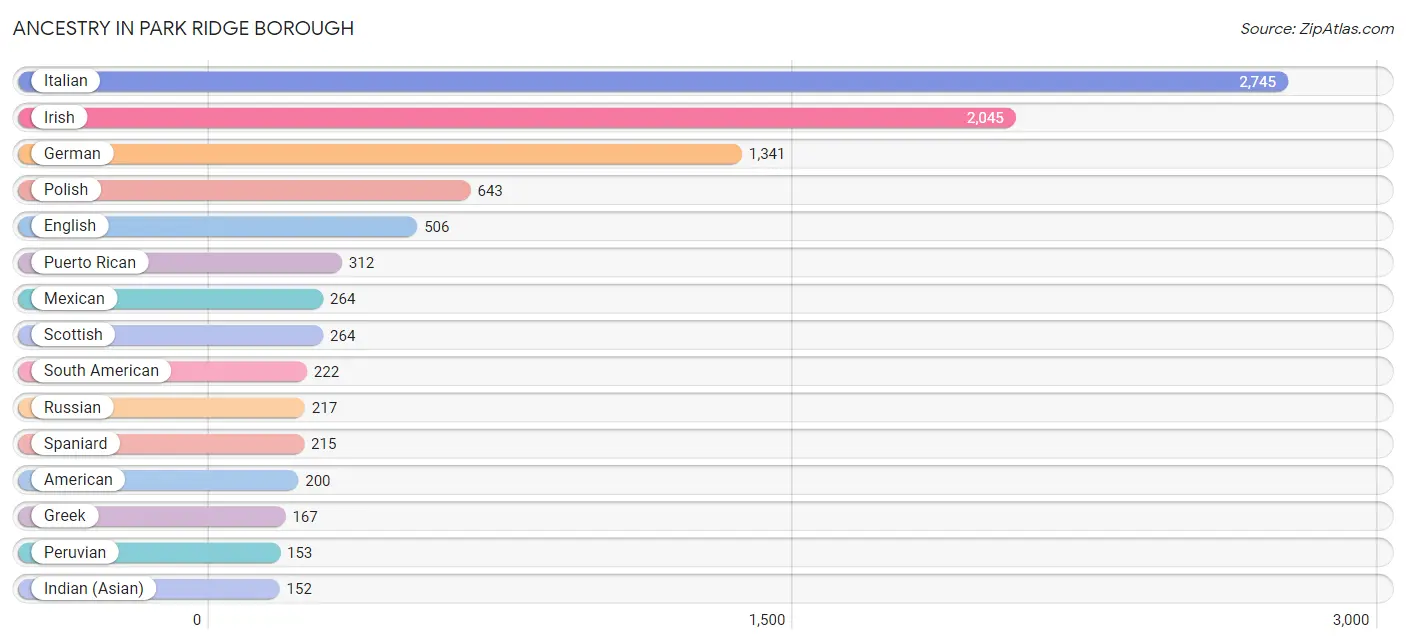
| Ancestry | # Population | % Population |
| American | 200 | 2.2% |
| Arab | 139 | 1.5% |
| Armenian | 63 | 0.7% |
| Austrian | 41 | 0.4% |
| Belgian | 12 | 0.1% |
| Bhutanese | 27 | 0.3% |
| British | 6 | 0.1% |
| Burmese | 62 | 0.7% |
| Canadian | 25 | 0.3% |
| Central American | 56 | 0.6% |
| Colombian | 8 | 0.1% |
| Cuban | 45 | 0.5% |
| Czech | 68 | 0.7% |
| Czechoslovakian | 5 | 0.1% |
| Danish | 8 | 0.1% |
| Dominican | 69 | 0.8% |
| Dutch | 30 | 0.3% |
| Eastern European | 74 | 0.8% |
| Ecuadorian | 61 | 0.7% |
| English | 506 | 5.6% |
| European | 151 | 1.7% |
| Finnish | 32 | 0.4% |
| French | 76 | 0.8% |
| French Canadian | 19 | 0.2% |
| German | 1,341 | 14.7% |
| Greek | 167 | 1.8% |
| Honduran | 56 | 0.6% |
| Hungarian | 104 | 1.1% |
| Indian (Asian) | 152 | 1.7% |
| Irish | 2,045 | 22.5% |
| Iroquois | 4 | 0.0% |
| Israeli | 15 | 0.2% |
| Italian | 2,745 | 30.2% |
| Jamaican | 26 | 0.3% |
| Korean | 53 | 0.6% |
| Lebanese | 13 | 0.1% |
| Mexican | 264 | 2.9% |
| Norwegian | 83 | 0.9% |
| Peruvian | 153 | 1.7% |
| Polish | 643 | 7.1% |
| Portuguese | 41 | 0.4% |
| Puerto Rican | 312 | 3.4% |
| Romanian | 37 | 0.4% |
| Russian | 217 | 2.4% |
| Scottish | 264 | 2.9% |
| Serbian | 14 | 0.2% |
| Slovak | 66 | 0.7% |
| South American | 222 | 2.4% |
| Spaniard | 215 | 2.4% |
| Sri Lankan | 85 | 0.9% |
| Swedish | 68 | 0.7% |
| Swiss | 58 | 0.6% |
| Syrian | 86 | 0.9% |
| Thai | 117 | 1.3% |
| Turkish | 43 | 0.5% |
| Ukrainian | 55 | 0.6% |
| Vietnamese | 8 | 0.1% |
| Welsh | 25 | 0.3% | View All 58 Rows |
Immigrants in Park Ridge borough
The most numerous immigrant groups reported in Park Ridge borough came from Latin America (412 | 4.5%), Europe (312 | 3.4%), Asia (302 | 3.3%), South America (189 | 2.1%), and Eastern Europe (165 | 1.8%), together accounting for 15.2% of all Park Ridge borough residents.
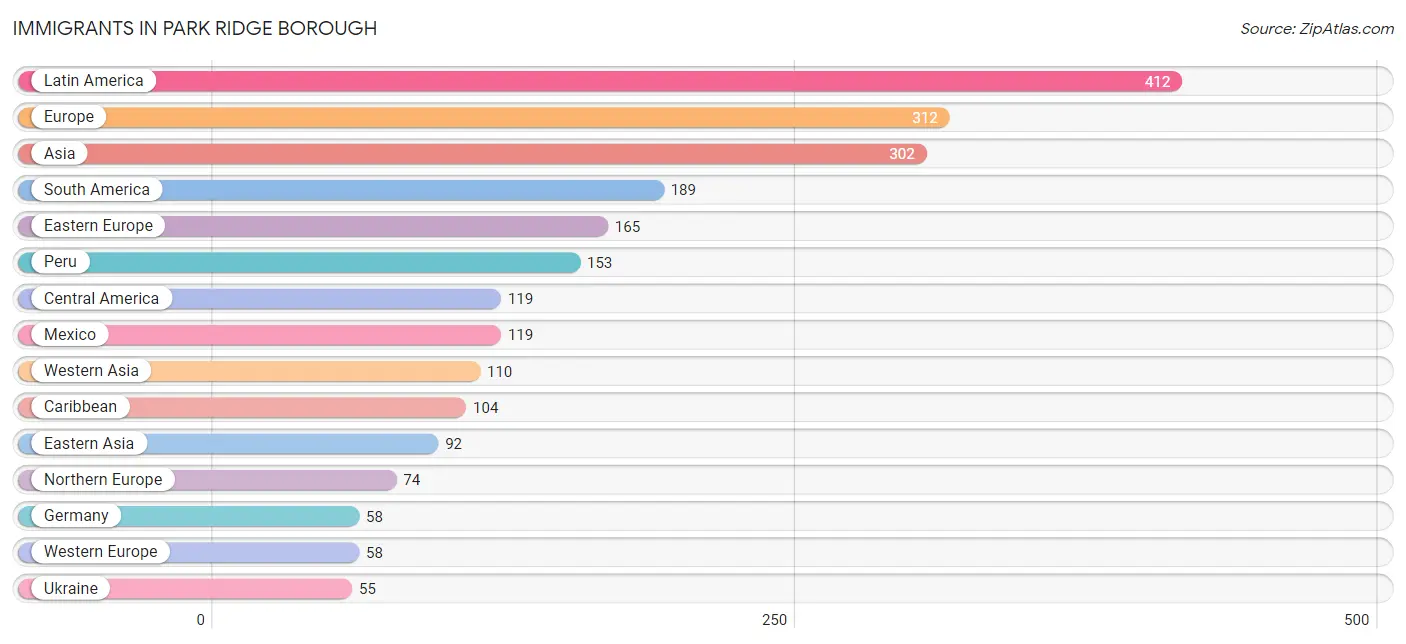
| Immigration Origin | # Population | % Population |
| Africa | 15 | 0.2% |
| Asia | 302 | 3.3% |
| Canada | 26 | 0.3% |
| Caribbean | 104 | 1.1% |
| Central America | 119 | 1.3% |
| China | 23 | 0.3% |
| Colombia | 8 | 0.1% |
| Cuba | 15 | 0.2% |
| Czechoslovakia | 21 | 0.2% |
| Dominican Republic | 14 | 0.2% |
| Eastern Asia | 92 | 1.0% |
| Eastern Europe | 165 | 1.8% |
| Ecuador | 28 | 0.3% |
| England | 18 | 0.2% |
| Europe | 312 | 3.4% |
| Germany | 58 | 0.6% |
| Haiti | 49 | 0.5% |
| India | 54 | 0.6% |
| Ireland | 38 | 0.4% |
| Israel | 35 | 0.4% |
| Jamaica | 26 | 0.3% |
| Japan | 27 | 0.3% |
| Korea | 42 | 0.5% |
| Latin America | 412 | 4.5% |
| Mexico | 119 | 1.3% |
| Northern Africa | 15 | 0.2% |
| Northern Europe | 74 | 0.8% |
| Peru | 153 | 1.7% |
| Philippines | 25 | 0.3% |
| Poland | 8 | 0.1% |
| Portugal | 15 | 0.2% |
| Romania | 37 | 0.4% |
| Russia | 29 | 0.3% |
| Saudi Arabia | 20 | 0.2% |
| South America | 189 | 2.1% |
| South Central Asia | 54 | 0.6% |
| South Eastern Asia | 46 | 0.5% |
| Southern Europe | 15 | 0.2% |
| Syria | 20 | 0.2% |
| Taiwan | 8 | 0.1% |
| Turkey | 35 | 0.4% |
| Ukraine | 55 | 0.6% |
| Vietnam | 21 | 0.2% |
| Western Asia | 110 | 1.2% |
| Western Europe | 58 | 0.6% | View All 45 Rows |
Sex and Age in Park Ridge borough
Sex and Age in Park Ridge borough
The most populous age groups in Park Ridge borough are 55 to 59 Years (519 | 11.9%) for men and 50 to 54 Years (548 | 11.6%) for women.
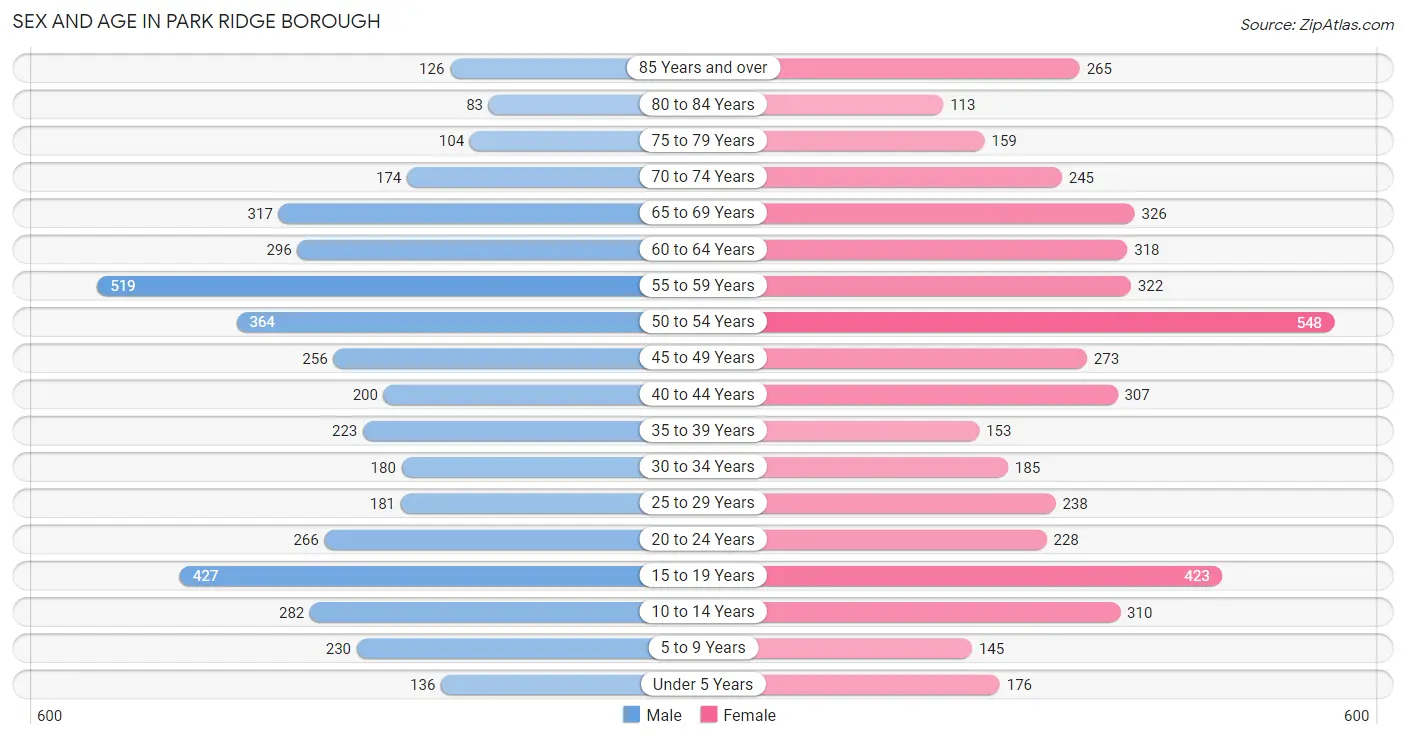
| Age Bracket | Male | Female |
| Under 5 Years | 136 (3.1%) | 176 (3.7%) |
| 5 to 9 Years | 230 (5.3%) | 145 (3.1%) |
| 10 to 14 Years | 282 (6.5%) | 310 (6.6%) |
| 15 to 19 Years | 427 (9.8%) | 423 (8.9%) |
| 20 to 24 Years | 266 (6.1%) | 228 (4.8%) |
| 25 to 29 Years | 181 (4.2%) | 238 (5.0%) |
| 30 to 34 Years | 180 (4.1%) | 185 (3.9%) |
| 35 to 39 Years | 223 (5.1%) | 153 (3.2%) |
| 40 to 44 Years | 200 (4.6%) | 307 (6.5%) |
| 45 to 49 Years | 256 (5.9%) | 273 (5.8%) |
| 50 to 54 Years | 364 (8.3%) | 548 (11.6%) |
| 55 to 59 Years | 519 (11.9%) | 322 (6.8%) |
| 60 to 64 Years | 296 (6.8%) | 318 (6.7%) |
| 65 to 69 Years | 317 (7.3%) | 326 (6.9%) |
| 70 to 74 Years | 174 (4.0%) | 245 (5.2%) |
| 75 to 79 Years | 104 (2.4%) | 159 (3.4%) |
| 80 to 84 Years | 83 (1.9%) | 113 (2.4%) |
| 85 Years and over | 126 (2.9%) | 265 (5.6%) |
| Total | 4,364 (100.0%) | 4,734 (100.0%) |
Families and Households in Park Ridge borough
Median Family Size in Park Ridge borough
The median family size in Park Ridge borough is 3.23 persons per family, with single female/mother families (159 | 6.6%) accounting for the largest median family size of 3.64 persons per family. On the other hand, single male/father families (41 | 1.7%) represent the smallest median family size with 2.71 persons per family.
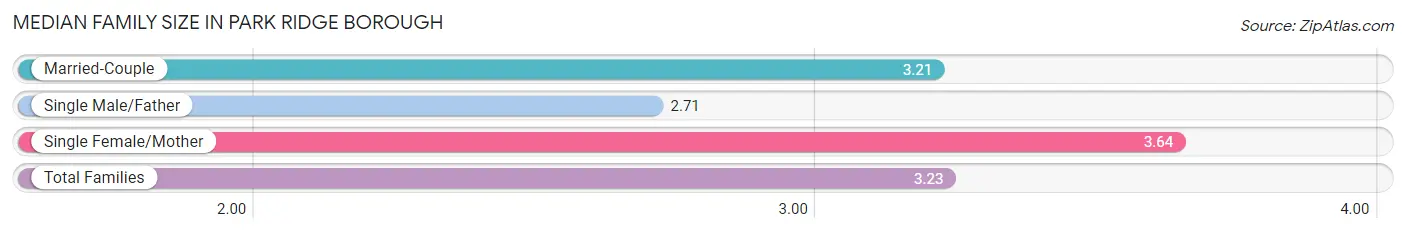
| Family Type | # Families | Family Size |
| Married-Couple | 2,227 (91.8%) | 3.21 |
| Single Male/Father | 41 (1.7%) | 2.71 |
| Single Female/Mother | 159 (6.6%) | 3.64 |
| Total Families | 2,427 (100.0%) | 3.23 |
Median Household Size in Park Ridge borough
The median household size in Park Ridge borough is 2.77 persons per household, with single female/mother households (159 | 5.0%) accounting for the largest median household size of 3.8 persons per household. non-family households (776 | 24.2%) represent the smallest median household size with 1.21 persons per household.
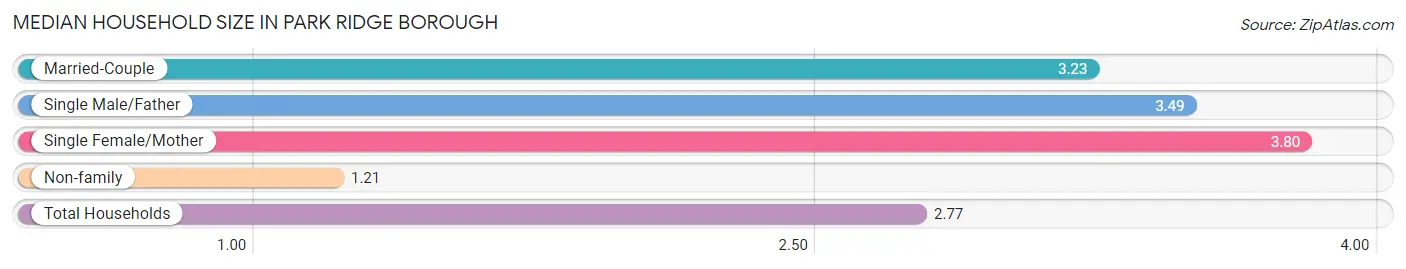
| Household Type | # Households | Household Size |
| Married-Couple | 2,227 (69.5%) | 3.23 |
| Single Male/Father | 41 (1.3%) | 3.49 |
| Single Female/Mother | 159 (5.0%) | 3.80 |
| Non-family | 776 (24.2%) | 1.21 |
| Total Households | 3,203 (100.0%) | 2.77 |
Household Size by Marriage Status in Park Ridge borough
Out of a total of 3,203 households in Park Ridge borough, 2,427 (75.8%) are family households, while 776 (24.2%) are nonfamily households. The most numerous type of family households are 2-person households, comprising 909, and the most common type of nonfamily households are 1-person households, comprising 642.
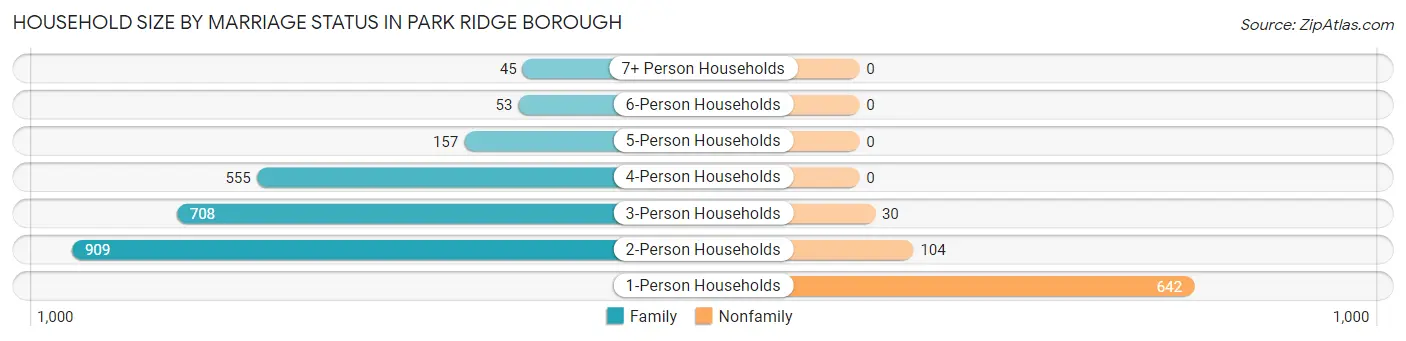
| Household Size | Family Households | Nonfamily Households |
| 1-Person Households | - | 642 (20.0%) |
| 2-Person Households | 909 (28.4%) | 104 (3.3%) |
| 3-Person Households | 708 (22.1%) | 30 (0.9%) |
| 4-Person Households | 555 (17.3%) | 0 (0.0%) |
| 5-Person Households | 157 (4.9%) | 0 (0.0%) |
| 6-Person Households | 53 (1.7%) | 0 (0.0%) |
| 7+ Person Households | 45 (1.4%) | 0 (0.0%) |
| Total | 2,427 (75.8%) | 776 (24.2%) |
Female Fertility in Park Ridge borough
Fertility by Age in Park Ridge borough
Average fertility rate in Park Ridge borough is 27.0 births per 1,000 women. Women in the age bracket of 20 to 34 years have the highest fertility rate with 65.0 births per 1,000 women. Women in the age bracket of 20 to 34 years acount for 82.4% of all women with births.
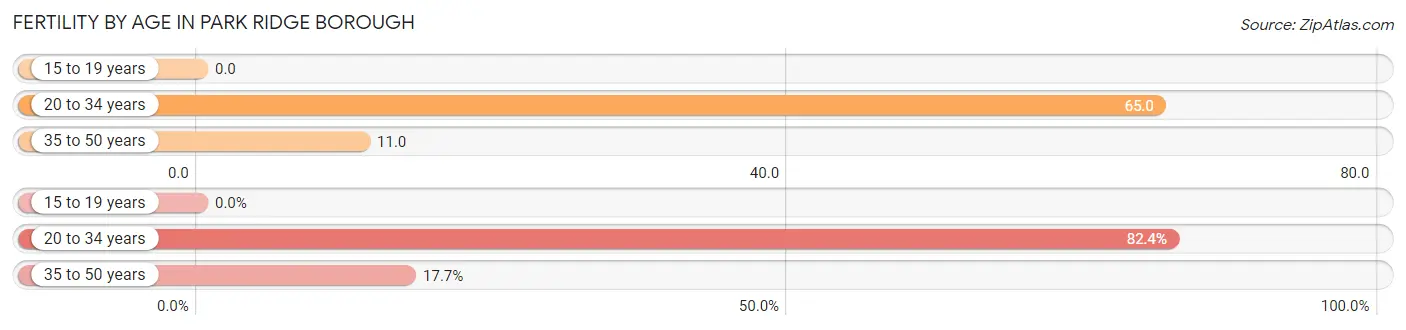
| Age Bracket | Women with Births | Births / 1,000 Women |
| 15 to 19 years | 0 (0.0%) | 0.0 |
| 20 to 34 years | 42 (82.4%) | 65.0 |
| 35 to 50 years | 9 (17.6%) | 11.0 |
| Total | 51 (100.0%) | 27.0 |
Fertility by Age by Marriage Status in Park Ridge borough
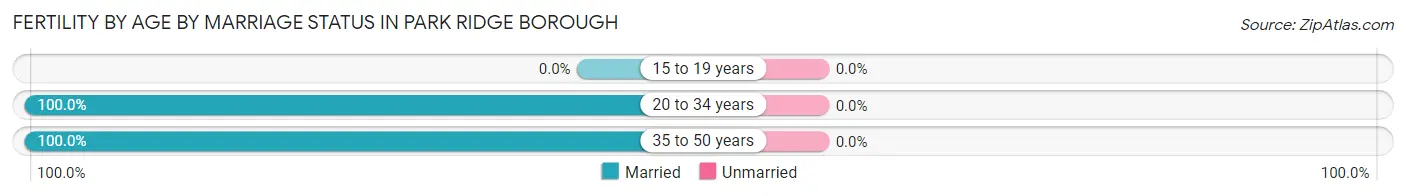
| Age Bracket | Married | Unmarried |
| 15 to 19 years | 0 (0.0%) | 0 (0.0%) |
| 20 to 34 years | 42 (100.0%) | 0 (0.0%) |
| 35 to 50 years | 9 (100.0%) | 0 (0.0%) |
| Total | 51 (100.0%) | 0 (0.0%) |
Fertility by Education in Park Ridge borough
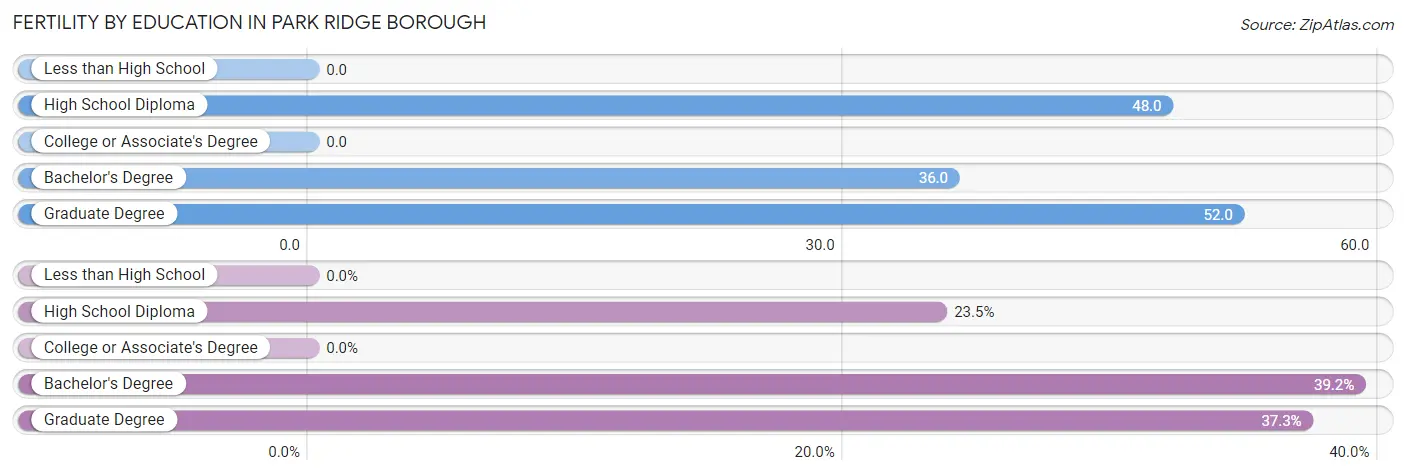
| Educational Attainment | Women with Births | Births / 1,000 Women |
| Less than High School | 0 (0.0%) | 0.0 |
| High School Diploma | 12 (23.5%) | 48.0 |
| College or Associate's Degree | 0 (0.0%) | 0.0 |
| Bachelor's Degree | 20 (39.2%) | 36.0 |
| Graduate Degree | 19 (37.2%) | 52.0 |
| Total | 51 (100.0%) | 27.0 |
Fertility by Education by Marriage Status in Park Ridge borough
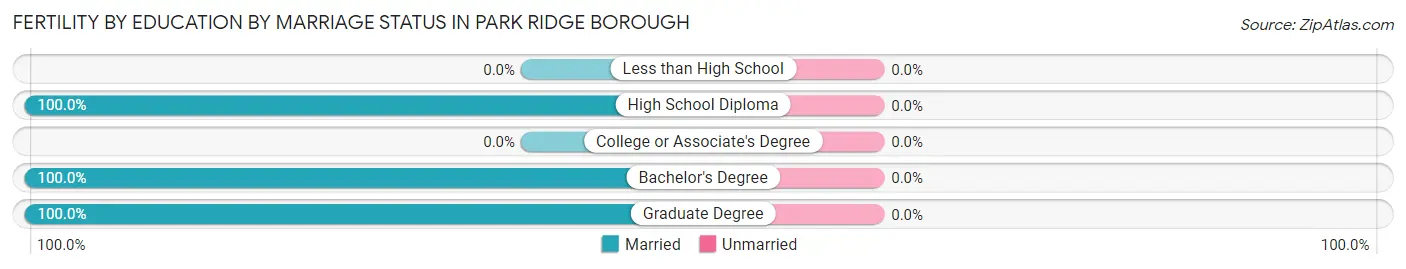
| Educational Attainment | Married | Unmarried |
| Less than High School | 0 (0.0%) | 0 (0.0%) |
| High School Diploma | 12 (100.0%) | 0 (0.0%) |
| College or Associate's Degree | 0 (0.0%) | 0 (0.0%) |
| Bachelor's Degree | 20 (100.0%) | 0 (0.0%) |
| Graduate Degree | 19 (100.0%) | 0 (0.0%) |
| Total | 51 (100.0%) | 0 (0.0%) |
Employment Characteristics in Park Ridge borough
Employment by Class of Employer in Park Ridge borough
Among the 4,976 employed individuals in Park Ridge borough, private company employees (3,560 | 71.5%), local government employees (676 | 13.6%), and self-employed (incorporated) (283 | 5.7%) make up the most common classes of employment.
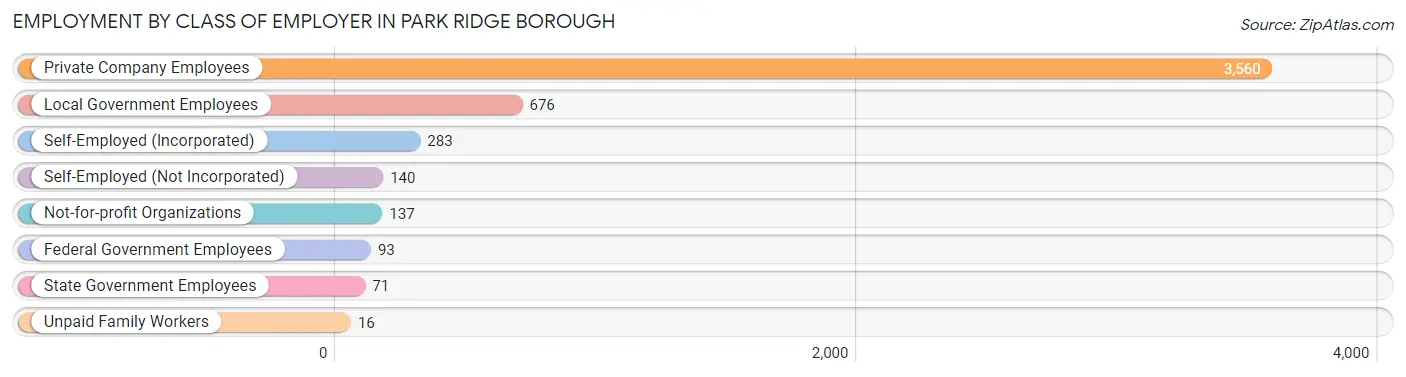
| Employer Class | # Employees | % Employees |
| Private Company Employees | 3,560 | 71.5% |
| Self-Employed (Incorporated) | 283 | 5.7% |
| Self-Employed (Not Incorporated) | 140 | 2.8% |
| Not-for-profit Organizations | 137 | 2.8% |
| Local Government Employees | 676 | 13.6% |
| State Government Employees | 71 | 1.4% |
| Federal Government Employees | 93 | 1.9% |
| Unpaid Family Workers | 16 | 0.3% |
| Total | 4,976 | 100.0% |
Employment Status by Age in Park Ridge borough
According to the labor force statistics for Park Ridge borough, out of the total population over 16 years of age (7,744), 66.8% or 5,173 individuals are in the labor force, with 3.0% or 155 of them unemployed. The age group with the highest labor force participation rate is 30 to 34 years, with 94.0% or 343 individuals in the labor force. Within the labor force, the 25 to 29 years age range has the highest percentage of unemployed individuals, with 14.7% or 53 of them being unemployed.
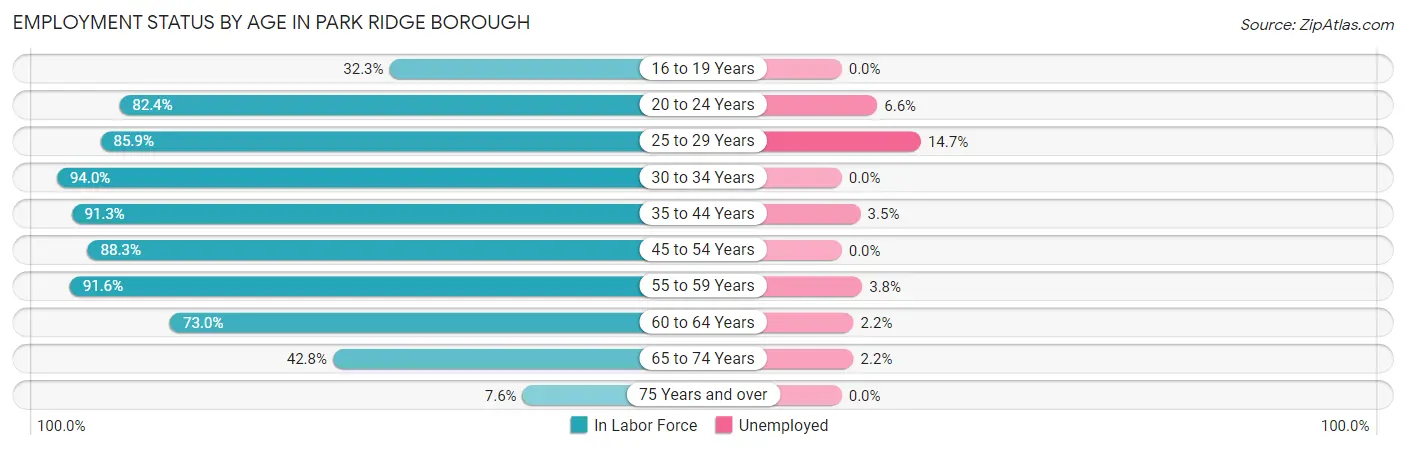
| Age Bracket | In Labor Force | Unemployed |
| 16 to 19 Years | 250 (32.3%) | 0 (0.0%) |
| 20 to 24 Years | 407 (82.4%) | 27 (6.6%) |
| 25 to 29 Years | 360 (85.9%) | 53 (14.7%) |
| 30 to 34 Years | 343 (94.0%) | 0 (0.0%) |
| 35 to 44 Years | 806 (91.3%) | 28 (3.5%) |
| 45 to 54 Years | 1,272 (88.3%) | 0 (0.0%) |
| 55 to 59 Years | 770 (91.6%) | 29 (3.8%) |
| 60 to 64 Years | 448 (73.0%) | 10 (2.2%) |
| 65 to 74 Years | 455 (42.8%) | 10 (2.2%) |
| 75 Years and over | 65 (7.6%) | 0 (0.0%) |
| Total | 5,173 (66.8%) | 155 (3.0%) |
Employment Status by Educational Attainment in Park Ridge borough
According to labor force statistics for Park Ridge borough, 87.6% of individuals (3,997) out of the total population between 25 and 64 years of age (4,563) are in the labor force, with 3.0% or 120 of them being unemployed. The group with the highest labor force participation rate are those with the educational attainment of bachelor's degree or higher, with 89.4% or 2,530 individuals in the labor force. Within the labor force, individuals with college / associate degree education have the highest percentage of unemployment, with 8.6% or 65 of them being unemployed.
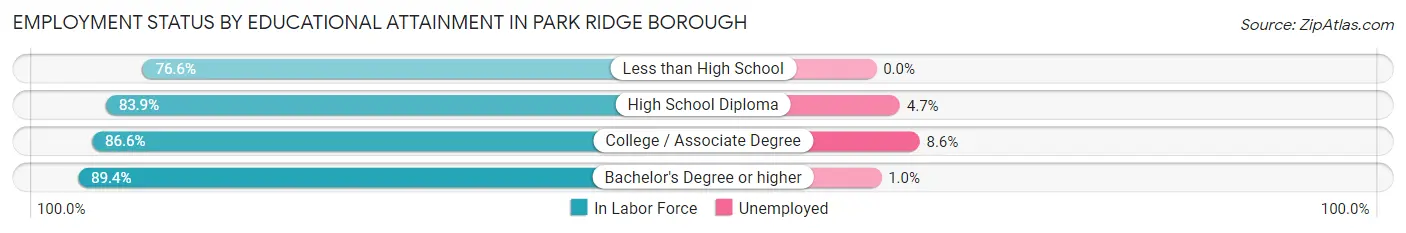
| Educational Attainment | In Labor Force | Unemployed |
| Less than High School | 105 (76.6%) | 0 (0.0%) |
| High School Diploma | 611 (83.9%) | 34 (4.7%) |
| College / Associate Degree | 752 (86.6%) | 75 (8.6%) |
| Bachelor's Degree or higher | 2,530 (89.4%) | 28 (1.0%) |
| Total | 3,997 (87.6%) | 137 (3.0%) |
Employment Occupations by Sex in Park Ridge borough
Management, Business, Science and Arts Occupations
The most common Management, Business, Science and Arts occupations in Park Ridge borough are Community & Social Service (840 | 16.7%), Management (725 | 14.4%), Education Instruction & Library (605 | 12.0%), Business & Financial (517 | 10.3%), and Computers, Engineering & Science (375 | 7.5%).
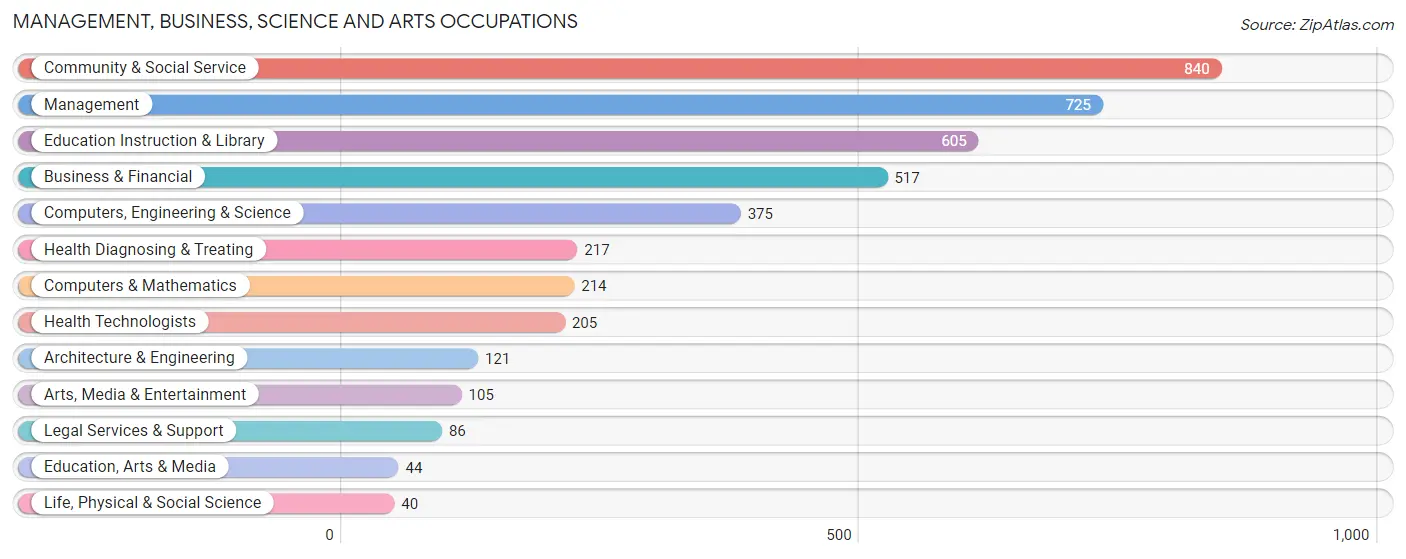
Management, Business, Science and Arts Occupations by Sex
Within the Management, Business, Science and Arts occupations in Park Ridge borough, the most male-oriented occupations are Architecture & Engineering (100.0%), Life, Physical & Social Science (100.0%), and Computers, Engineering & Science (92.0%), while the most female-oriented occupations are Education, Arts & Media (97.7%), Education Instruction & Library (87.4%), and Health Diagnosing & Treating (87.1%).
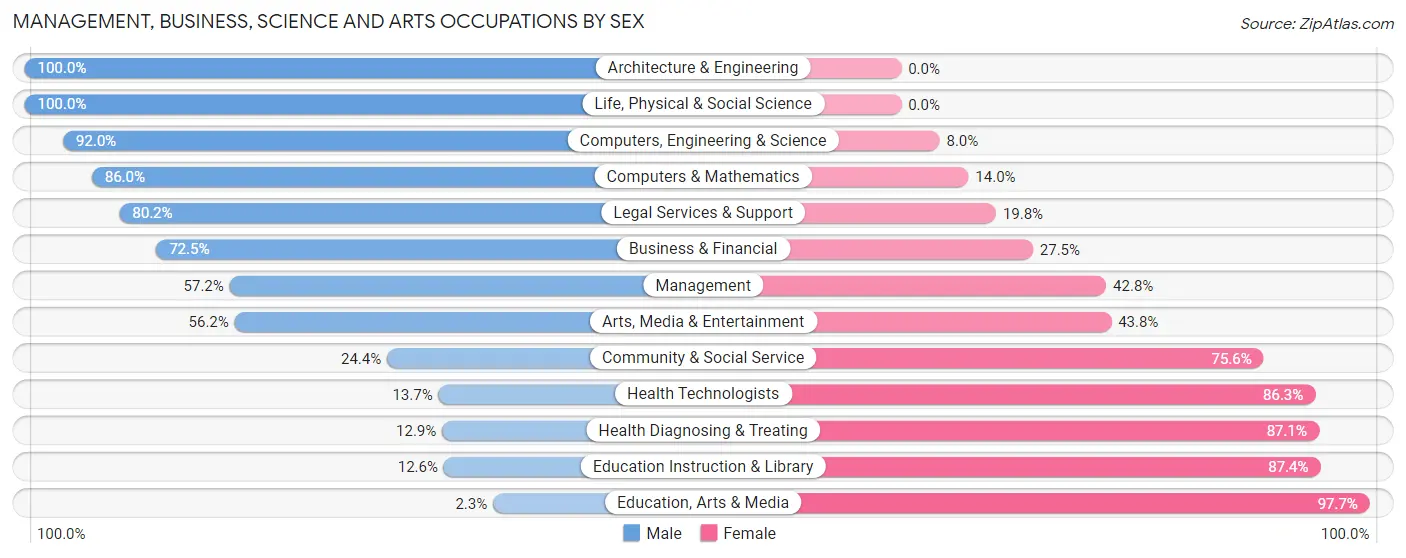
| Occupation | Male | Female |
| Management | 415 (57.2%) | 310 (42.8%) |
| Business & Financial | 375 (72.5%) | 142 (27.5%) |
| Computers, Engineering & Science | 345 (92.0%) | 30 (8.0%) |
| Computers & Mathematics | 184 (86.0%) | 30 (14.0%) |
| Architecture & Engineering | 121 (100.0%) | 0 (0.0%) |
| Life, Physical & Social Science | 40 (100.0%) | 0 (0.0%) |
| Community & Social Service | 205 (24.4%) | 635 (75.6%) |
| Education, Arts & Media | 1 (2.3%) | 43 (97.7%) |
| Legal Services & Support | 69 (80.2%) | 17 (19.8%) |
| Education Instruction & Library | 76 (12.6%) | 529 (87.4%) |
| Arts, Media & Entertainment | 59 (56.2%) | 46 (43.8%) |
| Health Diagnosing & Treating | 28 (12.9%) | 189 (87.1%) |
| Health Technologists | 28 (13.7%) | 177 (86.3%) |
| Total (Category) | 1,368 (51.2%) | 1,306 (48.8%) |
| Total (Overall) | 2,603 (51.9%) | 2,416 (48.1%) |
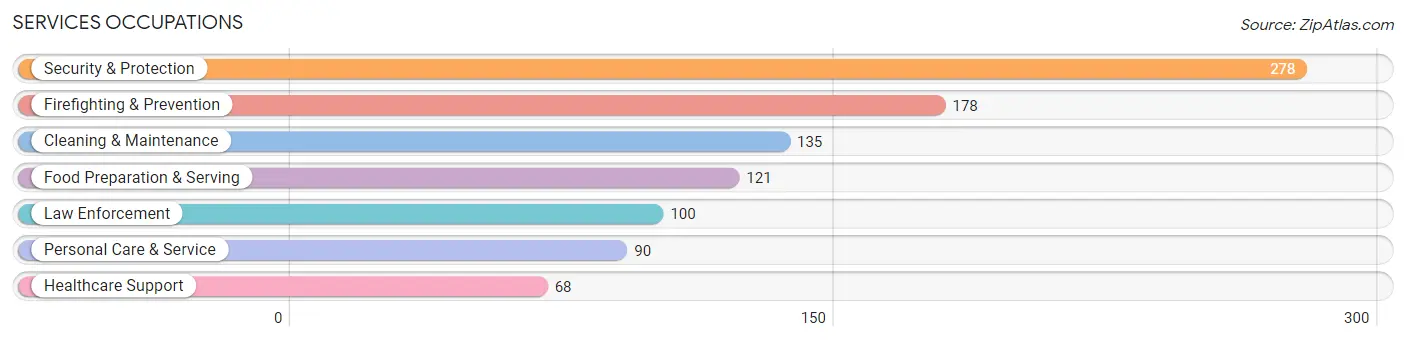
Services Occupations
The most common Services occupations in Park Ridge borough are Security & Protection (278 | 5.5%), Firefighting & Prevention (178 | 3.5%), Cleaning & Maintenance (135 | 2.7%), Food Preparation & Serving (121 | 2.4%), and Law Enforcement (100 | 2.0%).
Services Occupations by Sex
Within the Services occupations in Park Ridge borough, the most male-oriented occupations are Law Enforcement (81.0%), Security & Protection (80.2%), and Firefighting & Prevention (79.8%), while the most female-oriented occupations are Healthcare Support (100.0%), Personal Care & Service (70.0%), and Food Preparation & Serving (66.9%).
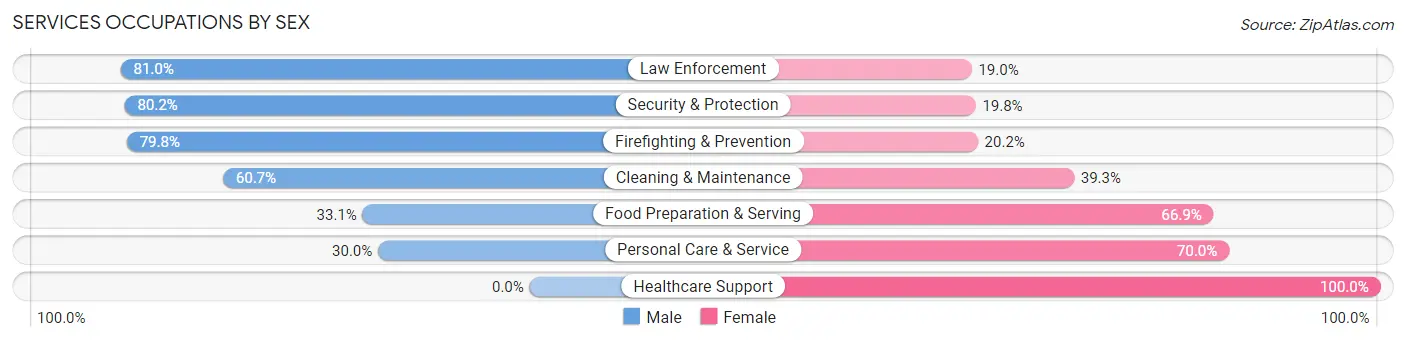
| Occupation | Male | Female |
| Healthcare Support | 0 (0.0%) | 68 (100.0%) |
| Security & Protection | 223 (80.2%) | 55 (19.8%) |
| Firefighting & Prevention | 142 (79.8%) | 36 (20.2%) |
| Law Enforcement | 81 (81.0%) | 19 (19.0%) |
| Food Preparation & Serving | 40 (33.1%) | 81 (66.9%) |
| Cleaning & Maintenance | 82 (60.7%) | 53 (39.3%) |
| Personal Care & Service | 27 (30.0%) | 63 (70.0%) |
| Total (Category) | 372 (53.8%) | 320 (46.2%) |
| Total (Overall) | 2,603 (51.9%) | 2,416 (48.1%) |
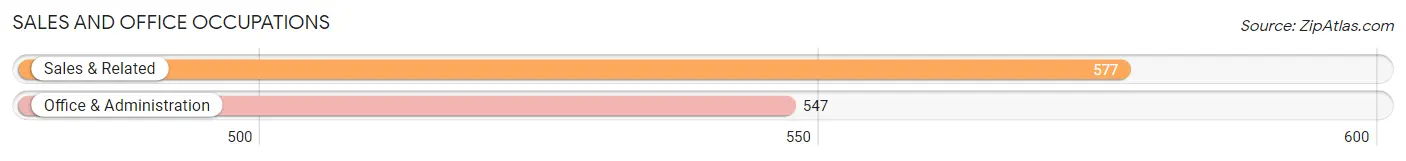
Sales and Office Occupations
The most common Sales and Office occupations in Park Ridge borough are Sales & Related (577 | 11.5%), and Office & Administration (547 | 10.9%).
Sales and Office Occupations by Sex
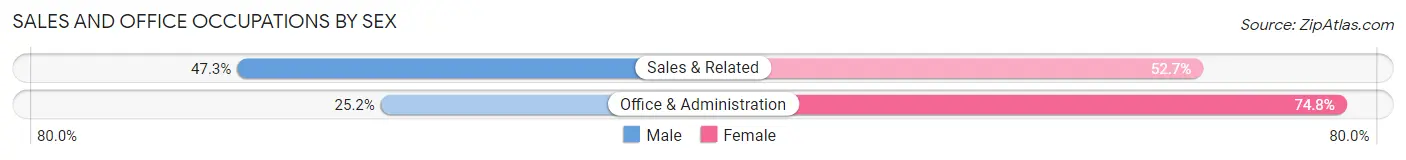
| Occupation | Male | Female |
| Sales & Related | 273 (47.3%) | 304 (52.7%) |
| Office & Administration | 138 (25.2%) | 409 (74.8%) |
| Total (Category) | 411 (36.6%) | 713 (63.4%) |
| Total (Overall) | 2,603 (51.9%) | 2,416 (48.1%) |
Natural Resources, Construction and Maintenance Occupations
The most common Natural Resources, Construction and Maintenance occupations in Park Ridge borough are Construction & Extraction (96 | 1.9%), and Installation, Maintenance & Repair (72 | 1.4%).
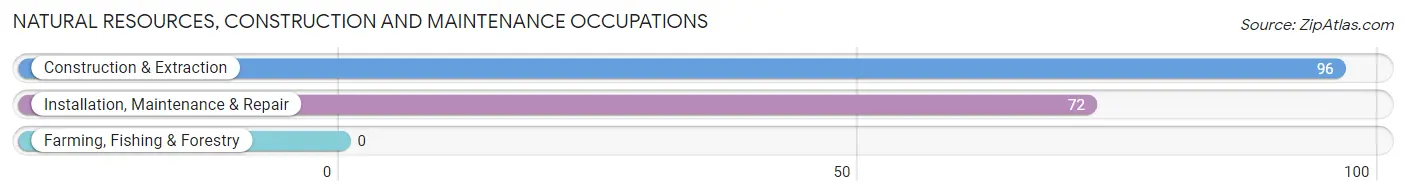
Natural Resources, Construction and Maintenance Occupations by Sex
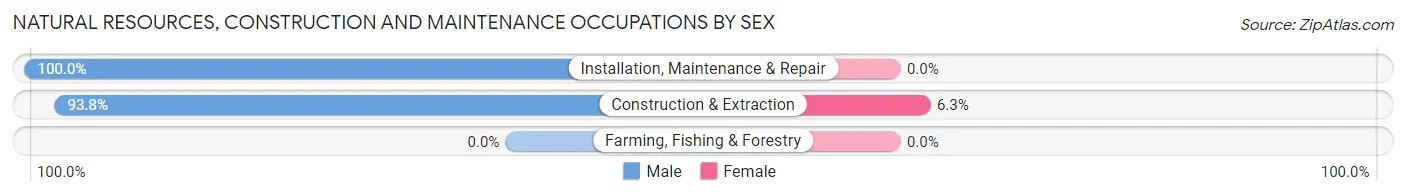
| Occupation | Male | Female |
| Farming, Fishing & Forestry | 0 (0.0%) | 0 (0.0%) |
| Construction & Extraction | 90 (93.8%) | 6 (6.2%) |
| Installation, Maintenance & Repair | 72 (100.0%) | 0 (0.0%) |
| Total (Category) | 162 (96.4%) | 6 (3.6%) |
| Total (Overall) | 2,603 (51.9%) | 2,416 (48.1%) |
Production, Transportation and Moving Occupations
The most common Production, Transportation and Moving occupations in Park Ridge borough are Production (159 | 3.2%), Transportation (141 | 2.8%), and Material Moving (61 | 1.2%).
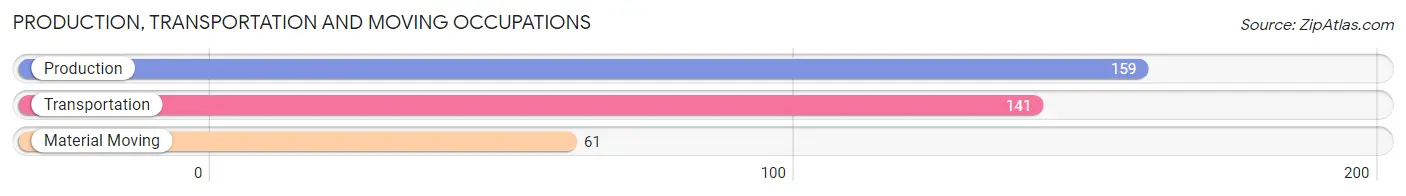
Production, Transportation and Moving Occupations by Sex
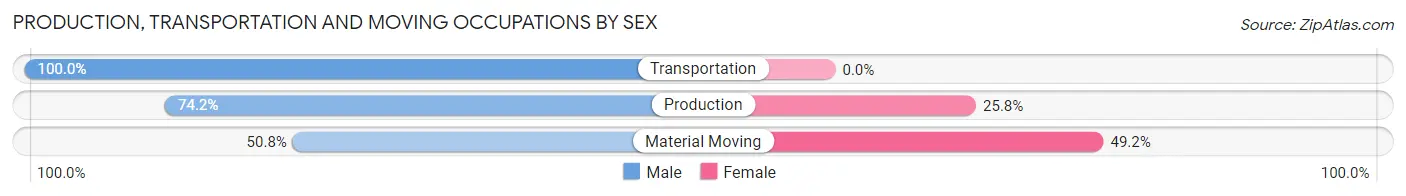
| Occupation | Male | Female |
| Production | 118 (74.2%) | 41 (25.8%) |
| Transportation | 141 (100.0%) | 0 (0.0%) |
| Material Moving | 31 (50.8%) | 30 (49.2%) |
| Total (Category) | 290 (80.3%) | 71 (19.7%) |
| Total (Overall) | 2,603 (51.9%) | 2,416 (48.1%) |
Employment Industries by Sex in Park Ridge borough
Employment Industries in Park Ridge borough
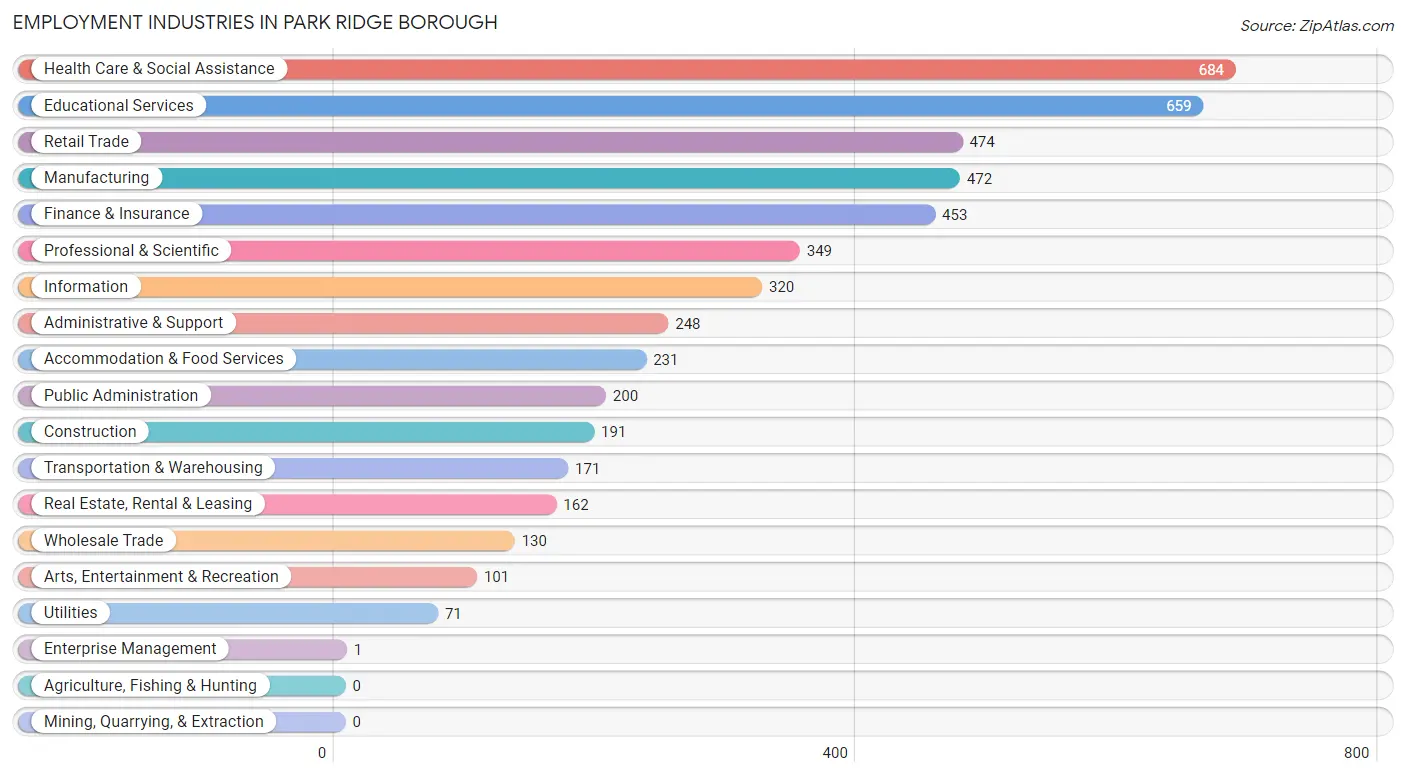
The major employment industries in Park Ridge borough include Health Care & Social Assistance (684 | 13.6%), Educational Services (659 | 13.1%), Retail Trade (474 | 9.4%), Manufacturing (472 | 9.4%), and Finance & Insurance (453 | 9.0%).
Employment Industries by Sex in Park Ridge borough
The Park Ridge borough industries that see more men than women are Enterprise Management (100.0%), Transportation & Warehousing (87.1%), and Accommodation & Food Services (85.7%), whereas the industries that tend to have a higher number of women are Health Care & Social Assistance (85.1%), Educational Services (77.1%), and Real Estate, Rental & Leasing (65.4%).
| Industry | Male | Female |
| Agriculture, Fishing & Hunting | 0 (0.0%) | 0 (0.0%) |
| Mining, Quarrying, & Extraction | 0 (0.0%) | 0 (0.0%) |
| Construction | 143 (74.9%) | 48 (25.1%) |
| Manufacturing | 338 (71.6%) | 134 (28.4%) |
| Wholesale Trade | 67 (51.5%) | 63 (48.5%) |
| Retail Trade | 183 (38.6%) | 291 (61.4%) |
| Transportation & Warehousing | 149 (87.1%) | 22 (12.9%) |
| Utilities | 56 (78.9%) | 15 (21.1%) |
| Information | 170 (53.1%) | 150 (46.9%) |
| Finance & Insurance | 331 (73.1%) | 122 (26.9%) |
| Real Estate, Rental & Leasing | 56 (34.6%) | 106 (65.4%) |
| Professional & Scientific | 292 (83.7%) | 57 (16.3%) |
| Enterprise Management | 1 (100.0%) | 0 (0.0%) |
| Administrative & Support | 143 (57.7%) | 105 (42.3%) |
| Educational Services | 151 (22.9%) | 508 (77.1%) |
| Health Care & Social Assistance | 102 (14.9%) | 582 (85.1%) |
| Arts, Entertainment & Recreation | 37 (36.6%) | 64 (63.4%) |
| Accommodation & Food Services | 198 (85.7%) | 33 (14.3%) |
| Public Administration | 145 (72.5%) | 55 (27.5%) |
| Total | 2,603 (51.9%) | 2,416 (48.1%) |
Education in Park Ridge borough
School Enrollment in Park Ridge borough
The most common levels of schooling among the 2,297 students in Park Ridge borough are high school (698 | 30.4%), middle school (491 | 21.4%), and college / undergraduate (479 | 20.8%).
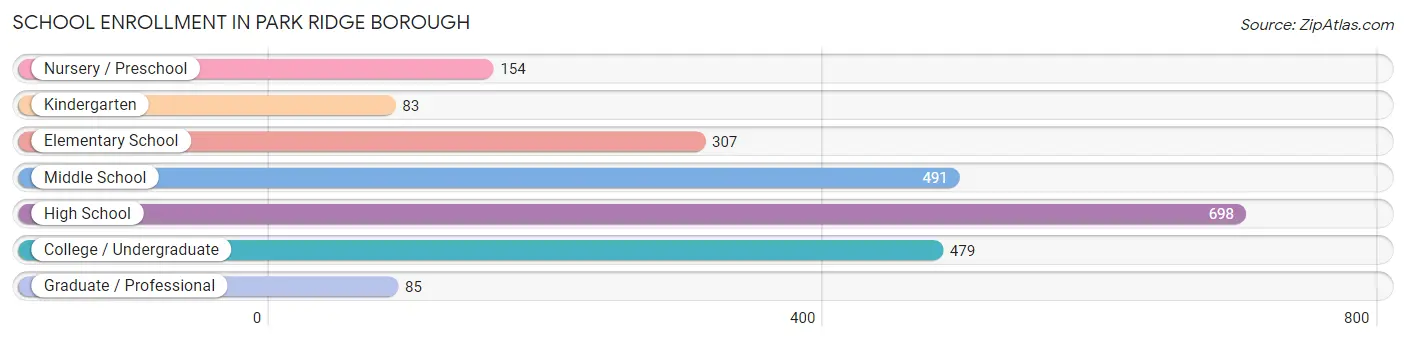
| School Level | # Students | % Students |
| Nursery / Preschool | 154 | 6.7% |
| Kindergarten | 83 | 3.6% |
| Elementary School | 307 | 13.4% |
| Middle School | 491 | 21.4% |
| High School | 698 | 30.4% |
| College / Undergraduate | 479 | 20.8% |
| Graduate / Professional | 85 | 3.7% |
| Total | 2,297 | 100.0% |
School Enrollment by Age by Funding Source in Park Ridge borough
Out of a total of 2,297 students who are enrolled in schools in Park Ridge borough, 551 (24.0%) attend a private institution, while the remaining 1,746 (76.0%) are enrolled in public schools. The age group of 25 to 34 year olds has the highest likelihood of being enrolled in private schools, with 33 (73.3% in the age bracket) enrolled. Conversely, the age group of 10 to 14 year olds has the lowest likelihood of being enrolled in a private school, with 545 (93.5% in the age bracket) attending a public institution.
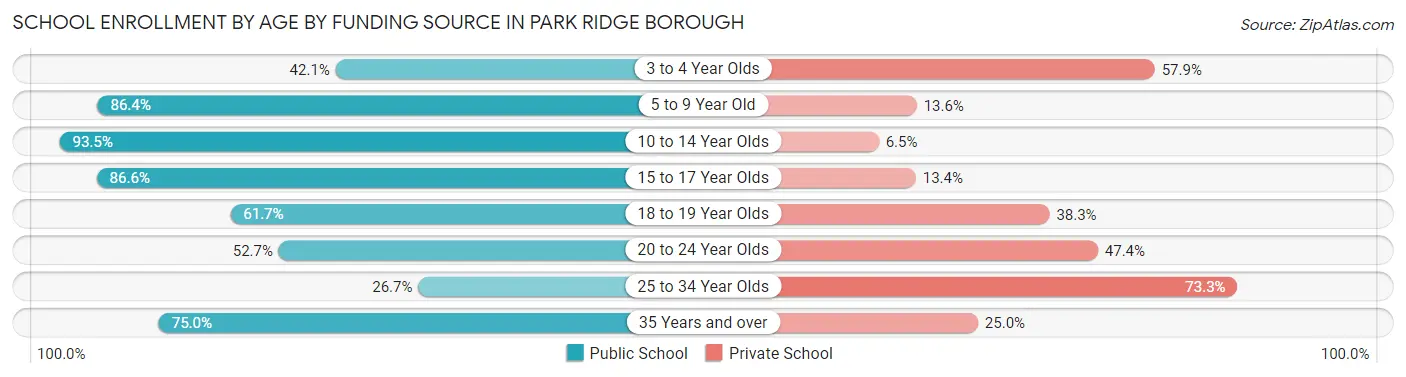
| Age Bracket | Public School | Private School |
| 3 to 4 Year Olds | 53 (42.1%) | 73 (57.9%) |
| 5 to 9 Year Old | 324 (86.4%) | 51 (13.6%) |
| 10 to 14 Year Olds | 545 (93.5%) | 38 (6.5%) |
| 15 to 17 Year Olds | 361 (86.6%) | 56 (13.4%) |
| 18 to 19 Year Olds | 251 (61.7%) | 156 (38.3%) |
| 20 to 24 Year Olds | 139 (52.6%) | 125 (47.3%) |
| 25 to 34 Year Olds | 12 (26.7%) | 33 (73.3%) |
| 35 Years and over | 60 (75.0%) | 20 (25.0%) |
| Total | 1,746 (76.0%) | 551 (24.0%) |
Educational Attainment by Field of Study in Park Ridge borough
Business (1,004 | 26.4%), education (408 | 10.7%), social sciences (345 | 9.1%), science & technology (335 | 8.8%), and bio, nature & agricultural (287 | 7.5%) are the most common fields of study among 3,801 individuals in Park Ridge borough who have obtained a bachelor's degree or higher.
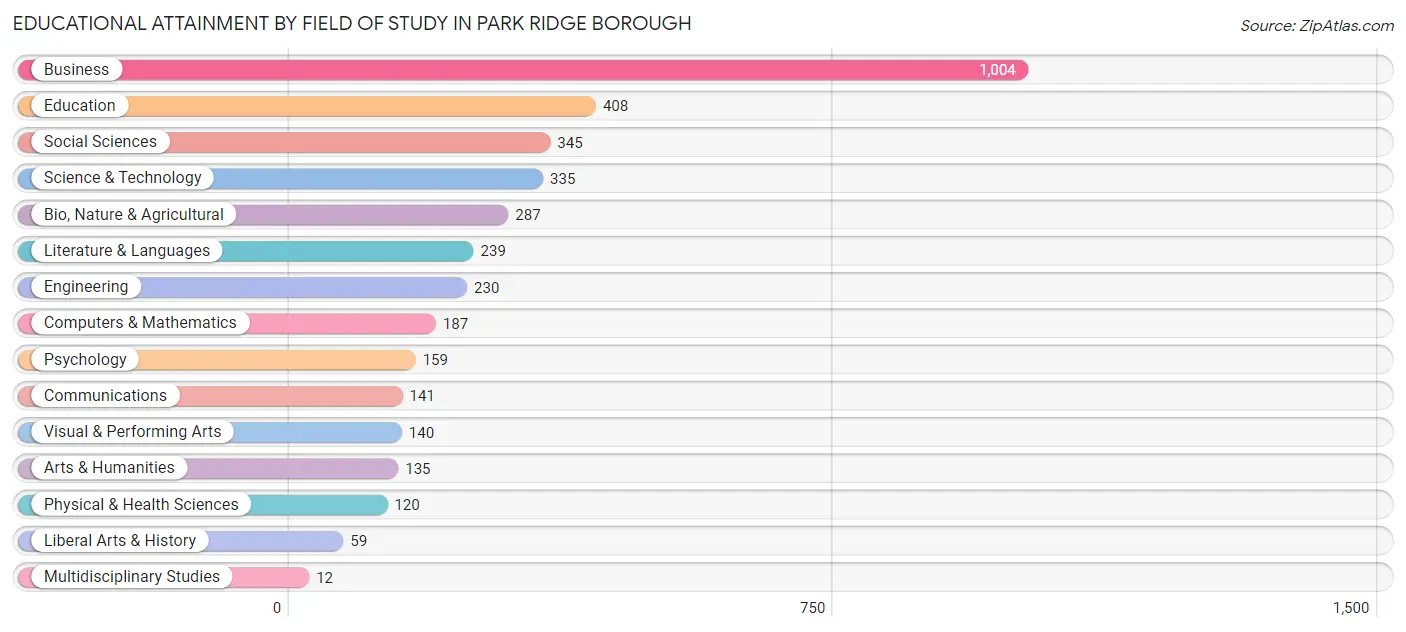
| Field of Study | # Graduates | % Graduates |
| Computers & Mathematics | 187 | 4.9% |
| Bio, Nature & Agricultural | 287 | 7.5% |
| Physical & Health Sciences | 120 | 3.2% |
| Psychology | 159 | 4.2% |
| Social Sciences | 345 | 9.1% |
| Engineering | 230 | 6.0% |
| Multidisciplinary Studies | 12 | 0.3% |
| Science & Technology | 335 | 8.8% |
| Business | 1,004 | 26.4% |
| Education | 408 | 10.7% |
| Literature & Languages | 239 | 6.3% |
| Liberal Arts & History | 59 | 1.5% |
| Visual & Performing Arts | 140 | 3.7% |
| Communications | 141 | 3.7% |
| Arts & Humanities | 135 | 3.5% |
| Total | 3,801 | 100.0% |
Transportation & Commute in Park Ridge borough
Vehicle Availability by Sex in Park Ridge borough
The most prevalent vehicle ownership categories in Park Ridge borough are males with 2 vehicles (1,095, accounting for 42.8%) and females with 2 vehicles (1,084, making up 45.3%).
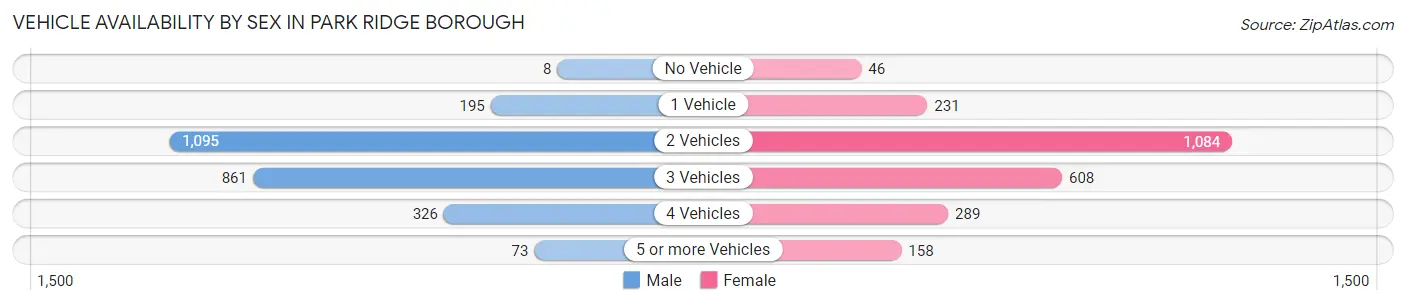
| Vehicles Available | Male | Female |
| No Vehicle | 8 (0.3%) | 46 (1.9%) |
| 1 Vehicle | 195 (7.6%) | 231 (9.6%) |
| 2 Vehicles | 1,095 (42.8%) | 1,084 (44.9%) |
| 3 Vehicles | 861 (33.7%) | 608 (25.2%) |
| 4 Vehicles | 326 (12.7%) | 289 (12.0%) |
| 5 or more Vehicles | 73 (2.9%) | 158 (6.5%) |
| Total | 2,558 (100.0%) | 2,416 (100.0%) |
Commute Time in Park Ridge borough
The most frequently occuring commute durations in Park Ridge borough are 10 to 14 minutes (636 commuters, 16.2%), 5 to 9 minutes (620 commuters, 15.8%), and 30 to 34 minutes (500 commuters, 12.7%).
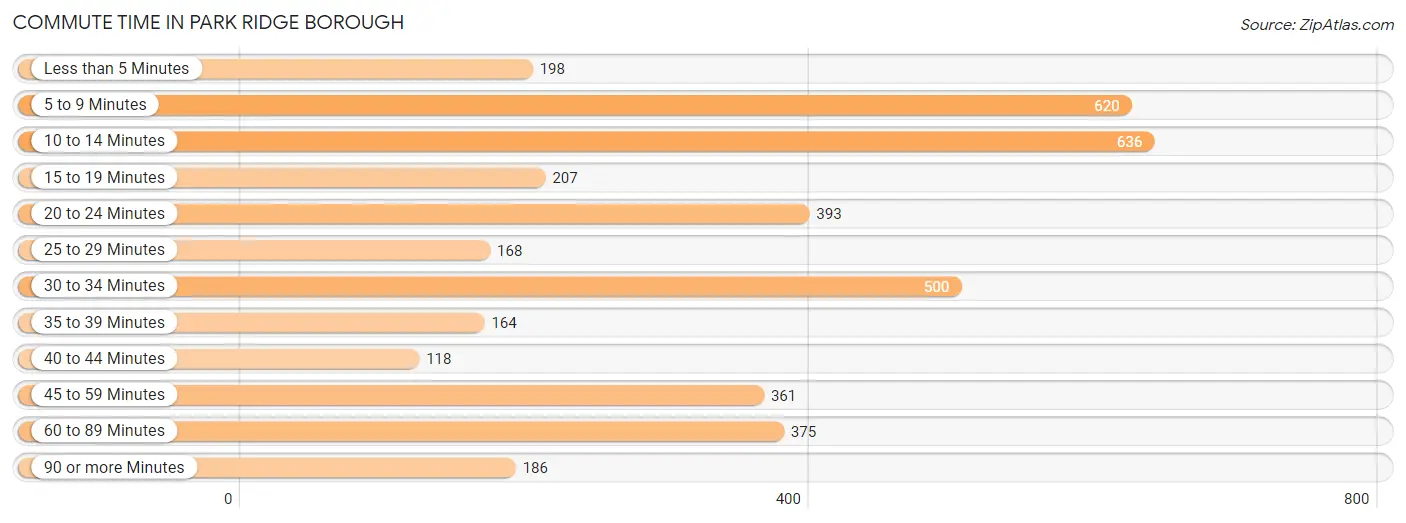
| Commute Time | # Commuters | % Commuters |
| Less than 5 Minutes | 198 | 5.0% |
| 5 to 9 Minutes | 620 | 15.8% |
| 10 to 14 Minutes | 636 | 16.2% |
| 15 to 19 Minutes | 207 | 5.3% |
| 20 to 24 Minutes | 393 | 10.0% |
| 25 to 29 Minutes | 168 | 4.3% |
| 30 to 34 Minutes | 500 | 12.7% |
| 35 to 39 Minutes | 164 | 4.2% |
| 40 to 44 Minutes | 118 | 3.0% |
| 45 to 59 Minutes | 361 | 9.2% |
| 60 to 89 Minutes | 375 | 9.6% |
| 90 or more Minutes | 186 | 4.7% |
Commute Time by Sex in Park Ridge borough
The most common commute times in Park Ridge borough are 10 to 14 minutes (320 commuters, 16.6%) for males and 5 to 9 minutes (427 commuters, 21.4%) for females.
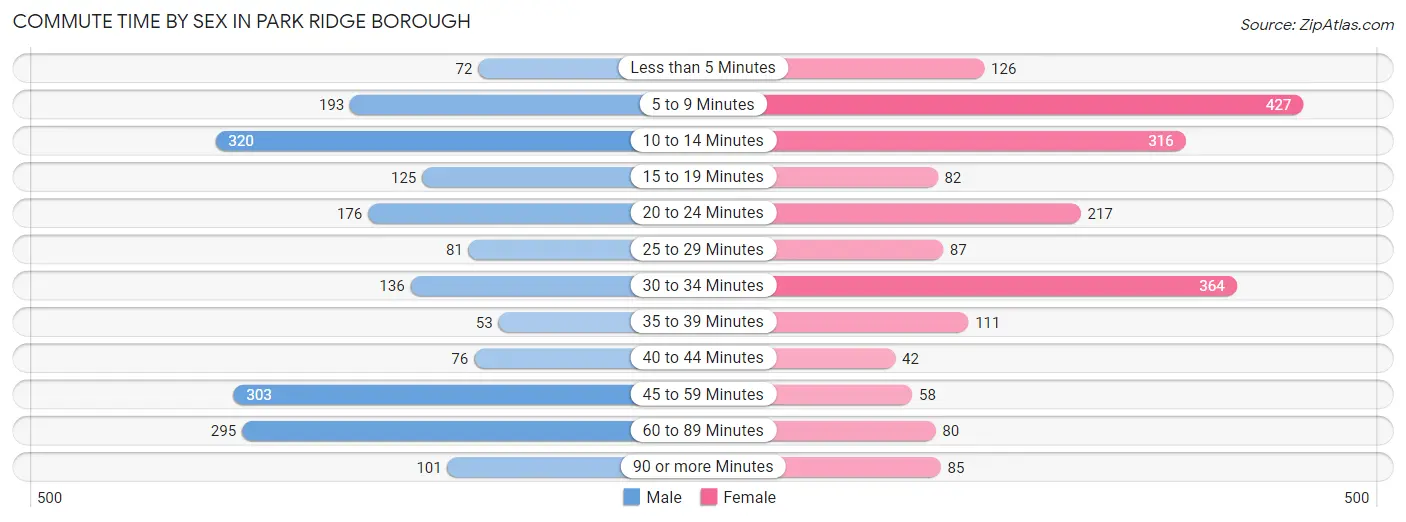
| Commute Time | Male | Female |
| Less than 5 Minutes | 72 (3.7%) | 126 (6.3%) |
| 5 to 9 Minutes | 193 (10.0%) | 427 (21.4%) |
| 10 to 14 Minutes | 320 (16.6%) | 316 (15.8%) |
| 15 to 19 Minutes | 125 (6.5%) | 82 (4.1%) |
| 20 to 24 Minutes | 176 (9.1%) | 217 (10.9%) |
| 25 to 29 Minutes | 81 (4.2%) | 87 (4.4%) |
| 30 to 34 Minutes | 136 (7.0%) | 364 (18.2%) |
| 35 to 39 Minutes | 53 (2.7%) | 111 (5.6%) |
| 40 to 44 Minutes | 76 (3.9%) | 42 (2.1%) |
| 45 to 59 Minutes | 303 (15.7%) | 58 (2.9%) |
| 60 to 89 Minutes | 295 (15.3%) | 80 (4.0%) |
| 90 or more Minutes | 101 (5.2%) | 85 (4.3%) |
Time of Departure to Work by Sex in Park Ridge borough
The most frequent times of departure to work in Park Ridge borough are 8:00 AM to 8:29 AM (377, 19.5%) for males and 8:00 AM to 8:29 AM (307, 15.4%) for females.
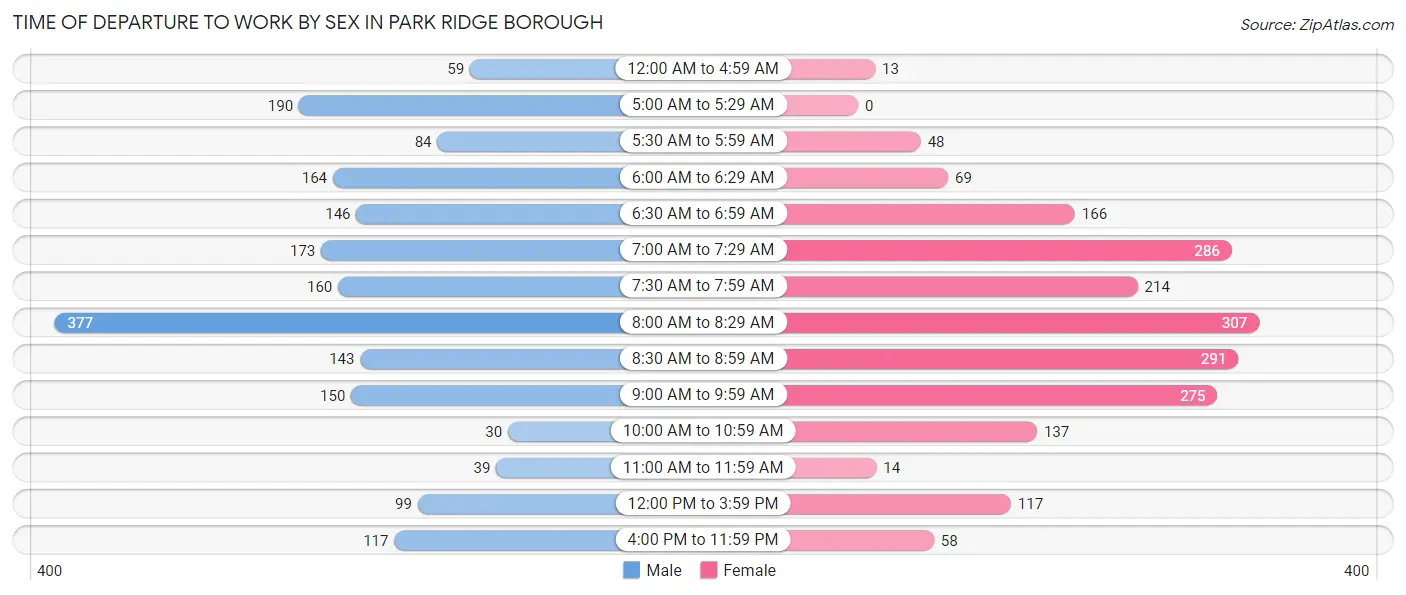
| Time of Departure | Male | Female |
| 12:00 AM to 4:59 AM | 59 (3.1%) | 13 (0.6%) |
| 5:00 AM to 5:29 AM | 190 (9.8%) | 0 (0.0%) |
| 5:30 AM to 5:59 AM | 84 (4.3%) | 48 (2.4%) |
| 6:00 AM to 6:29 AM | 164 (8.5%) | 69 (3.5%) |
| 6:30 AM to 6:59 AM | 146 (7.6%) | 166 (8.3%) |
| 7:00 AM to 7:29 AM | 173 (9.0%) | 286 (14.3%) |
| 7:30 AM to 7:59 AM | 160 (8.3%) | 214 (10.7%) |
| 8:00 AM to 8:29 AM | 377 (19.5%) | 307 (15.4%) |
| 8:30 AM to 8:59 AM | 143 (7.4%) | 291 (14.6%) |
| 9:00 AM to 9:59 AM | 150 (7.8%) | 275 (13.8%) |
| 10:00 AM to 10:59 AM | 30 (1.5%) | 137 (6.9%) |
| 11:00 AM to 11:59 AM | 39 (2.0%) | 14 (0.7%) |
| 12:00 PM to 3:59 PM | 99 (5.1%) | 117 (5.9%) |
| 4:00 PM to 11:59 PM | 117 (6.1%) | 58 (2.9%) |
| Total | 1,931 (100.0%) | 1,995 (100.0%) |
Housing Occupancy in Park Ridge borough
Occupancy by Ownership in Park Ridge borough
Of the total 3,203 dwellings in Park Ridge borough, owner-occupied units account for 2,629 (82.1%), while renter-occupied units make up 574 (17.9%).
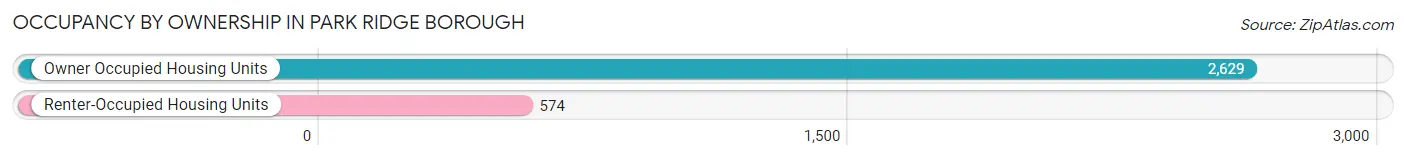
| Occupancy | # Housing Units | % Housing Units |
| Owner Occupied Housing Units | 2,629 | 82.1% |
| Renter-Occupied Housing Units | 574 | 17.9% |
| Total Occupied Housing Units | 3,203 | 100.0% |
Occupancy by Household Size in Park Ridge borough
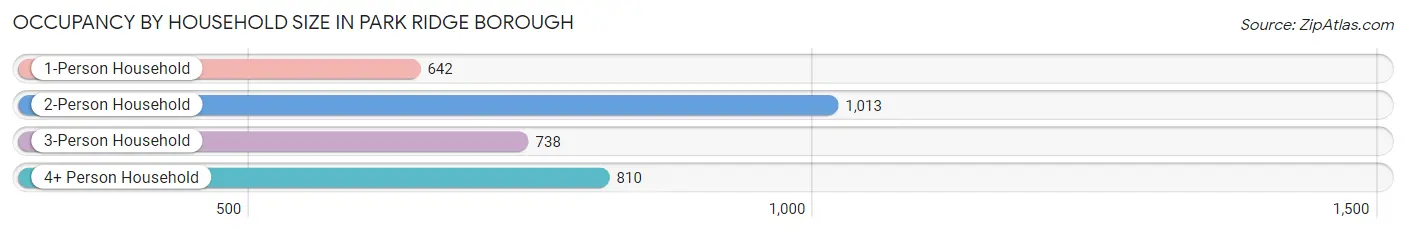
| Household Size | # Housing Units | % Housing Units |
| 1-Person Household | 642 | 20.0% |
| 2-Person Household | 1,013 | 31.6% |
| 3-Person Household | 738 | 23.0% |
| 4+ Person Household | 810 | 25.3% |
| Total Housing Units | 3,203 | 100.0% |
Occupancy by Ownership by Household Size in Park Ridge borough
| Household Size | Owner-occupied | Renter-occupied |
| 1-Person Household | 347 (54.0%) | 295 (46.0%) |
| 2-Person Household | 925 (91.3%) | 88 (8.7%) |
| 3-Person Household | 640 (86.7%) | 98 (13.3%) |
| 4+ Person Household | 717 (88.5%) | 93 (11.5%) |
| Total Housing Units | 2,629 (82.1%) | 574 (17.9%) |
Occupancy by Educational Attainment in Park Ridge borough
| Household Size | Owner-occupied | Renter-occupied |
| Less than High School | 41 (36.3%) | 72 (63.7%) |
| High School Diploma | 337 (64.6%) | 185 (35.4%) |
| College/Associate Degree | 541 (80.1%) | 134 (19.9%) |
| Bachelor's Degree or higher | 1,710 (90.3%) | 183 (9.7%) |
Occupancy by Age of Householder in Park Ridge borough
| Age Bracket | # Households | % Households |
| Under 35 Years | 306 | 9.6% |
| 35 to 44 Years | 424 | 13.2% |
| 45 to 54 Years | 739 | 23.1% |
| 55 to 64 Years | 682 | 21.3% |
| 65 to 74 Years | 595 | 18.6% |
| 75 to 84 Years | 248 | 7.7% |
| 85 Years and Over | 209 | 6.5% |
| Total | 3,203 | 100.0% |
Housing Finances in Park Ridge borough
Median Income by Occupancy in Park Ridge borough
| Occupancy Type | # Households | Median Income |
| Owner-Occupied | 2,629 (82.1%) | $188,734 |
| Renter-Occupied | 574 (17.9%) | $71,048 |
| Average | 3,203 (100.0%) | $164,241 |
Occupancy by Householder Income Bracket in Park Ridge borough
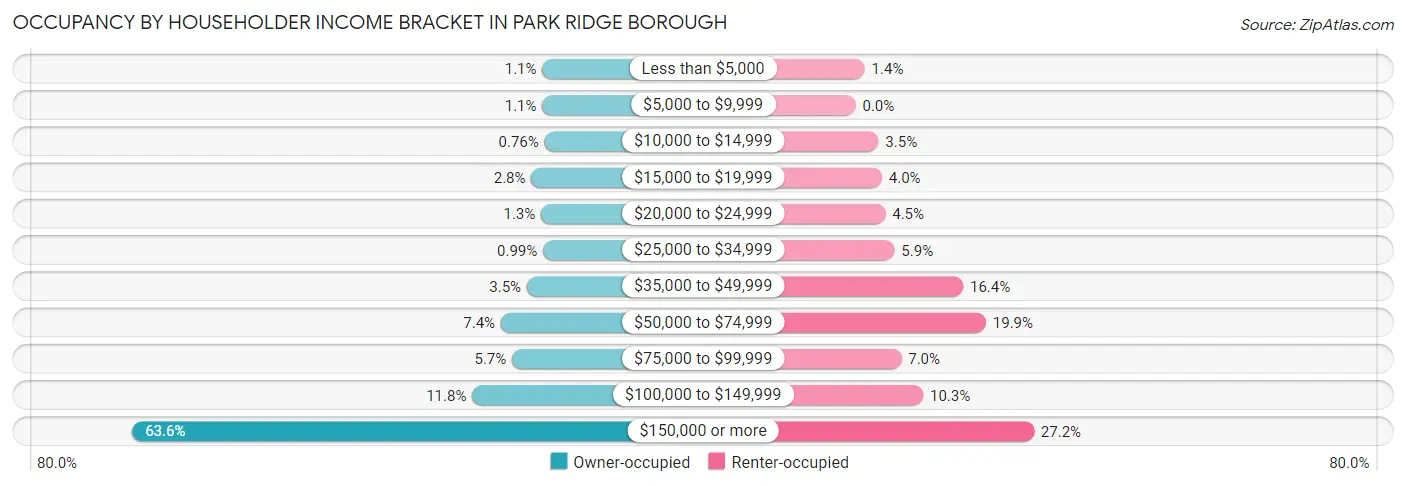
| Income Bracket | Owner-occupied | Renter-occupied |
| Less than $5,000 | 29 (1.1%) | 8 (1.4%) |
| $5,000 to $9,999 | 29 (1.1%) | 0 (0.0%) |
| $10,000 to $14,999 | 20 (0.8%) | 20 (3.5%) |
| $15,000 to $19,999 | 73 (2.8%) | 23 (4.0%) |
| $20,000 to $24,999 | 34 (1.3%) | 26 (4.5%) |
| $25,000 to $34,999 | 26 (1.0%) | 34 (5.9%) |
| $35,000 to $49,999 | 91 (3.5%) | 94 (16.4%) |
| $50,000 to $74,999 | 195 (7.4%) | 114 (19.9%) |
| $75,000 to $99,999 | 150 (5.7%) | 40 (7.0%) |
| $100,000 to $149,999 | 310 (11.8%) | 59 (10.3%) |
| $150,000 or more | 1,672 (63.6%) | 156 (27.2%) |
| Total | 2,629 (100.0%) | 574 (100.0%) |
Monthly Housing Cost Tiers in Park Ridge borough
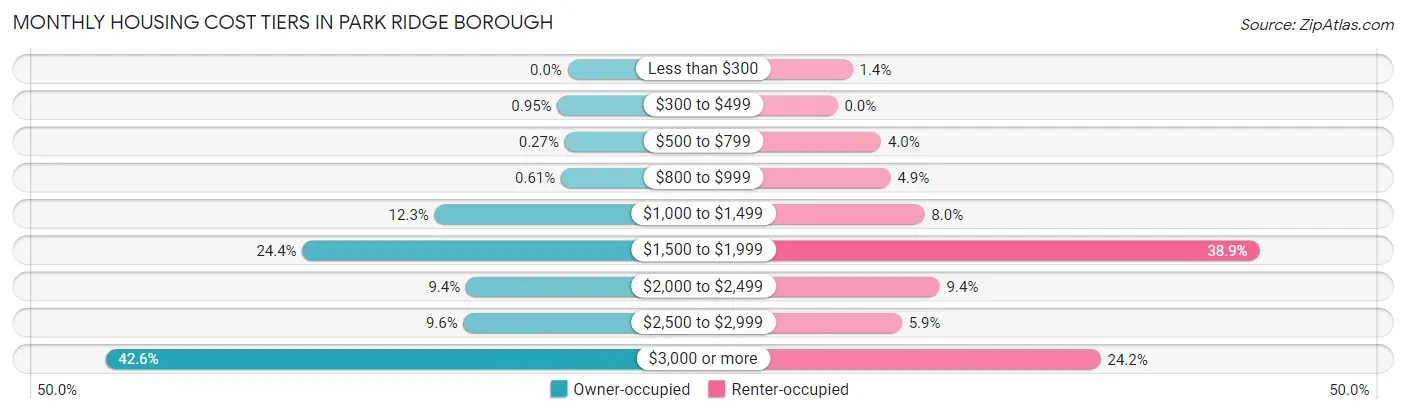
| Monthly Cost | Owner-occupied | Renter-occupied |
| Less than $300 | 0 (0.0%) | 8 (1.4%) |
| $300 to $499 | 25 (0.9%) | 0 (0.0%) |
| $500 to $799 | 7 (0.3%) | 23 (4.0%) |
| $800 to $999 | 16 (0.6%) | 28 (4.9%) |
| $1,000 to $1,499 | 322 (12.2%) | 46 (8.0%) |
| $1,500 to $1,999 | 642 (24.4%) | 223 (38.9%) |
| $2,000 to $2,499 | 246 (9.4%) | 54 (9.4%) |
| $2,500 to $2,999 | 252 (9.6%) | 34 (5.9%) |
| $3,000 or more | 1,119 (42.6%) | 139 (24.2%) |
| Total | 2,629 (100.0%) | 574 (100.0%) |
Physical Housing Characteristics in Park Ridge borough
Housing Structures in Park Ridge borough
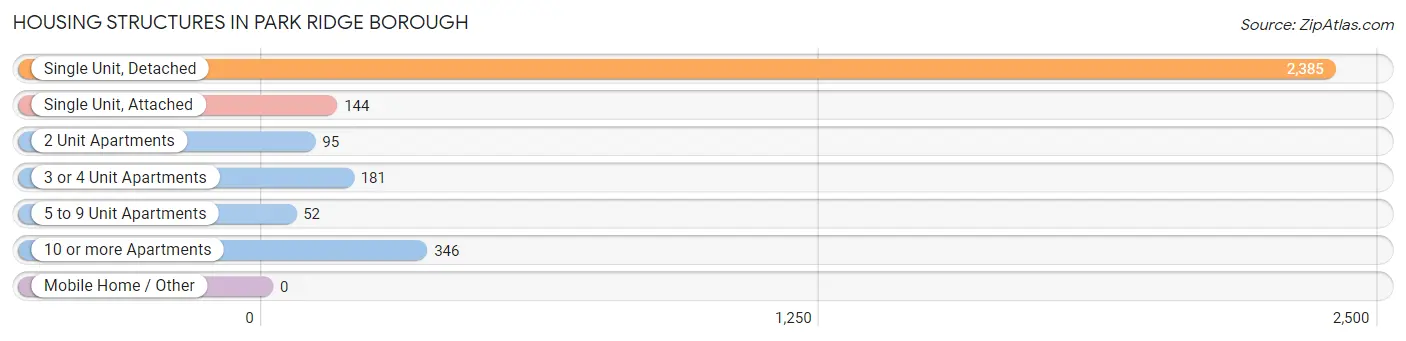
| Structure Type | # Housing Units | % Housing Units |
| Single Unit, Detached | 2,385 | 74.5% |
| Single Unit, Attached | 144 | 4.5% |
| 2 Unit Apartments | 95 | 3.0% |
| 3 or 4 Unit Apartments | 181 | 5.7% |
| 5 to 9 Unit Apartments | 52 | 1.6% |
| 10 or more Apartments | 346 | 10.8% |
| Mobile Home / Other | 0 | 0.0% |
| Total | 3,203 | 100.0% |
Housing Structures by Occupancy in Park Ridge borough
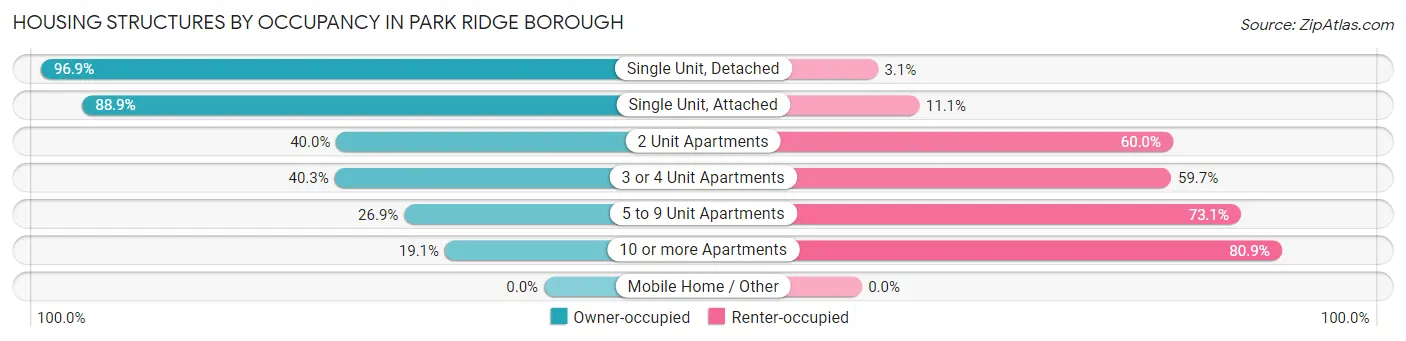
| Structure Type | Owner-occupied | Renter-occupied |
| Single Unit, Detached | 2,310 (96.9%) | 75 (3.1%) |
| Single Unit, Attached | 128 (88.9%) | 16 (11.1%) |
| 2 Unit Apartments | 38 (40.0%) | 57 (60.0%) |
| 3 or 4 Unit Apartments | 73 (40.3%) | 108 (59.7%) |
| 5 to 9 Unit Apartments | 14 (26.9%) | 38 (73.1%) |
| 10 or more Apartments | 66 (19.1%) | 280 (80.9%) |
| Mobile Home / Other | 0 (0.0%) | 0 (0.0%) |
| Total | 2,629 (82.1%) | 574 (17.9%) |
Housing Structures by Number of Rooms in Park Ridge borough
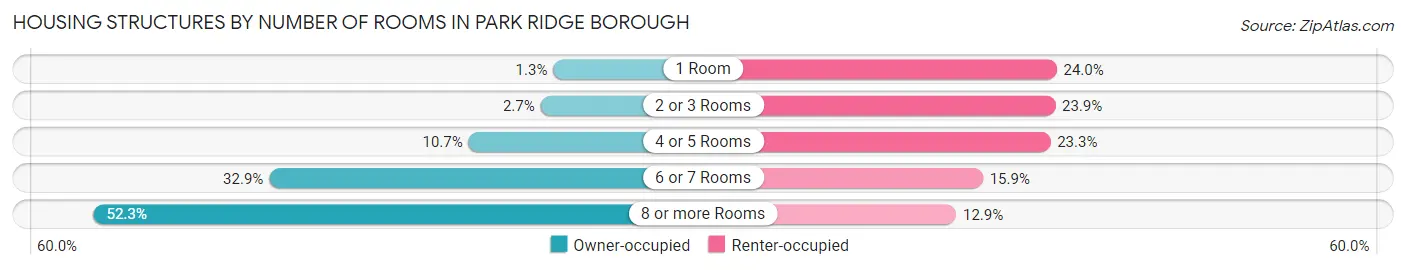
| Number of Rooms | Owner-occupied | Renter-occupied |
| 1 Room | 35 (1.3%) | 138 (24.0%) |
| 2 or 3 Rooms | 72 (2.7%) | 137 (23.9%) |
| 4 or 5 Rooms | 282 (10.7%) | 134 (23.3%) |
| 6 or 7 Rooms | 864 (32.9%) | 91 (15.9%) |
| 8 or more Rooms | 1,376 (52.3%) | 74 (12.9%) |
| Total | 2,629 (100.0%) | 574 (100.0%) |
Housing Structure by Heating Type in Park Ridge borough
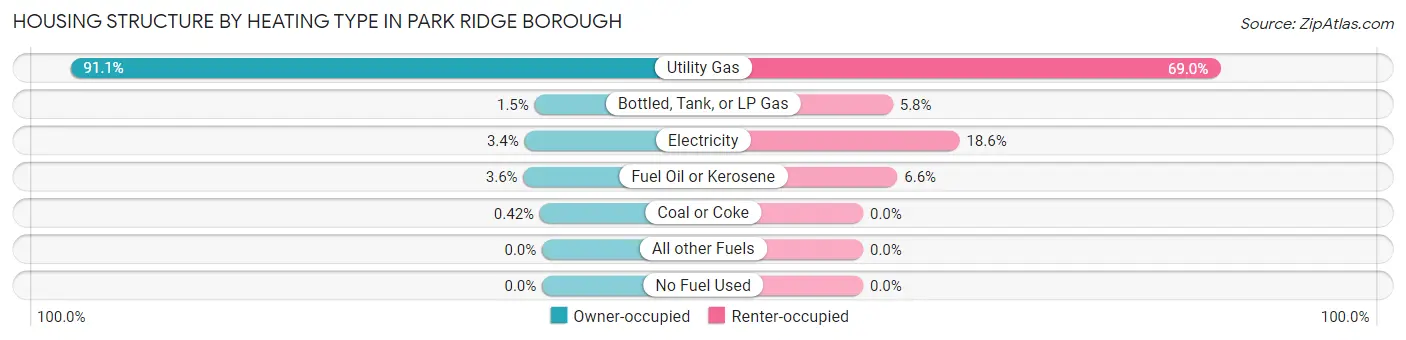
| Heating Type | Owner-occupied | Renter-occupied |
| Utility Gas | 2,396 (91.1%) | 396 (69.0%) |
| Bottled, Tank, or LP Gas | 38 (1.5%) | 33 (5.8%) |
| Electricity | 89 (3.4%) | 107 (18.6%) |
| Fuel Oil or Kerosene | 95 (3.6%) | 38 (6.6%) |
| Coal or Coke | 11 (0.4%) | 0 (0.0%) |
| All other Fuels | 0 (0.0%) | 0 (0.0%) |
| No Fuel Used | 0 (0.0%) | 0 (0.0%) |
| Total | 2,629 (100.0%) | 574 (100.0%) |
Household Vehicle Usage in Park Ridge borough
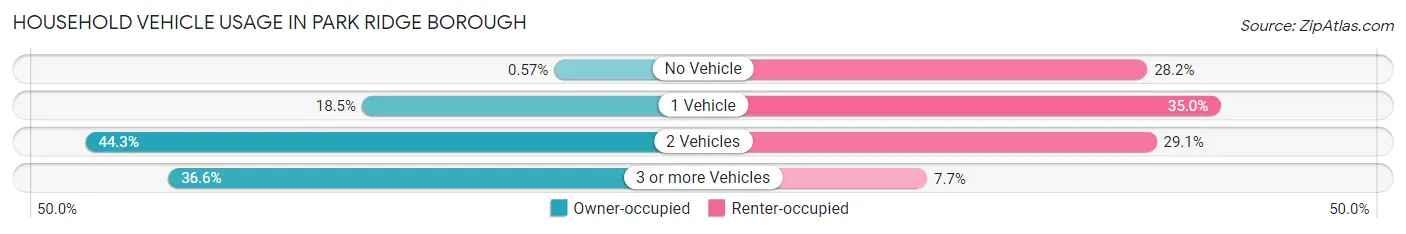
| Vehicles per Household | Owner-occupied | Renter-occupied |
| No Vehicle | 15 (0.6%) | 162 (28.2%) |
| 1 Vehicle | 487 (18.5%) | 201 (35.0%) |
| 2 Vehicles | 1,165 (44.3%) | 167 (29.1%) |
| 3 or more Vehicles | 962 (36.6%) | 44 (7.7%) |
| Total | 2,629 (100.0%) | 574 (100.0%) |
Real Estate & Mortgages in Park Ridge borough
Real Estate and Mortgage Overview in Park Ridge borough
| Characteristic | Without Mortgage | With Mortgage |
| Housing Units | 1,245 | 1,384 |
| Median Property Value | $646,800 | $678,300 |
| Median Household Income | $161,650 | $1,014 |
| Monthly Housing Costs | $1,501 | $1,025 |
| Real Estate Taxes | $10,001 | $52 |
Property Value by Mortgage Status in Park Ridge borough
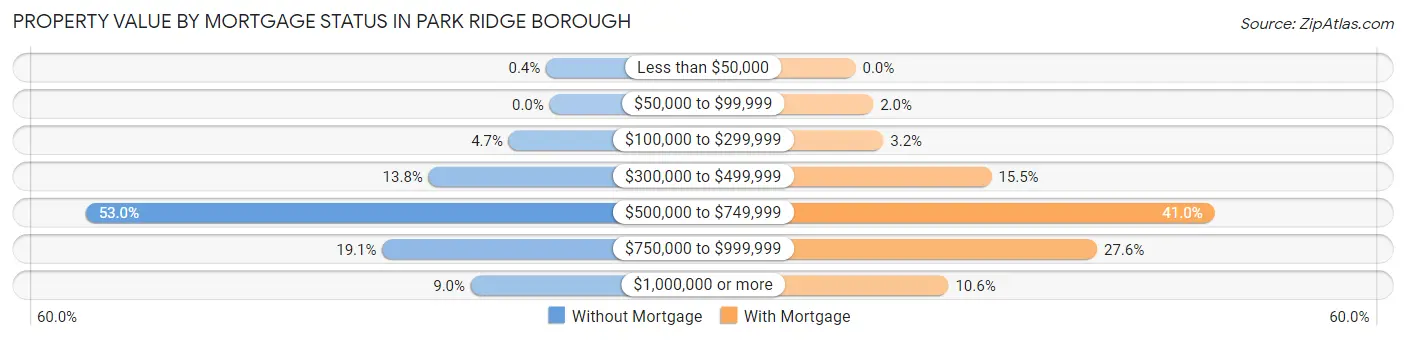
| Property Value | Without Mortgage | With Mortgage |
| Less than $50,000 | 5 (0.4%) | 0 (0.0%) |
| $50,000 to $99,999 | 0 (0.0%) | 28 (2.0%) |
| $100,000 to $299,999 | 58 (4.7%) | 44 (3.2%) |
| $300,000 to $499,999 | 172 (13.8%) | 215 (15.5%) |
| $500,000 to $749,999 | 660 (53.0%) | 568 (41.0%) |
| $750,000 to $999,999 | 238 (19.1%) | 382 (27.6%) |
| $1,000,000 or more | 112 (9.0%) | 147 (10.6%) |
| Total | 1,245 (100.0%) | 1,384 (100.0%) |
Household Income by Mortgage Status in Park Ridge borough
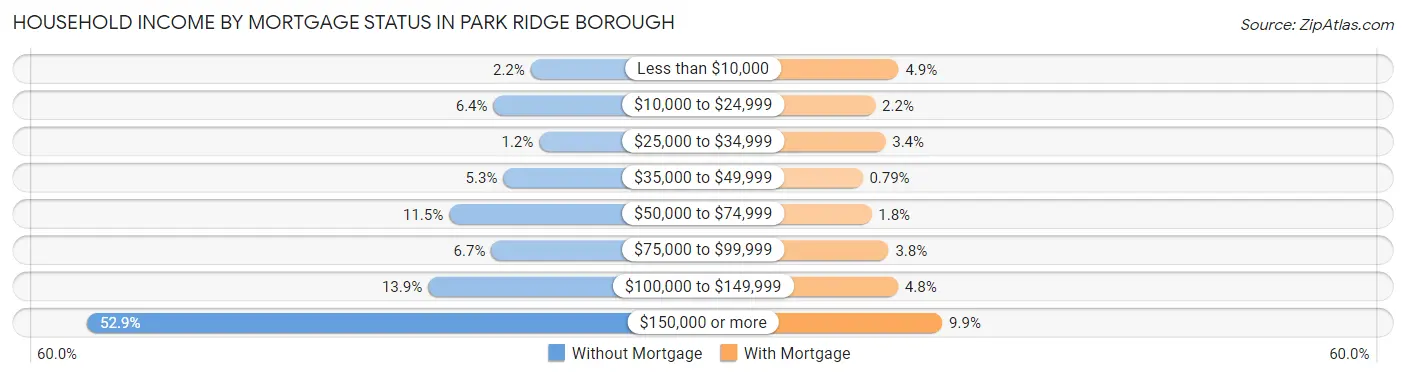
| Household Income | Without Mortgage | With Mortgage |
| Less than $10,000 | 27 (2.2%) | 68 (4.9%) |
| $10,000 to $24,999 | 80 (6.4%) | 31 (2.2%) |
| $25,000 to $34,999 | 15 (1.2%) | 47 (3.4%) |
| $35,000 to $49,999 | 66 (5.3%) | 11 (0.8%) |
| $50,000 to $74,999 | 143 (11.5%) | 25 (1.8%) |
| $75,000 to $99,999 | 83 (6.7%) | 52 (3.8%) |
| $100,000 to $149,999 | 173 (13.9%) | 67 (4.8%) |
| $150,000 or more | 658 (52.8%) | 137 (9.9%) |
| Total | 1,245 (100.0%) | 1,384 (100.0%) |
Property Value to Household Income Ratio in Park Ridge borough
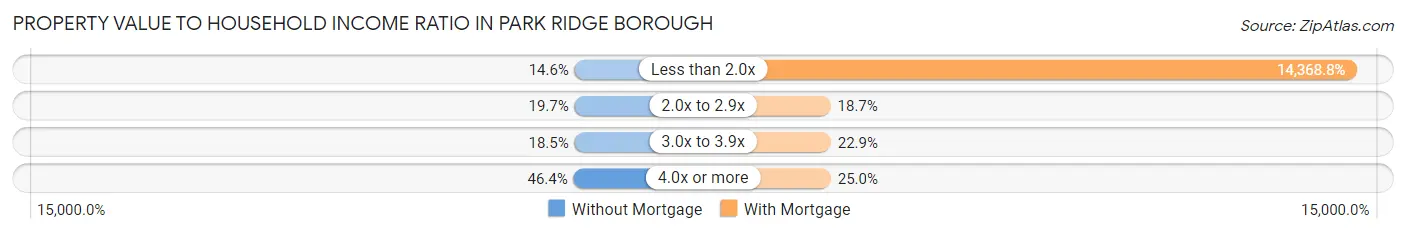
| Value-to-Income Ratio | Without Mortgage | With Mortgage |
| Less than 2.0x | 182 (14.6%) | 198,864 (14,368.8%) |
| 2.0x to 2.9x | 245 (19.7%) | 259 (18.7%) |
| 3.0x to 3.9x | 230 (18.5%) | 317 (22.9%) |
| 4.0x or more | 578 (46.4%) | 346 (25.0%) |
| Total | 1,245 (100.0%) | 1,384 (100.0%) |
Real Estate Taxes by Mortgage Status in Park Ridge borough
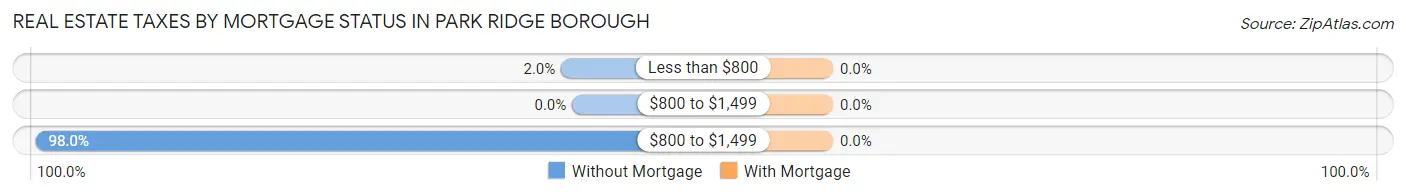
| Property Taxes | Without Mortgage | With Mortgage |
| Less than $800 | 25 (2.0%) | 0 (0.0%) |
| $800 to $1,499 | 0 (0.0%) | 0 (0.0%) |
| $800 to $1,499 | 1,220 (98.0%) | 0 (0.0%) |
| Total | 1,245 (100.0%) | 1,384 (100.0%) |
Health & Disability in Park Ridge borough
Health Insurance Coverage by Age in Park Ridge borough
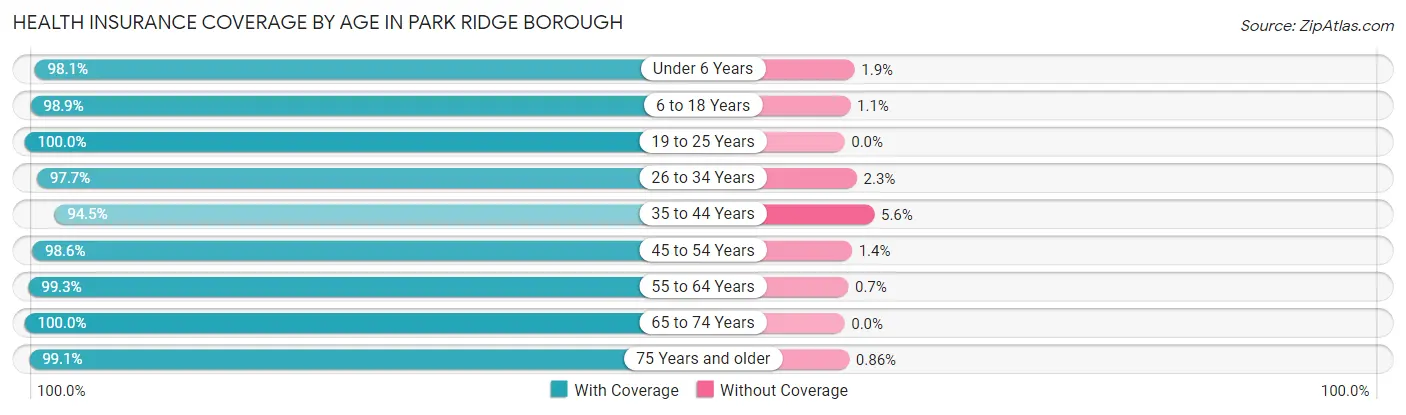
| Age Bracket | With Coverage | Without Coverage |
| Under 6 Years | 365 (98.1%) | 7 (1.9%) |
| 6 to 18 Years | 1,558 (98.9%) | 17 (1.1%) |
| 19 to 25 Years | 713 (100.0%) | 0 (0.0%) |
| 26 to 34 Years | 725 (97.7%) | 17 (2.3%) |
| 35 to 44 Years | 834 (94.5%) | 49 (5.6%) |
| 45 to 54 Years | 1,415 (98.6%) | 20 (1.4%) |
| 55 to 64 Years | 1,428 (99.3%) | 10 (0.7%) |
| 65 to 74 Years | 1,043 (100.0%) | 0 (0.0%) |
| 75 Years and older | 694 (99.1%) | 6 (0.9%) |
| Total | 8,775 (98.6%) | 126 (1.4%) |
Health Insurance Coverage by Citizenship Status in Park Ridge borough
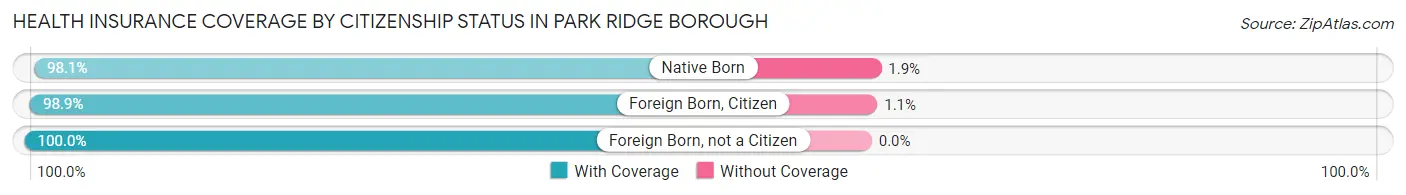
| Citizenship Status | With Coverage | Without Coverage |
| Native Born | 365 (98.1%) | 7 (1.9%) |
| Foreign Born, Citizen | 1,558 (98.9%) | 17 (1.1%) |
| Foreign Born, not a Citizen | 713 (100.0%) | 0 (0.0%) |
Health Insurance Coverage by Household Income in Park Ridge borough
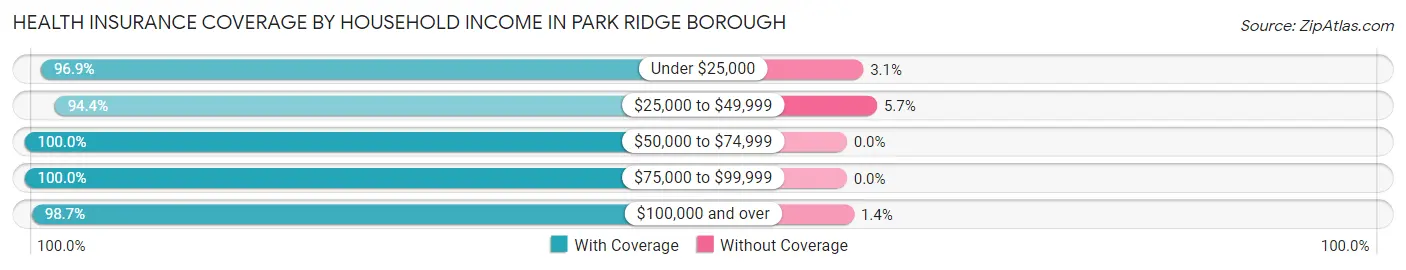
| Household Income | With Coverage | Without Coverage |
| Under $25,000 | 315 (96.9%) | 10 (3.1%) |
| $25,000 to $49,999 | 317 (94.4%) | 19 (5.7%) |
| $50,000 to $74,999 | 669 (100.0%) | 0 (0.0%) |
| $75,000 to $99,999 | 375 (100.0%) | 0 (0.0%) |
| $100,000 and over | 7,085 (98.7%) | 97 (1.3%) |
Public vs Private Health Insurance Coverage by Age in Park Ridge borough
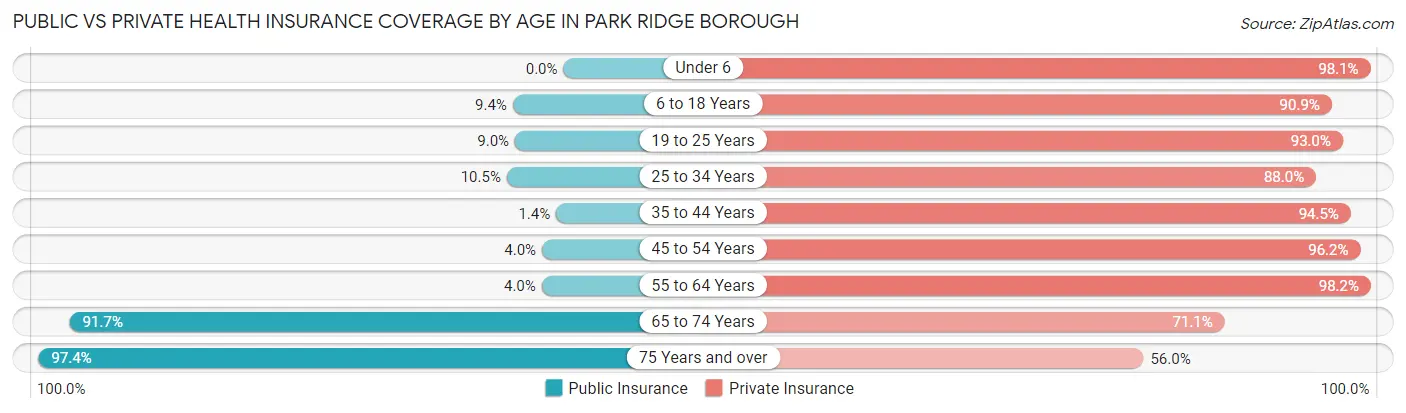
| Age Bracket | Public Insurance | Private Insurance |
| Under 6 | 0 (0.0%) | 365 (98.1%) |
| 6 to 18 Years | 148 (9.4%) | 1,432 (90.9%) |
| 19 to 25 Years | 64 (9.0%) | 663 (93.0%) |
| 25 to 34 Years | 78 (10.5%) | 653 (88.0%) |
| 35 to 44 Years | 12 (1.4%) | 834 (94.5%) |
| 45 to 54 Years | 57 (4.0%) | 1,381 (96.2%) |
| 55 to 64 Years | 58 (4.0%) | 1,412 (98.2%) |
| 65 to 74 Years | 956 (91.7%) | 741 (71.1%) |
| 75 Years and over | 682 (97.4%) | 392 (56.0%) |
| Total | 2,055 (23.1%) | 7,873 (88.4%) |
Disability Status by Sex by Age in Park Ridge borough
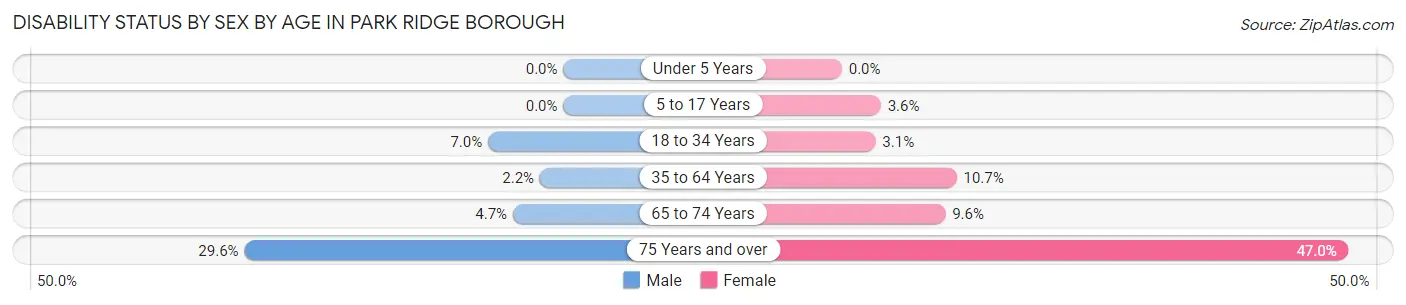
| Age Bracket | Male | Female |
| Under 5 Years | 0 (0.0%) | 0 (0.0%) |
| 5 to 17 Years | 0 (0.0%) | 24 (3.6%) |
| 18 to 34 Years | 59 (7.0%) | 27 (3.1%) |
| 35 to 64 Years | 40 (2.2%) | 204 (10.6%) |
| 65 to 74 Years | 23 (4.7%) | 53 (9.6%) |
| 75 Years and over | 82 (29.6%) | 199 (47.0%) |
Disability Class by Sex by Age in Park Ridge borough
Disability Class: Hearing Difficulty
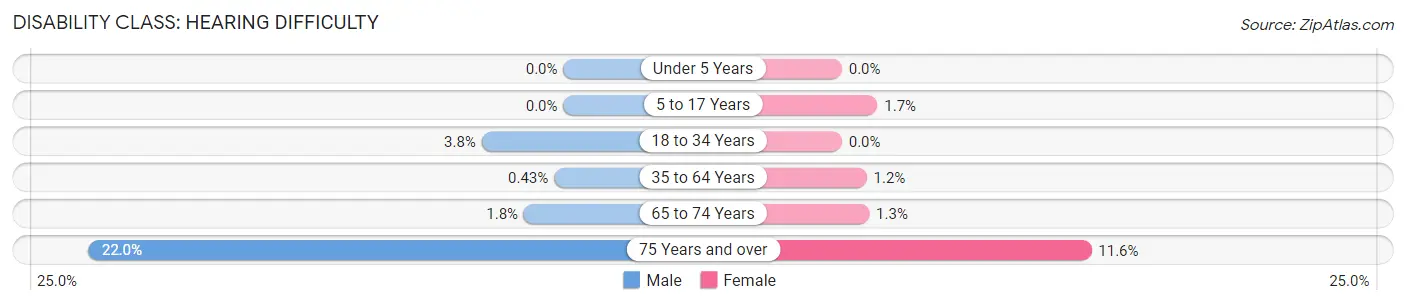
| Age Bracket | Male | Female |
| Under 5 Years | 0 (0.0%) | 0 (0.0%) |
| 5 to 17 Years | 0 (0.0%) | 11 (1.7%) |
| 18 to 34 Years | 32 (3.8%) | 0 (0.0%) |
| 35 to 64 Years | 8 (0.4%) | 22 (1.1%) |
| 65 to 74 Years | 9 (1.8%) | 7 (1.3%) |
| 75 Years and over | 61 (22.0%) | 49 (11.6%) |
Disability Class: Vision Difficulty
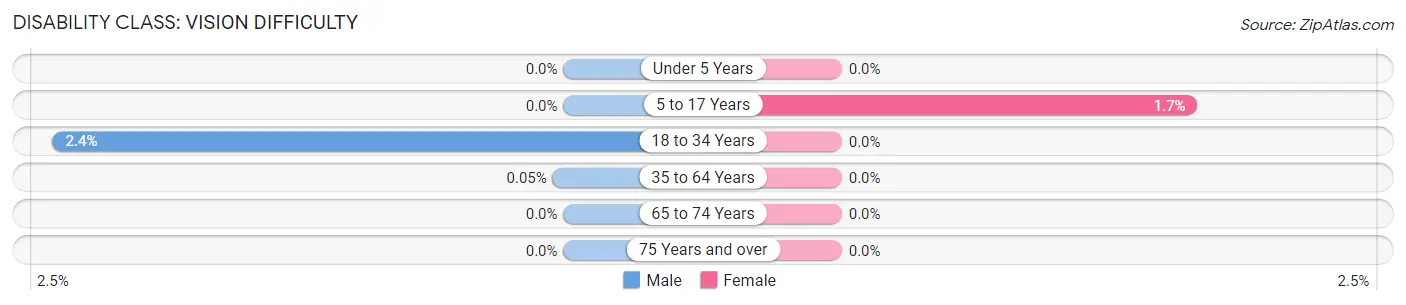
| Age Bracket | Male | Female |
| Under 5 Years | 0 (0.0%) | 0 (0.0%) |
| 5 to 17 Years | 0 (0.0%) | 11 (1.7%) |
| 18 to 34 Years | 20 (2.4%) | 0 (0.0%) |
| 35 to 64 Years | 1 (0.1%) | 0 (0.0%) |
| 65 to 74 Years | 0 (0.0%) | 0 (0.0%) |
| 75 Years and over | 0 (0.0%) | 0 (0.0%) |
Disability Class: Cognitive Difficulty
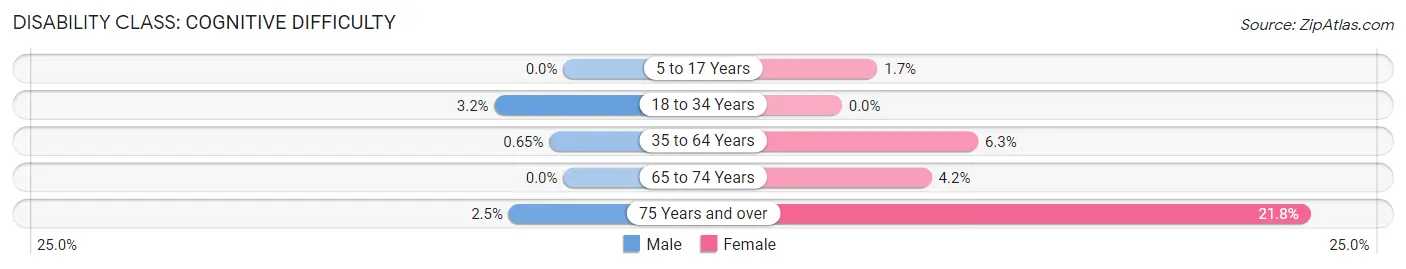
| Age Bracket | Male | Female |
| 5 to 17 Years | 0 (0.0%) | 11 (1.7%) |
| 18 to 34 Years | 27 (3.2%) | 0 (0.0%) |
| 35 to 64 Years | 12 (0.6%) | 121 (6.3%) |
| 65 to 74 Years | 0 (0.0%) | 23 (4.2%) |
| 75 Years and over | 7 (2.5%) | 92 (21.7%) |
Disability Class: Ambulatory Difficulty
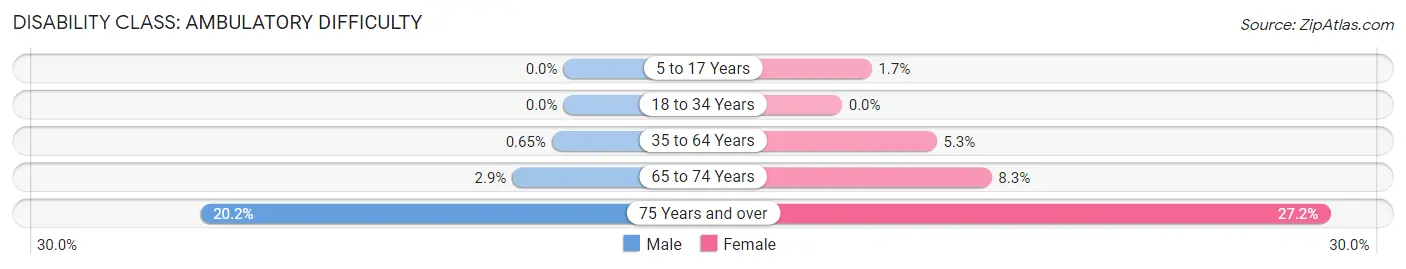
| Age Bracket | Male | Female |
| 5 to 17 Years | 0 (0.0%) | 11 (1.7%) |
| 18 to 34 Years | 0 (0.0%) | 0 (0.0%) |
| 35 to 64 Years | 12 (0.6%) | 101 (5.3%) |
| 65 to 74 Years | 14 (2.9%) | 46 (8.3%) |
| 75 Years and over | 56 (20.2%) | 115 (27.2%) |
Disability Class: Self-Care Difficulty
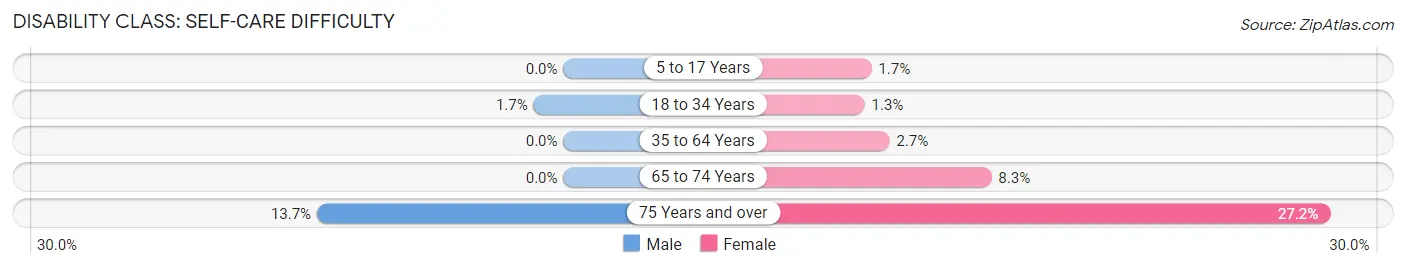
| Age Bracket | Male | Female |
| 5 to 17 Years | 0 (0.0%) | 11 (1.7%) |
| 18 to 34 Years | 14 (1.7%) | 11 (1.3%) |
| 35 to 64 Years | 0 (0.0%) | 51 (2.7%) |
| 65 to 74 Years | 0 (0.0%) | 46 (8.3%) |
| 75 Years and over | 38 (13.7%) | 115 (27.2%) |
Technology Access in Park Ridge borough
Computing Device Access in Park Ridge borough
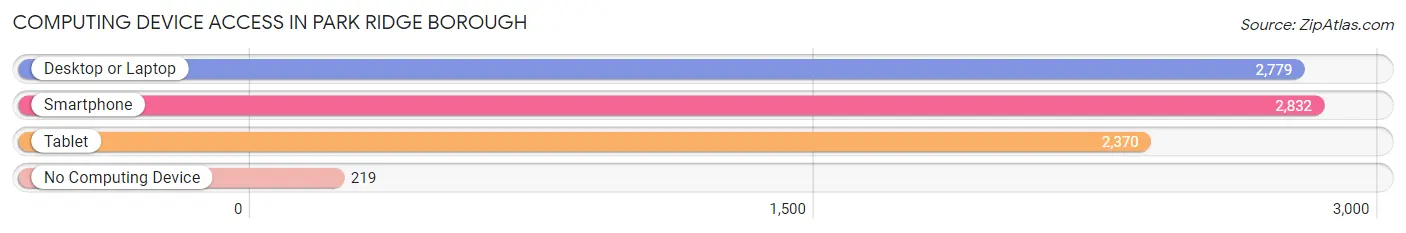
| Device Type | # Households | % Households |
| Desktop or Laptop | 2,779 | 86.8% |
| Smartphone | 2,832 | 88.4% |
| Tablet | 2,370 | 74.0% |
| No Computing Device | 219 | 6.8% |
| Total | 3,203 | 100.0% |
Internet Access in Park Ridge borough
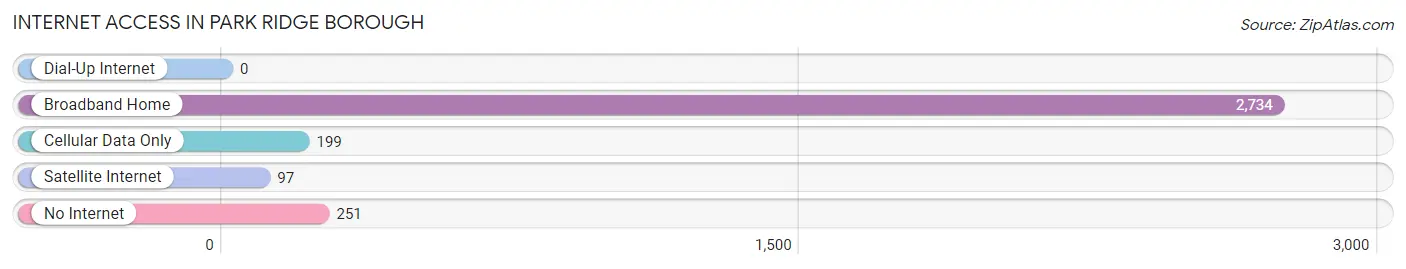
| Internet Type | # Households | % Households |
| Dial-Up Internet | 0 | 0.0% |
| Broadband Home | 2,734 | 85.4% |
| Cellular Data Only | 199 | 6.2% |
| Satellite Internet | 97 | 3.0% |
| No Internet | 251 | 7.8% |
| Total | 3,203 | 100.0% |
Park Ridge borough Summary
Introduction
Park Ridge Borough is a small borough located in Bergen County, New Jersey. It is situated in the northern part of the state, just west of the Hudson River. The borough is home to approximately 8,645 people, making it one of the smallest municipalities in the state. Park Ridge is known for its small-town charm and its close proximity to New York City.
History
Park Ridge was first settled in the late 1700s by Dutch and English settlers. The area was originally known as “Middletown” and was part of the larger township of Washington. In 1871, the area was incorporated as the Borough of Park Ridge. The name was chosen to reflect the area’s natural beauty and its location on a ridge overlooking the Hudson River.
In the late 19th century, Park Ridge was a popular summer destination for wealthy New Yorkers. The area was home to several grand estates, including the former home of President Chester A. Arthur. The borough also became a popular destination for wealthy New Yorkers looking to escape the hustle and bustle of the city.
In the early 20th century, Park Ridge began to experience a period of growth and development. The borough was home to several factories and businesses, including a silk mill, a paper mill, and a brickyard. The borough also became a popular destination for commuters, as it was located on the main line of the Erie Railroad.
Geography
Park Ridge is located in the northern part of Bergen County, New Jersey. It is situated on a ridge overlooking the Hudson River, just west of the George Washington Bridge. The borough is bordered by the towns of Montvale, Woodcliff Lake, and Hillsdale.
The borough covers an area of 2.2 square miles and is home to 8,645 people, as of the 2010 census. The borough is divided into two distinct sections: the downtown area and the residential area. The downtown area is home to several businesses, including restaurants, shops, and banks. The residential area is made up of single-family homes, townhouses, and condominiums.
Economy
Park Ridge is a primarily residential community, with a small but vibrant business district. The borough is home to several small businesses, including restaurants, shops, and banks. The borough is also home to several corporate offices, including those of the pharmaceutical company Merck and the financial services company Prudential.
The borough is also home to several industrial parks, which are home to a variety of businesses, including manufacturing, warehousing, and distribution. The borough is also home to several medical facilities, including a hospital and several medical offices.
Demographics
As of the 2010 census, Park Ridge had a population of 8,645 people. The racial makeup of the borough was 87.3% White, 4.2% African American, 0.2% Native American, 4.7% Asian, and 3.6% from other races. Hispanic or Latino of any race were 8.3% of the population.
The median household income in Park Ridge was $90,845, and the median family income was $106,917. The per capita income was $41,945. About 3.2% of families and 4.3% of the population were below the poverty line, including 5.2% of those under age 18 and 4.2% of those age 65 or over.
Conclusion
Park Ridge Borough is a small borough located in Bergen County, New Jersey. It is situated in the northern part of the state, just west of the Hudson River. The borough is home to approximately 8,645 people, making it one of the smallest municipalities in the state. Park Ridge is known for its small-town charm and its close proximity to New York City. The borough is primarily residential, with a small but vibrant business district. The borough is also home to several industrial parks, which are home to a variety of businesses. The population of Park Ridge is predominantly white, with a small percentage of African Americans, Asians, and other races. The median household income in Park Ridge is $90,845, and the median family income is $106,917.
Common Questions
What is Per Capita Income in Park Ridge borough?
Per Capita income in Park Ridge borough is $66,515.
What is the Median Family Income in Park Ridge borough?
Median Family Income in Park Ridge borough is $196,523.
What is the Median Household income in Park Ridge borough?
Median Household Income in Park Ridge borough is $164,241.
What is Income or Wage Gap in Park Ridge borough?
Income or Wage Gap in Park Ridge borough is 35.9%.
Women in Park Ridge borough earn 64.1 cents for every dollar earned by a man.
What is Inequality or Gini Index in Park Ridge borough?
Inequality or Gini Index in Park Ridge borough is 0.40.
What is the Total Population of Park Ridge borough?
Total Population of Park Ridge borough is 9,098.
What is the Total Male Population of Park Ridge borough?
Total Male Population of Park Ridge borough is 4,364.
What is the Total Female Population of Park Ridge borough?
Total Female Population of Park Ridge borough is 4,734.
What is the Ratio of Males per 100 Females in Park Ridge borough?
There are 92.18 Males per 100 Females in Park Ridge borough.
What is the Ratio of Females per 100 Males in Park Ridge borough?
There are 108.48 Females per 100 Males in Park Ridge borough.
What is the Median Population Age in Park Ridge borough?
Median Population Age in Park Ridge borough is 47.8 Years.
What is the Average Family Size in Park Ridge borough
Average Family Size in Park Ridge borough is 3.2 People.
What is the Average Household Size in Park Ridge borough
Average Household Size in Park Ridge borough is 2.8 People.
How Large is the Labor Force in Park Ridge borough?
There are 5,173 People in the Labor Forcein in Park Ridge borough.
What is the Percentage of People in the Labor Force in Park Ridge borough?
66.8% of People are in the Labor Force in Park Ridge borough.
What is the Unemployment Rate in Park Ridge borough?
Unemployment Rate in Park Ridge borough is 3.0%.