West Freehold, NJ Map & Demographics
West Freehold Map
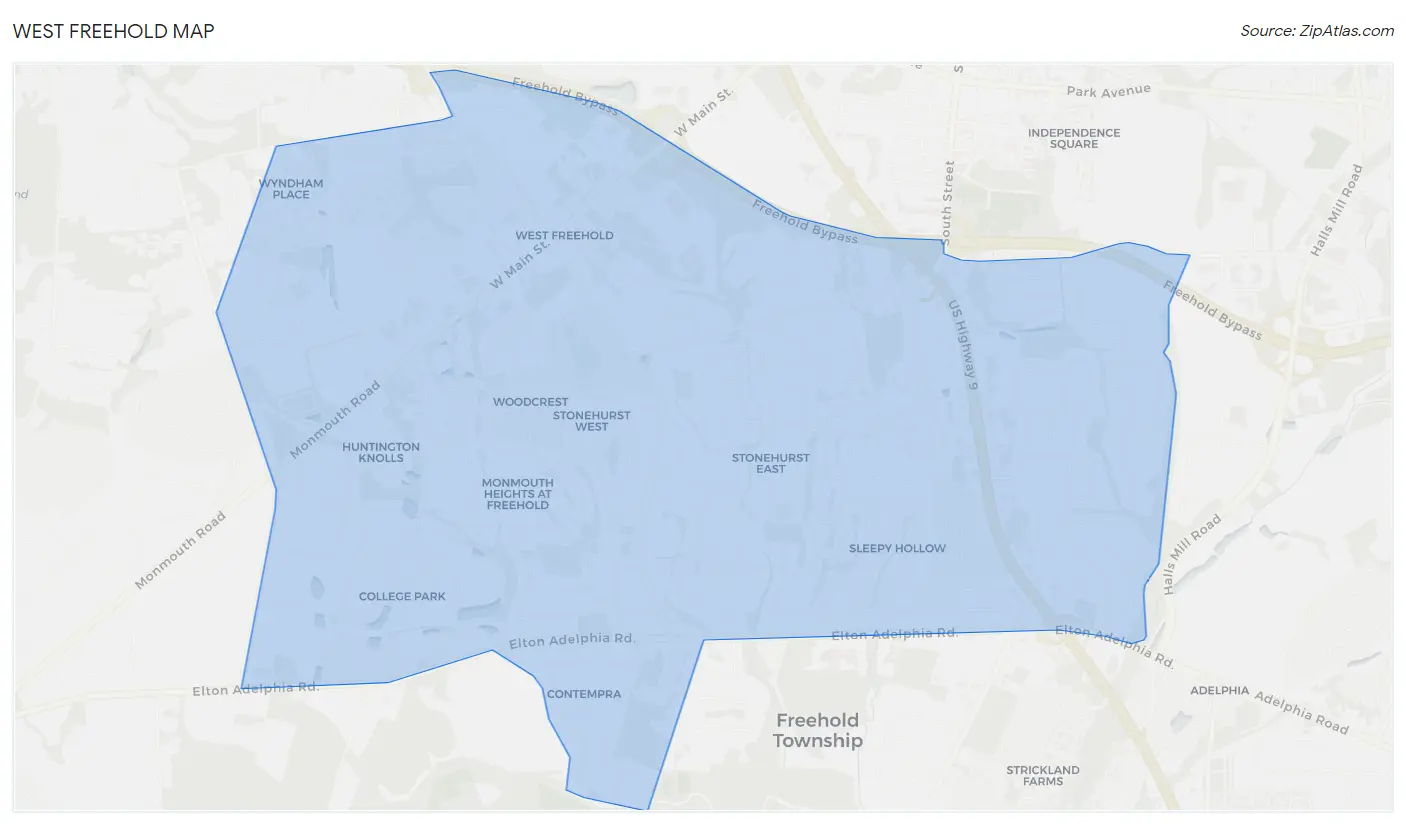
West Freehold Overview
$55,902
PER CAPITA INCOME
$172,163
AVG FAMILY INCOME
$117,108
AVG HOUSEHOLD INCOME
33.3%
WAGE / INCOME GAP [ % ]
66.7¢/ $1
WAGE / INCOME GAP [ $ ]
0.40
INEQUALITY / GINI INDEX
14,448
TOTAL POPULATION
6,958
MALE POPULATION
7,490
FEMALE POPULATION
92.90
MALES / 100 FEMALES
107.65
FEMALES / 100 MALES
40.3
MEDIAN AGE
3.3
AVG FAMILY SIZE
2.6
AVG HOUSEHOLD SIZE
7,715
LABOR FORCE [ PEOPLE ]
67.9%
PERCENT IN LABOR FORCE
3.6%
UNEMPLOYMENT RATE
Income in West Freehold
Income Overview in West Freehold
Per Capita Income in West Freehold is $55,902, while median incomes of families and households are $172,163 and $117,108 respectively.
| Characteristic | Number | Measure |
| Per Capita Income | 14,448 | $55,902 |
| Median Family Income | 3,798 | $172,163 |
| Mean Family Income | 3,798 | $177,398 |
| Median Household Income | 5,509 | $117,108 |
| Mean Household Income | 5,509 | $144,973 |
| Income Deficit | 3,798 | $0 |
| Wage / Income Gap (%) | 14,448 | 33.30% |
| Wage / Income Gap ($) | 14,448 | 66.70¢ per $1 |
| Gini / Inequality Index | 14,448 | 0.40 |
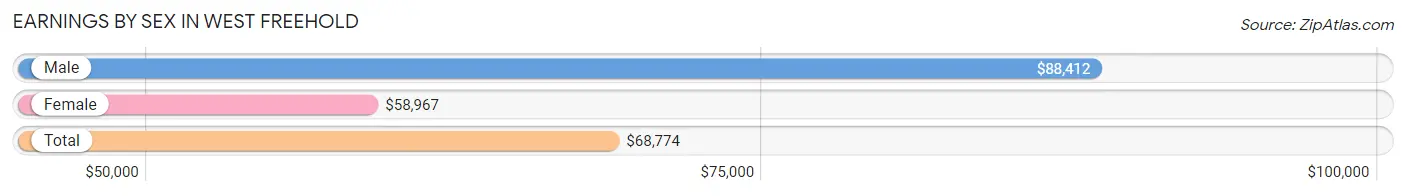
Earnings by Sex in West Freehold
Average Earnings in West Freehold are $68,774, $88,412 for men and $58,967 for women, a difference of 33.3%.
| Sex | Number | Average Earnings |
| Male | 4,285 (53.6%) | $88,412 |
| Female | 3,708 (46.4%) | $58,967 |
| Total | 7,993 (100.0%) | $68,774 |
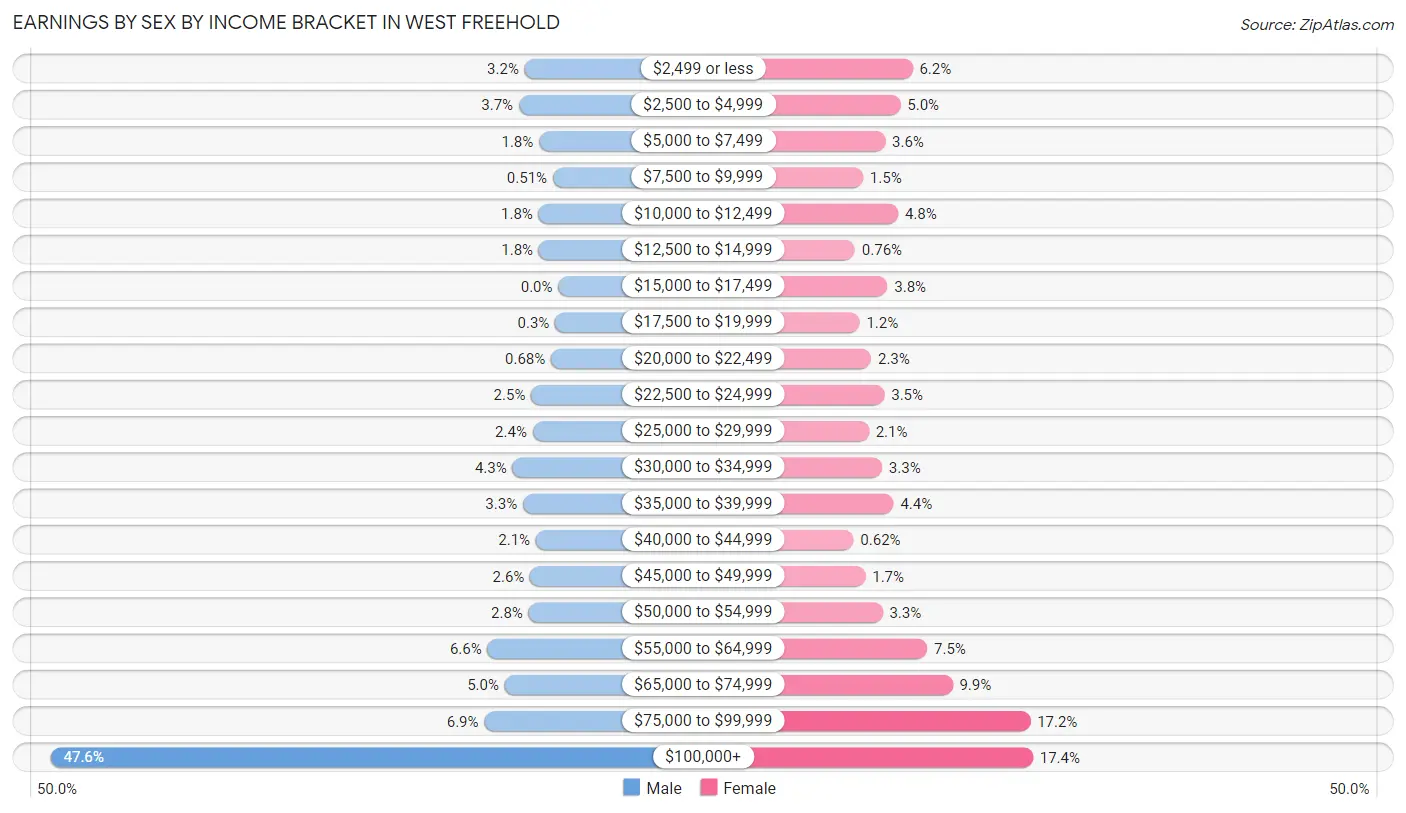
Earnings by Sex by Income Bracket in West Freehold
The most common earnings brackets in West Freehold are $100,000+ for men (2,038 | 47.6%) and $100,000+ for women (646 | 17.4%).
| Income | Male | Female |
| $2,499 or less | 135 (3.2%) | 228 (6.1%) |
| $2,500 to $4,999 | 158 (3.7%) | 186 (5.0%) |
| $5,000 to $7,499 | 77 (1.8%) | 133 (3.6%) |
| $7,500 to $9,999 | 22 (0.5%) | 56 (1.5%) |
| $10,000 to $12,499 | 79 (1.8%) | 178 (4.8%) |
| $12,500 to $14,999 | 78 (1.8%) | 28 (0.8%) |
| $15,000 to $17,499 | 0 (0.0%) | 141 (3.8%) |
| $17,500 to $19,999 | 13 (0.3%) | 44 (1.2%) |
| $20,000 to $22,499 | 29 (0.7%) | 84 (2.3%) |
| $22,500 to $24,999 | 109 (2.5%) | 130 (3.5%) |
| $25,000 to $29,999 | 103 (2.4%) | 76 (2.1%) |
| $30,000 to $34,999 | 184 (4.3%) | 122 (3.3%) |
| $35,000 to $39,999 | 142 (3.3%) | 162 (4.4%) |
| $40,000 to $44,999 | 90 (2.1%) | 23 (0.6%) |
| $45,000 to $49,999 | 113 (2.6%) | 64 (1.7%) |
| $50,000 to $54,999 | 119 (2.8%) | 124 (3.3%) |
| $55,000 to $64,999 | 284 (6.6%) | 279 (7.5%) |
| $65,000 to $74,999 | 215 (5.0%) | 367 (9.9%) |
| $75,000 to $99,999 | 297 (6.9%) | 637 (17.2%) |
| $100,000+ | 2,038 (47.6%) | 646 (17.4%) |
| Total | 4,285 (100.0%) | 3,708 (100.0%) |
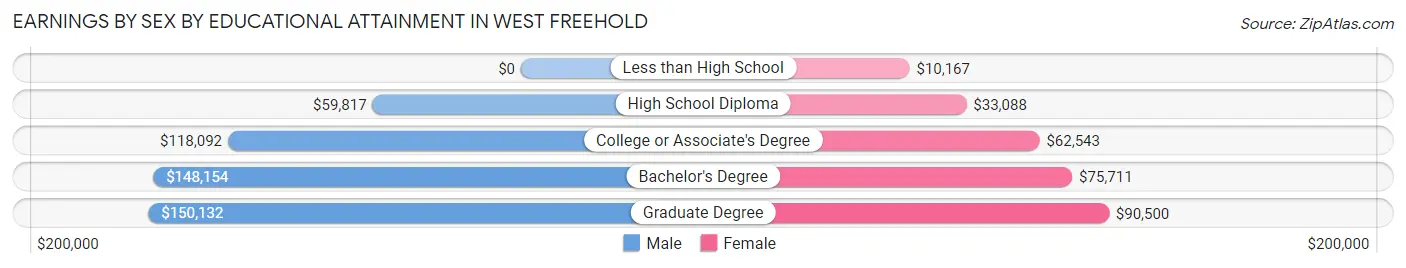
Earnings by Sex by Educational Attainment in West Freehold
Average earnings in West Freehold are $107,976 for men and $66,269 for women, a difference of 38.6%. Men with an educational attainment of graduate degree enjoy the highest average annual earnings of $150,132, while those with high school diploma education earn the least with $59,817. Women with an educational attainment of graduate degree earn the most with the average annual earnings of $90,500, while those with less than high school education have the smallest earnings of $10,167.
| Educational Attainment | Male Income | Female Income |
| Less than High School | - | - |
| High School Diploma | $59,817 | $33,088 |
| College or Associate's Degree | $118,092 | $62,543 |
| Bachelor's Degree | $148,154 | $75,711 |
| Graduate Degree | $150,132 | $90,500 |
| Total | $107,976 | $66,269 |
Family Income in West Freehold
Family Income Brackets in West Freehold
According to the West Freehold family income data, there are 1,504 families falling into the $200,000+ income range, which is the most common income bracket and makes up 39.6% of all families. Conversely, the $10,000 to $14,999 income bracket is the least frequent group with only 11 families (0.3%) belonging to this category.
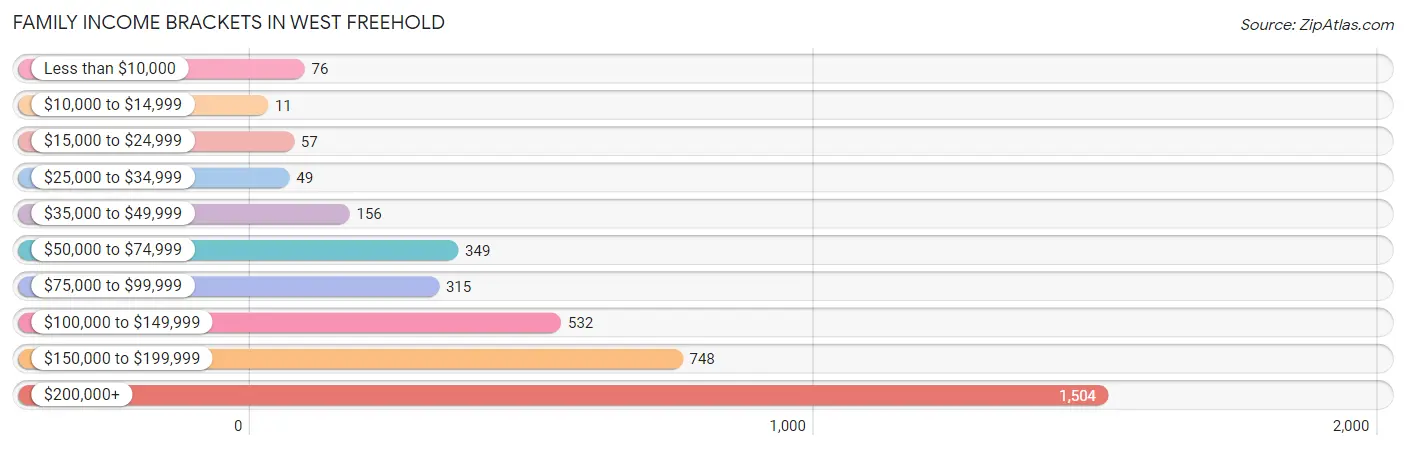
| Income Bracket | # Families | % Families |
| Less than $10,000 | 76 | 2.0% |
| $10,000 to $14,999 | 11 | 0.3% |
| $15,000 to $24,999 | 57 | 1.5% |
| $25,000 to $34,999 | 49 | 1.3% |
| $35,000 to $49,999 | 156 | 4.1% |
| $50,000 to $74,999 | 349 | 9.2% |
| $75,000 to $99,999 | 315 | 8.3% |
| $100,000 to $149,999 | 532 | 14.0% |
| $150,000 to $199,999 | 748 | 19.7% |
| $200,000+ | 1,504 | 39.6% |
Family Income by Famaliy Size in West Freehold
5-person families (334 | 8.8%) account for the highest median family income in West Freehold with $226,452 per family, while 4-person families (1,076 | 28.3%) have the highest median income of $56,470 per family member.
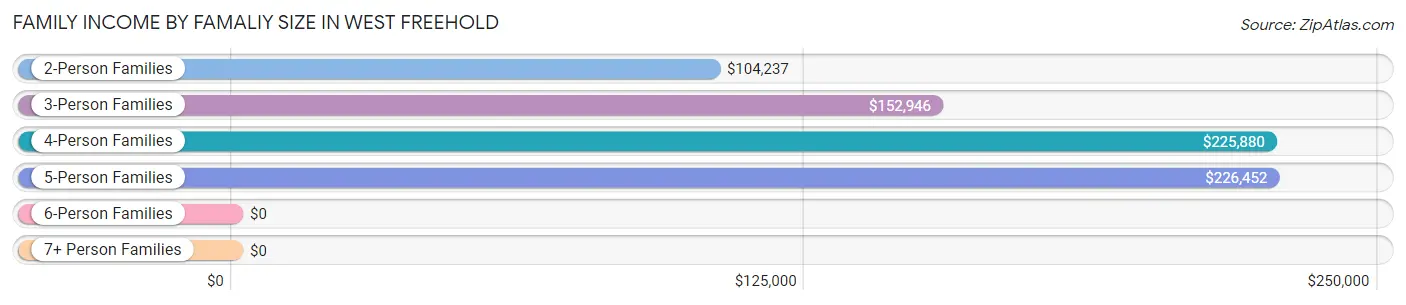
| Income Bracket | # Families | Median Income |
| 2-Person Families | 1,470 (38.7%) | $104,237 |
| 3-Person Families | 794 (20.9%) | $152,946 |
| 4-Person Families | 1,076 (28.3%) | $225,880 |
| 5-Person Families | 334 (8.8%) | $226,452 |
| 6-Person Families | 105 (2.8%) | $0 |
| 7+ Person Families | 19 (0.5%) | $0 |
| Total | 3,798 (100.0%) | $172,163 |
Family Income by Number of Earners in West Freehold
The median family income in West Freehold is $172,163, with families comprising 3+ earners (548) having the highest median family income of $250,001, while families with no earners (347) have the lowest median family income of $71,875, accounting for 14.4% and 9.1% of families, respectively.
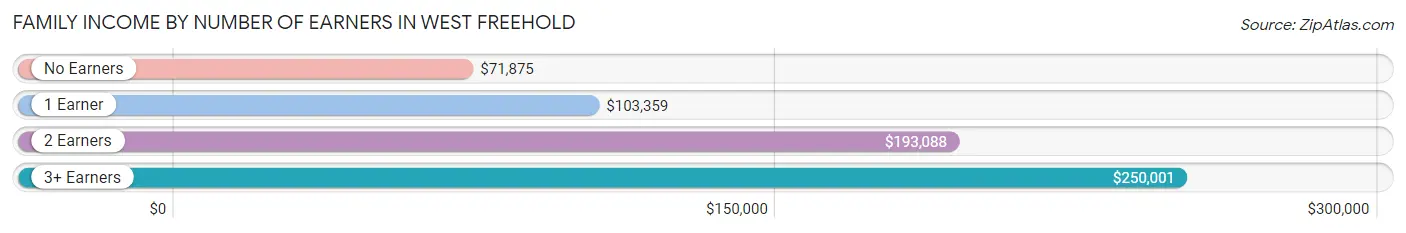
| Number of Earners | # Families | Median Income |
| No Earners | 347 (9.1%) | $71,875 |
| 1 Earner | 999 (26.3%) | $103,359 |
| 2 Earners | 1,904 (50.1%) | $193,088 |
| 3+ Earners | 548 (14.4%) | $250,001 |
| Total | 3,798 (100.0%) | $172,163 |
Household Income in West Freehold
Household Income Brackets in West Freehold
With 1,620 households falling in the category, the $200,000+ income range is the most frequent in West Freehold, accounting for 29.4% of all households. In contrast, only 99 households (1.8%) fall into the $10,000 to $14,999 income bracket, making it the least populous group.
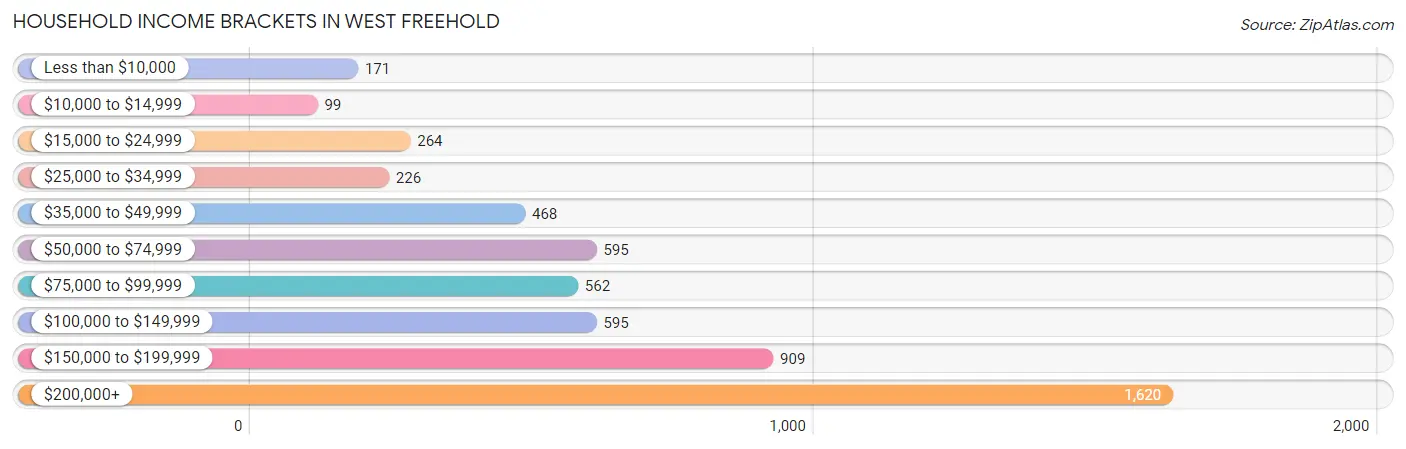
| Income Bracket | # Households | % Households |
| Less than $10,000 | 171 | 3.1% |
| $10,000 to $14,999 | 99 | 1.8% |
| $15,000 to $24,999 | 264 | 4.8% |
| $25,000 to $34,999 | 226 | 4.1% |
| $35,000 to $49,999 | 468 | 8.5% |
| $50,000 to $74,999 | 595 | 10.8% |
| $75,000 to $99,999 | 562 | 10.2% |
| $100,000 to $149,999 | 595 | 10.8% |
| $150,000 to $199,999 | 909 | 16.5% |
| $200,000+ | 1,620 | 29.4% |
Household Income by Householder Age in West Freehold
The median household income in West Freehold is $117,108, with the highest median household income of $170,827 found in the 45 to 64 years age bracket for the primary householder. A total of 2,425 households (44.0%) fall into this category. Meanwhile, the 15 to 24 years age bracket for the primary householder has the lowest median household income of $0, with 65 households (1.2%) in this group.
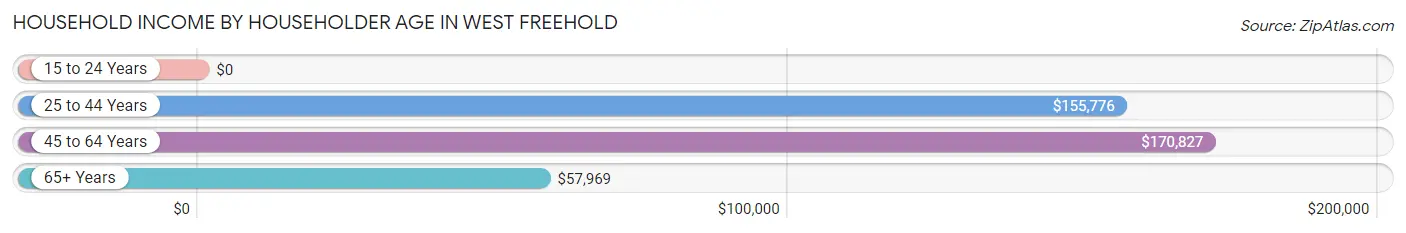
| Income Bracket | # Households | Median Income |
| 15 to 24 Years | 65 (1.2%) | $0 |
| 25 to 44 Years | 1,734 (31.5%) | $155,776 |
| 45 to 64 Years | 2,425 (44.0%) | $170,827 |
| 65+ Years | 1,285 (23.3%) | $57,969 |
| Total | 5,509 (100.0%) | $117,108 |
Poverty in West Freehold
Income Below Poverty by Sex and Age in West Freehold
With 3.6% poverty level for males and 2.6% for females among the residents of West Freehold, under 5 year old males and 75 year old and over females are the most vulnerable to poverty, with 33 males (16.5%) and 82 females (11.2%) in their respective age groups living below the poverty level.
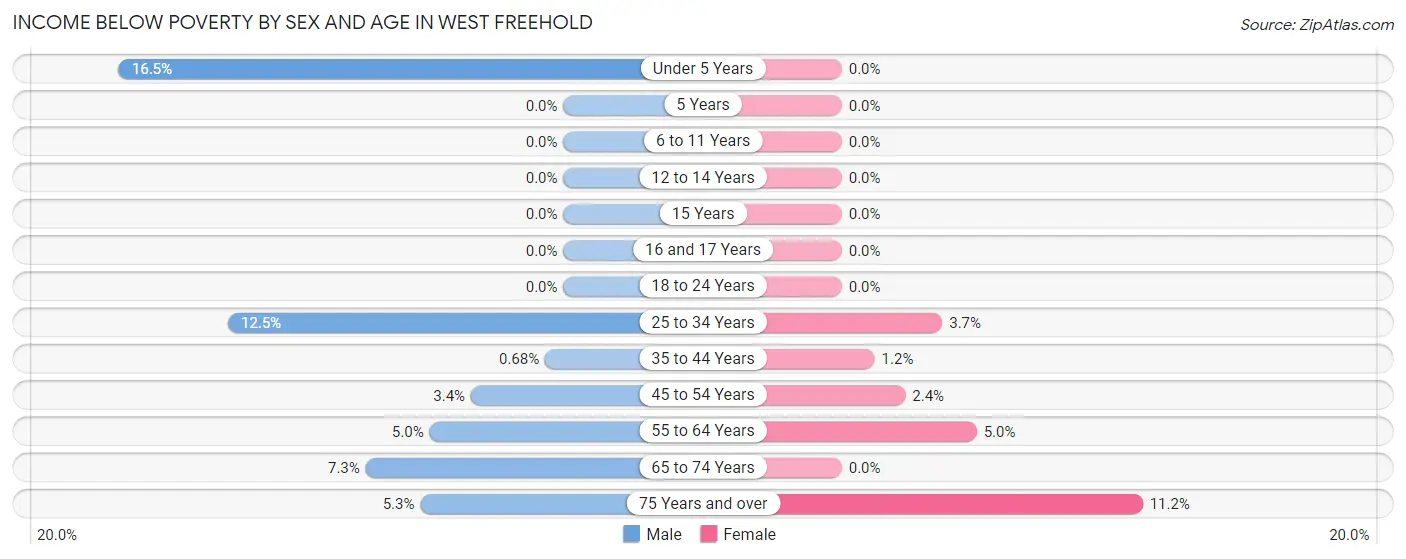
| Age Bracket | Male | Female |
| Under 5 Years | 33 (16.5%) | 0 (0.0%) |
| 5 Years | 0 (0.0%) | 0 (0.0%) |
| 6 to 11 Years | 0 (0.0%) | 0 (0.0%) |
| 12 to 14 Years | 0 (0.0%) | 0 (0.0%) |
| 15 Years | 0 (0.0%) | 0 (0.0%) |
| 16 and 17 Years | 0 (0.0%) | 0 (0.0%) |
| 18 to 24 Years | 0 (0.0%) | 0 (0.0%) |
| 25 to 34 Years | 69 (12.4%) | 23 (3.7%) |
| 35 to 44 Years | 9 (0.7%) | 15 (1.2%) |
| 45 to 54 Years | 34 (3.4%) | 25 (2.4%) |
| 55 to 64 Years | 51 (5.0%) | 49 (5.0%) |
| 65 to 74 Years | 27 (7.3%) | 0 (0.0%) |
| 75 Years and over | 24 (5.3%) | 82 (11.2%) |
| Total | 247 (3.6%) | 194 (2.6%) |
Income Above Poverty by Sex and Age in West Freehold
According to the poverty statistics in West Freehold, males aged 5 years and females aged under 5 years are the age groups that are most secure financially, with 100.0% of males and 100.0% of females in these age groups living above the poverty line.
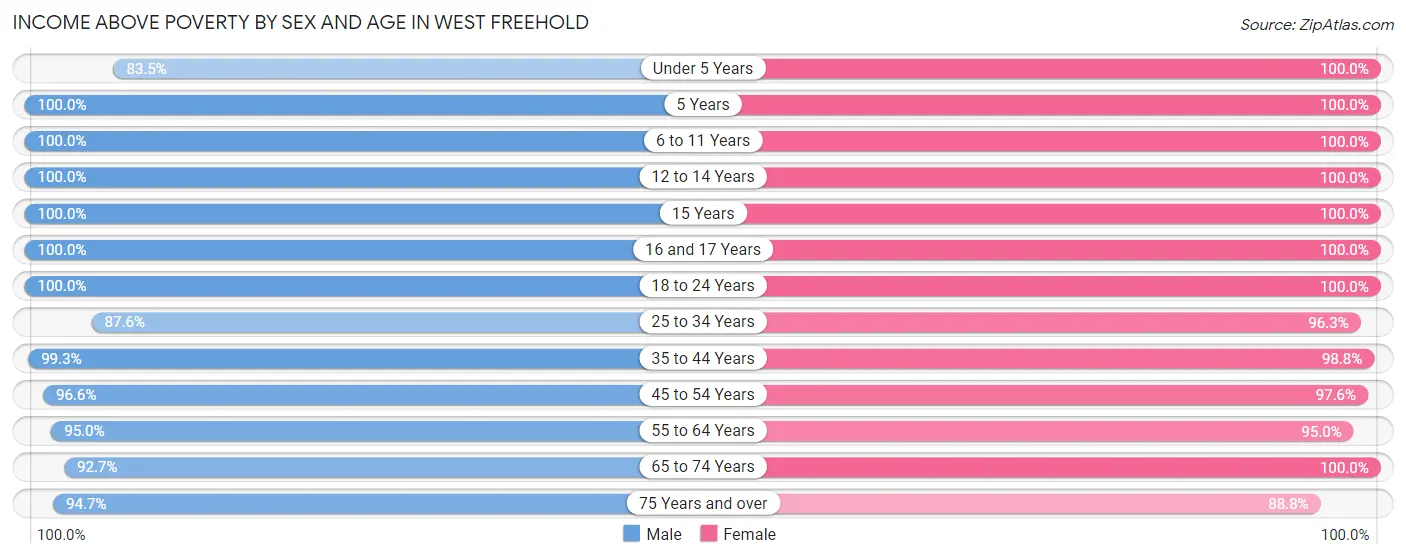
| Age Bracket | Male | Female |
| Under 5 Years | 167 (83.5%) | 154 (100.0%) |
| 5 Years | 122 (100.0%) | 102 (100.0%) |
| 6 to 11 Years | 698 (100.0%) | 1,035 (100.0%) |
| 12 to 14 Years | 326 (100.0%) | 244 (100.0%) |
| 15 Years | 111 (100.0%) | 94 (100.0%) |
| 16 and 17 Years | 177 (100.0%) | 253 (100.0%) |
| 18 to 24 Years | 575 (100.0%) | 446 (100.0%) |
| 25 to 34 Years | 485 (87.5%) | 594 (96.3%) |
| 35 to 44 Years | 1,322 (99.3%) | 1,212 (98.8%) |
| 45 to 54 Years | 958 (96.6%) | 1,035 (97.6%) |
| 55 to 64 Years | 976 (95.0%) | 930 (95.0%) |
| 65 to 74 Years | 341 (92.7%) | 466 (100.0%) |
| 75 Years and over | 428 (94.7%) | 652 (88.8%) |
| Total | 6,686 (96.4%) | 7,217 (97.4%) |
Income Below Poverty Among Married-Couple Families in West Freehold
The poverty statistics for married-couple families in West Freehold show that 2.0% or 64 of the total 3,159 families live below the poverty line. Families with no children have the highest poverty rate of 4.2%, comprising of 64 families. On the other hand, families with 1 or 2 children have the lowest poverty rate of 0.0%, which includes 0 families.
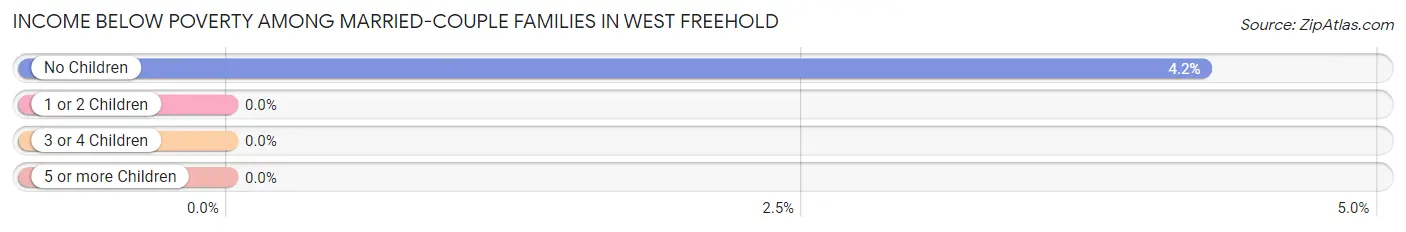
| Children | Above Poverty | Below Poverty |
| No Children | 1,447 (95.8%) | 64 (4.2%) |
| 1 or 2 Children | 1,331 (100.0%) | 0 (0.0%) |
| 3 or 4 Children | 317 (100.0%) | 0 (0.0%) |
| 5 or more Children | 0 (0.0%) | 0 (0.0%) |
| Total | 3,095 (98.0%) | 64 (2.0%) |
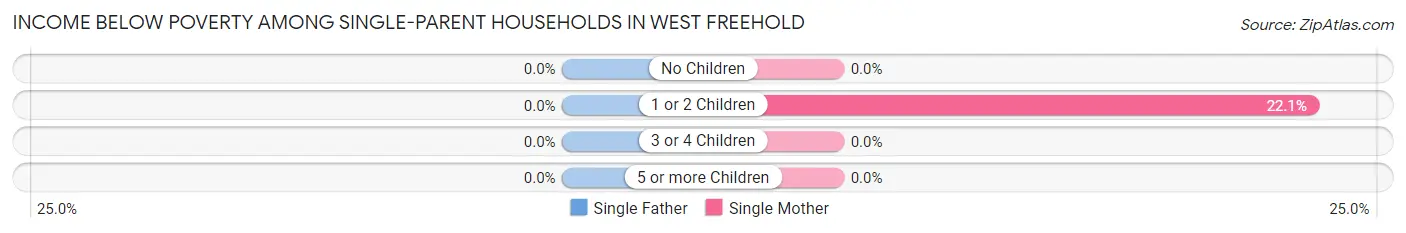
Income Below Poverty Among Single-Parent Households in West Freehold
| Children | Single Father | Single Mother |
| No Children | 0 (0.0%) | 0 (0.0%) |
| 1 or 2 Children | 0 (0.0%) | 23 (22.1%) |
| 3 or 4 Children | 0 (0.0%) | 0 (0.0%) |
| 5 or more Children | 0 (0.0%) | 0 (0.0%) |
| Total | 0 (0.0%) | 23 (7.7%) |
Income Below Poverty Among Married-Couple vs Single-Parent Households in West Freehold
The poverty data for West Freehold shows that 64 of the married-couple family households (2.0%) and 23 of the single-parent households (3.6%) are living below the poverty level. Within the married-couple family households, those with no children have the highest poverty rate, with 64 households (4.2%) falling below the poverty line. Among the single-parent households, those with 1 or 2 children have the highest poverty rate, with 23 household (10.9%) living below poverty.
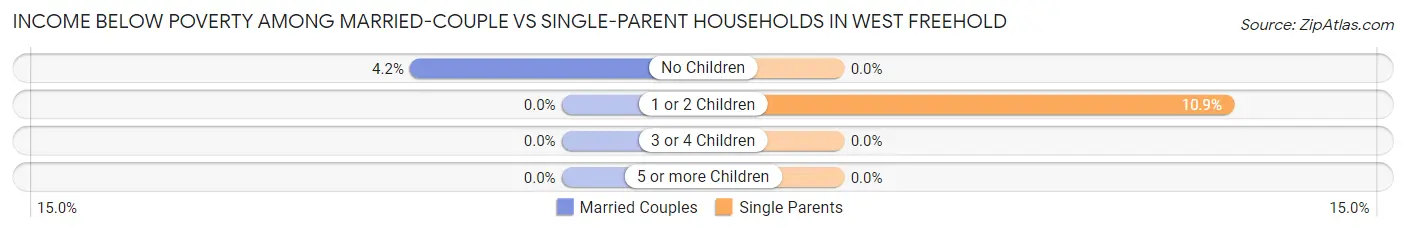
| Children | Married-Couple Families | Single-Parent Households |
| No Children | 64 (4.2%) | 0 (0.0%) |
| 1 or 2 Children | 0 (0.0%) | 23 (10.9%) |
| 3 or 4 Children | 0 (0.0%) | 0 (0.0%) |
| 5 or more Children | 0 (0.0%) | 0 (0.0%) |
| Total | 64 (2.0%) | 23 (3.6%) |
Race in West Freehold
The most populous races in West Freehold are White / Caucasian (12,026 | 83.2%), Hispanic or Latino (2,042 | 14.1%), and Two or more Races (1,150 | 8.0%).
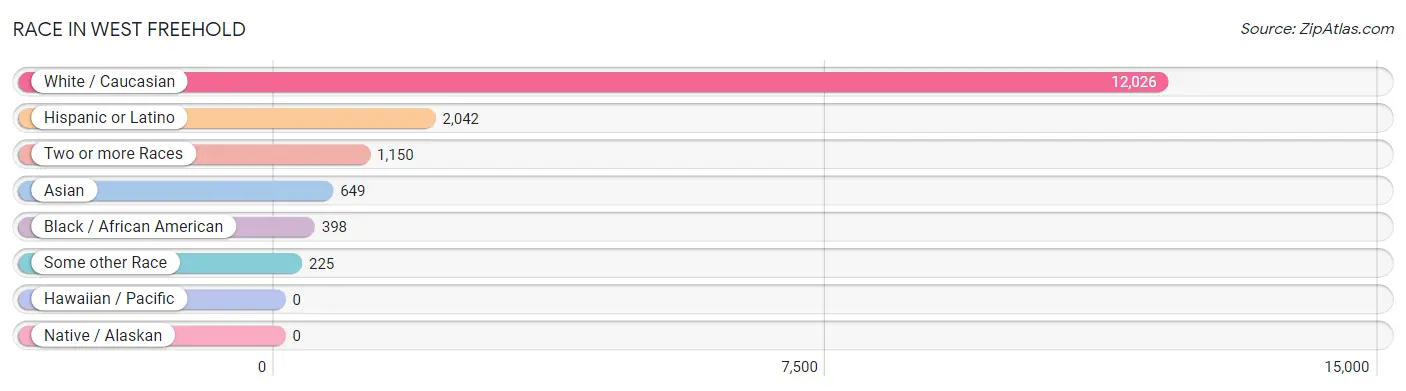
| Race | # Population | % Population |
| Asian | 649 | 4.5% |
| Black / African American | 398 | 2.8% |
| Hawaiian / Pacific | 0 | 0.0% |
| Hispanic or Latino | 2,042 | 14.1% |
| Native / Alaskan | 0 | 0.0% |
| White / Caucasian | 12,026 | 83.2% |
| Two or more Races | 1,150 | 8.0% |
| Some other Race | 225 | 1.6% |
| Total | 14,448 | 100.0% |
Ancestry in West Freehold
The most populous ancestries reported in West Freehold are Italian (4,584 | 31.7%), Irish (3,127 | 21.6%), German (1,158 | 8.0%), English (1,009 | 7.0%), and American (961 | 6.7%), together accounting for 75.0% of all West Freehold residents.
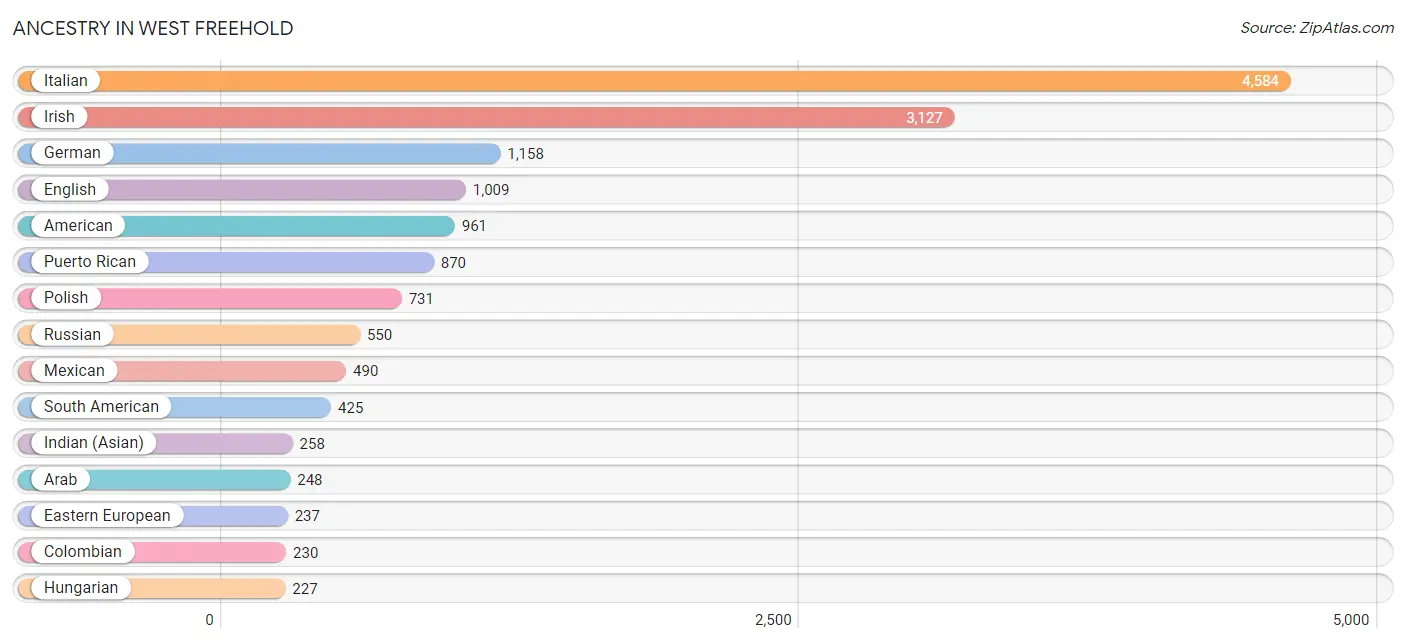
| Ancestry | # Population | % Population |
| African | 27 | 0.2% |
| American | 961 | 6.7% |
| Arab | 248 | 1.7% |
| Assyrian / Chaldean / Syriac | 28 | 0.2% |
| Austrian | 42 | 0.3% |
| Brazilian | 77 | 0.5% |
| British | 125 | 0.9% |
| Burmese | 83 | 0.6% |
| Cambodian | 39 | 0.3% |
| Central American | 131 | 0.9% |
| Chilean | 80 | 0.5% |
| Colombian | 230 | 1.6% |
| Croatian | 39 | 0.3% |
| Cuban | 11 | 0.1% |
| Czech | 31 | 0.2% |
| Czechoslovakian | 17 | 0.1% |
| Dominican | 20 | 0.1% |
| Dutch | 110 | 0.8% |
| Eastern European | 237 | 1.6% |
| Egyptian | 46 | 0.3% |
| English | 1,009 | 7.0% |
| European | 200 | 1.4% |
| Filipino | 9 | 0.1% |
| French | 134 | 0.9% |
| French Canadian | 13 | 0.1% |
| German | 1,158 | 8.0% |
| Greek | 45 | 0.3% |
| Haitian | 1 | 0.0% |
| Honduran | 115 | 0.8% |
| Hungarian | 227 | 1.6% |
| Indian (Asian) | 258 | 1.8% |
| Iraqi | 27 | 0.2% |
| Irish | 3,127 | 21.6% |
| Italian | 4,584 | 31.7% |
| Jamaican | 160 | 1.1% |
| Korean | 18 | 0.1% |
| Lithuanian | 33 | 0.2% |
| Mexican | 490 | 3.4% |
| Mongolian | 43 | 0.3% |
| Moroccan | 123 | 0.9% |
| Norwegian | 28 | 0.2% |
| Peruvian | 53 | 0.4% |
| Polish | 731 | 5.1% |
| Portuguese | 49 | 0.3% |
| Puerto Rican | 870 | 6.0% |
| Romanian | 39 | 0.3% |
| Russian | 550 | 3.8% |
| Salvadoran | 16 | 0.1% |
| Scotch-Irish | 51 | 0.4% |
| Scottish | 24 | 0.2% |
| Slavic | 12 | 0.1% |
| Slovak | 37 | 0.3% |
| South American | 425 | 2.9% |
| Spaniard | 73 | 0.5% |
| Spanish | 22 | 0.2% |
| Sri Lankan | 25 | 0.2% |
| Subsaharan African | 27 | 0.2% |
| Swedish | 57 | 0.4% |
| Swiss | 31 | 0.2% |
| Syrian | 32 | 0.2% |
| Thai | 205 | 1.4% |
| Trinidadian and Tobagonian | 17 | 0.1% |
| Turkish | 187 | 1.3% |
| Ukrainian | 187 | 1.3% |
| Venezuelan | 62 | 0.4% |
| Welsh | 16 | 0.1% |
| West Indian | 27 | 0.2% |
| Yugoslavian | 34 | 0.2% | View All 68 Rows |
Immigrants in West Freehold
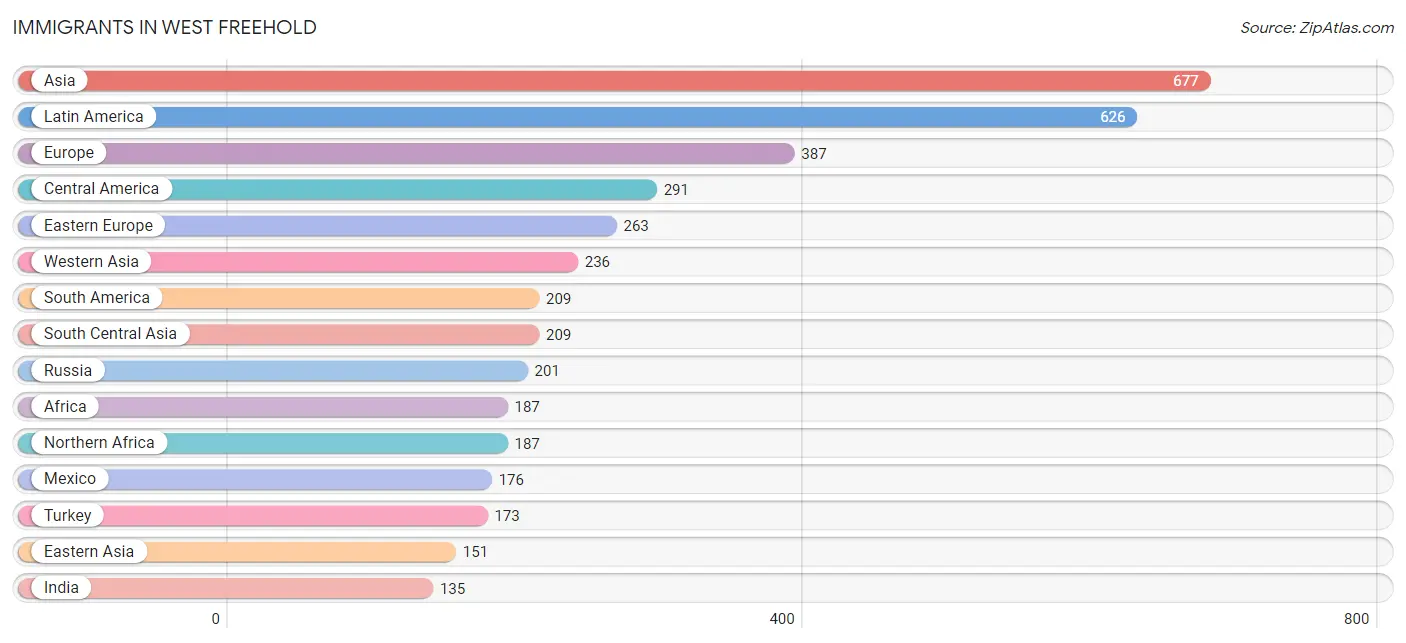
The most numerous immigrant groups reported in West Freehold came from Asia (677 | 4.7%), Latin America (626 | 4.3%), Europe (387 | 2.7%), Central America (291 | 2.0%), and Eastern Europe (263 | 1.8%), together accounting for 15.5% of all West Freehold residents.
| Immigration Origin | # Population | % Population |
| Africa | 187 | 1.3% |
| Asia | 677 | 4.7% |
| Belarus | 23 | 0.2% |
| Brazil | 79 | 0.5% |
| Caribbean | 126 | 0.9% |
| Central America | 291 | 2.0% |
| China | 133 | 0.9% |
| Colombia | 109 | 0.7% |
| Cuba | 42 | 0.3% |
| Eastern Asia | 151 | 1.1% |
| Eastern Europe | 263 | 1.8% |
| Egypt | 125 | 0.9% |
| El Salvador | 22 | 0.2% |
| England | 14 | 0.1% |
| Europe | 387 | 2.7% |
| Germany | 11 | 0.1% |
| Grenada | 5 | 0.0% |
| Haiti | 1 | 0.0% |
| Honduras | 93 | 0.6% |
| Hong Kong | 4 | 0.0% |
| India | 135 | 0.9% |
| Iraq | 63 | 0.4% |
| Italy | 65 | 0.4% |
| Jamaica | 61 | 0.4% |
| Korea | 18 | 0.1% |
| Latin America | 626 | 4.3% |
| Malaysia | 43 | 0.3% |
| Mexico | 176 | 1.2% |
| Morocco | 62 | 0.4% |
| Nepal | 74 | 0.5% |
| Northern Africa | 187 | 1.3% |
| Northern Europe | 14 | 0.1% |
| Peru | 21 | 0.2% |
| Philippines | 18 | 0.1% |
| Romania | 39 | 0.3% |
| Russia | 201 | 1.4% |
| Singapore | 3 | 0.0% |
| South America | 209 | 1.5% |
| South Central Asia | 209 | 1.5% |
| South Eastern Asia | 81 | 0.6% |
| Southern Europe | 99 | 0.7% |
| Spain | 34 | 0.2% |
| Taiwan | 21 | 0.2% |
| Trinidad and Tobago | 17 | 0.1% |
| Turkey | 173 | 1.2% |
| Vietnam | 17 | 0.1% |
| Western Asia | 236 | 1.6% |
| Western Europe | 11 | 0.1% | View All 48 Rows |
Sex and Age in West Freehold
Sex and Age in West Freehold
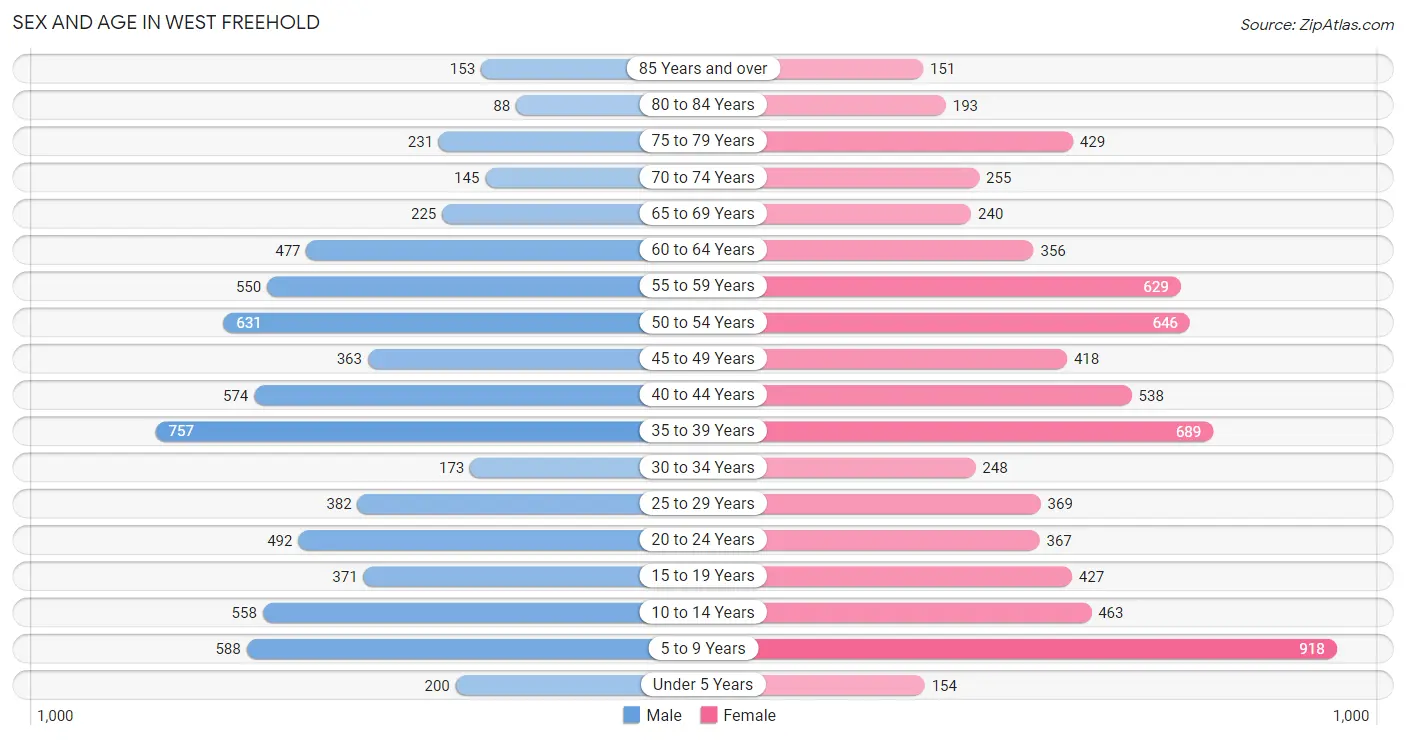
The most populous age groups in West Freehold are 35 to 39 Years (757 | 10.9%) for men and 5 to 9 Years (918 | 12.3%) for women.
| Age Bracket | Male | Female |
| Under 5 Years | 200 (2.9%) | 154 (2.1%) |
| 5 to 9 Years | 588 (8.5%) | 918 (12.3%) |
| 10 to 14 Years | 558 (8.0%) | 463 (6.2%) |
| 15 to 19 Years | 371 (5.3%) | 427 (5.7%) |
| 20 to 24 Years | 492 (7.1%) | 367 (4.9%) |
| 25 to 29 Years | 382 (5.5%) | 369 (4.9%) |
| 30 to 34 Years | 173 (2.5%) | 248 (3.3%) |
| 35 to 39 Years | 757 (10.9%) | 689 (9.2%) |
| 40 to 44 Years | 574 (8.3%) | 538 (7.2%) |
| 45 to 49 Years | 363 (5.2%) | 418 (5.6%) |
| 50 to 54 Years | 631 (9.1%) | 646 (8.6%) |
| 55 to 59 Years | 550 (7.9%) | 629 (8.4%) |
| 60 to 64 Years | 477 (6.9%) | 356 (4.8%) |
| 65 to 69 Years | 225 (3.2%) | 240 (3.2%) |
| 70 to 74 Years | 145 (2.1%) | 255 (3.4%) |
| 75 to 79 Years | 231 (3.3%) | 429 (5.7%) |
| 80 to 84 Years | 88 (1.3%) | 193 (2.6%) |
| 85 Years and over | 153 (2.2%) | 151 (2.0%) |
| Total | 6,958 (100.0%) | 7,490 (100.0%) |
Families and Households in West Freehold
Median Family Size in West Freehold
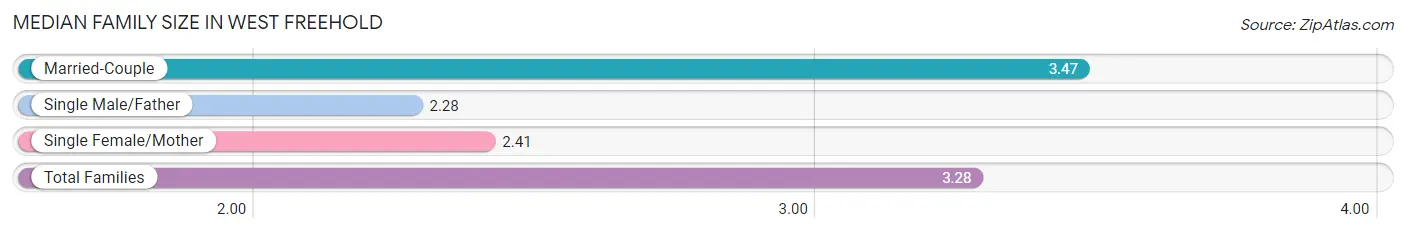
The median family size in West Freehold is 3.28 persons per family, with married-couple families (3,159 | 83.2%) accounting for the largest median family size of 3.47 persons per family. On the other hand, single male/father families (341 | 9.0%) represent the smallest median family size with 2.28 persons per family.
| Family Type | # Families | Family Size |
| Married-Couple | 3,159 (83.2%) | 3.47 |
| Single Male/Father | 341 (9.0%) | 2.28 |
| Single Female/Mother | 298 (7.9%) | 2.41 |
| Total Families | 3,798 (100.0%) | 3.28 |
Median Household Size in West Freehold
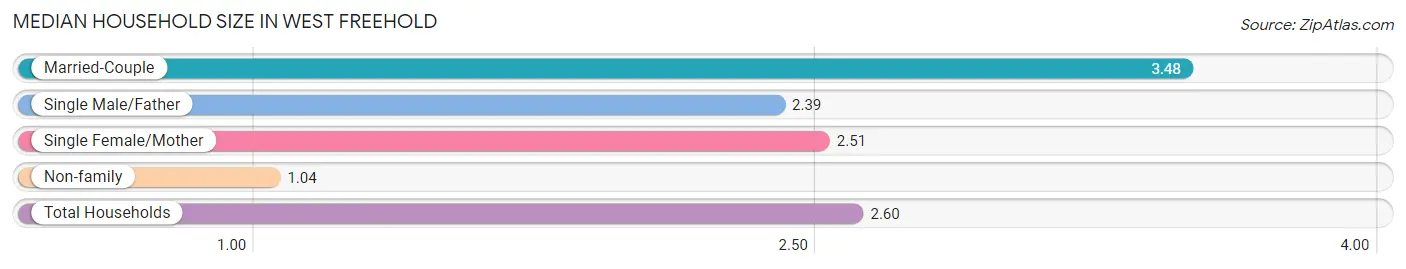
The median household size in West Freehold is 2.60 persons per household, with married-couple households (3,159 | 57.3%) accounting for the largest median household size of 3.48 persons per household. non-family households (1,711 | 31.1%) represent the smallest median household size with 1.04 persons per household.
| Household Type | # Households | Household Size |
| Married-Couple | 3,159 (57.3%) | 3.48 |
| Single Male/Father | 341 (6.2%) | 2.39 |
| Single Female/Mother | 298 (5.4%) | 2.51 |
| Non-family | 1,711 (31.1%) | 1.04 |
| Total Households | 5,509 (100.0%) | 2.60 |
Household Size by Marriage Status in West Freehold
Out of a total of 5,509 households in West Freehold, 3,798 (68.9%) are family households, while 1,711 (31.1%) are nonfamily households. The most numerous type of family households are 2-person households, comprising 1,395, and the most common type of nonfamily households are 1-person households, comprising 1,631.
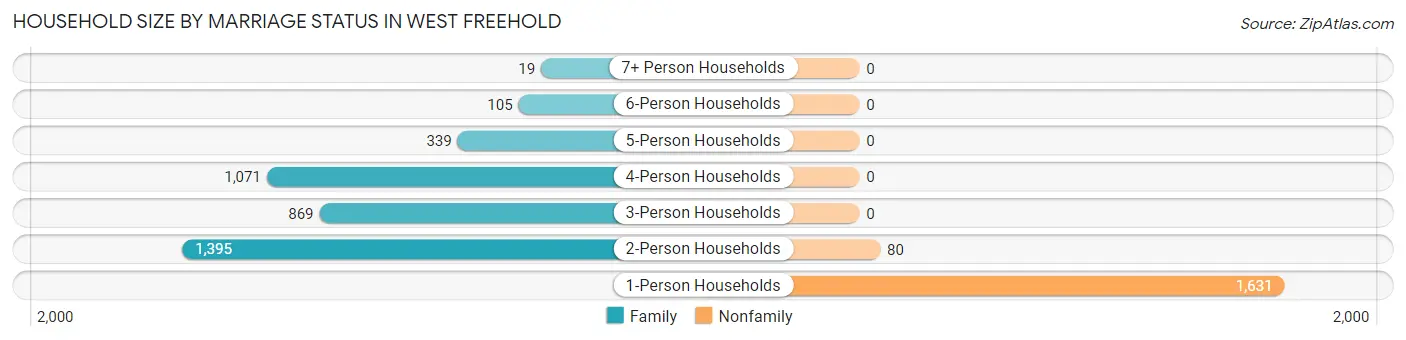
| Household Size | Family Households | Nonfamily Households |
| 1-Person Households | - | 1,631 (29.6%) |
| 2-Person Households | 1,395 (25.3%) | 80 (1.5%) |
| 3-Person Households | 869 (15.8%) | 0 (0.0%) |
| 4-Person Households | 1,071 (19.4%) | 0 (0.0%) |
| 5-Person Households | 339 (6.1%) | 0 (0.0%) |
| 6-Person Households | 105 (1.9%) | 0 (0.0%) |
| 7+ Person Households | 19 (0.3%) | 0 (0.0%) |
| Total | 3,798 (68.9%) | 1,711 (31.1%) |
Female Fertility in West Freehold
Fertility by Age in West Freehold
Average fertility rate in West Freehold is 15.0 births per 1,000 women. Women in the age bracket of 20 to 34 years have the highest fertility rate with 23.0 births per 1,000 women. Women in the age bracket of 20 to 34 years acount for 51.1% of all women with births.
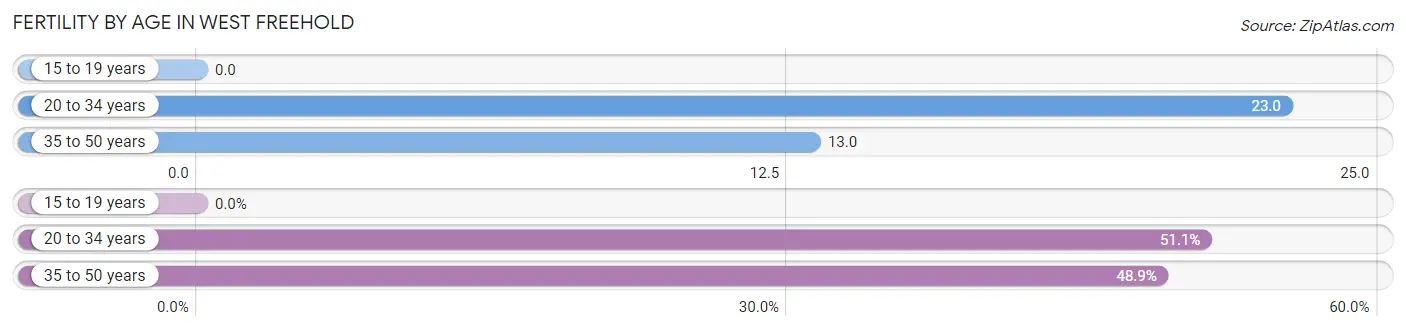
| Age Bracket | Women with Births | Births / 1,000 Women |
| 15 to 19 years | 0 (0.0%) | 0.0 |
| 20 to 34 years | 23 (51.1%) | 23.0 |
| 35 to 50 years | 22 (48.9%) | 13.0 |
| Total | 45 (100.0%) | 15.0 |
Fertility by Age by Marriage Status in West Freehold
48.9% of women with births (45) in West Freehold are married. The highest percentage of unmarried women with births falls into 20 to 34 years age bracket with 100.0% of them unmarried at the time of birth, while the lowest percentage of unmarried women with births belong to 35 to 50 years age bracket with 0.0% of them unmarried.
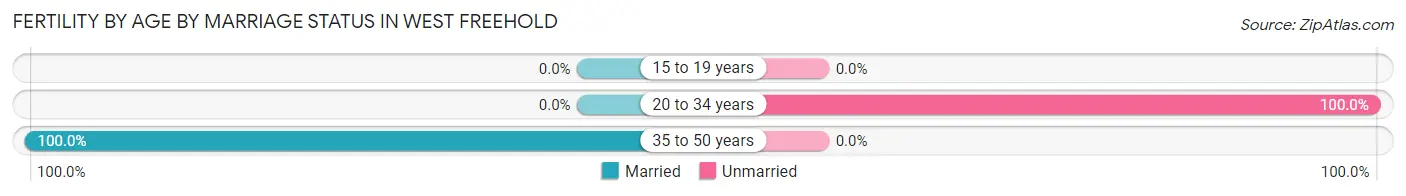
| Age Bracket | Married | Unmarried |
| 15 to 19 years | 0 (0.0%) | 0 (0.0%) |
| 20 to 34 years | 0 (0.0%) | 23 (100.0%) |
| 35 to 50 years | 22 (100.0%) | 0 (0.0%) |
| Total | 22 (48.9%) | 23 (51.1%) |
Fertility by Education in West Freehold
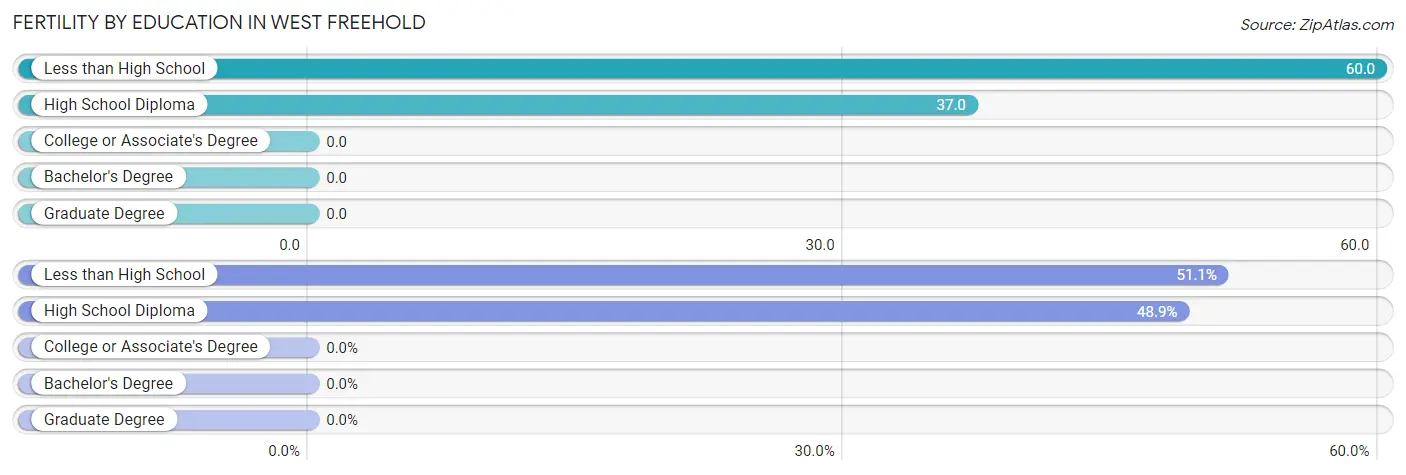
| Educational Attainment | Women with Births | Births / 1,000 Women |
| Less than High School | 23 (51.1%) | 60.0 |
| High School Diploma | 22 (48.9%) | 37.0 |
| College or Associate's Degree | 0 (0.0%) | 0.0 |
| Bachelor's Degree | 0 (0.0%) | 0.0 |
| Graduate Degree | 0 (0.0%) | 0.0 |
| Total | 45 (100.0%) | 15.0 |
Fertility by Education by Marriage Status in West Freehold
51.1% of women with births in West Freehold are unmarried. Women with the educational attainment of high school diploma are most likely to be married with 100.0% of them married at childbirth, while women with the educational attainment of less than high school are least likely to be married with 100.0% of them unmarried at childbirth.
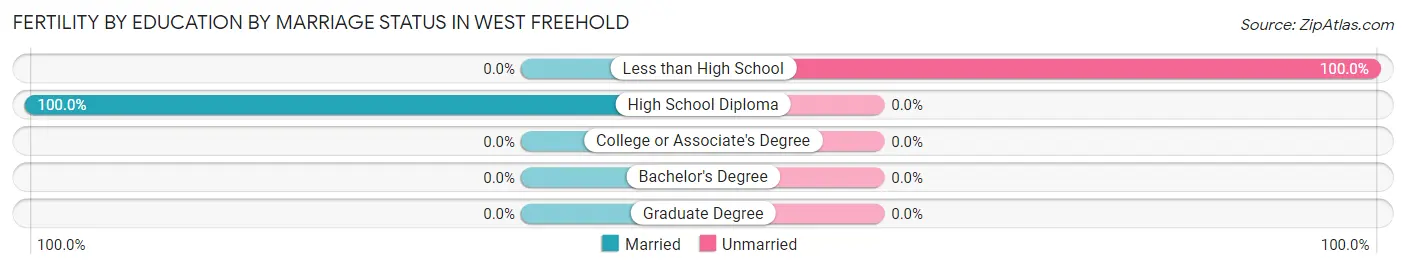
| Educational Attainment | Married | Unmarried |
| Less than High School | 0 (0.0%) | 23 (100.0%) |
| High School Diploma | 22 (100.0%) | 0 (0.0%) |
| College or Associate's Degree | 0 (0.0%) | 0 (0.0%) |
| Bachelor's Degree | 0 (0.0%) | 0 (0.0%) |
| Graduate Degree | 0 (0.0%) | 0 (0.0%) |
| Total | 22 (48.9%) | 23 (51.1%) |
Employment Characteristics in West Freehold
Employment by Class of Employer in West Freehold
Among the 7,374 employed individuals in West Freehold, private company employees (4,688 | 63.6%), local government employees (1,239 | 16.8%), and state government employees (345 | 4.7%) make up the most common classes of employment.
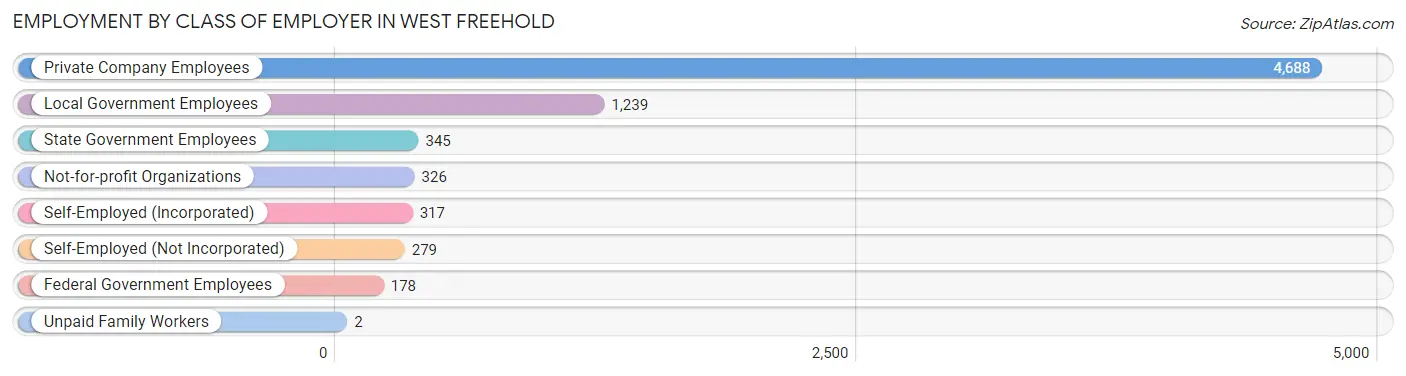
| Employer Class | # Employees | % Employees |
| Private Company Employees | 4,688 | 63.6% |
| Self-Employed (Incorporated) | 317 | 4.3% |
| Self-Employed (Not Incorporated) | 279 | 3.8% |
| Not-for-profit Organizations | 326 | 4.4% |
| Local Government Employees | 1,239 | 16.8% |
| State Government Employees | 345 | 4.7% |
| Federal Government Employees | 178 | 2.4% |
| Unpaid Family Workers | 2 | 0.0% |
| Total | 7,374 | 100.0% |
Employment Status by Age in West Freehold
According to the labor force statistics for West Freehold, out of the total population over 16 years of age (11,362), 67.9% or 7,715 individuals are in the labor force, with 3.6% or 278 of them unemployed. The age group with the highest labor force participation rate is 25 to 29 years, with 92.9% or 698 individuals in the labor force. Within the labor force, the 65 to 74 years age range has the highest percentage of unemployed individuals, with 18.0% or 37 of them being unemployed.
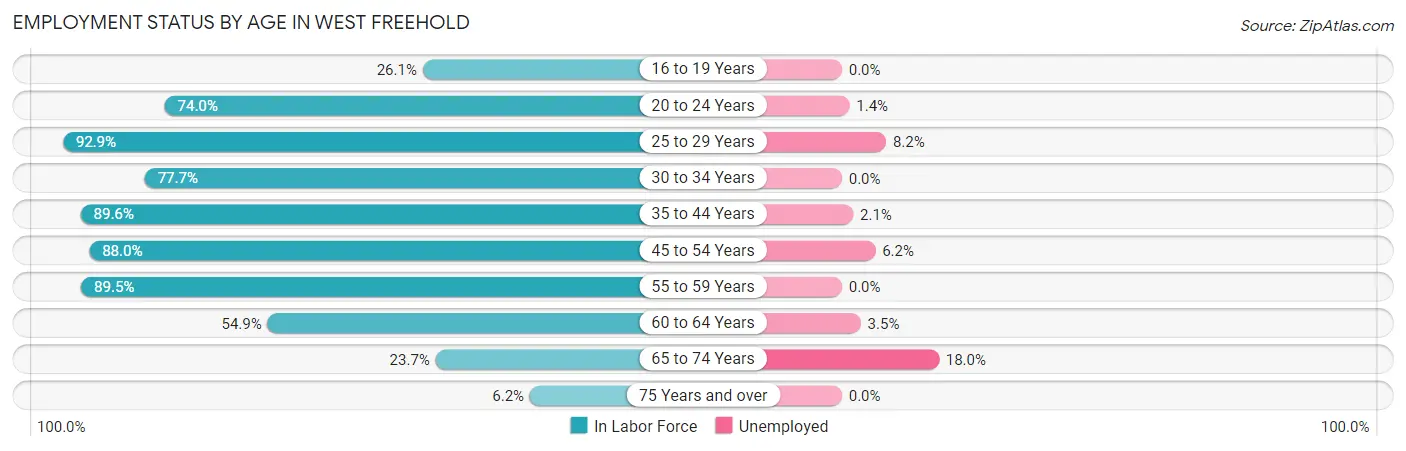
| Age Bracket | In Labor Force | Unemployed |
| 16 to 19 Years | 155 (26.1%) | 0 (0.0%) |
| 20 to 24 Years | 636 (74.0%) | 9 (1.4%) |
| 25 to 29 Years | 698 (92.9%) | 57 (8.2%) |
| 30 to 34 Years | 327 (77.7%) | 0 (0.0%) |
| 35 to 44 Years | 2,292 (89.6%) | 48 (2.1%) |
| 45 to 54 Years | 1,811 (88.0%) | 112 (6.2%) |
| 55 to 59 Years | 1,055 (89.5%) | 0 (0.0%) |
| 60 to 64 Years | 457 (54.9%) | 16 (3.5%) |
| 65 to 74 Years | 205 (23.7%) | 37 (18.0%) |
| 75 Years and over | 77 (6.2%) | 0 (0.0%) |
| Total | 7,715 (67.9%) | 278 (3.6%) |
Employment Status by Educational Attainment in West Freehold
According to labor force statistics for West Freehold, 85.1% of individuals (6,638) out of the total population between 25 and 64 years of age (7,800) are in the labor force, with 3.5% or 232 of them being unemployed. The group with the highest labor force participation rate are those with the educational attainment of bachelor's degree or higher, with 90.3% or 4,077 individuals in the labor force. Within the labor force, individuals with high school diploma education have the highest percentage of unemployment, with 6.0% or 68 of them being unemployed.
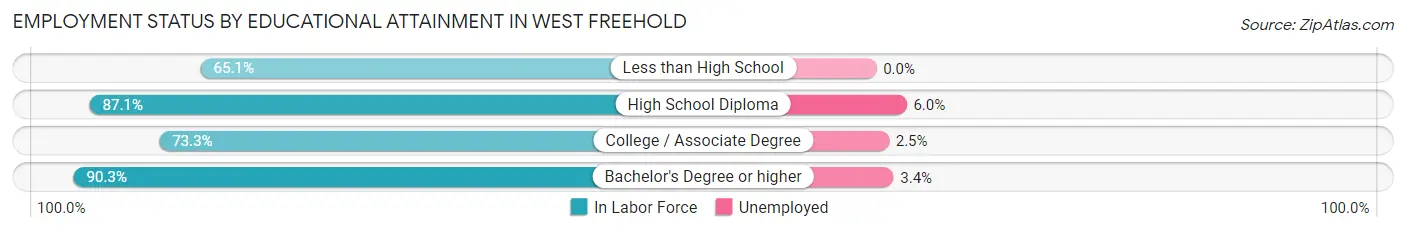
| Educational Attainment | In Labor Force | Unemployed |
| Less than High School | 218 (65.1%) | 0 (0.0%) |
| High School Diploma | 1,137 (87.1%) | 78 (6.0%) |
| College / Associate Degree | 1,206 (73.3%) | 41 (2.5%) |
| Bachelor's Degree or higher | 4,077 (90.3%) | 154 (3.4%) |
| Total | 6,638 (85.1%) | 273 (3.5%) |
Employment Occupations by Sex in West Freehold
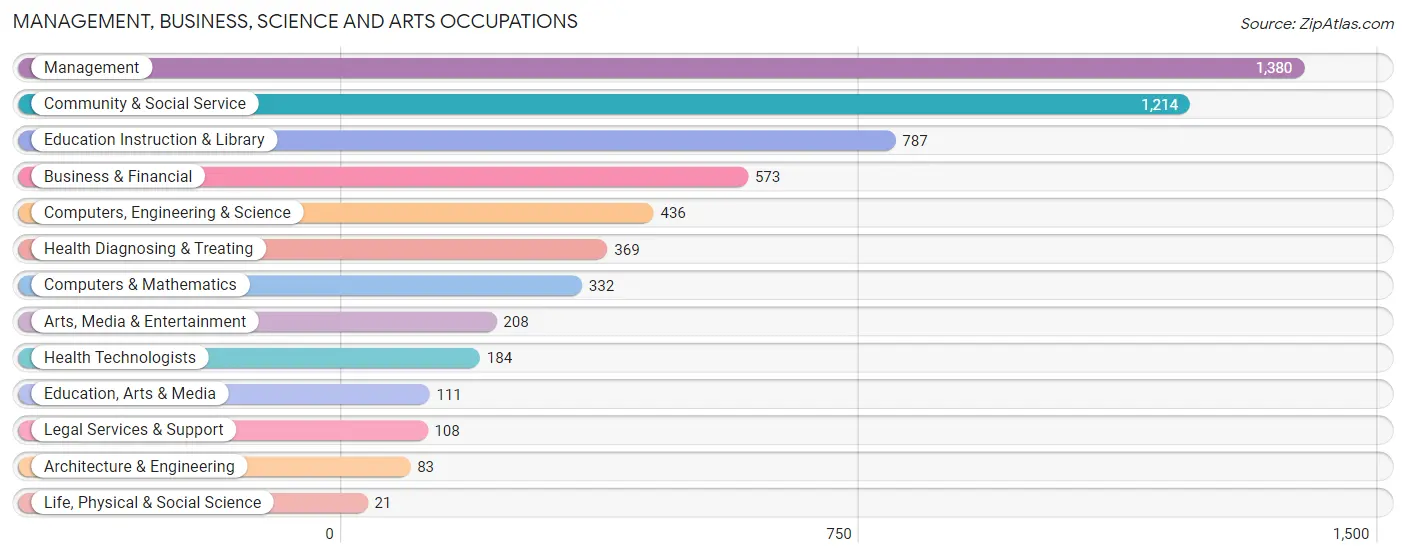
Management, Business, Science and Arts Occupations
The most common Management, Business, Science and Arts occupations in West Freehold are Management (1,380 | 18.6%), Community & Social Service (1,214 | 16.3%), Education Instruction & Library (787 | 10.6%), Business & Financial (573 | 7.7%), and Computers, Engineering & Science (436 | 5.9%).
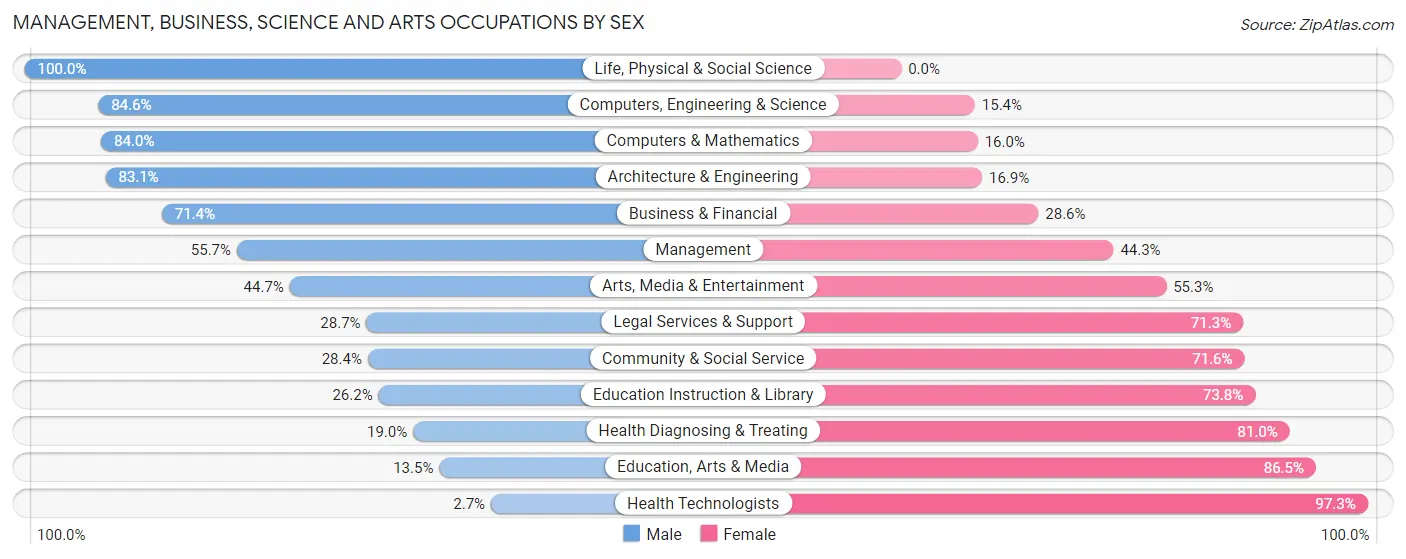
Management, Business, Science and Arts Occupations by Sex
Within the Management, Business, Science and Arts occupations in West Freehold, the most male-oriented occupations are Life, Physical & Social Science (100.0%), Computers, Engineering & Science (84.6%), and Computers & Mathematics (84.0%), while the most female-oriented occupations are Health Technologists (97.3%), Education, Arts & Media (86.5%), and Health Diagnosing & Treating (81.0%).
| Occupation | Male | Female |
| Management | 769 (55.7%) | 611 (44.3%) |
| Business & Financial | 409 (71.4%) | 164 (28.6%) |
| Computers, Engineering & Science | 369 (84.6%) | 67 (15.4%) |
| Computers & Mathematics | 279 (84.0%) | 53 (16.0%) |
| Architecture & Engineering | 69 (83.1%) | 14 (16.9%) |
| Life, Physical & Social Science | 21 (100.0%) | 0 (0.0%) |
| Community & Social Service | 345 (28.4%) | 869 (71.6%) |
| Education, Arts & Media | 15 (13.5%) | 96 (86.5%) |
| Legal Services & Support | 31 (28.7%) | 77 (71.3%) |
| Education Instruction & Library | 206 (26.2%) | 581 (73.8%) |
| Arts, Media & Entertainment | 93 (44.7%) | 115 (55.3%) |
| Health Diagnosing & Treating | 70 (19.0%) | 299 (81.0%) |
| Health Technologists | 5 (2.7%) | 179 (97.3%) |
| Total (Category) | 1,962 (49.4%) | 2,010 (50.6%) |
| Total (Overall) | 4,062 (54.7%) | 3,370 (45.3%) |
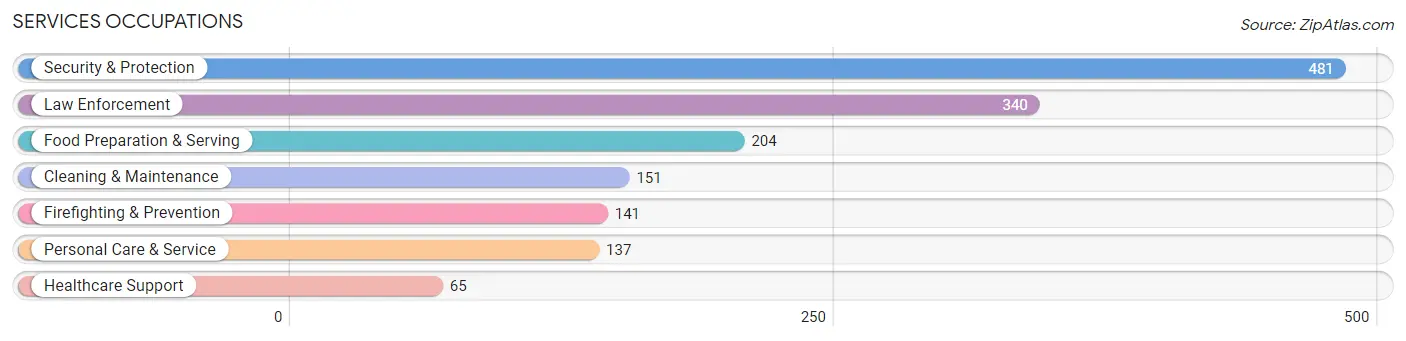
Services Occupations
The most common Services occupations in West Freehold are Security & Protection (481 | 6.5%), Law Enforcement (340 | 4.6%), Food Preparation & Serving (204 | 2.7%), Cleaning & Maintenance (151 | 2.0%), and Firefighting & Prevention (141 | 1.9%).
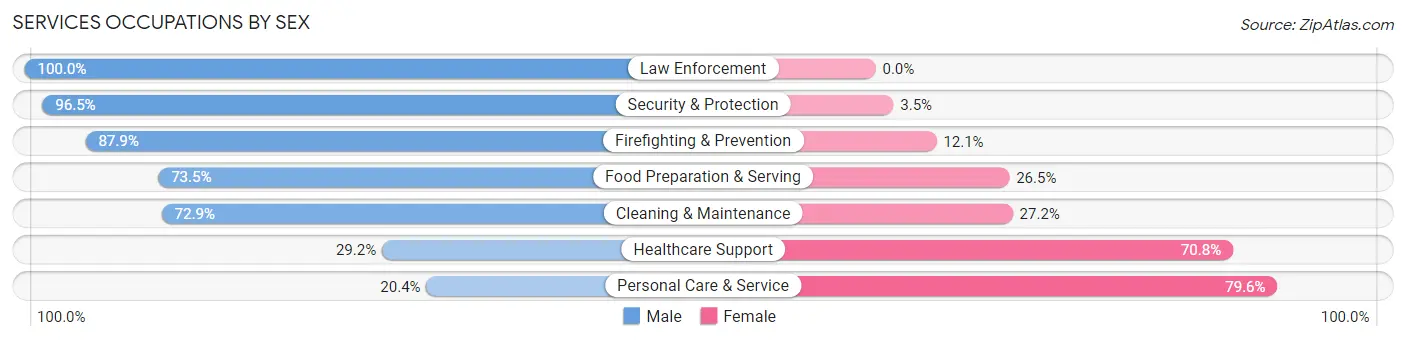
Services Occupations by Sex
Within the Services occupations in West Freehold, the most male-oriented occupations are Law Enforcement (100.0%), Security & Protection (96.5%), and Firefighting & Prevention (87.9%), while the most female-oriented occupations are Personal Care & Service (79.6%), Healthcare Support (70.8%), and Cleaning & Maintenance (27.2%).
| Occupation | Male | Female |
| Healthcare Support | 19 (29.2%) | 46 (70.8%) |
| Security & Protection | 464 (96.5%) | 17 (3.5%) |
| Firefighting & Prevention | 124 (87.9%) | 17 (12.1%) |
| Law Enforcement | 340 (100.0%) | 0 (0.0%) |
| Food Preparation & Serving | 150 (73.5%) | 54 (26.5%) |
| Cleaning & Maintenance | 110 (72.9%) | 41 (27.2%) |
| Personal Care & Service | 28 (20.4%) | 109 (79.6%) |
| Total (Category) | 771 (74.3%) | 267 (25.7%) |
| Total (Overall) | 4,062 (54.7%) | 3,370 (45.3%) |
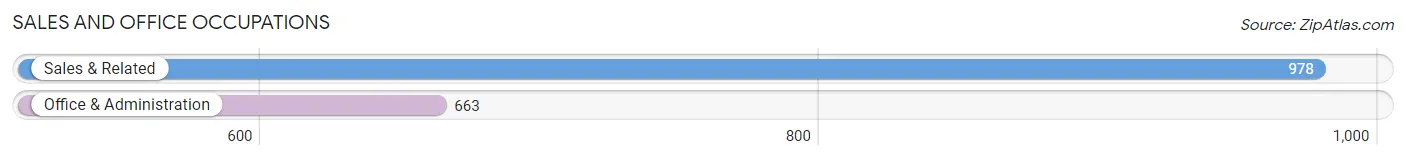
Sales and Office Occupations
The most common Sales and Office occupations in West Freehold are Sales & Related (978 | 13.2%), and Office & Administration (663 | 8.9%).
Sales and Office Occupations by Sex
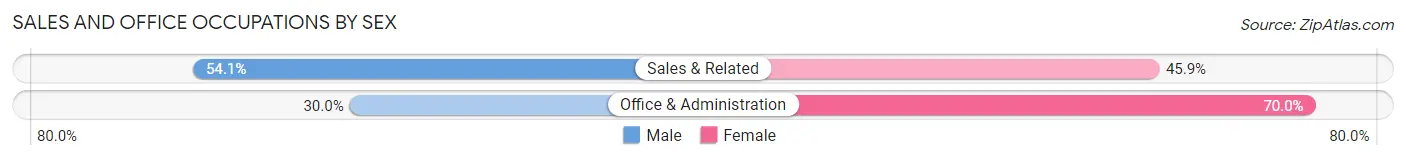
| Occupation | Male | Female |
| Sales & Related | 529 (54.1%) | 449 (45.9%) |
| Office & Administration | 199 (30.0%) | 464 (70.0%) |
| Total (Category) | 728 (44.4%) | 913 (55.6%) |
| Total (Overall) | 4,062 (54.7%) | 3,370 (45.3%) |
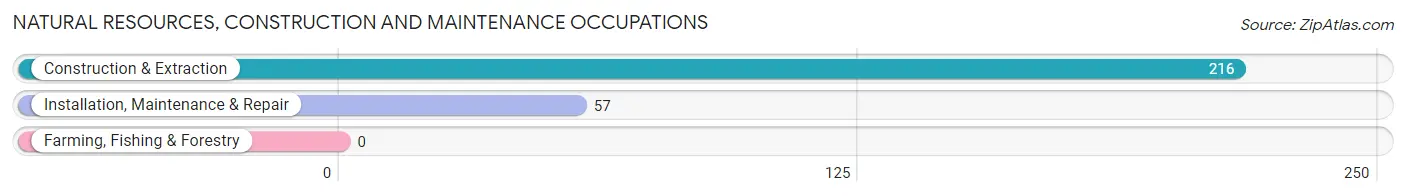
Natural Resources, Construction and Maintenance Occupations
The most common Natural Resources, Construction and Maintenance occupations in West Freehold are Construction & Extraction (216 | 2.9%), and Installation, Maintenance & Repair (57 | 0.8%).
Natural Resources, Construction and Maintenance Occupations by Sex
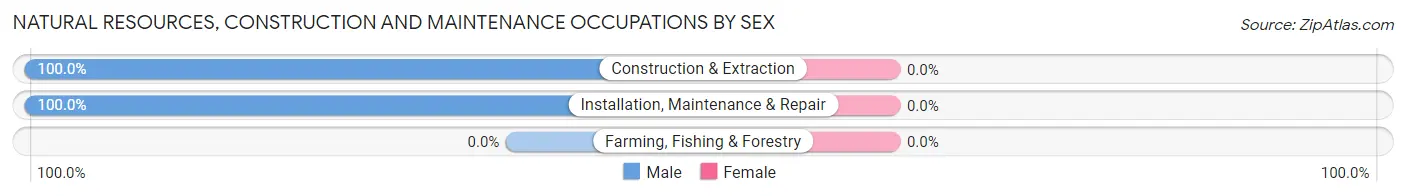
| Occupation | Male | Female |
| Farming, Fishing & Forestry | 0 (0.0%) | 0 (0.0%) |
| Construction & Extraction | 216 (100.0%) | 0 (0.0%) |
| Installation, Maintenance & Repair | 57 (100.0%) | 0 (0.0%) |
| Total (Category) | 273 (100.0%) | 0 (0.0%) |
| Total (Overall) | 4,062 (54.7%) | 3,370 (45.3%) |
Production, Transportation and Moving Occupations
The most common Production, Transportation and Moving occupations in West Freehold are Material Moving (205 | 2.8%), Transportation (179 | 2.4%), and Production (124 | 1.7%).
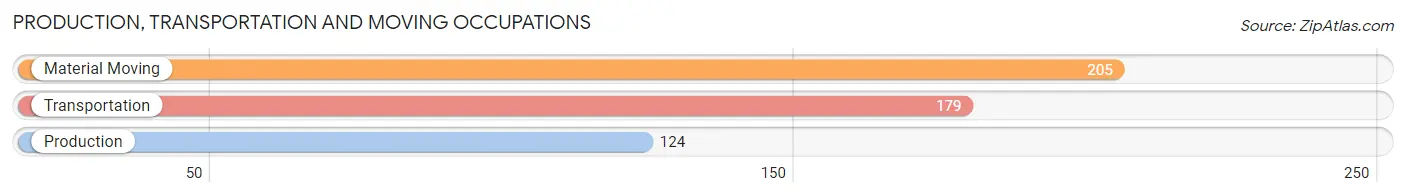
Production, Transportation and Moving Occupations by Sex
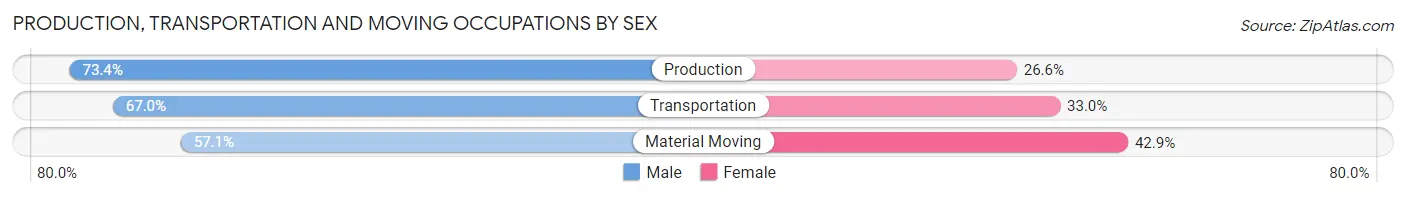
| Occupation | Male | Female |
| Production | 91 (73.4%) | 33 (26.6%) |
| Transportation | 120 (67.0%) | 59 (33.0%) |
| Material Moving | 117 (57.1%) | 88 (42.9%) |
| Total (Category) | 328 (64.6%) | 180 (35.4%) |
| Total (Overall) | 4,062 (54.7%) | 3,370 (45.3%) |
Employment Industries by Sex in West Freehold
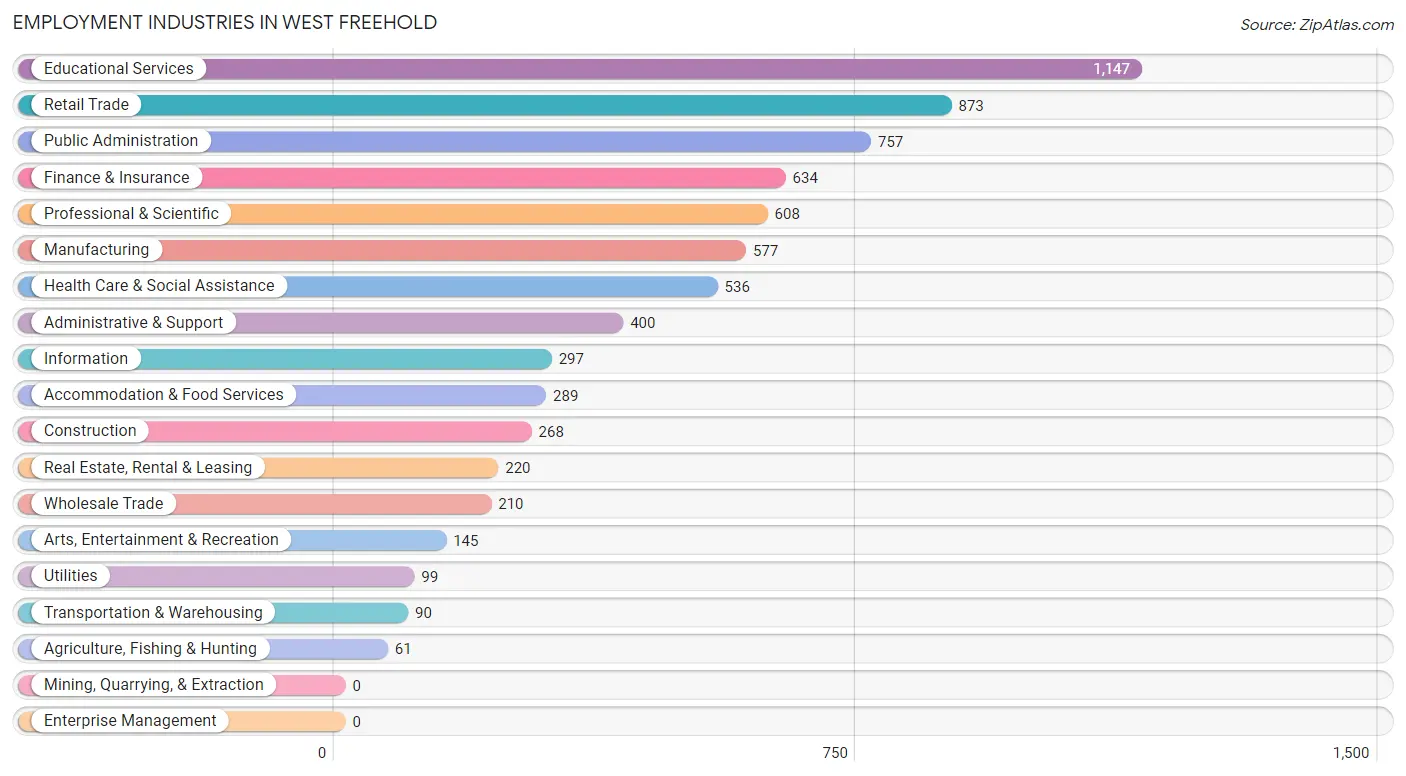
Employment Industries in West Freehold
The major employment industries in West Freehold include Educational Services (1,147 | 15.4%), Retail Trade (873 | 11.7%), Public Administration (757 | 10.2%), Finance & Insurance (634 | 8.5%), and Professional & Scientific (608 | 8.2%).
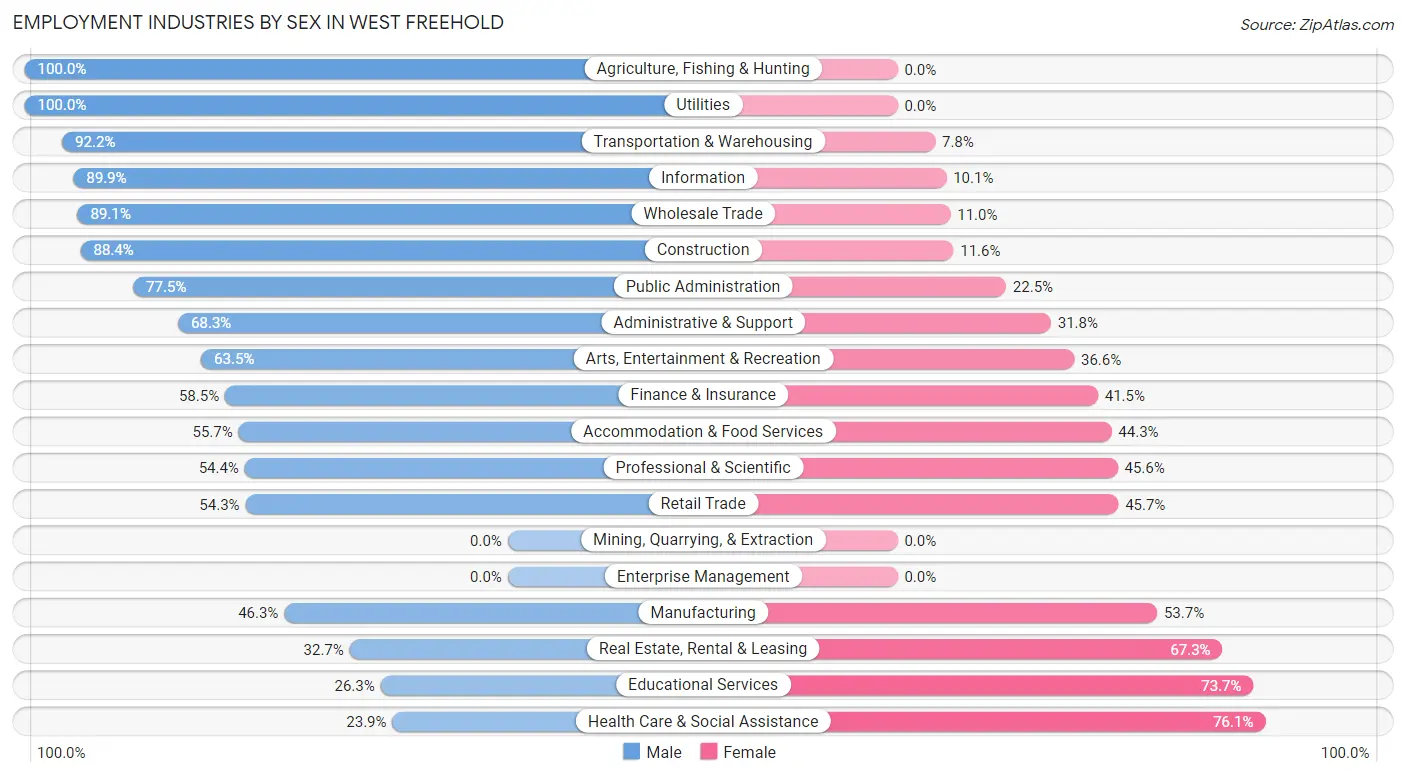
Employment Industries by Sex in West Freehold
The West Freehold industries that see more men than women are Agriculture, Fishing & Hunting (100.0%), Utilities (100.0%), and Transportation & Warehousing (92.2%), whereas the industries that tend to have a higher number of women are Health Care & Social Assistance (76.1%), Educational Services (73.7%), and Real Estate, Rental & Leasing (67.3%).
| Industry | Male | Female |
| Agriculture, Fishing & Hunting | 61 (100.0%) | 0 (0.0%) |
| Mining, Quarrying, & Extraction | 0 (0.0%) | 0 (0.0%) |
| Construction | 237 (88.4%) | 31 (11.6%) |
| Manufacturing | 267 (46.3%) | 310 (53.7%) |
| Wholesale Trade | 187 (89.0%) | 23 (11.0%) |
| Retail Trade | 474 (54.3%) | 399 (45.7%) |
| Transportation & Warehousing | 83 (92.2%) | 7 (7.8%) |
| Utilities | 99 (100.0%) | 0 (0.0%) |
| Information | 267 (89.9%) | 30 (10.1%) |
| Finance & Insurance | 371 (58.5%) | 263 (41.5%) |
| Real Estate, Rental & Leasing | 72 (32.7%) | 148 (67.3%) |
| Professional & Scientific | 331 (54.4%) | 277 (45.6%) |
| Enterprise Management | 0 (0.0%) | 0 (0.0%) |
| Administrative & Support | 273 (68.2%) | 127 (31.8%) |
| Educational Services | 302 (26.3%) | 845 (73.7%) |
| Health Care & Social Assistance | 128 (23.9%) | 408 (76.1%) |
| Arts, Entertainment & Recreation | 92 (63.4%) | 53 (36.5%) |
| Accommodation & Food Services | 161 (55.7%) | 128 (44.3%) |
| Public Administration | 587 (77.5%) | 170 (22.5%) |
| Total | 4,062 (54.7%) | 3,370 (45.3%) |
Education in West Freehold
School Enrollment in West Freehold
The most common levels of schooling among the 3,925 students in West Freehold are elementary school (1,332 | 33.9%), middle school (851 | 21.7%), and high school (734 | 18.7%).
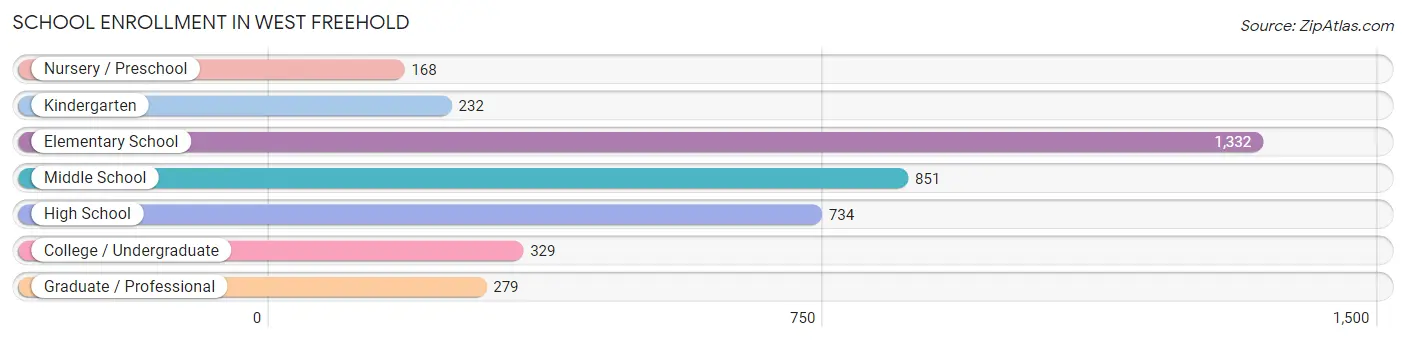
| School Level | # Students | % Students |
| Nursery / Preschool | 168 | 4.3% |
| Kindergarten | 232 | 5.9% |
| Elementary School | 1,332 | 33.9% |
| Middle School | 851 | 21.7% |
| High School | 734 | 18.7% |
| College / Undergraduate | 329 | 8.4% |
| Graduate / Professional | 279 | 7.1% |
| Total | 3,925 | 100.0% |
School Enrollment by Age by Funding Source in West Freehold
Out of a total of 3,925 students who are enrolled in schools in West Freehold, 695 (17.7%) attend a private institution, while the remaining 3,230 (82.3%) are enrolled in public schools. The age group of 3 to 4 year olds has the highest likelihood of being enrolled in private schools, with 119 (85.6% in the age bracket) enrolled. Conversely, the age group of 18 to 19 year olds has the lowest likelihood of being enrolled in a private school, with 148 (100.0% in the age bracket) attending a public institution.
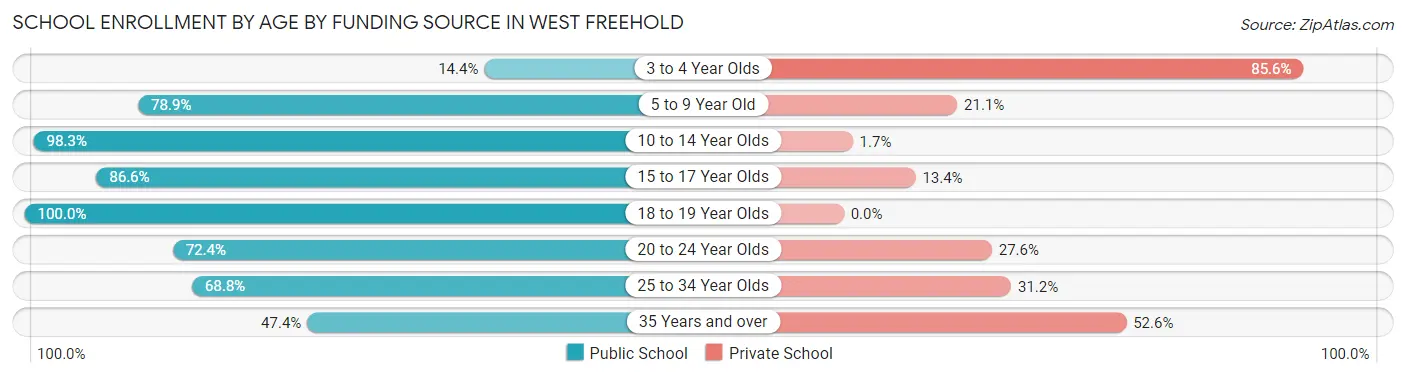
| Age Bracket | Public School | Private School |
| 3 to 4 Year Olds | 20 (14.4%) | 119 (85.6%) |
| 5 to 9 Year Old | 1,179 (78.9%) | 316 (21.1%) |
| 10 to 14 Year Olds | 1,004 (98.3%) | 17 (1.7%) |
| 15 to 17 Year Olds | 538 (86.6%) | 83 (13.4%) |
| 18 to 19 Year Olds | 148 (100.0%) | 0 (0.0%) |
| 20 to 24 Year Olds | 252 (72.4%) | 96 (27.6%) |
| 25 to 34 Year Olds | 53 (68.8%) | 24 (31.2%) |
| 35 Years and over | 36 (47.4%) | 40 (52.6%) |
| Total | 3,230 (82.3%) | 695 (17.7%) |
Educational Attainment by Field of Study in West Freehold
Business (1,600 | 26.2%), education (557 | 9.1%), psychology (471 | 7.7%), arts & humanities (466 | 7.6%), and computers & mathematics (422 | 6.9%) are the most common fields of study among 6,112 individuals in West Freehold who have obtained a bachelor's degree or higher.
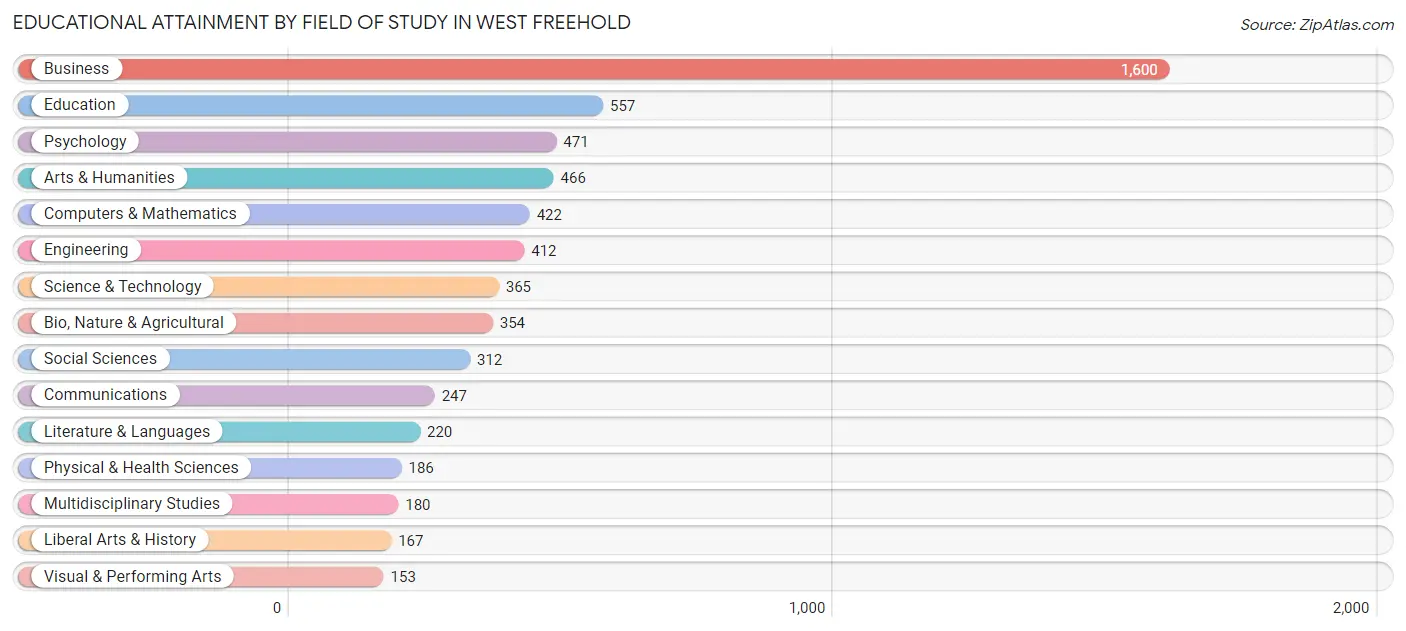
| Field of Study | # Graduates | % Graduates |
| Computers & Mathematics | 422 | 6.9% |
| Bio, Nature & Agricultural | 354 | 5.8% |
| Physical & Health Sciences | 186 | 3.0% |
| Psychology | 471 | 7.7% |
| Social Sciences | 312 | 5.1% |
| Engineering | 412 | 6.7% |
| Multidisciplinary Studies | 180 | 2.9% |
| Science & Technology | 365 | 6.0% |
| Business | 1,600 | 26.2% |
| Education | 557 | 9.1% |
| Literature & Languages | 220 | 3.6% |
| Liberal Arts & History | 167 | 2.7% |
| Visual & Performing Arts | 153 | 2.5% |
| Communications | 247 | 4.0% |
| Arts & Humanities | 466 | 7.6% |
| Total | 6,112 | 100.0% |
Transportation & Commute in West Freehold
Vehicle Availability by Sex in West Freehold
The most prevalent vehicle ownership categories in West Freehold are males with 2 vehicles (2,014, accounting for 49.9%) and females with 2 vehicles (1,429, making up 60.4%).
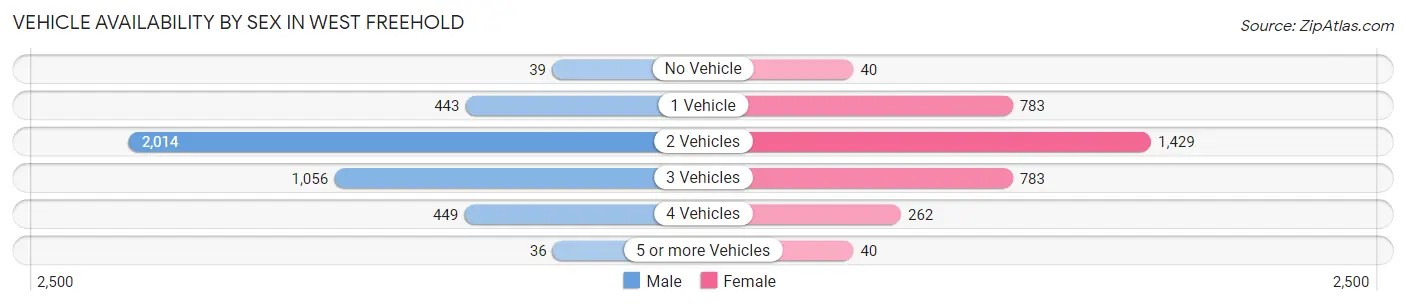
| Vehicles Available | Male | Female |
| No Vehicle | 39 (1.0%) | 40 (1.2%) |
| 1 Vehicle | 443 (11.0%) | 783 (23.5%) |
| 2 Vehicles | 2,014 (49.9%) | 1,429 (42.8%) |
| 3 Vehicles | 1,056 (26.2%) | 783 (23.5%) |
| 4 Vehicles | 449 (11.1%) | 262 (7.9%) |
| 5 or more Vehicles | 36 (0.9%) | 40 (1.2%) |
| Total | 4,037 (100.0%) | 3,337 (100.0%) |
Commute Time in West Freehold
The most frequently occuring commute durations in West Freehold are 15 to 19 minutes (976 commuters, 16.7%), 5 to 9 minutes (844 commuters, 14.5%), and 10 to 14 minutes (586 commuters, 10.1%).
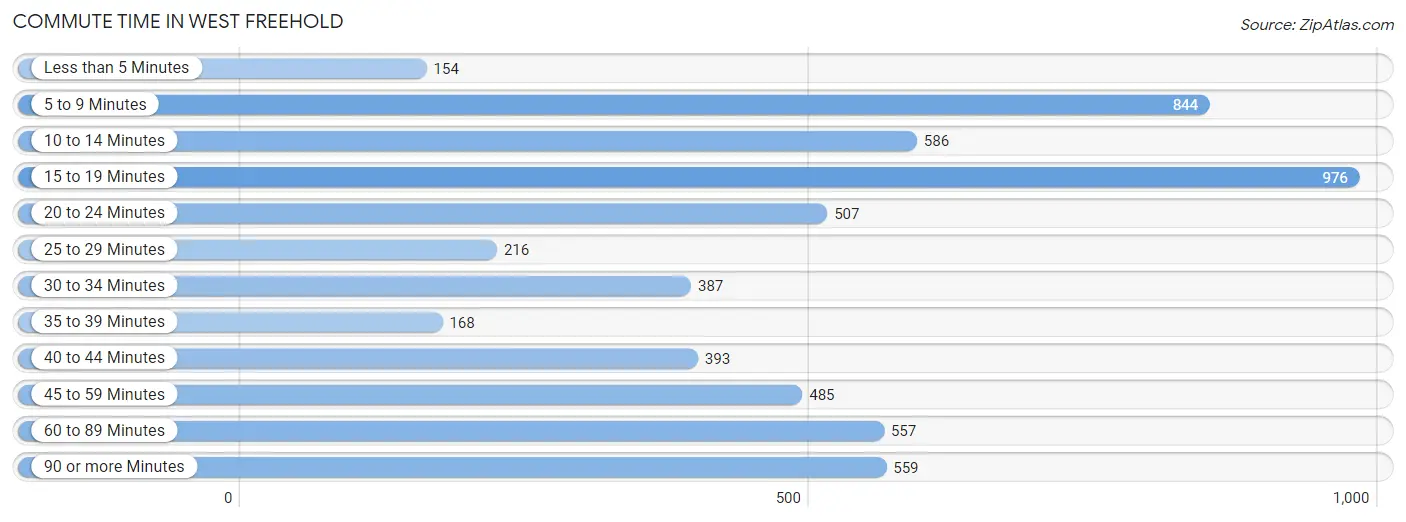
| Commute Time | # Commuters | % Commuters |
| Less than 5 Minutes | 154 | 2.6% |
| 5 to 9 Minutes | 844 | 14.5% |
| 10 to 14 Minutes | 586 | 10.1% |
| 15 to 19 Minutes | 976 | 16.7% |
| 20 to 24 Minutes | 507 | 8.7% |
| 25 to 29 Minutes | 216 | 3.7% |
| 30 to 34 Minutes | 387 | 6.6% |
| 35 to 39 Minutes | 168 | 2.9% |
| 40 to 44 Minutes | 393 | 6.7% |
| 45 to 59 Minutes | 485 | 8.3% |
| 60 to 89 Minutes | 557 | 9.6% |
| 90 or more Minutes | 559 | 9.6% |
Commute Time by Sex in West Freehold
The most common commute times in West Freehold are 60 to 89 minutes (489 commuters, 15.4%) for males and 15 to 19 minutes (586 commuters, 22.1%) for females.
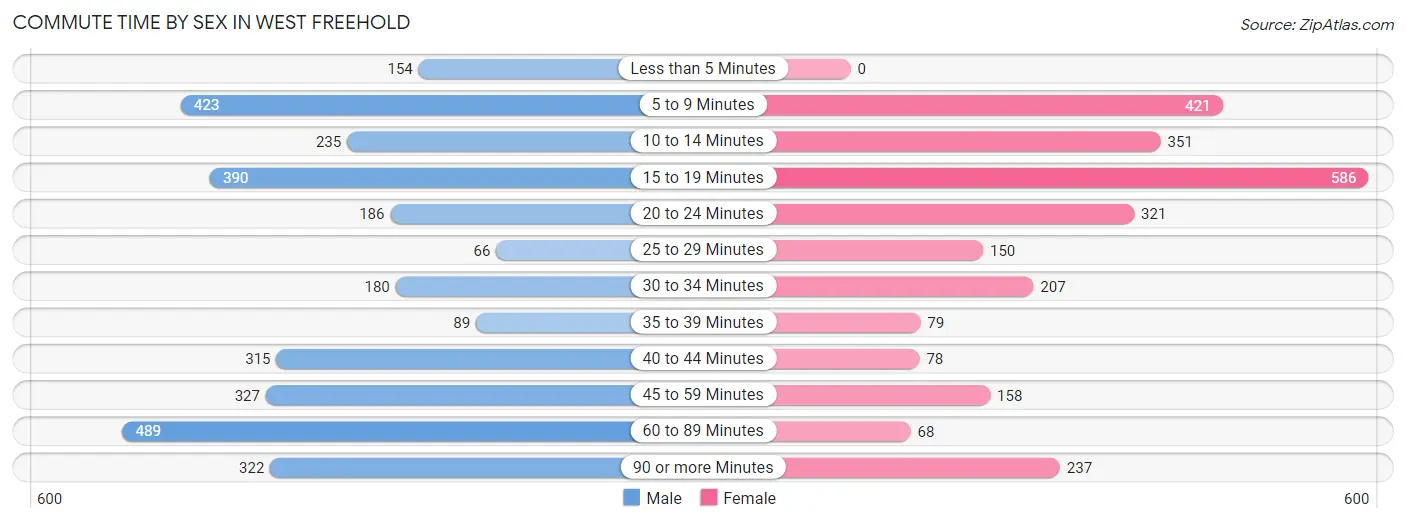
| Commute Time | Male | Female |
| Less than 5 Minutes | 154 (4.9%) | 0 (0.0%) |
| 5 to 9 Minutes | 423 (13.3%) | 421 (15.9%) |
| 10 to 14 Minutes | 235 (7.4%) | 351 (13.2%) |
| 15 to 19 Minutes | 390 (12.3%) | 586 (22.1%) |
| 20 to 24 Minutes | 186 (5.9%) | 321 (12.1%) |
| 25 to 29 Minutes | 66 (2.1%) | 150 (5.7%) |
| 30 to 34 Minutes | 180 (5.7%) | 207 (7.8%) |
| 35 to 39 Minutes | 89 (2.8%) | 79 (3.0%) |
| 40 to 44 Minutes | 315 (9.9%) | 78 (2.9%) |
| 45 to 59 Minutes | 327 (10.3%) | 158 (5.9%) |
| 60 to 89 Minutes | 489 (15.4%) | 68 (2.6%) |
| 90 or more Minutes | 322 (10.1%) | 237 (8.9%) |
Time of Departure to Work by Sex in West Freehold
The most frequent times of departure to work in West Freehold are 7:00 AM to 7:29 AM (471, 14.8%) for males and 7:30 AM to 7:59 AM (866, 32.6%) for females.
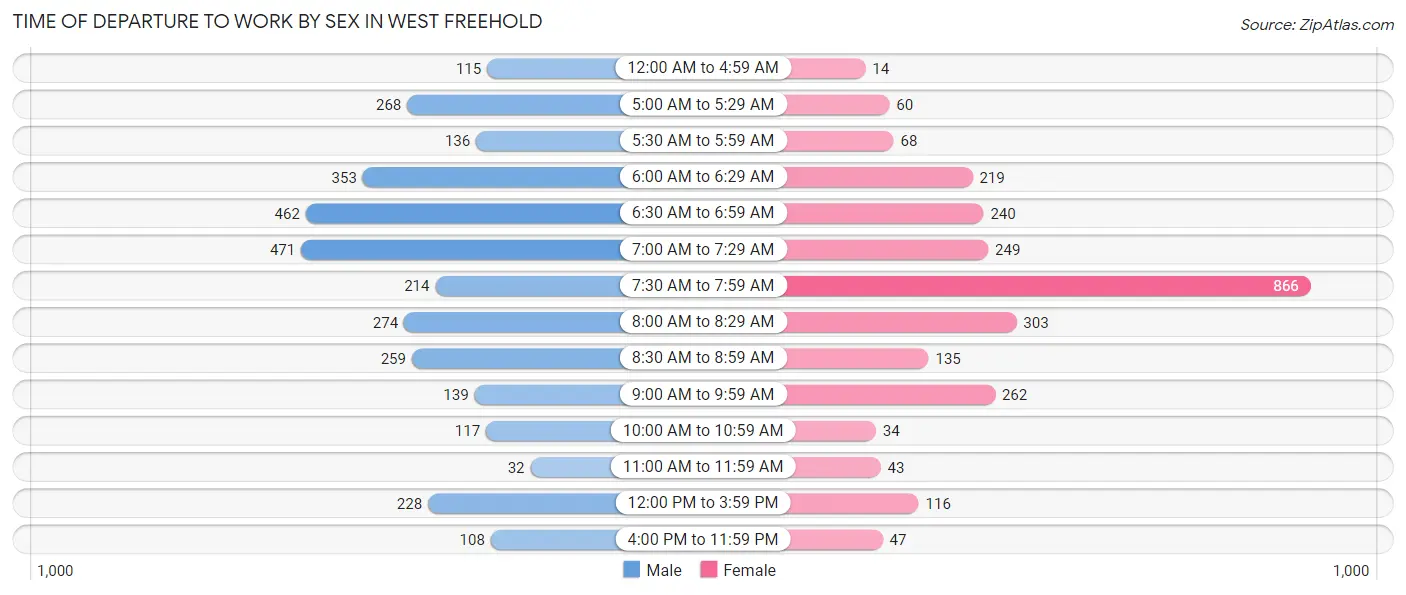
| Time of Departure | Male | Female |
| 12:00 AM to 4:59 AM | 115 (3.6%) | 14 (0.5%) |
| 5:00 AM to 5:29 AM | 268 (8.4%) | 60 (2.3%) |
| 5:30 AM to 5:59 AM | 136 (4.3%) | 68 (2.6%) |
| 6:00 AM to 6:29 AM | 353 (11.1%) | 219 (8.3%) |
| 6:30 AM to 6:59 AM | 462 (14.5%) | 240 (9.0%) |
| 7:00 AM to 7:29 AM | 471 (14.8%) | 249 (9.4%) |
| 7:30 AM to 7:59 AM | 214 (6.7%) | 866 (32.6%) |
| 8:00 AM to 8:29 AM | 274 (8.6%) | 303 (11.4%) |
| 8:30 AM to 8:59 AM | 259 (8.2%) | 135 (5.1%) |
| 9:00 AM to 9:59 AM | 139 (4.4%) | 262 (9.9%) |
| 10:00 AM to 10:59 AM | 117 (3.7%) | 34 (1.3%) |
| 11:00 AM to 11:59 AM | 32 (1.0%) | 43 (1.6%) |
| 12:00 PM to 3:59 PM | 228 (7.2%) | 116 (4.4%) |
| 4:00 PM to 11:59 PM | 108 (3.4%) | 47 (1.8%) |
| Total | 3,176 (100.0%) | 2,656 (100.0%) |
Housing Occupancy in West Freehold
Occupancy by Ownership in West Freehold
Of the total 5,509 dwellings in West Freehold, owner-occupied units account for 4,783 (86.8%), while renter-occupied units make up 726 (13.2%).
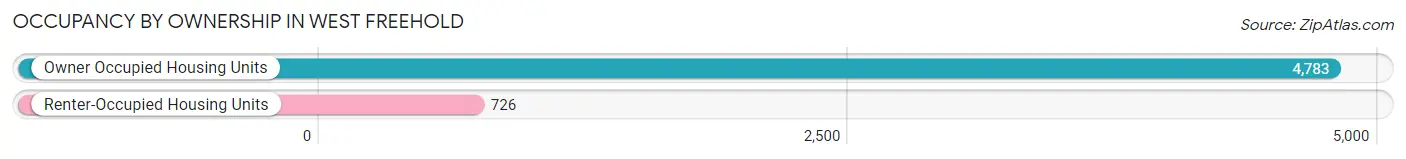
| Occupancy | # Housing Units | % Housing Units |
| Owner Occupied Housing Units | 4,783 | 86.8% |
| Renter-Occupied Housing Units | 726 | 13.2% |
| Total Occupied Housing Units | 5,509 | 100.0% |
Occupancy by Household Size in West Freehold
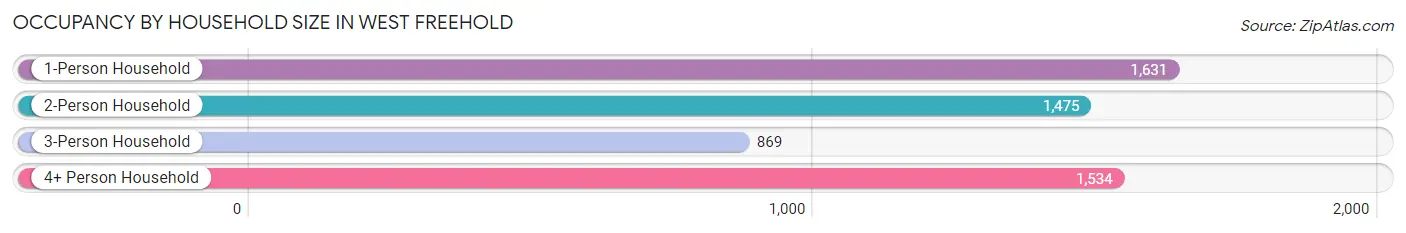
| Household Size | # Housing Units | % Housing Units |
| 1-Person Household | 1,631 | 29.6% |
| 2-Person Household | 1,475 | 26.8% |
| 3-Person Household | 869 | 15.8% |
| 4+ Person Household | 1,534 | 27.9% |
| Total Housing Units | 5,509 | 100.0% |
Occupancy by Ownership by Household Size in West Freehold
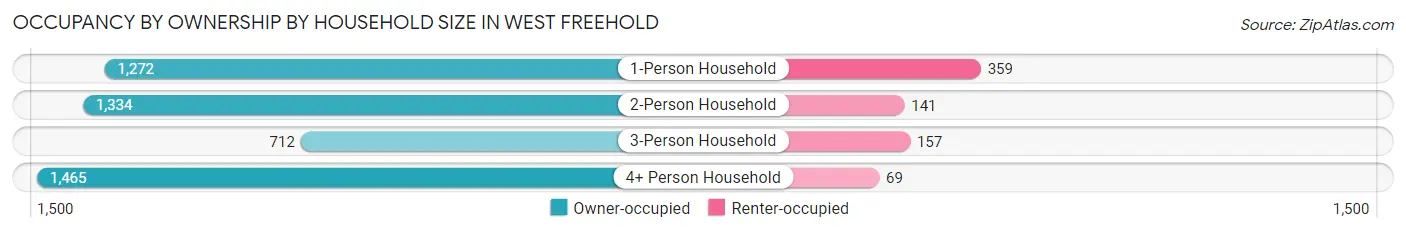
| Household Size | Owner-occupied | Renter-occupied |
| 1-Person Household | 1,272 (78.0%) | 359 (22.0%) |
| 2-Person Household | 1,334 (90.4%) | 141 (9.6%) |
| 3-Person Household | 712 (81.9%) | 157 (18.1%) |
| 4+ Person Household | 1,465 (95.5%) | 69 (4.5%) |
| Total Housing Units | 4,783 (86.8%) | 726 (13.2%) |
Occupancy by Educational Attainment in West Freehold
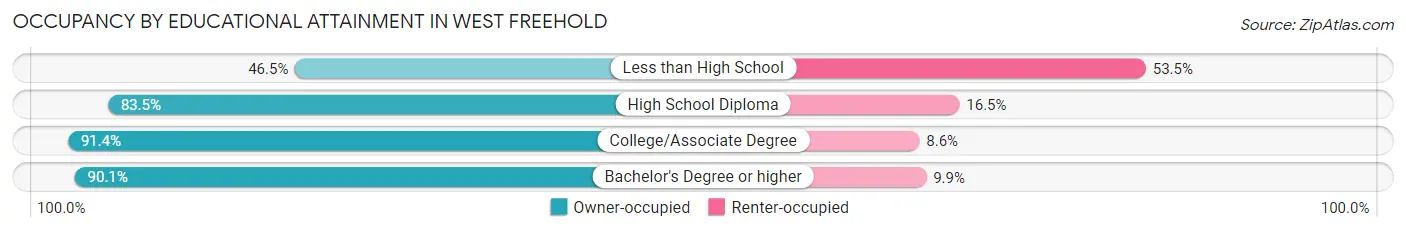
| Household Size | Owner-occupied | Renter-occupied |
| Less than High School | 148 (46.5%) | 170 (53.5%) |
| High School Diploma | 724 (83.5%) | 143 (16.5%) |
| College/Associate Degree | 1,079 (91.4%) | 101 (8.6%) |
| Bachelor's Degree or higher | 2,832 (90.1%) | 312 (9.9%) |
Occupancy by Age of Householder in West Freehold
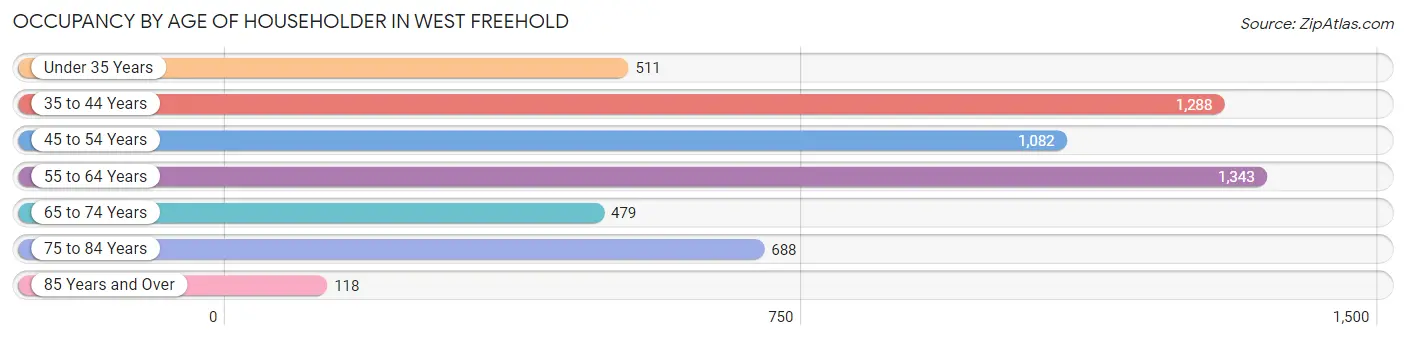
| Age Bracket | # Households | % Households |
| Under 35 Years | 511 | 9.3% |
| 35 to 44 Years | 1,288 | 23.4% |
| 45 to 54 Years | 1,082 | 19.6% |
| 55 to 64 Years | 1,343 | 24.4% |
| 65 to 74 Years | 479 | 8.7% |
| 75 to 84 Years | 688 | 12.5% |
| 85 Years and Over | 118 | 2.1% |
| Total | 5,509 | 100.0% |
Housing Finances in West Freehold
Median Income by Occupancy in West Freehold
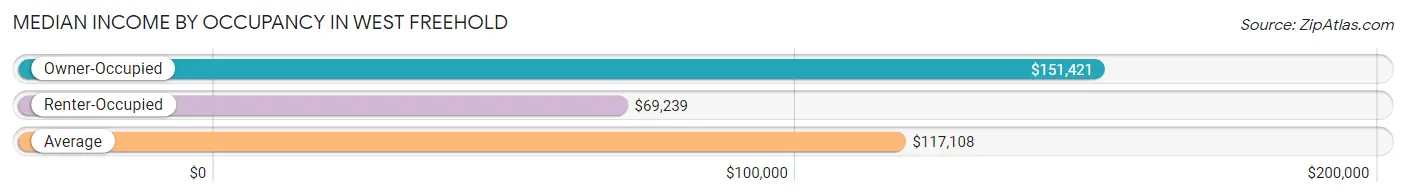
| Occupancy Type | # Households | Median Income |
| Owner-Occupied | 4,783 (86.8%) | $151,421 |
| Renter-Occupied | 726 (13.2%) | $69,239 |
| Average | 5,509 (100.0%) | $117,108 |
Occupancy by Householder Income Bracket in West Freehold
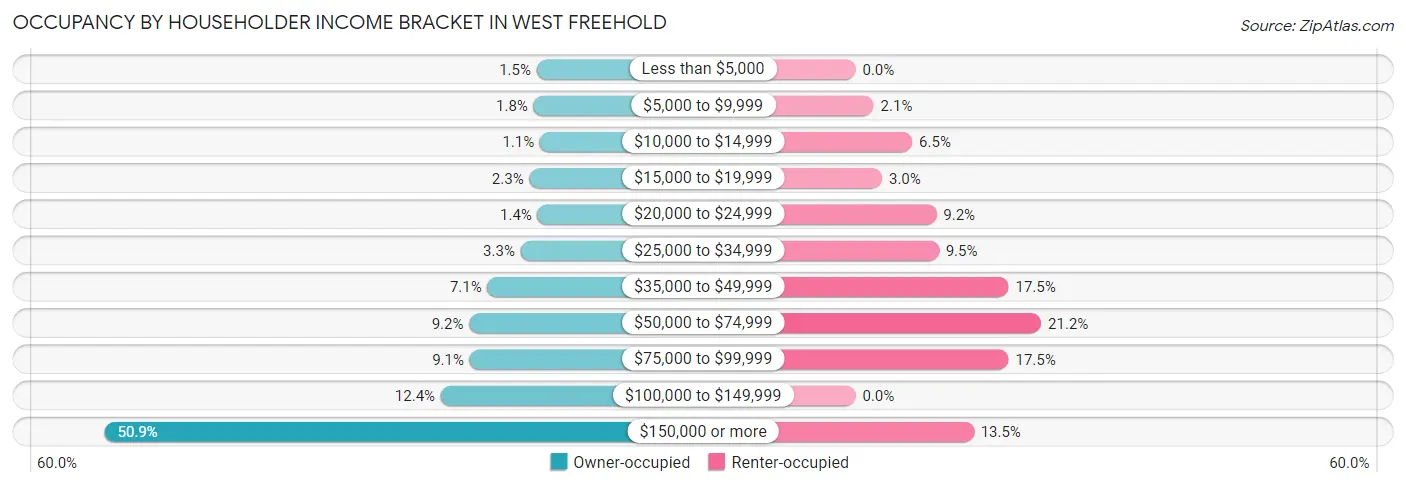
| Income Bracket | Owner-occupied | Renter-occupied |
| Less than $5,000 | 70 (1.5%) | 0 (0.0%) |
| $5,000 to $9,999 | 87 (1.8%) | 15 (2.1%) |
| $10,000 to $14,999 | 52 (1.1%) | 47 (6.5%) |
| $15,000 to $19,999 | 110 (2.3%) | 22 (3.0%) |
| $20,000 to $24,999 | 65 (1.4%) | 67 (9.2%) |
| $25,000 to $34,999 | 158 (3.3%) | 69 (9.5%) |
| $35,000 to $49,999 | 339 (7.1%) | 127 (17.5%) |
| $50,000 to $74,999 | 439 (9.2%) | 154 (21.2%) |
| $75,000 to $99,999 | 436 (9.1%) | 127 (17.5%) |
| $100,000 to $149,999 | 594 (12.4%) | 0 (0.0%) |
| $150,000 or more | 2,433 (50.9%) | 98 (13.5%) |
| Total | 4,783 (100.0%) | 726 (100.0%) |
Monthly Housing Cost Tiers in West Freehold
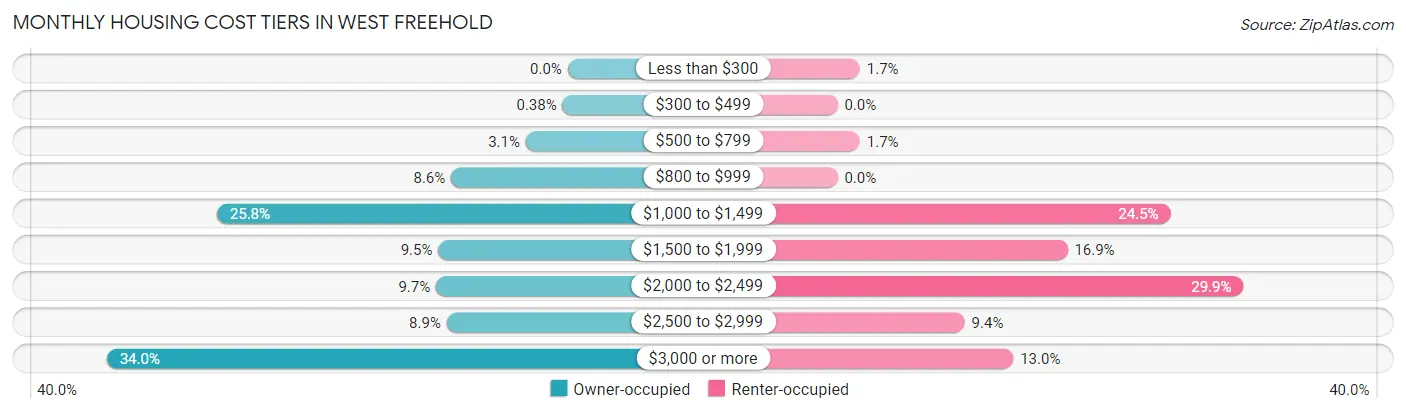
| Monthly Cost | Owner-occupied | Renter-occupied |
| Less than $300 | 0 (0.0%) | 12 (1.7%) |
| $300 to $499 | 18 (0.4%) | 0 (0.0%) |
| $500 to $799 | 148 (3.1%) | 12 (1.7%) |
| $800 to $999 | 411 (8.6%) | 0 (0.0%) |
| $1,000 to $1,499 | 1,236 (25.8%) | 178 (24.5%) |
| $1,500 to $1,999 | 456 (9.5%) | 123 (16.9%) |
| $2,000 to $2,499 | 464 (9.7%) | 217 (29.9%) |
| $2,500 to $2,999 | 426 (8.9%) | 68 (9.4%) |
| $3,000 or more | 1,624 (34.0%) | 94 (13.0%) |
| Total | 4,783 (100.0%) | 726 (100.0%) |
Physical Housing Characteristics in West Freehold
Housing Structures in West Freehold
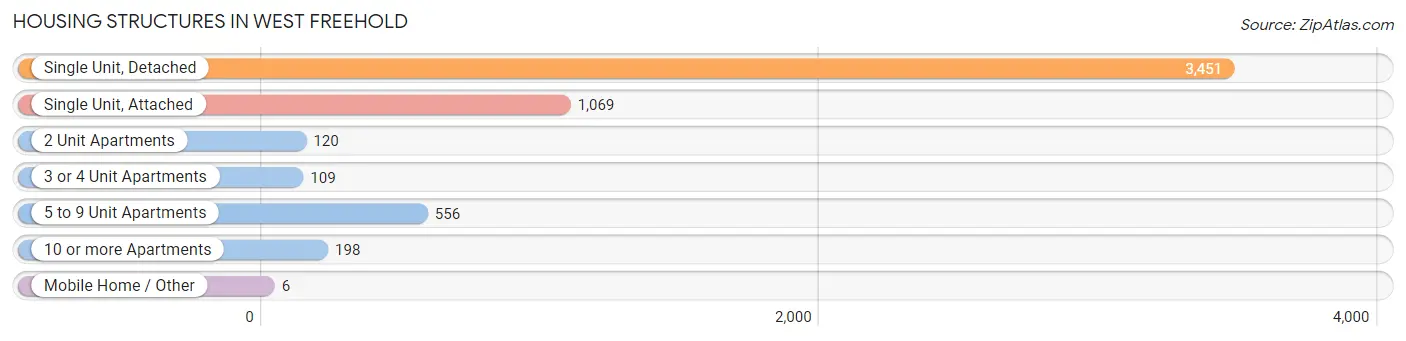
| Structure Type | # Housing Units | % Housing Units |
| Single Unit, Detached | 3,451 | 62.6% |
| Single Unit, Attached | 1,069 | 19.4% |
| 2 Unit Apartments | 120 | 2.2% |
| 3 or 4 Unit Apartments | 109 | 2.0% |
| 5 to 9 Unit Apartments | 556 | 10.1% |
| 10 or more Apartments | 198 | 3.6% |
| Mobile Home / Other | 6 | 0.1% |
| Total | 5,509 | 100.0% |
Housing Structures by Occupancy in West Freehold
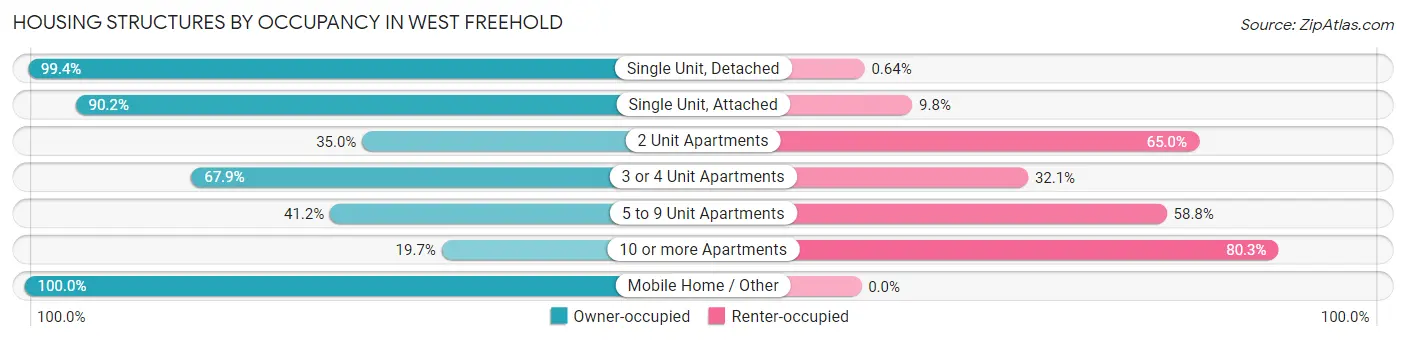
| Structure Type | Owner-occupied | Renter-occupied |
| Single Unit, Detached | 3,429 (99.4%) | 22 (0.6%) |
| Single Unit, Attached | 964 (90.2%) | 105 (9.8%) |
| 2 Unit Apartments | 42 (35.0%) | 78 (65.0%) |
| 3 or 4 Unit Apartments | 74 (67.9%) | 35 (32.1%) |
| 5 to 9 Unit Apartments | 229 (41.2%) | 327 (58.8%) |
| 10 or more Apartments | 39 (19.7%) | 159 (80.3%) |
| Mobile Home / Other | 6 (100.0%) | 0 (0.0%) |
| Total | 4,783 (86.8%) | 726 (13.2%) |
Housing Structures by Number of Rooms in West Freehold
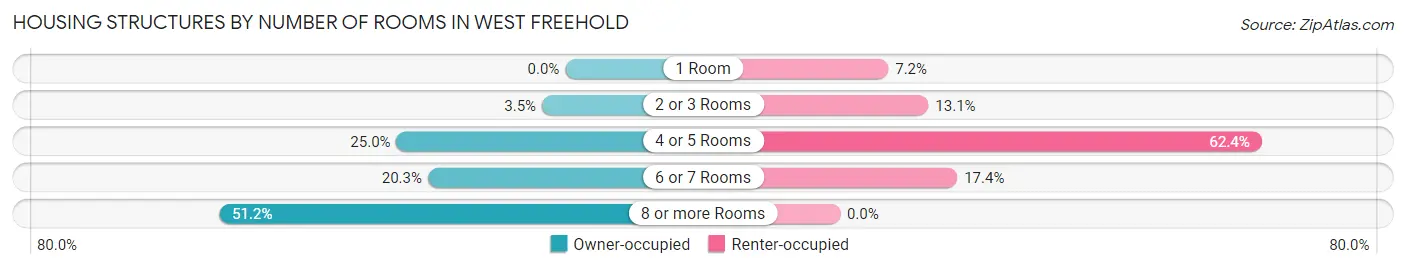
| Number of Rooms | Owner-occupied | Renter-occupied |
| 1 Room | 0 (0.0%) | 52 (7.2%) |
| 2 or 3 Rooms | 165 (3.5%) | 95 (13.1%) |
| 4 or 5 Rooms | 1,195 (25.0%) | 453 (62.4%) |
| 6 or 7 Rooms | 973 (20.3%) | 126 (17.4%) |
| 8 or more Rooms | 2,450 (51.2%) | 0 (0.0%) |
| Total | 4,783 (100.0%) | 726 (100.0%) |
Housing Structure by Heating Type in West Freehold
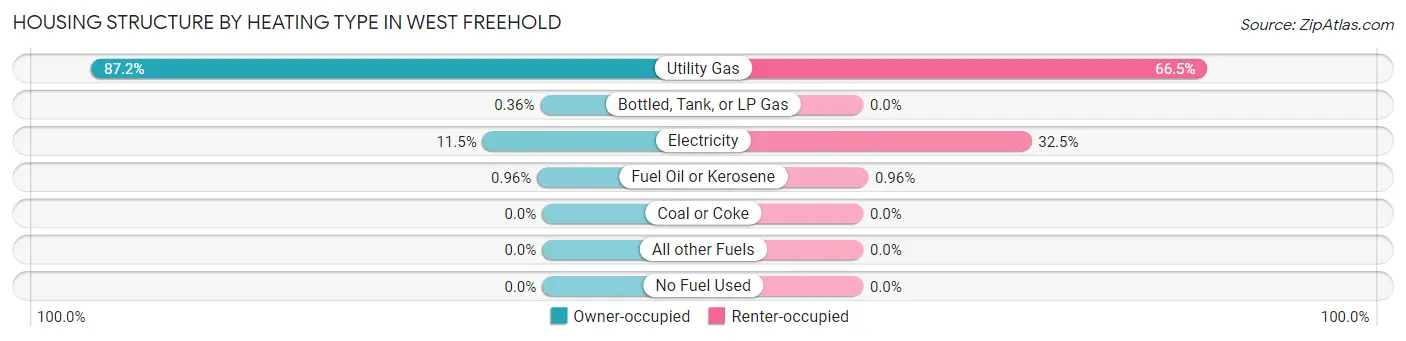
| Heating Type | Owner-occupied | Renter-occupied |
| Utility Gas | 4,169 (87.2%) | 483 (66.5%) |
| Bottled, Tank, or LP Gas | 17 (0.4%) | 0 (0.0%) |
| Electricity | 551 (11.5%) | 236 (32.5%) |
| Fuel Oil or Kerosene | 46 (1.0%) | 7 (1.0%) |
| Coal or Coke | 0 (0.0%) | 0 (0.0%) |
| All other Fuels | 0 (0.0%) | 0 (0.0%) |
| No Fuel Used | 0 (0.0%) | 0 (0.0%) |
| Total | 4,783 (100.0%) | 726 (100.0%) |
Household Vehicle Usage in West Freehold
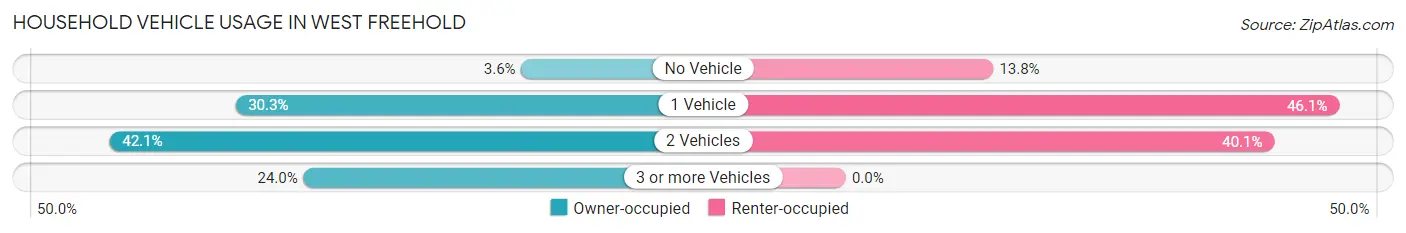
| Vehicles per Household | Owner-occupied | Renter-occupied |
| No Vehicle | 173 (3.6%) | 100 (13.8%) |
| 1 Vehicle | 1,451 (30.3%) | 335 (46.1%) |
| 2 Vehicles | 2,013 (42.1%) | 291 (40.1%) |
| 3 or more Vehicles | 1,146 (24.0%) | 0 (0.0%) |
| Total | 4,783 (100.0%) | 726 (100.0%) |
Real Estate & Mortgages in West Freehold
Real Estate and Mortgage Overview in West Freehold
| Characteristic | Without Mortgage | With Mortgage |
| Housing Units | 1,567 | 3,216 |
| Median Property Value | $409,600 | $520,500 |
| Median Household Income | $68,728 | $1,990 |
| Monthly Housing Costs | $1,168 | $1,624 |
| Real Estate Taxes | $8,421 | $76 |
Property Value by Mortgage Status in West Freehold
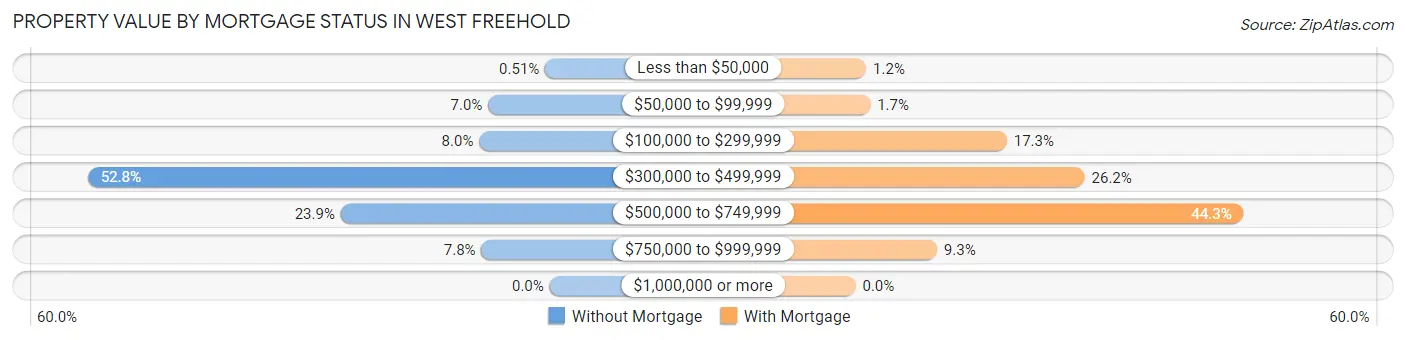
| Property Value | Without Mortgage | With Mortgage |
| Less than $50,000 | 8 (0.5%) | 39 (1.2%) |
| $50,000 to $99,999 | 110 (7.0%) | 54 (1.7%) |
| $100,000 to $299,999 | 126 (8.0%) | 556 (17.3%) |
| $300,000 to $499,999 | 827 (52.8%) | 842 (26.2%) |
| $500,000 to $749,999 | 374 (23.9%) | 1,426 (44.3%) |
| $750,000 to $999,999 | 122 (7.8%) | 299 (9.3%) |
| $1,000,000 or more | 0 (0.0%) | 0 (0.0%) |
| Total | 1,567 (100.0%) | 3,216 (100.0%) |
Household Income by Mortgage Status in West Freehold
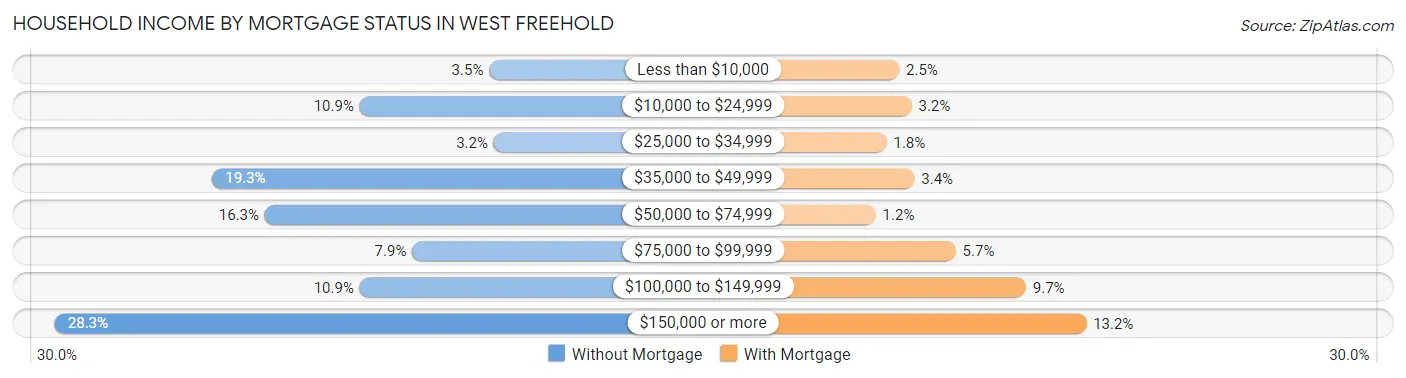
| Household Income | Without Mortgage | With Mortgage |
| Less than $10,000 | 54 (3.5%) | 80 (2.5%) |
| $10,000 to $24,999 | 170 (10.8%) | 103 (3.2%) |
| $25,000 to $34,999 | 50 (3.2%) | 57 (1.8%) |
| $35,000 to $49,999 | 302 (19.3%) | 108 (3.4%) |
| $50,000 to $74,999 | 255 (16.3%) | 37 (1.1%) |
| $75,000 to $99,999 | 123 (7.9%) | 184 (5.7%) |
| $100,000 to $149,999 | 170 (10.8%) | 313 (9.7%) |
| $150,000 or more | 443 (28.3%) | 424 (13.2%) |
| Total | 1,567 (100.0%) | 3,216 (100.0%) |
Property Value to Household Income Ratio in West Freehold
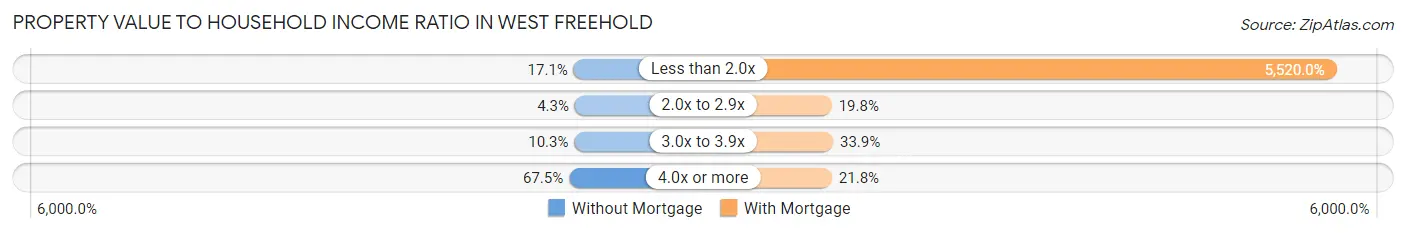
| Value-to-Income Ratio | Without Mortgage | With Mortgage |
| Less than 2.0x | 268 (17.1%) | 177,523 (5,520.0%) |
| 2.0x to 2.9x | 68 (4.3%) | 637 (19.8%) |
| 3.0x to 3.9x | 161 (10.3%) | 1,090 (33.9%) |
| 4.0x or more | 1,058 (67.5%) | 702 (21.8%) |
| Total | 1,567 (100.0%) | 3,216 (100.0%) |
Real Estate Taxes by Mortgage Status in West Freehold
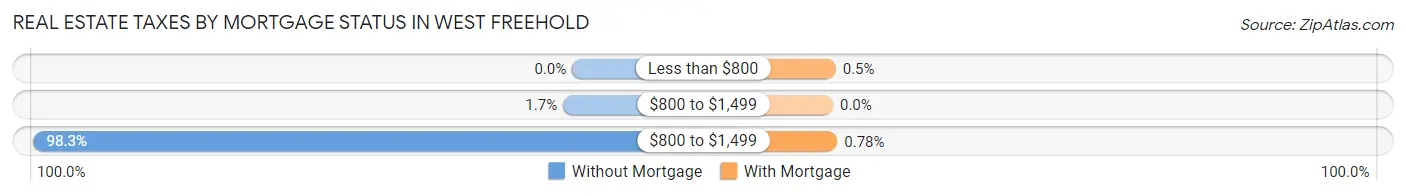
| Property Taxes | Without Mortgage | With Mortgage |
| Less than $800 | 0 (0.0%) | 16 (0.5%) |
| $800 to $1,499 | 26 (1.7%) | 0 (0.0%) |
| $800 to $1,499 | 1,541 (98.3%) | 25 (0.8%) |
| Total | 1,567 (100.0%) | 3,216 (100.0%) |
Health & Disability in West Freehold
Health Insurance Coverage by Age in West Freehold
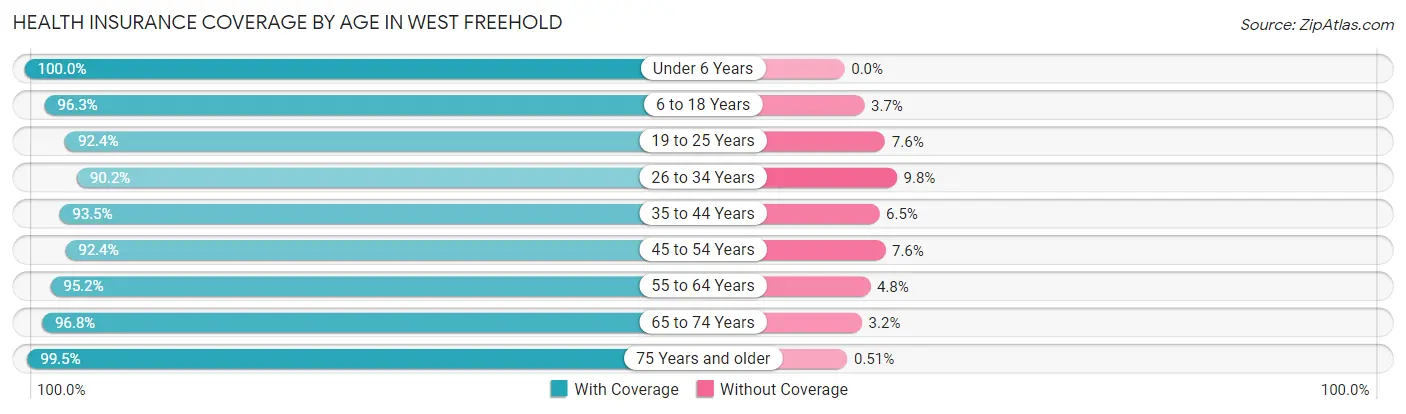
| Age Bracket | With Coverage | Without Coverage |
| Under 6 Years | 578 (100.0%) | 0 (0.0%) |
| 6 to 18 Years | 2,942 (96.3%) | 113 (3.7%) |
| 19 to 25 Years | 1,075 (92.4%) | 88 (7.6%) |
| 26 to 34 Years | 823 (90.2%) | 89 (9.8%) |
| 35 to 44 Years | 2,392 (93.5%) | 166 (6.5%) |
| 45 to 54 Years | 1,896 (92.4%) | 156 (7.6%) |
| 55 to 64 Years | 1,910 (95.2%) | 96 (4.8%) |
| 65 to 74 Years | 807 (96.8%) | 27 (3.2%) |
| 75 Years and older | 1,180 (99.5%) | 6 (0.5%) |
| Total | 13,603 (94.8%) | 741 (5.2%) |
Health Insurance Coverage by Citizenship Status in West Freehold
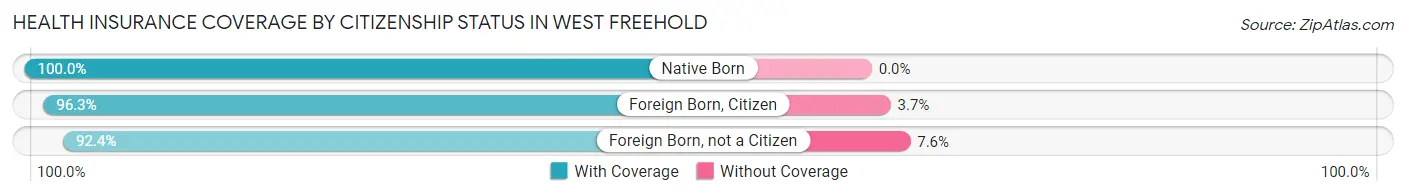
| Citizenship Status | With Coverage | Without Coverage |
| Native Born | 578 (100.0%) | 0 (0.0%) |
| Foreign Born, Citizen | 2,942 (96.3%) | 113 (3.7%) |
| Foreign Born, not a Citizen | 1,075 (92.4%) | 88 (7.6%) |
Health Insurance Coverage by Household Income in West Freehold
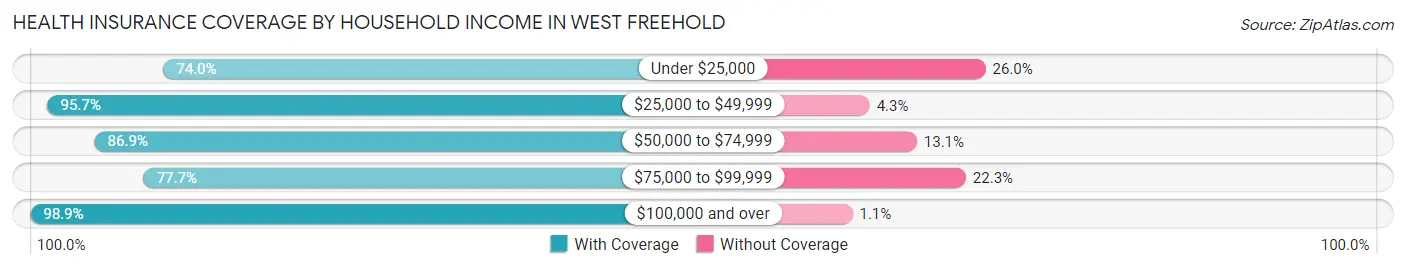
| Household Income | With Coverage | Without Coverage |
| Under $25,000 | 535 (74.0%) | 188 (26.0%) |
| $25,000 to $49,999 | 1,023 (95.7%) | 46 (4.3%) |
| $50,000 to $74,999 | 1,045 (86.9%) | 158 (13.1%) |
| $75,000 to $99,999 | 832 (77.7%) | 239 (22.3%) |
| $100,000 and over | 10,141 (98.9%) | 110 (1.1%) |
Public vs Private Health Insurance Coverage by Age in West Freehold
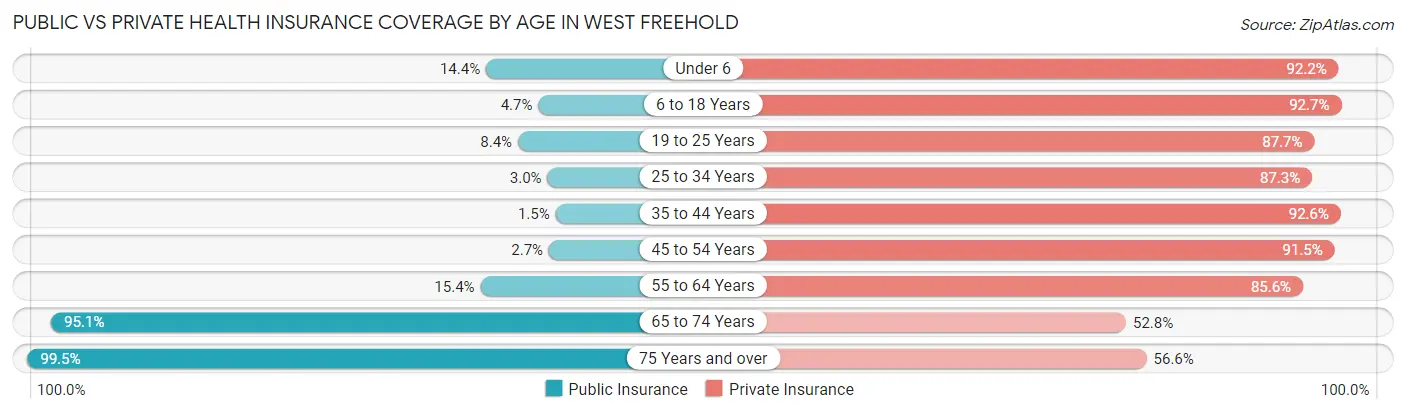
| Age Bracket | Public Insurance | Private Insurance |
| Under 6 | 83 (14.4%) | 533 (92.2%) |
| 6 to 18 Years | 142 (4.6%) | 2,832 (92.7%) |
| 19 to 25 Years | 98 (8.4%) | 1,020 (87.7%) |
| 25 to 34 Years | 27 (3.0%) | 796 (87.3%) |
| 35 to 44 Years | 37 (1.5%) | 2,369 (92.6%) |
| 45 to 54 Years | 55 (2.7%) | 1,877 (91.5%) |
| 55 to 64 Years | 309 (15.4%) | 1,717 (85.6%) |
| 65 to 74 Years | 793 (95.1%) | 440 (52.8%) |
| 75 Years and over | 1,180 (99.5%) | 671 (56.6%) |
| Total | 2,724 (19.0%) | 12,255 (85.4%) |
Disability Status by Sex by Age in West Freehold
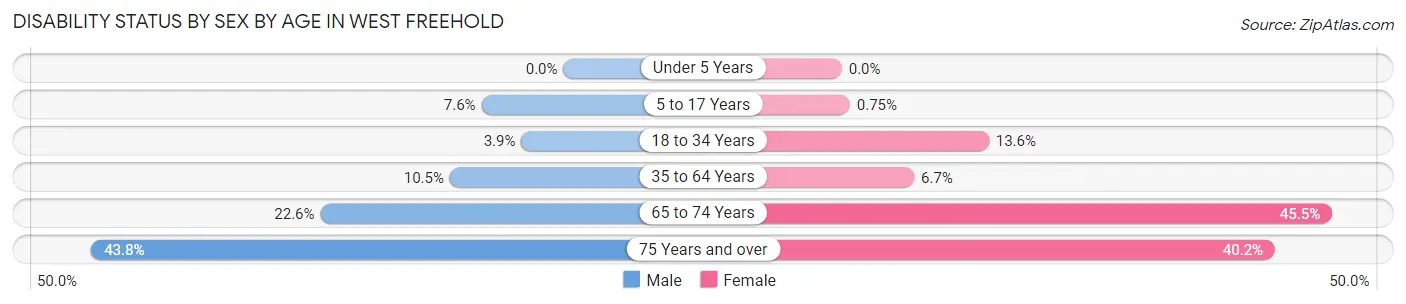
| Age Bracket | Male | Female |
| Under 5 Years | 0 (0.0%) | 0 (0.0%) |
| 5 to 17 Years | 109 (7.6%) | 13 (0.7%) |
| 18 to 34 Years | 44 (3.9%) | 145 (13.6%) |
| 35 to 64 Years | 353 (10.5%) | 219 (6.7%) |
| 65 to 74 Years | 83 (22.6%) | 212 (45.5%) |
| 75 Years and over | 198 (43.8%) | 295 (40.2%) |
Disability Class by Sex by Age in West Freehold
Disability Class: Hearing Difficulty
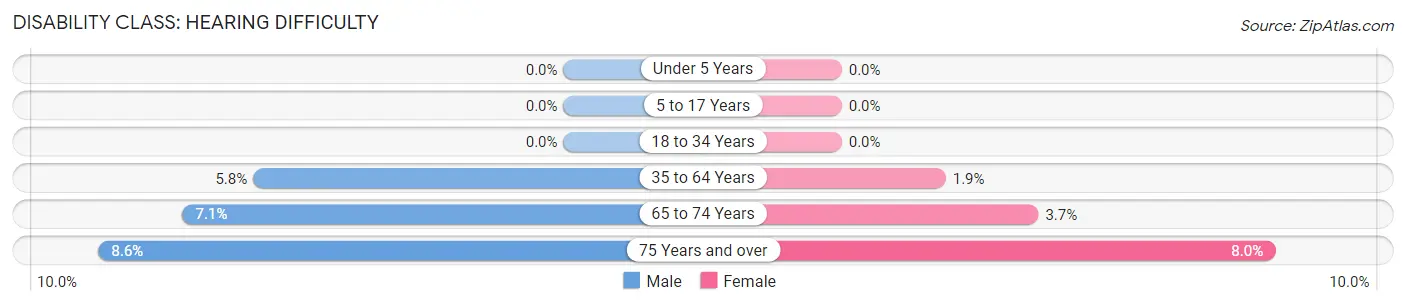
| Age Bracket | Male | Female |
| Under 5 Years | 0 (0.0%) | 0 (0.0%) |
| 5 to 17 Years | 0 (0.0%) | 0 (0.0%) |
| 18 to 34 Years | 0 (0.0%) | 0 (0.0%) |
| 35 to 64 Years | 193 (5.8%) | 63 (1.9%) |
| 65 to 74 Years | 26 (7.1%) | 17 (3.6%) |
| 75 Years and over | 39 (8.6%) | 59 (8.0%) |
Disability Class: Vision Difficulty
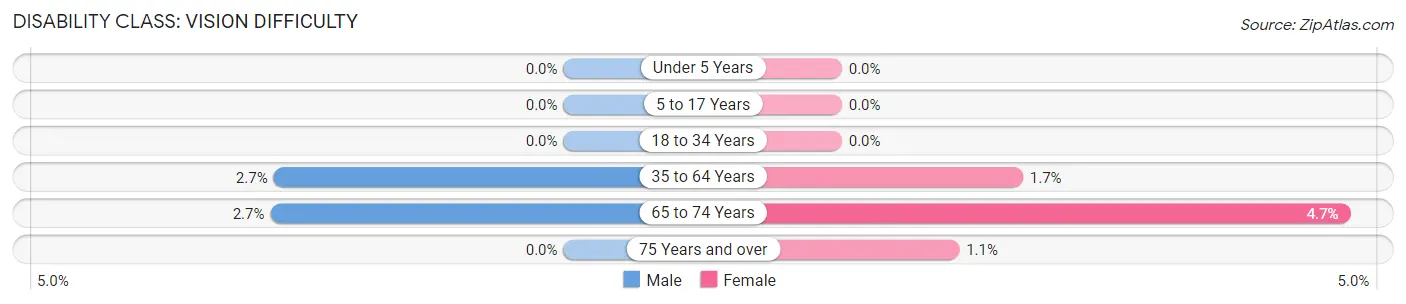
| Age Bracket | Male | Female |
| Under 5 Years | 0 (0.0%) | 0 (0.0%) |
| 5 to 17 Years | 0 (0.0%) | 0 (0.0%) |
| 18 to 34 Years | 0 (0.0%) | 0 (0.0%) |
| 35 to 64 Years | 90 (2.7%) | 55 (1.7%) |
| 65 to 74 Years | 10 (2.7%) | 22 (4.7%) |
| 75 Years and over | 0 (0.0%) | 8 (1.1%) |
Disability Class: Cognitive Difficulty
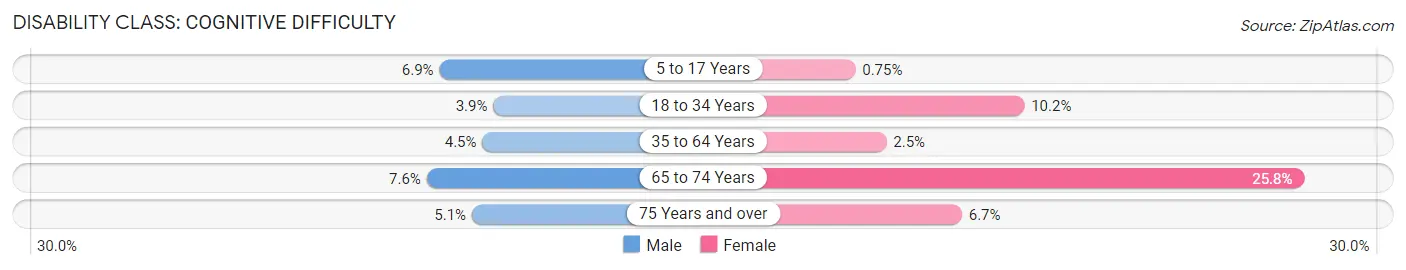
| Age Bracket | Male | Female |
| 5 to 17 Years | 99 (6.9%) | 13 (0.7%) |
| 18 to 34 Years | 44 (3.9%) | 108 (10.2%) |
| 35 to 64 Years | 151 (4.5%) | 81 (2.5%) |
| 65 to 74 Years | 28 (7.6%) | 120 (25.8%) |
| 75 Years and over | 23 (5.1%) | 49 (6.7%) |
Disability Class: Ambulatory Difficulty
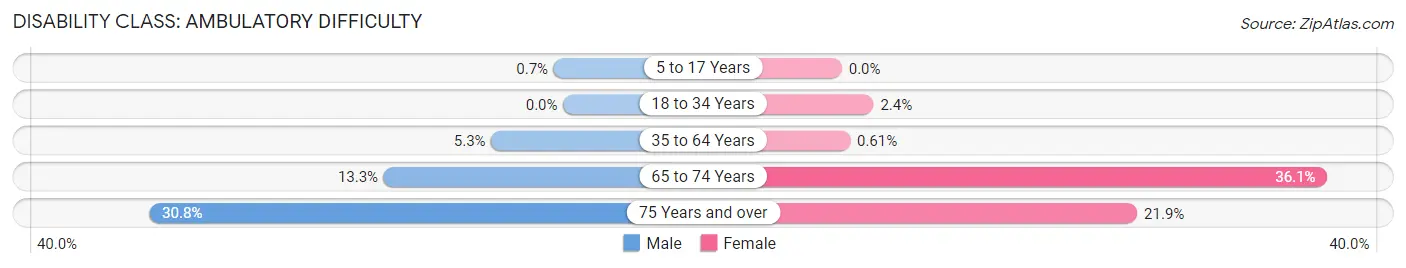
| Age Bracket | Male | Female |
| 5 to 17 Years | 10 (0.7%) | 0 (0.0%) |
| 18 to 34 Years | 0 (0.0%) | 25 (2.4%) |
| 35 to 64 Years | 179 (5.3%) | 20 (0.6%) |
| 65 to 74 Years | 49 (13.3%) | 168 (36.0%) |
| 75 Years and over | 139 (30.7%) | 161 (21.9%) |
Disability Class: Self-Care Difficulty
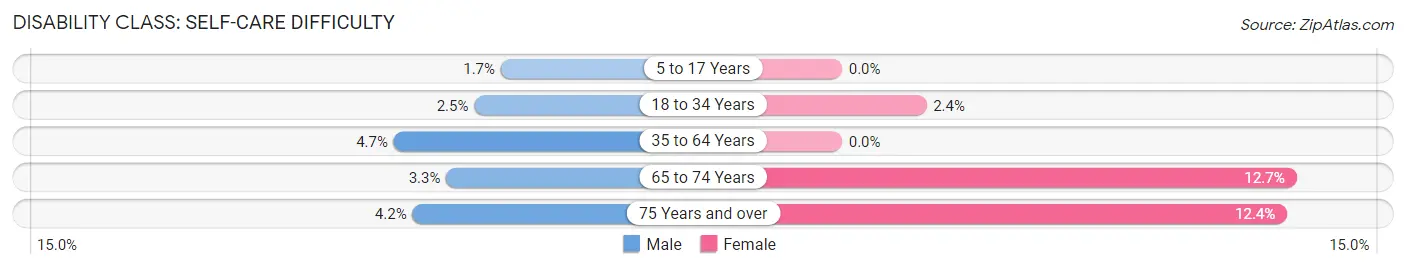
| Age Bracket | Male | Female |
| 5 to 17 Years | 25 (1.7%) | 0 (0.0%) |
| 18 to 34 Years | 28 (2.5%) | 25 (2.4%) |
| 35 to 64 Years | 158 (4.7%) | 0 (0.0%) |
| 65 to 74 Years | 12 (3.3%) | 59 (12.7%) |
| 75 Years and over | 19 (4.2%) | 91 (12.4%) |
Technology Access in West Freehold
Computing Device Access in West Freehold
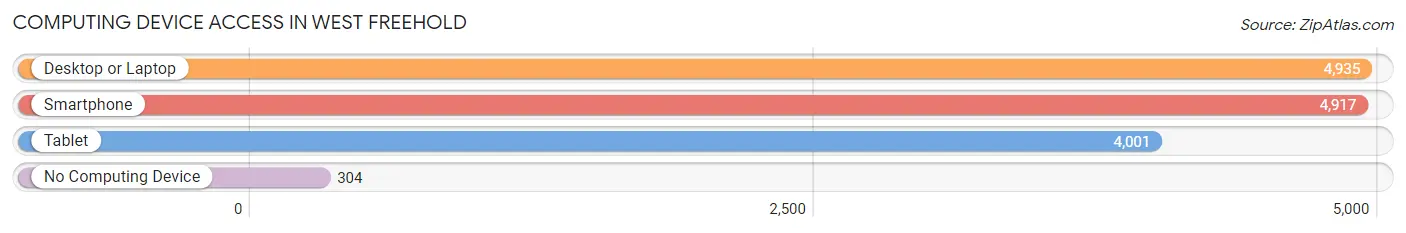
| Device Type | # Households | % Households |
| Desktop or Laptop | 4,935 | 89.6% |
| Smartphone | 4,917 | 89.2% |
| Tablet | 4,001 | 72.6% |
| No Computing Device | 304 | 5.5% |
| Total | 5,509 | 100.0% |
Internet Access in West Freehold
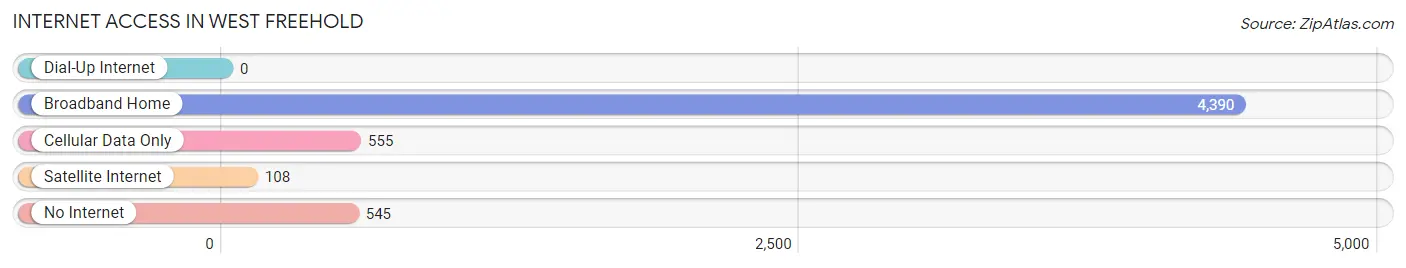
| Internet Type | # Households | % Households |
| Dial-Up Internet | 0 | 0.0% |
| Broadband Home | 4,390 | 79.7% |
| Cellular Data Only | 555 | 10.1% |
| Satellite Internet | 108 | 2.0% |
| No Internet | 545 | 9.9% |
| Total | 5,509 | 100.0% |
West Freehold Summary
Freehold Township is a township in Monmouth County, New Jersey, United States. It is located in the western part of the county, bordered by Howell Township to the north, Manalapan Township to the east, Marlboro Township to the south, and Millstone Township to the west. As of the 2010 United States Census, the township's population was 36,184, reflecting an increase of 5,472 (+17.8%) from the 30,712 counted in the 2000 Census, which had in turn increased by 6,076 (+24.6%) from the 24,636 counted in the 1990 Census.
History
Freehold Township was formed by an act of the New Jersey Legislature on March 11, 1869, from portions of Freehold Borough, Freehold Township (now Marlboro Township) and Upper Freehold Township (now Millstone Township). The township was named for Freehold Borough, which had been named for the word "freehold", an English legal term describing fee simple property ownership.
Geography
According to the United States Census Bureau, the township had a total area of 24.945 square miles (64.619km^2), including 24.845 square miles (64.372km^2) of land and 0.100 square miles (0.247km^2) of water (0.40%).
The township is located in the central part of the state and is part of the New York metropolitan area. It is bordered by Howell Township to the north, Manalapan Township to the east, Marlboro Township to the south, and Millstone Township to the west.
Demographics
As of the 2010 United States Census, there were 36,184 people, 12,871 households, and 9,717.8 families residing in the township. The population density was 1,459.2 per square mile (563.7/km^2). There were 13,395 housing units at an average density of 539.2 per square mile (208.3/km^2). The racial makeup of the township was 81.44% (29,420) White, 6.00% (2,173) Black or African American, 0.14% (50) Native American, 8.75% (3,164) Asian, 0.03% (10) Pacific Islander, 1.77% (642) from other races, and 2.87% (1,035) from two or more races. Hispanic or Latino of any race were 6.22% (2,241) of the population.
Economy
Freehold Township is home to several large employers, including CentraState Medical Center, Freehold Raceway Mall, and iCIMS. The township is also home to several smaller businesses, including restaurants, retail stores, and professional services.
The township is also home to several large industrial parks, including the Freehold Industrial Park, the Freehold Business Park, and the Freehold Technology Park. These parks are home to a variety of businesses, including manufacturing, distribution, and technology companies.
Freehold Township is also home to several large agricultural operations, including farms, nurseries, and greenhouses. These operations provide a variety of products, including fruits, vegetables, flowers, and plants.
The township is also home to several large retail centers, including the Freehold Raceway Mall, the Freehold Raceway Shopping Center, and the Freehold Shopping Center. These centers are home to a variety of stores, restaurants, and entertainment venues.
Conclusion
Freehold Township is a township in Monmouth County, New Jersey, located in the western part of the county. It is bordered by Howell Township to the north, Manalapan Township to the east, Marlboro Township to the south, and Millstone Township to the west. As of the 2010 United States Census, the township's population was 36,184. The township is home to several large employers, industrial parks, agricultural operations, and retail centers.
Common Questions
What is Per Capita Income in West Freehold?
Per Capita income in West Freehold is $55,902.
What is the Median Family Income in West Freehold?
Median Family Income in West Freehold is $172,163.
What is the Median Household income in West Freehold?
Median Household Income in West Freehold is $117,108.
What is Income or Wage Gap in West Freehold?
Income or Wage Gap in West Freehold is 33.3%.
Women in West Freehold earn 66.7 cents for every dollar earned by a man.
What is Inequality or Gini Index in West Freehold?
Inequality or Gini Index in West Freehold is 0.40.
What is the Total Population of West Freehold?
Total Population of West Freehold is 14,448.
What is the Total Male Population of West Freehold?
Total Male Population of West Freehold is 6,958.
What is the Total Female Population of West Freehold?
Total Female Population of West Freehold is 7,490.
What is the Ratio of Males per 100 Females in West Freehold?
There are 92.90 Males per 100 Females in West Freehold.
What is the Ratio of Females per 100 Males in West Freehold?
There are 107.65 Females per 100 Males in West Freehold.
What is the Median Population Age in West Freehold?
Median Population Age in West Freehold is 40.3 Years.
What is the Average Family Size in West Freehold
Average Family Size in West Freehold is 3.3 People.
What is the Average Household Size in West Freehold
Average Household Size in West Freehold is 2.6 People.
How Large is the Labor Force in West Freehold?
There are 7,715 People in the Labor Forcein in West Freehold.
What is the Percentage of People in the Labor Force in West Freehold?
67.9% of People are in the Labor Force in West Freehold.
What is the Unemployment Rate in West Freehold?
Unemployment Rate in West Freehold is 3.6%.