Haddon Heights borough, NJ Map & Demographics
Haddon Heights borough Overview
$59,798
PER CAPITA INCOME
$145,761
AVG FAMILY INCOME
$117,556
AVG HOUSEHOLD INCOME
30.1%
WAGE / INCOME GAP [ % ]
69.9¢/ $1
WAGE / INCOME GAP [ $ ]
0.41
INEQUALITY / GINI INDEX
7,484
TOTAL POPULATION
3,721
MALE POPULATION
3,763
FEMALE POPULATION
98.88
MALES / 100 FEMALES
101.13
FEMALES / 100 MALES
39.1
MEDIAN AGE
3.0
AVG FAMILY SIZE
2.4
AVG HOUSEHOLD SIZE
4,175
LABOR FORCE [ PEOPLE ]
70.7%
PERCENT IN LABOR FORCE
4.6%
UNEMPLOYMENT RATE
Income in Haddon Heights borough
Income Overview in Haddon Heights borough
Per Capita Income in Haddon Heights borough is $59,798, while median incomes of families and households are $145,761 and $117,556 respectively.
| Characteristic | Number | Measure |
| Per Capita Income | 7,484 | $59,798 |
| Median Family Income | 1,996 | $145,761 |
| Mean Family Income | 1,996 | $171,739 |
| Median Household Income | 3,132 | $117,556 |
| Mean Household Income | 3,132 | $141,867 |
| Income Deficit | 1,996 | $0 |
| Wage / Income Gap (%) | 7,484 | 30.09% |
| Wage / Income Gap ($) | 7,484 | 69.91¢ per $1 |
| Gini / Inequality Index | 7,484 | 0.41 |
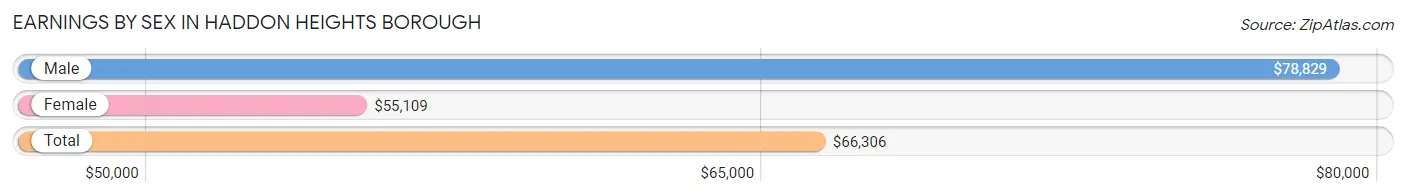
Earnings by Sex in Haddon Heights borough
Average Earnings in Haddon Heights borough are $66,306, $78,829 for men and $55,109 for women, a difference of 30.1%.
| Sex | Number | Average Earnings |
| Male | 2,255 (52.3%) | $78,829 |
| Female | 2,058 (47.7%) | $55,109 |
| Total | 4,313 (100.0%) | $66,306 |
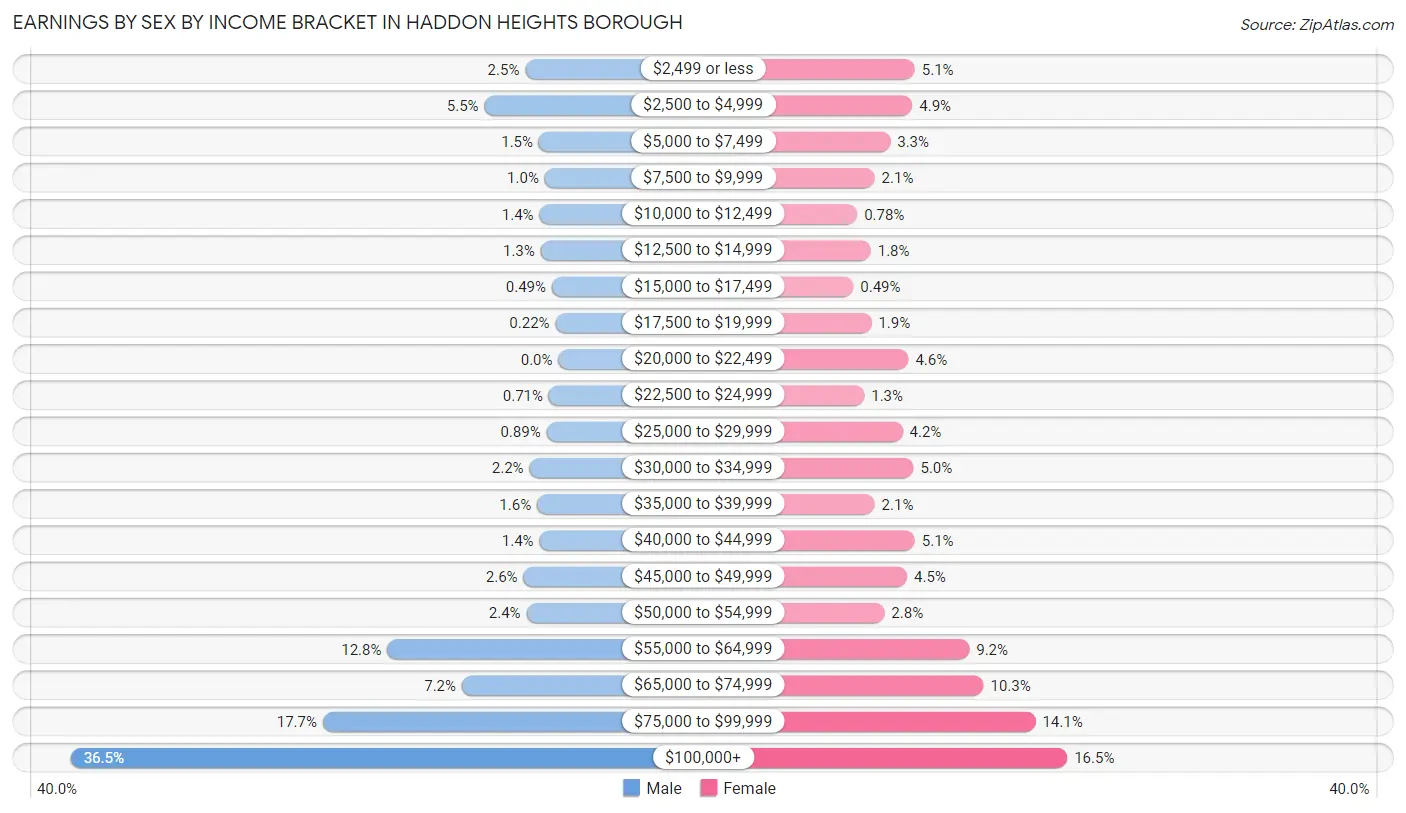
Earnings by Sex by Income Bracket in Haddon Heights borough
The most common earnings brackets in Haddon Heights borough are $100,000+ for men (824 | 36.5%) and $100,000+ for women (340 | 16.5%).
| Income | Male | Female |
| $2,499 or less | 56 (2.5%) | 105 (5.1%) |
| $2,500 to $4,999 | 125 (5.5%) | 101 (4.9%) |
| $5,000 to $7,499 | 33 (1.5%) | 67 (3.3%) |
| $7,500 to $9,999 | 23 (1.0%) | 43 (2.1%) |
| $10,000 to $12,499 | 32 (1.4%) | 16 (0.8%) |
| $12,500 to $14,999 | 30 (1.3%) | 37 (1.8%) |
| $15,000 to $17,499 | 11 (0.5%) | 10 (0.5%) |
| $17,500 to $19,999 | 5 (0.2%) | 38 (1.8%) |
| $20,000 to $22,499 | 0 (0.0%) | 95 (4.6%) |
| $22,500 to $24,999 | 16 (0.7%) | 27 (1.3%) |
| $25,000 to $29,999 | 20 (0.9%) | 86 (4.2%) |
| $30,000 to $34,999 | 49 (2.2%) | 103 (5.0%) |
| $35,000 to $39,999 | 36 (1.6%) | 43 (2.1%) |
| $40,000 to $44,999 | 32 (1.4%) | 105 (5.1%) |
| $45,000 to $49,999 | 59 (2.6%) | 93 (4.5%) |
| $50,000 to $54,999 | 54 (2.4%) | 58 (2.8%) |
| $55,000 to $64,999 | 289 (12.8%) | 189 (9.2%) |
| $65,000 to $74,999 | 163 (7.2%) | 211 (10.2%) |
| $75,000 to $99,999 | 398 (17.6%) | 291 (14.1%) |
| $100,000+ | 824 (36.5%) | 340 (16.5%) |
| Total | 2,255 (100.0%) | 2,058 (100.0%) |
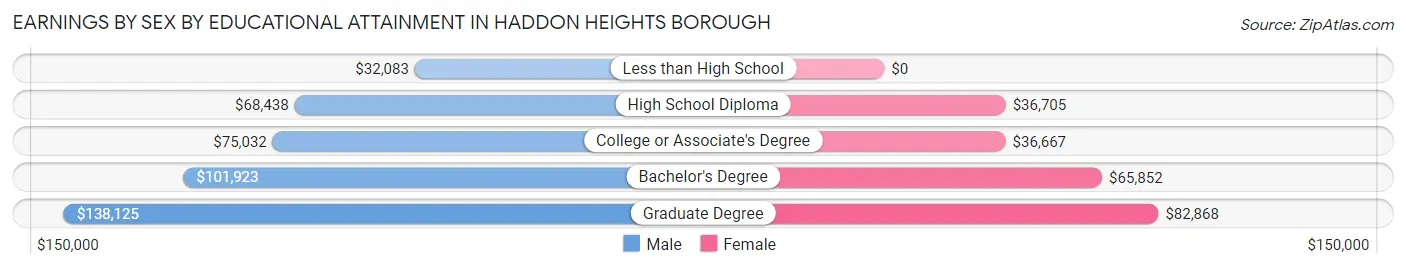
Earnings by Sex by Educational Attainment in Haddon Heights borough
Average earnings in Haddon Heights borough are $87,000 for men and $60,440 for women, a difference of 30.5%. Men with an educational attainment of graduate degree enjoy the highest average annual earnings of $138,125, while those with less than high school education earn the least with $32,083. Women with an educational attainment of graduate degree earn the most with the average annual earnings of $82,868, while those with college or associate's degree education have the smallest earnings of $36,667.
| Educational Attainment | Male Income | Female Income |
| Less than High School | $32,083 | $0 |
| High School Diploma | $68,438 | $36,705 |
| College or Associate's Degree | $75,032 | $36,667 |
| Bachelor's Degree | $101,923 | $65,852 |
| Graduate Degree | $138,125 | $82,868 |
| Total | $87,000 | $60,440 |
Family Income in Haddon Heights borough
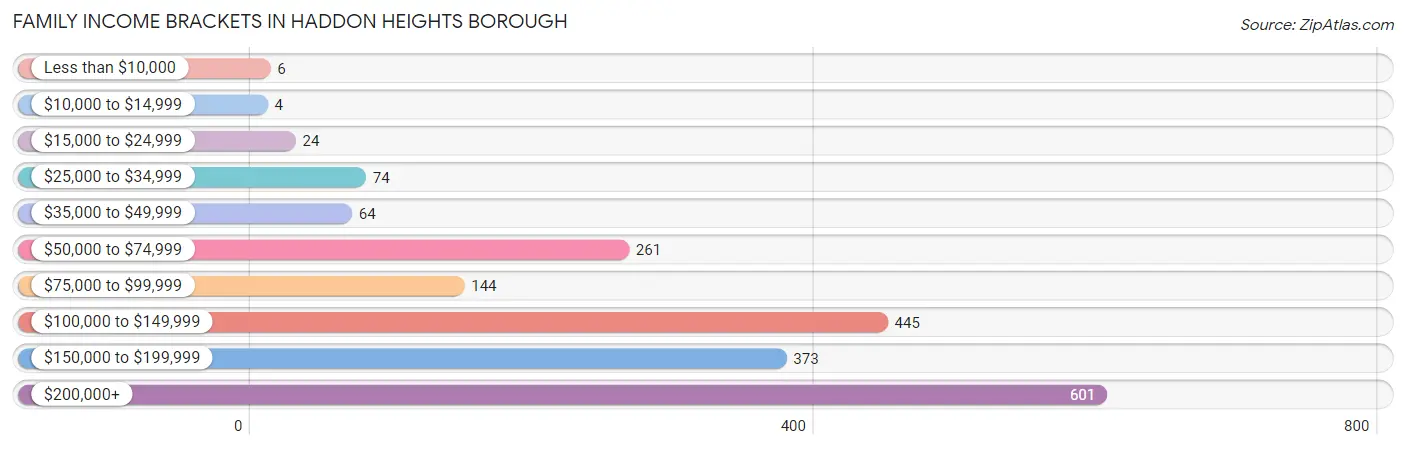
Family Income Brackets in Haddon Heights borough
According to the Haddon Heights borough family income data, there are 601 families falling into the $200,000+ income range, which is the most common income bracket and makes up 30.1% of all families. Conversely, the $10,000 to $14,999 income bracket is the least frequent group with only 4 families (0.2%) belonging to this category.
| Income Bracket | # Families | % Families |
| Less than $10,000 | 6 | 0.3% |
| $10,000 to $14,999 | 4 | 0.2% |
| $15,000 to $24,999 | 24 | 1.2% |
| $25,000 to $34,999 | 74 | 3.7% |
| $35,000 to $49,999 | 64 | 3.2% |
| $50,000 to $74,999 | 261 | 13.1% |
| $75,000 to $99,999 | 144 | 7.2% |
| $100,000 to $149,999 | 445 | 22.3% |
| $150,000 to $199,999 | 373 | 18.7% |
| $200,000+ | 601 | 30.1% |
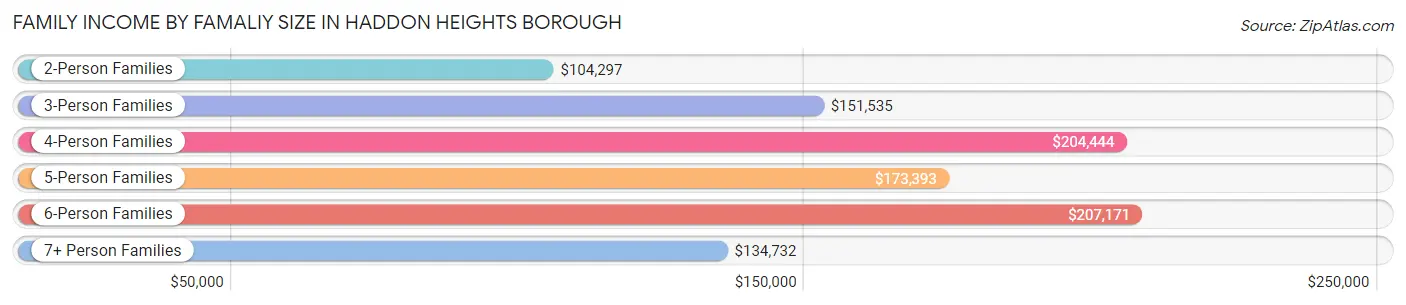
Family Income by Famaliy Size in Haddon Heights borough
6-person families (43 | 2.1%) account for the highest median family income in Haddon Heights borough with $207,171 per family, while 2-person families (883 | 44.2%) have the highest median income of $52,148 per family member.
| Income Bracket | # Families | Median Income |
| 2-Person Families | 883 (44.2%) | $104,297 |
| 3-Person Families | 540 (27.1%) | $151,535 |
| 4-Person Families | 362 (18.1%) | $204,444 |
| 5-Person Families | 143 (7.2%) | $173,393 |
| 6-Person Families | 43 (2.1%) | $207,171 |
| 7+ Person Families | 25 (1.3%) | $134,732 |
| Total | 1,996 (100.0%) | $145,761 |
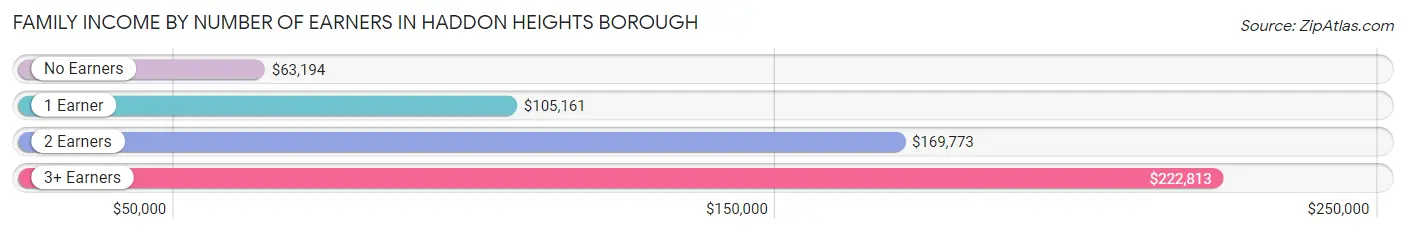
Family Income by Number of Earners in Haddon Heights borough
The median family income in Haddon Heights borough is $145,761, with families comprising 3+ earners (327) having the highest median family income of $222,813, while families with no earners (207) have the lowest median family income of $63,194, accounting for 16.4% and 10.4% of families, respectively.
| Number of Earners | # Families | Median Income |
| No Earners | 207 (10.4%) | $63,194 |
| 1 Earner | 498 (24.9%) | $105,161 |
| 2 Earners | 964 (48.3%) | $169,773 |
| 3+ Earners | 327 (16.4%) | $222,813 |
| Total | 1,996 (100.0%) | $145,761 |
Household Income in Haddon Heights borough
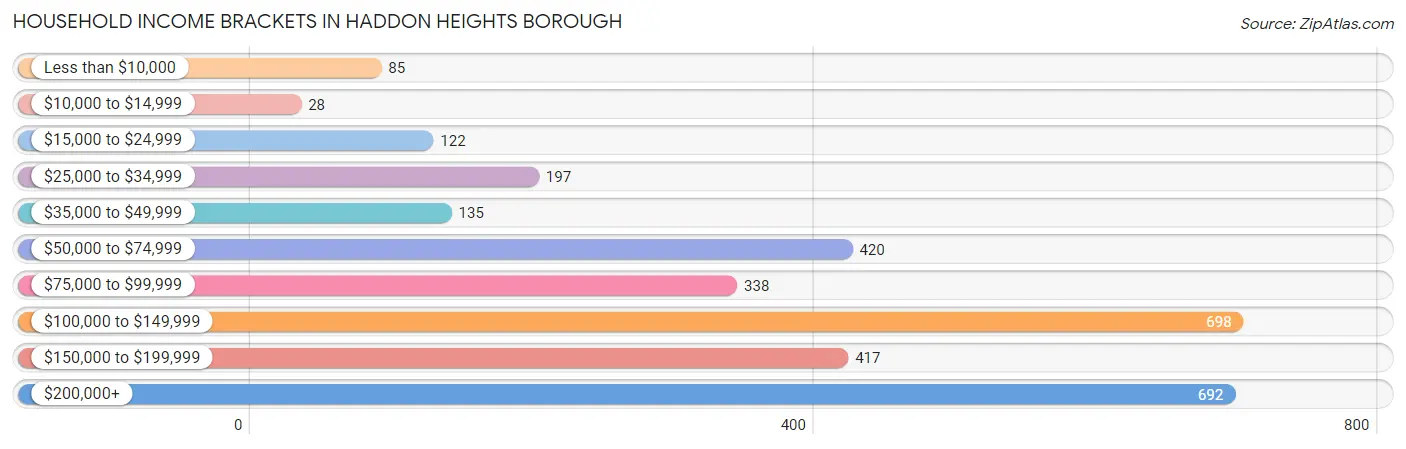
Household Income Brackets in Haddon Heights borough
With 698 households falling in the category, the $100,000 to $149,999 income range is the most frequent in Haddon Heights borough, accounting for 22.3% of all households. In contrast, only 28 households (0.9%) fall into the $10,000 to $14,999 income bracket, making it the least populous group.
| Income Bracket | # Households | % Households |
| Less than $10,000 | 85 | 2.7% |
| $10,000 to $14,999 | 28 | 0.9% |
| $15,000 to $24,999 | 122 | 3.9% |
| $25,000 to $34,999 | 197 | 6.3% |
| $35,000 to $49,999 | 135 | 4.3% |
| $50,000 to $74,999 | 420 | 13.4% |
| $75,000 to $99,999 | 338 | 10.8% |
| $100,000 to $149,999 | 698 | 22.3% |
| $150,000 to $199,999 | 417 | 13.3% |
| $200,000+ | 692 | 22.1% |
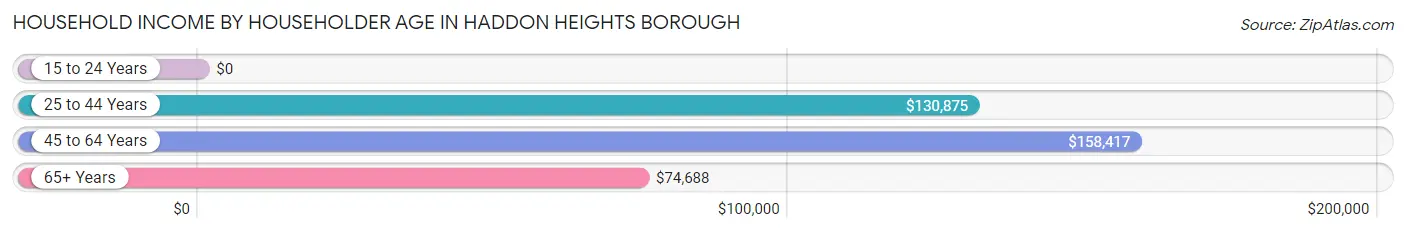
Household Income by Householder Age in Haddon Heights borough
The median household income in Haddon Heights borough is $117,556, with the highest median household income of $158,417 found in the 45 to 64 years age bracket for the primary householder. A total of 899 households (28.7%) fall into this category. Meanwhile, the 15 to 24 years age bracket for the primary householder has the lowest median household income of $0, with 19 households (0.6%) in this group.
| Income Bracket | # Households | Median Income |
| 15 to 24 Years | 19 (0.6%) | $0 |
| 25 to 44 Years | 1,047 (33.4%) | $130,875 |
| 45 to 64 Years | 899 (28.7%) | $158,417 |
| 65+ Years | 1,167 (37.3%) | $74,688 |
| Total | 3,132 (100.0%) | $117,556 |
Poverty in Haddon Heights borough
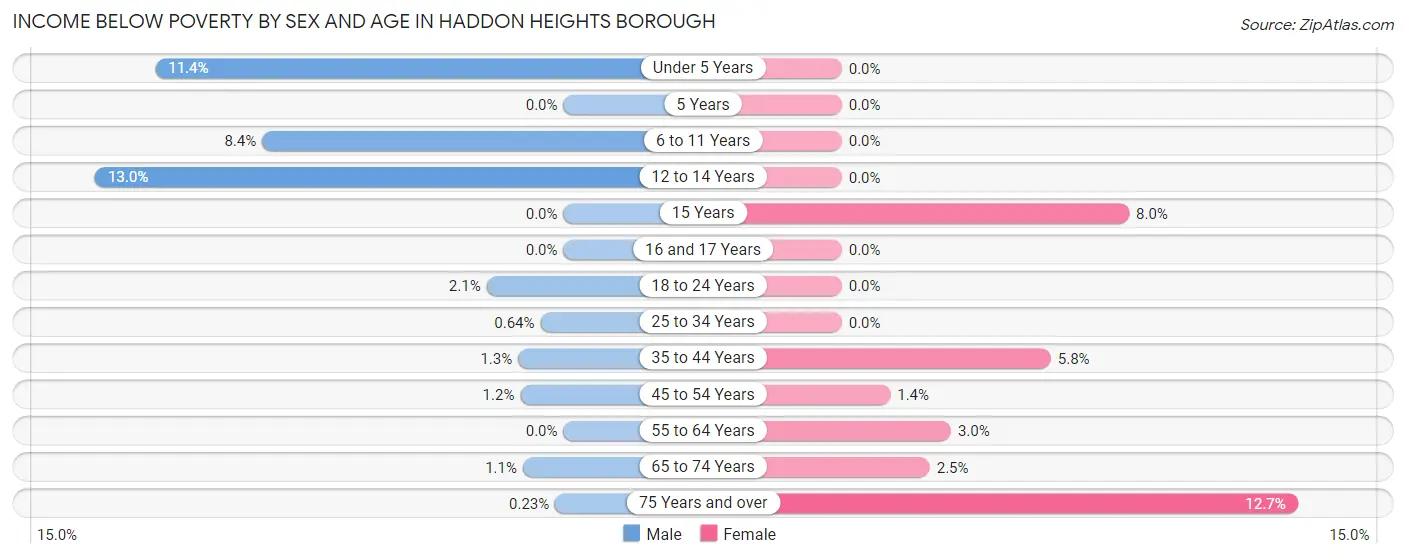
Income Below Poverty by Sex and Age in Haddon Heights borough
With 2.4% poverty level for males and 3.2% for females among the residents of Haddon Heights borough, 12 to 14 year old males and 75 year old and over females are the most vulnerable to poverty, with 9 males (13.0%) and 57 females (12.7%) in their respective age groups living below the poverty level.
| Age Bracket | Male | Female |
| Under 5 Years | 30 (11.4%) | 0 (0.0%) |
| 5 Years | 0 (0.0%) | 0 (0.0%) |
| 6 to 11 Years | 25 (8.4%) | 0 (0.0%) |
| 12 to 14 Years | 9 (13.0%) | 0 (0.0%) |
| 15 Years | 0 (0.0%) | 6 (8.0%) |
| 16 and 17 Years | 0 (0.0%) | 0 (0.0%) |
| 18 to 24 Years | 5 (2.1%) | 0 (0.0%) |
| 25 to 34 Years | 4 (0.6%) | 0 (0.0%) |
| 35 to 44 Years | 5 (1.3%) | 29 (5.8%) |
| 45 to 54 Years | 5 (1.2%) | 5 (1.3%) |
| 55 to 64 Years | 0 (0.0%) | 13 (3.0%) |
| 65 to 74 Years | 4 (1.1%) | 11 (2.5%) |
| 75 Years and over | 1 (0.2%) | 57 (12.7%) |
| Total | 88 (2.4%) | 121 (3.2%) |
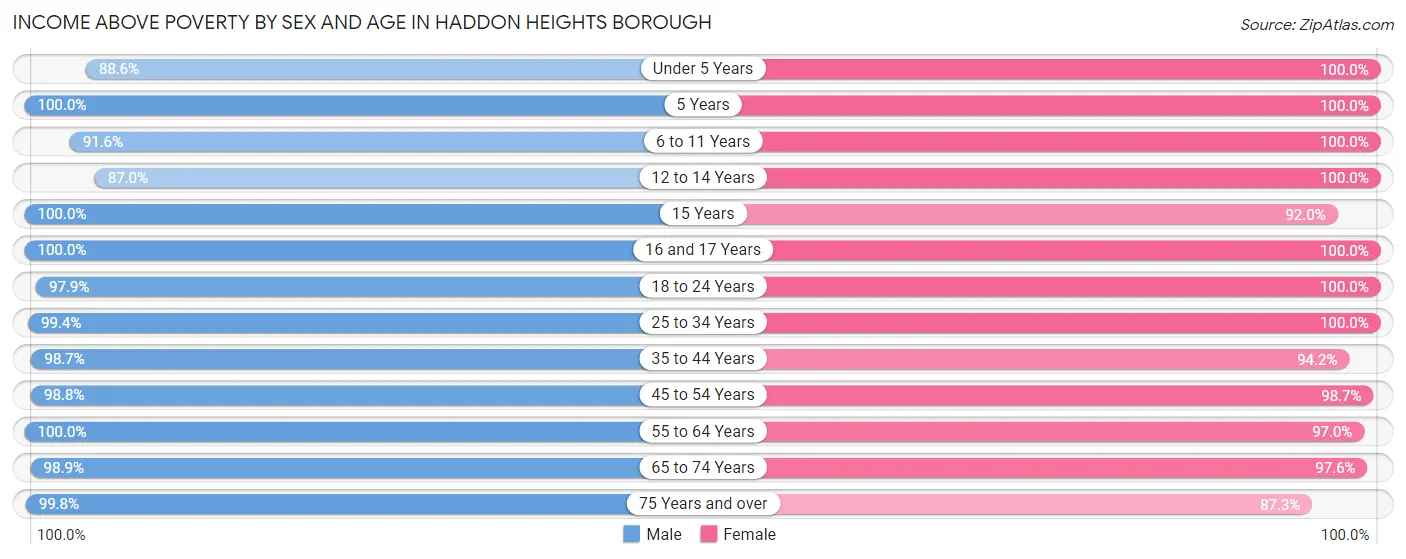
Income Above Poverty by Sex and Age in Haddon Heights borough
According to the poverty statistics in Haddon Heights borough, males aged 5 years and females aged under 5 years are the age groups that are most secure financially, with 100.0% of males and 100.0% of females in these age groups living above the poverty line.
| Age Bracket | Male | Female |
| Under 5 Years | 234 (88.6%) | 153 (100.0%) |
| 5 Years | 44 (100.0%) | 64 (100.0%) |
| 6 to 11 Years | 273 (91.6%) | 288 (100.0%) |
| 12 to 14 Years | 60 (87.0%) | 208 (100.0%) |
| 15 Years | 78 (100.0%) | 69 (92.0%) |
| 16 and 17 Years | 57 (100.0%) | 69 (100.0%) |
| 18 to 24 Years | 229 (97.9%) | 194 (100.0%) |
| 25 to 34 Years | 624 (99.4%) | 498 (100.0%) |
| 35 to 44 Years | 392 (98.7%) | 469 (94.2%) |
| 45 to 54 Years | 410 (98.8%) | 365 (98.7%) |
| 55 to 64 Years | 432 (100.0%) | 414 (97.0%) |
| 65 to 74 Years | 350 (98.9%) | 438 (97.6%) |
| 75 Years and over | 433 (99.8%) | 392 (87.3%) |
| Total | 3,616 (97.6%) | 3,621 (96.8%) |
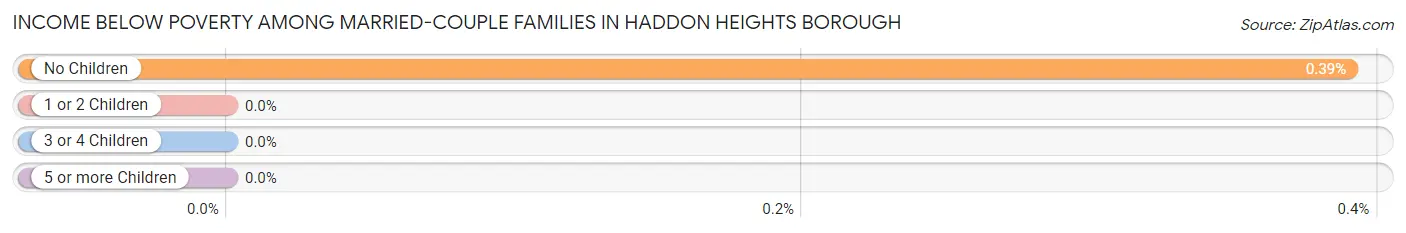
Income Below Poverty Among Married-Couple Families in Haddon Heights borough
The poverty statistics for married-couple families in Haddon Heights borough show that 0.3% or 4 of the total 1,631 families live below the poverty line. Families with no children have the highest poverty rate of 0.4%, comprising of 4 families. On the other hand, families with 1 or 2 children have the lowest poverty rate of 0.0%, which includes 0 families.
| Children | Above Poverty | Below Poverty |
| No Children | 1,029 (99.6%) | 4 (0.4%) |
| 1 or 2 Children | 438 (100.0%) | 0 (0.0%) |
| 3 or 4 Children | 153 (100.0%) | 0 (0.0%) |
| 5 or more Children | 7 (100.0%) | 0 (0.0%) |
| Total | 1,627 (99.8%) | 4 (0.3%) |
Income Below Poverty Among Single-Parent Households in Haddon Heights borough
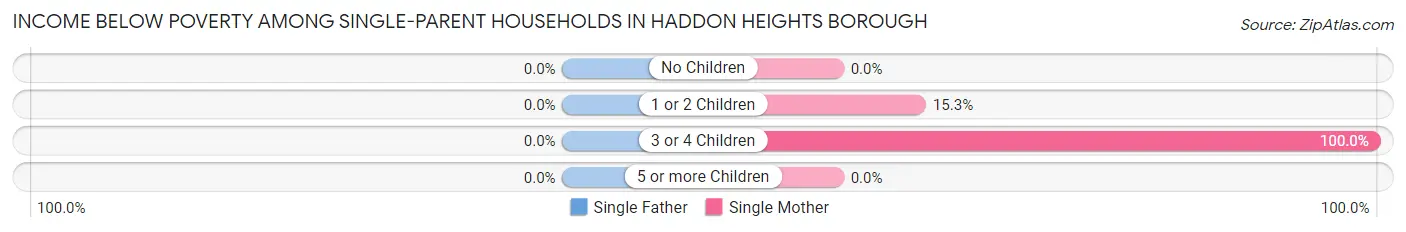
| Children | Single Father | Single Mother |
| No Children | 0 (0.0%) | 0 (0.0%) |
| 1 or 2 Children | 0 (0.0%) | 23 (15.3%) |
| 3 or 4 Children | 0 (0.0%) | 6 (100.0%) |
| 5 or more Children | 0 (0.0%) | 0 (0.0%) |
| Total | 0 (0.0%) | 29 (14.9%) |
Income Below Poverty Among Married-Couple vs Single-Parent Households in Haddon Heights borough
The poverty data for Haddon Heights borough shows that 4 of the married-couple family households (0.3%) and 29 of the single-parent households (8.0%) are living below the poverty level. Within the married-couple family households, those with no children have the highest poverty rate, with 4 households (0.4%) falling below the poverty line. Among the single-parent households, those with 3 or 4 children have the highest poverty rate, with 6 household (25.0%) living below poverty.
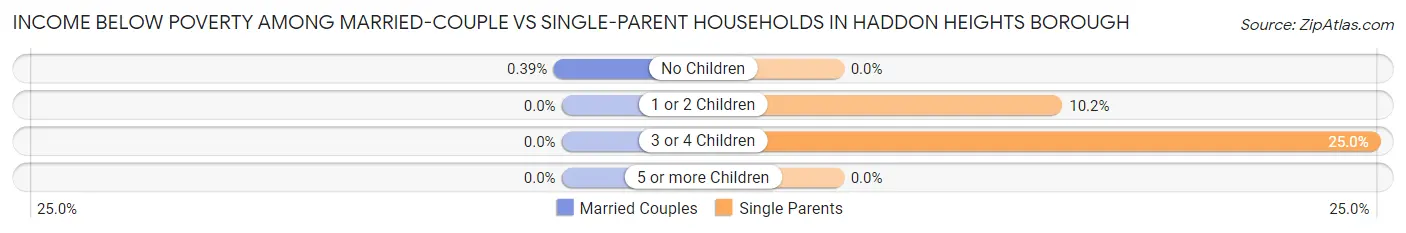
| Children | Married-Couple Families | Single-Parent Households |
| No Children | 4 (0.4%) | 0 (0.0%) |
| 1 or 2 Children | 0 (0.0%) | 23 (10.2%) |
| 3 or 4 Children | 0 (0.0%) | 6 (25.0%) |
| 5 or more Children | 0 (0.0%) | 0 (0.0%) |
| Total | 4 (0.3%) | 29 (8.0%) |
Race in Haddon Heights borough
The most populous races in Haddon Heights borough are White / Caucasian (7,088 | 94.7%), Hispanic or Latino (248 | 3.3%), and Two or more Races (154 | 2.1%).
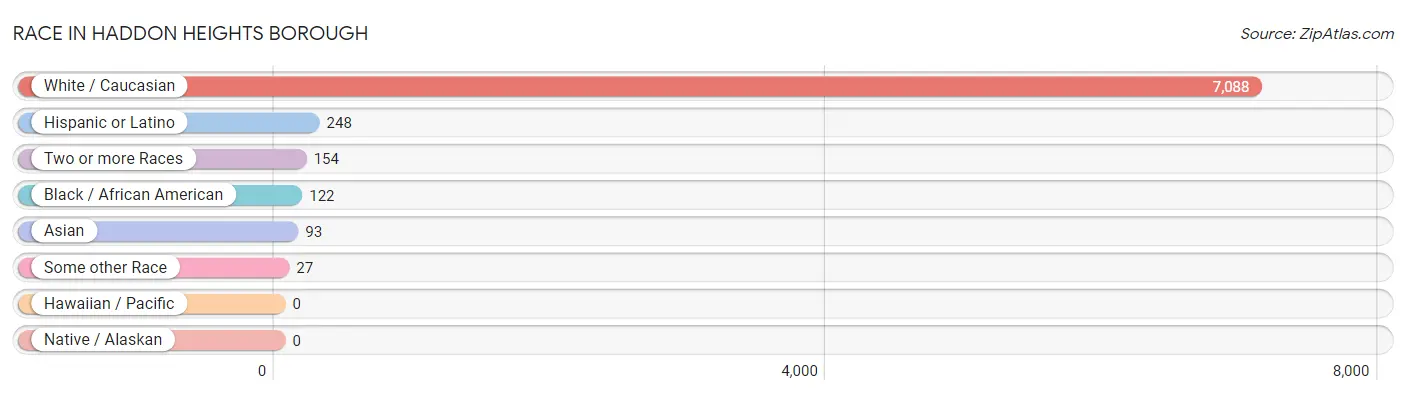
| Race | # Population | % Population |
| Asian | 93 | 1.2% |
| Black / African American | 122 | 1.6% |
| Hawaiian / Pacific | 0 | 0.0% |
| Hispanic or Latino | 248 | 3.3% |
| Native / Alaskan | 0 | 0.0% |
| White / Caucasian | 7,088 | 94.7% |
| Two or more Races | 154 | 2.1% |
| Some other Race | 27 | 0.4% |
| Total | 7,484 | 100.0% |
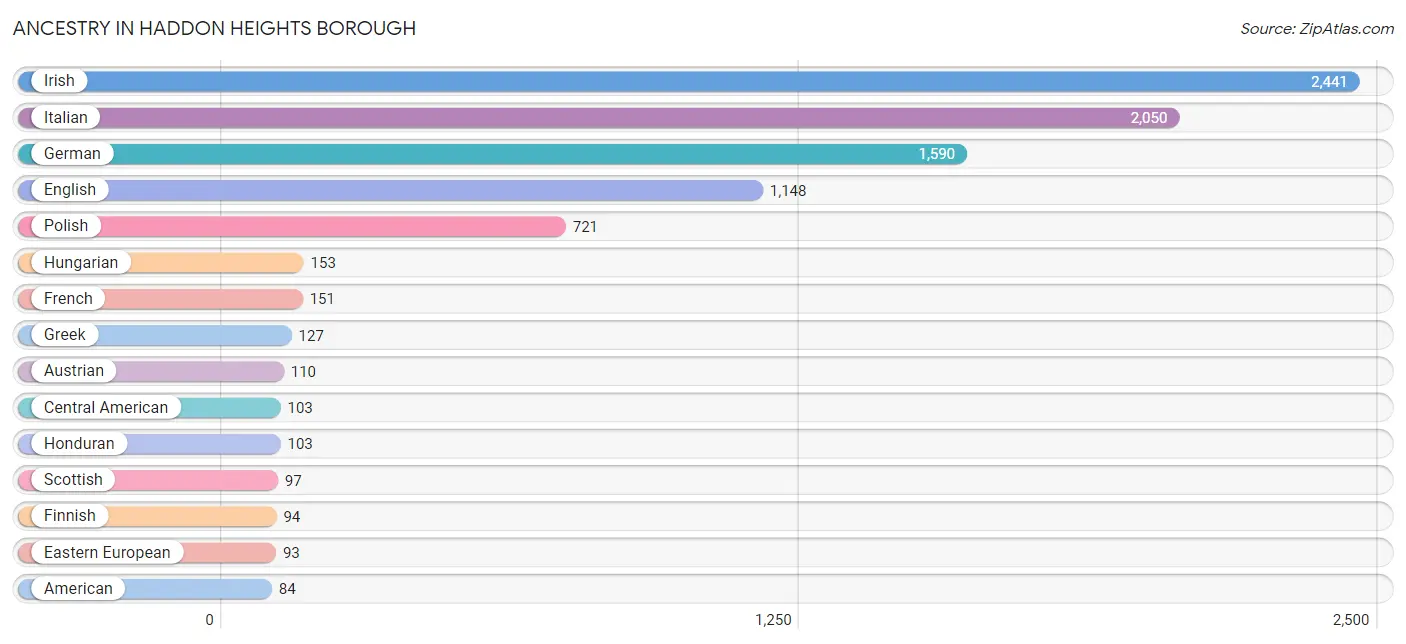
Ancestry in Haddon Heights borough
The most populous ancestries reported in Haddon Heights borough are Irish (2,441 | 32.6%), Italian (2,050 | 27.4%), German (1,590 | 21.2%), English (1,148 | 15.3%), and Polish (721 | 9.6%), together accounting for 106.2% of all Haddon Heights borough residents.
| Ancestry | # Population | % Population |
| American | 84 | 1.1% |
| Austrian | 110 | 1.5% |
| Belgian | 15 | 0.2% |
| Brazilian | 13 | 0.2% |
| British | 64 | 0.9% |
| Central American | 103 | 1.4% |
| Colombian | 28 | 0.4% |
| Croatian | 10 | 0.1% |
| Cuban | 55 | 0.7% |
| Czech | 5 | 0.1% |
| Czechoslovakian | 8 | 0.1% |
| Dutch | 69 | 0.9% |
| Eastern European | 93 | 1.2% |
| English | 1,148 | 15.3% |
| Estonian | 5 | 0.1% |
| European | 25 | 0.3% |
| Filipino | 4 | 0.1% |
| Finnish | 94 | 1.3% |
| French | 151 | 2.0% |
| French Canadian | 4 | 0.1% |
| German | 1,590 | 21.2% |
| Greek | 127 | 1.7% |
| Honduran | 103 | 1.4% |
| Hungarian | 153 | 2.0% |
| Indian (Asian) | 68 | 0.9% |
| Iranian | 8 | 0.1% |
| Irish | 2,441 | 32.6% |
| Italian | 2,050 | 27.4% |
| Japanese | 5 | 0.1% |
| Korean | 12 | 0.2% |
| Laotian | 4 | 0.1% |
| Latvian | 3 | 0.0% |
| Lithuanian | 38 | 0.5% |
| Mexican | 12 | 0.2% |
| Northern European | 14 | 0.2% |
| Norwegian | 60 | 0.8% |
| Polish | 721 | 9.6% |
| Portuguese | 45 | 0.6% |
| Puerto Rican | 37 | 0.5% |
| Russian | 80 | 1.1% |
| Scandinavian | 18 | 0.2% |
| Scotch-Irish | 63 | 0.8% |
| Scottish | 97 | 1.3% |
| Slavic | 9 | 0.1% |
| Slovak | 23 | 0.3% |
| South American | 28 | 0.4% |
| Spanish | 5 | 0.1% |
| Swedish | 72 | 1.0% |
| Swiss | 35 | 0.5% |
| Ukrainian | 44 | 0.6% |
| Welsh | 76 | 1.0% | View All 51 Rows |
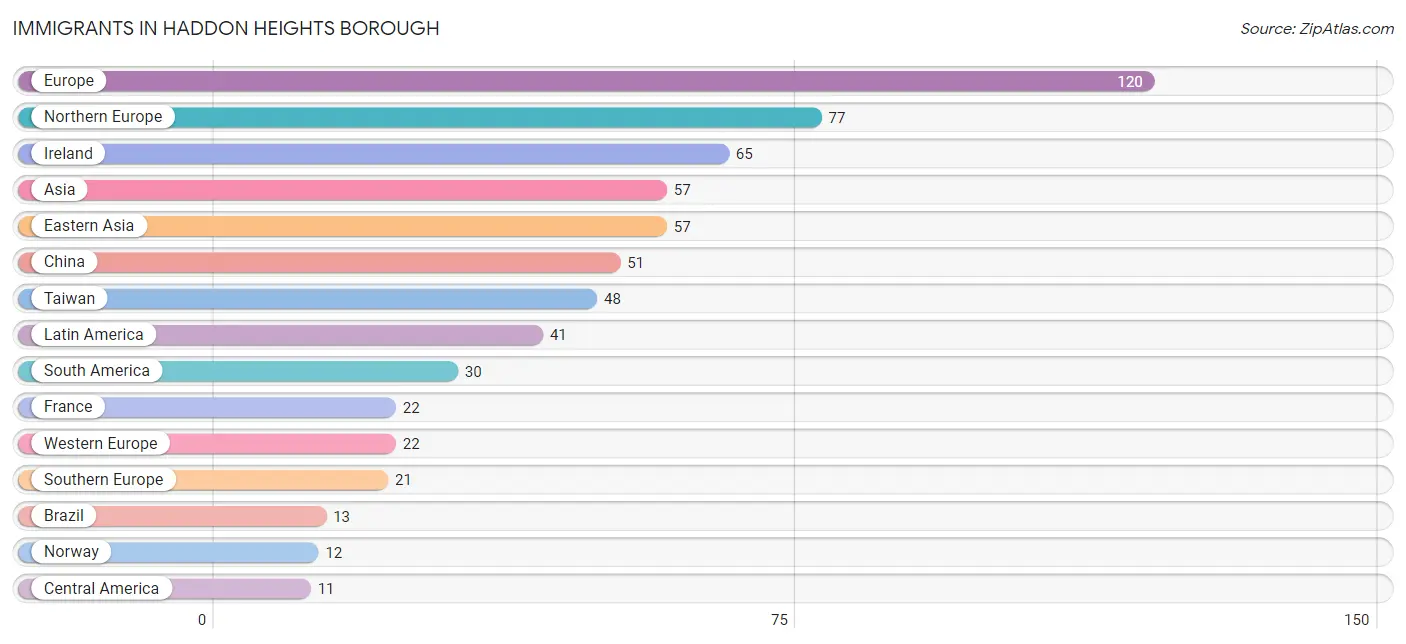
Immigrants in Haddon Heights borough
The most numerous immigrant groups reported in Haddon Heights borough came from Europe (120 | 1.6%), Northern Europe (77 | 1.0%), Ireland (65 | 0.9%), Asia (57 | 0.8%), and Eastern Asia (57 | 0.8%), together accounting for 5.0% of all Haddon Heights borough residents.
| Immigration Origin | # Population | % Population |
| Asia | 57 | 0.8% |
| Brazil | 13 | 0.2% |
| Central America | 11 | 0.2% |
| China | 51 | 0.7% |
| Colombia | 8 | 0.1% |
| Eastern Asia | 57 | 0.8% |
| Europe | 120 | 1.6% |
| France | 22 | 0.3% |
| Greece | 9 | 0.1% |
| Ireland | 65 | 0.9% |
| Italy | 8 | 0.1% |
| Korea | 6 | 0.1% |
| Latin America | 41 | 0.5% |
| Mexico | 11 | 0.2% |
| Northern Europe | 77 | 1.0% |
| Norway | 12 | 0.2% |
| Portugal | 4 | 0.1% |
| South America | 30 | 0.4% |
| Southern Europe | 21 | 0.3% |
| Taiwan | 48 | 0.6% |
| Venezuela | 9 | 0.1% |
| Western Europe | 22 | 0.3% | View All 22 Rows |
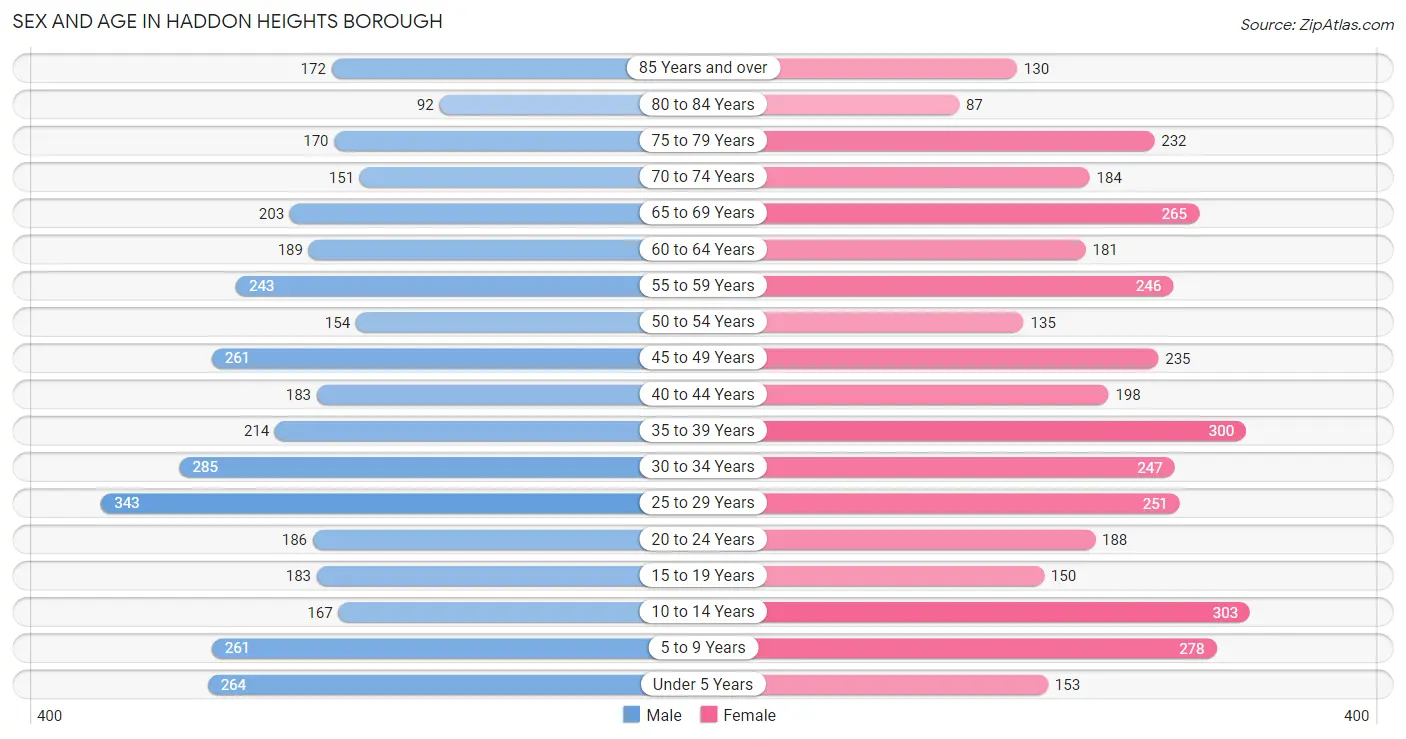
Sex and Age in Haddon Heights borough
Sex and Age in Haddon Heights borough
The most populous age groups in Haddon Heights borough are 25 to 29 Years (343 | 9.2%) for men and 10 to 14 Years (303 | 8.1%) for women.
| Age Bracket | Male | Female |
| Under 5 Years | 264 (7.1%) | 153 (4.1%) |
| 5 to 9 Years | 261 (7.0%) | 278 (7.4%) |
| 10 to 14 Years | 167 (4.5%) | 303 (8.1%) |
| 15 to 19 Years | 183 (4.9%) | 150 (4.0%) |
| 20 to 24 Years | 186 (5.0%) | 188 (5.0%) |
| 25 to 29 Years | 343 (9.2%) | 251 (6.7%) |
| 30 to 34 Years | 285 (7.7%) | 247 (6.6%) |
| 35 to 39 Years | 214 (5.8%) | 300 (8.0%) |
| 40 to 44 Years | 183 (4.9%) | 198 (5.3%) |
| 45 to 49 Years | 261 (7.0%) | 235 (6.2%) |
| 50 to 54 Years | 154 (4.1%) | 135 (3.6%) |
| 55 to 59 Years | 243 (6.5%) | 246 (6.5%) |
| 60 to 64 Years | 189 (5.1%) | 181 (4.8%) |
| 65 to 69 Years | 203 (5.5%) | 265 (7.0%) |
| 70 to 74 Years | 151 (4.1%) | 184 (4.9%) |
| 75 to 79 Years | 170 (4.6%) | 232 (6.2%) |
| 80 to 84 Years | 92 (2.5%) | 87 (2.3%) |
| 85 Years and over | 172 (4.6%) | 130 (3.5%) |
| Total | 3,721 (100.0%) | 3,763 (100.0%) |
Families and Households in Haddon Heights borough
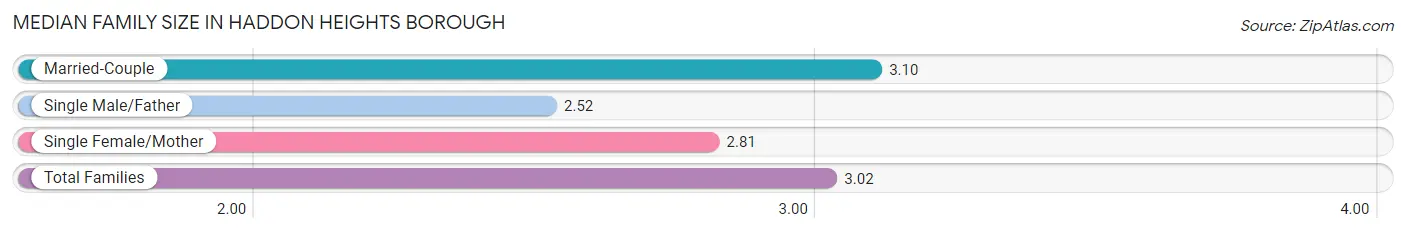
Median Family Size in Haddon Heights borough
The median family size in Haddon Heights borough is 3.02 persons per family, with married-couple families (1,631 | 81.7%) accounting for the largest median family size of 3.1 persons per family. On the other hand, single male/father families (170 | 8.5%) represent the smallest median family size with 2.52 persons per family.
| Family Type | # Families | Family Size |
| Married-Couple | 1,631 (81.7%) | 3.10 |
| Single Male/Father | 170 (8.5%) | 2.52 |
| Single Female/Mother | 195 (9.8%) | 2.81 |
| Total Families | 1,996 (100.0%) | 3.02 |
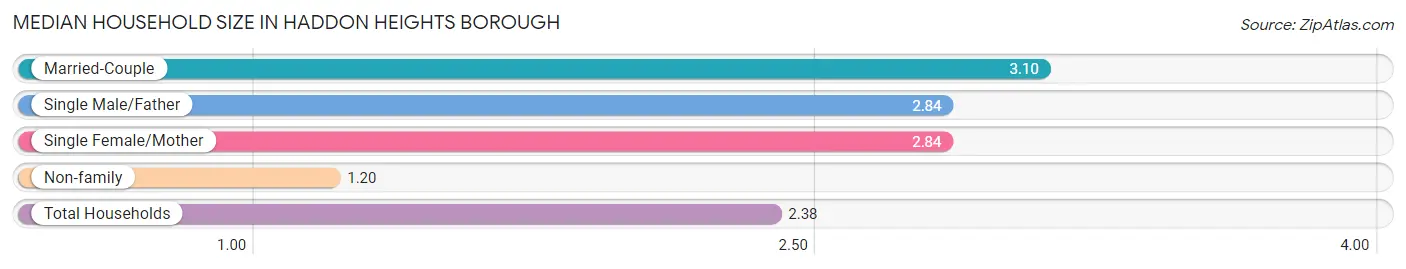
Median Household Size in Haddon Heights borough
The median household size in Haddon Heights borough is 2.38 persons per household, with married-couple households (1,631 | 52.1%) accounting for the largest median household size of 3.1 persons per household. non-family households (1,136 | 36.3%) represent the smallest median household size with 1.20 persons per household.
| Household Type | # Households | Household Size |
| Married-Couple | 1,631 (52.1%) | 3.10 |
| Single Male/Father | 170 (5.4%) | 2.84 |
| Single Female/Mother | 195 (6.2%) | 2.84 |
| Non-family | 1,136 (36.3%) | 1.20 |
| Total Households | 3,132 (100.0%) | 2.38 |
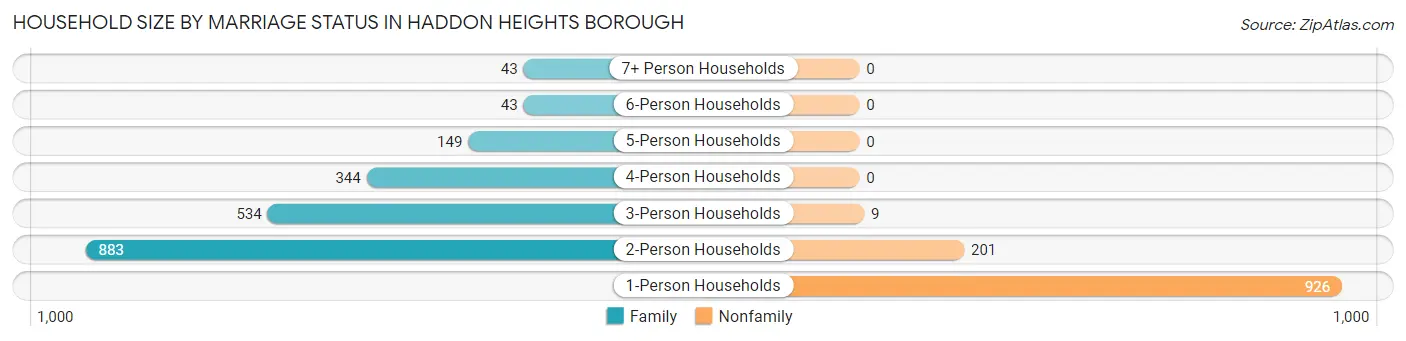
Household Size by Marriage Status in Haddon Heights borough
Out of a total of 3,132 households in Haddon Heights borough, 1,996 (63.7%) are family households, while 1,136 (36.3%) are nonfamily households. The most numerous type of family households are 2-person households, comprising 883, and the most common type of nonfamily households are 1-person households, comprising 926.
| Household Size | Family Households | Nonfamily Households |
| 1-Person Households | - | 926 (29.6%) |
| 2-Person Households | 883 (28.2%) | 201 (6.4%) |
| 3-Person Households | 534 (17.1%) | 9 (0.3%) |
| 4-Person Households | 344 (11.0%) | 0 (0.0%) |
| 5-Person Households | 149 (4.8%) | 0 (0.0%) |
| 6-Person Households | 43 (1.4%) | 0 (0.0%) |
| 7+ Person Households | 43 (1.4%) | 0 (0.0%) |
| Total | 1,996 (63.7%) | 1,136 (36.3%) |
Female Fertility in Haddon Heights borough
Fertility by Age in Haddon Heights borough
Average fertility rate in Haddon Heights borough is 50.0 births per 1,000 women. Women in the age bracket of 35 to 50 years have the highest fertility rate with 75.0 births per 1,000 women. Women in the age bracket of 35 to 50 years acount for 70.9% of all women with births.
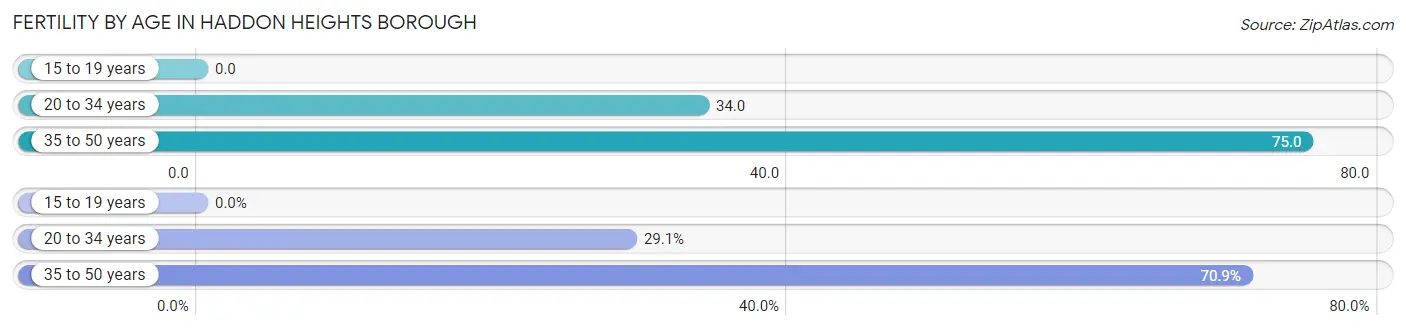
| Age Bracket | Women with Births | Births / 1,000 Women |
| 15 to 19 years | 0 (0.0%) | 0.0 |
| 20 to 34 years | 23 (29.1%) | 34.0 |
| 35 to 50 years | 56 (70.9%) | 75.0 |
| Total | 79 (100.0%) | 50.0 |
Fertility by Age by Marriage Status in Haddon Heights borough
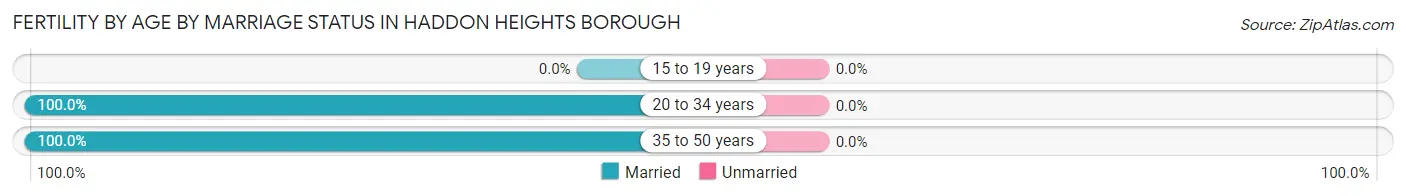
| Age Bracket | Married | Unmarried |
| 15 to 19 years | 0 (0.0%) | 0 (0.0%) |
| 20 to 34 years | 23 (100.0%) | 0 (0.0%) |
| 35 to 50 years | 56 (100.0%) | 0 (0.0%) |
| Total | 79 (100.0%) | 0 (0.0%) |
Fertility by Education in Haddon Heights borough
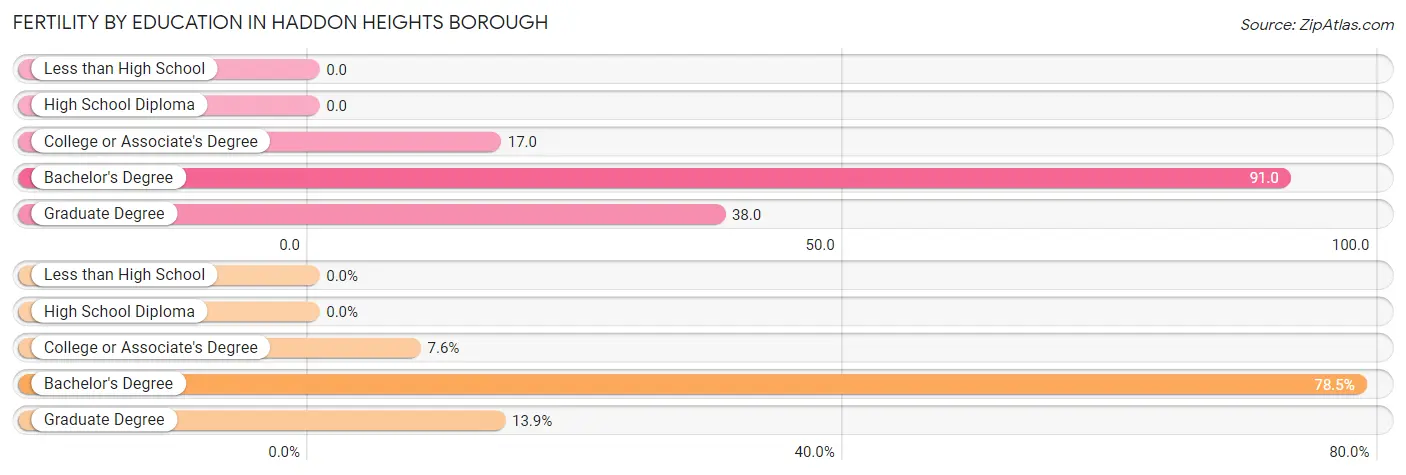
| Educational Attainment | Women with Births | Births / 1,000 Women |
| Less than High School | 0 (0.0%) | 0.0 |
| High School Diploma | 0 (0.0%) | 0.0 |
| College or Associate's Degree | 6 (7.6%) | 17.0 |
| Bachelor's Degree | 62 (78.5%) | 91.0 |
| Graduate Degree | 11 (13.9%) | 38.0 |
| Total | 79 (100.0%) | 50.0 |
Fertility by Education by Marriage Status in Haddon Heights borough
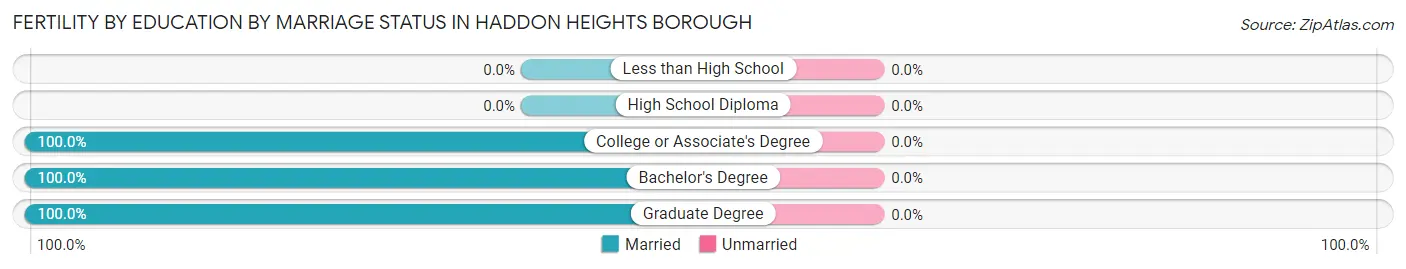
| Educational Attainment | Married | Unmarried |
| Less than High School | 0 (0.0%) | 0 (0.0%) |
| High School Diploma | 0 (0.0%) | 0 (0.0%) |
| College or Associate's Degree | 6 (100.0%) | 0 (0.0%) |
| Bachelor's Degree | 62 (100.0%) | 0 (0.0%) |
| Graduate Degree | 11 (100.0%) | 0 (0.0%) |
| Total | 79 (100.0%) | 0 (0.0%) |
Employment Characteristics in Haddon Heights borough
Employment by Class of Employer in Haddon Heights borough
Among the 3,911 employed individuals in Haddon Heights borough, private company employees (2,494 | 63.8%), local government employees (552 | 14.1%), and not-for-profit organizations (309 | 7.9%) make up the most common classes of employment.
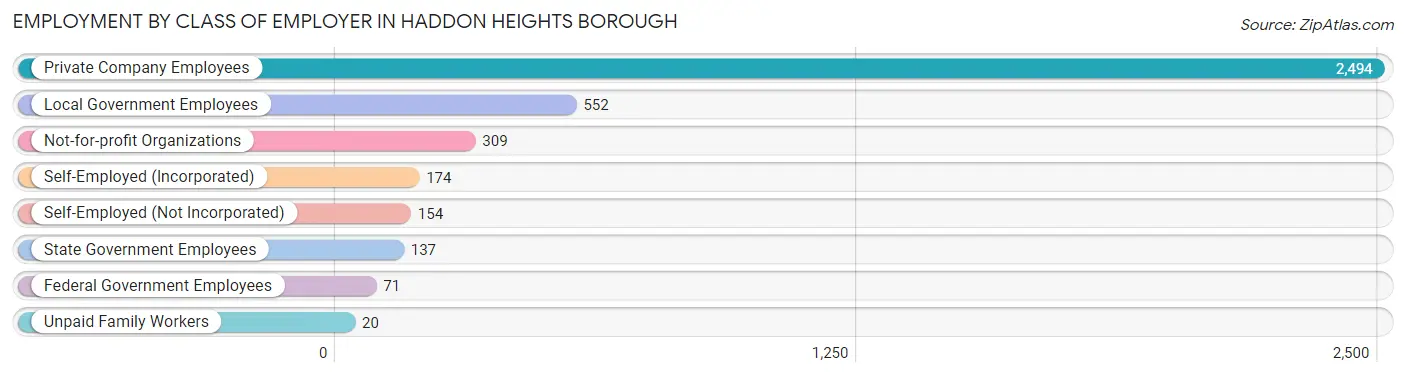
| Employer Class | # Employees | % Employees |
| Private Company Employees | 2,494 | 63.8% |
| Self-Employed (Incorporated) | 174 | 4.4% |
| Self-Employed (Not Incorporated) | 154 | 3.9% |
| Not-for-profit Organizations | 309 | 7.9% |
| Local Government Employees | 552 | 14.1% |
| State Government Employees | 137 | 3.5% |
| Federal Government Employees | 71 | 1.8% |
| Unpaid Family Workers | 20 | 0.5% |
| Total | 3,911 | 100.0% |
Employment Status by Age in Haddon Heights borough
According to the labor force statistics for Haddon Heights borough, out of the total population over 16 years of age (5,905), 70.7% or 4,175 individuals are in the labor force, with 4.6% or 192 of them unemployed. The age group with the highest labor force participation rate is 30 to 34 years, with 95.5% or 508 individuals in the labor force. Within the labor force, the 20 to 24 years age range has the highest percentage of unemployed individuals, with 17.6% or 54 of them being unemployed.
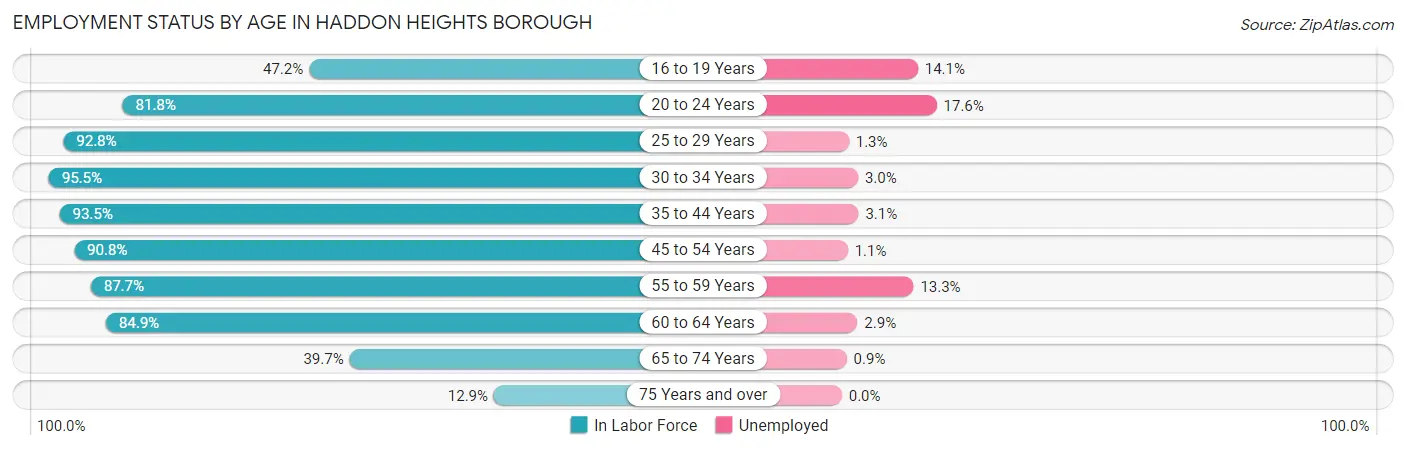
| Age Bracket | In Labor Force | Unemployed |
| 16 to 19 Years | 85 (47.2%) | 12 (14.1%) |
| 20 to 24 Years | 306 (81.8%) | 54 (17.6%) |
| 25 to 29 Years | 551 (92.8%) | 7 (1.3%) |
| 30 to 34 Years | 508 (95.5%) | 15 (3.0%) |
| 35 to 44 Years | 837 (93.5%) | 26 (3.1%) |
| 45 to 54 Years | 713 (90.8%) | 8 (1.1%) |
| 55 to 59 Years | 429 (87.7%) | 57 (13.3%) |
| 60 to 64 Years | 314 (84.9%) | 9 (2.9%) |
| 65 to 74 Years | 319 (39.7%) | 3 (0.9%) |
| 75 Years and over | 114 (12.9%) | 0 (0.0%) |
| Total | 4,175 (70.7%) | 192 (4.6%) |
Employment Status by Educational Attainment in Haddon Heights borough
According to labor force statistics for Haddon Heights borough, 91.5% of individuals (3,353) out of the total population between 25 and 64 years of age (3,665) are in the labor force, with 3.6% or 121 of them being unemployed. The group with the highest labor force participation rate are those with the educational attainment of bachelor's degree or higher, with 94.4% or 2,167 individuals in the labor force. Within the labor force, individuals with less than high school education have the highest percentage of unemployment, with 16.1% or 5 of them being unemployed.
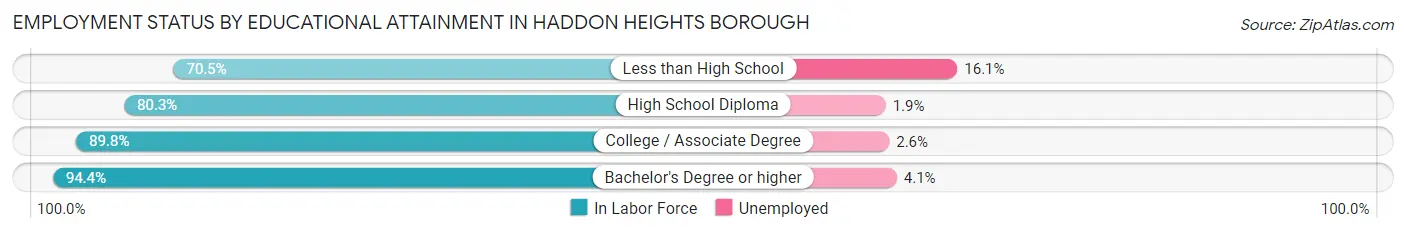
| Educational Attainment | In Labor Force | Unemployed |
| Less than High School | 31 (70.5%) | 7 (16.1%) |
| High School Diploma | 309 (80.3%) | 7 (1.9%) |
| College / Associate Degree | 844 (89.8%) | 24 (2.6%) |
| Bachelor's Degree or higher | 2,167 (94.4%) | 94 (4.1%) |
| Total | 3,353 (91.5%) | 132 (3.6%) |
Employment Occupations by Sex in Haddon Heights borough
Management, Business, Science and Arts Occupations
The most common Management, Business, Science and Arts occupations in Haddon Heights borough are Community & Social Service (669 | 16.8%), Management (580 | 14.5%), Computers, Engineering & Science (441 | 11.1%), Health Diagnosing & Treating (407 | 10.2%), and Health Technologists (369 | 9.3%).
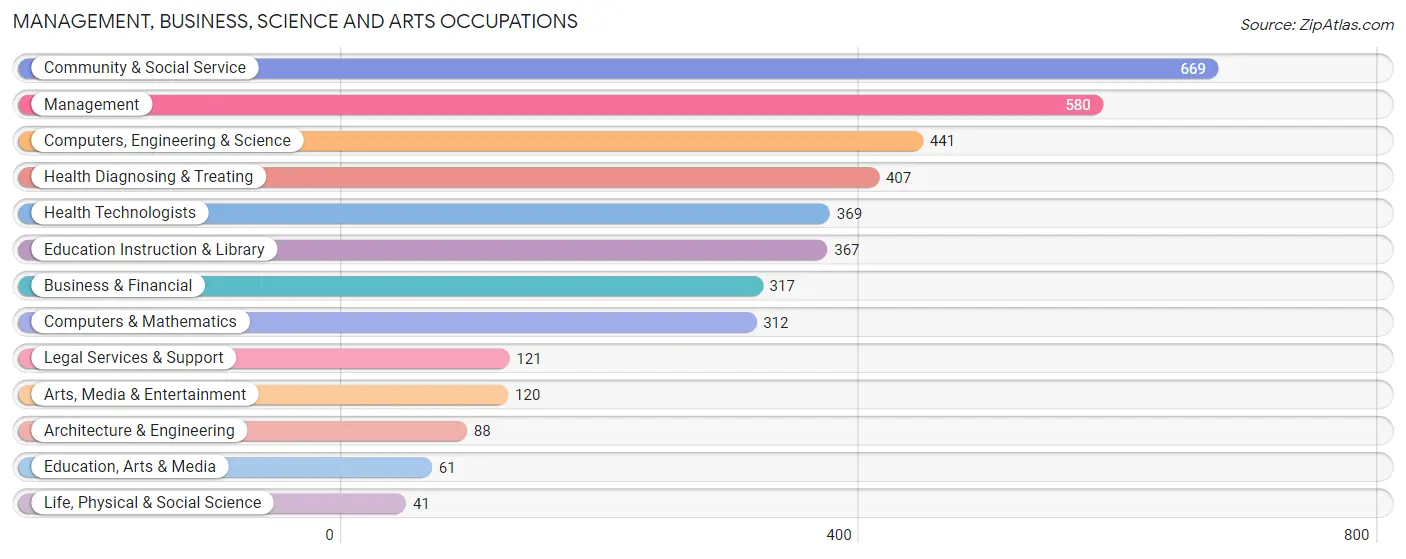
Management, Business, Science and Arts Occupations by Sex
Within the Management, Business, Science and Arts occupations in Haddon Heights borough, the most male-oriented occupations are Computers & Mathematics (92.6%), Computers, Engineering & Science (81.6%), and Architecture & Engineering (75.0%), while the most female-oriented occupations are Life, Physical & Social Science (87.8%), Education, Arts & Media (83.6%), and Education Instruction & Library (80.9%).
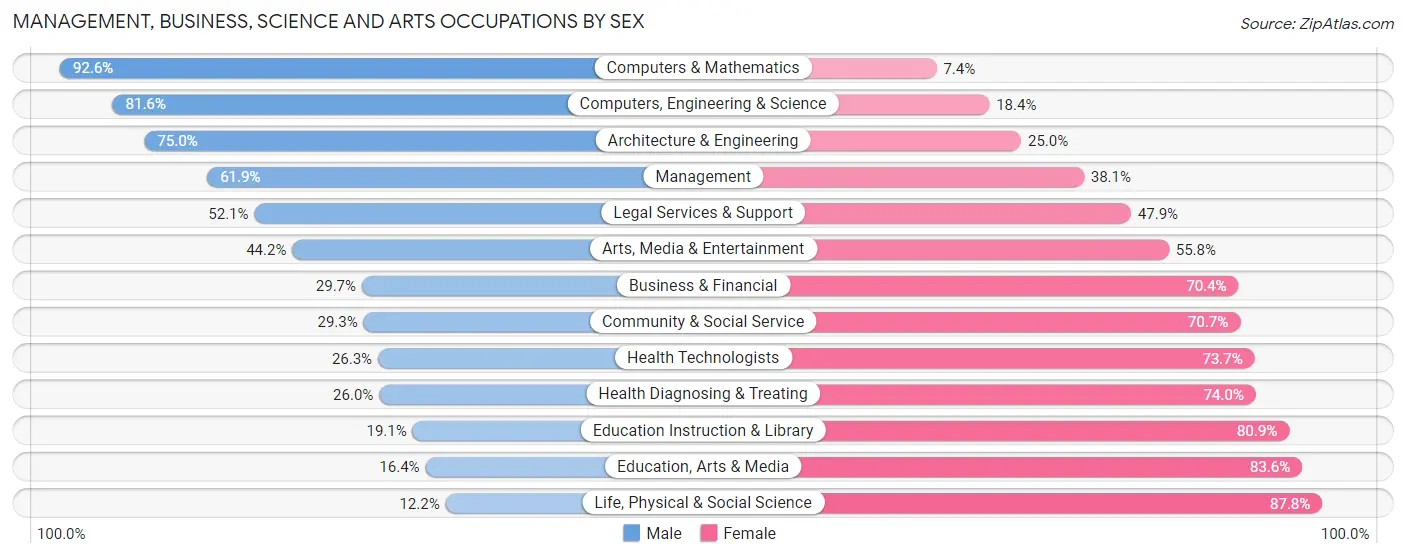
| Occupation | Male | Female |
| Management | 359 (61.9%) | 221 (38.1%) |
| Business & Financial | 94 (29.6%) | 223 (70.4%) |
| Computers, Engineering & Science | 360 (81.6%) | 81 (18.4%) |
| Computers & Mathematics | 289 (92.6%) | 23 (7.4%) |
| Architecture & Engineering | 66 (75.0%) | 22 (25.0%) |
| Life, Physical & Social Science | 5 (12.2%) | 36 (87.8%) |
| Community & Social Service | 196 (29.3%) | 473 (70.7%) |
| Education, Arts & Media | 10 (16.4%) | 51 (83.6%) |
| Legal Services & Support | 63 (52.1%) | 58 (47.9%) |
| Education Instruction & Library | 70 (19.1%) | 297 (80.9%) |
| Arts, Media & Entertainment | 53 (44.2%) | 67 (55.8%) |
| Health Diagnosing & Treating | 106 (26.0%) | 301 (74.0%) |
| Health Technologists | 97 (26.3%) | 272 (73.7%) |
| Total (Category) | 1,115 (46.2%) | 1,299 (53.8%) |
| Total (Overall) | 2,033 (51.0%) | 1,952 (49.0%) |
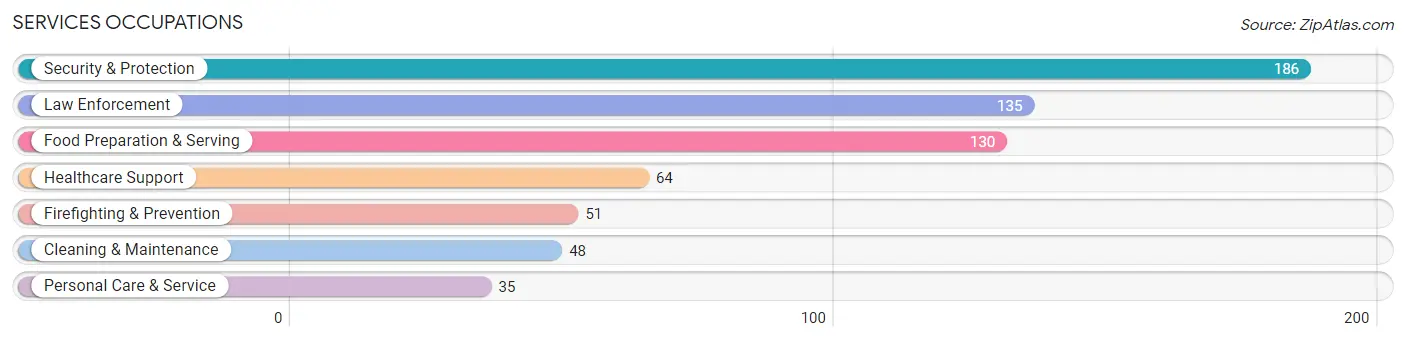
Services Occupations
The most common Services occupations in Haddon Heights borough are Security & Protection (186 | 4.7%), Law Enforcement (135 | 3.4%), Food Preparation & Serving (130 | 3.3%), Healthcare Support (64 | 1.6%), and Firefighting & Prevention (51 | 1.3%).
Services Occupations by Sex
Within the Services occupations in Haddon Heights borough, the most male-oriented occupations are Law Enforcement (100.0%), Security & Protection (96.2%), and Firefighting & Prevention (86.3%), while the most female-oriented occupations are Healthcare Support (100.0%), Food Preparation & Serving (78.5%), and Personal Care & Service (74.3%).
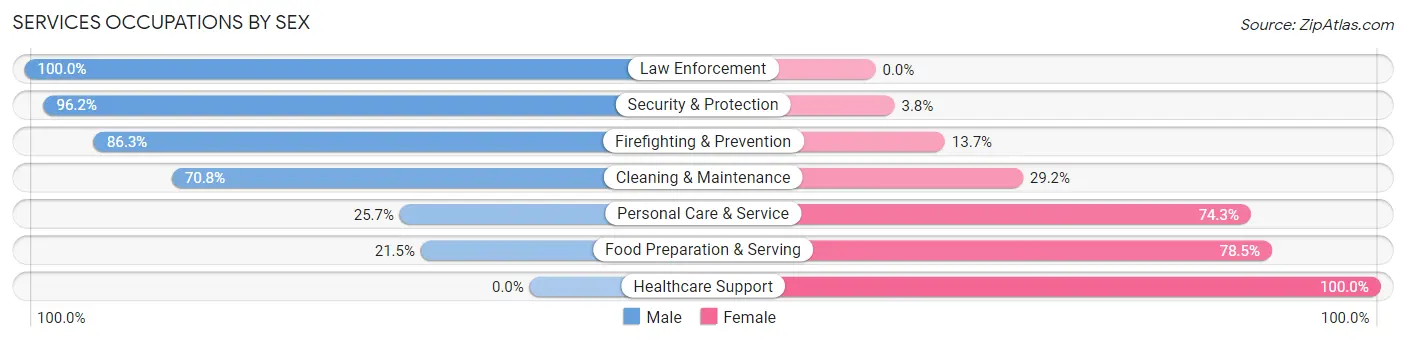
| Occupation | Male | Female |
| Healthcare Support | 0 (0.0%) | 64 (100.0%) |
| Security & Protection | 179 (96.2%) | 7 (3.8%) |
| Firefighting & Prevention | 44 (86.3%) | 7 (13.7%) |
| Law Enforcement | 135 (100.0%) | 0 (0.0%) |
| Food Preparation & Serving | 28 (21.5%) | 102 (78.5%) |
| Cleaning & Maintenance | 34 (70.8%) | 14 (29.2%) |
| Personal Care & Service | 9 (25.7%) | 26 (74.3%) |
| Total (Category) | 250 (54.0%) | 213 (46.0%) |
| Total (Overall) | 2,033 (51.0%) | 1,952 (49.0%) |
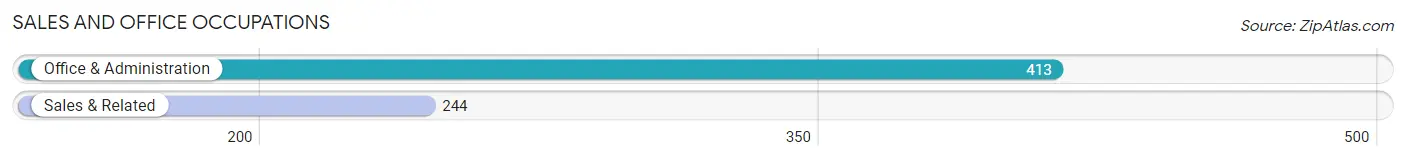
Sales and Office Occupations
The most common Sales and Office occupations in Haddon Heights borough are Office & Administration (413 | 10.4%), and Sales & Related (244 | 6.1%).
Sales and Office Occupations by Sex
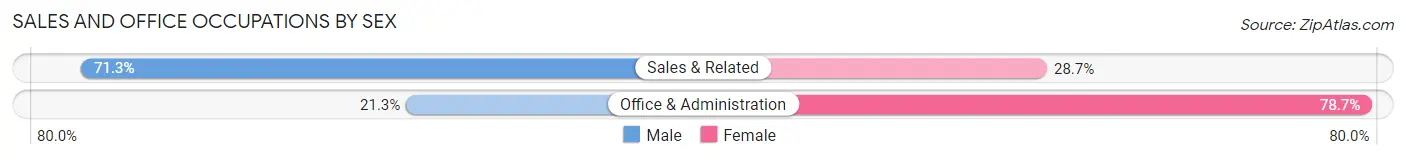
| Occupation | Male | Female |
| Sales & Related | 174 (71.3%) | 70 (28.7%) |
| Office & Administration | 88 (21.3%) | 325 (78.7%) |
| Total (Category) | 262 (39.9%) | 395 (60.1%) |
| Total (Overall) | 2,033 (51.0%) | 1,952 (49.0%) |
Natural Resources, Construction and Maintenance Occupations
The most common Natural Resources, Construction and Maintenance occupations in Haddon Heights borough are Installation, Maintenance & Repair (144 | 3.6%), and Construction & Extraction (141 | 3.5%).
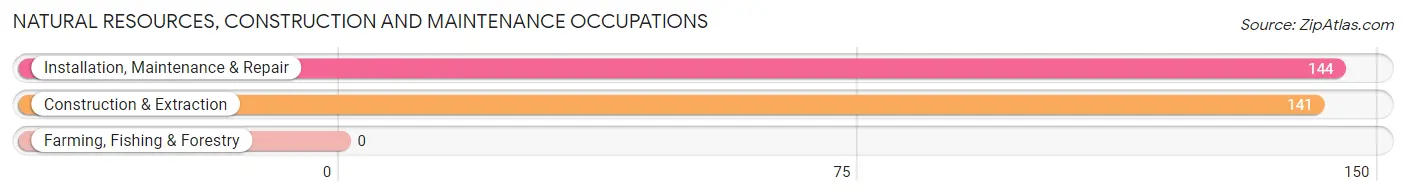
Natural Resources, Construction and Maintenance Occupations by Sex
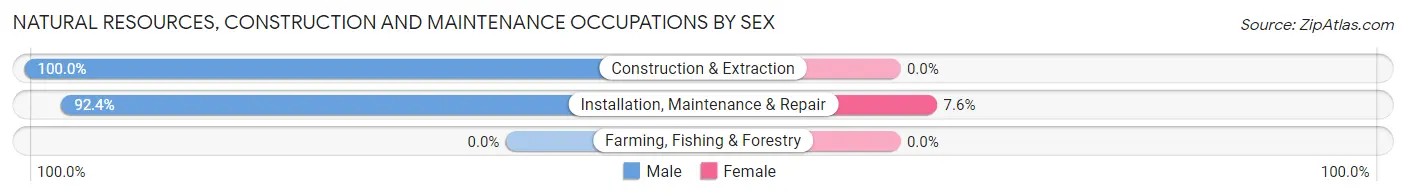
| Occupation | Male | Female |
| Farming, Fishing & Forestry | 0 (0.0%) | 0 (0.0%) |
| Construction & Extraction | 141 (100.0%) | 0 (0.0%) |
| Installation, Maintenance & Repair | 133 (92.4%) | 11 (7.6%) |
| Total (Category) | 274 (96.1%) | 11 (3.9%) |
| Total (Overall) | 2,033 (51.0%) | 1,952 (49.0%) |
Production, Transportation and Moving Occupations
The most common Production, Transportation and Moving occupations in Haddon Heights borough are Material Moving (76 | 1.9%), Production (57 | 1.4%), and Transportation (33 | 0.8%).
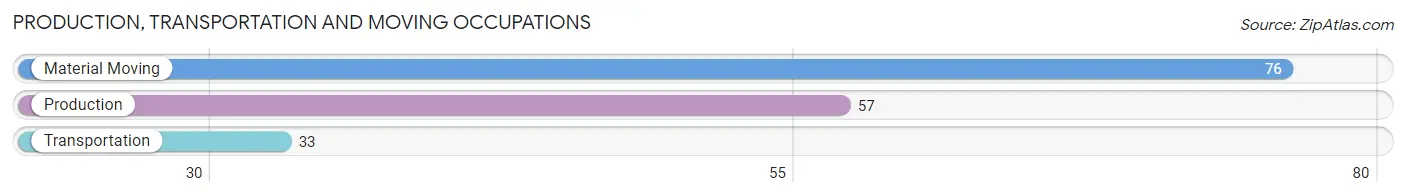
Production, Transportation and Moving Occupations by Sex
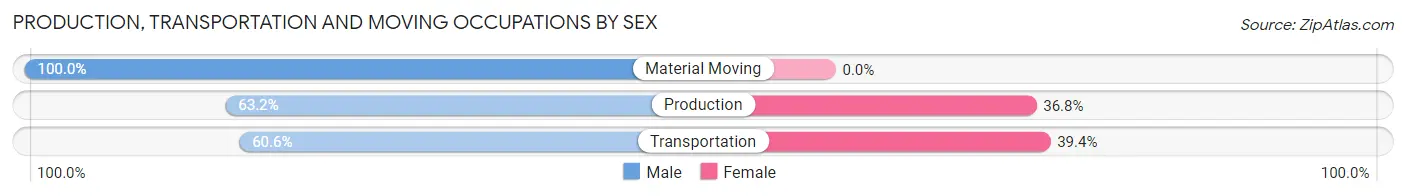
| Occupation | Male | Female |
| Production | 36 (63.2%) | 21 (36.8%) |
| Transportation | 20 (60.6%) | 13 (39.4%) |
| Material Moving | 76 (100.0%) | 0 (0.0%) |
| Total (Category) | 132 (79.5%) | 34 (20.5%) |
| Total (Overall) | 2,033 (51.0%) | 1,952 (49.0%) |
Employment Industries by Sex in Haddon Heights borough
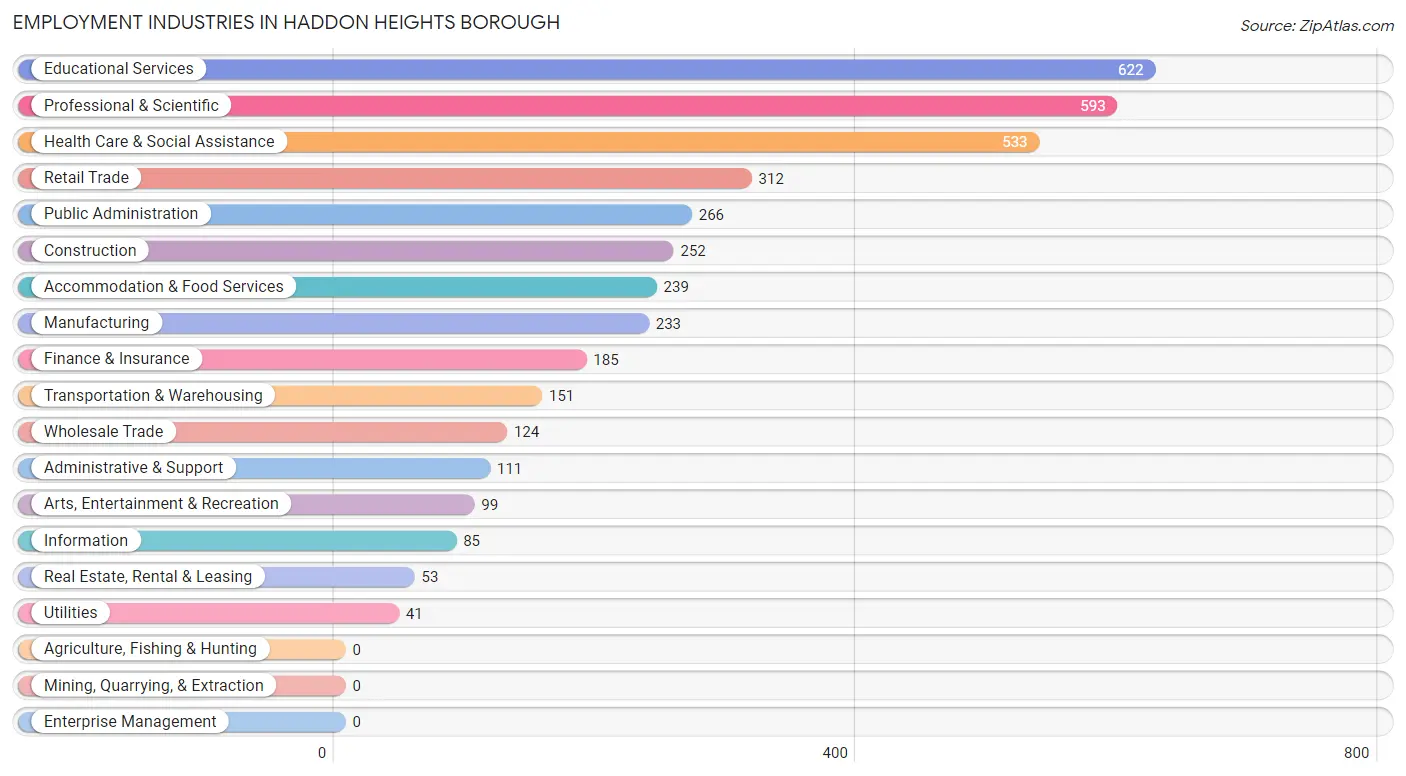
Employment Industries in Haddon Heights borough
The major employment industries in Haddon Heights borough include Educational Services (622 | 15.6%), Professional & Scientific (593 | 14.9%), Health Care & Social Assistance (533 | 13.4%), Retail Trade (312 | 7.8%), and Public Administration (266 | 6.7%).
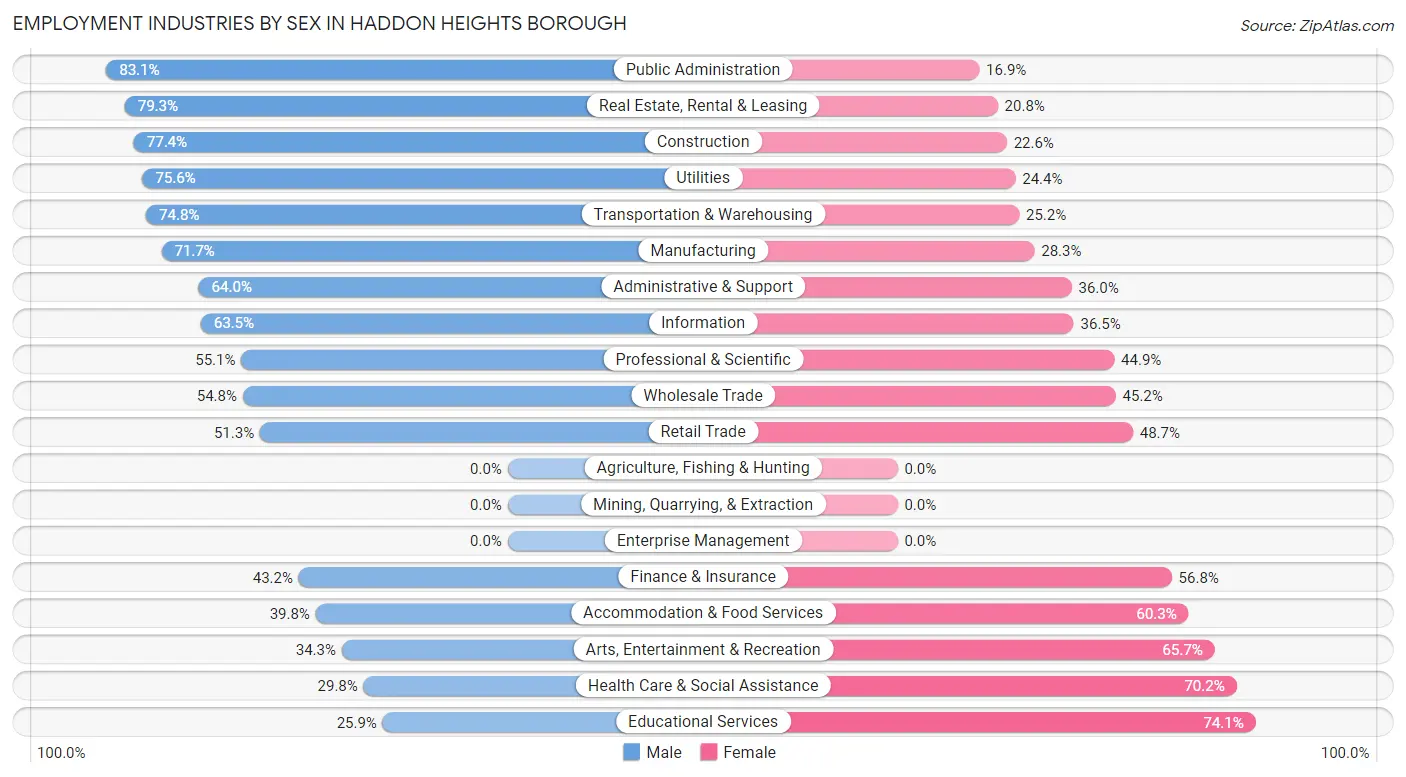
Employment Industries by Sex in Haddon Heights borough
The Haddon Heights borough industries that see more men than women are Public Administration (83.1%), Real Estate, Rental & Leasing (79.2%), and Construction (77.4%), whereas the industries that tend to have a higher number of women are Educational Services (74.1%), Health Care & Social Assistance (70.2%), and Arts, Entertainment & Recreation (65.7%).
| Industry | Male | Female |
| Agriculture, Fishing & Hunting | 0 (0.0%) | 0 (0.0%) |
| Mining, Quarrying, & Extraction | 0 (0.0%) | 0 (0.0%) |
| Construction | 195 (77.4%) | 57 (22.6%) |
| Manufacturing | 167 (71.7%) | 66 (28.3%) |
| Wholesale Trade | 68 (54.8%) | 56 (45.2%) |
| Retail Trade | 160 (51.3%) | 152 (48.7%) |
| Transportation & Warehousing | 113 (74.8%) | 38 (25.2%) |
| Utilities | 31 (75.6%) | 10 (24.4%) |
| Information | 54 (63.5%) | 31 (36.5%) |
| Finance & Insurance | 80 (43.2%) | 105 (56.8%) |
| Real Estate, Rental & Leasing | 42 (79.2%) | 11 (20.7%) |
| Professional & Scientific | 327 (55.1%) | 266 (44.9%) |
| Enterprise Management | 0 (0.0%) | 0 (0.0%) |
| Administrative & Support | 71 (64.0%) | 40 (36.0%) |
| Educational Services | 161 (25.9%) | 461 (74.1%) |
| Health Care & Social Assistance | 159 (29.8%) | 374 (70.2%) |
| Arts, Entertainment & Recreation | 34 (34.3%) | 65 (65.7%) |
| Accommodation & Food Services | 95 (39.8%) | 144 (60.3%) |
| Public Administration | 221 (83.1%) | 45 (16.9%) |
| Total | 2,033 (51.0%) | 1,952 (49.0%) |
Education in Haddon Heights borough
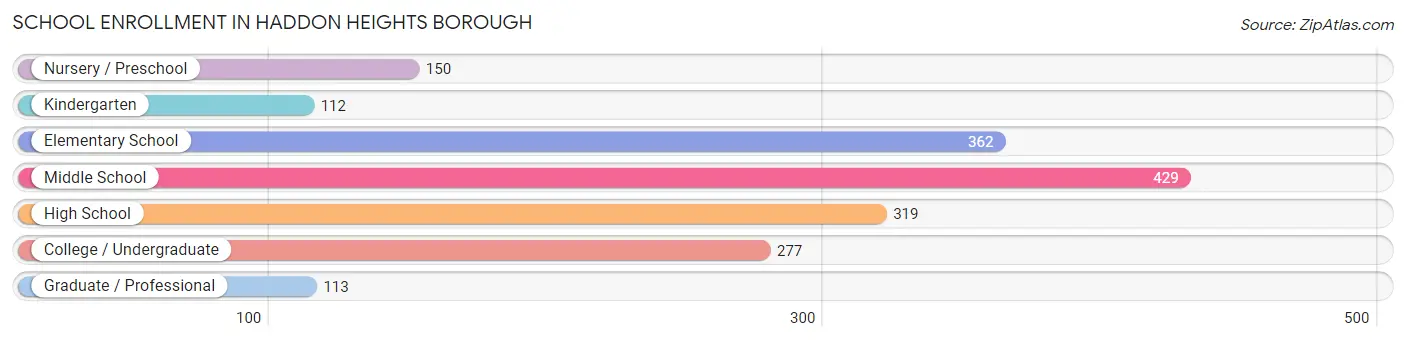
School Enrollment in Haddon Heights borough
The most common levels of schooling among the 1,762 students in Haddon Heights borough are middle school (429 | 24.3%), elementary school (362 | 20.5%), and high school (319 | 18.1%).
| School Level | # Students | % Students |
| Nursery / Preschool | 150 | 8.5% |
| Kindergarten | 112 | 6.4% |
| Elementary School | 362 | 20.5% |
| Middle School | 429 | 24.3% |
| High School | 319 | 18.1% |
| College / Undergraduate | 277 | 15.7% |
| Graduate / Professional | 113 | 6.4% |
| Total | 1,762 | 100.0% |
School Enrollment by Age by Funding Source in Haddon Heights borough
Out of a total of 1,762 students who are enrolled in schools in Haddon Heights borough, 381 (21.6%) attend a private institution, while the remaining 1,381 (78.4%) are enrolled in public schools. The age group of 3 to 4 year olds has the highest likelihood of being enrolled in private schools, with 96 (89.7% in the age bracket) enrolled. Conversely, the age group of 5 to 9 year old has the lowest likelihood of being enrolled in a private school, with 472 (93.3% in the age bracket) attending a public institution.
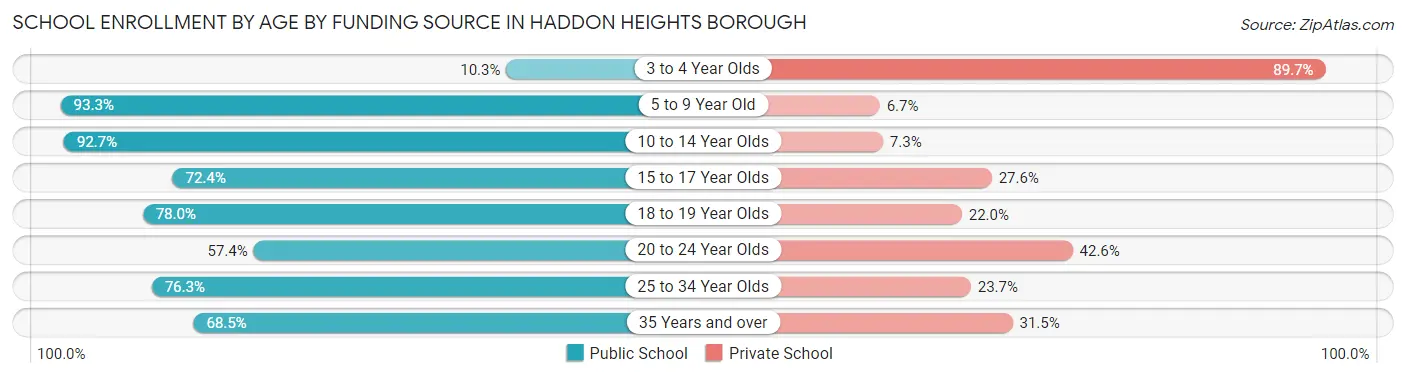
| Age Bracket | Public School | Private School |
| 3 to 4 Year Olds | 11 (10.3%) | 96 (89.7%) |
| 5 to 9 Year Old | 472 (93.3%) | 34 (6.7%) |
| 10 to 14 Year Olds | 431 (92.7%) | 34 (7.3%) |
| 15 to 17 Year Olds | 197 (72.4%) | 75 (27.6%) |
| 18 to 19 Year Olds | 39 (78.0%) | 11 (22.0%) |
| 20 to 24 Year Olds | 113 (57.4%) | 84 (42.6%) |
| 25 to 34 Year Olds | 58 (76.3%) | 18 (23.7%) |
| 35 Years and over | 61 (68.5%) | 28 (31.5%) |
| Total | 1,381 (78.4%) | 381 (21.6%) |
Educational Attainment by Field of Study in Haddon Heights borough
Business (585 | 18.9%), education (398 | 12.9%), science & technology (341 | 11.0%), communications (250 | 8.1%), and engineering (211 | 6.8%) are the most common fields of study among 3,089 individuals in Haddon Heights borough who have obtained a bachelor's degree or higher.
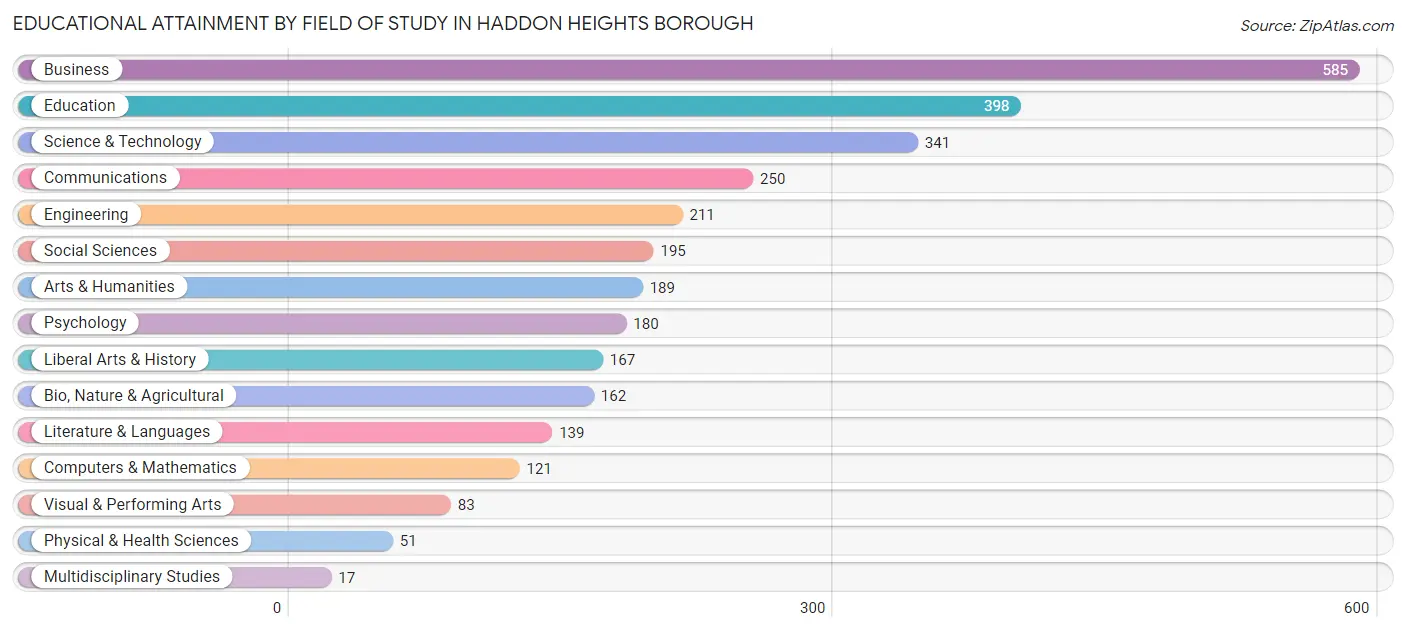
| Field of Study | # Graduates | % Graduates |
| Computers & Mathematics | 121 | 3.9% |
| Bio, Nature & Agricultural | 162 | 5.2% |
| Physical & Health Sciences | 51 | 1.7% |
| Psychology | 180 | 5.8% |
| Social Sciences | 195 | 6.3% |
| Engineering | 211 | 6.8% |
| Multidisciplinary Studies | 17 | 0.5% |
| Science & Technology | 341 | 11.0% |
| Business | 585 | 18.9% |
| Education | 398 | 12.9% |
| Literature & Languages | 139 | 4.5% |
| Liberal Arts & History | 167 | 5.4% |
| Visual & Performing Arts | 83 | 2.7% |
| Communications | 250 | 8.1% |
| Arts & Humanities | 189 | 6.1% |
| Total | 3,089 | 100.0% |
Transportation & Commute in Haddon Heights borough
Vehicle Availability by Sex in Haddon Heights borough
The most prevalent vehicle ownership categories in Haddon Heights borough are males with 2 vehicles (1,017, accounting for 51.0%) and females with 2 vehicles (971, making up 53.1%).
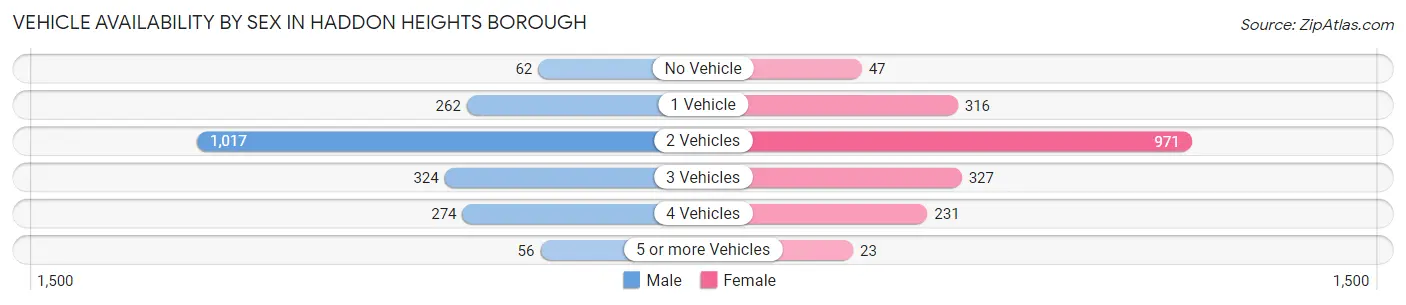
| Vehicles Available | Male | Female |
| No Vehicle | 62 (3.1%) | 47 (2.5%) |
| 1 Vehicle | 262 (13.1%) | 316 (16.5%) |
| 2 Vehicles | 1,017 (51.0%) | 971 (50.7%) |
| 3 Vehicles | 324 (16.2%) | 327 (17.1%) |
| 4 Vehicles | 274 (13.7%) | 231 (12.1%) |
| 5 or more Vehicles | 56 (2.8%) | 23 (1.2%) |
| Total | 1,995 (100.0%) | 1,915 (100.0%) |
Commute Time in Haddon Heights borough
The most frequently occuring commute durations in Haddon Heights borough are 15 to 19 minutes (639 commuters, 20.5%), 20 to 24 minutes (552 commuters, 17.7%), and 30 to 34 minutes (324 commuters, 10.4%).
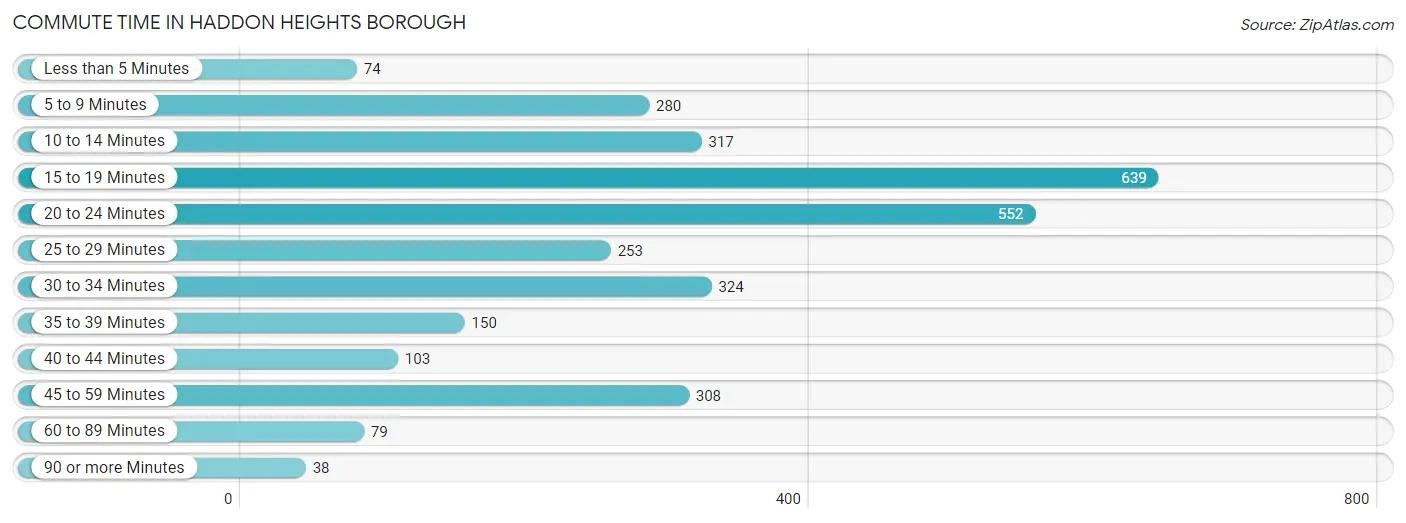
| Commute Time | # Commuters | % Commuters |
| Less than 5 Minutes | 74 | 2.4% |
| 5 to 9 Minutes | 280 | 9.0% |
| 10 to 14 Minutes | 317 | 10.2% |
| 15 to 19 Minutes | 639 | 20.5% |
| 20 to 24 Minutes | 552 | 17.7% |
| 25 to 29 Minutes | 253 | 8.1% |
| 30 to 34 Minutes | 324 | 10.4% |
| 35 to 39 Minutes | 150 | 4.8% |
| 40 to 44 Minutes | 103 | 3.3% |
| 45 to 59 Minutes | 308 | 9.9% |
| 60 to 89 Minutes | 79 | 2.5% |
| 90 or more Minutes | 38 | 1.2% |
Commute Time by Sex in Haddon Heights borough
The most common commute times in Haddon Heights borough are 15 to 19 minutes (349 commuters, 21.0%) for males and 15 to 19 minutes (290 commuters, 19.9%) for females.
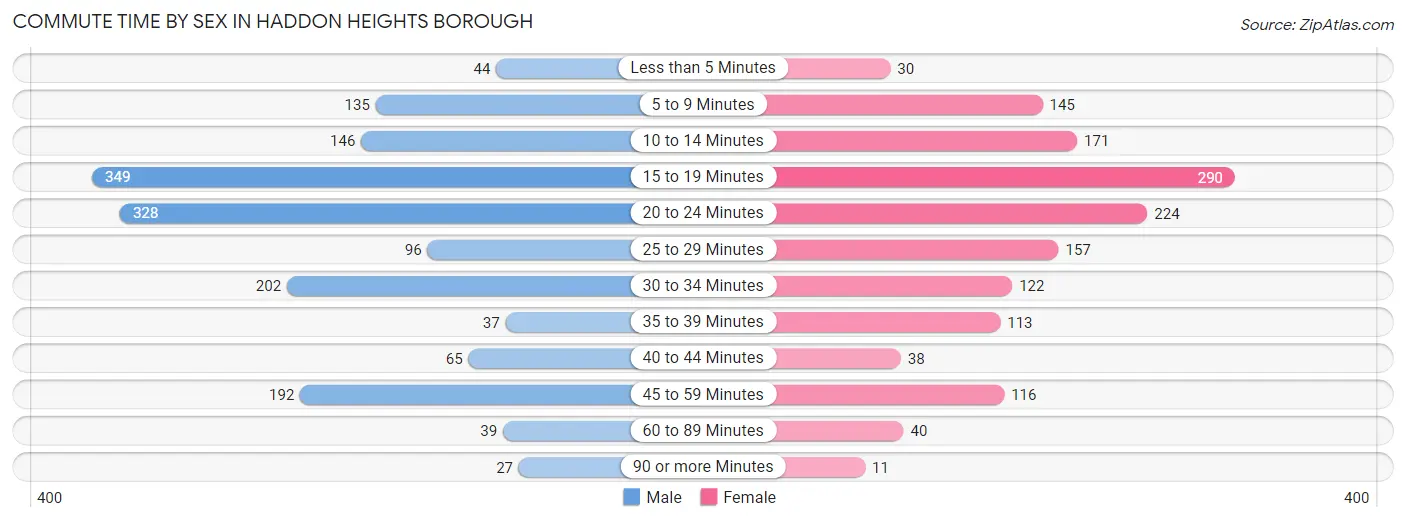
| Commute Time | Male | Female |
| Less than 5 Minutes | 44 (2.6%) | 30 (2.1%) |
| 5 to 9 Minutes | 135 (8.1%) | 145 (10.0%) |
| 10 to 14 Minutes | 146 (8.8%) | 171 (11.7%) |
| 15 to 19 Minutes | 349 (21.0%) | 290 (19.9%) |
| 20 to 24 Minutes | 328 (19.8%) | 224 (15.4%) |
| 25 to 29 Minutes | 96 (5.8%) | 157 (10.8%) |
| 30 to 34 Minutes | 202 (12.2%) | 122 (8.4%) |
| 35 to 39 Minutes | 37 (2.2%) | 113 (7.8%) |
| 40 to 44 Minutes | 65 (3.9%) | 38 (2.6%) |
| 45 to 59 Minutes | 192 (11.6%) | 116 (8.0%) |
| 60 to 89 Minutes | 39 (2.4%) | 40 (2.8%) |
| 90 or more Minutes | 27 (1.6%) | 11 (0.7%) |
Time of Departure to Work by Sex in Haddon Heights borough
The most frequent times of departure to work in Haddon Heights borough are 7:00 AM to 7:29 AM (312, 18.8%) for males and 8:00 AM to 8:29 AM (250, 17.2%) for females.
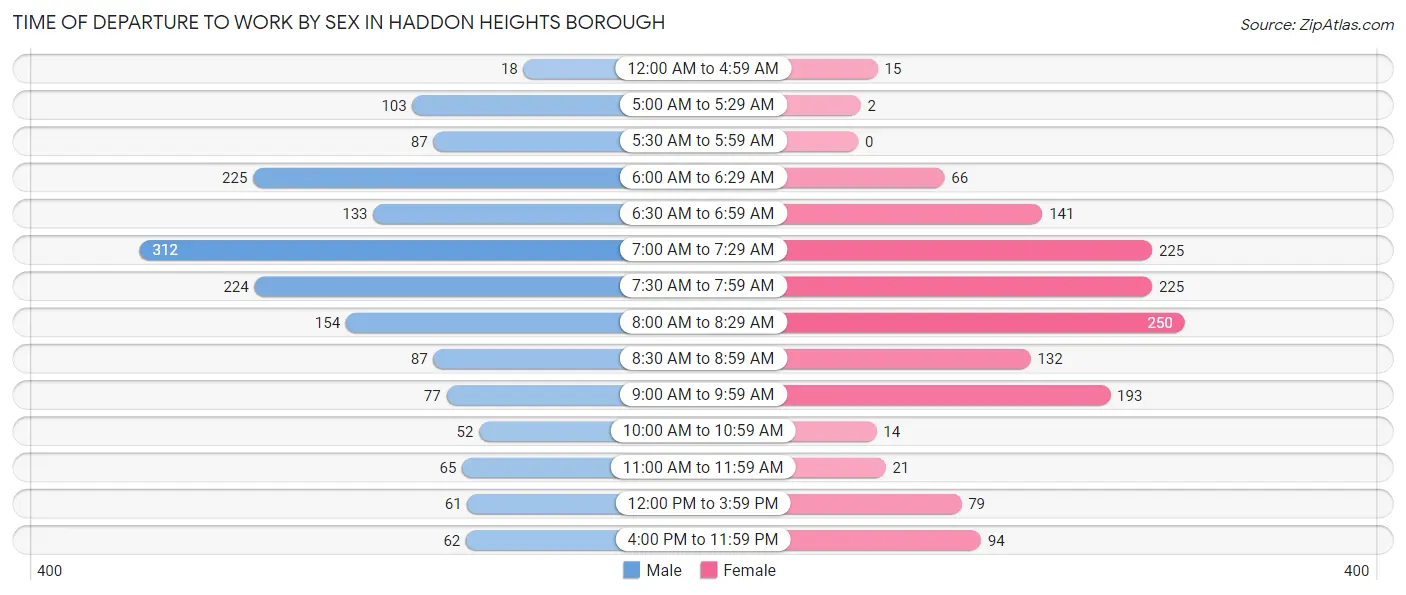
| Time of Departure | Male | Female |
| 12:00 AM to 4:59 AM | 18 (1.1%) | 15 (1.0%) |
| 5:00 AM to 5:29 AM | 103 (6.2%) | 2 (0.1%) |
| 5:30 AM to 5:59 AM | 87 (5.2%) | 0 (0.0%) |
| 6:00 AM to 6:29 AM | 225 (13.6%) | 66 (4.5%) |
| 6:30 AM to 6:59 AM | 133 (8.0%) | 141 (9.7%) |
| 7:00 AM to 7:29 AM | 312 (18.8%) | 225 (15.4%) |
| 7:30 AM to 7:59 AM | 224 (13.5%) | 225 (15.4%) |
| 8:00 AM to 8:29 AM | 154 (9.3%) | 250 (17.2%) |
| 8:30 AM to 8:59 AM | 87 (5.2%) | 132 (9.1%) |
| 9:00 AM to 9:59 AM | 77 (4.6%) | 193 (13.3%) |
| 10:00 AM to 10:59 AM | 52 (3.1%) | 14 (1.0%) |
| 11:00 AM to 11:59 AM | 65 (3.9%) | 21 (1.4%) |
| 12:00 PM to 3:59 PM | 61 (3.7%) | 79 (5.4%) |
| 4:00 PM to 11:59 PM | 62 (3.7%) | 94 (6.5%) |
| Total | 1,660 (100.0%) | 1,457 (100.0%) |
Housing Occupancy in Haddon Heights borough
Occupancy by Ownership in Haddon Heights borough
Of the total 3,132 dwellings in Haddon Heights borough, owner-occupied units account for 2,439 (77.9%), while renter-occupied units make up 693 (22.1%).
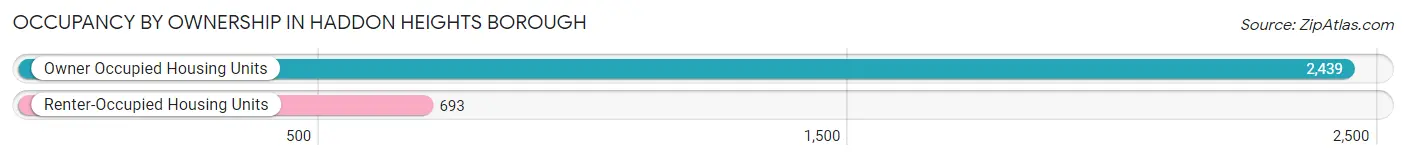
| Occupancy | # Housing Units | % Housing Units |
| Owner Occupied Housing Units | 2,439 | 77.9% |
| Renter-Occupied Housing Units | 693 | 22.1% |
| Total Occupied Housing Units | 3,132 | 100.0% |
Occupancy by Household Size in Haddon Heights borough
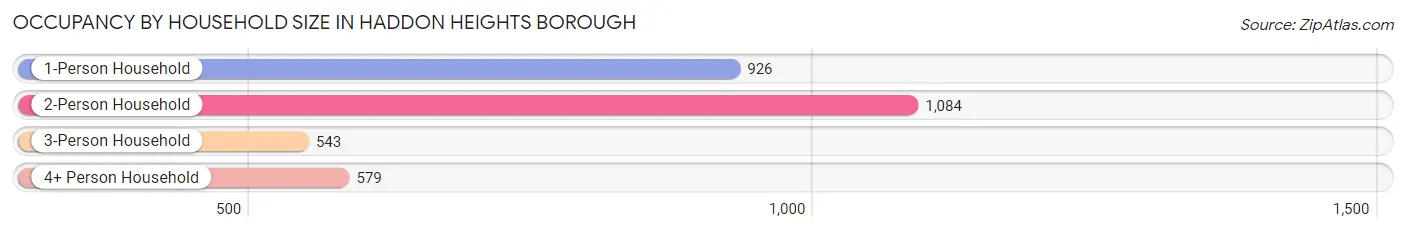
| Household Size | # Housing Units | % Housing Units |
| 1-Person Household | 926 | 29.6% |
| 2-Person Household | 1,084 | 34.6% |
| 3-Person Household | 543 | 17.3% |
| 4+ Person Household | 579 | 18.5% |
| Total Housing Units | 3,132 | 100.0% |
Occupancy by Ownership by Household Size in Haddon Heights borough
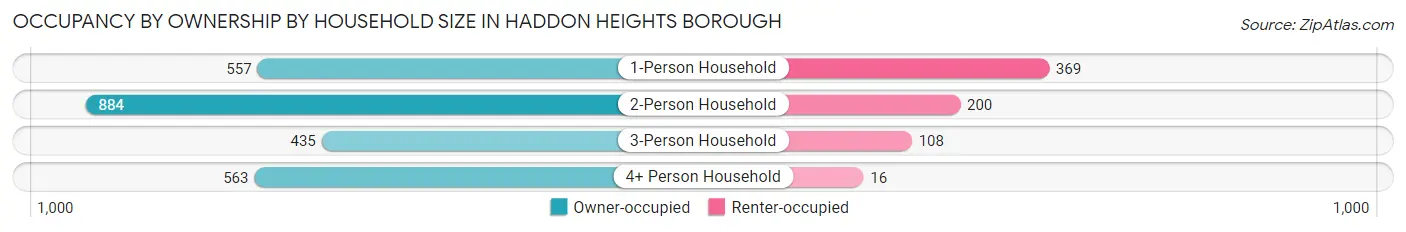
| Household Size | Owner-occupied | Renter-occupied |
| 1-Person Household | 557 (60.2%) | 369 (39.9%) |
| 2-Person Household | 884 (81.6%) | 200 (18.4%) |
| 3-Person Household | 435 (80.1%) | 108 (19.9%) |
| 4+ Person Household | 563 (97.2%) | 16 (2.8%) |
| Total Housing Units | 2,439 (77.9%) | 693 (22.1%) |
Occupancy by Educational Attainment in Haddon Heights borough
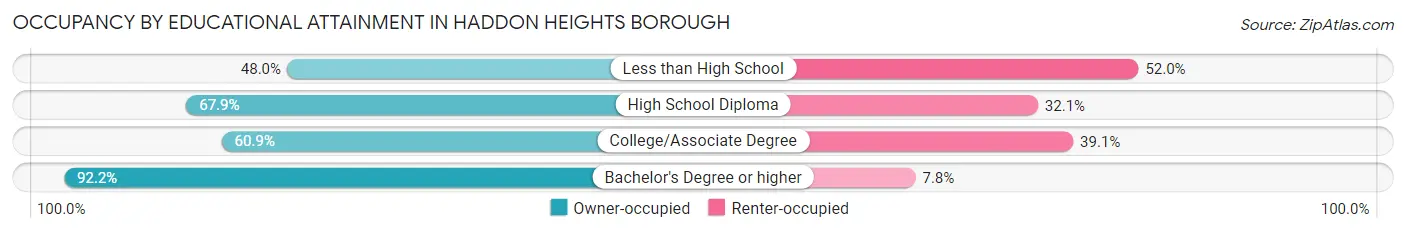
| Household Size | Owner-occupied | Renter-occupied |
| Less than High School | 60 (48.0%) | 65 (52.0%) |
| High School Diploma | 413 (67.9%) | 195 (32.1%) |
| College/Associate Degree | 479 (60.9%) | 307 (39.1%) |
| Bachelor's Degree or higher | 1,487 (92.2%) | 126 (7.8%) |
Occupancy by Age of Householder in Haddon Heights borough
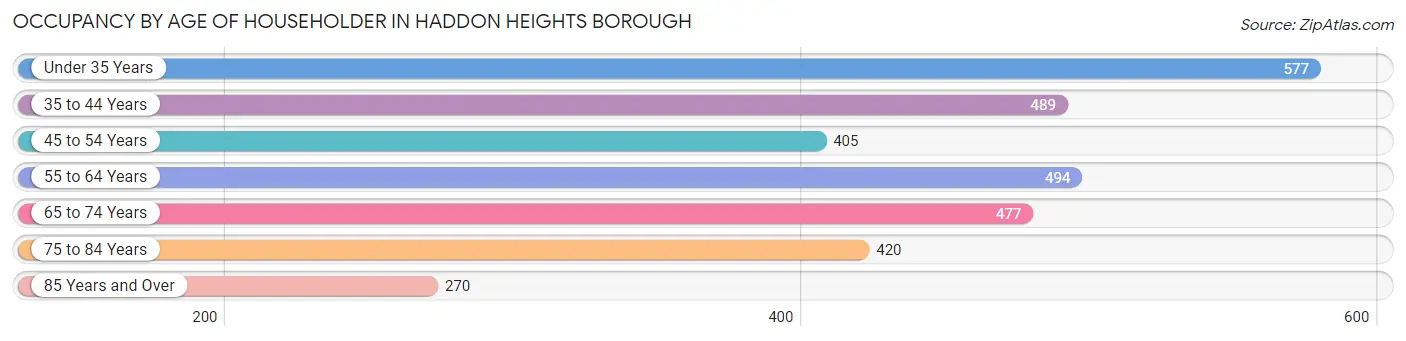
| Age Bracket | # Households | % Households |
| Under 35 Years | 577 | 18.4% |
| 35 to 44 Years | 489 | 15.6% |
| 45 to 54 Years | 405 | 12.9% |
| 55 to 64 Years | 494 | 15.8% |
| 65 to 74 Years | 477 | 15.2% |
| 75 to 84 Years | 420 | 13.4% |
| 85 Years and Over | 270 | 8.6% |
| Total | 3,132 | 100.0% |
Housing Finances in Haddon Heights borough
Median Income by Occupancy in Haddon Heights borough
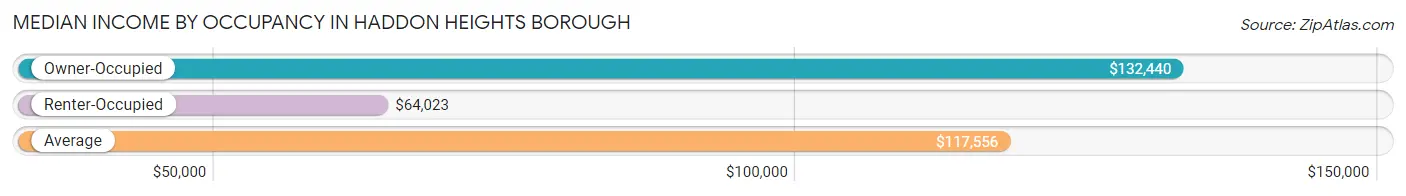
| Occupancy Type | # Households | Median Income |
| Owner-Occupied | 2,439 (77.9%) | $132,440 |
| Renter-Occupied | 693 (22.1%) | $64,023 |
| Average | 3,132 (100.0%) | $117,556 |
Occupancy by Householder Income Bracket in Haddon Heights borough
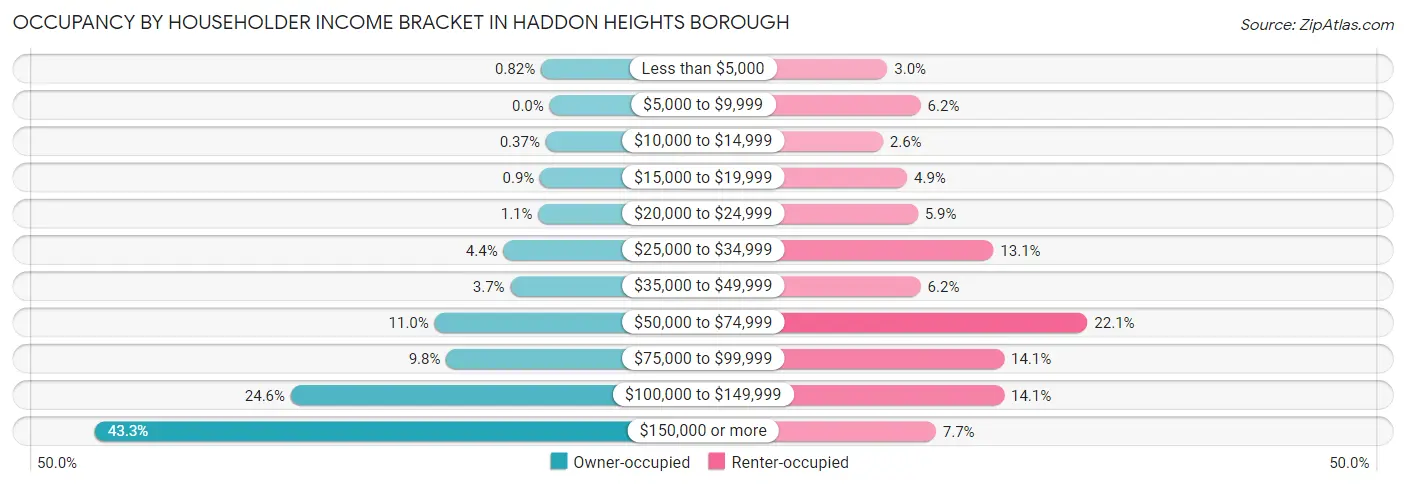
| Income Bracket | Owner-occupied | Renter-occupied |
| Less than $5,000 | 20 (0.8%) | 21 (3.0%) |
| $5,000 to $9,999 | 0 (0.0%) | 43 (6.2%) |
| $10,000 to $14,999 | 9 (0.4%) | 18 (2.6%) |
| $15,000 to $19,999 | 22 (0.9%) | 34 (4.9%) |
| $20,000 to $24,999 | 26 (1.1%) | 41 (5.9%) |
| $25,000 to $34,999 | 107 (4.4%) | 91 (13.1%) |
| $35,000 to $49,999 | 91 (3.7%) | 43 (6.2%) |
| $50,000 to $74,999 | 267 (11.0%) | 153 (22.1%) |
| $75,000 to $99,999 | 240 (9.8%) | 98 (14.1%) |
| $100,000 to $149,999 | 601 (24.6%) | 98 (14.1%) |
| $150,000 or more | 1,056 (43.3%) | 53 (7.6%) |
| Total | 2,439 (100.0%) | 693 (100.0%) |
Monthly Housing Cost Tiers in Haddon Heights borough
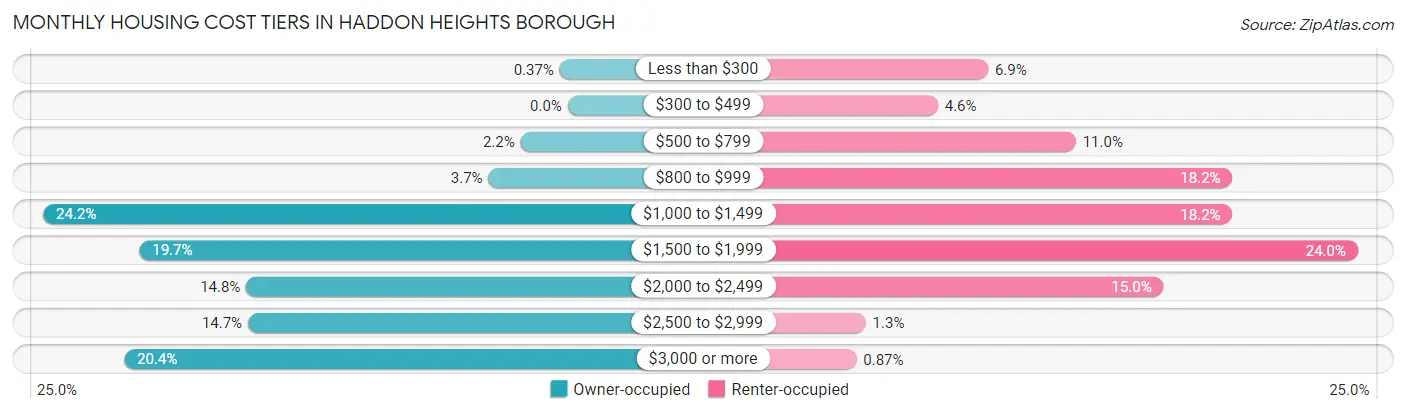
| Monthly Cost | Owner-occupied | Renter-occupied |
| Less than $300 | 9 (0.4%) | 48 (6.9%) |
| $300 to $499 | 0 (0.0%) | 32 (4.6%) |
| $500 to $799 | 53 (2.2%) | 76 (11.0%) |
| $800 to $999 | 89 (3.6%) | 126 (18.2%) |
| $1,000 to $1,499 | 589 (24.1%) | 126 (18.2%) |
| $1,500 to $1,999 | 481 (19.7%) | 166 (23.9%) |
| $2,000 to $2,499 | 361 (14.8%) | 104 (15.0%) |
| $2,500 to $2,999 | 359 (14.7%) | 9 (1.3%) |
| $3,000 or more | 498 (20.4%) | 6 (0.9%) |
| Total | 2,439 (100.0%) | 693 (100.0%) |
Physical Housing Characteristics in Haddon Heights borough
Housing Structures in Haddon Heights borough
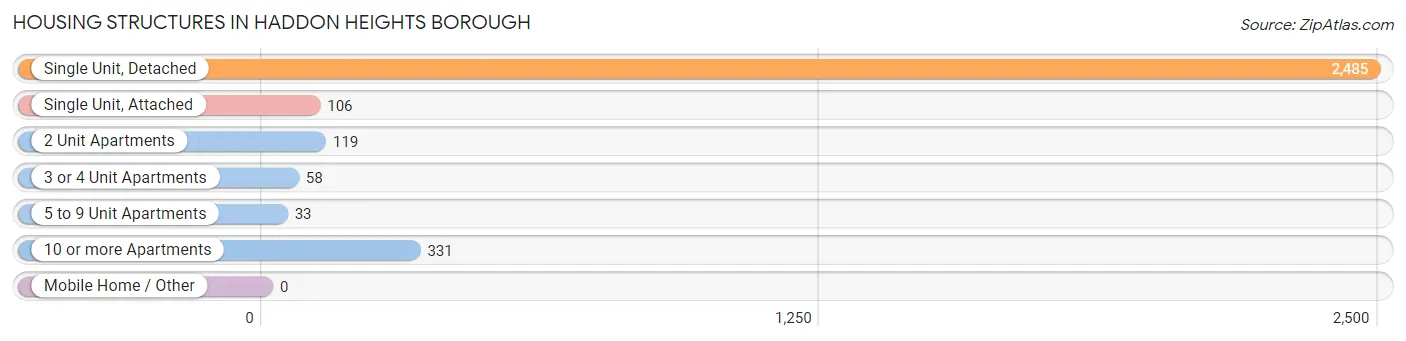
| Structure Type | # Housing Units | % Housing Units |
| Single Unit, Detached | 2,485 | 79.3% |
| Single Unit, Attached | 106 | 3.4% |
| 2 Unit Apartments | 119 | 3.8% |
| 3 or 4 Unit Apartments | 58 | 1.8% |
| 5 to 9 Unit Apartments | 33 | 1.1% |
| 10 or more Apartments | 331 | 10.6% |
| Mobile Home / Other | 0 | 0.0% |
| Total | 3,132 | 100.0% |
Housing Structures by Occupancy in Haddon Heights borough
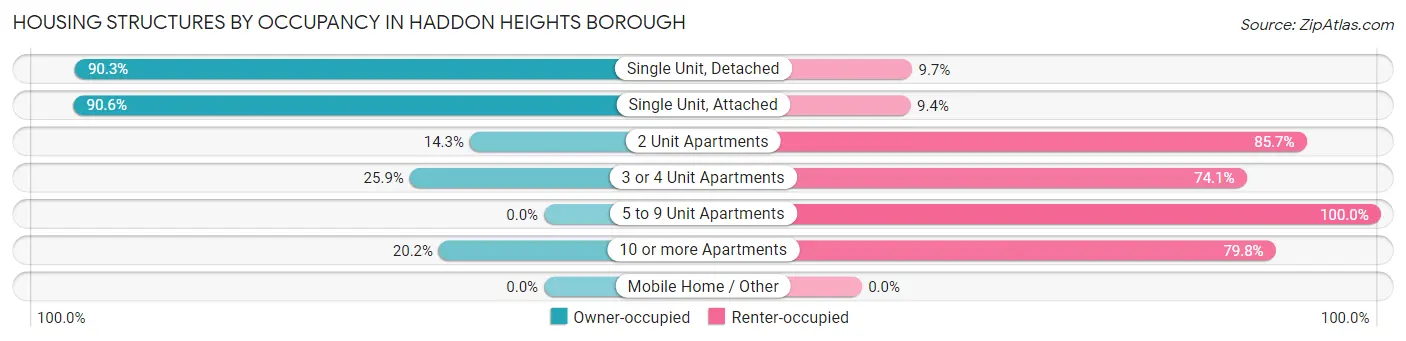
| Structure Type | Owner-occupied | Renter-occupied |
| Single Unit, Detached | 2,244 (90.3%) | 241 (9.7%) |
| Single Unit, Attached | 96 (90.6%) | 10 (9.4%) |
| 2 Unit Apartments | 17 (14.3%) | 102 (85.7%) |
| 3 or 4 Unit Apartments | 15 (25.9%) | 43 (74.1%) |
| 5 to 9 Unit Apartments | 0 (0.0%) | 33 (100.0%) |
| 10 or more Apartments | 67 (20.2%) | 264 (79.8%) |
| Mobile Home / Other | 0 (0.0%) | 0 (0.0%) |
| Total | 2,439 (77.9%) | 693 (22.1%) |
Housing Structures by Number of Rooms in Haddon Heights borough
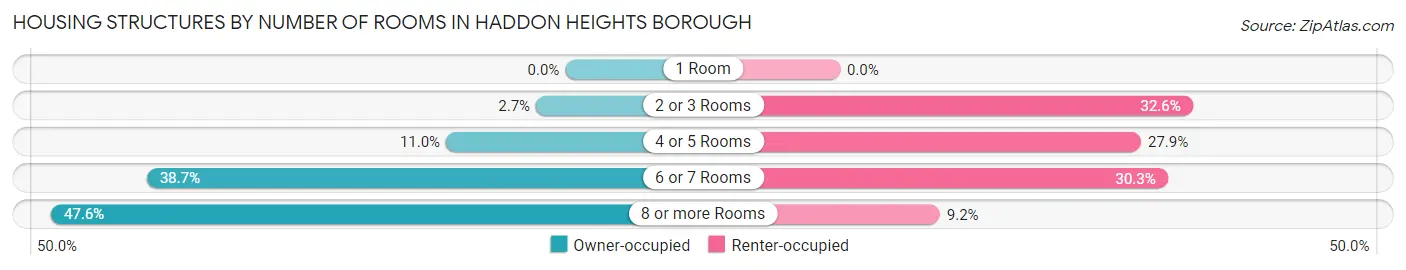
| Number of Rooms | Owner-occupied | Renter-occupied |
| 1 Room | 0 (0.0%) | 0 (0.0%) |
| 2 or 3 Rooms | 66 (2.7%) | 226 (32.6%) |
| 4 or 5 Rooms | 269 (11.0%) | 193 (27.9%) |
| 6 or 7 Rooms | 944 (38.7%) | 210 (30.3%) |
| 8 or more Rooms | 1,160 (47.6%) | 64 (9.2%) |
| Total | 2,439 (100.0%) | 693 (100.0%) |
Housing Structure by Heating Type in Haddon Heights borough
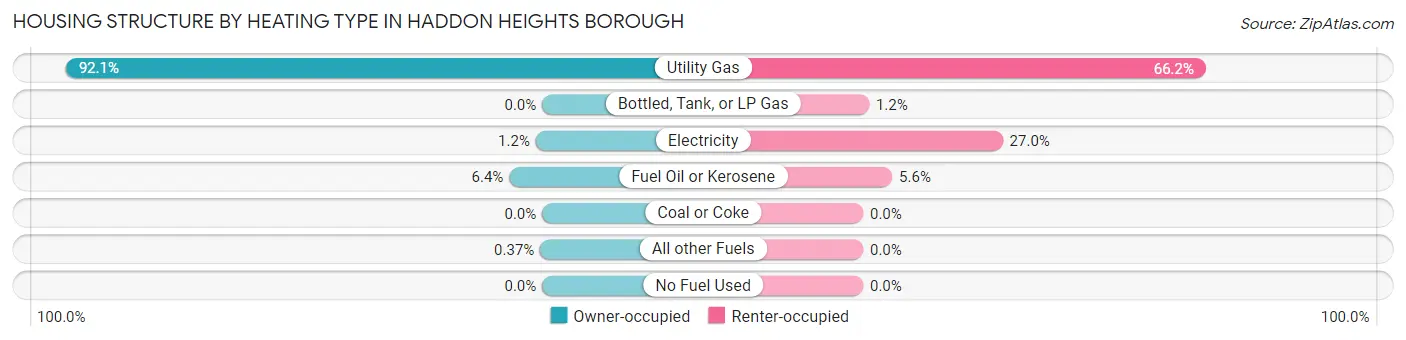
| Heating Type | Owner-occupied | Renter-occupied |
| Utility Gas | 2,245 (92.0%) | 459 (66.2%) |
| Bottled, Tank, or LP Gas | 0 (0.0%) | 8 (1.1%) |
| Electricity | 30 (1.2%) | 187 (27.0%) |
| Fuel Oil or Kerosene | 155 (6.4%) | 39 (5.6%) |
| Coal or Coke | 0 (0.0%) | 0 (0.0%) |
| All other Fuels | 9 (0.4%) | 0 (0.0%) |
| No Fuel Used | 0 (0.0%) | 0 (0.0%) |
| Total | 2,439 (100.0%) | 693 (100.0%) |
Household Vehicle Usage in Haddon Heights borough
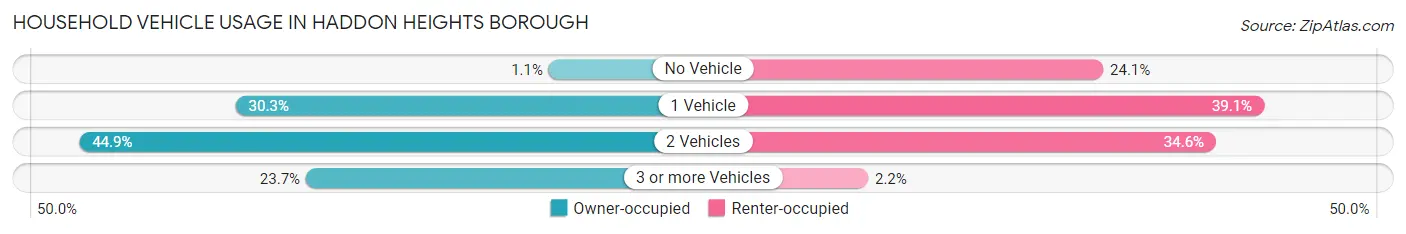
| Vehicles per Household | Owner-occupied | Renter-occupied |
| No Vehicle | 26 (1.1%) | 167 (24.1%) |
| 1 Vehicle | 739 (30.3%) | 271 (39.1%) |
| 2 Vehicles | 1,095 (44.9%) | 240 (34.6%) |
| 3 or more Vehicles | 579 (23.7%) | 15 (2.2%) |
| Total | 2,439 (100.0%) | 693 (100.0%) |
Real Estate & Mortgages in Haddon Heights borough
Real Estate and Mortgage Overview in Haddon Heights borough
| Characteristic | Without Mortgage | With Mortgage |
| Housing Units | 849 | 1,590 |
| Median Property Value | $291,900 | $362,000 |
| Median Household Income | $87,750 | $828 |
| Monthly Housing Costs | $1,275 | $492 |
| Real Estate Taxes | $10,001 | $0 |
Property Value by Mortgage Status in Haddon Heights borough
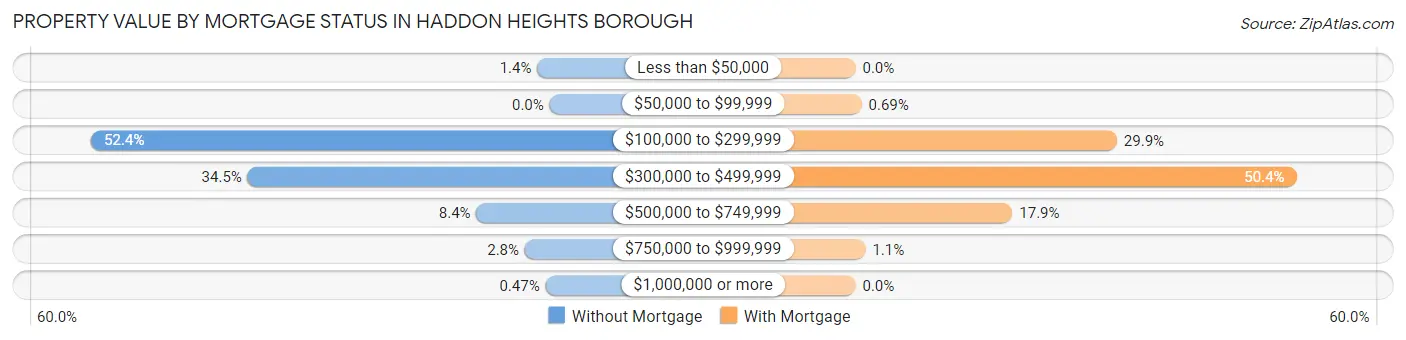
| Property Value | Without Mortgage | With Mortgage |
| Less than $50,000 | 12 (1.4%) | 0 (0.0%) |
| $50,000 to $99,999 | 0 (0.0%) | 11 (0.7%) |
| $100,000 to $299,999 | 445 (52.4%) | 475 (29.9%) |
| $300,000 to $499,999 | 293 (34.5%) | 801 (50.4%) |
| $500,000 to $749,999 | 71 (8.4%) | 285 (17.9%) |
| $750,000 to $999,999 | 24 (2.8%) | 18 (1.1%) |
| $1,000,000 or more | 4 (0.5%) | 0 (0.0%) |
| Total | 849 (100.0%) | 1,590 (100.0%) |
Household Income by Mortgage Status in Haddon Heights borough
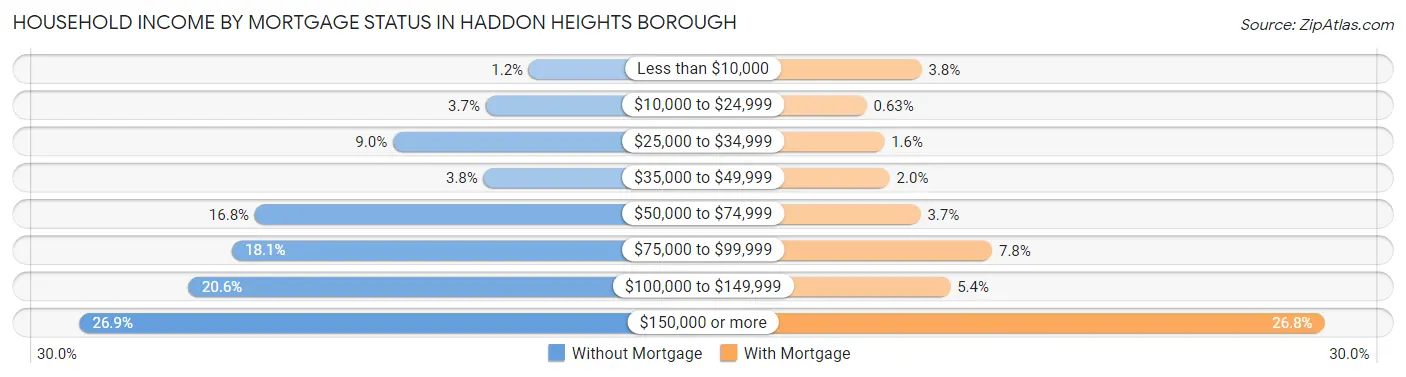
| Household Income | Without Mortgage | With Mortgage |
| Less than $10,000 | 10 (1.2%) | 60 (3.8%) |
| $10,000 to $24,999 | 31 (3.6%) | 10 (0.6%) |
| $25,000 to $34,999 | 76 (8.9%) | 26 (1.6%) |
| $35,000 to $49,999 | 32 (3.8%) | 31 (1.9%) |
| $50,000 to $74,999 | 143 (16.8%) | 59 (3.7%) |
| $75,000 to $99,999 | 154 (18.1%) | 124 (7.8%) |
| $100,000 to $149,999 | 175 (20.6%) | 86 (5.4%) |
| $150,000 or more | 228 (26.9%) | 426 (26.8%) |
| Total | 849 (100.0%) | 1,590 (100.0%) |
Property Value to Household Income Ratio in Haddon Heights borough
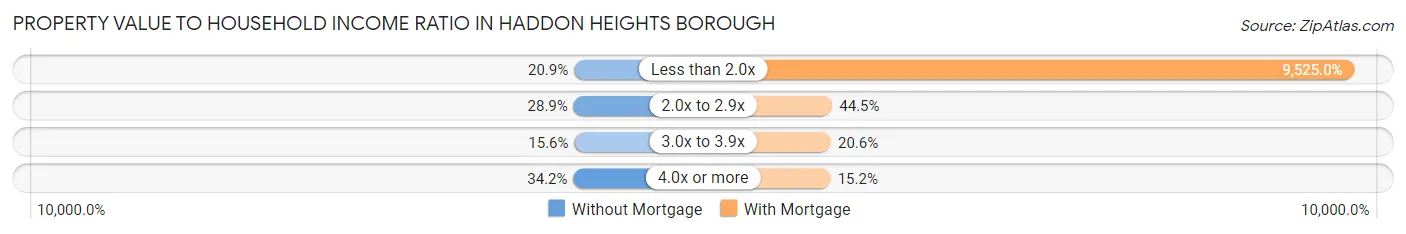
| Value-to-Income Ratio | Without Mortgage | With Mortgage |
| Less than 2.0x | 177 (20.8%) | 151,447 (9,525.0%) |
| 2.0x to 2.9x | 245 (28.9%) | 708 (44.5%) |
| 3.0x to 3.9x | 132 (15.5%) | 328 (20.6%) |
| 4.0x or more | 290 (34.2%) | 241 (15.2%) |
| Total | 849 (100.0%) | 1,590 (100.0%) |
Real Estate Taxes by Mortgage Status in Haddon Heights borough
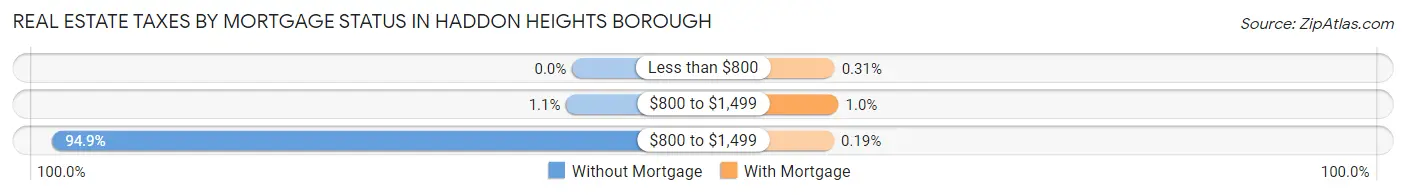
| Property Taxes | Without Mortgage | With Mortgage |
| Less than $800 | 0 (0.0%) | 5 (0.3%) |
| $800 to $1,499 | 9 (1.1%) | 16 (1.0%) |
| $800 to $1,499 | 806 (94.9%) | 3 (0.2%) |
| Total | 849 (100.0%) | 1,590 (100.0%) |
Health & Disability in Haddon Heights borough
Health Insurance Coverage by Age in Haddon Heights borough
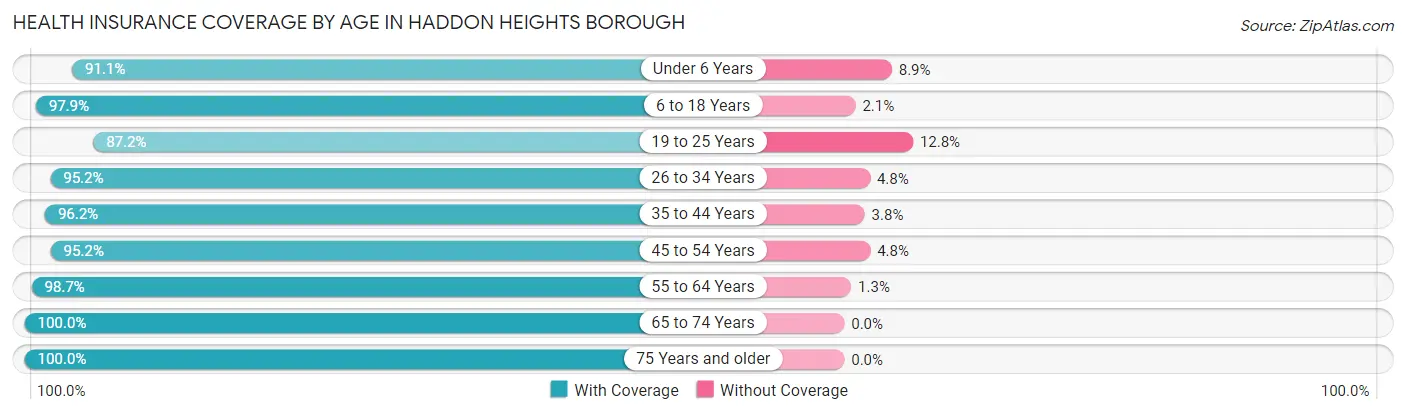
| Age Bracket | With Coverage | Without Coverage |
| Under 6 Years | 494 (91.1%) | 48 (8.9%) |
| 6 to 18 Years | 1,171 (97.9%) | 25 (2.1%) |
| 19 to 25 Years | 361 (87.2%) | 53 (12.8%) |
| 26 to 34 Years | 1,054 (95.2%) | 53 (4.8%) |
| 35 to 44 Years | 861 (96.2%) | 34 (3.8%) |
| 45 to 54 Years | 747 (95.2%) | 38 (4.8%) |
| 55 to 64 Years | 848 (98.7%) | 11 (1.3%) |
| 65 to 74 Years | 803 (100.0%) | 0 (0.0%) |
| 75 Years and older | 883 (100.0%) | 0 (0.0%) |
| Total | 7,222 (96.5%) | 262 (3.5%) |
Health Insurance Coverage by Citizenship Status in Haddon Heights borough
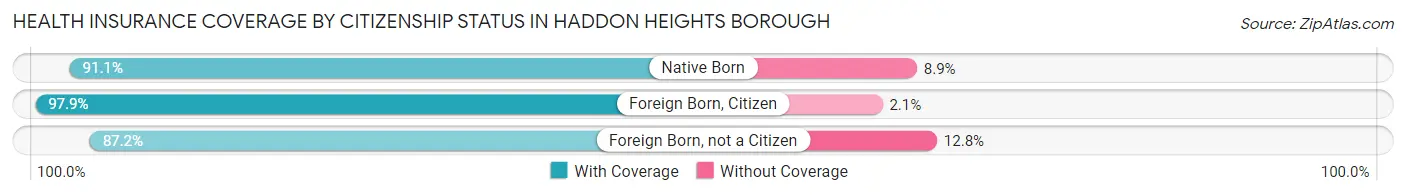
| Citizenship Status | With Coverage | Without Coverage |
| Native Born | 494 (91.1%) | 48 (8.9%) |
| Foreign Born, Citizen | 1,171 (97.9%) | 25 (2.1%) |
| Foreign Born, not a Citizen | 361 (87.2%) | 53 (12.8%) |
Health Insurance Coverage by Household Income in Haddon Heights borough
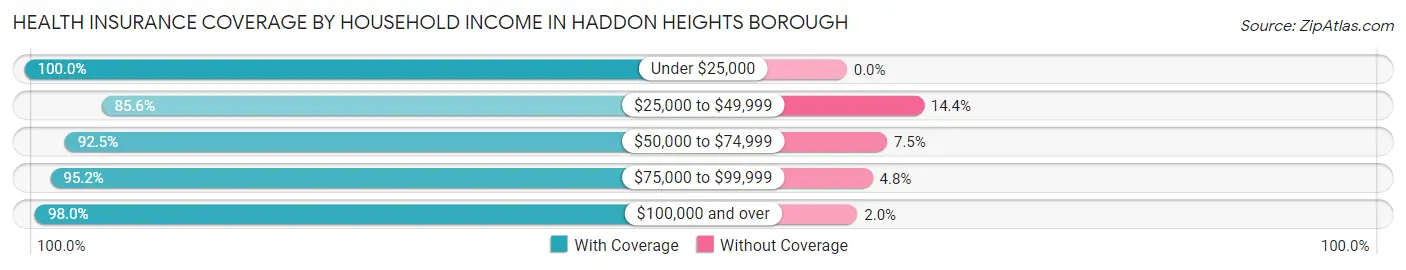
| Household Income | With Coverage | Without Coverage |
| Under $25,000 | 289 (100.0%) | 0 (0.0%) |
| $25,000 to $49,999 | 415 (85.6%) | 70 (14.4%) |
| $50,000 to $74,999 | 736 (92.5%) | 60 (7.5%) |
| $75,000 to $99,999 | 511 (95.2%) | 26 (4.8%) |
| $100,000 and over | 5,256 (98.0%) | 106 (2.0%) |
Public vs Private Health Insurance Coverage by Age in Haddon Heights borough
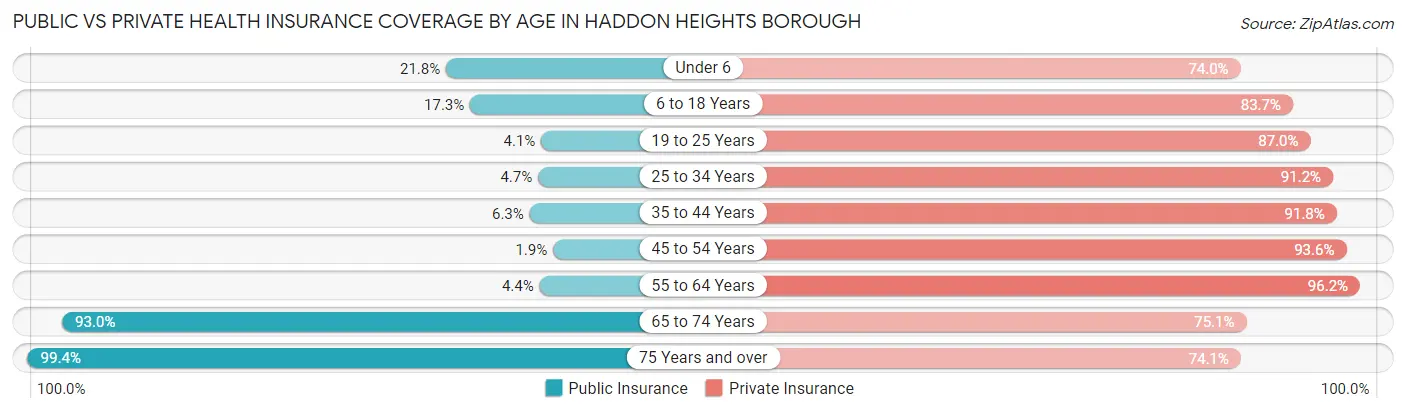
| Age Bracket | Public Insurance | Private Insurance |
| Under 6 | 118 (21.8%) | 401 (74.0%) |
| 6 to 18 Years | 207 (17.3%) | 1,001 (83.7%) |
| 19 to 25 Years | 17 (4.1%) | 360 (87.0%) |
| 25 to 34 Years | 52 (4.7%) | 1,009 (91.1%) |
| 35 to 44 Years | 56 (6.3%) | 822 (91.8%) |
| 45 to 54 Years | 15 (1.9%) | 735 (93.6%) |
| 55 to 64 Years | 38 (4.4%) | 826 (96.2%) |
| 65 to 74 Years | 747 (93.0%) | 603 (75.1%) |
| 75 Years and over | 878 (99.4%) | 654 (74.1%) |
| Total | 2,128 (28.4%) | 6,411 (85.7%) |
Disability Status by Sex by Age in Haddon Heights borough
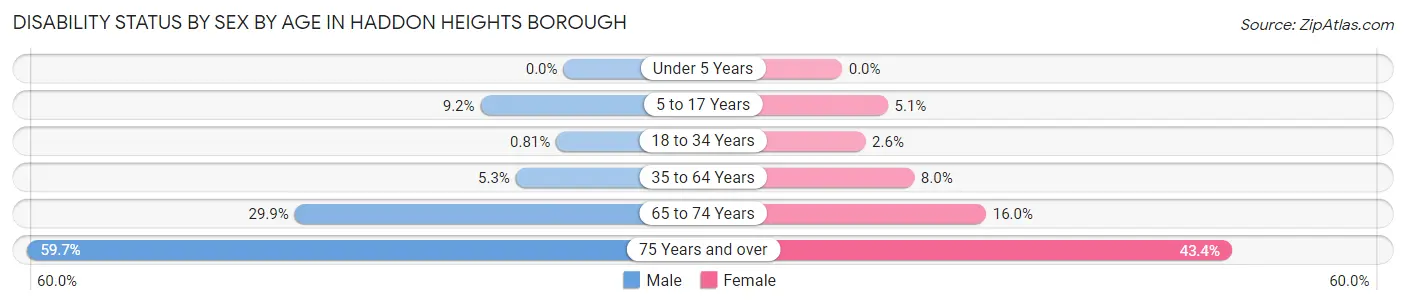
| Age Bracket | Male | Female |
| Under 5 Years | 0 (0.0%) | 0 (0.0%) |
| 5 to 17 Years | 52 (9.2%) | 37 (5.1%) |
| 18 to 34 Years | 7 (0.8%) | 18 (2.6%) |
| 35 to 64 Years | 66 (5.3%) | 104 (8.0%) |
| 65 to 74 Years | 106 (29.9%) | 72 (16.0%) |
| 75 Years and over | 259 (59.7%) | 195 (43.4%) |
Disability Class by Sex by Age in Haddon Heights borough
Disability Class: Hearing Difficulty
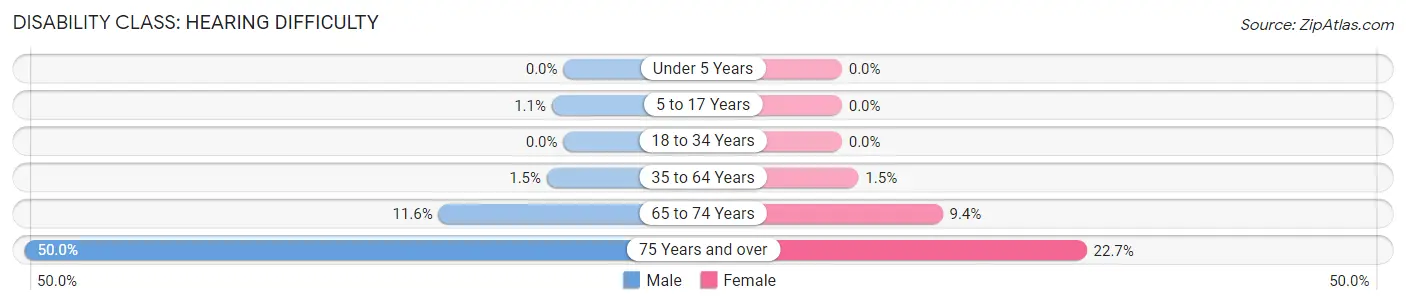
| Age Bracket | Male | Female |
| Under 5 Years | 0 (0.0%) | 0 (0.0%) |
| 5 to 17 Years | 6 (1.1%) | 0 (0.0%) |
| 18 to 34 Years | 0 (0.0%) | 0 (0.0%) |
| 35 to 64 Years | 19 (1.5%) | 20 (1.5%) |
| 65 to 74 Years | 41 (11.6%) | 42 (9.3%) |
| 75 Years and over | 217 (50.0%) | 102 (22.7%) |
Disability Class: Vision Difficulty
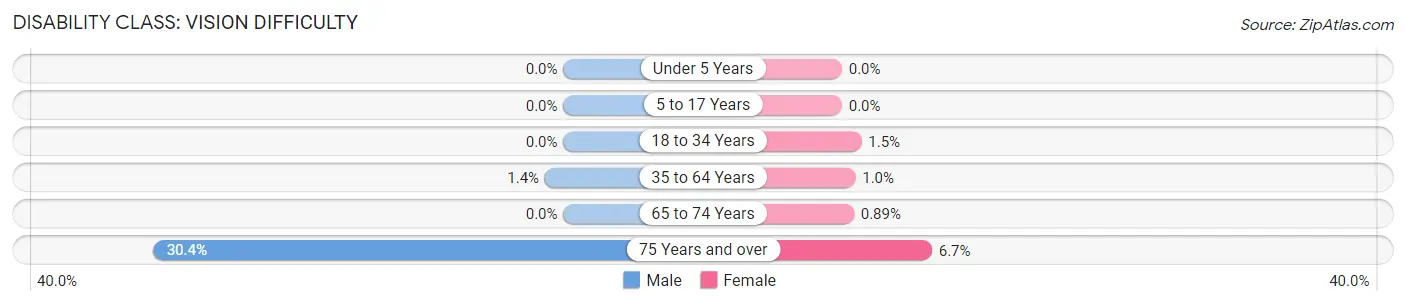
| Age Bracket | Male | Female |
| Under 5 Years | 0 (0.0%) | 0 (0.0%) |
| 5 to 17 Years | 0 (0.0%) | 0 (0.0%) |
| 18 to 34 Years | 0 (0.0%) | 10 (1.5%) |
| 35 to 64 Years | 17 (1.4%) | 13 (1.0%) |
| 65 to 74 Years | 0 (0.0%) | 4 (0.9%) |
| 75 Years and over | 132 (30.4%) | 30 (6.7%) |
Disability Class: Cognitive Difficulty
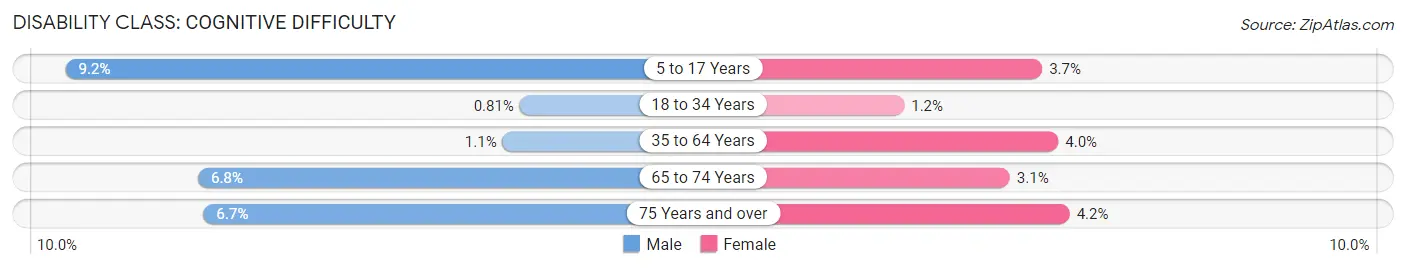
| Age Bracket | Male | Female |
| 5 to 17 Years | 52 (9.2%) | 27 (3.7%) |
| 18 to 34 Years | 7 (0.8%) | 8 (1.2%) |
| 35 to 64 Years | 14 (1.1%) | 52 (4.0%) |
| 65 to 74 Years | 24 (6.8%) | 14 (3.1%) |
| 75 Years and over | 29 (6.7%) | 19 (4.2%) |
Disability Class: Ambulatory Difficulty
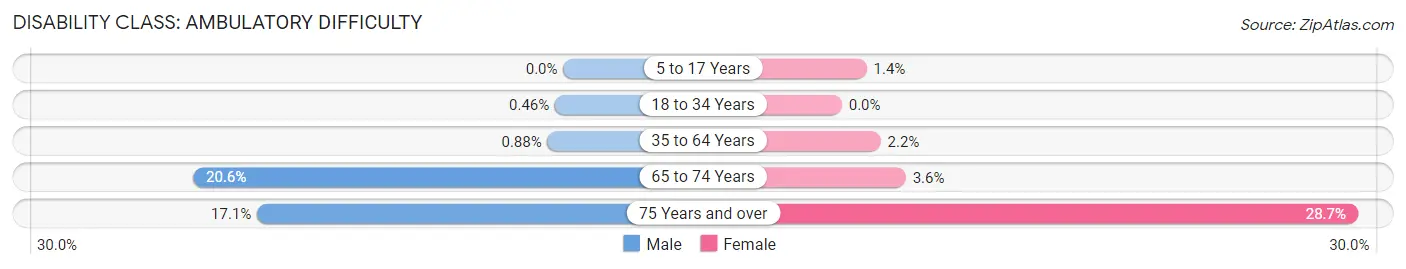
| Age Bracket | Male | Female |
| 5 to 17 Years | 0 (0.0%) | 10 (1.4%) |
| 18 to 34 Years | 4 (0.5%) | 0 (0.0%) |
| 35 to 64 Years | 11 (0.9%) | 28 (2.2%) |
| 65 to 74 Years | 73 (20.6%) | 16 (3.6%) |
| 75 Years and over | 74 (17.1%) | 129 (28.7%) |
Disability Class: Self-Care Difficulty
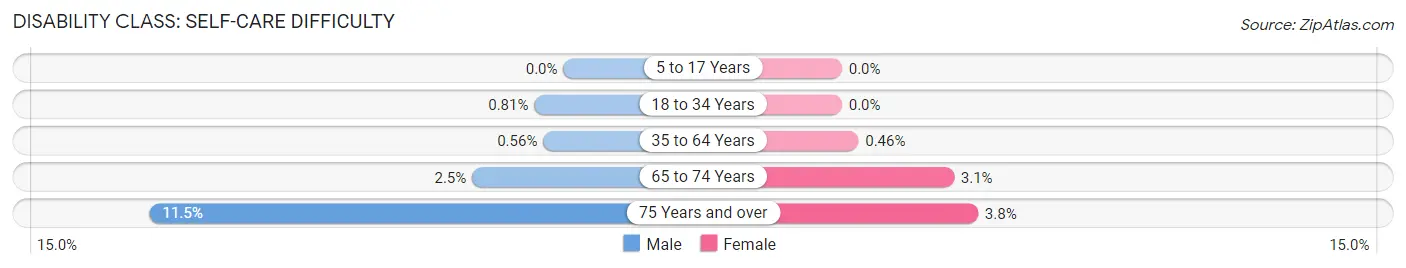
| Age Bracket | Male | Female |
| 5 to 17 Years | 0 (0.0%) | 0 (0.0%) |
| 18 to 34 Years | 7 (0.8%) | 0 (0.0%) |
| 35 to 64 Years | 7 (0.6%) | 6 (0.5%) |
| 65 to 74 Years | 9 (2.5%) | 14 (3.1%) |
| 75 Years and over | 50 (11.5%) | 17 (3.8%) |
Technology Access in Haddon Heights borough
Computing Device Access in Haddon Heights borough
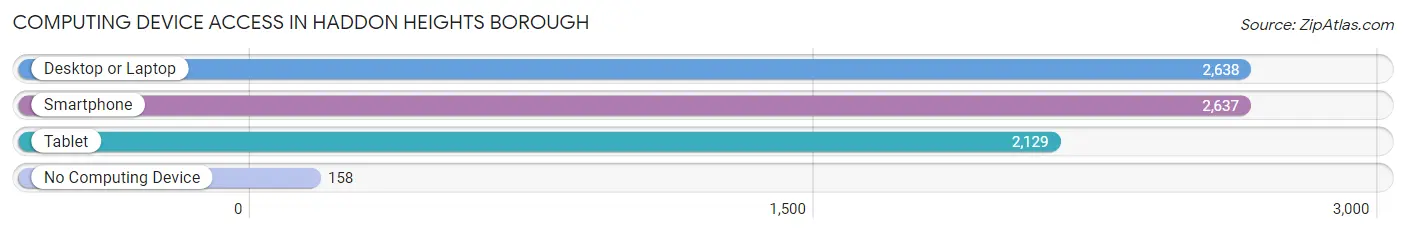
| Device Type | # Households | % Households |
| Desktop or Laptop | 2,638 | 84.2% |
| Smartphone | 2,637 | 84.2% |
| Tablet | 2,129 | 68.0% |
| No Computing Device | 158 | 5.0% |
| Total | 3,132 | 100.0% |
Internet Access in Haddon Heights borough
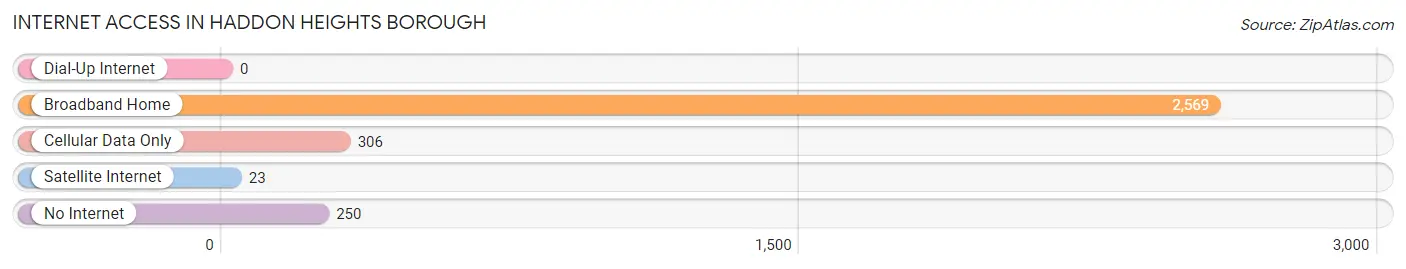
| Internet Type | # Households | % Households |
| Dial-Up Internet | 0 | 0.0% |
| Broadband Home | 2,569 | 82.0% |
| Cellular Data Only | 306 | 9.8% |
| Satellite Internet | 23 | 0.7% |
| No Internet | 250 | 8.0% |
| Total | 3,132 | 100.0% |
Haddon Heights borough Summary
Haddon Heights Borough is a small borough located in Camden County, New Jersey. It is situated on the eastern side of the county, just south of the city of Camden. The borough is bordered by Barrington, Lawnside, and Magnolia to the north, Haddon Township to the east, and Audubon Park to the south. The borough has a total area of 1.2 square miles, all of which is land.
History
Haddon Heights was first settled in the late 1600s by English Quakers. The area was originally known as the “Haddonfield Heights” and was part of the larger Haddonfield Township. In 1894, the area was incorporated as the Borough of Haddon Heights. The borough was named after the Haddon family, who were prominent landowners in the area.
The borough was primarily a rural farming community until the early 1900s, when it began to experience rapid growth due to its proximity to the city of Camden. The borough was home to several factories, including the Haddon Heights Manufacturing Company, which produced a variety of products, including paper, textiles, and leather goods.
The borough continued to grow throughout the 20th century, and by the 2000s, it had become a largely residential community. The borough is now home to a variety of businesses, including restaurants, retail stores, and professional services.
Geography
Haddon Heights is located in the eastern part of Camden County, just south of the city of Camden. The borough is bordered by Barrington, Lawnside, and Magnolia to the north, Haddon Township to the east, and Audubon Park to the south. The borough has a total area of 1.2 square miles, all of which is land.
The borough is located in the Atlantic Coastal Plain, and is characterized by flat terrain. The borough is located in the Pine Barrens, and is home to a variety of plant and animal species. The borough is also home to several creeks, including the Cooper River, which flows through the borough.
Economy
Haddon Heights is a largely residential community, and the majority of its residents are employed in the service sector. The borough is home to a variety of businesses, including restaurants, retail stores, and professional services. The borough is also home to several manufacturing companies, including the Haddon Heights Manufacturing Company, which produces a variety of products, including paper, textiles, and leather goods.
Demographics
As of the 2010 census, Haddon Heights had a population of 7,473. The racial makeup of the borough was 87.3% White, 8.2% African American, 0.4% Native American, 1.3% Asian, and 2.8% from other races. Hispanic or Latino of any race were 5.2% of the population.
The median household income in the borough was $71,945, and the median family income was $86,945. The per capita income in the borough was $32,945. About 4.3% of families and 5.7% of the population were below the poverty line.
Haddon Heights is a small borough with a rich history and a diverse population. The borough is home to a variety of businesses, and its residents are employed in a variety of industries. The borough is also home to several parks and recreational areas, making it an ideal place to live and work.
Common Questions
What is Per Capita Income in Haddon Heights borough?
Per Capita income in Haddon Heights borough is $59,798.
What is the Median Family Income in Haddon Heights borough?
Median Family Income in Haddon Heights borough is $145,761.
What is the Median Household income in Haddon Heights borough?
Median Household Income in Haddon Heights borough is $117,556.
What is Income or Wage Gap in Haddon Heights borough?
Income or Wage Gap in Haddon Heights borough is 30.1%.
Women in Haddon Heights borough earn 69.9 cents for every dollar earned by a man.
What is Inequality or Gini Index in Haddon Heights borough?
Inequality or Gini Index in Haddon Heights borough is 0.41.
What is the Total Population of Haddon Heights borough?
Total Population of Haddon Heights borough is 7,484.
What is the Total Male Population of Haddon Heights borough?
Total Male Population of Haddon Heights borough is 3,721.
What is the Total Female Population of Haddon Heights borough?
Total Female Population of Haddon Heights borough is 3,763.
What is the Ratio of Males per 100 Females in Haddon Heights borough?
There are 98.88 Males per 100 Females in Haddon Heights borough.
What is the Ratio of Females per 100 Males in Haddon Heights borough?
There are 101.13 Females per 100 Males in Haddon Heights borough.
What is the Median Population Age in Haddon Heights borough?
Median Population Age in Haddon Heights borough is 39.1 Years.
What is the Average Family Size in Haddon Heights borough
Average Family Size in Haddon Heights borough is 3.0 People.
What is the Average Household Size in Haddon Heights borough
Average Household Size in Haddon Heights borough is 2.4 People.
How Large is the Labor Force in Haddon Heights borough?
There are 4,175 People in the Labor Forcein in Haddon Heights borough.
What is the Percentage of People in the Labor Force in Haddon Heights borough?
70.7% of People are in the Labor Force in Haddon Heights borough.
What is the Unemployment Rate in Haddon Heights borough?
Unemployment Rate in Haddon Heights borough is 4.6%.