Stewartsville, NJ Map & Demographics
Stewartsville Map
Stewartsville Overview
$64,169
PER CAPITA INCOME
$186,477
AVG FAMILY INCOME
$149,417
AVG HOUSEHOLD INCOME
38.4%
WAGE / INCOME GAP [ % ]
61.6¢/ $1
WAGE / INCOME GAP [ $ ]
0.36
INEQUALITY / GINI INDEX
616
TOTAL POPULATION
243
MALE POPULATION
373
FEMALE POPULATION
65.15
MALES / 100 FEMALES
153.50
FEMALES / 100 MALES
41.3
MEDIAN AGE
2.8
AVG FAMILY SIZE
2.5
AVG HOUSEHOLD SIZE
368
LABOR FORCE [ PEOPLE ]
78.3%
PERCENT IN LABOR FORCE
5.4%
UNEMPLOYMENT RATE
Stewartsville Zip Codes
Stewartsville Area Codes
Income in Stewartsville
Income Overview in Stewartsville
Per Capita Income in Stewartsville is $64,169, while median incomes of families and households are $186,477 and $149,417 respectively.
| Characteristic | Number | Measure |
| Per Capita Income | 616 | $64,169 |
| Median Family Income | 181 | $186,477 |
| Mean Family Income | 181 | $179,556 |
| Median Household Income | 251 | $149,417 |
| Mean Household Income | 251 | $161,912 |
| Income Deficit | 181 | $0 |
| Wage / Income Gap (%) | 616 | 38.36% |
| Wage / Income Gap ($) | 616 | 61.64¢ per $1 |
| Gini / Inequality Index | 616 | 0.36 |
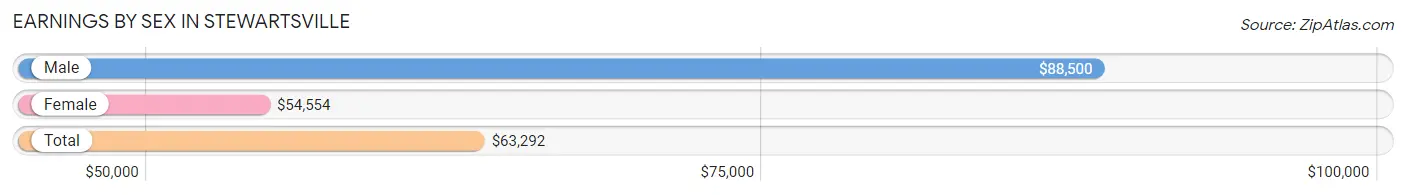
Earnings by Sex in Stewartsville
Average Earnings in Stewartsville are $63,292, $88,500 for men and $54,554 for women, a difference of 38.4%.
| Sex | Number | Average Earnings |
| Male | 158 (40.0%) | $88,500 |
| Female | 237 (60.0%) | $54,554 |
| Total | 395 (100.0%) | $63,292 |
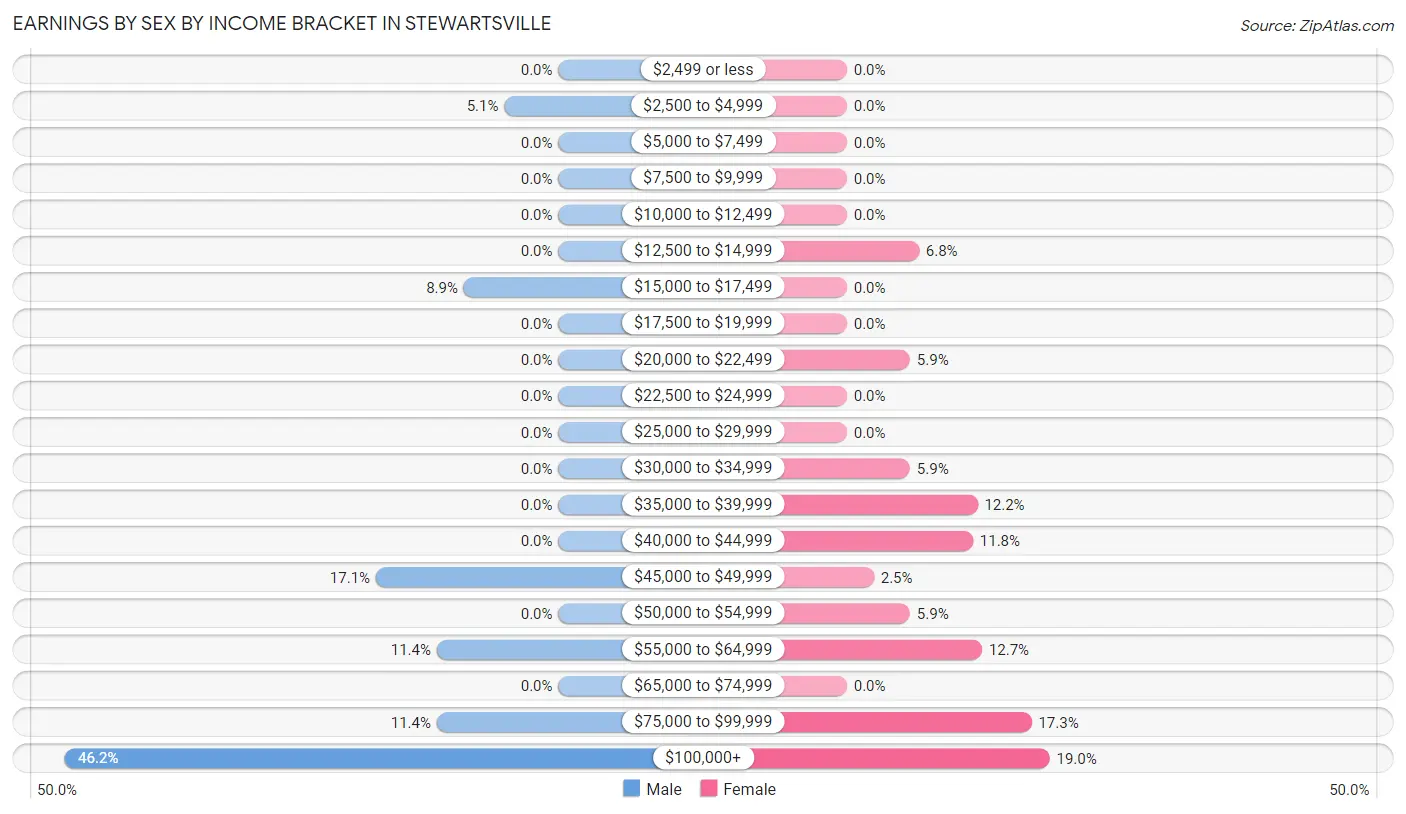
Earnings by Sex by Income Bracket in Stewartsville
The most common earnings brackets in Stewartsville are $100,000+ for men (73 | 46.2%) and $100,000+ for women (45 | 19.0%).
| Income | Male | Female |
| $2,499 or less | 0 (0.0%) | 0 (0.0%) |
| $2,500 to $4,999 | 8 (5.1%) | 0 (0.0%) |
| $5,000 to $7,499 | 0 (0.0%) | 0 (0.0%) |
| $7,500 to $9,999 | 0 (0.0%) | 0 (0.0%) |
| $10,000 to $12,499 | 0 (0.0%) | 0 (0.0%) |
| $12,500 to $14,999 | 0 (0.0%) | 16 (6.8%) |
| $15,000 to $17,499 | 14 (8.9%) | 0 (0.0%) |
| $17,500 to $19,999 | 0 (0.0%) | 0 (0.0%) |
| $20,000 to $22,499 | 0 (0.0%) | 14 (5.9%) |
| $22,500 to $24,999 | 0 (0.0%) | 0 (0.0%) |
| $25,000 to $29,999 | 0 (0.0%) | 0 (0.0%) |
| $30,000 to $34,999 | 0 (0.0%) | 14 (5.9%) |
| $35,000 to $39,999 | 0 (0.0%) | 29 (12.2%) |
| $40,000 to $44,999 | 0 (0.0%) | 28 (11.8%) |
| $45,000 to $49,999 | 27 (17.1%) | 6 (2.5%) |
| $50,000 to $54,999 | 0 (0.0%) | 14 (5.9%) |
| $55,000 to $64,999 | 18 (11.4%) | 30 (12.7%) |
| $65,000 to $74,999 | 0 (0.0%) | 0 (0.0%) |
| $75,000 to $99,999 | 18 (11.4%) | 41 (17.3%) |
| $100,000+ | 73 (46.2%) | 45 (19.0%) |
| Total | 158 (100.0%) | 237 (100.0%) |
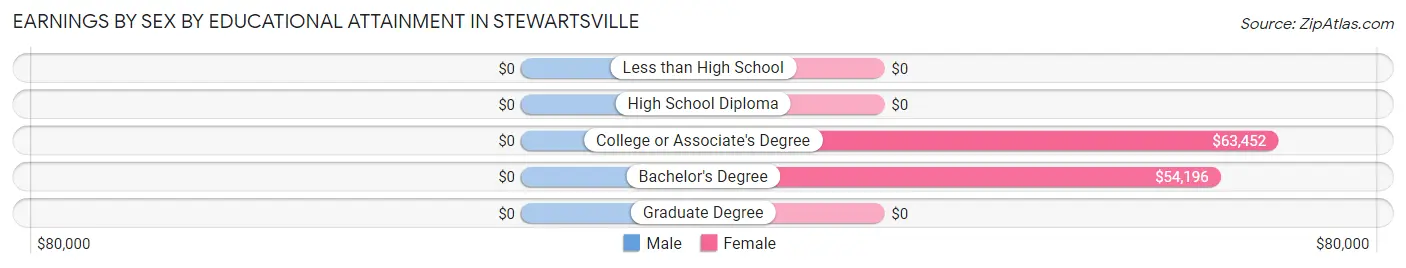
Earnings by Sex by Educational Attainment in Stewartsville
| Educational Attainment | Male Income | Female Income |
| Less than High School | - | - |
| High School Diploma | - | - |
| College or Associate's Degree | - | - |
| Bachelor's Degree | - | - |
| Graduate Degree | - | - |
| Total | $103,375 | $59,861 |
Family Income in Stewartsville
Family Income Brackets in Stewartsville
According to the Stewartsville family income data, there are 86 families falling into the $200,000+ income range, which is the most common income bracket and makes up 47.5% of all families.
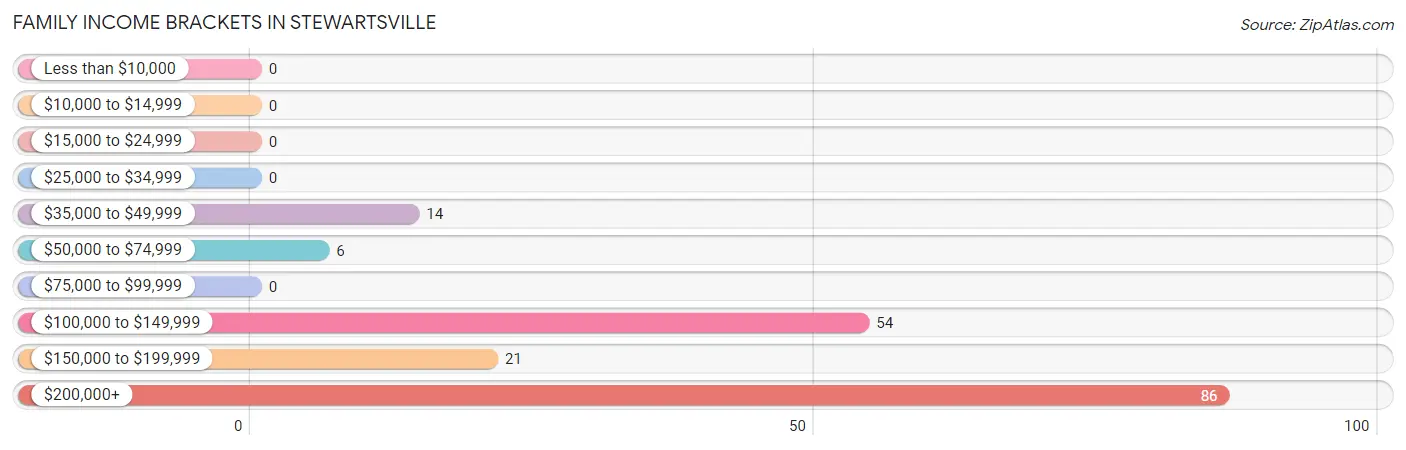
| Income Bracket | # Families | % Families |
| Less than $10,000 | 0 | 0.0% |
| $10,000 to $14,999 | 0 | 0.0% |
| $15,000 to $24,999 | 0 | 0.0% |
| $25,000 to $34,999 | 0 | 0.0% |
| $35,000 to $49,999 | 14 | 7.7% |
| $50,000 to $74,999 | 6 | 3.3% |
| $75,000 to $99,999 | 0 | 0.0% |
| $100,000 to $149,999 | 54 | 29.8% |
| $150,000 to $199,999 | 21 | 11.6% |
| $200,000+ | 86 | 47.5% |
Family Income by Famaliy Size in Stewartsville
3-person families (78 | 43.1%) account for the highest median family income in Stewartsville with $220,357 per family, while 3-person families (78 | 43.1%) have the highest median income of $73,452 per family member.
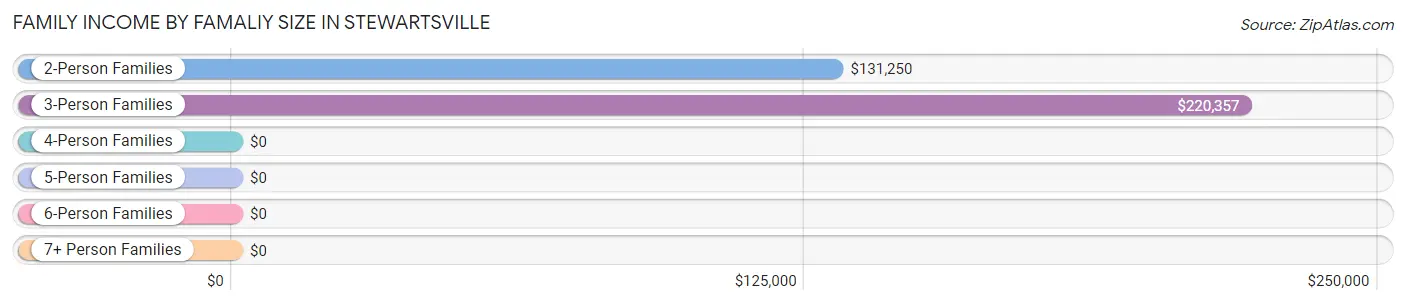
| Income Bracket | # Families | Median Income |
| 2-Person Families | 72 (39.8%) | $131,250 |
| 3-Person Families | 78 (43.1%) | $220,357 |
| 4-Person Families | 15 (8.3%) | $0 |
| 5-Person Families | 16 (8.8%) | $0 |
| 6-Person Families | 0 (0.0%) | $0 |
| 7+ Person Families | 0 (0.0%) | $0 |
| Total | 181 (100.0%) | $186,477 |
Family Income by Number of Earners in Stewartsville
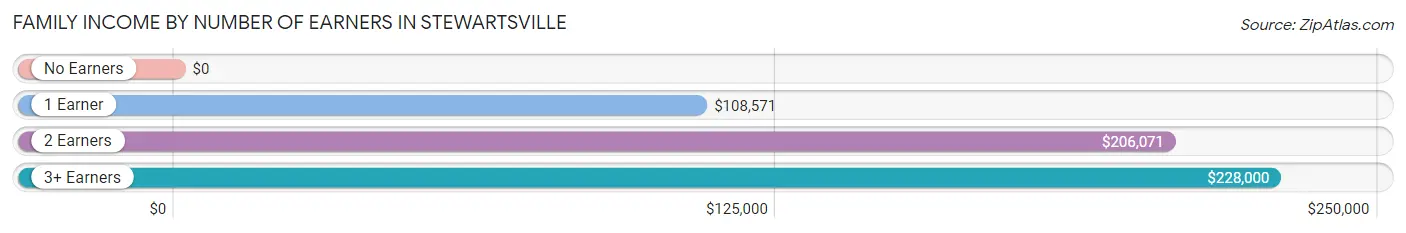
| Number of Earners | # Families | Median Income |
| No Earners | 7 (3.9%) | $0 |
| 1 Earner | 46 (25.4%) | $108,571 |
| 2 Earners | 78 (43.1%) | $206,071 |
| 3+ Earners | 50 (27.6%) | $228,000 |
| Total | 181 (100.0%) | $186,477 |
Household Income in Stewartsville
Household Income Brackets in Stewartsville
With 101 households falling in the category, the $200,000+ income range is the most frequent in Stewartsville, accounting for 40.2% of all households.
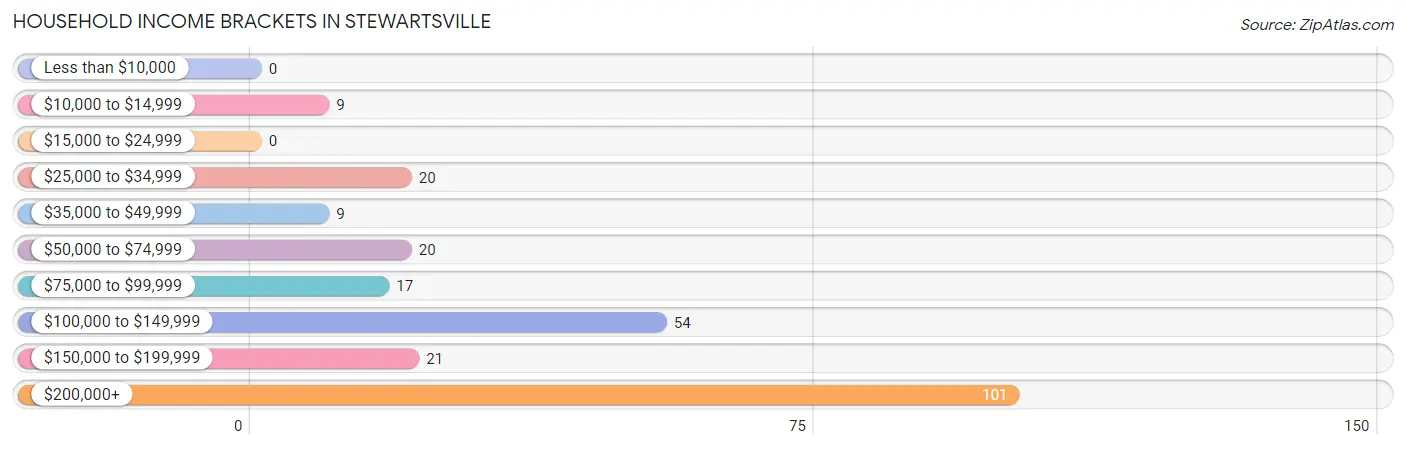
| Income Bracket | # Households | % Households |
| Less than $10,000 | 0 | 0.0% |
| $10,000 to $14,999 | 9 | 3.6% |
| $15,000 to $24,999 | 0 | 0.0% |
| $25,000 to $34,999 | 20 | 8.0% |
| $35,000 to $49,999 | 9 | 3.6% |
| $50,000 to $74,999 | 20 | 8.0% |
| $75,000 to $99,999 | 17 | 6.8% |
| $100,000 to $149,999 | 54 | 21.5% |
| $150,000 to $199,999 | 21 | 8.4% |
| $200,000+ | 101 | 40.2% |
Household Income by Householder Age in Stewartsville
The median household income in Stewartsville is $149,417, with the highest median household income of $222,232 found in the 45 to 64 years age bracket for the primary householder. A total of 117 households (46.6%) fall into this category.
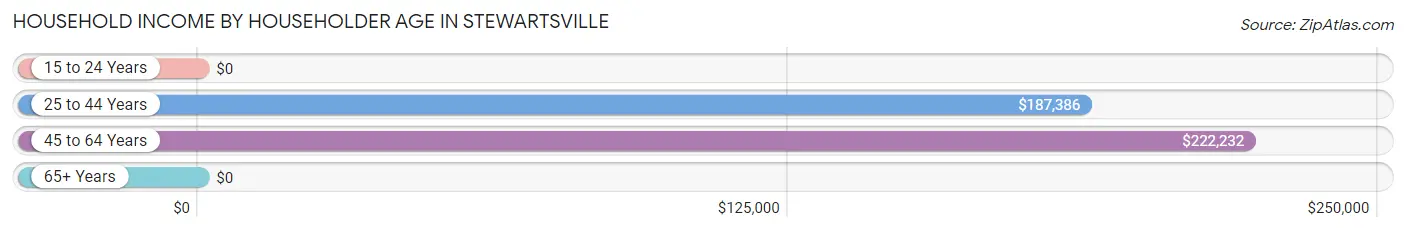
| Income Bracket | # Households | Median Income |
| 15 to 24 Years | 0 (0.0%) | $0 |
| 25 to 44 Years | 61 (24.3%) | $187,386 |
| 45 to 64 Years | 117 (46.6%) | $222,232 |
| 65+ Years | 73 (29.1%) | $0 |
| Total | 251 (100.0%) | $149,417 |
Poverty in Stewartsville
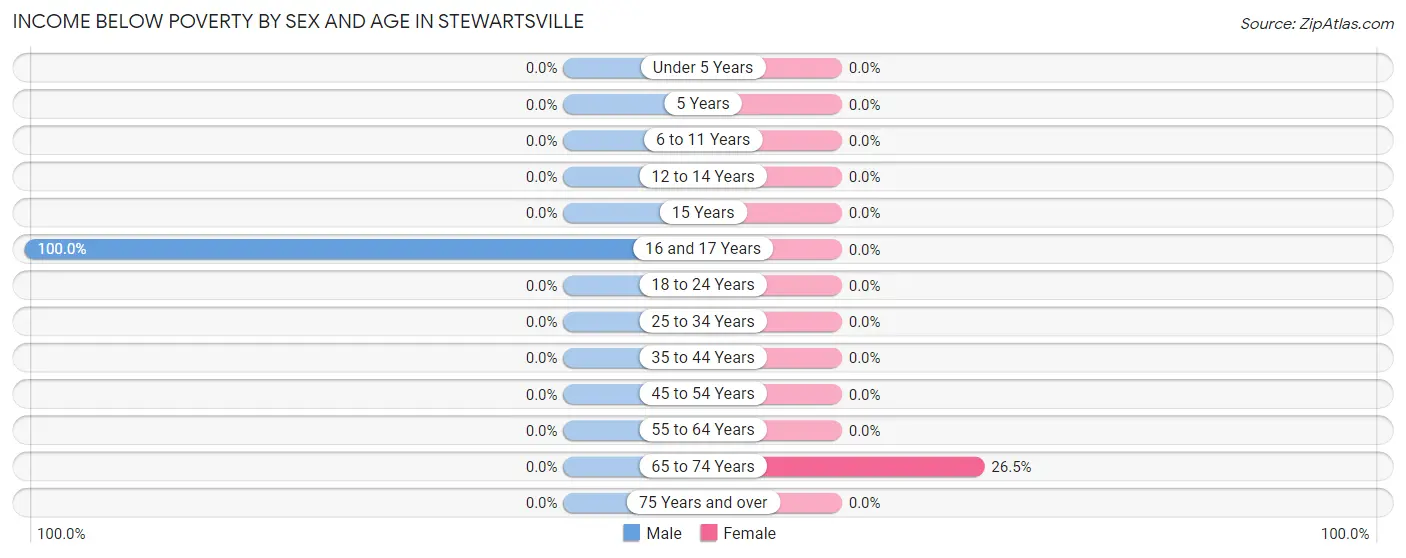
Income Below Poverty by Sex and Age in Stewartsville
With 5.8% poverty level for males and 2.4% for females among the residents of Stewartsville, 16 and 17 year old males and 65 to 74 year old females are the most vulnerable to poverty, with 14 males (100.0%) and 9 females (26.5%) in their respective age groups living below the poverty level.
| Age Bracket | Male | Female |
| Under 5 Years | 0 (0.0%) | 0 (0.0%) |
| 5 Years | 0 (0.0%) | 0 (0.0%) |
| 6 to 11 Years | 0 (0.0%) | 0 (0.0%) |
| 12 to 14 Years | 0 (0.0%) | 0 (0.0%) |
| 15 Years | 0 (0.0%) | 0 (0.0%) |
| 16 and 17 Years | 14 (100.0%) | 0 (0.0%) |
| 18 to 24 Years | 0 (0.0%) | 0 (0.0%) |
| 25 to 34 Years | 0 (0.0%) | 0 (0.0%) |
| 35 to 44 Years | 0 (0.0%) | 0 (0.0%) |
| 45 to 54 Years | 0 (0.0%) | 0 (0.0%) |
| 55 to 64 Years | 0 (0.0%) | 0 (0.0%) |
| 65 to 74 Years | 0 (0.0%) | 9 (26.5%) |
| 75 Years and over | 0 (0.0%) | 0 (0.0%) |
| Total | 14 (5.8%) | 9 (2.4%) |
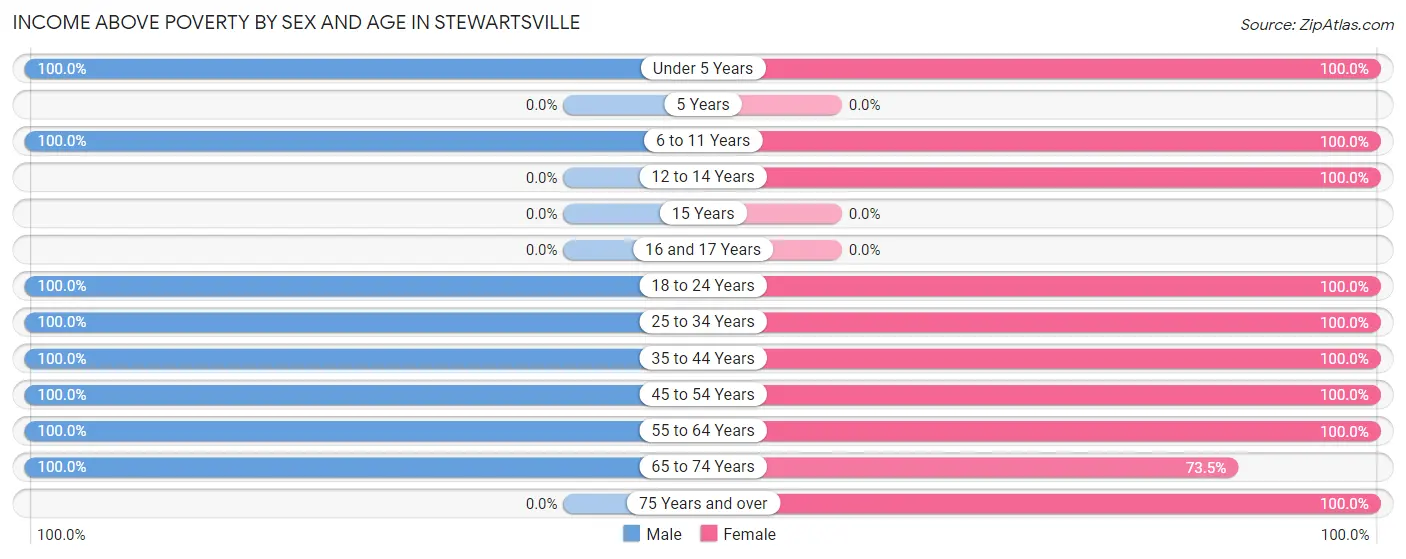
Income Above Poverty by Sex and Age in Stewartsville
According to the poverty statistics in Stewartsville, males aged under 5 years and females aged under 5 years are the age groups that are most secure financially, with 100.0% of males and 100.0% of females in these age groups living above the poverty line.
| Age Bracket | Male | Female |
| Under 5 Years | 31 (100.0%) | 13 (100.0%) |
| 5 Years | 0 (0.0%) | 0 (0.0%) |
| 6 to 11 Years | 24 (100.0%) | 51 (100.0%) |
| 12 to 14 Years | 0 (0.0%) | 27 (100.0%) |
| 15 Years | 0 (0.0%) | 0 (0.0%) |
| 16 and 17 Years | 0 (0.0%) | 0 (0.0%) |
| 18 to 24 Years | 19 (100.0%) | 22 (100.0%) |
| 25 to 34 Years | 14 (100.0%) | 38 (100.0%) |
| 35 to 44 Years | 33 (100.0%) | 56 (100.0%) |
| 45 to 54 Years | 40 (100.0%) | 59 (100.0%) |
| 55 to 64 Years | 34 (100.0%) | 53 (100.0%) |
| 65 to 74 Years | 34 (100.0%) | 25 (73.5%) |
| 75 Years and over | 0 (0.0%) | 20 (100.0%) |
| Total | 229 (94.2%) | 364 (97.6%) |
Income Below Poverty Among Married-Couple Families in Stewartsville
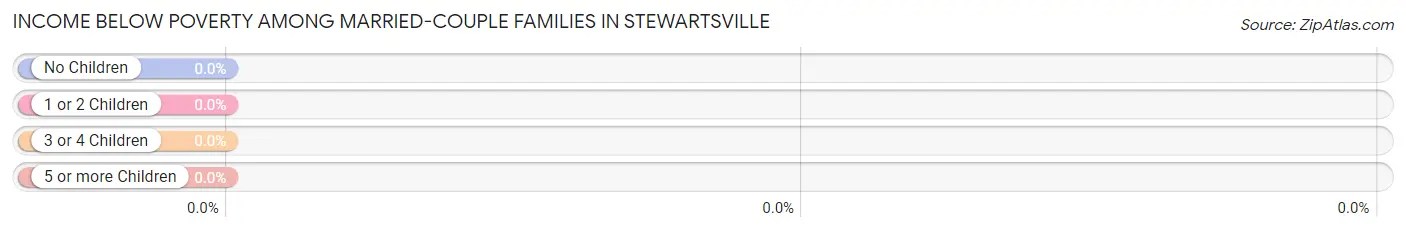
| Children | Above Poverty | Below Poverty |
| No Children | 75 (100.0%) | 0 (0.0%) |
| 1 or 2 Children | 29 (100.0%) | 0 (0.0%) |
| 3 or 4 Children | 16 (100.0%) | 0 (0.0%) |
| 5 or more Children | 0 (0.0%) | 0 (0.0%) |
| Total | 120 (100.0%) | 0 (0.0%) |
Income Below Poverty Among Single-Parent Households in Stewartsville
| Children | Single Father | Single Mother |
| No Children | 0 (0.0%) | 0 (0.0%) |
| 1 or 2 Children | 0 (0.0%) | 0 (0.0%) |
| 3 or 4 Children | 0 (0.0%) | 0 (0.0%) |
| 5 or more Children | 0 (0.0%) | 0 (0.0%) |
| Total | 0 (0.0%) | 0 (0.0%) |
Income Below Poverty Among Married-Couple vs Single-Parent Households in Stewartsville
| Children | Married-Couple Families | Single-Parent Households |
| No Children | 0 (0.0%) | 0 (0.0%) |
| 1 or 2 Children | 0 (0.0%) | 0 (0.0%) |
| 3 or 4 Children | 0 (0.0%) | 0 (0.0%) |
| 5 or more Children | 0 (0.0%) | 0 (0.0%) |
| Total | 0 (0.0%) | 0 (0.0%) |
Race in Stewartsville
The most populous races in Stewartsville are White / Caucasian (586 | 95.1%), Hispanic or Latino (30 | 4.9%), and Two or more Races (30 | 4.9%).
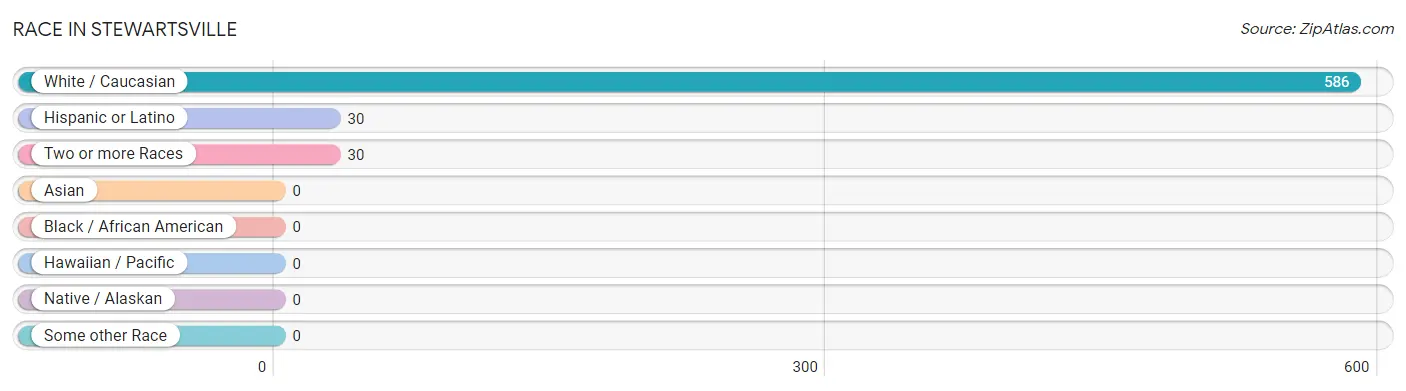
| Race | # Population | % Population |
| Asian | 0 | 0.0% |
| Black / African American | 0 | 0.0% |
| Hawaiian / Pacific | 0 | 0.0% |
| Hispanic or Latino | 30 | 4.9% |
| Native / Alaskan | 0 | 0.0% |
| White / Caucasian | 586 | 95.1% |
| Two or more Races | 30 | 4.9% |
| Some other Race | 0 | 0.0% |
| Total | 616 | 100.0% |
Ancestry in Stewartsville
The most populous ancestries reported in Stewartsville are Irish (241 | 39.1%), Italian (232 | 37.7%), German (190 | 30.8%), English (80 | 13.0%), and Polish (51 | 8.3%), together accounting for 128.9% of all Stewartsville residents.
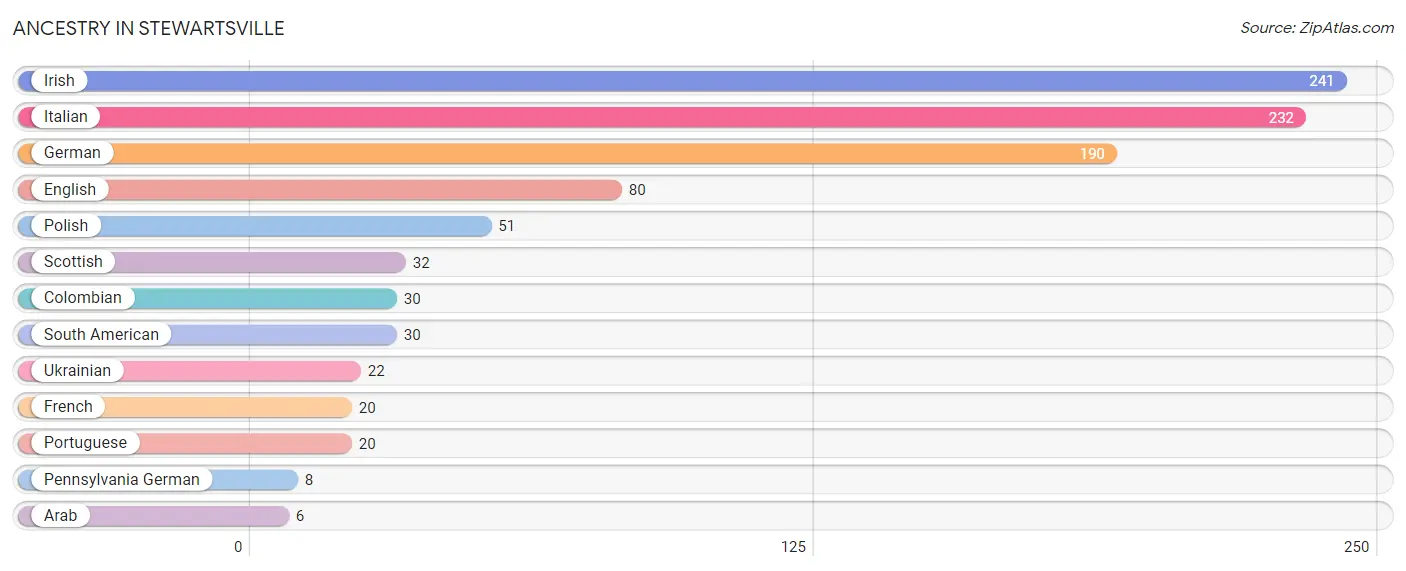
| Ancestry | # Population | % Population |
| Arab | 6 | 1.0% |
| Colombian | 30 | 4.9% |
| English | 80 | 13.0% |
| French | 20 | 3.3% |
| German | 190 | 30.8% |
| Irish | 241 | 39.1% |
| Italian | 232 | 37.7% |
| Pennsylvania German | 8 | 1.3% |
| Polish | 51 | 8.3% |
| Portuguese | 20 | 3.3% |
| Scottish | 32 | 5.2% |
| South American | 30 | 4.9% |
| Ukrainian | 22 | 3.6% | View All 13 Rows |
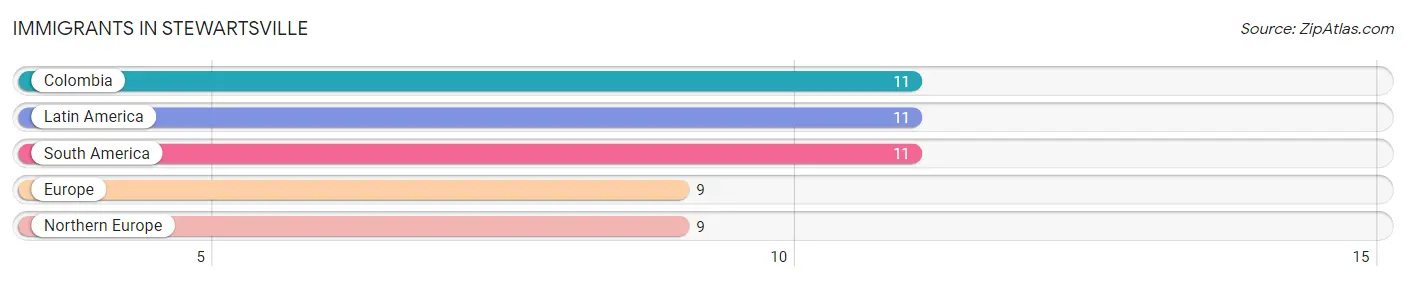
Immigrants in Stewartsville
The most numerous immigrant groups reported in Stewartsville came from Colombia (11 | 1.8%), Latin America (11 | 1.8%), South America (11 | 1.8%), Europe (9 | 1.5%), and Northern Europe (9 | 1.5%), together accounting for 8.3% of all Stewartsville residents.
| Immigration Origin | # Population | % Population |
| Colombia | 11 | 1.8% |
| Europe | 9 | 1.5% |
| Latin America | 11 | 1.8% |
| Northern Europe | 9 | 1.5% |
| South America | 11 | 1.8% | View All 5 Rows |
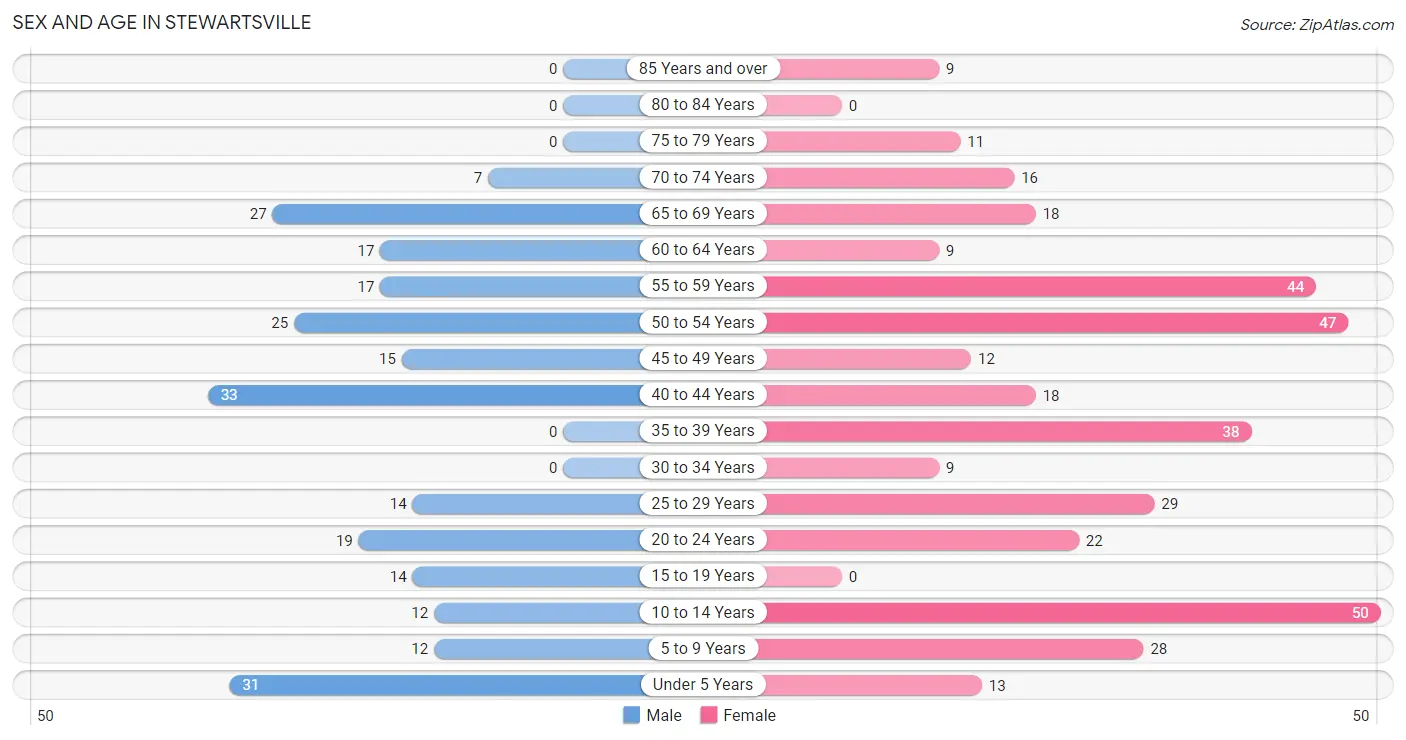
Sex and Age in Stewartsville
Sex and Age in Stewartsville
The most populous age groups in Stewartsville are 40 to 44 Years (33 | 13.6%) for men and 10 to 14 Years (50 | 13.4%) for women.
| Age Bracket | Male | Female |
| Under 5 Years | 31 (12.8%) | 13 (3.5%) |
| 5 to 9 Years | 12 (4.9%) | 28 (7.5%) |
| 10 to 14 Years | 12 (4.9%) | 50 (13.4%) |
| 15 to 19 Years | 14 (5.8%) | 0 (0.0%) |
| 20 to 24 Years | 19 (7.8%) | 22 (5.9%) |
| 25 to 29 Years | 14 (5.8%) | 29 (7.8%) |
| 30 to 34 Years | 0 (0.0%) | 9 (2.4%) |
| 35 to 39 Years | 0 (0.0%) | 38 (10.2%) |
| 40 to 44 Years | 33 (13.6%) | 18 (4.8%) |
| 45 to 49 Years | 15 (6.2%) | 12 (3.2%) |
| 50 to 54 Years | 25 (10.3%) | 47 (12.6%) |
| 55 to 59 Years | 17 (7.0%) | 44 (11.8%) |
| 60 to 64 Years | 17 (7.0%) | 9 (2.4%) |
| 65 to 69 Years | 27 (11.1%) | 18 (4.8%) |
| 70 to 74 Years | 7 (2.9%) | 16 (4.3%) |
| 75 to 79 Years | 0 (0.0%) | 11 (2.9%) |
| 80 to 84 Years | 0 (0.0%) | 0 (0.0%) |
| 85 Years and over | 0 (0.0%) | 9 (2.4%) |
| Total | 243 (100.0%) | 373 (100.0%) |
Families and Households in Stewartsville
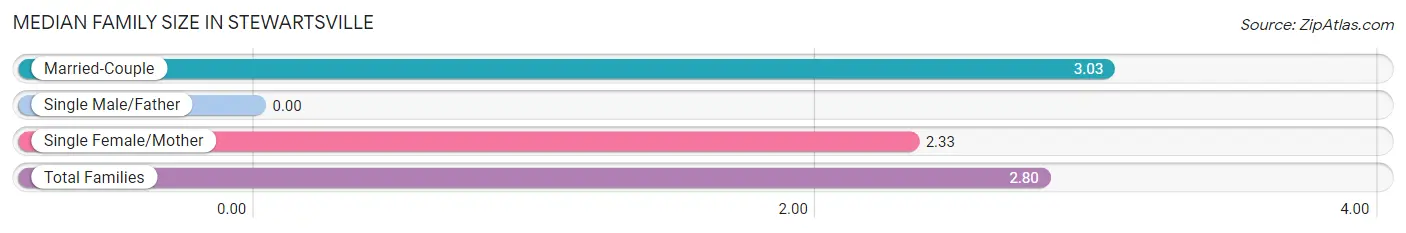
Median Family Size in Stewartsville
| Family Type | # Families | Family Size |
| Married-Couple | 120 (66.3%) | 3.03 |
| Single Male/Father | 0 (0.0%) | - |
| Single Female/Mother | 61 (33.7%) | 2.33 |
| Total Families | 181 (100.0%) | 2.80 |
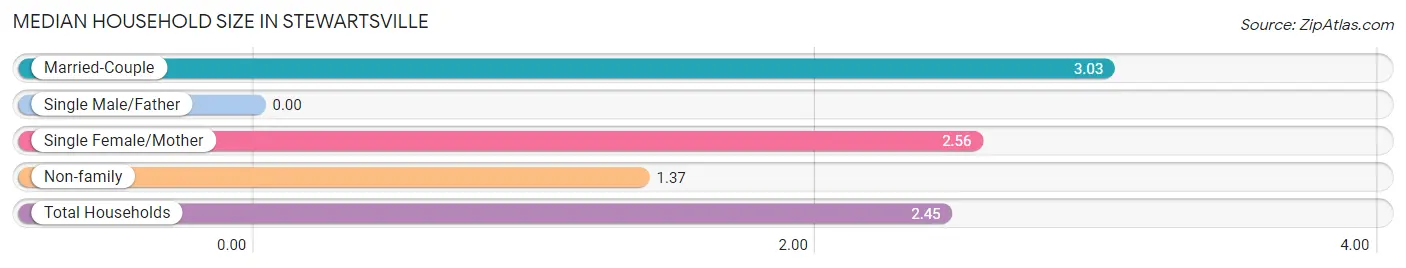
Median Household Size in Stewartsville
| Household Type | # Households | Household Size |
| Married-Couple | 120 (47.8%) | 3.03 |
| Single Male/Father | 0 (0.0%) | - |
| Single Female/Mother | 61 (24.3%) | 2.56 |
| Non-family | 70 (27.9%) | 1.37 |
| Total Households | 251 (100.0%) | 2.45 |
Household Size by Marriage Status in Stewartsville
Out of a total of 251 households in Stewartsville, 181 (72.1%) are family households, while 70 (27.9%) are nonfamily households. The most numerous type of family households are 2-person households, comprising 72, and the most common type of nonfamily households are 1-person households, comprising 55.
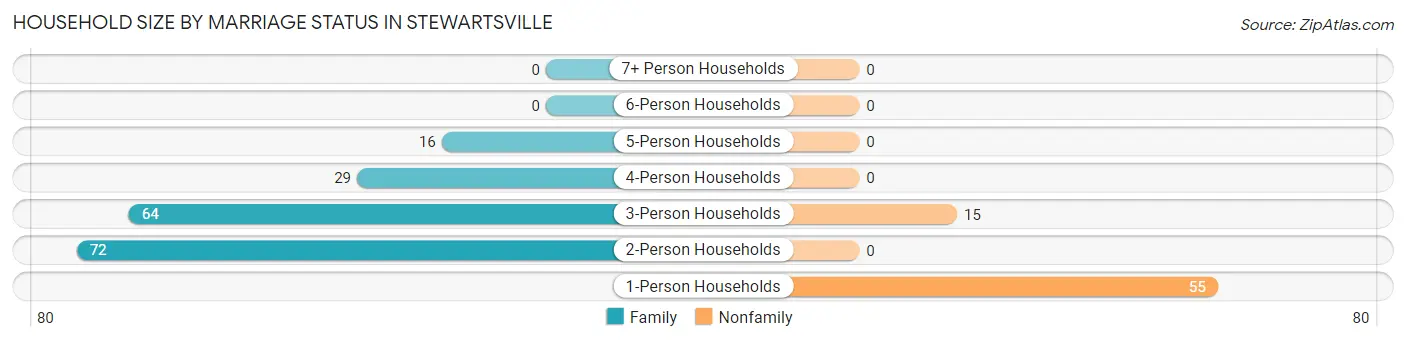
| Household Size | Family Households | Nonfamily Households |
| 1-Person Households | - | 55 (21.9%) |
| 2-Person Households | 72 (28.7%) | 0 (0.0%) |
| 3-Person Households | 64 (25.5%) | 15 (6.0%) |
| 4-Person Households | 29 (11.6%) | 0 (0.0%) |
| 5-Person Households | 16 (6.4%) | 0 (0.0%) |
| 6-Person Households | 0 (0.0%) | 0 (0.0%) |
| 7+ Person Households | 0 (0.0%) | 0 (0.0%) |
| Total | 181 (72.1%) | 70 (27.9%) |
Female Fertility in Stewartsville
Fertility by Age in Stewartsville
| Age Bracket | Women with Births | Births / 1,000 Women |
| 15 to 19 years | 0 (0.0%) | 0.0 |
| 20 to 34 years | 0 (0.0%) | 0.0 |
| 35 to 50 years | 0 (0.0%) | 0.0 |
| Total | 0 (0.0%) | 0.0 |
Fertility by Age by Marriage Status in Stewartsville
| Age Bracket | Married | Unmarried |
| 15 to 19 years | 0 (0.0%) | 0 (0.0%) |
| 20 to 34 years | 0 (0.0%) | 0 (0.0%) |
| 35 to 50 years | 0 (0.0%) | 0 (0.0%) |
| Total | 0 (0.0%) | 0 (0.0%) |
Fertility by Education in Stewartsville
| Educational Attainment | Women with Births | Births / 1,000 Women |
| Less than High School | 0 (0.0%) | 0.0 |
| High School Diploma | 0 (0.0%) | 0.0 |
| College or Associate's Degree | 0 (0.0%) | 0.0 |
| Bachelor's Degree | 0 (0.0%) | 0.0 |
| Graduate Degree | 0 (0.0%) | 0.0 |
| Total | 0 (0.0%) | 0.0 |
Fertility by Education by Marriage Status in Stewartsville
| Educational Attainment | Married | Unmarried |
| Less than High School | 0 (0.0%) | 0 (0.0%) |
| High School Diploma | 0 (0.0%) | 0 (0.0%) |
| College or Associate's Degree | 0 (0.0%) | 0 (0.0%) |
| Bachelor's Degree | 0 (0.0%) | 0 (0.0%) |
| Graduate Degree | 0 (0.0%) | 0 (0.0%) |
| Total | 0 (0.0%) | 0 (0.0%) |
Employment Characteristics in Stewartsville
Employment by Class of Employer in Stewartsville
Among the 331 employed individuals in Stewartsville, private company employees (278 | 84.0%), local government employees (38 | 11.5%), and self-employed (not incorporated) (9 | 2.7%) make up the most common classes of employment.
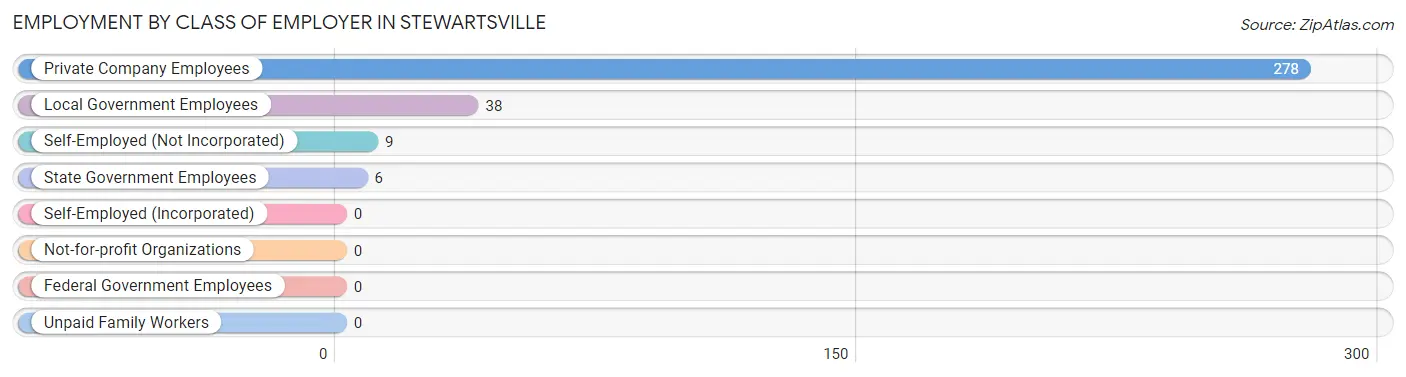
| Employer Class | # Employees | % Employees |
| Private Company Employees | 278 | 84.0% |
| Self-Employed (Incorporated) | 0 | 0.0% |
| Self-Employed (Not Incorporated) | 9 | 2.7% |
| Not-for-profit Organizations | 0 | 0.0% |
| Local Government Employees | 38 | 11.5% |
| State Government Employees | 6 | 1.8% |
| Federal Government Employees | 0 | 0.0% |
| Unpaid Family Workers | 0 | 0.0% |
| Total | 331 | 100.0% |
Employment Status by Age in Stewartsville
According to the labor force statistics for Stewartsville, out of the total population over 16 years of age (470), 78.3% or 368 individuals are in the labor force, with 5.4% or 20 of them unemployed. The age group with the highest labor force participation rate is 25 to 29 years, with 100.0% or 43 individuals in the labor force. Within the labor force, the 55 to 59 years age range has the highest percentage of unemployed individuals, with 13.1% or 8 of them being unemployed.
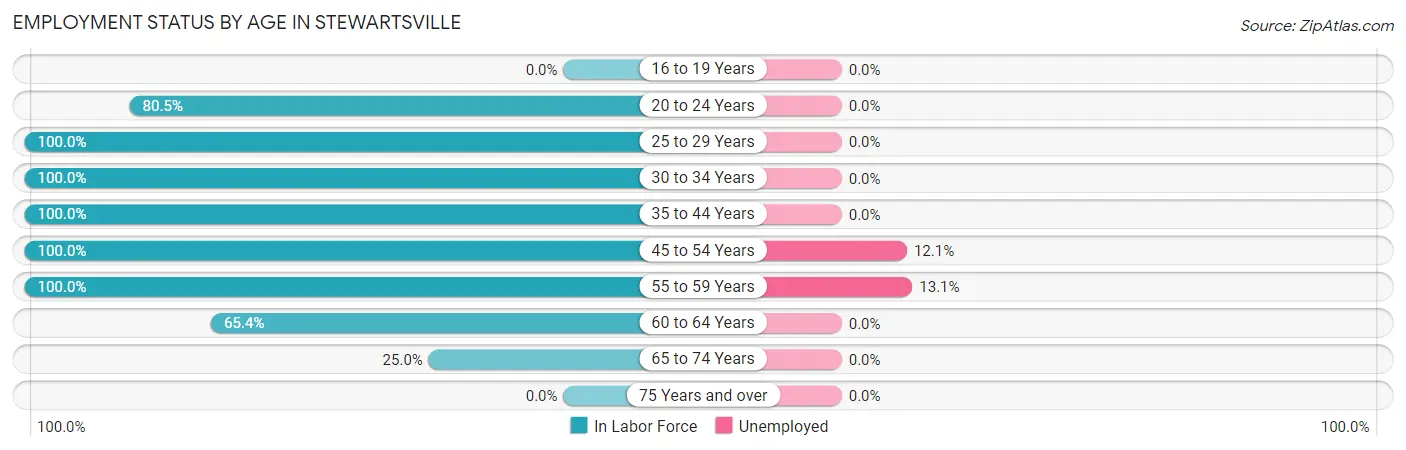
| Age Bracket | In Labor Force | Unemployed |
| 16 to 19 Years | 0 (0.0%) | 0 (0.0%) |
| 20 to 24 Years | 33 (80.5%) | 0 (0.0%) |
| 25 to 29 Years | 43 (100.0%) | 0 (0.0%) |
| 30 to 34 Years | 9 (100.0%) | 0 (0.0%) |
| 35 to 44 Years | 89 (100.0%) | 0 (0.0%) |
| 45 to 54 Years | 99 (100.0%) | 12 (12.1%) |
| 55 to 59 Years | 61 (100.0%) | 8 (13.1%) |
| 60 to 64 Years | 17 (65.4%) | 0 (0.0%) |
| 65 to 74 Years | 17 (25.0%) | 0 (0.0%) |
| 75 Years and over | 0 (0.0%) | 0 (0.0%) |
| Total | 368 (78.3%) | 20 (5.4%) |
Employment Status by Educational Attainment in Stewartsville
According to labor force statistics for Stewartsville, 97.2% of individuals (318) out of the total population between 25 and 64 years of age (327) are in the labor force, with 6.3% or 20 of them being unemployed. The group with the highest labor force participation rate are those with the educational attainment of high school diploma, with 100.0% or 30 individuals in the labor force. Within the labor force, individuals with bachelor's degree or higher education have the highest percentage of unemployment, with 11.0% or 20 of them being unemployed.
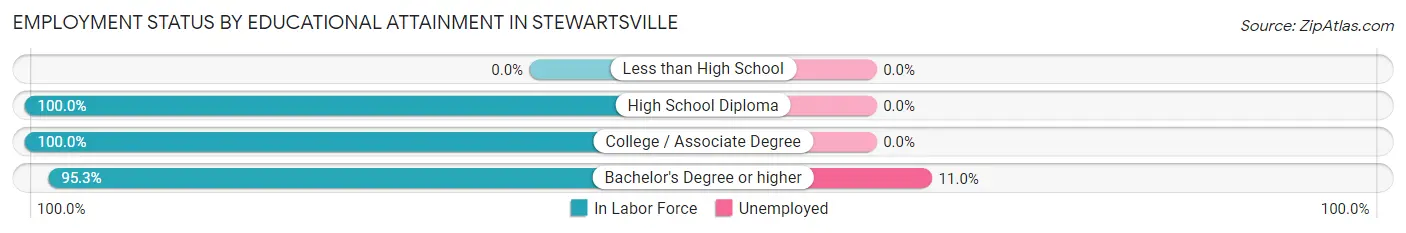
| Educational Attainment | In Labor Force | Unemployed |
| Less than High School | 0 (0.0%) | 0 (0.0%) |
| High School Diploma | 30 (100.0%) | 0 (0.0%) |
| College / Associate Degree | 107 (100.0%) | 0 (0.0%) |
| Bachelor's Degree or higher | 181 (95.3%) | 21 (11.0%) |
| Total | 318 (97.2%) | 21 (6.3%) |
Employment Occupations by Sex in Stewartsville
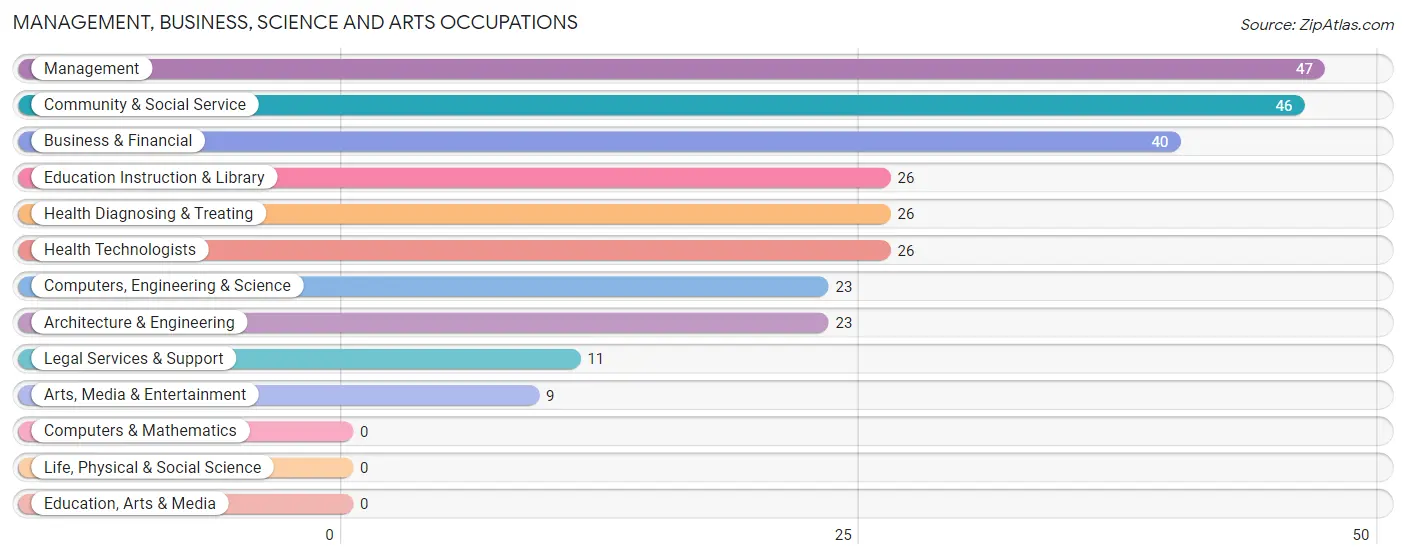
Management, Business, Science and Arts Occupations
The most common Management, Business, Science and Arts occupations in Stewartsville are Management (47 | 13.5%), Community & Social Service (46 | 13.2%), Business & Financial (40 | 11.5%), Education Instruction & Library (26 | 7.5%), and Health Diagnosing & Treating (26 | 7.5%).
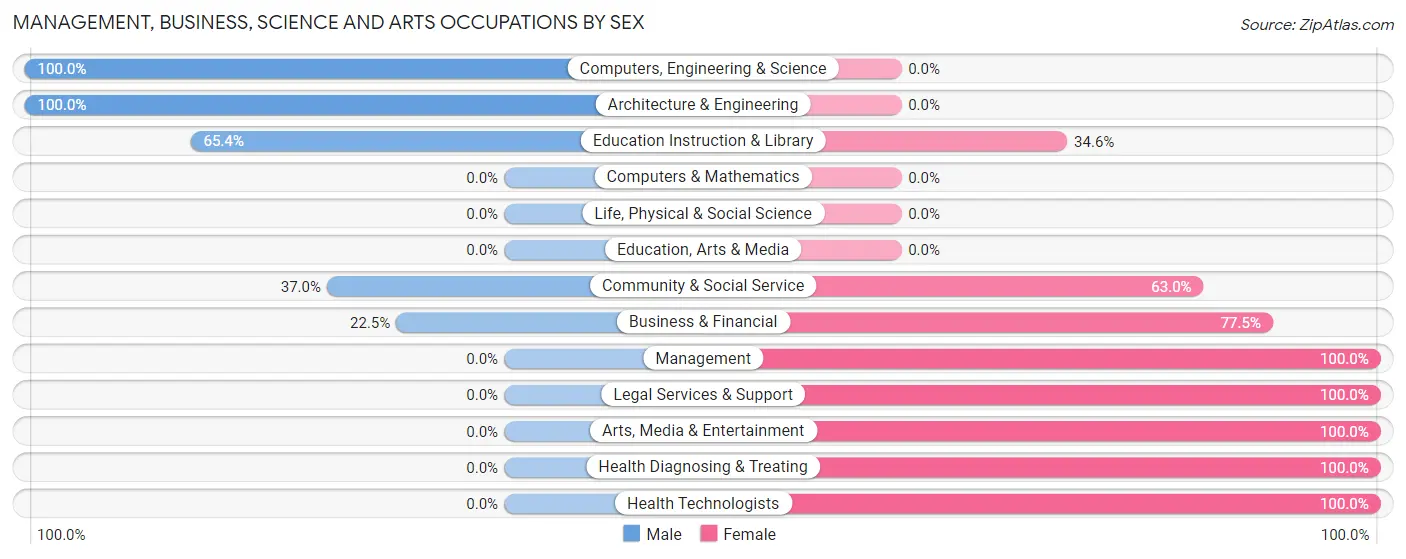
Management, Business, Science and Arts Occupations by Sex
Within the Management, Business, Science and Arts occupations in Stewartsville, the most male-oriented occupations are Computers, Engineering & Science (100.0%), Architecture & Engineering (100.0%), and Education Instruction & Library (65.4%), while the most female-oriented occupations are Management (100.0%), Legal Services & Support (100.0%), and Arts, Media & Entertainment (100.0%).
| Occupation | Male | Female |
| Management | 0 (0.0%) | 47 (100.0%) |
| Business & Financial | 9 (22.5%) | 31 (77.5%) |
| Computers, Engineering & Science | 23 (100.0%) | 0 (0.0%) |
| Computers & Mathematics | 0 (0.0%) | 0 (0.0%) |
| Architecture & Engineering | 23 (100.0%) | 0 (0.0%) |
| Life, Physical & Social Science | 0 (0.0%) | 0 (0.0%) |
| Community & Social Service | 17 (37.0%) | 29 (63.0%) |
| Education, Arts & Media | 0 (0.0%) | 0 (0.0%) |
| Legal Services & Support | 0 (0.0%) | 11 (100.0%) |
| Education Instruction & Library | 17 (65.4%) | 9 (34.6%) |
| Arts, Media & Entertainment | 0 (0.0%) | 9 (100.0%) |
| Health Diagnosing & Treating | 0 (0.0%) | 26 (100.0%) |
| Health Technologists | 0 (0.0%) | 26 (100.0%) |
| Total (Category) | 49 (26.9%) | 133 (73.1%) |
| Total (Overall) | 148 (42.5%) | 200 (57.5%) |
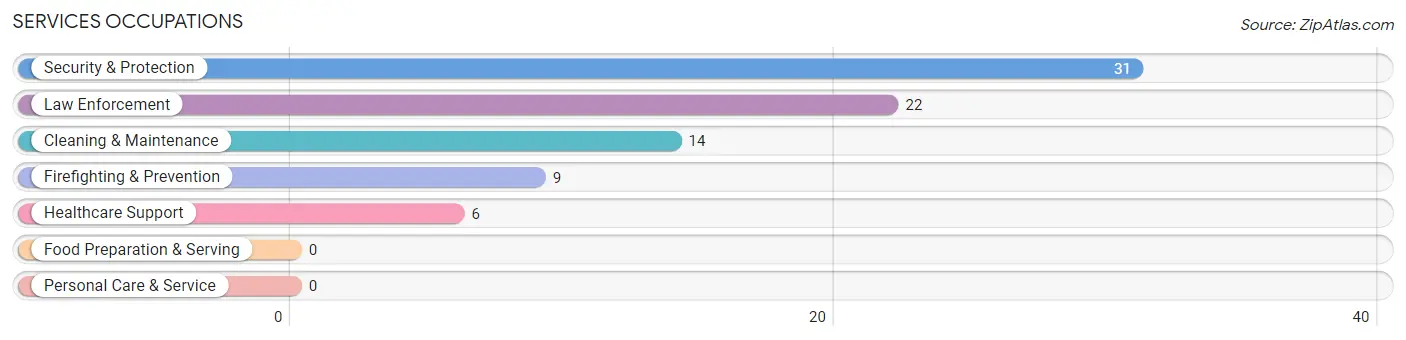
Services Occupations
The most common Services occupations in Stewartsville are Security & Protection (31 | 8.9%), Law Enforcement (22 | 6.3%), Cleaning & Maintenance (14 | 4.0%), Firefighting & Prevention (9 | 2.6%), and Healthcare Support (6 | 1.7%).
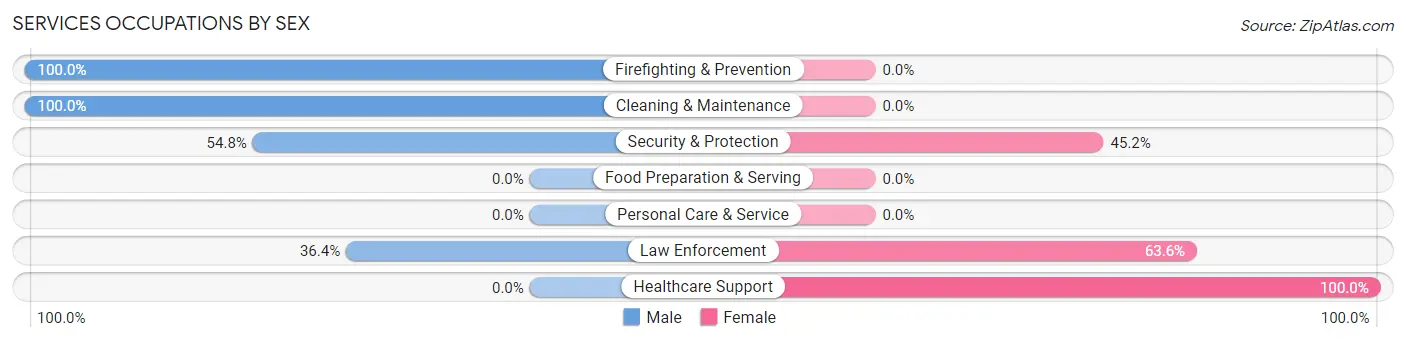
Services Occupations by Sex
Within the Services occupations in Stewartsville, the most male-oriented occupations are Firefighting & Prevention (100.0%), Cleaning & Maintenance (100.0%), and Security & Protection (54.8%), while the most female-oriented occupations are Healthcare Support (100.0%), Law Enforcement (63.6%), and Security & Protection (45.2%).
| Occupation | Male | Female |
| Healthcare Support | 0 (0.0%) | 6 (100.0%) |
| Security & Protection | 17 (54.8%) | 14 (45.2%) |
| Firefighting & Prevention | 9 (100.0%) | 0 (0.0%) |
| Law Enforcement | 8 (36.4%) | 14 (63.6%) |
| Food Preparation & Serving | 0 (0.0%) | 0 (0.0%) |
| Cleaning & Maintenance | 14 (100.0%) | 0 (0.0%) |
| Personal Care & Service | 0 (0.0%) | 0 (0.0%) |
| Total (Category) | 31 (60.8%) | 20 (39.2%) |
| Total (Overall) | 148 (42.5%) | 200 (57.5%) |
Sales and Office Occupations
The most common Sales and Office occupations in Stewartsville are Office & Administration (47 | 13.5%), and Sales & Related (41 | 11.8%).
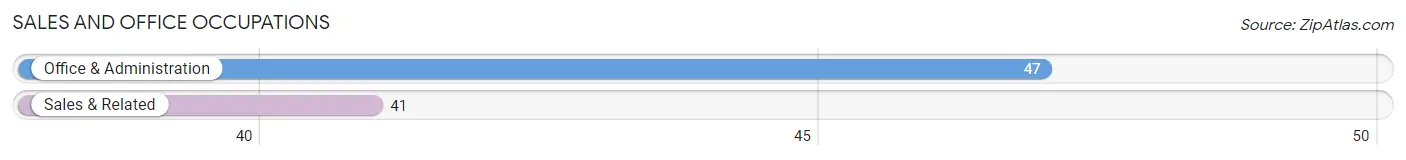
Sales and Office Occupations by Sex

| Occupation | Male | Female |
| Sales & Related | 41 (100.0%) | 0 (0.0%) |
| Office & Administration | 0 (0.0%) | 47 (100.0%) |
| Total (Category) | 41 (46.6%) | 47 (53.4%) |
| Total (Overall) | 148 (42.5%) | 200 (57.5%) |
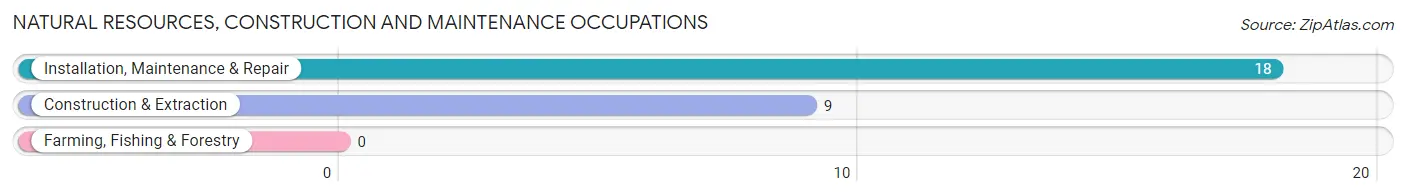
Natural Resources, Construction and Maintenance Occupations
The most common Natural Resources, Construction and Maintenance occupations in Stewartsville are Installation, Maintenance & Repair (18 | 5.2%), and Construction & Extraction (9 | 2.6%).
Natural Resources, Construction and Maintenance Occupations by Sex
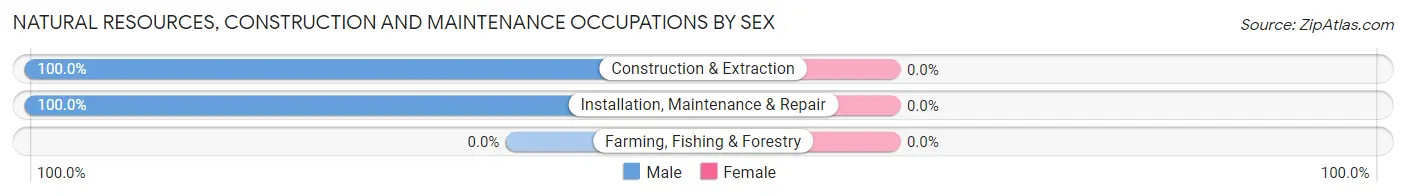
| Occupation | Male | Female |
| Farming, Fishing & Forestry | 0 (0.0%) | 0 (0.0%) |
| Construction & Extraction | 9 (100.0%) | 0 (0.0%) |
| Installation, Maintenance & Repair | 18 (100.0%) | 0 (0.0%) |
| Total (Category) | 27 (100.0%) | 0 (0.0%) |
| Total (Overall) | 148 (42.5%) | 200 (57.5%) |
Production, Transportation and Moving Occupations
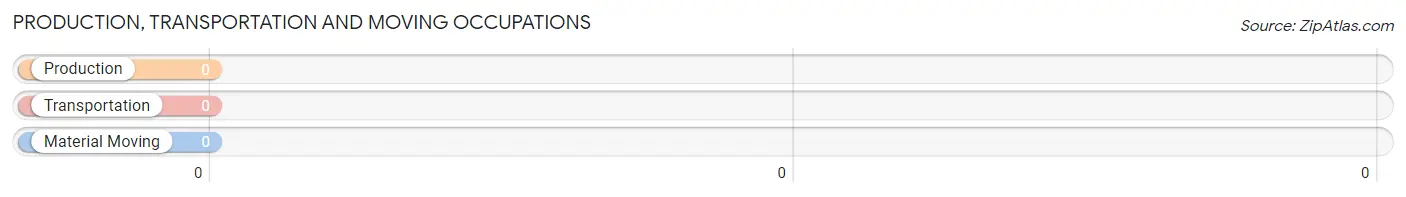
Production, Transportation and Moving Occupations by Sex
| Occupation | Male | Female |
| Production | 0 (0.0%) | 0 (0.0%) |
| Transportation | 0 (0.0%) | 0 (0.0%) |
| Material Moving | 0 (0.0%) | 0 (0.0%) |
| Total (Category) | 0 (0.0%) | 0 (0.0%) |
| Total (Overall) | 148 (42.5%) | 200 (57.5%) |
Employment Industries by Sex in Stewartsville
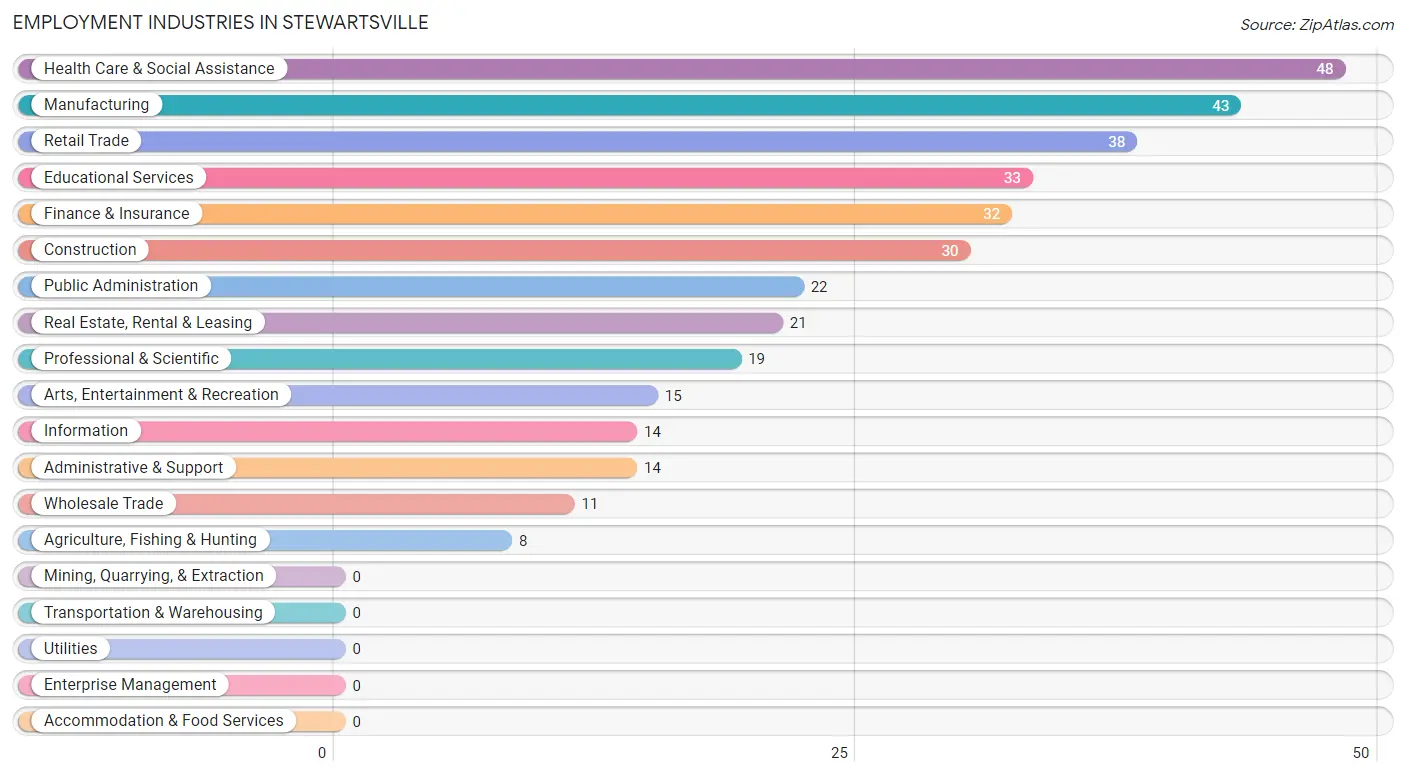
Employment Industries in Stewartsville
The major employment industries in Stewartsville include Health Care & Social Assistance (48 | 13.8%), Manufacturing (43 | 12.4%), Retail Trade (38 | 10.9%), Educational Services (33 | 9.5%), and Finance & Insurance (32 | 9.2%).
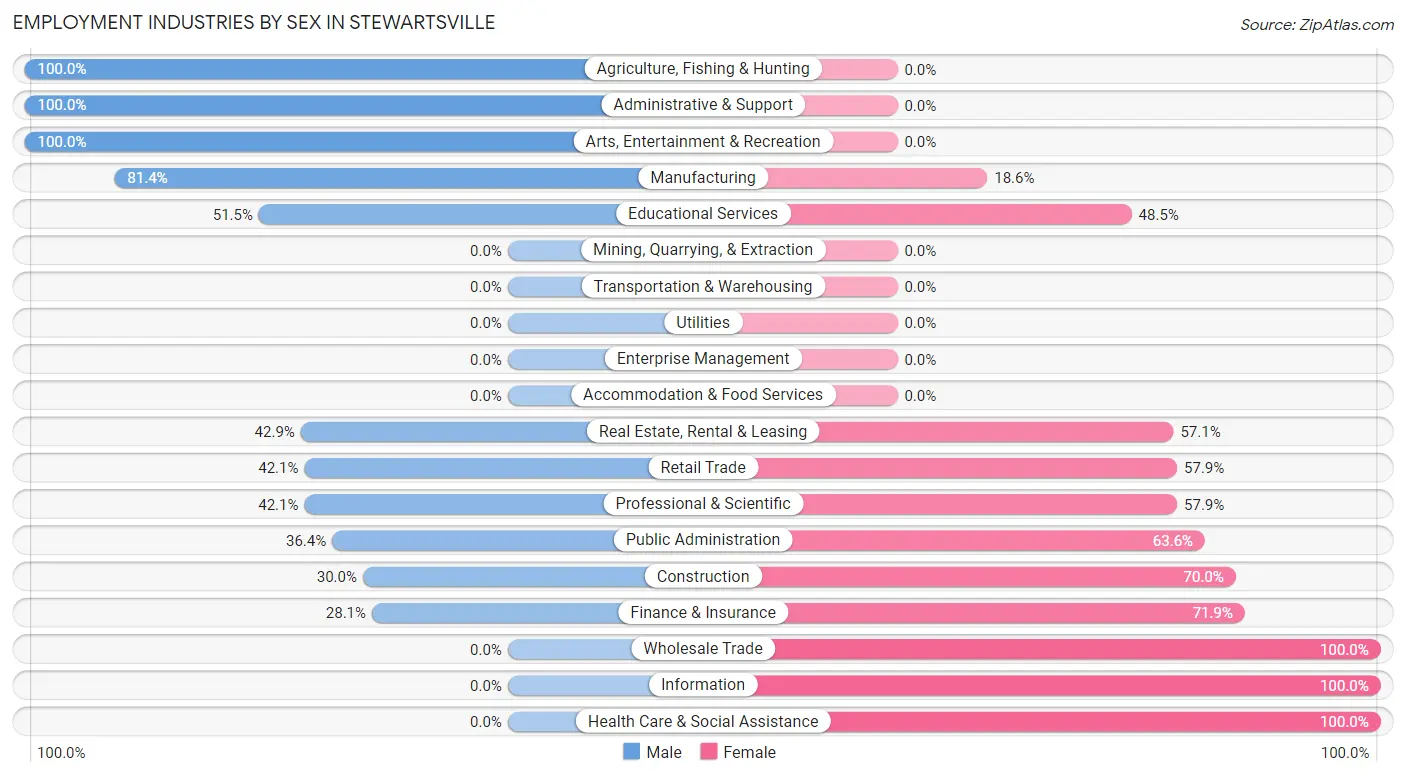
Employment Industries by Sex in Stewartsville
The Stewartsville industries that see more men than women are Agriculture, Fishing & Hunting (100.0%), Administrative & Support (100.0%), and Arts, Entertainment & Recreation (100.0%), whereas the industries that tend to have a higher number of women are Wholesale Trade (100.0%), Information (100.0%), and Health Care & Social Assistance (100.0%).
| Industry | Male | Female |
| Agriculture, Fishing & Hunting | 8 (100.0%) | 0 (0.0%) |
| Mining, Quarrying, & Extraction | 0 (0.0%) | 0 (0.0%) |
| Construction | 9 (30.0%) | 21 (70.0%) |
| Manufacturing | 35 (81.4%) | 8 (18.6%) |
| Wholesale Trade | 0 (0.0%) | 11 (100.0%) |
| Retail Trade | 16 (42.1%) | 22 (57.9%) |
| Transportation & Warehousing | 0 (0.0%) | 0 (0.0%) |
| Utilities | 0 (0.0%) | 0 (0.0%) |
| Information | 0 (0.0%) | 14 (100.0%) |
| Finance & Insurance | 9 (28.1%) | 23 (71.9%) |
| Real Estate, Rental & Leasing | 9 (42.9%) | 12 (57.1%) |
| Professional & Scientific | 8 (42.1%) | 11 (57.9%) |
| Enterprise Management | 0 (0.0%) | 0 (0.0%) |
| Administrative & Support | 14 (100.0%) | 0 (0.0%) |
| Educational Services | 17 (51.5%) | 16 (48.5%) |
| Health Care & Social Assistance | 0 (0.0%) | 48 (100.0%) |
| Arts, Entertainment & Recreation | 15 (100.0%) | 0 (0.0%) |
| Accommodation & Food Services | 0 (0.0%) | 0 (0.0%) |
| Public Administration | 8 (36.4%) | 14 (63.6%) |
| Total | 148 (42.5%) | 200 (57.5%) |
Education in Stewartsville
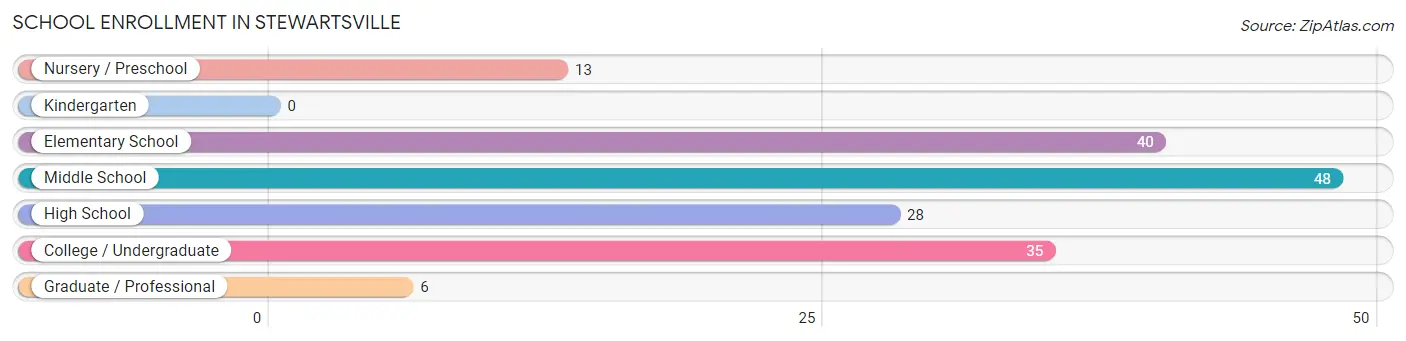
School Enrollment in Stewartsville
The most common levels of schooling among the 170 students in Stewartsville are middle school (48 | 28.2%), elementary school (40 | 23.5%), and college / undergraduate (35 | 20.6%).
| School Level | # Students | % Students |
| Nursery / Preschool | 13 | 7.6% |
| Kindergarten | 0 | 0.0% |
| Elementary School | 40 | 23.5% |
| Middle School | 48 | 28.2% |
| High School | 28 | 16.5% |
| College / Undergraduate | 35 | 20.6% |
| Graduate / Professional | 6 | 3.5% |
| Total | 170 | 100.0% |
School Enrollment by Age by Funding Source in Stewartsville
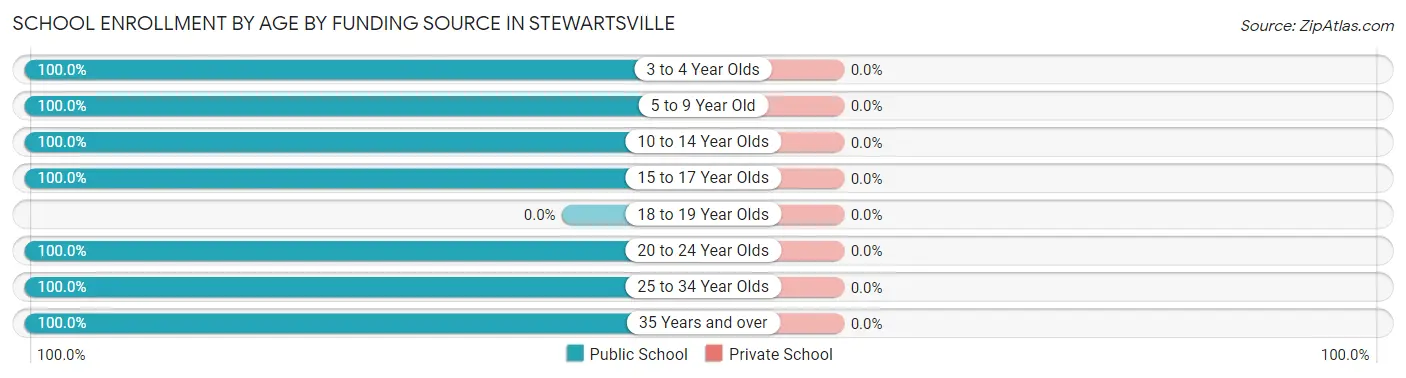
| Age Bracket | Public School | Private School |
| 3 to 4 Year Olds | 13 (100.0%) | 0 (0.0%) |
| 5 to 9 Year Old | 40 (100.0%) | 0 (0.0%) |
| 10 to 14 Year Olds | 62 (100.0%) | 0 (0.0%) |
| 15 to 17 Year Olds | 14 (100.0%) | 0 (0.0%) |
| 18 to 19 Year Olds | 0 (0.0%) | 0 (0.0%) |
| 20 to 24 Year Olds | 14 (100.0%) | 0 (0.0%) |
| 25 to 34 Year Olds | 6 (100.0%) | 0 (0.0%) |
| 35 Years and over | 21 (100.0%) | 0 (0.0%) |
| Total | 170 (100.0%) | 0 (0.0%) |
Educational Attainment by Field of Study in Stewartsville
Liberal arts & history (40 | 18.2%), education (37 | 16.8%), bio, nature & agricultural (27 | 12.3%), science & technology (26 | 11.8%), and physical & health sciences (15 | 6.8%) are the most common fields of study among 220 individuals in Stewartsville who have obtained a bachelor's degree or higher.
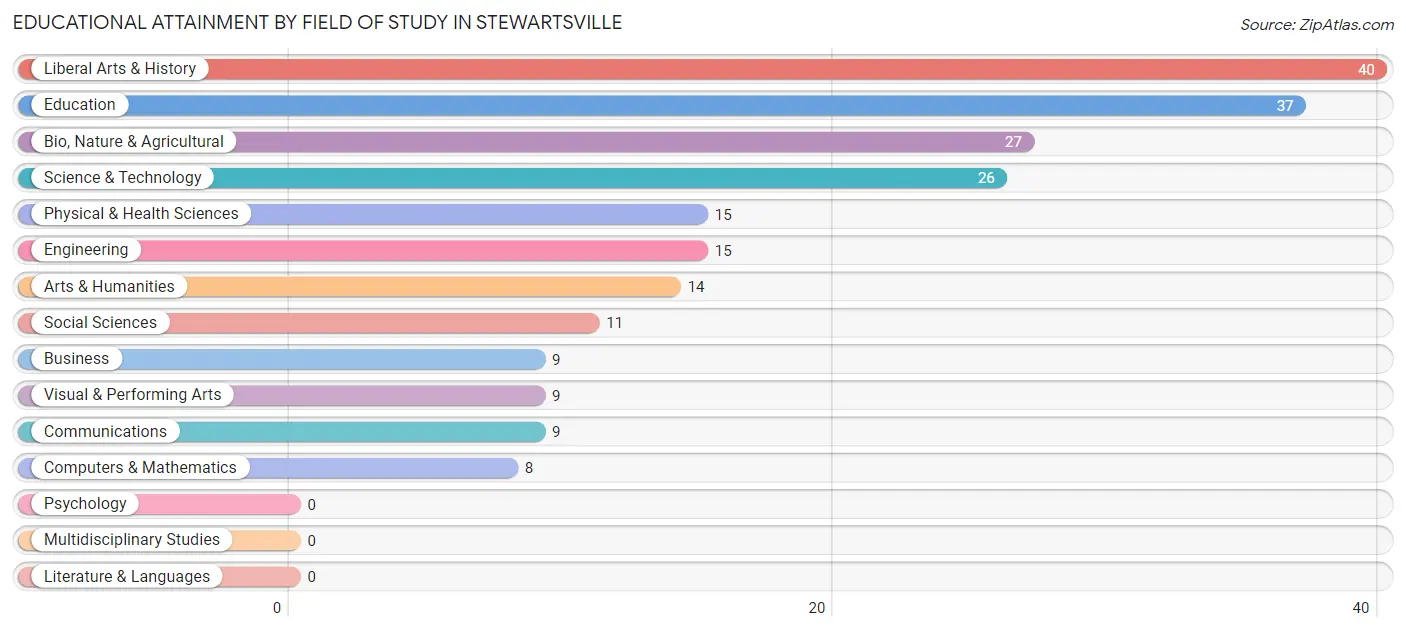
| Field of Study | # Graduates | % Graduates |
| Computers & Mathematics | 8 | 3.6% |
| Bio, Nature & Agricultural | 27 | 12.3% |
| Physical & Health Sciences | 15 | 6.8% |
| Psychology | 0 | 0.0% |
| Social Sciences | 11 | 5.0% |
| Engineering | 15 | 6.8% |
| Multidisciplinary Studies | 0 | 0.0% |
| Science & Technology | 26 | 11.8% |
| Business | 9 | 4.1% |
| Education | 37 | 16.8% |
| Literature & Languages | 0 | 0.0% |
| Liberal Arts & History | 40 | 18.2% |
| Visual & Performing Arts | 9 | 4.1% |
| Communications | 9 | 4.1% |
| Arts & Humanities | 14 | 6.4% |
| Total | 220 | 100.0% |
Transportation & Commute in Stewartsville
Vehicle Availability by Sex in Stewartsville
The most prevalent vehicle ownership categories in Stewartsville are males with 3 vehicles (48, accounting for 36.6%) and females with 3 vehicles (38, making up 24.0%).
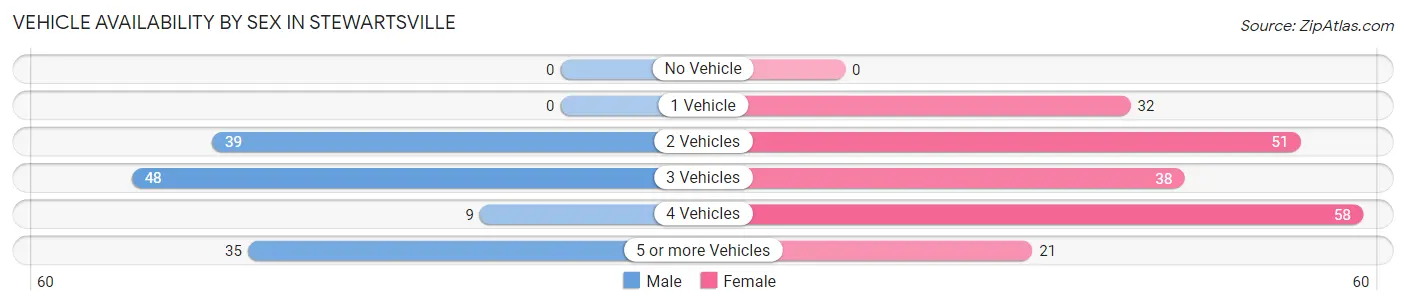
| Vehicles Available | Male | Female |
| No Vehicle | 0 (0.0%) | 0 (0.0%) |
| 1 Vehicle | 0 (0.0%) | 32 (16.0%) |
| 2 Vehicles | 39 (29.8%) | 51 (25.5%) |
| 3 Vehicles | 48 (36.6%) | 38 (19.0%) |
| 4 Vehicles | 9 (6.9%) | 58 (29.0%) |
| 5 or more Vehicles | 35 (26.7%) | 21 (10.5%) |
| Total | 131 (100.0%) | 200 (100.0%) |
Commute Time in Stewartsville
The most frequently occuring commute durations in Stewartsville are 40 to 44 minutes (70 commuters, 25.1%), 45 to 59 minutes (52 commuters, 18.6%), and 30 to 34 minutes (38 commuters, 13.6%).
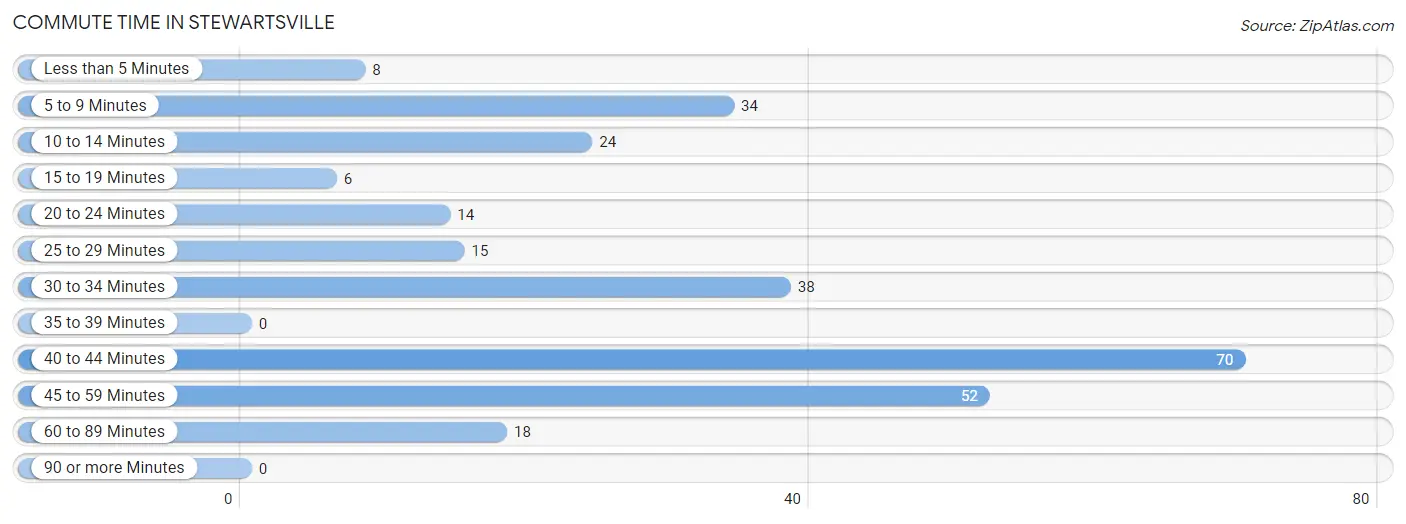
| Commute Time | # Commuters | % Commuters |
| Less than 5 Minutes | 8 | 2.9% |
| 5 to 9 Minutes | 34 | 12.2% |
| 10 to 14 Minutes | 24 | 8.6% |
| 15 to 19 Minutes | 6 | 2.1% |
| 20 to 24 Minutes | 14 | 5.0% |
| 25 to 29 Minutes | 15 | 5.4% |
| 30 to 34 Minutes | 38 | 13.6% |
| 35 to 39 Minutes | 0 | 0.0% |
| 40 to 44 Minutes | 70 | 25.1% |
| 45 to 59 Minutes | 52 | 18.6% |
| 60 to 89 Minutes | 18 | 6.5% |
| 90 or more Minutes | 0 | 0.0% |
Commute Time by Sex in Stewartsville
The most common commute times in Stewartsville are 5 to 9 minutes (34 commuters, 26.0%) for males and 30 to 34 minutes (38 commuters, 25.7%) for females.
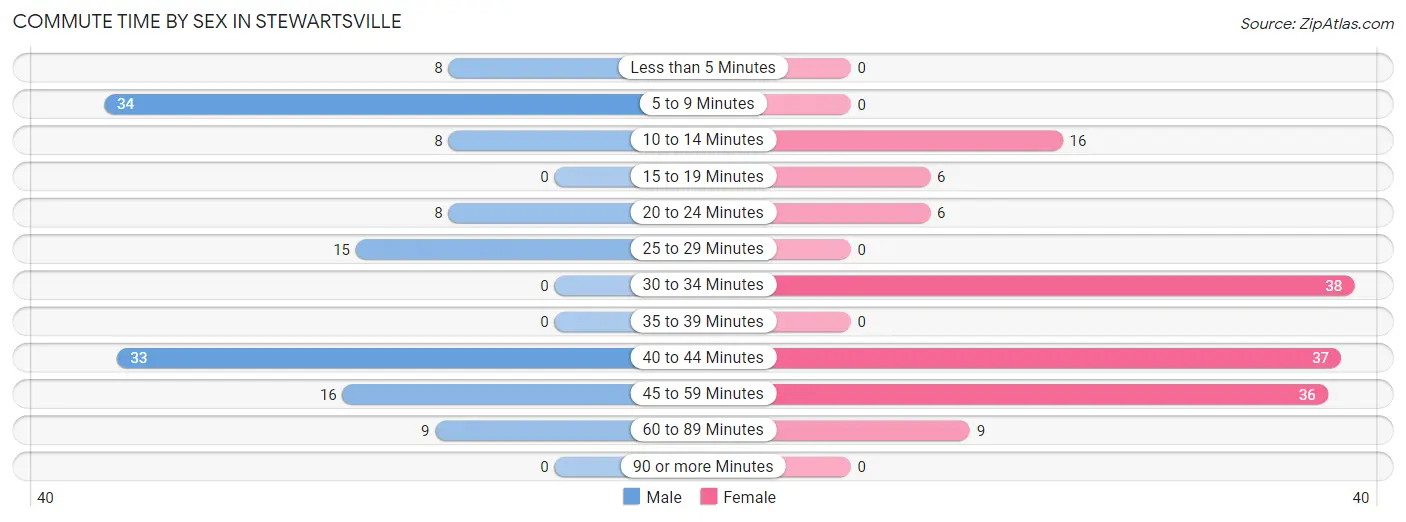
| Commute Time | Male | Female |
| Less than 5 Minutes | 8 (6.1%) | 0 (0.0%) |
| 5 to 9 Minutes | 34 (26.0%) | 0 (0.0%) |
| 10 to 14 Minutes | 8 (6.1%) | 16 (10.8%) |
| 15 to 19 Minutes | 0 (0.0%) | 6 (4.1%) |
| 20 to 24 Minutes | 8 (6.1%) | 6 (4.1%) |
| 25 to 29 Minutes | 15 (11.5%) | 0 (0.0%) |
| 30 to 34 Minutes | 0 (0.0%) | 38 (25.7%) |
| 35 to 39 Minutes | 0 (0.0%) | 0 (0.0%) |
| 40 to 44 Minutes | 33 (25.2%) | 37 (25.0%) |
| 45 to 59 Minutes | 16 (12.2%) | 36 (24.3%) |
| 60 to 89 Minutes | 9 (6.9%) | 9 (6.1%) |
| 90 or more Minutes | 0 (0.0%) | 0 (0.0%) |
Time of Departure to Work by Sex in Stewartsville
The most frequent times of departure to work in Stewartsville are 8:00 AM to 8:29 AM (43, 32.8%) for males and 8:00 AM to 8:29 AM (40, 27.0%) for females.
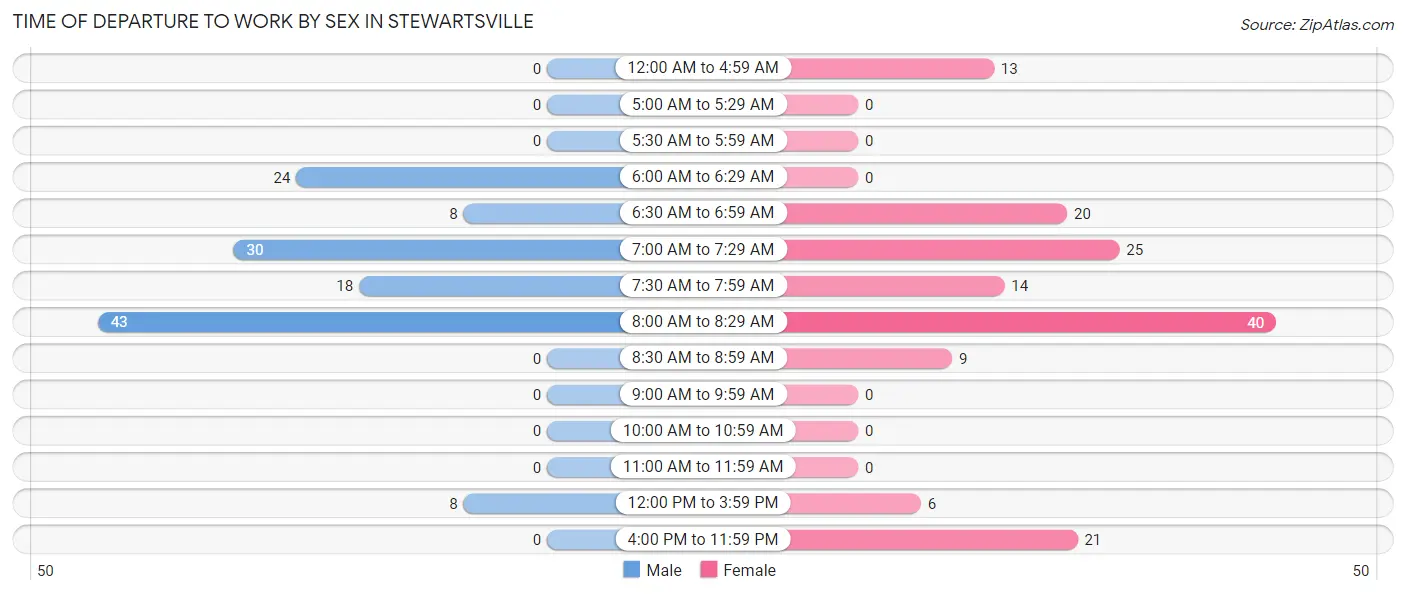
| Time of Departure | Male | Female |
| 12:00 AM to 4:59 AM | 0 (0.0%) | 13 (8.8%) |
| 5:00 AM to 5:29 AM | 0 (0.0%) | 0 (0.0%) |
| 5:30 AM to 5:59 AM | 0 (0.0%) | 0 (0.0%) |
| 6:00 AM to 6:29 AM | 24 (18.3%) | 0 (0.0%) |
| 6:30 AM to 6:59 AM | 8 (6.1%) | 20 (13.5%) |
| 7:00 AM to 7:29 AM | 30 (22.9%) | 25 (16.9%) |
| 7:30 AM to 7:59 AM | 18 (13.7%) | 14 (9.5%) |
| 8:00 AM to 8:29 AM | 43 (32.8%) | 40 (27.0%) |
| 8:30 AM to 8:59 AM | 0 (0.0%) | 9 (6.1%) |
| 9:00 AM to 9:59 AM | 0 (0.0%) | 0 (0.0%) |
| 10:00 AM to 10:59 AM | 0 (0.0%) | 0 (0.0%) |
| 11:00 AM to 11:59 AM | 0 (0.0%) | 0 (0.0%) |
| 12:00 PM to 3:59 PM | 8 (6.1%) | 6 (4.1%) |
| 4:00 PM to 11:59 PM | 0 (0.0%) | 21 (14.2%) |
| Total | 131 (100.0%) | 148 (100.0%) |
Housing Occupancy in Stewartsville
Occupancy by Ownership in Stewartsville
Of the total 251 dwellings in Stewartsville, owner-occupied units account for 201 (80.1%), while renter-occupied units make up 50 (19.9%).
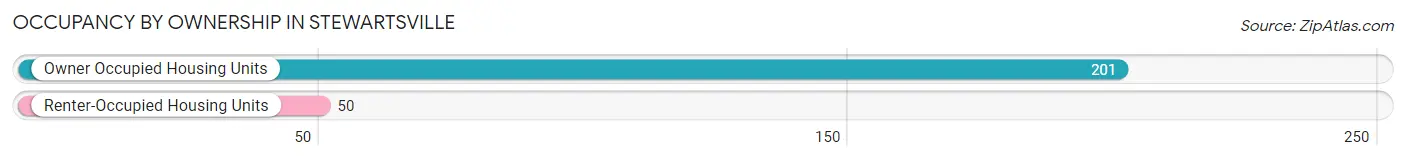
| Occupancy | # Housing Units | % Housing Units |
| Owner Occupied Housing Units | 201 | 80.1% |
| Renter-Occupied Housing Units | 50 | 19.9% |
| Total Occupied Housing Units | 251 | 100.0% |
Occupancy by Household Size in Stewartsville
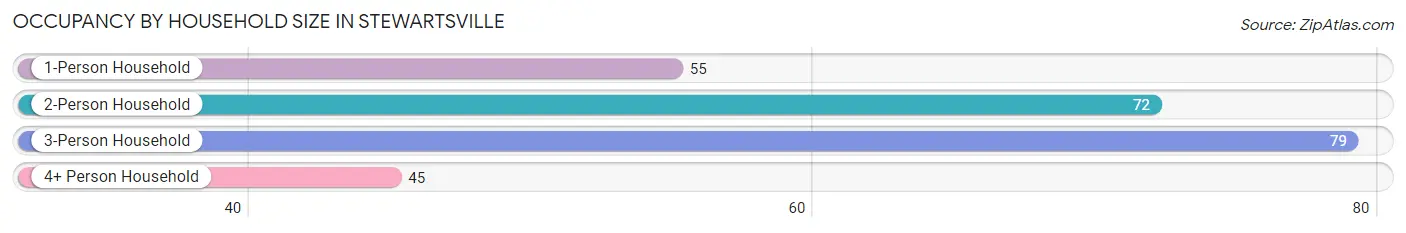
| Household Size | # Housing Units | % Housing Units |
| 1-Person Household | 55 | 21.9% |
| 2-Person Household | 72 | 28.7% |
| 3-Person Household | 79 | 31.5% |
| 4+ Person Household | 45 | 17.9% |
| Total Housing Units | 251 | 100.0% |
Occupancy by Ownership by Household Size in Stewartsville
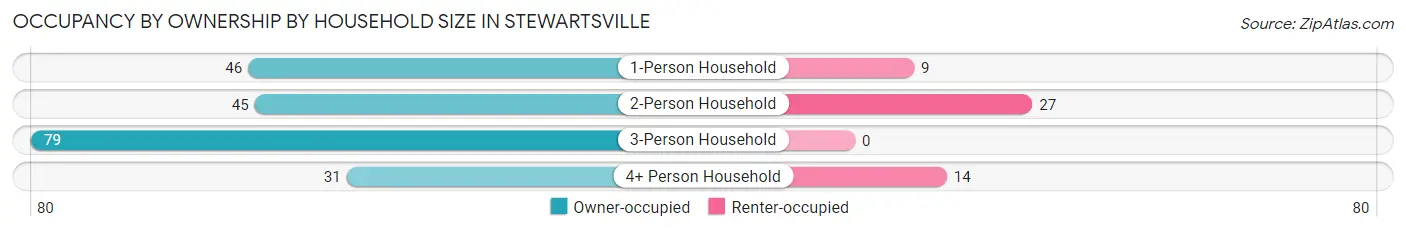
| Household Size | Owner-occupied | Renter-occupied |
| 1-Person Household | 46 (83.6%) | 9 (16.4%) |
| 2-Person Household | 45 (62.5%) | 27 (37.5%) |
| 3-Person Household | 79 (100.0%) | 0 (0.0%) |
| 4+ Person Household | 31 (68.9%) | 14 (31.1%) |
| Total Housing Units | 201 (80.1%) | 50 (19.9%) |
Occupancy by Educational Attainment in Stewartsville
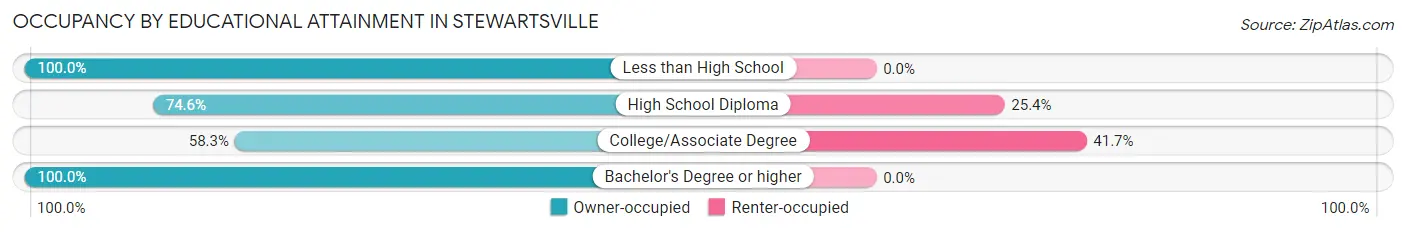
| Household Size | Owner-occupied | Renter-occupied |
| Less than High School | 11 (100.0%) | 0 (0.0%) |
| High School Diploma | 44 (74.6%) | 15 (25.4%) |
| College/Associate Degree | 49 (58.3%) | 35 (41.7%) |
| Bachelor's Degree or higher | 97 (100.0%) | 0 (0.0%) |
Occupancy by Age of Householder in Stewartsville
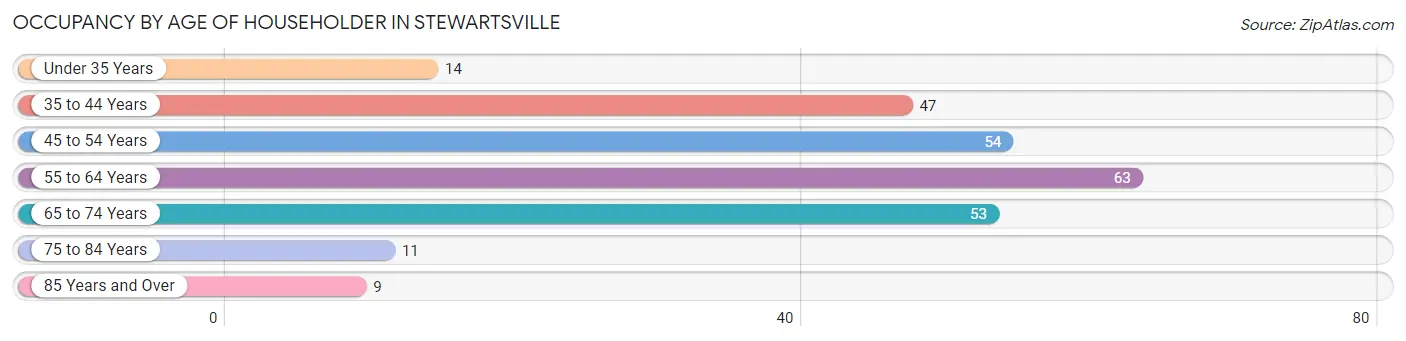
| Age Bracket | # Households | % Households |
| Under 35 Years | 14 | 5.6% |
| 35 to 44 Years | 47 | 18.7% |
| 45 to 54 Years | 54 | 21.5% |
| 55 to 64 Years | 63 | 25.1% |
| 65 to 74 Years | 53 | 21.1% |
| 75 to 84 Years | 11 | 4.4% |
| 85 Years and Over | 9 | 3.6% |
| Total | 251 | 100.0% |
Housing Finances in Stewartsville
Median Income by Occupancy in Stewartsville
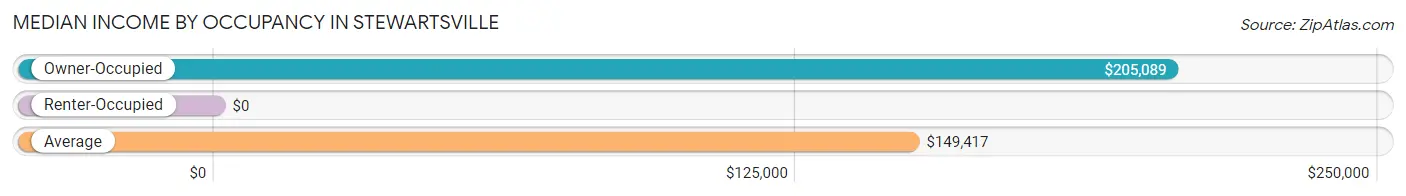
| Occupancy Type | # Households | Median Income |
| Owner-Occupied | 201 (80.1%) | $205,089 |
| Renter-Occupied | 50 (19.9%) | $0 |
| Average | 251 (100.0%) | $149,417 |
Occupancy by Householder Income Bracket in Stewartsville
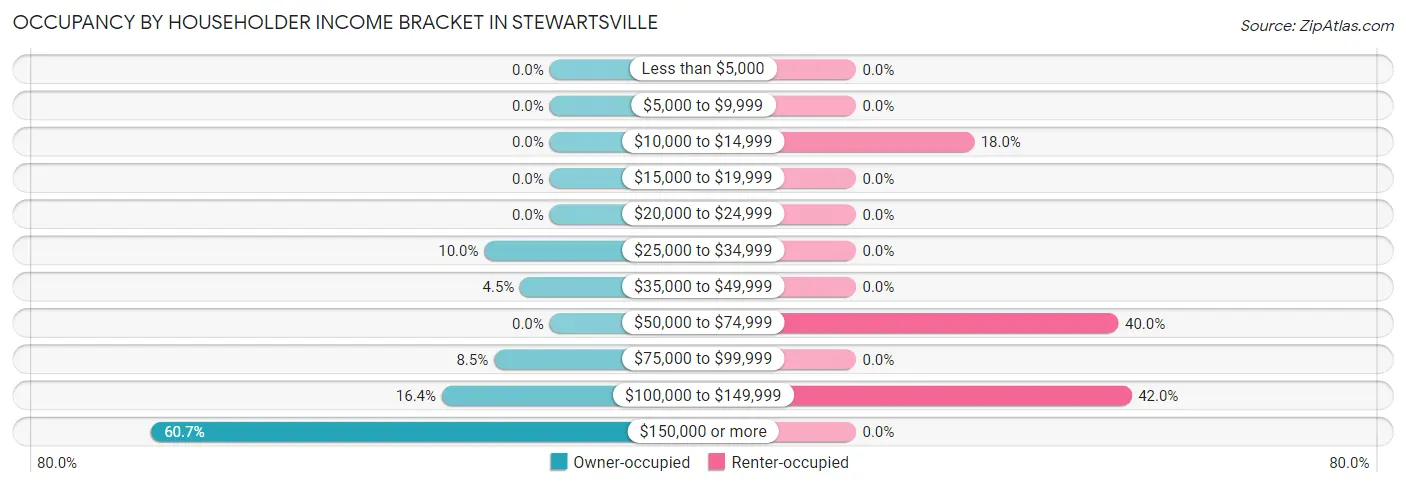
| Income Bracket | Owner-occupied | Renter-occupied |
| Less than $5,000 | 0 (0.0%) | 0 (0.0%) |
| $5,000 to $9,999 | 0 (0.0%) | 0 (0.0%) |
| $10,000 to $14,999 | 0 (0.0%) | 9 (18.0%) |
| $15,000 to $19,999 | 0 (0.0%) | 0 (0.0%) |
| $20,000 to $24,999 | 0 (0.0%) | 0 (0.0%) |
| $25,000 to $34,999 | 20 (10.0%) | 0 (0.0%) |
| $35,000 to $49,999 | 9 (4.5%) | 0 (0.0%) |
| $50,000 to $74,999 | 0 (0.0%) | 20 (40.0%) |
| $75,000 to $99,999 | 17 (8.5%) | 0 (0.0%) |
| $100,000 to $149,999 | 33 (16.4%) | 21 (42.0%) |
| $150,000 or more | 122 (60.7%) | 0 (0.0%) |
| Total | 201 (100.0%) | 50 (100.0%) |
Monthly Housing Cost Tiers in Stewartsville
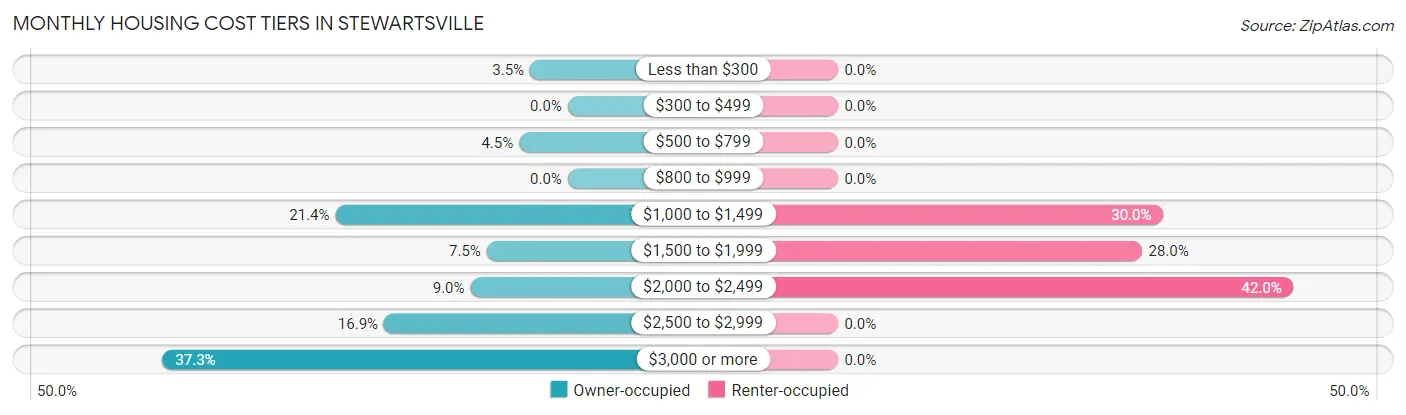
| Monthly Cost | Owner-occupied | Renter-occupied |
| Less than $300 | 7 (3.5%) | 0 (0.0%) |
| $300 to $499 | 0 (0.0%) | 0 (0.0%) |
| $500 to $799 | 9 (4.5%) | 0 (0.0%) |
| $800 to $999 | 0 (0.0%) | 0 (0.0%) |
| $1,000 to $1,499 | 43 (21.4%) | 15 (30.0%) |
| $1,500 to $1,999 | 15 (7.5%) | 14 (28.0%) |
| $2,000 to $2,499 | 18 (9.0%) | 21 (42.0%) |
| $2,500 to $2,999 | 34 (16.9%) | 0 (0.0%) |
| $3,000 or more | 75 (37.3%) | 0 (0.0%) |
| Total | 201 (100.0%) | 50 (100.0%) |
Physical Housing Characteristics in Stewartsville
Housing Structures in Stewartsville
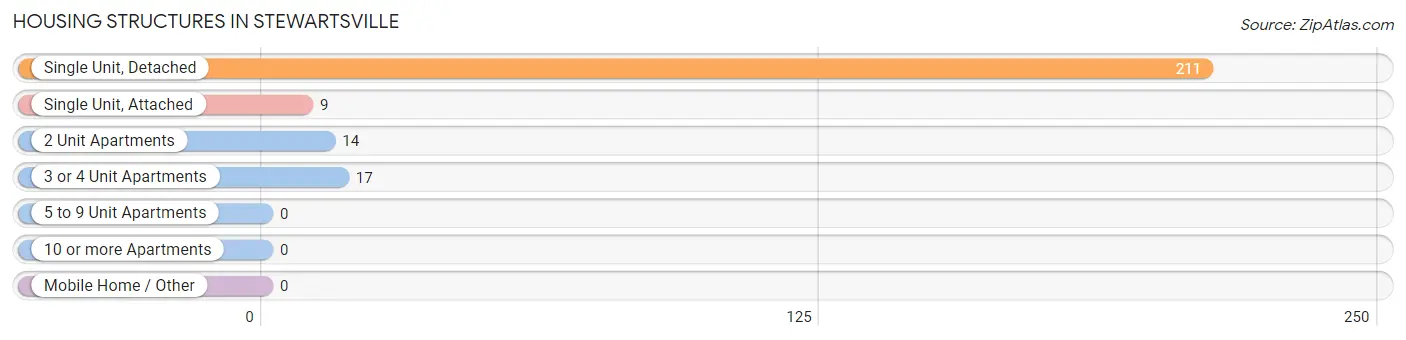
| Structure Type | # Housing Units | % Housing Units |
| Single Unit, Detached | 211 | 84.1% |
| Single Unit, Attached | 9 | 3.6% |
| 2 Unit Apartments | 14 | 5.6% |
| 3 or 4 Unit Apartments | 17 | 6.8% |
| 5 to 9 Unit Apartments | 0 | 0.0% |
| 10 or more Apartments | 0 | 0.0% |
| Mobile Home / Other | 0 | 0.0% |
| Total | 251 | 100.0% |
Housing Structures by Occupancy in Stewartsville
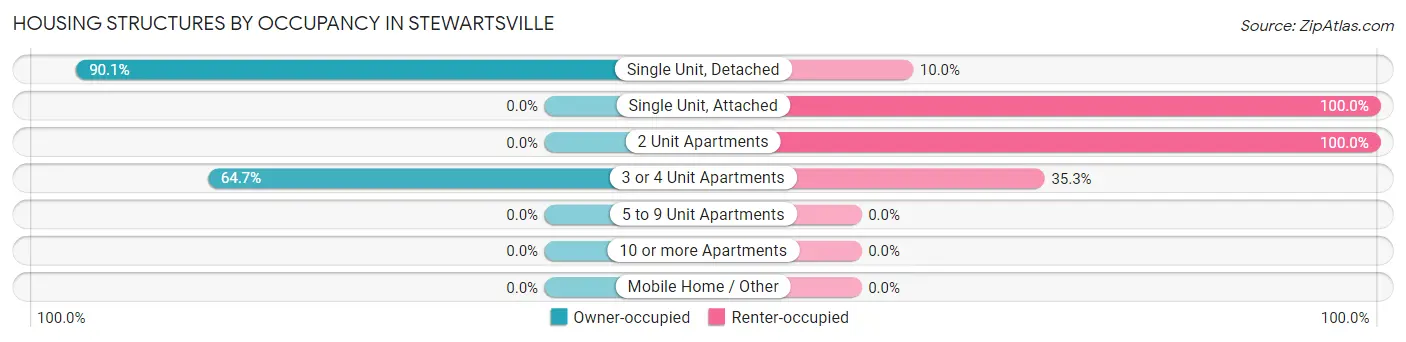
| Structure Type | Owner-occupied | Renter-occupied |
| Single Unit, Detached | 190 (90.0%) | 21 (10.0%) |
| Single Unit, Attached | 0 (0.0%) | 9 (100.0%) |
| 2 Unit Apartments | 0 (0.0%) | 14 (100.0%) |
| 3 or 4 Unit Apartments | 11 (64.7%) | 6 (35.3%) |
| 5 to 9 Unit Apartments | 0 (0.0%) | 0 (0.0%) |
| 10 or more Apartments | 0 (0.0%) | 0 (0.0%) |
| Mobile Home / Other | 0 (0.0%) | 0 (0.0%) |
| Total | 201 (80.1%) | 50 (19.9%) |
Housing Structures by Number of Rooms in Stewartsville
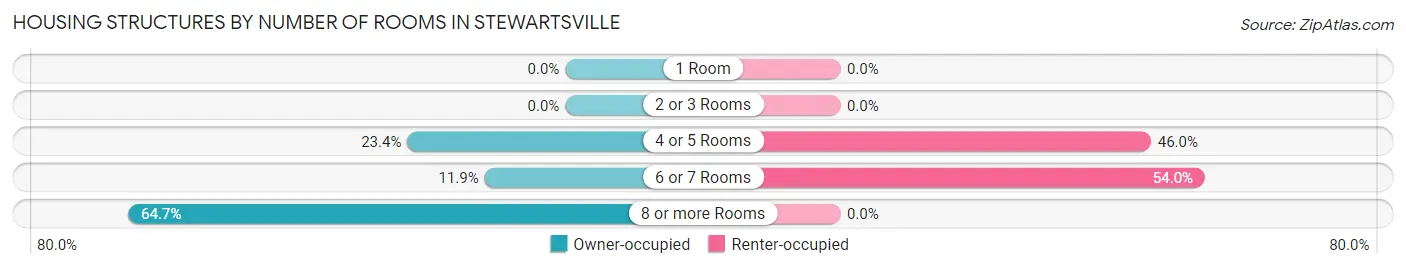
| Number of Rooms | Owner-occupied | Renter-occupied |
| 1 Room | 0 (0.0%) | 0 (0.0%) |
| 2 or 3 Rooms | 0 (0.0%) | 0 (0.0%) |
| 4 or 5 Rooms | 47 (23.4%) | 23 (46.0%) |
| 6 or 7 Rooms | 24 (11.9%) | 27 (54.0%) |
| 8 or more Rooms | 130 (64.7%) | 0 (0.0%) |
| Total | 201 (100.0%) | 50 (100.0%) |
Housing Structure by Heating Type in Stewartsville
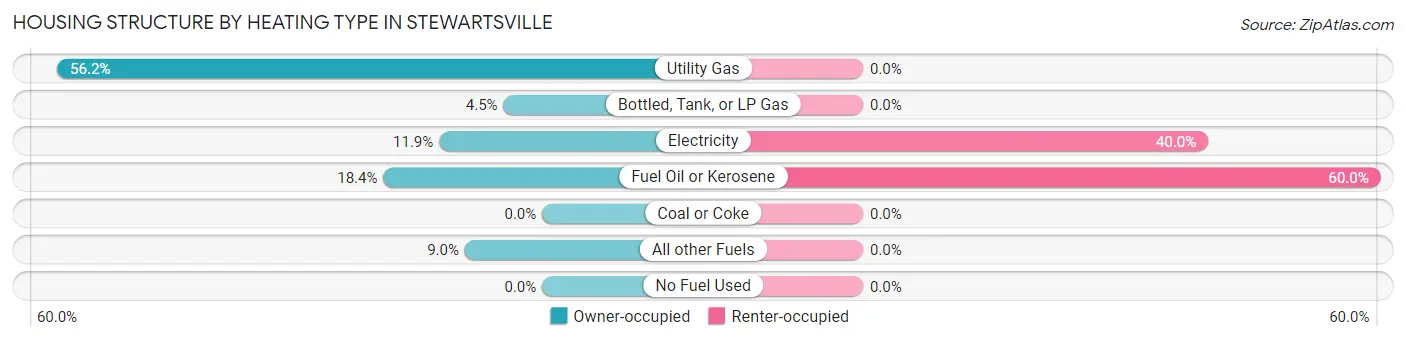
| Heating Type | Owner-occupied | Renter-occupied |
| Utility Gas | 113 (56.2%) | 0 (0.0%) |
| Bottled, Tank, or LP Gas | 9 (4.5%) | 0 (0.0%) |
| Electricity | 24 (11.9%) | 20 (40.0%) |
| Fuel Oil or Kerosene | 37 (18.4%) | 30 (60.0%) |
| Coal or Coke | 0 (0.0%) | 0 (0.0%) |
| All other Fuels | 18 (9.0%) | 0 (0.0%) |
| No Fuel Used | 0 (0.0%) | 0 (0.0%) |
| Total | 201 (100.0%) | 50 (100.0%) |
Household Vehicle Usage in Stewartsville
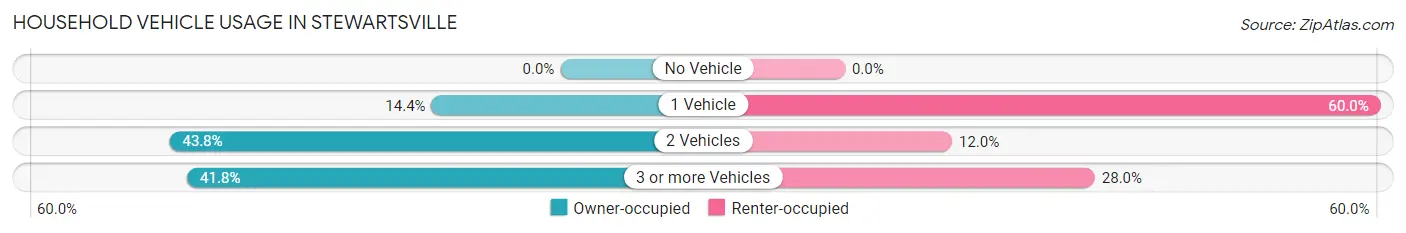
| Vehicles per Household | Owner-occupied | Renter-occupied |
| No Vehicle | 0 (0.0%) | 0 (0.0%) |
| 1 Vehicle | 29 (14.4%) | 30 (60.0%) |
| 2 Vehicles | 88 (43.8%) | 6 (12.0%) |
| 3 or more Vehicles | 84 (41.8%) | 14 (28.0%) |
| Total | 201 (100.0%) | 50 (100.0%) |
Real Estate & Mortgages in Stewartsville
Real Estate and Mortgage Overview in Stewartsville
| Characteristic | Without Mortgage | With Mortgage |
| Housing Units | 41 | 160 |
| Median Property Value | $430,600 | $416,000 |
| Median Household Income | $148,083 | $113 |
| Monthly Housing Costs | $1,028 | $75 |
| Real Estate Taxes | $8,750 | $0 |
Property Value by Mortgage Status in Stewartsville
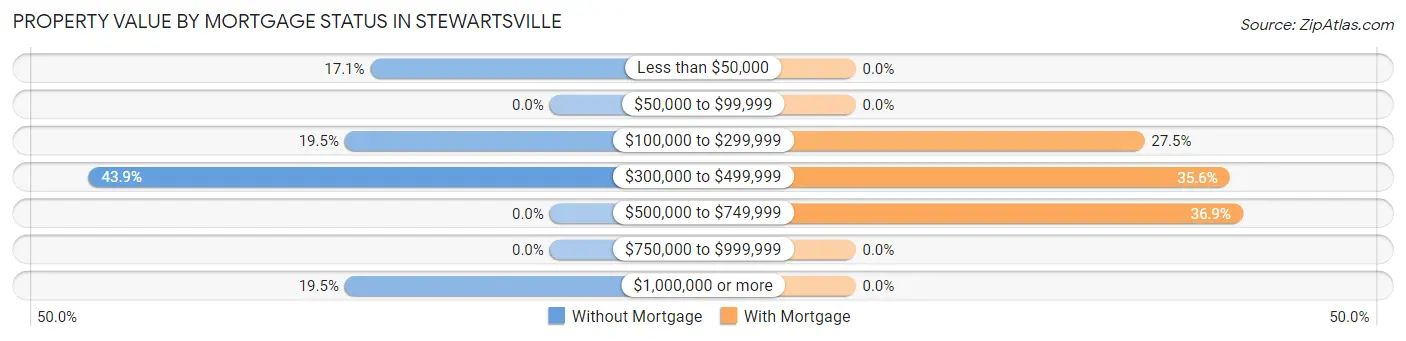
| Property Value | Without Mortgage | With Mortgage |
| Less than $50,000 | 7 (17.1%) | 0 (0.0%) |
| $50,000 to $99,999 | 0 (0.0%) | 0 (0.0%) |
| $100,000 to $299,999 | 8 (19.5%) | 44 (27.5%) |
| $300,000 to $499,999 | 18 (43.9%) | 57 (35.6%) |
| $500,000 to $749,999 | 0 (0.0%) | 59 (36.9%) |
| $750,000 to $999,999 | 0 (0.0%) | 0 (0.0%) |
| $1,000,000 or more | 8 (19.5%) | 0 (0.0%) |
| Total | 41 (100.0%) | 160 (100.0%) |
Household Income by Mortgage Status in Stewartsville
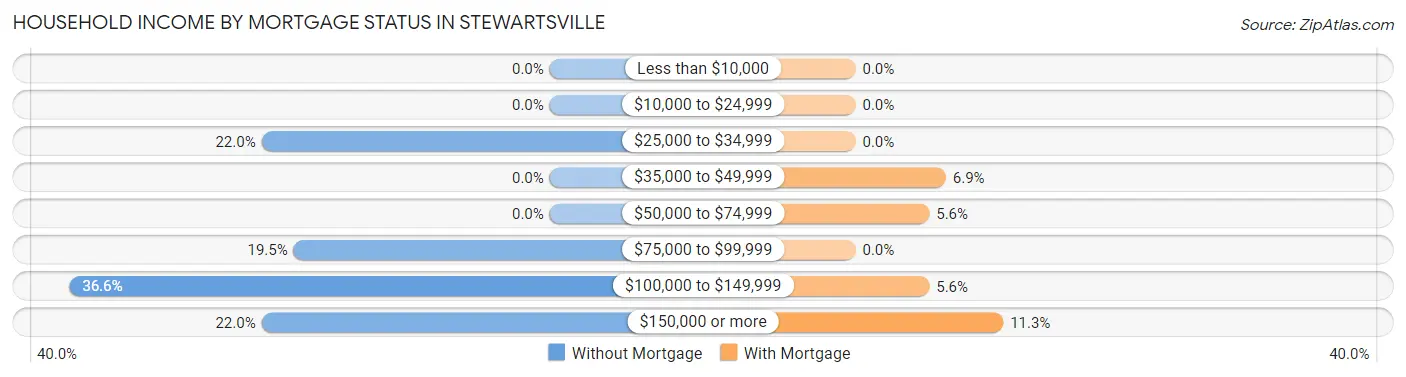
| Household Income | Without Mortgage | With Mortgage |
| Less than $10,000 | 0 (0.0%) | 0 (0.0%) |
| $10,000 to $24,999 | 0 (0.0%) | 0 (0.0%) |
| $25,000 to $34,999 | 9 (22.0%) | 0 (0.0%) |
| $35,000 to $49,999 | 0 (0.0%) | 11 (6.9%) |
| $50,000 to $74,999 | 0 (0.0%) | 9 (5.6%) |
| $75,000 to $99,999 | 8 (19.5%) | 0 (0.0%) |
| $100,000 to $149,999 | 15 (36.6%) | 9 (5.6%) |
| $150,000 or more | 9 (22.0%) | 18 (11.3%) |
| Total | 41 (100.0%) | 160 (100.0%) |
Property Value to Household Income Ratio in Stewartsville
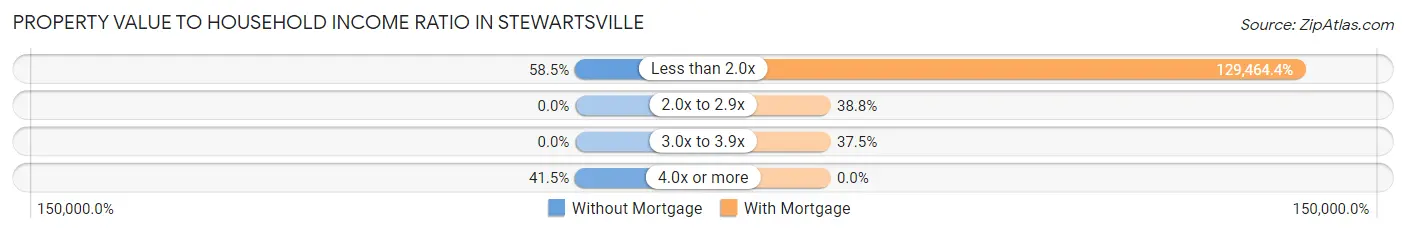
| Value-to-Income Ratio | Without Mortgage | With Mortgage |
| Less than 2.0x | 24 (58.5%) | 207,143 (129,464.4%) |
| 2.0x to 2.9x | 0 (0.0%) | 62 (38.8%) |
| 3.0x to 3.9x | 0 (0.0%) | 60 (37.5%) |
| 4.0x or more | 17 (41.5%) | 0 (0.0%) |
| Total | 41 (100.0%) | 160 (100.0%) |
Real Estate Taxes by Mortgage Status in Stewartsville
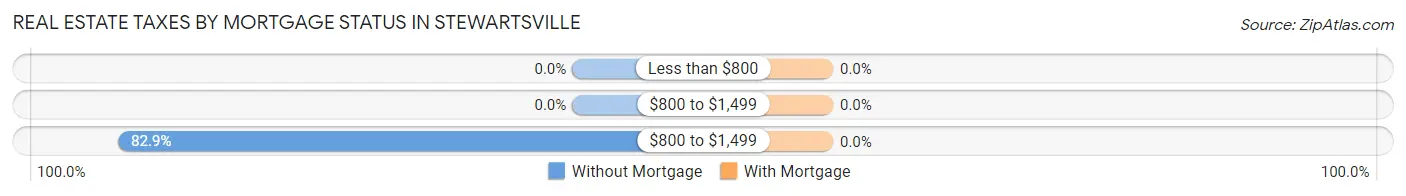
| Property Taxes | Without Mortgage | With Mortgage |
| Less than $800 | 0 (0.0%) | 0 (0.0%) |
| $800 to $1,499 | 0 (0.0%) | 0 (0.0%) |
| $800 to $1,499 | 34 (82.9%) | 0 (0.0%) |
| Total | 41 (100.0%) | 160 (100.0%) |
Health & Disability in Stewartsville
Health Insurance Coverage by Age in Stewartsville
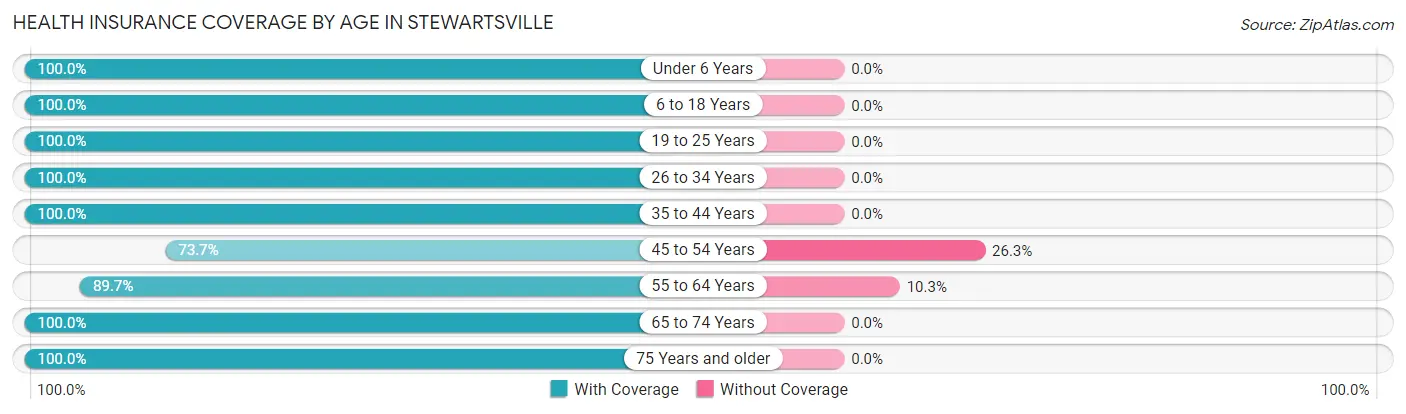
| Age Bracket | With Coverage | Without Coverage |
| Under 6 Years | 44 (100.0%) | 0 (0.0%) |
| 6 to 18 Years | 116 (100.0%) | 0 (0.0%) |
| 19 to 25 Years | 56 (100.0%) | 0 (0.0%) |
| 26 to 34 Years | 37 (100.0%) | 0 (0.0%) |
| 35 to 44 Years | 89 (100.0%) | 0 (0.0%) |
| 45 to 54 Years | 73 (73.7%) | 26 (26.3%) |
| 55 to 64 Years | 78 (89.7%) | 9 (10.3%) |
| 65 to 74 Years | 68 (100.0%) | 0 (0.0%) |
| 75 Years and older | 20 (100.0%) | 0 (0.0%) |
| Total | 581 (94.3%) | 35 (5.7%) |
Health Insurance Coverage by Citizenship Status in Stewartsville
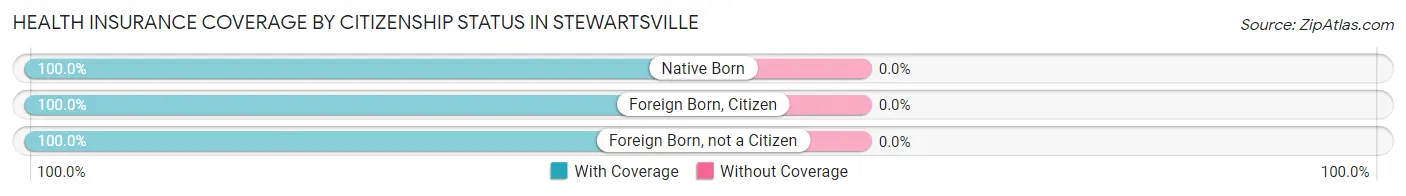
| Citizenship Status | With Coverage | Without Coverage |
| Native Born | 44 (100.0%) | 0 (0.0%) |
| Foreign Born, Citizen | 116 (100.0%) | 0 (0.0%) |
| Foreign Born, not a Citizen | 56 (100.0%) | 0 (0.0%) |
Health Insurance Coverage by Household Income in Stewartsville
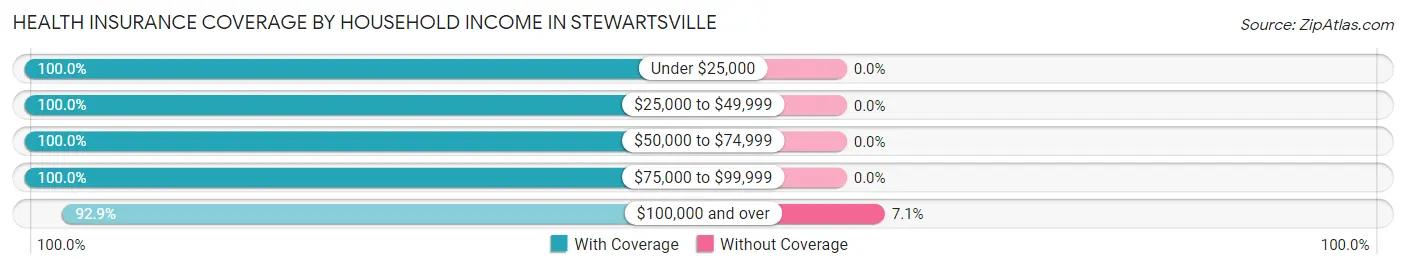
| Household Income | With Coverage | Without Coverage |
| Under $25,000 | 9 (100.0%) | 0 (0.0%) |
| $25,000 to $49,999 | 29 (100.0%) | 0 (0.0%) |
| $50,000 to $74,999 | 70 (100.0%) | 0 (0.0%) |
| $75,000 to $99,999 | 17 (100.0%) | 0 (0.0%) |
| $100,000 and over | 456 (92.9%) | 35 (7.1%) |
Public vs Private Health Insurance Coverage by Age in Stewartsville
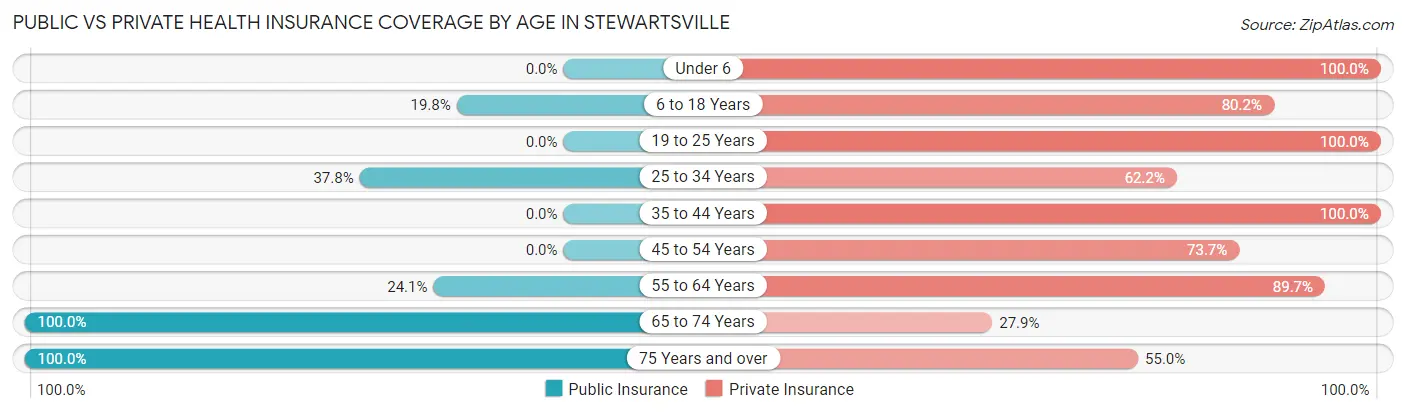
| Age Bracket | Public Insurance | Private Insurance |
| Under 6 | 0 (0.0%) | 44 (100.0%) |
| 6 to 18 Years | 23 (19.8%) | 93 (80.2%) |
| 19 to 25 Years | 0 (0.0%) | 56 (100.0%) |
| 25 to 34 Years | 14 (37.8%) | 23 (62.2%) |
| 35 to 44 Years | 0 (0.0%) | 89 (100.0%) |
| 45 to 54 Years | 0 (0.0%) | 73 (73.7%) |
| 55 to 64 Years | 21 (24.1%) | 78 (89.7%) |
| 65 to 74 Years | 68 (100.0%) | 19 (27.9%) |
| 75 Years and over | 20 (100.0%) | 11 (55.0%) |
| Total | 146 (23.7%) | 486 (78.9%) |
Disability Status by Sex by Age in Stewartsville
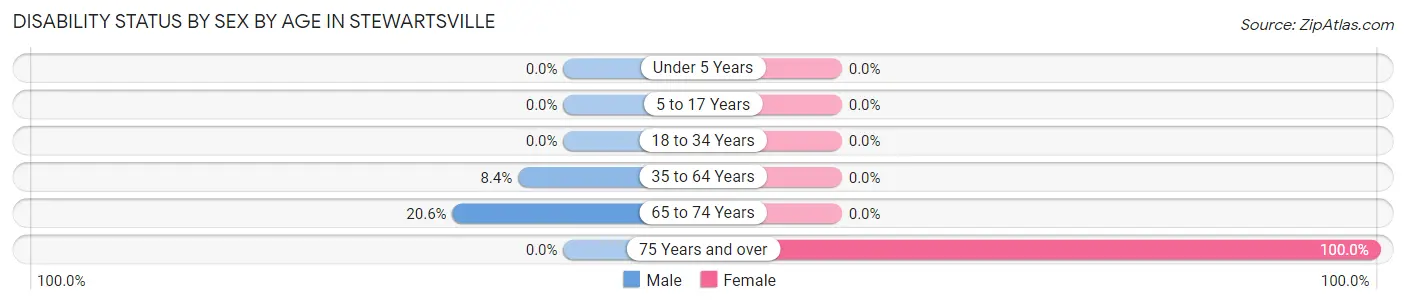
| Age Bracket | Male | Female |
| Under 5 Years | 0 (0.0%) | 0 (0.0%) |
| 5 to 17 Years | 0 (0.0%) | 0 (0.0%) |
| 18 to 34 Years | 0 (0.0%) | 0 (0.0%) |
| 35 to 64 Years | 9 (8.4%) | 0 (0.0%) |
| 65 to 74 Years | 7 (20.6%) | 0 (0.0%) |
| 75 Years and over | 0 (0.0%) | 20 (100.0%) |
Disability Class by Sex by Age in Stewartsville
Disability Class: Hearing Difficulty
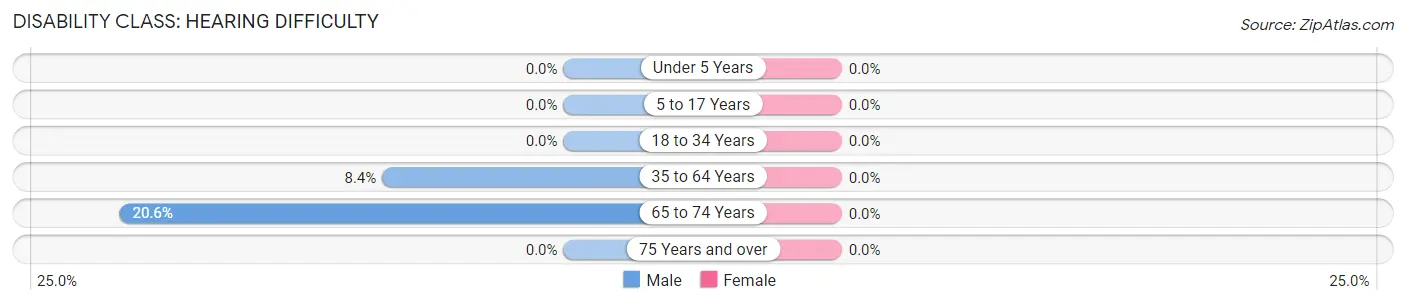
| Age Bracket | Male | Female |
| Under 5 Years | 0 (0.0%) | 0 (0.0%) |
| 5 to 17 Years | 0 (0.0%) | 0 (0.0%) |
| 18 to 34 Years | 0 (0.0%) | 0 (0.0%) |
| 35 to 64 Years | 9 (8.4%) | 0 (0.0%) |
| 65 to 74 Years | 7 (20.6%) | 0 (0.0%) |
| 75 Years and over | 0 (0.0%) | 0 (0.0%) |
Disability Class: Vision Difficulty
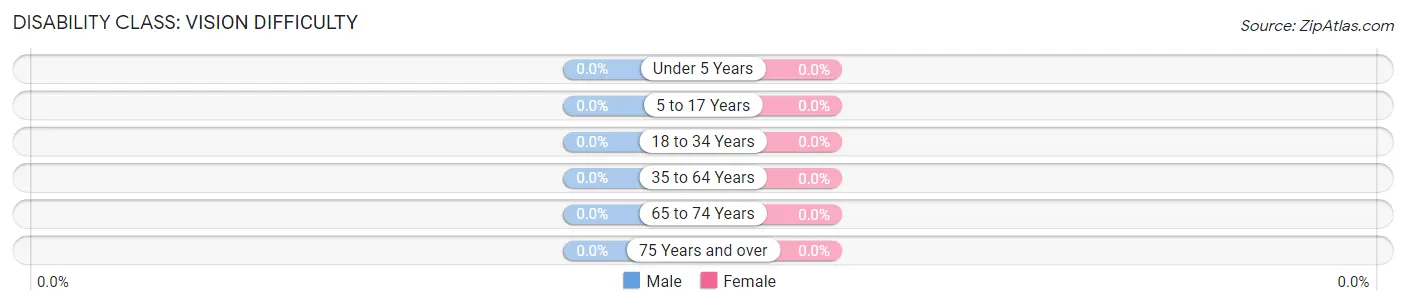
| Age Bracket | Male | Female |
| Under 5 Years | 0 (0.0%) | 0 (0.0%) |
| 5 to 17 Years | 0 (0.0%) | 0 (0.0%) |
| 18 to 34 Years | 0 (0.0%) | 0 (0.0%) |
| 35 to 64 Years | 0 (0.0%) | 0 (0.0%) |
| 65 to 74 Years | 0 (0.0%) | 0 (0.0%) |
| 75 Years and over | 0 (0.0%) | 0 (0.0%) |
Disability Class: Cognitive Difficulty
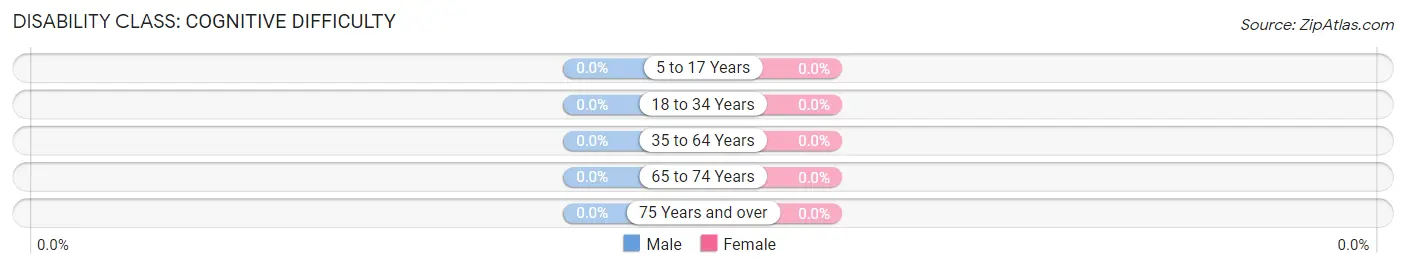
| Age Bracket | Male | Female |
| 5 to 17 Years | 0 (0.0%) | 0 (0.0%) |
| 18 to 34 Years | 0 (0.0%) | 0 (0.0%) |
| 35 to 64 Years | 0 (0.0%) | 0 (0.0%) |
| 65 to 74 Years | 0 (0.0%) | 0 (0.0%) |
| 75 Years and over | 0 (0.0%) | 0 (0.0%) |
Disability Class: Ambulatory Difficulty
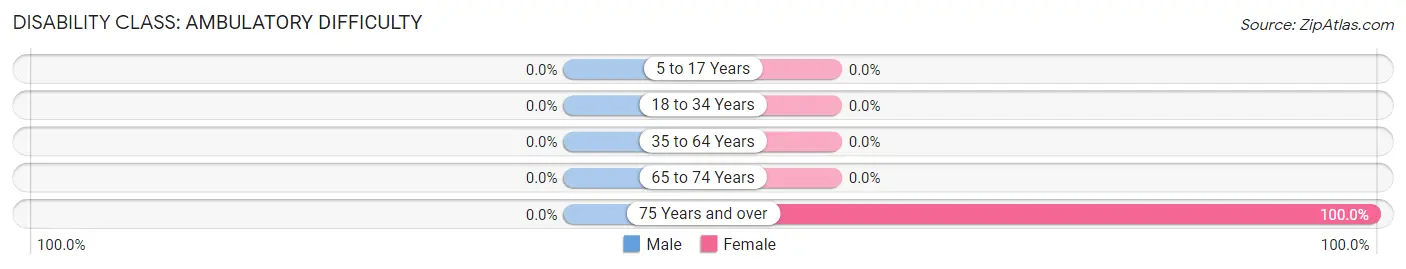
| Age Bracket | Male | Female |
| 5 to 17 Years | 0 (0.0%) | 0 (0.0%) |
| 18 to 34 Years | 0 (0.0%) | 0 (0.0%) |
| 35 to 64 Years | 0 (0.0%) | 0 (0.0%) |
| 65 to 74 Years | 0 (0.0%) | 0 (0.0%) |
| 75 Years and over | 0 (0.0%) | 20 (100.0%) |
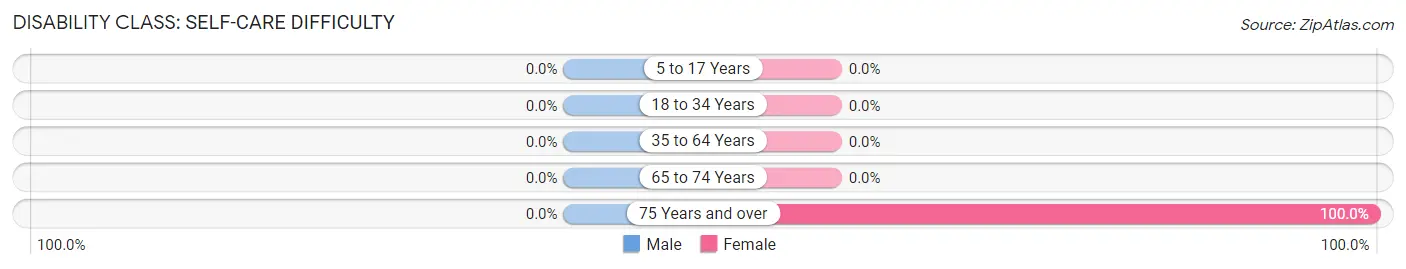
Disability Class: Self-Care Difficulty
| Age Bracket | Male | Female |
| 5 to 17 Years | 0 (0.0%) | 0 (0.0%) |
| 18 to 34 Years | 0 (0.0%) | 0 (0.0%) |
| 35 to 64 Years | 0 (0.0%) | 0 (0.0%) |
| 65 to 74 Years | 0 (0.0%) | 0 (0.0%) |
| 75 Years and over | 0 (0.0%) | 20 (100.0%) |
Technology Access in Stewartsville
Computing Device Access in Stewartsville
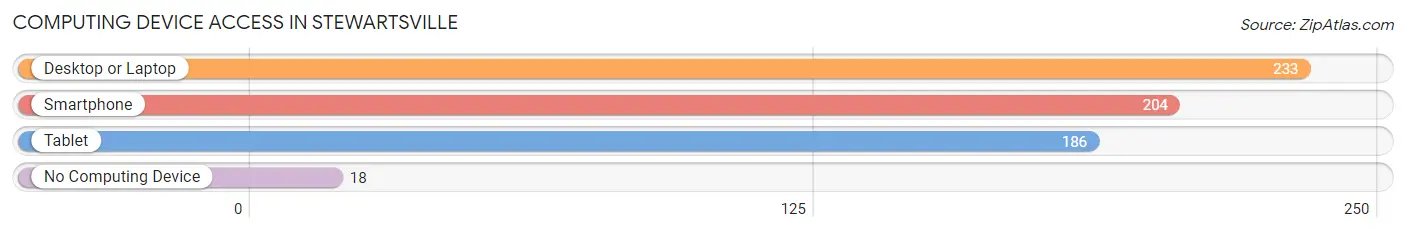
| Device Type | # Households | % Households |
| Desktop or Laptop | 233 | 92.8% |
| Smartphone | 204 | 81.3% |
| Tablet | 186 | 74.1% |
| No Computing Device | 18 | 7.2% |
| Total | 251 | 100.0% |
Internet Access in Stewartsville
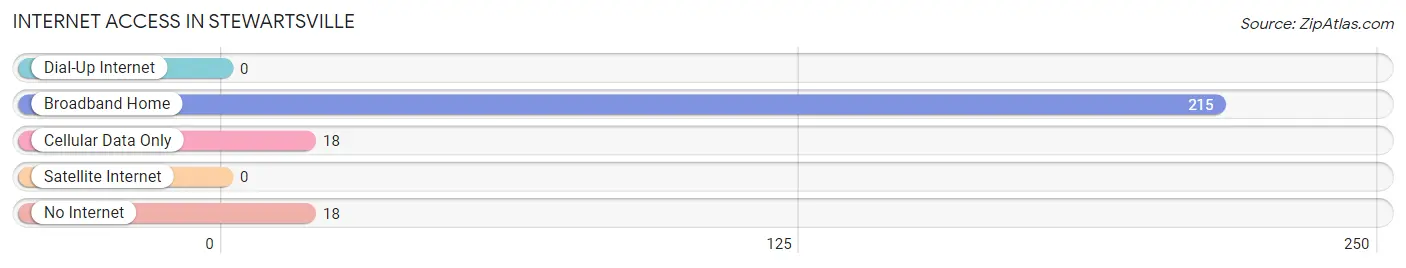
| Internet Type | # Households | % Households |
| Dial-Up Internet | 0 | 0.0% |
| Broadband Home | 215 | 85.7% |
| Cellular Data Only | 18 | 7.2% |
| Satellite Internet | 0 | 0.0% |
| No Internet | 18 | 7.2% |
| Total | 251 | 100.0% |
Stewartsville Summary
Stewartsville is a small borough located in Warren County, New Jersey. It is situated in the northwest corner of the state, near the Delaware River. The borough was incorporated in 1845 and is home to a population of approximately 1,400 people.
Geography
Stewartsville is located at 40°45'N 75°10'W (40.75, -75.17). It is situated in the northwest corner of Warren County, near the Delaware River. The borough is bordered by Pohatcong Township to the north, Greenwich Township to the east, Lopatcong Township to the south, and the Delaware River to the west. The total area of the borough is 0.9 square miles, all of which is land.
The terrain of Stewartsville is mostly flat, with some rolling hills. The borough is located in the Kittatinny Valley, which is part of the Great Appalachian Valley. The climate is humid continental, with hot, humid summers and cold, snowy winters.
Economy
The economy of Stewartsville is largely based on agriculture and tourism. The borough is home to several farms, which produce a variety of crops, including corn, soybeans, and hay. The borough also has several wineries, which attract tourists from all over the region.
In addition to agriculture and tourism, Stewartsville is home to several small businesses, including restaurants, retail stores, and professional services. The borough is also home to a few light industrial businesses, such as a printing company and a machine shop.
Demographics
As of the 2010 census, the population of Stewartsville was 1,400. The racial makeup of the borough was 94.3% White, 2.3% African American, 0.7% Asian, 0.3% Native American, and 2.4% from other races. Hispanic or Latino of any race were 5.3% of the population.
The median household income in Stewartsville was $60,000, and the median family income was $68,000. The per capita income was $25,000. About 8.3% of the population was below the poverty line.
The population of Stewartsville is largely made up of families. About 60% of households are married couples, and about 25% of households have children under the age of 18. The median age of the population is 40.
Conclusion
Stewartsville is a small borough located in Warren County, New Jersey. It is situated in the northwest corner of the state, near the Delaware River. The borough was incorporated in 1845 and is home to a population of approximately 1,400 people. The economy of Stewartsville is largely based on agriculture and tourism, and the population is largely made up of families. The median household income in Stewartsville is $60,000, and the median family income is $68,000. The per capita income is $25,000.
Common Questions
What is Per Capita Income in Stewartsville?
Per Capita income in Stewartsville is $64,169.
What is the Median Family Income in Stewartsville?
Median Family Income in Stewartsville is $186,477.
What is the Median Household income in Stewartsville?
Median Household Income in Stewartsville is $149,417.
What is Income or Wage Gap in Stewartsville?
Income or Wage Gap in Stewartsville is 38.4%.
Women in Stewartsville earn 61.6 cents for every dollar earned by a man.
What is Inequality or Gini Index in Stewartsville?
Inequality or Gini Index in Stewartsville is 0.36.
What is the Total Population of Stewartsville?
Total Population of Stewartsville is 616.
What is the Total Male Population of Stewartsville?
Total Male Population of Stewartsville is 243.
What is the Total Female Population of Stewartsville?
Total Female Population of Stewartsville is 373.
What is the Ratio of Males per 100 Females in Stewartsville?
There are 65.15 Males per 100 Females in Stewartsville.
What is the Ratio of Females per 100 Males in Stewartsville?
There are 153.50 Females per 100 Males in Stewartsville.
What is the Median Population Age in Stewartsville?
Median Population Age in Stewartsville is 41.3 Years.
What is the Average Family Size in Stewartsville
Average Family Size in Stewartsville is 2.8 People.
What is the Average Household Size in Stewartsville
Average Household Size in Stewartsville is 2.5 People.
How Large is the Labor Force in Stewartsville?
There are 368 People in the Labor Forcein in Stewartsville.
What is the Percentage of People in the Labor Force in Stewartsville?
78.3% of People are in the Labor Force in Stewartsville.
What is the Unemployment Rate in Stewartsville?
Unemployment Rate in Stewartsville is 5.4%.