Salem, NJ Map & Demographics
Salem Map
Salem Overview
$21,330
PER CAPITA INCOME
$48,936
AVG FAMILY INCOME
$35,143
AVG HOUSEHOLD INCOME
33.7%
WAGE / INCOME GAP [ % ]
66.3¢/ $1
WAGE / INCOME GAP [ $ ]
0.47
INEQUALITY / GINI INDEX
5,285
TOTAL POPULATION
2,323
MALE POPULATION
2,962
FEMALE POPULATION
78.43
MALES / 100 FEMALES
127.51
FEMALES / 100 MALES
34.6
MEDIAN AGE
3.4
AVG FAMILY SIZE
2.4
AVG HOUSEHOLD SIZE
2,089
LABOR FORCE [ PEOPLE ]
54.4%
PERCENT IN LABOR FORCE
12.5%
UNEMPLOYMENT RATE
Salem Zip Codes
Income in Salem
Income Overview in Salem
Per Capita Income in Salem is $21,330, while median incomes of families and households are $48,936 and $35,143 respectively.
| Characteristic | Number | Measure |
| Per Capita Income | 5,285 | $21,330 |
| Median Family Income | 1,113 | $48,936 |
| Mean Family Income | 1,113 | $64,474 |
| Median Household Income | 2,172 | $35,143 |
| Mean Household Income | 2,172 | $47,188 |
| Income Deficit | 1,113 | $0 |
| Wage / Income Gap (%) | 5,285 | 33.69% |
| Wage / Income Gap ($) | 5,285 | 66.31¢ per $1 |
| Gini / Inequality Index | 5,285 | 0.47 |
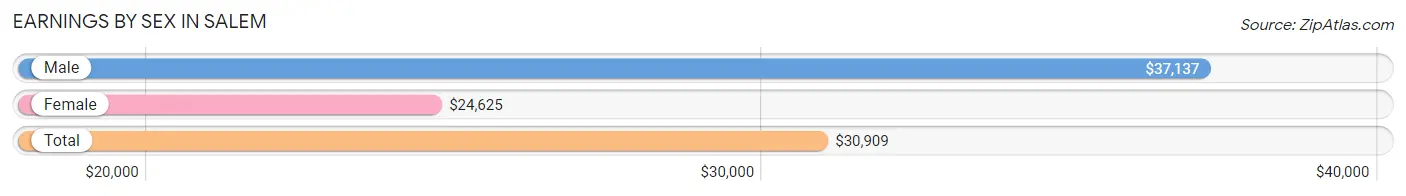
Earnings by Sex in Salem
Average Earnings in Salem are $30,909, $37,137 for men and $24,625 for women, a difference of 33.7%.
| Sex | Number | Average Earnings |
| Male | 899 (43.4%) | $37,137 |
| Female | 1,171 (56.6%) | $24,625 |
| Total | 2,070 (100.0%) | $30,909 |
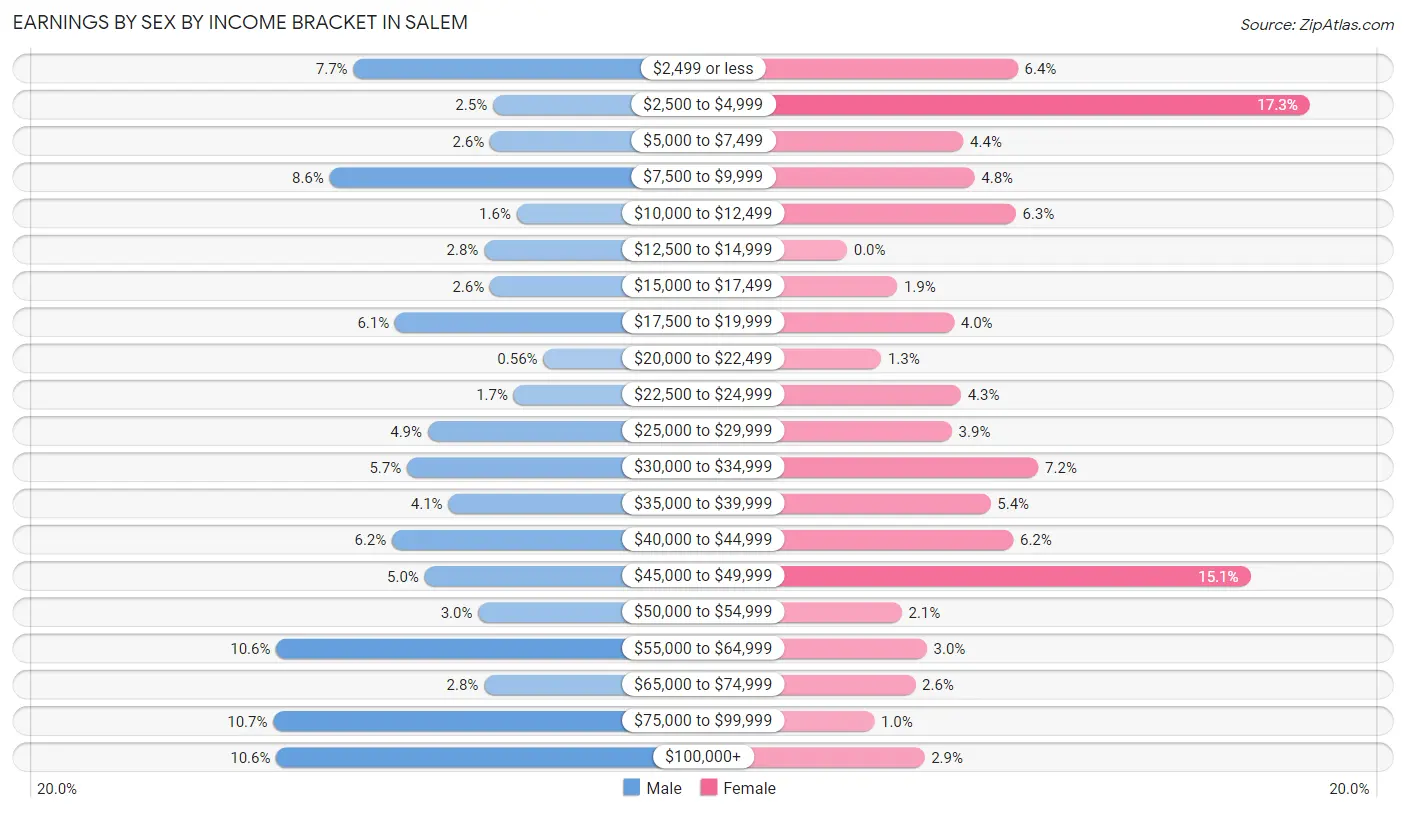
Earnings by Sex by Income Bracket in Salem
The most common earnings brackets in Salem are $75,000 to $99,999 for men (96 | 10.7%) and $2,500 to $4,999 for women (203 | 17.3%).
| Income | Male | Female |
| $2,499 or less | 69 (7.7%) | 75 (6.4%) |
| $2,500 to $4,999 | 22 (2.5%) | 203 (17.3%) |
| $5,000 to $7,499 | 23 (2.6%) | 51 (4.4%) |
| $7,500 to $9,999 | 77 (8.6%) | 56 (4.8%) |
| $10,000 to $12,499 | 14 (1.6%) | 74 (6.3%) |
| $12,500 to $14,999 | 25 (2.8%) | 0 (0.0%) |
| $15,000 to $17,499 | 23 (2.6%) | 22 (1.9%) |
| $17,500 to $19,999 | 55 (6.1%) | 47 (4.0%) |
| $20,000 to $22,499 | 5 (0.6%) | 15 (1.3%) |
| $22,500 to $24,999 | 15 (1.7%) | 50 (4.3%) |
| $25,000 to $29,999 | 44 (4.9%) | 46 (3.9%) |
| $30,000 to $34,999 | 51 (5.7%) | 84 (7.2%) |
| $35,000 to $39,999 | 37 (4.1%) | 63 (5.4%) |
| $40,000 to $44,999 | 56 (6.2%) | 73 (6.2%) |
| $45,000 to $49,999 | 45 (5.0%) | 177 (15.1%) |
| $50,000 to $54,999 | 27 (3.0%) | 24 (2.1%) |
| $55,000 to $64,999 | 95 (10.6%) | 35 (3.0%) |
| $65,000 to $74,999 | 25 (2.8%) | 30 (2.6%) |
| $75,000 to $99,999 | 96 (10.7%) | 12 (1.0%) |
| $100,000+ | 95 (10.6%) | 34 (2.9%) |
| Total | 899 (100.0%) | 1,171 (100.0%) |
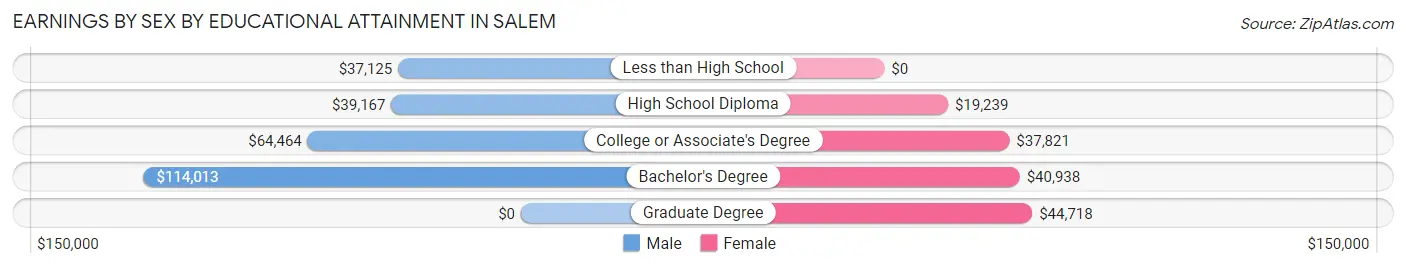
Earnings by Sex by Educational Attainment in Salem
Average earnings in Salem are $46,875 for men and $30,705 for women, a difference of 34.5%. Men with an educational attainment of bachelor's degree enjoy the highest average annual earnings of $114,013, while those with less than high school education earn the least with $37,125. Women with an educational attainment of graduate degree earn the most with the average annual earnings of $44,718, while those with high school diploma education have the smallest earnings of $19,239.
| Educational Attainment | Male Income | Female Income |
| Less than High School | $37,125 | $0 |
| High School Diploma | $39,167 | $19,239 |
| College or Associate's Degree | $64,464 | $37,821 |
| Bachelor's Degree | $114,013 | $40,938 |
| Graduate Degree | - | - |
| Total | $46,875 | $30,705 |
Family Income in Salem
Family Income Brackets in Salem
According to the Salem family income data, there are 357 families falling into the $35,000 to $49,999 income range, which is the most common income bracket and makes up 32.1% of all families. Conversely, the $150,000 to $199,999 income bracket is the least frequent group with only 24 families (2.2%) belonging to this category.
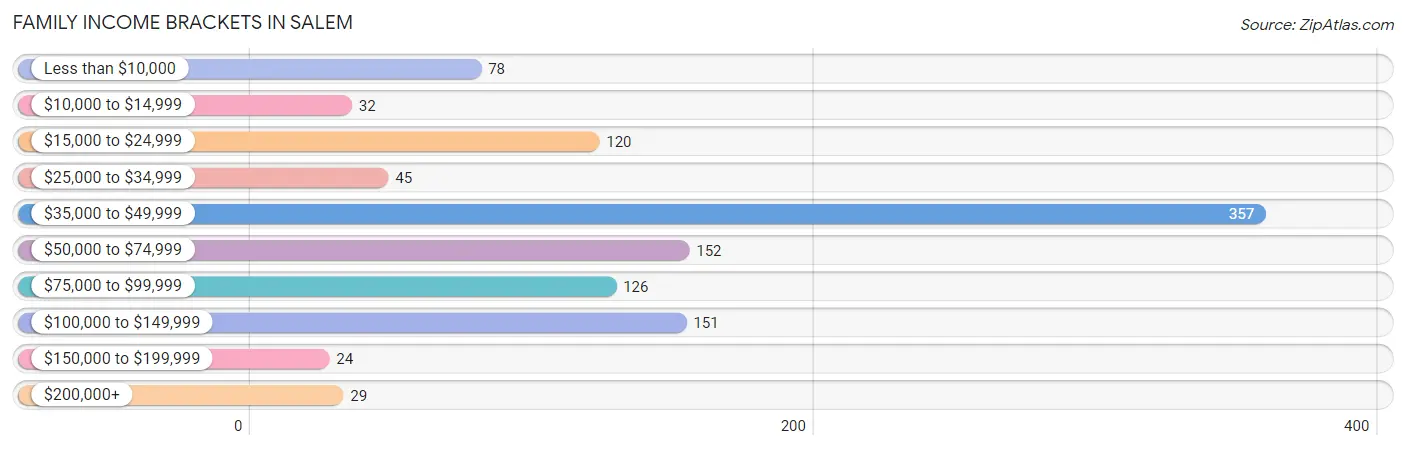
| Income Bracket | # Families | % Families |
| Less than $10,000 | 78 | 7.0% |
| $10,000 to $14,999 | 32 | 2.9% |
| $15,000 to $24,999 | 120 | 10.8% |
| $25,000 to $34,999 | 45 | 4.0% |
| $35,000 to $49,999 | 357 | 32.1% |
| $50,000 to $74,999 | 152 | 13.7% |
| $75,000 to $99,999 | 126 | 11.3% |
| $100,000 to $149,999 | 151 | 13.6% |
| $150,000 to $199,999 | 24 | 2.2% |
| $200,000+ | 29 | 2.6% |
Family Income by Famaliy Size in Salem
2-person families (563 | 50.6%) account for the highest median family income in Salem with $59,125 per family, while 2-person families (563 | 50.6%) have the highest median income of $29,562 per family member.
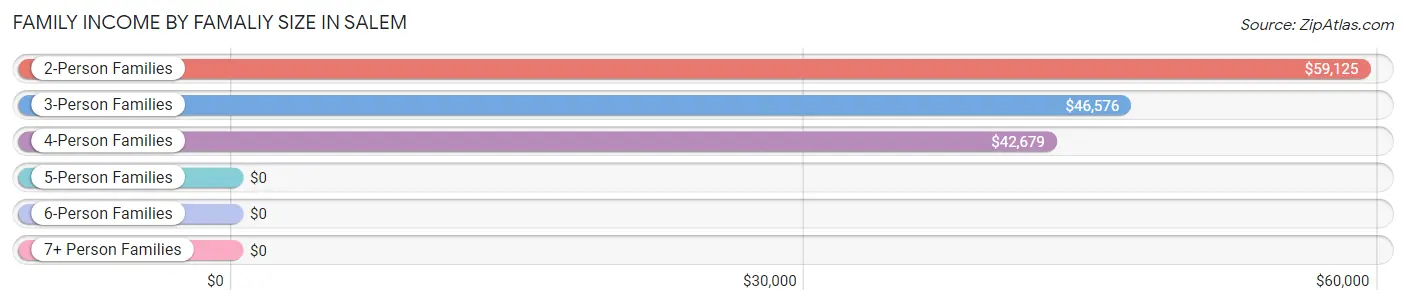
| Income Bracket | # Families | Median Income |
| 2-Person Families | 563 (50.6%) | $59,125 |
| 3-Person Families | 265 (23.8%) | $46,576 |
| 4-Person Families | 211 (19.0%) | $42,679 |
| 5-Person Families | 39 (3.5%) | $0 |
| 6-Person Families | 35 (3.1%) | $0 |
| 7+ Person Families | 0 (0.0%) | $0 |
| Total | 1,113 (100.0%) | $48,936 |
Family Income by Number of Earners in Salem
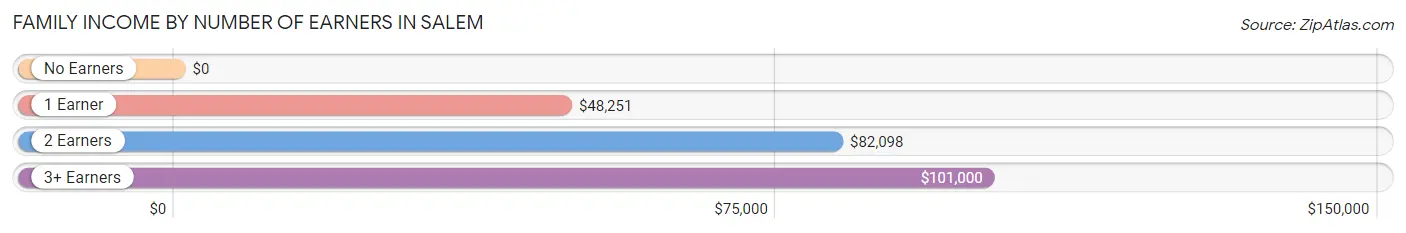
| Number of Earners | # Families | Median Income |
| No Earners | 156 (14.0%) | $0 |
| 1 Earner | 648 (58.2%) | $48,251 |
| 2 Earners | 231 (20.7%) | $82,098 |
| 3+ Earners | 78 (7.0%) | $101,000 |
| Total | 1,113 (100.0%) | $48,936 |
Household Income in Salem
Household Income Brackets in Salem
With 480 households falling in the category, the $10,000 to $14,999 income range is the most frequent in Salem, accounting for 22.1% of all households. In contrast, only 24 households (1.1%) fall into the $150,000 to $199,999 income bracket, making it the least populous group.
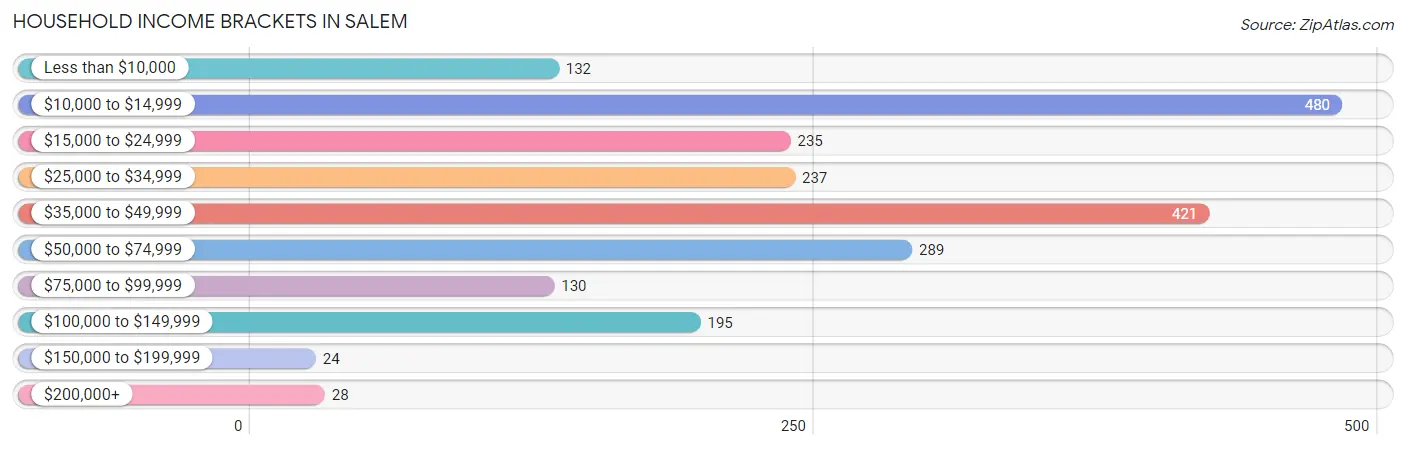
| Income Bracket | # Households | % Households |
| Less than $10,000 | 132 | 6.1% |
| $10,000 to $14,999 | 480 | 22.1% |
| $15,000 to $24,999 | 235 | 10.8% |
| $25,000 to $34,999 | 237 | 10.9% |
| $35,000 to $49,999 | 421 | 19.4% |
| $50,000 to $74,999 | 289 | 13.3% |
| $75,000 to $99,999 | 130 | 6.0% |
| $100,000 to $149,999 | 195 | 9.0% |
| $150,000 to $199,999 | 24 | 1.1% |
| $200,000+ | 28 | 1.3% |
Household Income by Householder Age in Salem
The median household income in Salem is $35,143, with the highest median household income of $48,222 found in the 25 to 44 years age bracket for the primary householder. A total of 649 households (29.9%) fall into this category. Meanwhile, the 15 to 24 years age bracket for the primary householder has the lowest median household income of $0, with 25 households (1.1%) in this group.
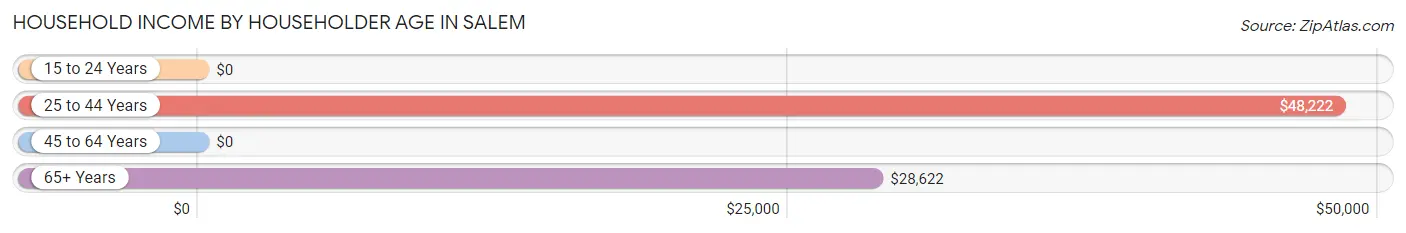
| Income Bracket | # Households | Median Income |
| 15 to 24 Years | 25 (1.1%) | $0 |
| 25 to 44 Years | 649 (29.9%) | $48,222 |
| 45 to 64 Years | 831 (38.3%) | $0 |
| 65+ Years | 667 (30.7%) | $28,622 |
| Total | 2,172 (100.0%) | $35,143 |
Poverty in Salem
Income Below Poverty by Sex and Age in Salem
With 33.4% poverty level for males and 30.2% for females among the residents of Salem, 5 year old males and 18 to 24 year old females are the most vulnerable to poverty, with 26 males (100.0%) and 75 females (57.3%) in their respective age groups living below the poverty level.
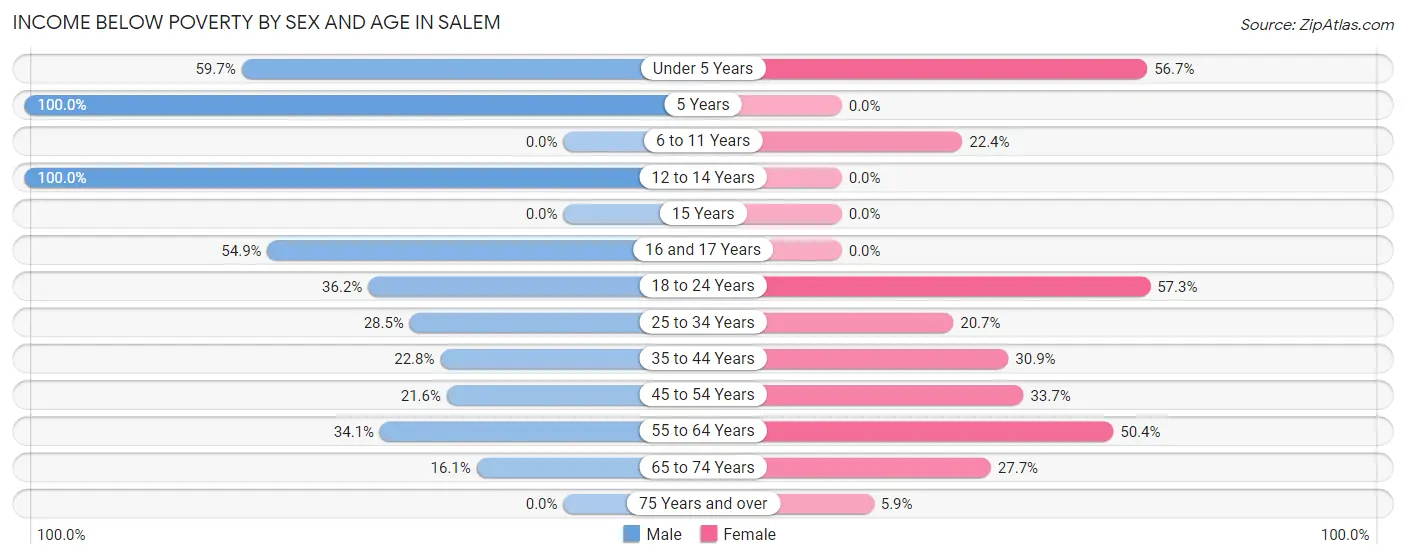
| Age Bracket | Male | Female |
| Under 5 Years | 187 (59.7%) | 144 (56.7%) |
| 5 Years | 26 (100.0%) | 0 (0.0%) |
| 6 to 11 Years | 0 (0.0%) | 111 (22.4%) |
| 12 to 14 Years | 105 (100.0%) | 0 (0.0%) |
| 15 Years | 0 (0.0%) | 0 (0.0%) |
| 16 and 17 Years | 39 (54.9%) | 0 (0.0%) |
| 18 to 24 Years | 75 (36.2%) | 75 (57.3%) |
| 25 to 34 Years | 75 (28.5%) | 107 (20.7%) |
| 35 to 44 Years | 53 (22.8%) | 103 (30.9%) |
| 45 to 54 Years | 37 (21.6%) | 87 (33.7%) |
| 55 to 64 Years | 126 (34.1%) | 190 (50.4%) |
| 65 to 74 Years | 43 (16.1%) | 62 (27.7%) |
| 75 Years and over | 0 (0.0%) | 17 (5.9%) |
| Total | 766 (33.4%) | 896 (30.2%) |
Income Above Poverty by Sex and Age in Salem
According to the poverty statistics in Salem, males aged 6 to 11 years and females aged 12 to 14 years are the age groups that are most secure financially, with 100.0% of males and 100.0% of females in these age groups living above the poverty line.
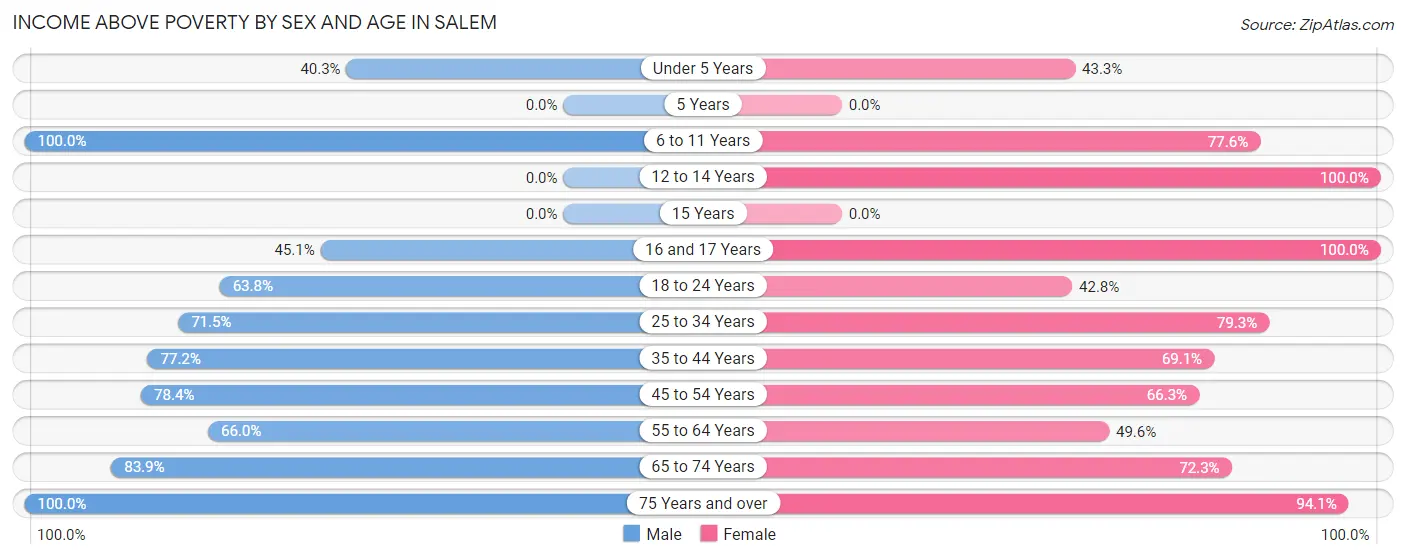
| Age Bracket | Male | Female |
| Under 5 Years | 126 (40.3%) | 110 (43.3%) |
| 5 Years | 0 (0.0%) | 0 (0.0%) |
| 6 to 11 Years | 198 (100.0%) | 385 (77.6%) |
| 12 to 14 Years | 0 (0.0%) | 22 (100.0%) |
| 15 Years | 0 (0.0%) | 0 (0.0%) |
| 16 and 17 Years | 32 (45.1%) | 64 (100.0%) |
| 18 to 24 Years | 132 (63.8%) | 56 (42.7%) |
| 25 to 34 Years | 188 (71.5%) | 410 (79.3%) |
| 35 to 44 Years | 179 (77.2%) | 230 (69.1%) |
| 45 to 54 Years | 134 (78.4%) | 171 (66.3%) |
| 55 to 64 Years | 244 (65.9%) | 187 (49.6%) |
| 65 to 74 Years | 224 (83.9%) | 162 (72.3%) |
| 75 Years and over | 69 (100.0%) | 269 (94.1%) |
| Total | 1,526 (66.6%) | 2,066 (69.8%) |
Income Below Poverty Among Married-Couple Families in Salem
The poverty statistics for married-couple families in Salem show that 10.0% or 49 of the total 491 families live below the poverty line. Families with 3 or 4 children have the highest poverty rate of 55.1%, comprising of 27 families. On the other hand, families with 1 or 2 children have the lowest poverty rate of 0.0%, which includes 0 families.
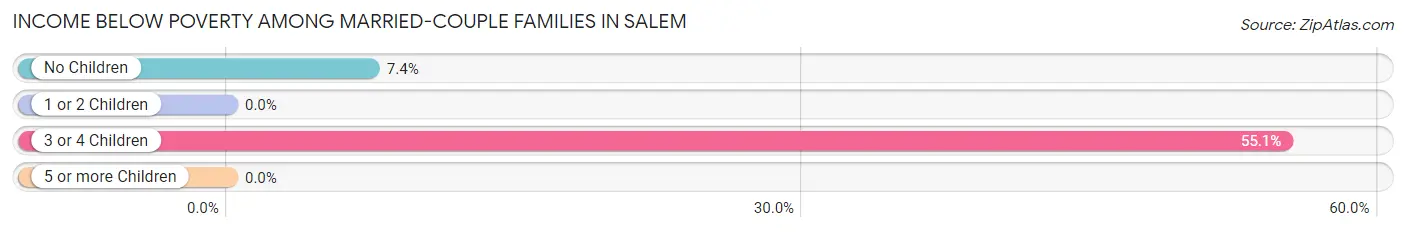
| Children | Above Poverty | Below Poverty |
| No Children | 275 (92.6%) | 22 (7.4%) |
| 1 or 2 Children | 145 (100.0%) | 0 (0.0%) |
| 3 or 4 Children | 22 (44.9%) | 27 (55.1%) |
| 5 or more Children | 0 (0.0%) | 0 (0.0%) |
| Total | 442 (90.0%) | 49 (10.0%) |
Income Below Poverty Among Single-Parent Households in Salem
According to the poverty data in Salem, 52.3% or 46 single-father households and 25.1% or 134 single-mother households are living below the poverty line. Among single-father households, those with 3 or 4 children have the highest poverty rate, with 46 households (100.0%) experiencing poverty. Likewise, among single-mother households, those with no children have the highest poverty rate, with 50 households (34.0%) falling below the poverty line.
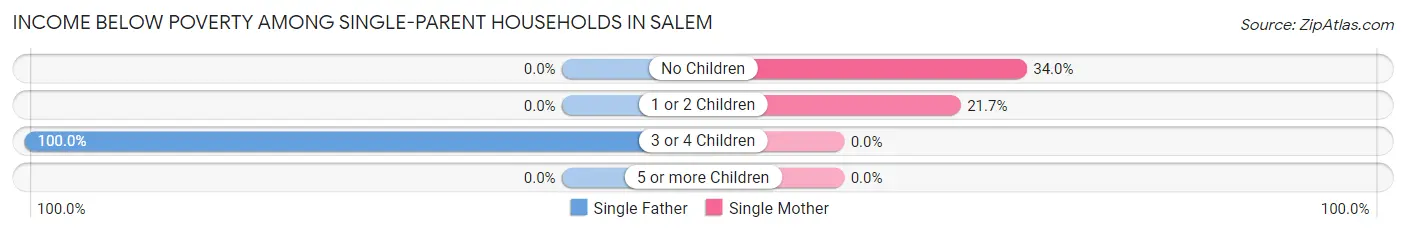
| Children | Single Father | Single Mother |
| No Children | 0 (0.0%) | 50 (34.0%) |
| 1 or 2 Children | 0 (0.0%) | 84 (21.7%) |
| 3 or 4 Children | 46 (100.0%) | 0 (0.0%) |
| 5 or more Children | 0 (0.0%) | 0 (0.0%) |
| Total | 46 (52.3%) | 134 (25.1%) |
Income Below Poverty Among Married-Couple vs Single-Parent Households in Salem
The poverty data for Salem shows that 49 of the married-couple family households (10.0%) and 180 of the single-parent households (28.9%) are living below the poverty level. Within the married-couple family households, those with 3 or 4 children have the highest poverty rate, with 27 households (55.1%) falling below the poverty line. Among the single-parent households, those with 3 or 4 children have the highest poverty rate, with 46 household (100.0%) living below poverty.
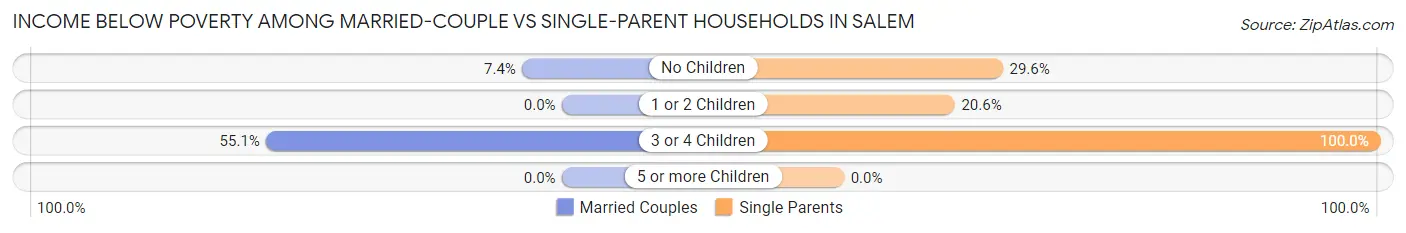
| Children | Married-Couple Families | Single-Parent Households |
| No Children | 22 (7.4%) | 50 (29.6%) |
| 1 or 2 Children | 0 (0.0%) | 84 (20.6%) |
| 3 or 4 Children | 27 (55.1%) | 46 (100.0%) |
| 5 or more Children | 0 (0.0%) | 0 (0.0%) |
| Total | 49 (10.0%) | 180 (28.9%) |
Race in Salem
The most populous races in Salem are Black / African American (3,153 | 59.7%), White / Caucasian (1,877 | 35.5%), and Hispanic or Latino (542 | 10.3%).
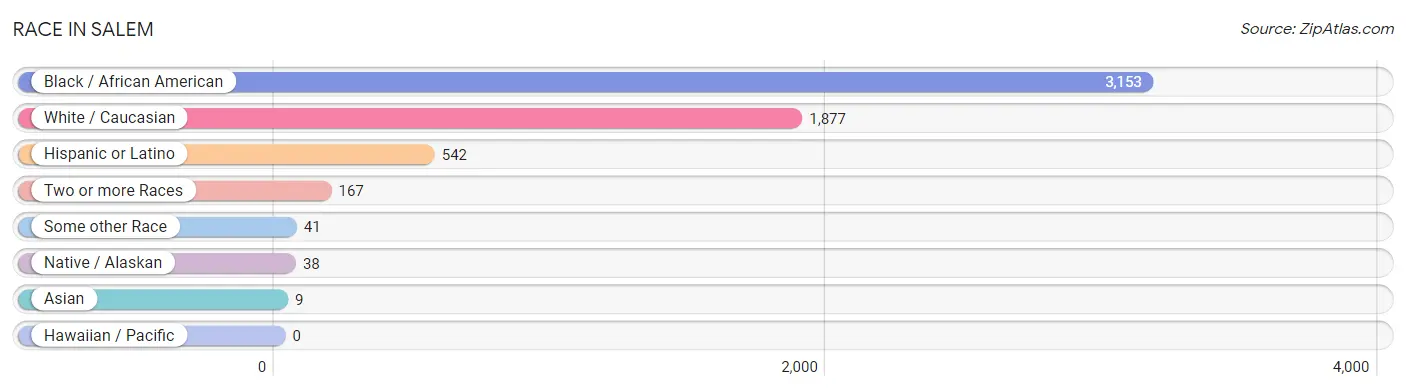
| Race | # Population | % Population |
| Asian | 9 | 0.2% |
| Black / African American | 3,153 | 59.7% |
| Hawaiian / Pacific | 0 | 0.0% |
| Hispanic or Latino | 542 | 10.3% |
| Native / Alaskan | 38 | 0.7% |
| White / Caucasian | 1,877 | 35.5% |
| Two or more Races | 167 | 3.2% |
| Some other Race | 41 | 0.8% |
| Total | 5,285 | 100.0% |
Ancestry in Salem
The most populous ancestries reported in Salem are Puerto Rican (411 | 7.8%), Italian (362 | 6.9%), Irish (345 | 6.5%), German (294 | 5.6%), and English (288 | 5.4%), together accounting for 32.2% of all Salem residents.
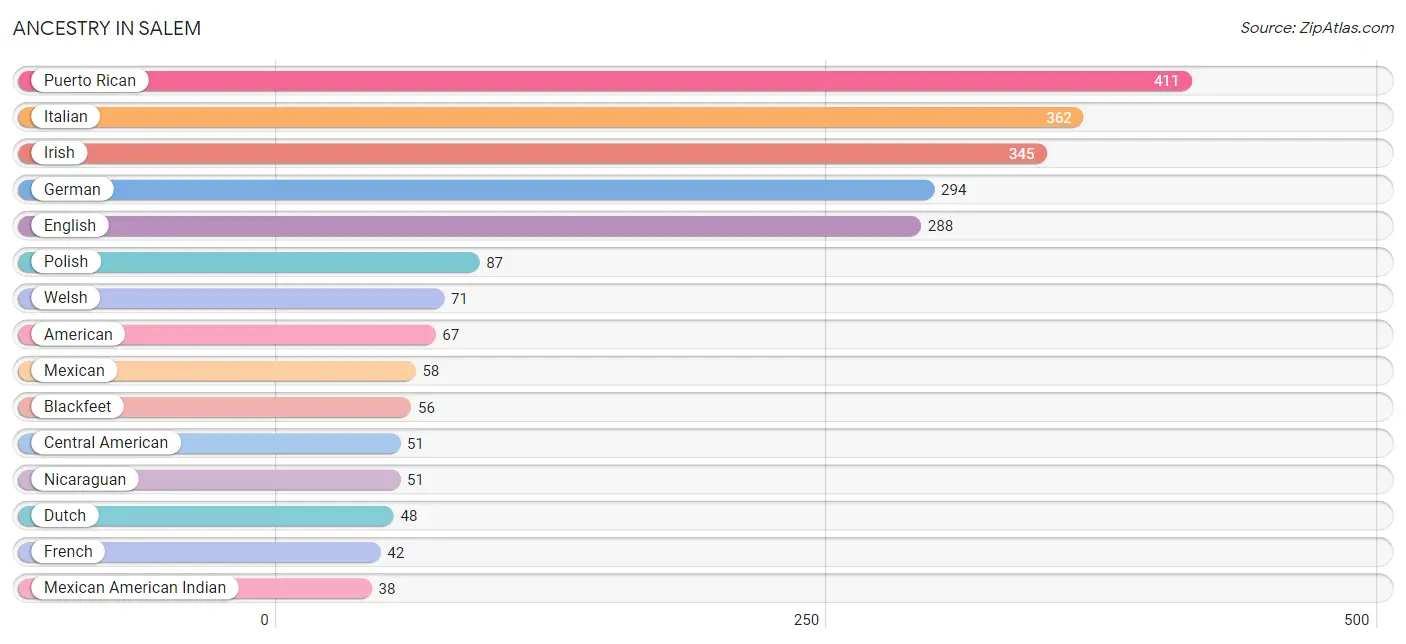
| Ancestry | # Population | % Population |
| African | 17 | 0.3% |
| American | 67 | 1.3% |
| Barbadian | 6 | 0.1% |
| Blackfeet | 56 | 1.1% |
| Burmese | 9 | 0.2% |
| Canadian | 8 | 0.2% |
| Central American | 51 | 1.0% |
| Cuban | 13 | 0.3% |
| Czech | 16 | 0.3% |
| Delaware | 14 | 0.3% |
| Dutch | 48 | 0.9% |
| Eastern European | 1 | 0.0% |
| English | 288 | 5.4% |
| European | 16 | 0.3% |
| French | 42 | 0.8% |
| French Canadian | 4 | 0.1% |
| German | 294 | 5.6% |
| Irish | 345 | 6.5% |
| Italian | 362 | 6.9% |
| Mexican | 58 | 1.1% |
| Mexican American Indian | 38 | 0.7% |
| Nicaraguan | 51 | 1.0% |
| Norwegian | 38 | 0.7% |
| Peruvian | 9 | 0.2% |
| Polish | 87 | 1.7% |
| Puerto Rican | 411 | 7.8% |
| Scottish | 2 | 0.0% |
| South American | 9 | 0.2% |
| Subsaharan African | 17 | 0.3% |
| Swedish | 33 | 0.6% |
| Trinidadian and Tobagonian | 10 | 0.2% |
| Ukrainian | 10 | 0.2% |
| Welsh | 71 | 1.3% |
| West Indian | 6 | 0.1% | View All 34 Rows |
Immigrants in Salem
The most numerous immigrant groups reported in Salem came from Latin America (83 | 1.6%), Central America (51 | 1.0%), Nicaragua (51 | 1.0%), Caribbean (23 | 0.4%), and Eastern Europe (19 | 0.4%), together accounting for 4.3% of all Salem residents.
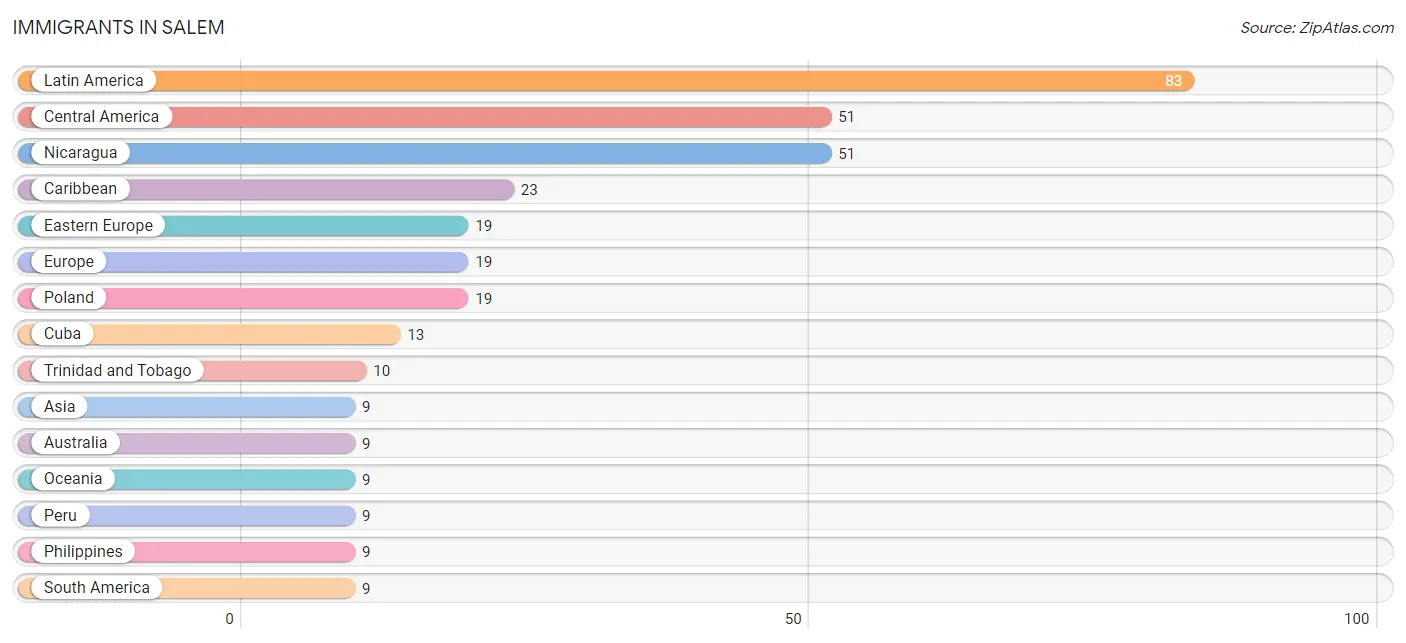
| Immigration Origin | # Population | % Population |
| Asia | 9 | 0.2% |
| Australia | 9 | 0.2% |
| Caribbean | 23 | 0.4% |
| Central America | 51 | 1.0% |
| Cuba | 13 | 0.3% |
| Eastern Europe | 19 | 0.4% |
| Europe | 19 | 0.4% |
| Latin America | 83 | 1.6% |
| Nicaragua | 51 | 1.0% |
| Oceania | 9 | 0.2% |
| Peru | 9 | 0.2% |
| Philippines | 9 | 0.2% |
| Poland | 19 | 0.4% |
| South America | 9 | 0.2% |
| South Eastern Asia | 9 | 0.2% |
| Trinidad and Tobago | 10 | 0.2% | View All 16 Rows |
Sex and Age in Salem
Sex and Age in Salem
The most populous age groups in Salem are Under 5 Years (313 | 13.5%) for men and 5 to 9 Years (404 | 13.6%) for women.
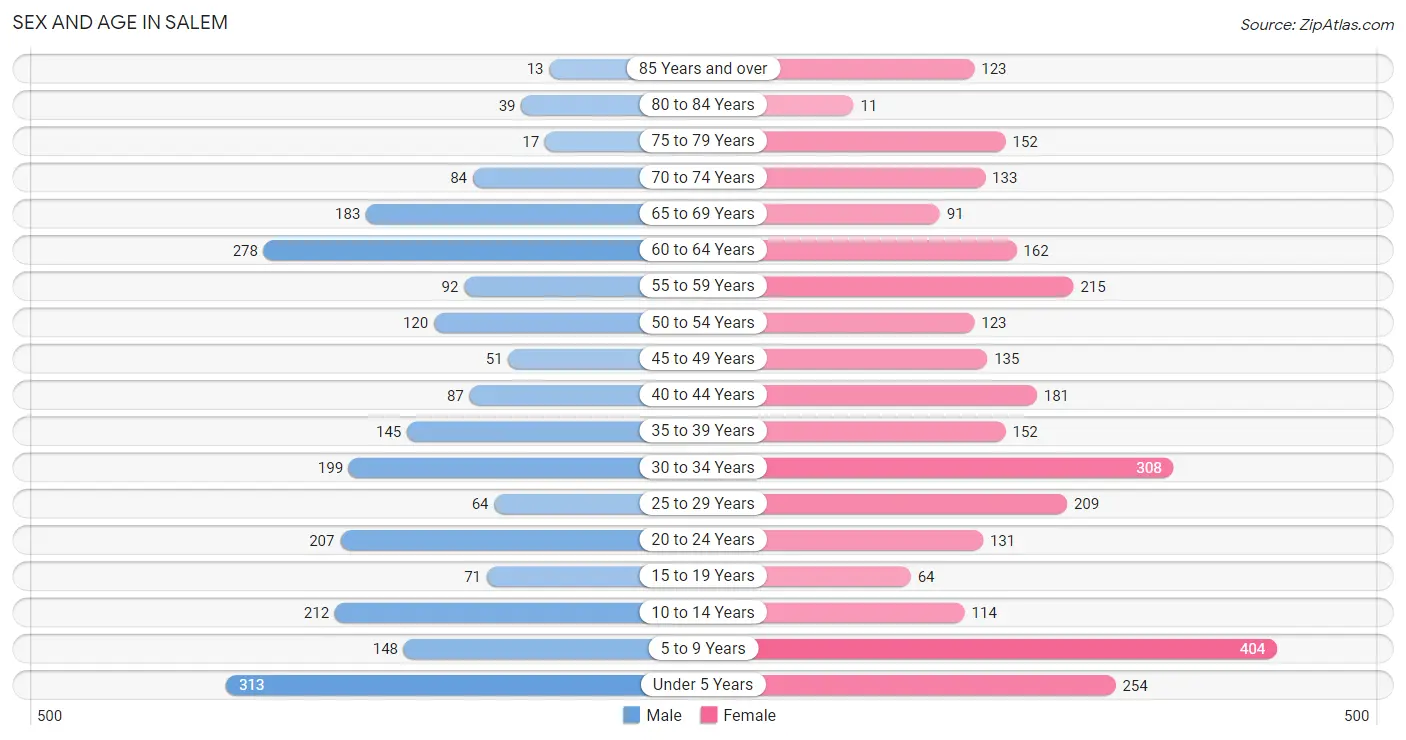
| Age Bracket | Male | Female |
| Under 5 Years | 313 (13.5%) | 254 (8.6%) |
| 5 to 9 Years | 148 (6.4%) | 404 (13.6%) |
| 10 to 14 Years | 212 (9.1%) | 114 (3.8%) |
| 15 to 19 Years | 71 (3.1%) | 64 (2.2%) |
| 20 to 24 Years | 207 (8.9%) | 131 (4.4%) |
| 25 to 29 Years | 64 (2.8%) | 209 (7.1%) |
| 30 to 34 Years | 199 (8.6%) | 308 (10.4%) |
| 35 to 39 Years | 145 (6.2%) | 152 (5.1%) |
| 40 to 44 Years | 87 (3.7%) | 181 (6.1%) |
| 45 to 49 Years | 51 (2.2%) | 135 (4.6%) |
| 50 to 54 Years | 120 (5.2%) | 123 (4.2%) |
| 55 to 59 Years | 92 (4.0%) | 215 (7.3%) |
| 60 to 64 Years | 278 (12.0%) | 162 (5.5%) |
| 65 to 69 Years | 183 (7.9%) | 91 (3.1%) |
| 70 to 74 Years | 84 (3.6%) | 133 (4.5%) |
| 75 to 79 Years | 17 (0.7%) | 152 (5.1%) |
| 80 to 84 Years | 39 (1.7%) | 11 (0.4%) |
| 85 Years and over | 13 (0.6%) | 123 (4.2%) |
| Total | 2,323 (100.0%) | 2,962 (100.0%) |
Families and Households in Salem
Median Family Size in Salem
The median family size in Salem is 3.40 persons per family, with single male/father families (88 | 7.9%) accounting for the largest median family size of 3.94 persons per family. On the other hand, married-couple families (491 | 44.1%) represent the smallest median family size with 3.15 persons per family.
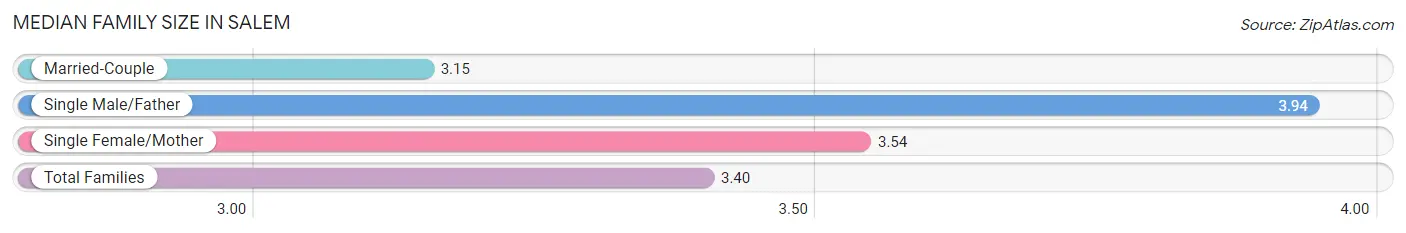
| Family Type | # Families | Family Size |
| Married-Couple | 491 (44.1%) | 3.15 |
| Single Male/Father | 88 (7.9%) | 3.94 |
| Single Female/Mother | 534 (48.0%) | 3.54 |
| Total Families | 1,113 (100.0%) | 3.40 |
Median Household Size in Salem
The median household size in Salem is 2.42 persons per household, with single male/father households (88 | 4.1%) accounting for the largest median household size of 4.88 persons per household. non-family households (1,059 | 48.8%) represent the smallest median household size with 1.18 persons per household.
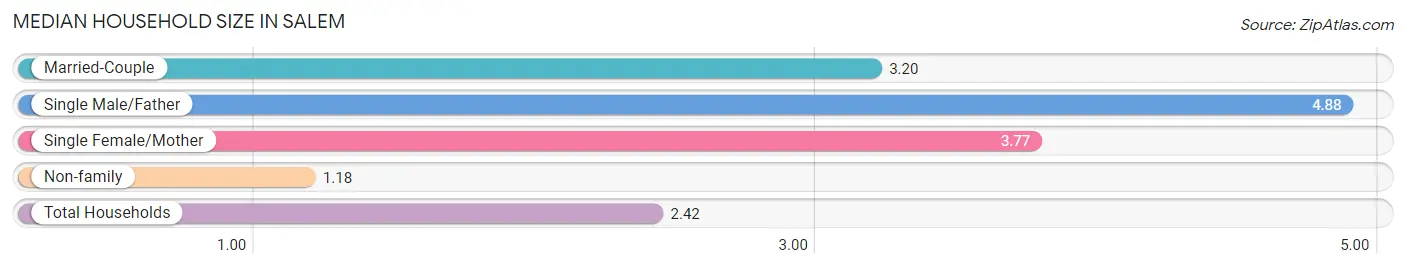
| Household Type | # Households | Household Size |
| Married-Couple | 491 (22.6%) | 3.20 |
| Single Male/Father | 88 (4.1%) | 4.88 |
| Single Female/Mother | 534 (24.6%) | 3.77 |
| Non-family | 1,059 (48.8%) | 1.18 |
| Total Households | 2,172 (100.0%) | 2.42 |
Household Size by Marriage Status in Salem
Out of a total of 2,172 households in Salem, 1,113 (51.2%) are family households, while 1,059 (48.8%) are nonfamily households. The most numerous type of family households are 2-person households, comprising 537, and the most common type of nonfamily households are 1-person households, comprising 962.
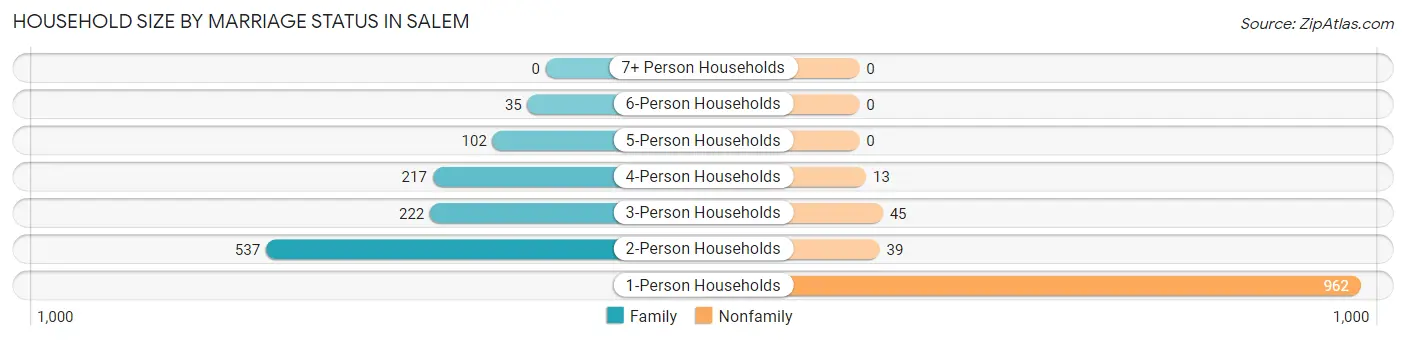
| Household Size | Family Households | Nonfamily Households |
| 1-Person Households | - | 962 (44.3%) |
| 2-Person Households | 537 (24.7%) | 39 (1.8%) |
| 3-Person Households | 222 (10.2%) | 45 (2.1%) |
| 4-Person Households | 217 (10.0%) | 13 (0.6%) |
| 5-Person Households | 102 (4.7%) | 0 (0.0%) |
| 6-Person Households | 35 (1.6%) | 0 (0.0%) |
| 7+ Person Households | 0 (0.0%) | 0 (0.0%) |
| Total | 1,113 (51.2%) | 1,059 (48.8%) |
Female Fertility in Salem
Fertility by Age in Salem
Average fertility rate in Salem is 75.0 births per 1,000 women. Women in the age bracket of 20 to 34 years have the highest fertility rate with 100.0 births per 1,000 women. Women in the age bracket of 20 to 34 years acount for 72.2% of all women with births.
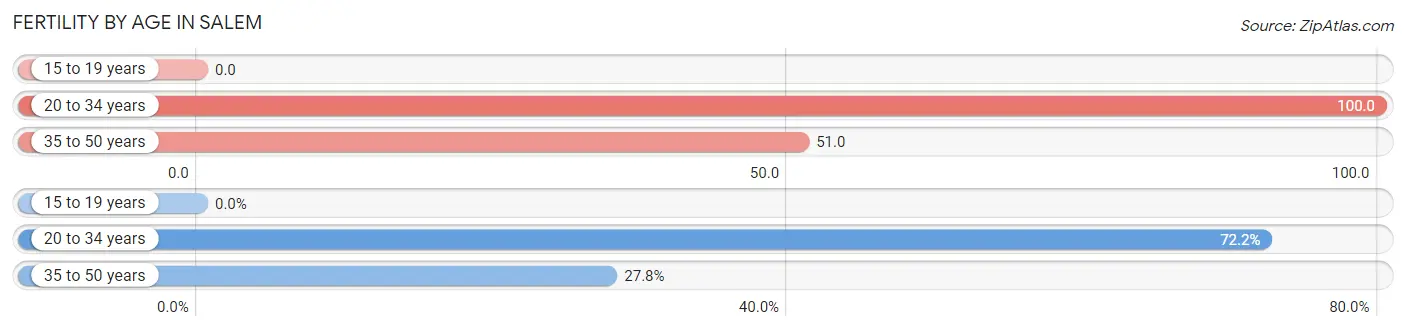
| Age Bracket | Women with Births | Births / 1,000 Women |
| 15 to 19 years | 0 (0.0%) | 0.0 |
| 20 to 34 years | 65 (72.2%) | 100.0 |
| 35 to 50 years | 25 (27.8%) | 51.0 |
| Total | 90 (100.0%) | 75.0 |
Fertility by Age by Marriage Status in Salem
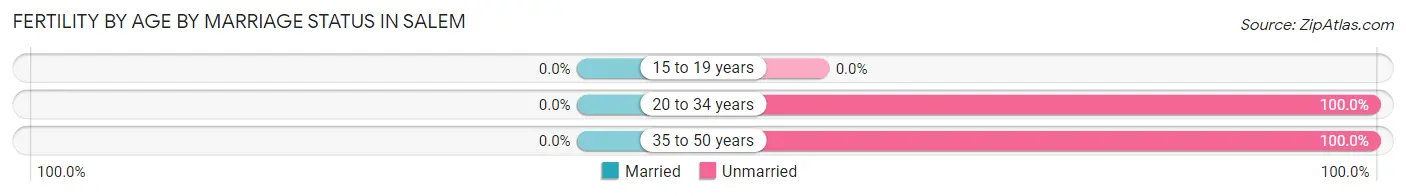
| Age Bracket | Married | Unmarried |
| 15 to 19 years | 0 (0.0%) | 0 (0.0%) |
| 20 to 34 years | 0 (0.0%) | 65 (100.0%) |
| 35 to 50 years | 0 (0.0%) | 25 (100.0%) |
| Total | 0 (0.0%) | 90 (100.0%) |
Fertility by Education in Salem
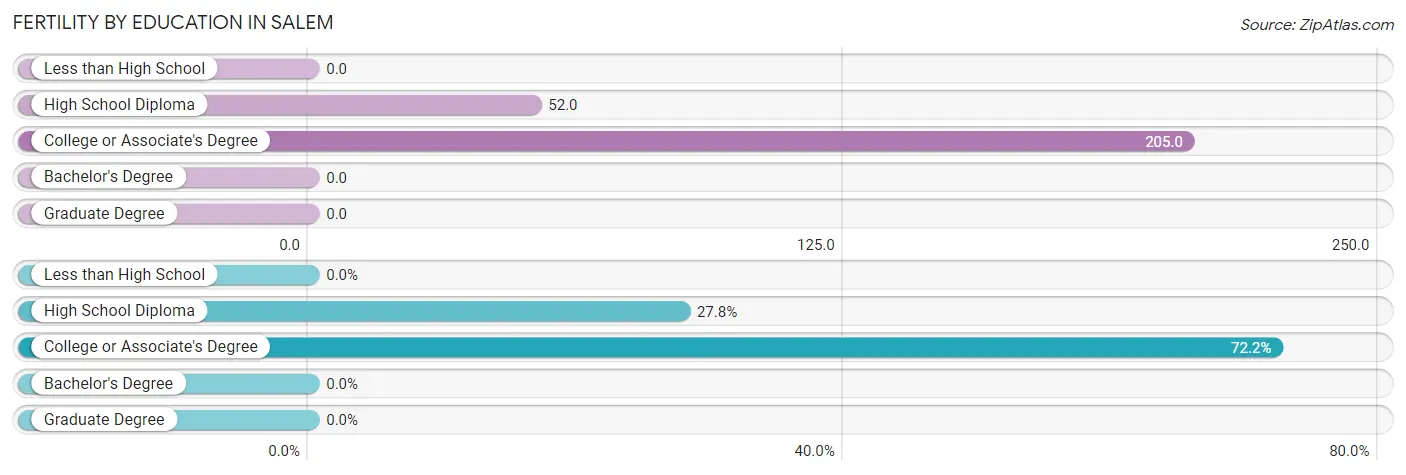
| Educational Attainment | Women with Births | Births / 1,000 Women |
| Less than High School | 0 (0.0%) | 0.0 |
| High School Diploma | 25 (27.8%) | 52.0 |
| College or Associate's Degree | 65 (72.2%) | 205.0 |
| Bachelor's Degree | 0 (0.0%) | 0.0 |
| Graduate Degree | 0 (0.0%) | 0.0 |
| Total | 90 (100.0%) | 75.0 |
Fertility by Education by Marriage Status in Salem
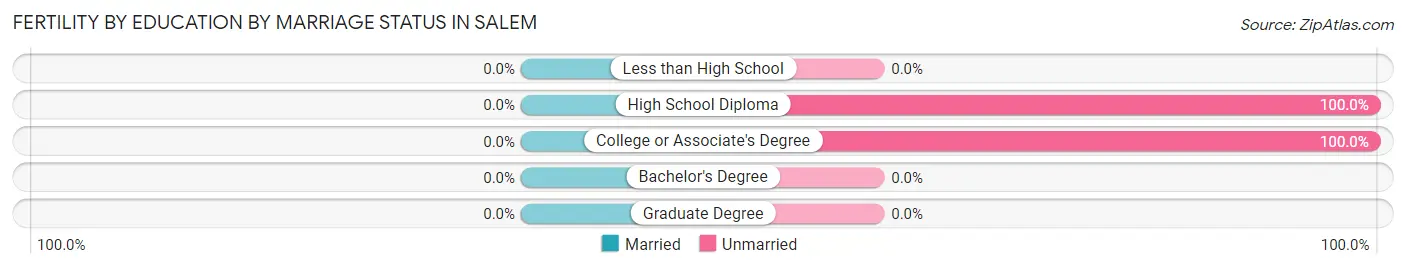
| Educational Attainment | Married | Unmarried |
| Less than High School | 0 (0.0%) | 0 (0.0%) |
| High School Diploma | 0 (0.0%) | 25 (100.0%) |
| College or Associate's Degree | 0 (0.0%) | 65 (100.0%) |
| Bachelor's Degree | 0 (0.0%) | 0 (0.0%) |
| Graduate Degree | 0 (0.0%) | 0 (0.0%) |
| Total | 0 (0.0%) | 90 (100.0%) |
Employment Characteristics in Salem
Employment by Class of Employer in Salem
Among the 1,797 employed individuals in Salem, private company employees (1,147 | 63.8%), not-for-profit organizations (272 | 15.1%), and local government employees (180 | 10.0%) make up the most common classes of employment.
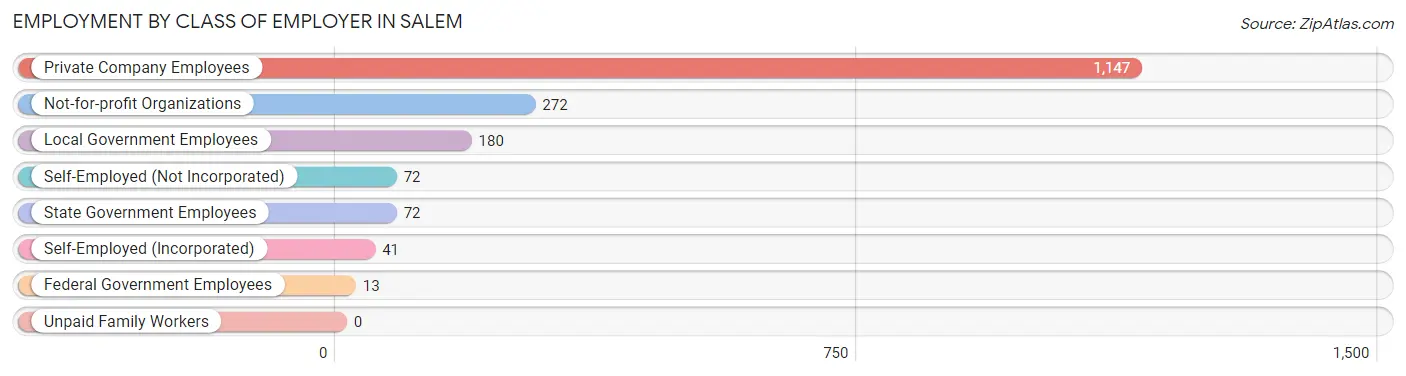
| Employer Class | # Employees | % Employees |
| Private Company Employees | 1,147 | 63.8% |
| Self-Employed (Incorporated) | 41 | 2.3% |
| Self-Employed (Not Incorporated) | 72 | 4.0% |
| Not-for-profit Organizations | 272 | 15.1% |
| Local Government Employees | 180 | 10.0% |
| State Government Employees | 72 | 4.0% |
| Federal Government Employees | 13 | 0.7% |
| Unpaid Family Workers | 0 | 0.0% |
| Total | 1,797 | 100.0% |
Employment Status by Age in Salem
According to the labor force statistics for Salem, out of the total population over 16 years of age (3,840), 54.4% or 2,089 individuals are in the labor force, with 12.5% or 261 of them unemployed. The age group with the highest labor force participation rate is 35 to 44 years, with 85.5% or 483 individuals in the labor force. Within the labor force, the 16 to 19 years age range has the highest percentage of unemployed individuals, with 85.9% or 61 of them being unemployed.
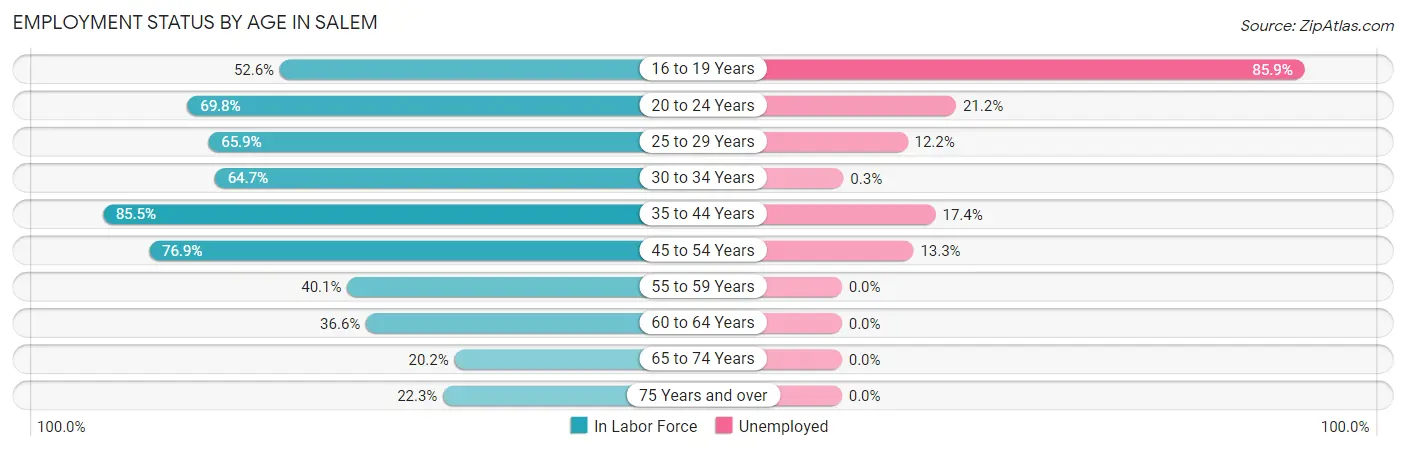
| Age Bracket | In Labor Force | Unemployed |
| 16 to 19 Years | 71 (52.6%) | 61 (85.9%) |
| 20 to 24 Years | 236 (69.8%) | 50 (21.2%) |
| 25 to 29 Years | 180 (65.9%) | 22 (12.2%) |
| 30 to 34 Years | 328 (64.7%) | 1 (0.3%) |
| 35 to 44 Years | 483 (85.5%) | 84 (17.4%) |
| 45 to 54 Years | 330 (76.9%) | 44 (13.3%) |
| 55 to 59 Years | 123 (40.1%) | 0 (0.0%) |
| 60 to 64 Years | 161 (36.6%) | 0 (0.0%) |
| 65 to 74 Years | 99 (20.2%) | 0 (0.0%) |
| 75 Years and over | 79 (22.3%) | 0 (0.0%) |
| Total | 2,089 (54.4%) | 261 (12.5%) |
Employment Status by Educational Attainment in Salem
According to labor force statistics for Salem, 63.7% of individuals (1,606) out of the total population between 25 and 64 years of age (2,521) are in the labor force, with 9.4% or 151 of them being unemployed. The group with the highest labor force participation rate are those with the educational attainment of bachelor's degree or higher, with 80.2% or 199 individuals in the labor force. Within the labor force, individuals with college / associate degree education have the highest percentage of unemployment, with 16.5% or 62 of them being unemployed.
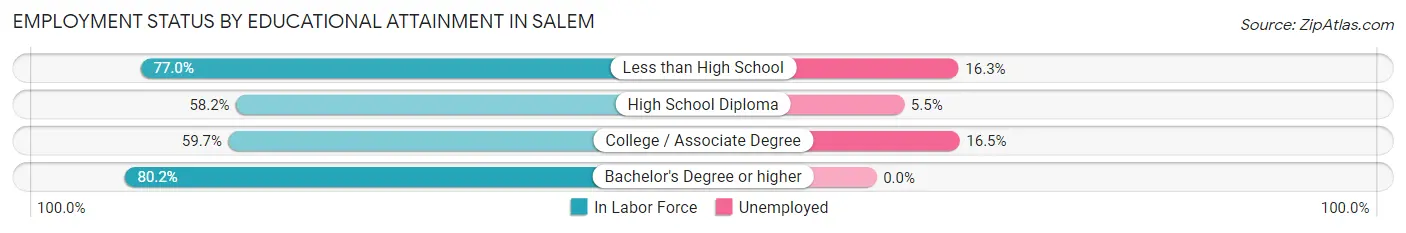
| Educational Attainment | In Labor Force | Unemployed |
| Less than High School | 301 (77.0%) | 64 (16.3%) |
| High School Diploma | 729 (58.2%) | 69 (5.5%) |
| College / Associate Degree | 376 (59.7%) | 104 (16.5%) |
| Bachelor's Degree or higher | 199 (80.2%) | 0 (0.0%) |
| Total | 1,606 (63.7%) | 237 (9.4%) |
Employment Occupations by Sex in Salem
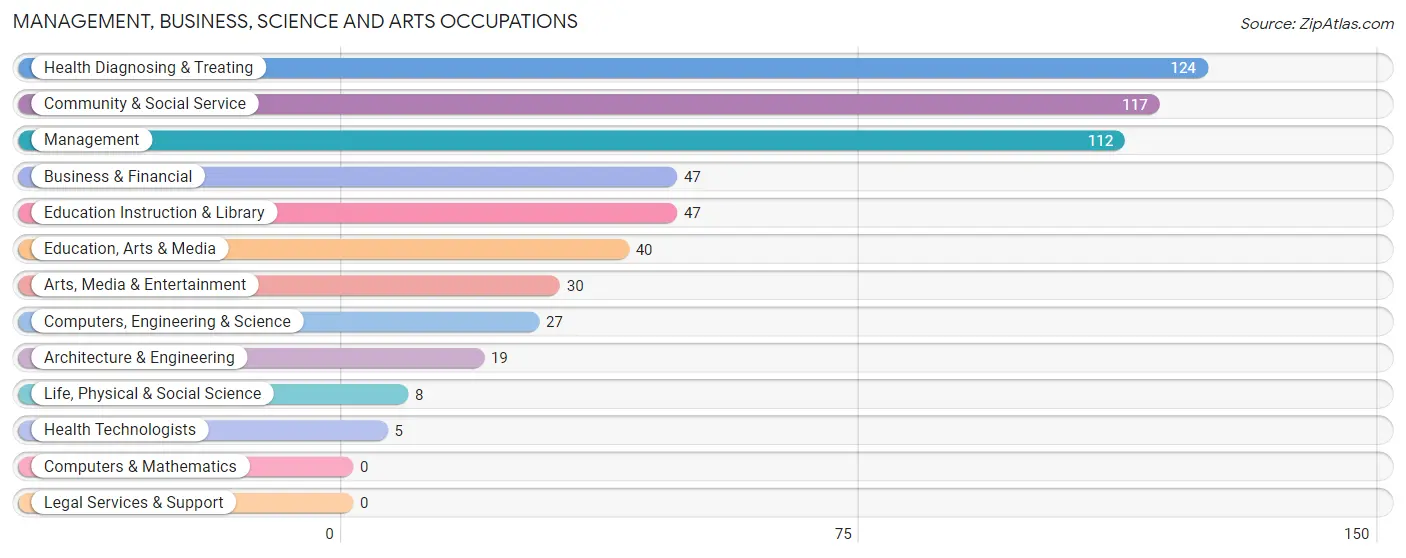
Management, Business, Science and Arts Occupations
The most common Management, Business, Science and Arts occupations in Salem are Health Diagnosing & Treating (124 | 6.8%), Community & Social Service (117 | 6.4%), Management (112 | 6.1%), Business & Financial (47 | 2.6%), and Education Instruction & Library (47 | 2.6%).
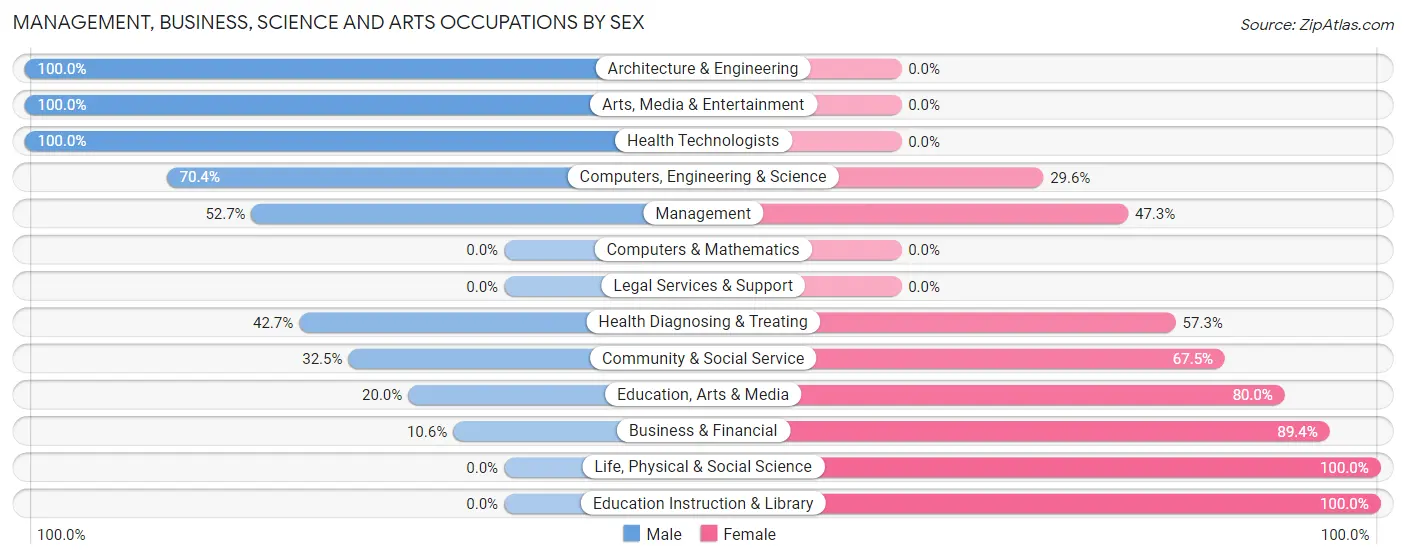
Management, Business, Science and Arts Occupations by Sex
Within the Management, Business, Science and Arts occupations in Salem, the most male-oriented occupations are Architecture & Engineering (100.0%), Arts, Media & Entertainment (100.0%), and Health Technologists (100.0%), while the most female-oriented occupations are Life, Physical & Social Science (100.0%), Education Instruction & Library (100.0%), and Business & Financial (89.4%).
| Occupation | Male | Female |
| Management | 59 (52.7%) | 53 (47.3%) |
| Business & Financial | 5 (10.6%) | 42 (89.4%) |
| Computers, Engineering & Science | 19 (70.4%) | 8 (29.6%) |
| Computers & Mathematics | 0 (0.0%) | 0 (0.0%) |
| Architecture & Engineering | 19 (100.0%) | 0 (0.0%) |
| Life, Physical & Social Science | 0 (0.0%) | 8 (100.0%) |
| Community & Social Service | 38 (32.5%) | 79 (67.5%) |
| Education, Arts & Media | 8 (20.0%) | 32 (80.0%) |
| Legal Services & Support | 0 (0.0%) | 0 (0.0%) |
| Education Instruction & Library | 0 (0.0%) | 47 (100.0%) |
| Arts, Media & Entertainment | 30 (100.0%) | 0 (0.0%) |
| Health Diagnosing & Treating | 53 (42.7%) | 71 (57.3%) |
| Health Technologists | 5 (100.0%) | 0 (0.0%) |
| Total (Category) | 174 (40.7%) | 253 (59.3%) |
| Total (Overall) | 721 (39.4%) | 1,107 (60.6%) |
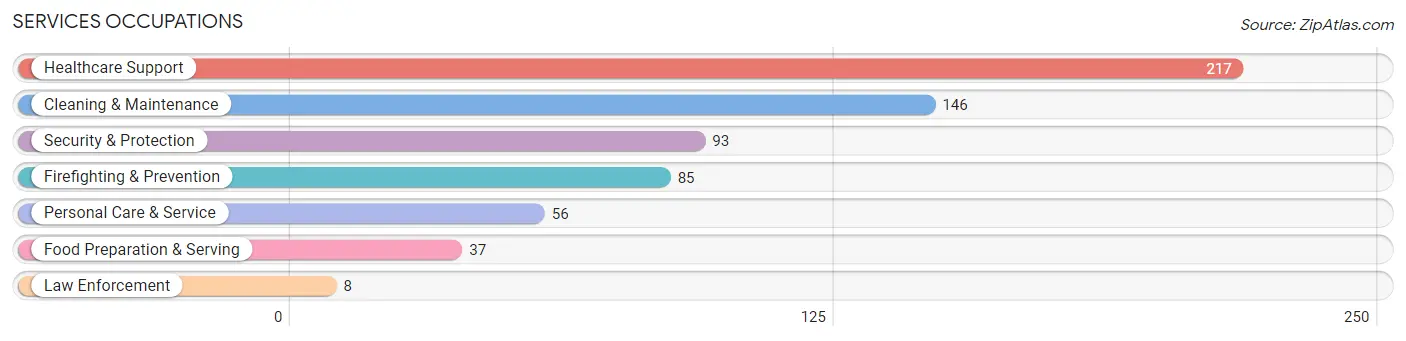
Services Occupations
The most common Services occupations in Salem are Healthcare Support (217 | 11.9%), Cleaning & Maintenance (146 | 8.0%), Security & Protection (93 | 5.1%), Firefighting & Prevention (85 | 4.6%), and Personal Care & Service (56 | 3.1%).
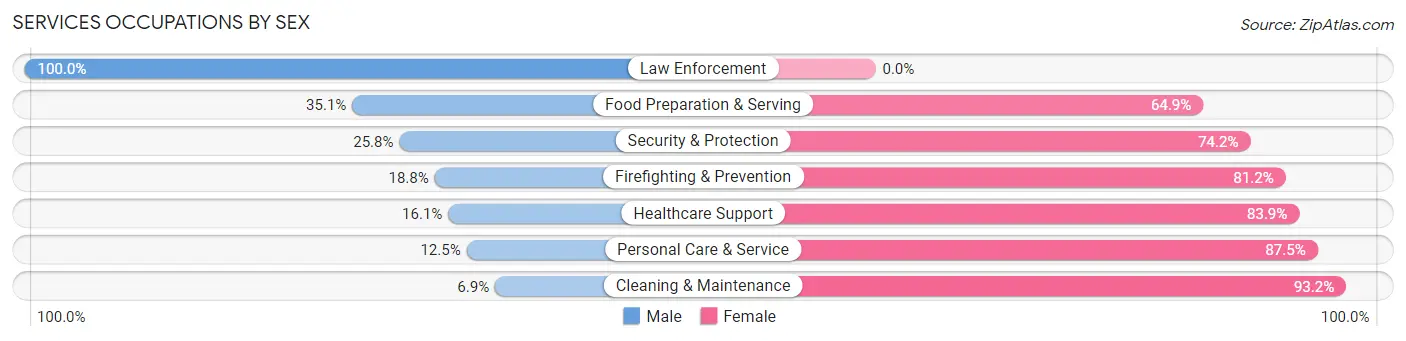
Services Occupations by Sex
Within the Services occupations in Salem, the most male-oriented occupations are Law Enforcement (100.0%), Food Preparation & Serving (35.1%), and Security & Protection (25.8%), while the most female-oriented occupations are Cleaning & Maintenance (93.1%), Personal Care & Service (87.5%), and Healthcare Support (83.9%).
| Occupation | Male | Female |
| Healthcare Support | 35 (16.1%) | 182 (83.9%) |
| Security & Protection | 24 (25.8%) | 69 (74.2%) |
| Firefighting & Prevention | 16 (18.8%) | 69 (81.2%) |
| Law Enforcement | 8 (100.0%) | 0 (0.0%) |
| Food Preparation & Serving | 13 (35.1%) | 24 (64.9%) |
| Cleaning & Maintenance | 10 (6.9%) | 136 (93.1%) |
| Personal Care & Service | 7 (12.5%) | 49 (87.5%) |
| Total (Category) | 89 (16.2%) | 460 (83.8%) |
| Total (Overall) | 721 (39.4%) | 1,107 (60.6%) |
Sales and Office Occupations
The most common Sales and Office occupations in Salem are Office & Administration (120 | 6.6%), and Sales & Related (39 | 2.1%).
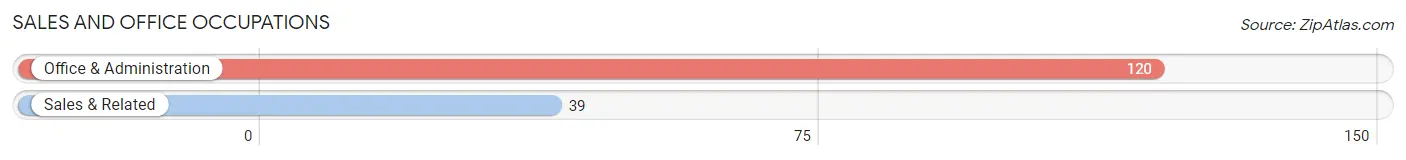
Sales and Office Occupations by Sex
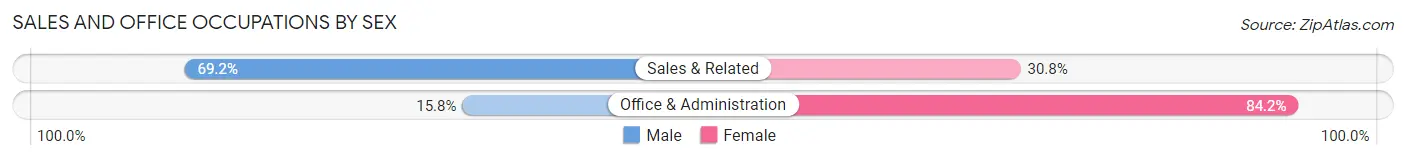
| Occupation | Male | Female |
| Sales & Related | 27 (69.2%) | 12 (30.8%) |
| Office & Administration | 19 (15.8%) | 101 (84.2%) |
| Total (Category) | 46 (28.9%) | 113 (71.1%) |
| Total (Overall) | 721 (39.4%) | 1,107 (60.6%) |
Natural Resources, Construction and Maintenance Occupations
The most common Natural Resources, Construction and Maintenance occupations in Salem are Installation, Maintenance & Repair (101 | 5.5%), and Construction & Extraction (15 | 0.8%).
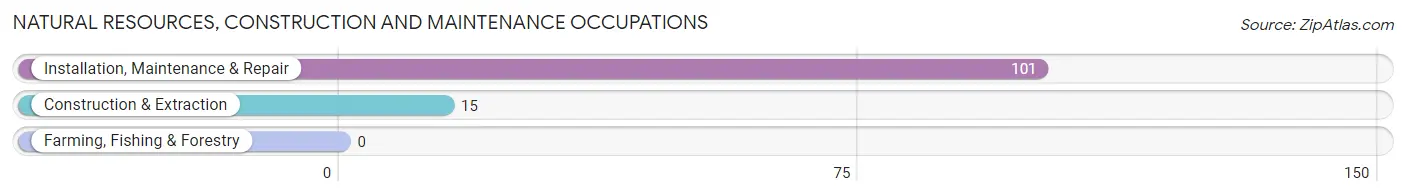
Natural Resources, Construction and Maintenance Occupations by Sex
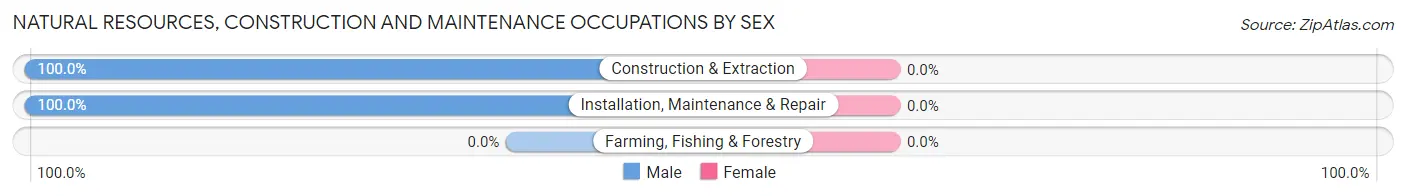
| Occupation | Male | Female |
| Farming, Fishing & Forestry | 0 (0.0%) | 0 (0.0%) |
| Construction & Extraction | 15 (100.0%) | 0 (0.0%) |
| Installation, Maintenance & Repair | 101 (100.0%) | 0 (0.0%) |
| Total (Category) | 116 (100.0%) | 0 (0.0%) |
| Total (Overall) | 721 (39.4%) | 1,107 (60.6%) |
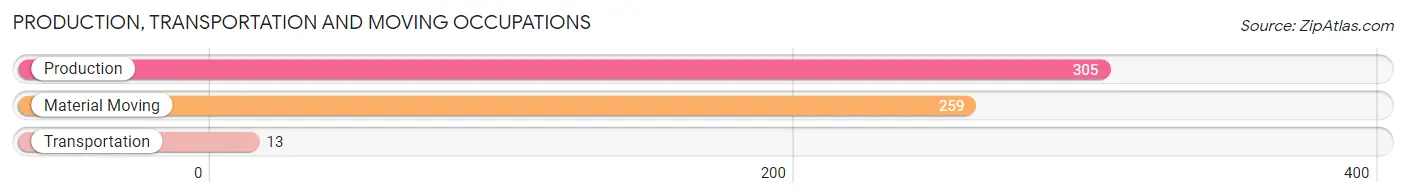
Production, Transportation and Moving Occupations
The most common Production, Transportation and Moving occupations in Salem are Production (305 | 16.7%), Material Moving (259 | 14.2%), and Transportation (13 | 0.7%).
Production, Transportation and Moving Occupations by Sex
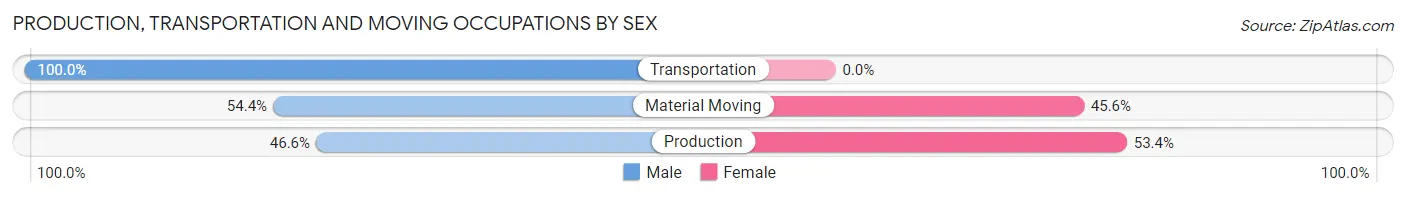
| Occupation | Male | Female |
| Production | 142 (46.6%) | 163 (53.4%) |
| Transportation | 13 (100.0%) | 0 (0.0%) |
| Material Moving | 141 (54.4%) | 118 (45.6%) |
| Total (Category) | 296 (51.3%) | 281 (48.7%) |
| Total (Overall) | 721 (39.4%) | 1,107 (60.6%) |
Employment Industries by Sex in Salem
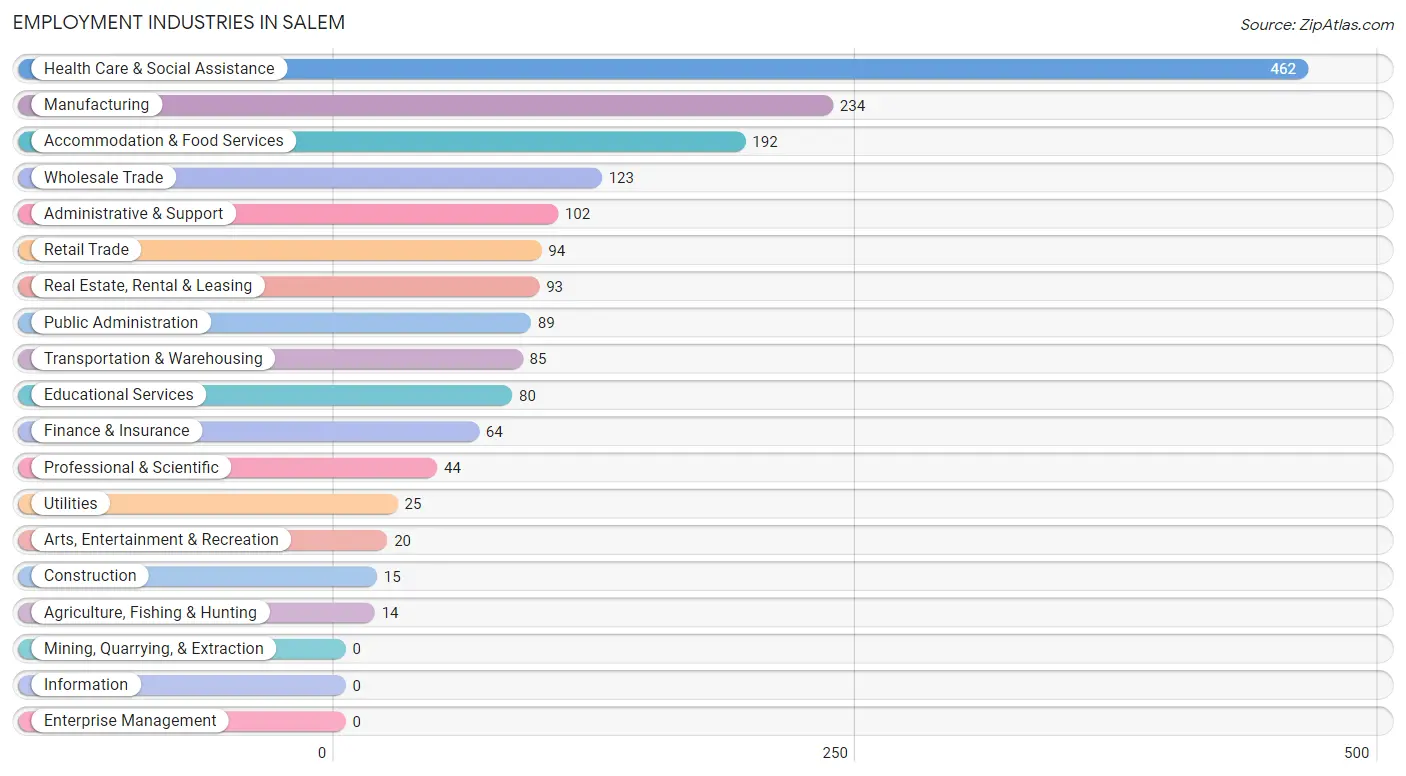
Employment Industries in Salem
The major employment industries in Salem include Health Care & Social Assistance (462 | 25.3%), Manufacturing (234 | 12.8%), Accommodation & Food Services (192 | 10.5%), Wholesale Trade (123 | 6.7%), and Administrative & Support (102 | 5.6%).
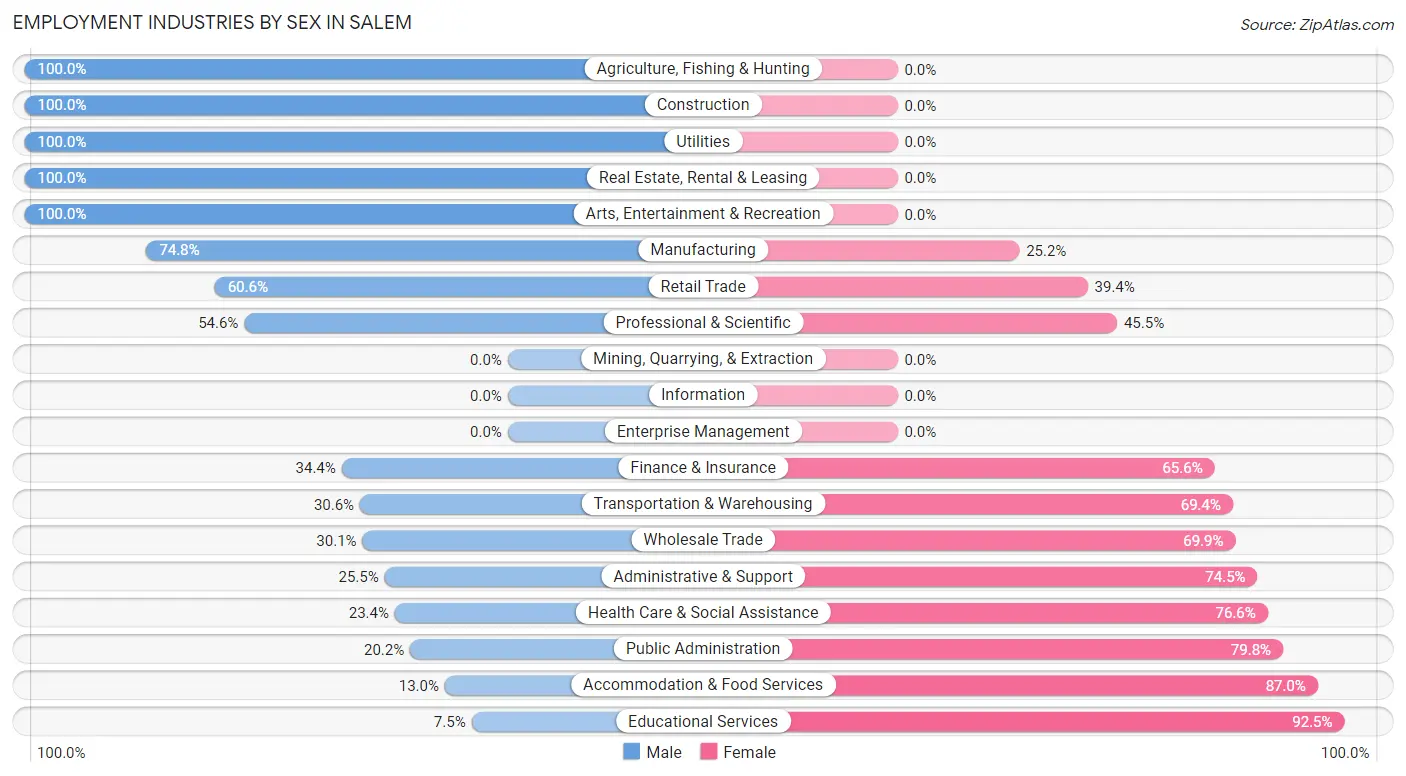
Employment Industries by Sex in Salem
The Salem industries that see more men than women are Agriculture, Fishing & Hunting (100.0%), Construction (100.0%), and Utilities (100.0%), whereas the industries that tend to have a higher number of women are Educational Services (92.5%), Accommodation & Food Services (87.0%), and Public Administration (79.8%).
| Industry | Male | Female |
| Agriculture, Fishing & Hunting | 14 (100.0%) | 0 (0.0%) |
| Mining, Quarrying, & Extraction | 0 (0.0%) | 0 (0.0%) |
| Construction | 15 (100.0%) | 0 (0.0%) |
| Manufacturing | 175 (74.8%) | 59 (25.2%) |
| Wholesale Trade | 37 (30.1%) | 86 (69.9%) |
| Retail Trade | 57 (60.6%) | 37 (39.4%) |
| Transportation & Warehousing | 26 (30.6%) | 59 (69.4%) |
| Utilities | 25 (100.0%) | 0 (0.0%) |
| Information | 0 (0.0%) | 0 (0.0%) |
| Finance & Insurance | 22 (34.4%) | 42 (65.6%) |
| Real Estate, Rental & Leasing | 93 (100.0%) | 0 (0.0%) |
| Professional & Scientific | 24 (54.5%) | 20 (45.5%) |
| Enterprise Management | 0 (0.0%) | 0 (0.0%) |
| Administrative & Support | 26 (25.5%) | 76 (74.5%) |
| Educational Services | 6 (7.5%) | 74 (92.5%) |
| Health Care & Social Assistance | 108 (23.4%) | 354 (76.6%) |
| Arts, Entertainment & Recreation | 20 (100.0%) | 0 (0.0%) |
| Accommodation & Food Services | 25 (13.0%) | 167 (87.0%) |
| Public Administration | 18 (20.2%) | 71 (79.8%) |
| Total | 721 (39.4%) | 1,107 (60.6%) |
Education in Salem
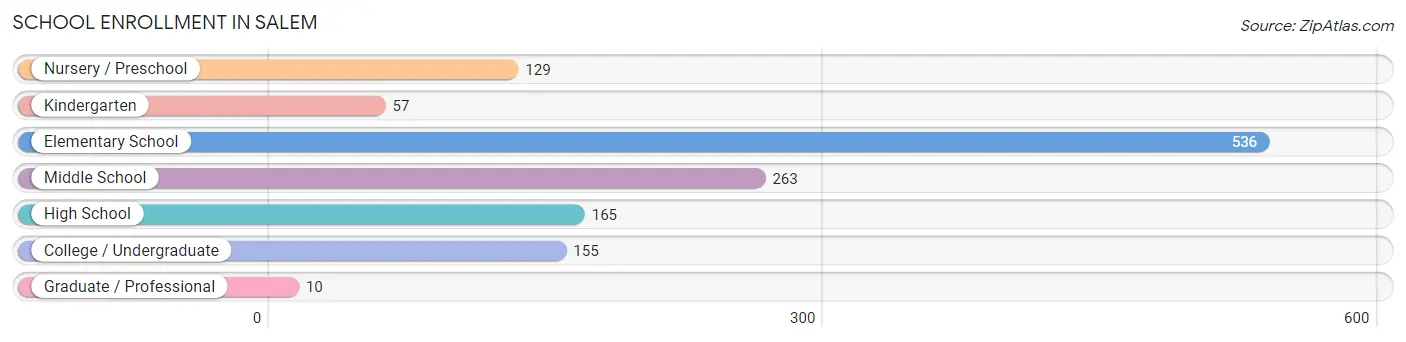
School Enrollment in Salem
The most common levels of schooling among the 1,315 students in Salem are elementary school (536 | 40.8%), middle school (263 | 20.0%), and high school (165 | 12.6%).
| School Level | # Students | % Students |
| Nursery / Preschool | 129 | 9.8% |
| Kindergarten | 57 | 4.3% |
| Elementary School | 536 | 40.8% |
| Middle School | 263 | 20.0% |
| High School | 165 | 12.6% |
| College / Undergraduate | 155 | 11.8% |
| Graduate / Professional | 10 | 0.8% |
| Total | 1,315 | 100.0% |
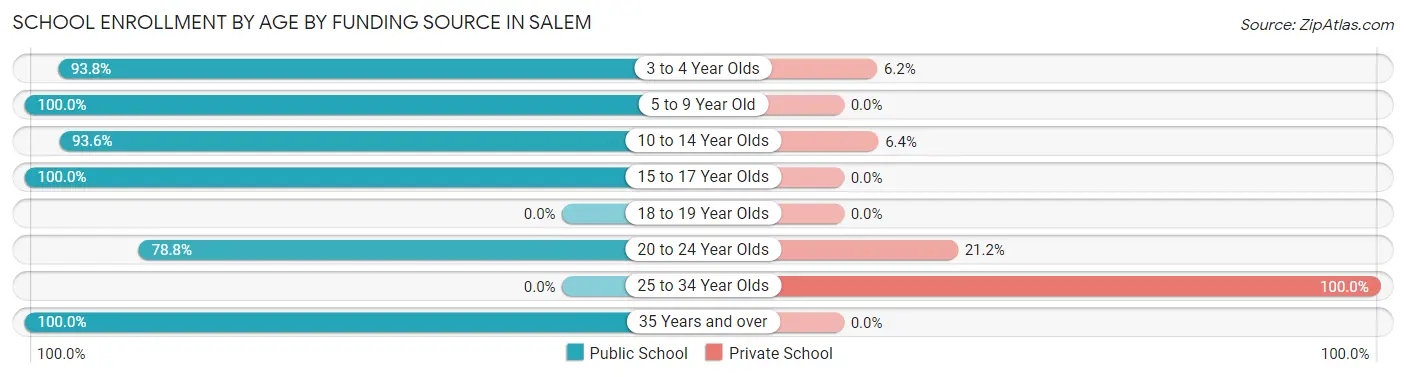
School Enrollment by Age by Funding Source in Salem
Out of a total of 1,315 students who are enrolled in schools in Salem, 71 (5.4%) attend a private institution, while the remaining 1,244 (94.6%) are enrolled in public schools. The age group of 25 to 34 year olds has the highest likelihood of being enrolled in private schools, with 18 (100.0% in the age bracket) enrolled. Conversely, the age group of 5 to 9 year old has the lowest likelihood of being enrolled in a private school, with 552 (100.0% in the age bracket) attending a public institution.
| Age Bracket | Public School | Private School |
| 3 to 4 Year Olds | 121 (93.8%) | 8 (6.2%) |
| 5 to 9 Year Old | 552 (100.0%) | 0 (0.0%) |
| 10 to 14 Year Olds | 305 (93.6%) | 21 (6.4%) |
| 15 to 17 Year Olds | 125 (100.0%) | 0 (0.0%) |
| 18 to 19 Year Olds | 0 (0.0%) | 0 (0.0%) |
| 20 to 24 Year Olds | 89 (78.8%) | 24 (21.2%) |
| 25 to 34 Year Olds | 0 (0.0%) | 18 (100.0%) |
| 35 Years and over | 52 (100.0%) | 0 (0.0%) |
| Total | 1,244 (94.6%) | 71 (5.4%) |
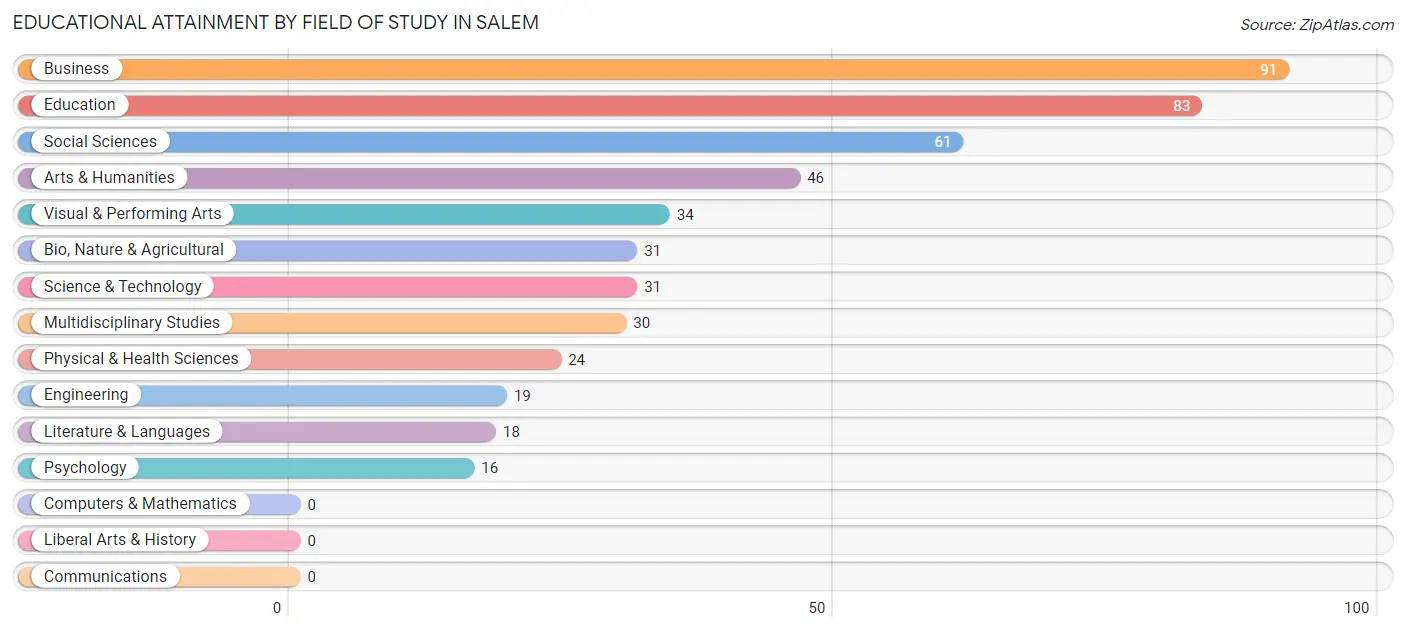
Educational Attainment by Field of Study in Salem
Business (91 | 18.8%), education (83 | 17.2%), social sciences (61 | 12.6%), arts & humanities (46 | 9.5%), and visual & performing arts (34 | 7.0%) are the most common fields of study among 484 individuals in Salem who have obtained a bachelor's degree or higher.
| Field of Study | # Graduates | % Graduates |
| Computers & Mathematics | 0 | 0.0% |
| Bio, Nature & Agricultural | 31 | 6.4% |
| Physical & Health Sciences | 24 | 5.0% |
| Psychology | 16 | 3.3% |
| Social Sciences | 61 | 12.6% |
| Engineering | 19 | 3.9% |
| Multidisciplinary Studies | 30 | 6.2% |
| Science & Technology | 31 | 6.4% |
| Business | 91 | 18.8% |
| Education | 83 | 17.2% |
| Literature & Languages | 18 | 3.7% |
| Liberal Arts & History | 0 | 0.0% |
| Visual & Performing Arts | 34 | 7.0% |
| Communications | 0 | 0.0% |
| Arts & Humanities | 46 | 9.5% |
| Total | 484 | 100.0% |
Transportation & Commute in Salem
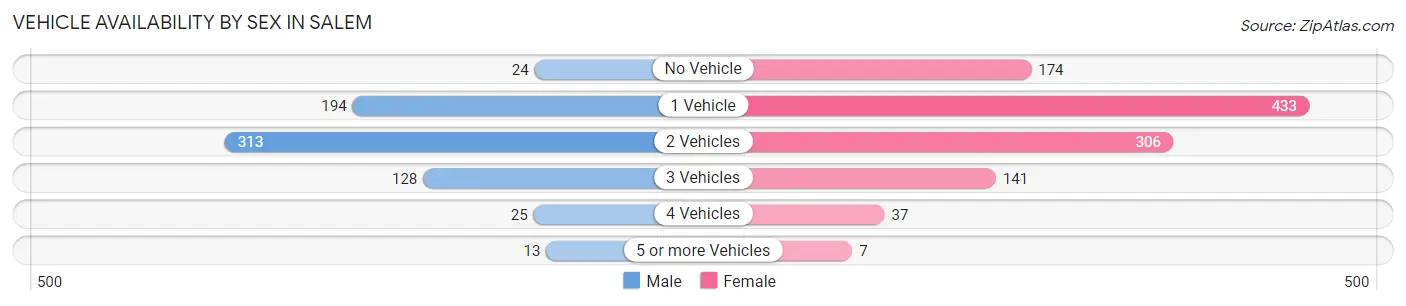
Vehicle Availability by Sex in Salem
The most prevalent vehicle ownership categories in Salem are males with 2 vehicles (313, accounting for 44.9%) and females with 2 vehicles (306, making up 28.5%).
| Vehicles Available | Male | Female |
| No Vehicle | 24 (3.4%) | 174 (15.9%) |
| 1 Vehicle | 194 (27.8%) | 433 (39.4%) |
| 2 Vehicles | 313 (44.9%) | 306 (27.9%) |
| 3 Vehicles | 128 (18.4%) | 141 (12.8%) |
| 4 Vehicles | 25 (3.6%) | 37 (3.4%) |
| 5 or more Vehicles | 13 (1.9%) | 7 (0.6%) |
| Total | 697 (100.0%) | 1,098 (100.0%) |
Commute Time in Salem
The most frequently occuring commute durations in Salem are 30 to 34 minutes (330 commuters, 20.8%), 20 to 24 minutes (240 commuters, 15.1%), and 5 to 9 minutes (204 commuters, 12.9%).
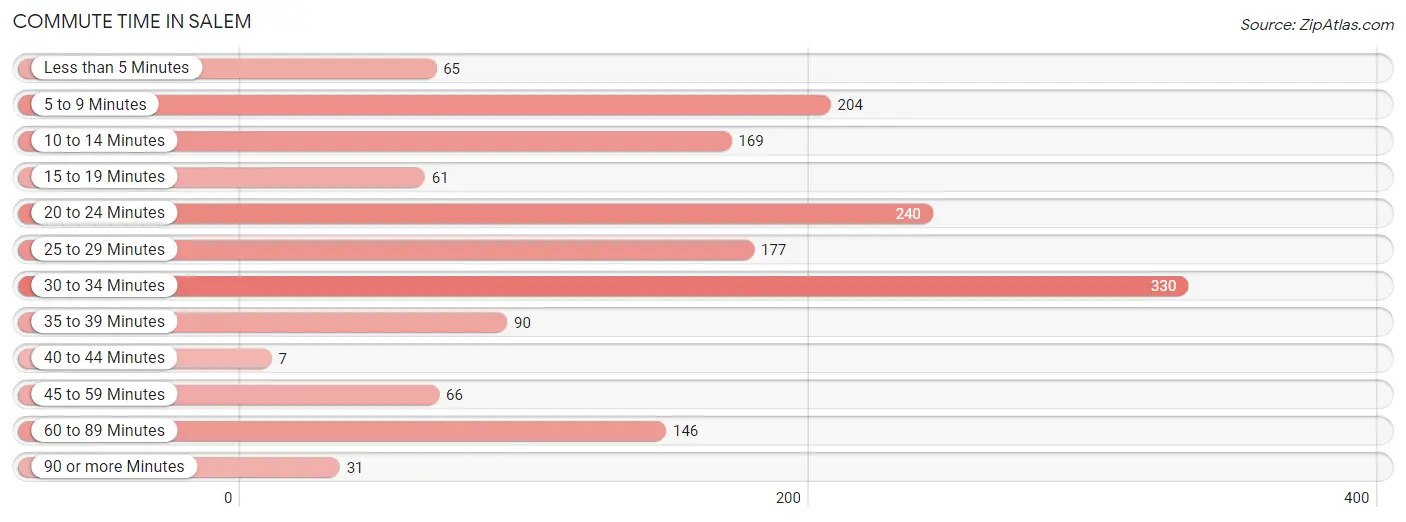
| Commute Time | # Commuters | % Commuters |
| Less than 5 Minutes | 65 | 4.1% |
| 5 to 9 Minutes | 204 | 12.9% |
| 10 to 14 Minutes | 169 | 10.7% |
| 15 to 19 Minutes | 61 | 3.8% |
| 20 to 24 Minutes | 240 | 15.1% |
| 25 to 29 Minutes | 177 | 11.2% |
| 30 to 34 Minutes | 330 | 20.8% |
| 35 to 39 Minutes | 90 | 5.7% |
| 40 to 44 Minutes | 7 | 0.4% |
| 45 to 59 Minutes | 66 | 4.2% |
| 60 to 89 Minutes | 146 | 9.2% |
| 90 or more Minutes | 31 | 1.9% |
Commute Time by Sex in Salem
The most common commute times in Salem are 5 to 9 minutes (129 commuters, 19.7%) for males and 30 to 34 minutes (203 commuters, 21.8%) for females.
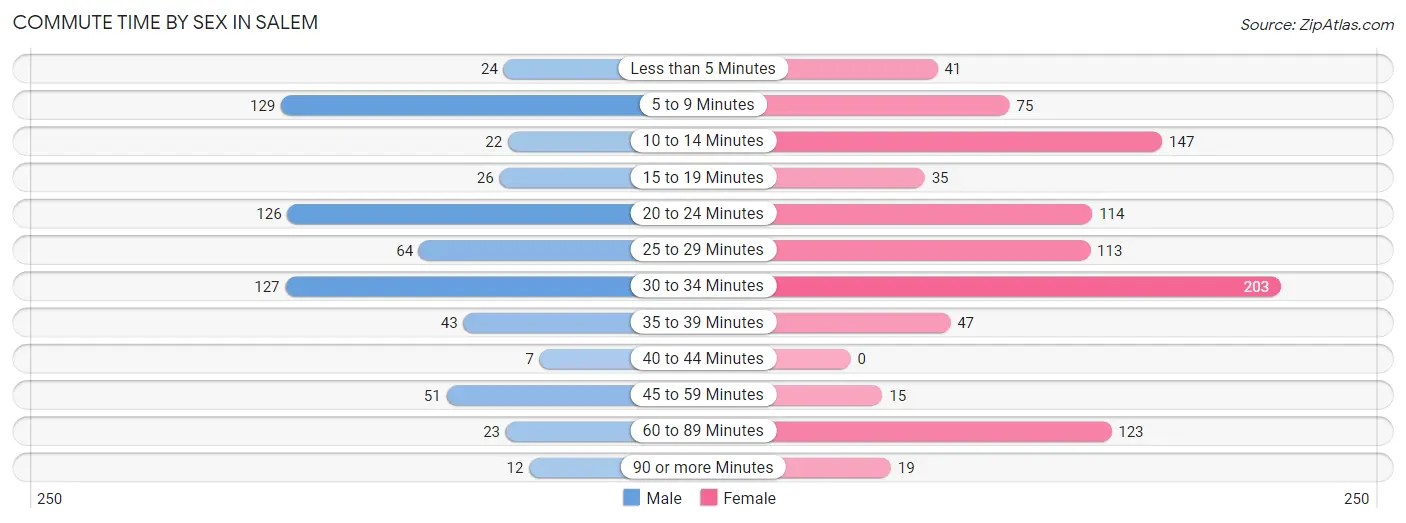
| Commute Time | Male | Female |
| Less than 5 Minutes | 24 (3.7%) | 41 (4.4%) |
| 5 to 9 Minutes | 129 (19.7%) | 75 (8.1%) |
| 10 to 14 Minutes | 22 (3.4%) | 147 (15.8%) |
| 15 to 19 Minutes | 26 (4.0%) | 35 (3.8%) |
| 20 to 24 Minutes | 126 (19.3%) | 114 (12.2%) |
| 25 to 29 Minutes | 64 (9.8%) | 113 (12.1%) |
| 30 to 34 Minutes | 127 (19.4%) | 203 (21.8%) |
| 35 to 39 Minutes | 43 (6.6%) | 47 (5.0%) |
| 40 to 44 Minutes | 7 (1.1%) | 0 (0.0%) |
| 45 to 59 Minutes | 51 (7.8%) | 15 (1.6%) |
| 60 to 89 Minutes | 23 (3.5%) | 123 (13.2%) |
| 90 or more Minutes | 12 (1.8%) | 19 (2.0%) |
Time of Departure to Work by Sex in Salem
The most frequent times of departure to work in Salem are 7:00 AM to 7:29 AM (129, 19.7%) for males and 7:30 AM to 7:59 AM (163, 17.5%) for females.
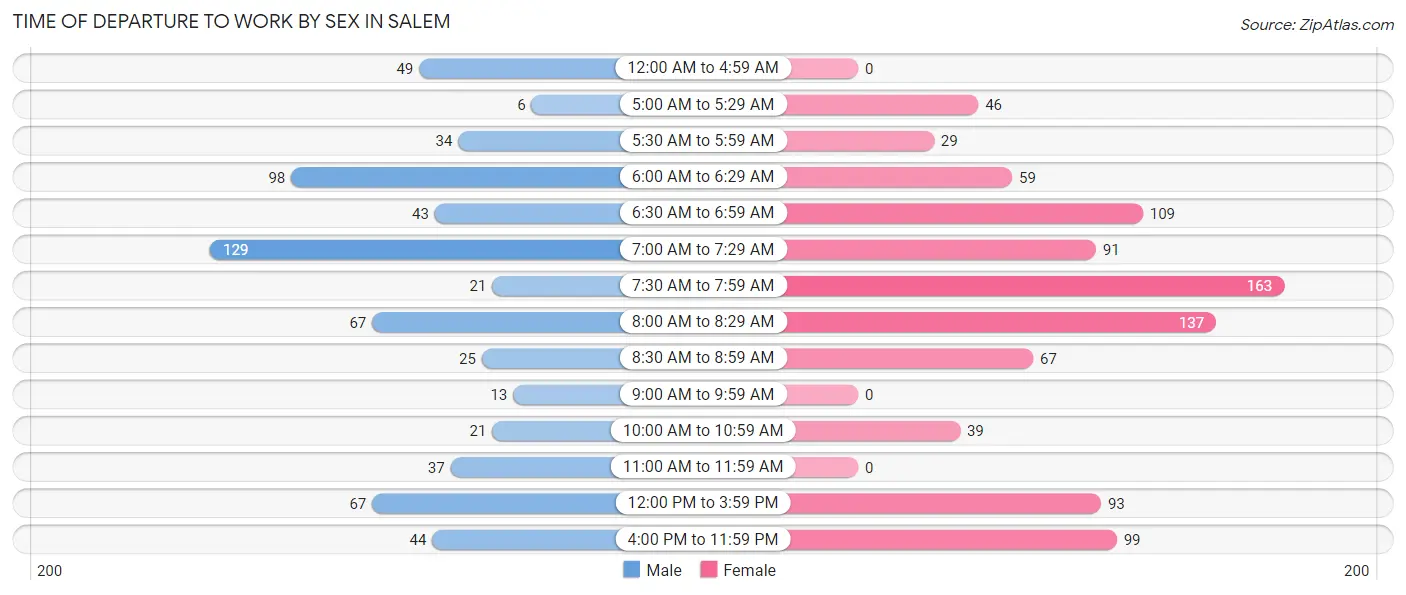
| Time of Departure | Male | Female |
| 12:00 AM to 4:59 AM | 49 (7.5%) | 0 (0.0%) |
| 5:00 AM to 5:29 AM | 6 (0.9%) | 46 (4.9%) |
| 5:30 AM to 5:59 AM | 34 (5.2%) | 29 (3.1%) |
| 6:00 AM to 6:29 AM | 98 (15.0%) | 59 (6.3%) |
| 6:30 AM to 6:59 AM | 43 (6.6%) | 109 (11.7%) |
| 7:00 AM to 7:29 AM | 129 (19.7%) | 91 (9.8%) |
| 7:30 AM to 7:59 AM | 21 (3.2%) | 163 (17.5%) |
| 8:00 AM to 8:29 AM | 67 (10.2%) | 137 (14.7%) |
| 8:30 AM to 8:59 AM | 25 (3.8%) | 67 (7.2%) |
| 9:00 AM to 9:59 AM | 13 (2.0%) | 0 (0.0%) |
| 10:00 AM to 10:59 AM | 21 (3.2%) | 39 (4.2%) |
| 11:00 AM to 11:59 AM | 37 (5.7%) | 0 (0.0%) |
| 12:00 PM to 3:59 PM | 67 (10.2%) | 93 (10.0%) |
| 4:00 PM to 11:59 PM | 44 (6.7%) | 99 (10.6%) |
| Total | 654 (100.0%) | 932 (100.0%) |
Housing Occupancy in Salem
Occupancy by Ownership in Salem
Of the total 2,172 dwellings in Salem, owner-occupied units account for 734 (33.8%), while renter-occupied units make up 1,438 (66.2%).
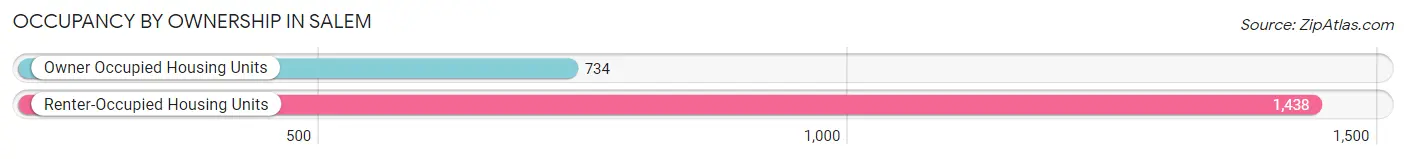
| Occupancy | # Housing Units | % Housing Units |
| Owner Occupied Housing Units | 734 | 33.8% |
| Renter-Occupied Housing Units | 1,438 | 66.2% |
| Total Occupied Housing Units | 2,172 | 100.0% |
Occupancy by Household Size in Salem
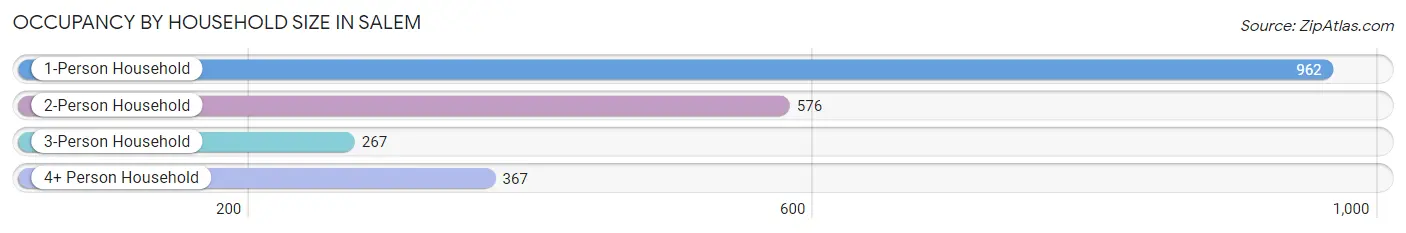
| Household Size | # Housing Units | % Housing Units |
| 1-Person Household | 962 | 44.3% |
| 2-Person Household | 576 | 26.5% |
| 3-Person Household | 267 | 12.3% |
| 4+ Person Household | 367 | 16.9% |
| Total Housing Units | 2,172 | 100.0% |
Occupancy by Ownership by Household Size in Salem
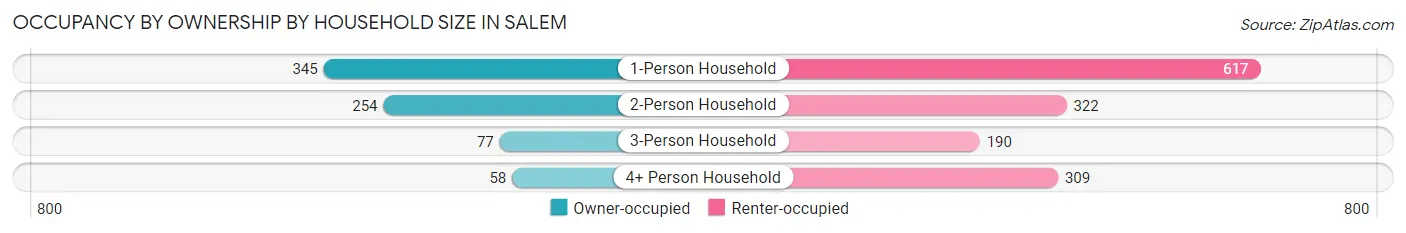
| Household Size | Owner-occupied | Renter-occupied |
| 1-Person Household | 345 (35.9%) | 617 (64.1%) |
| 2-Person Household | 254 (44.1%) | 322 (55.9%) |
| 3-Person Household | 77 (28.8%) | 190 (71.2%) |
| 4+ Person Household | 58 (15.8%) | 309 (84.2%) |
| Total Housing Units | 734 (33.8%) | 1,438 (66.2%) |
Occupancy by Educational Attainment in Salem
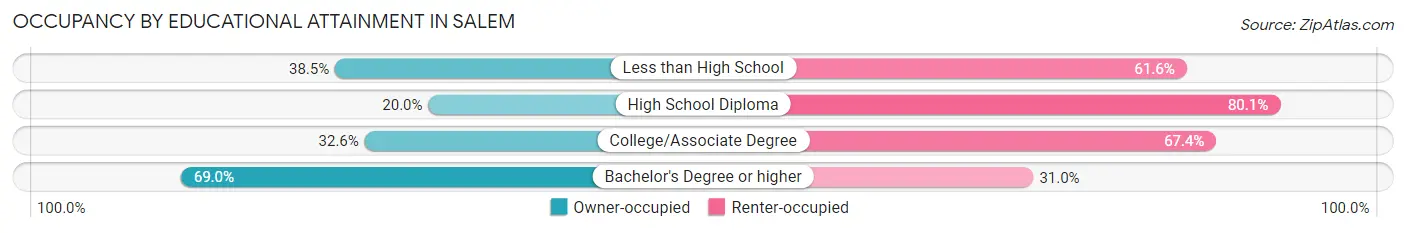
| Household Size | Owner-occupied | Renter-occupied |
| Less than High School | 193 (38.5%) | 309 (61.6%) |
| High School Diploma | 176 (20.0%) | 706 (80.0%) |
| College/Associate Degree | 160 (32.6%) | 331 (67.4%) |
| Bachelor's Degree or higher | 205 (69.0%) | 92 (31.0%) |
Occupancy by Age of Householder in Salem
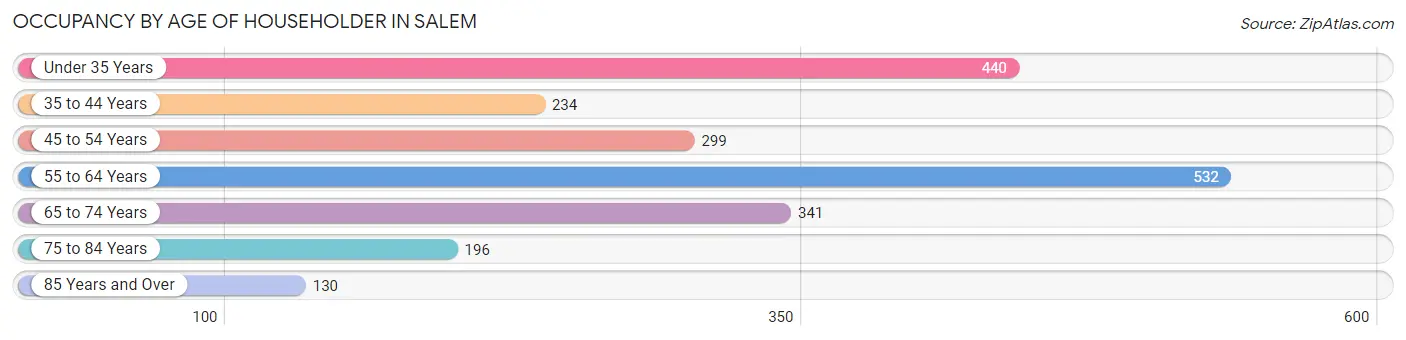
| Age Bracket | # Households | % Households |
| Under 35 Years | 440 | 20.3% |
| 35 to 44 Years | 234 | 10.8% |
| 45 to 54 Years | 299 | 13.8% |
| 55 to 64 Years | 532 | 24.5% |
| 65 to 74 Years | 341 | 15.7% |
| 75 to 84 Years | 196 | 9.0% |
| 85 Years and Over | 130 | 6.0% |
| Total | 2,172 | 100.0% |
Housing Finances in Salem
Median Income by Occupancy in Salem
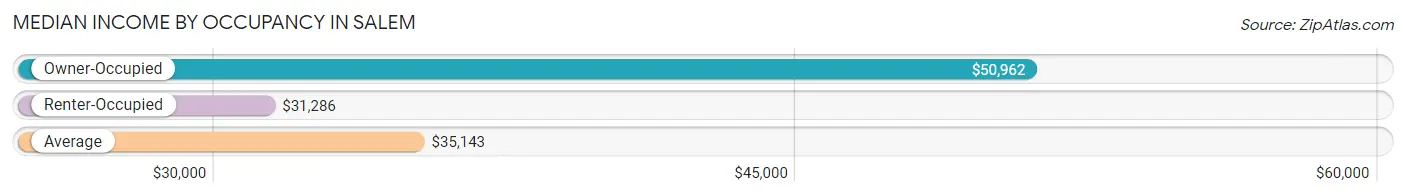
| Occupancy Type | # Households | Median Income |
| Owner-Occupied | 734 (33.8%) | $50,962 |
| Renter-Occupied | 1,438 (66.2%) | $31,286 |
| Average | 2,172 (100.0%) | $35,143 |
Occupancy by Householder Income Bracket in Salem
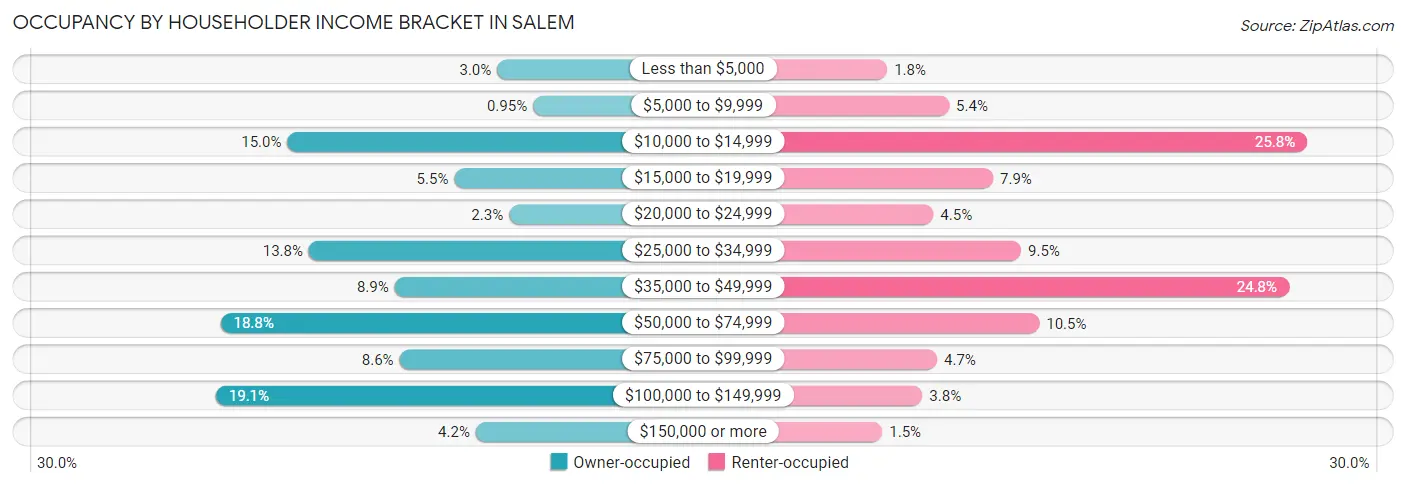
| Income Bracket | Owner-occupied | Renter-occupied |
| Less than $5,000 | 22 (3.0%) | 26 (1.8%) |
| $5,000 to $9,999 | 7 (0.9%) | 77 (5.3%) |
| $10,000 to $14,999 | 110 (15.0%) | 371 (25.8%) |
| $15,000 to $19,999 | 40 (5.4%) | 113 (7.9%) |
| $20,000 to $24,999 | 17 (2.3%) | 64 (4.4%) |
| $25,000 to $34,999 | 101 (13.8%) | 136 (9.5%) |
| $35,000 to $49,999 | 65 (8.9%) | 356 (24.8%) |
| $50,000 to $74,999 | 138 (18.8%) | 151 (10.5%) |
| $75,000 to $99,999 | 63 (8.6%) | 67 (4.7%) |
| $100,000 to $149,999 | 140 (19.1%) | 55 (3.8%) |
| $150,000 or more | 31 (4.2%) | 22 (1.5%) |
| Total | 734 (100.0%) | 1,438 (100.0%) |
Monthly Housing Cost Tiers in Salem
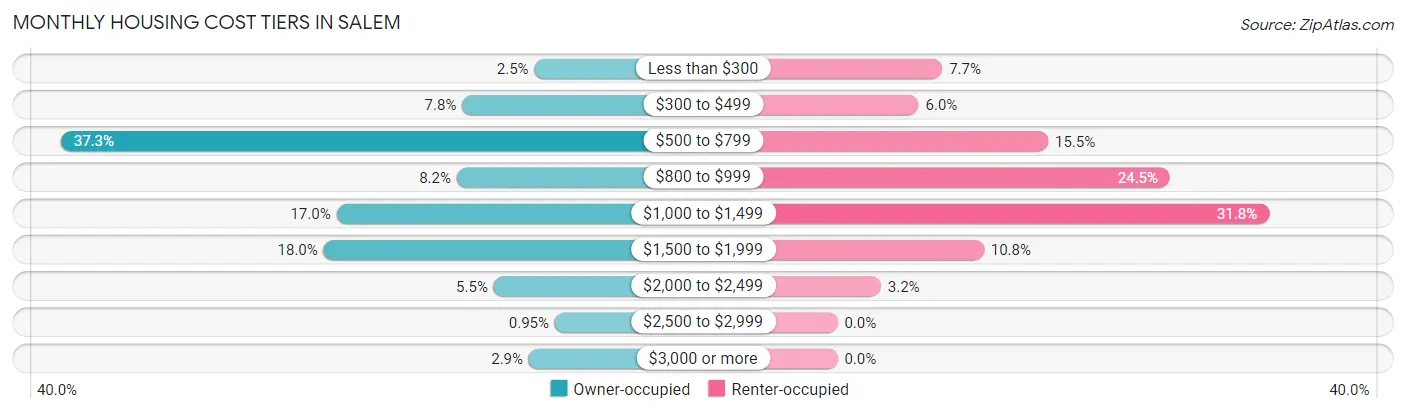
| Monthly Cost | Owner-occupied | Renter-occupied |
| Less than $300 | 18 (2.5%) | 111 (7.7%) |
| $300 to $499 | 57 (7.8%) | 86 (6.0%) |
| $500 to $799 | 274 (37.3%) | 223 (15.5%) |
| $800 to $999 | 60 (8.2%) | 352 (24.5%) |
| $1,000 to $1,499 | 125 (17.0%) | 457 (31.8%) |
| $1,500 to $1,999 | 132 (18.0%) | 155 (10.8%) |
| $2,000 to $2,499 | 40 (5.4%) | 46 (3.2%) |
| $2,500 to $2,999 | 7 (0.9%) | 0 (0.0%) |
| $3,000 or more | 21 (2.9%) | 0 (0.0%) |
| Total | 734 (100.0%) | 1,438 (100.0%) |
Physical Housing Characteristics in Salem
Housing Structures in Salem
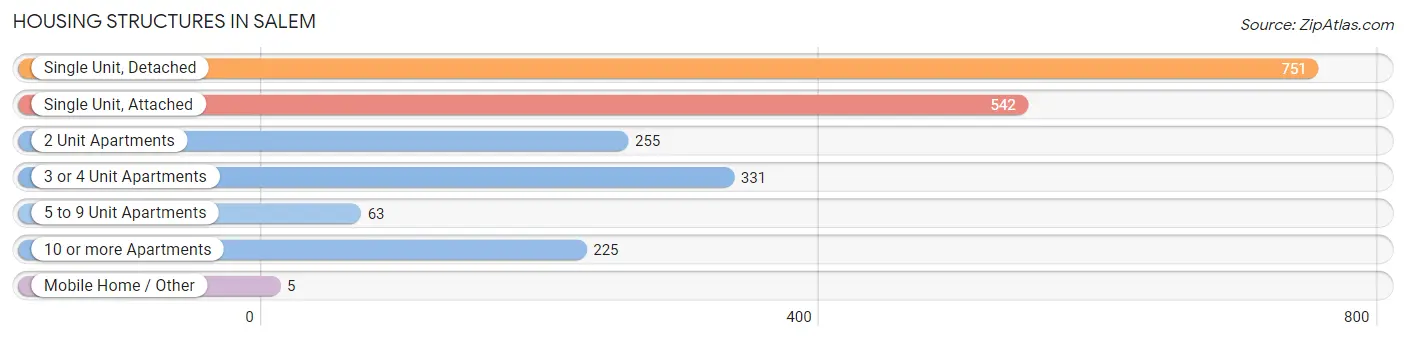
| Structure Type | # Housing Units | % Housing Units |
| Single Unit, Detached | 751 | 34.6% |
| Single Unit, Attached | 542 | 24.9% |
| 2 Unit Apartments | 255 | 11.7% |
| 3 or 4 Unit Apartments | 331 | 15.2% |
| 5 to 9 Unit Apartments | 63 | 2.9% |
| 10 or more Apartments | 225 | 10.4% |
| Mobile Home / Other | 5 | 0.2% |
| Total | 2,172 | 100.0% |
Housing Structures by Occupancy in Salem
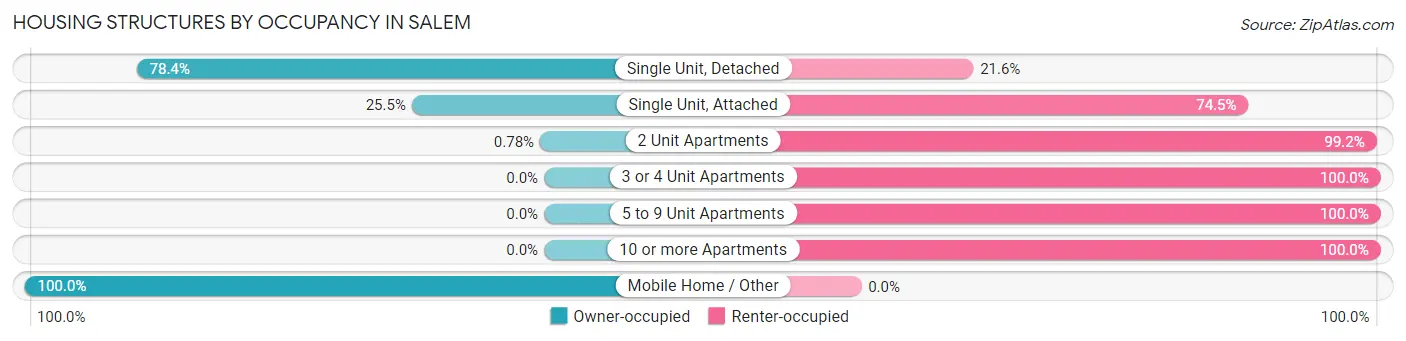
| Structure Type | Owner-occupied | Renter-occupied |
| Single Unit, Detached | 589 (78.4%) | 162 (21.6%) |
| Single Unit, Attached | 138 (25.5%) | 404 (74.5%) |
| 2 Unit Apartments | 2 (0.8%) | 253 (99.2%) |
| 3 or 4 Unit Apartments | 0 (0.0%) | 331 (100.0%) |
| 5 to 9 Unit Apartments | 0 (0.0%) | 63 (100.0%) |
| 10 or more Apartments | 0 (0.0%) | 225 (100.0%) |
| Mobile Home / Other | 5 (100.0%) | 0 (0.0%) |
| Total | 734 (33.8%) | 1,438 (66.2%) |
Housing Structures by Number of Rooms in Salem
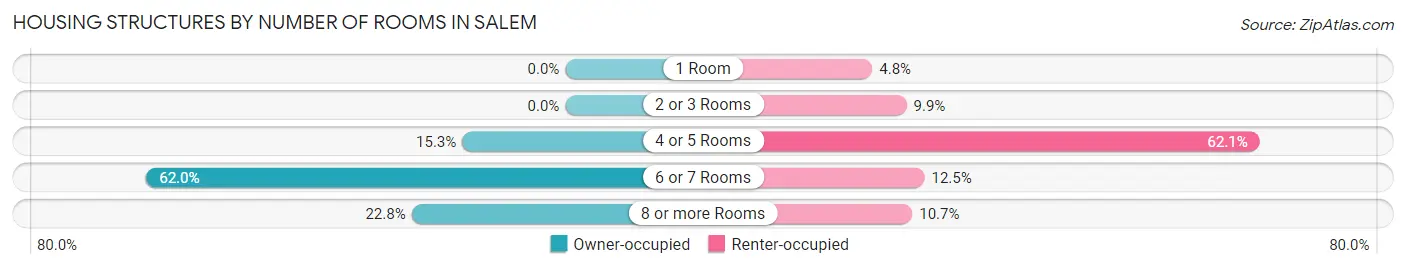
| Number of Rooms | Owner-occupied | Renter-occupied |
| 1 Room | 0 (0.0%) | 69 (4.8%) |
| 2 or 3 Rooms | 0 (0.0%) | 142 (9.9%) |
| 4 or 5 Rooms | 112 (15.3%) | 893 (62.1%) |
| 6 or 7 Rooms | 455 (62.0%) | 180 (12.5%) |
| 8 or more Rooms | 167 (22.8%) | 154 (10.7%) |
| Total | 734 (100.0%) | 1,438 (100.0%) |
Housing Structure by Heating Type in Salem
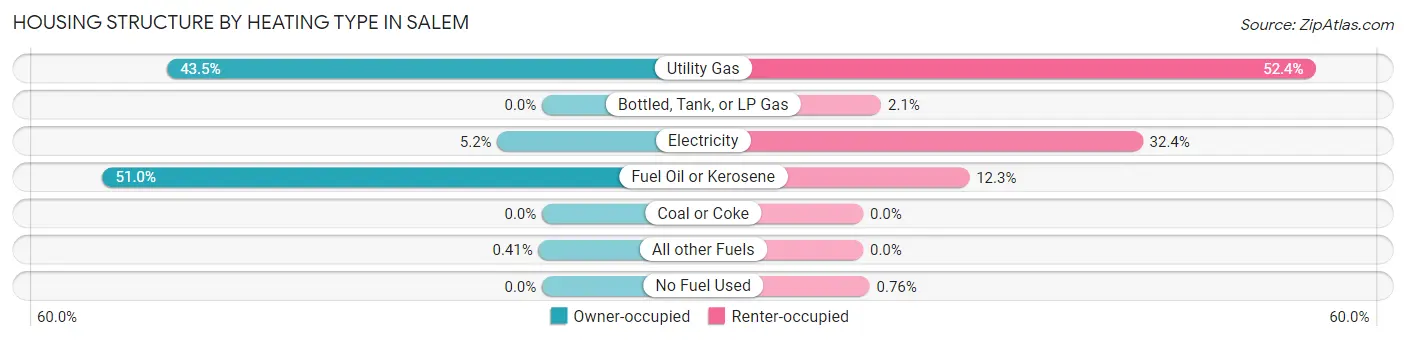
| Heating Type | Owner-occupied | Renter-occupied |
| Utility Gas | 319 (43.5%) | 754 (52.4%) |
| Bottled, Tank, or LP Gas | 0 (0.0%) | 30 (2.1%) |
| Electricity | 38 (5.2%) | 466 (32.4%) |
| Fuel Oil or Kerosene | 374 (50.9%) | 177 (12.3%) |
| Coal or Coke | 0 (0.0%) | 0 (0.0%) |
| All other Fuels | 3 (0.4%) | 0 (0.0%) |
| No Fuel Used | 0 (0.0%) | 11 (0.8%) |
| Total | 734 (100.0%) | 1,438 (100.0%) |
Household Vehicle Usage in Salem
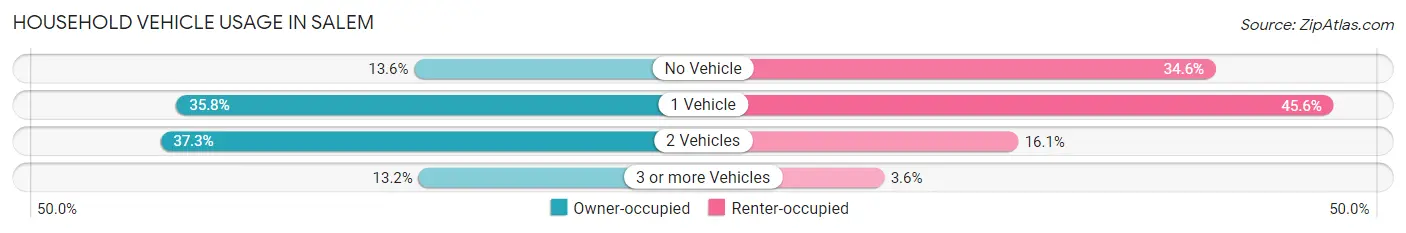
| Vehicles per Household | Owner-occupied | Renter-occupied |
| No Vehicle | 100 (13.6%) | 498 (34.6%) |
| 1 Vehicle | 263 (35.8%) | 656 (45.6%) |
| 2 Vehicles | 274 (37.3%) | 232 (16.1%) |
| 3 or more Vehicles | 97 (13.2%) | 52 (3.6%) |
| Total | 734 (100.0%) | 1,438 (100.0%) |
Real Estate & Mortgages in Salem
Real Estate and Mortgage Overview in Salem
| Characteristic | Without Mortgage | With Mortgage |
| Housing Units | 387 | 347 |
| Median Property Value | $62,900 | $69,200 |
| Median Household Income | $35,066 | $24 |
| Monthly Housing Costs | $652 | $21 |
| Real Estate Taxes | $2,746 | $25 |
Property Value by Mortgage Status in Salem
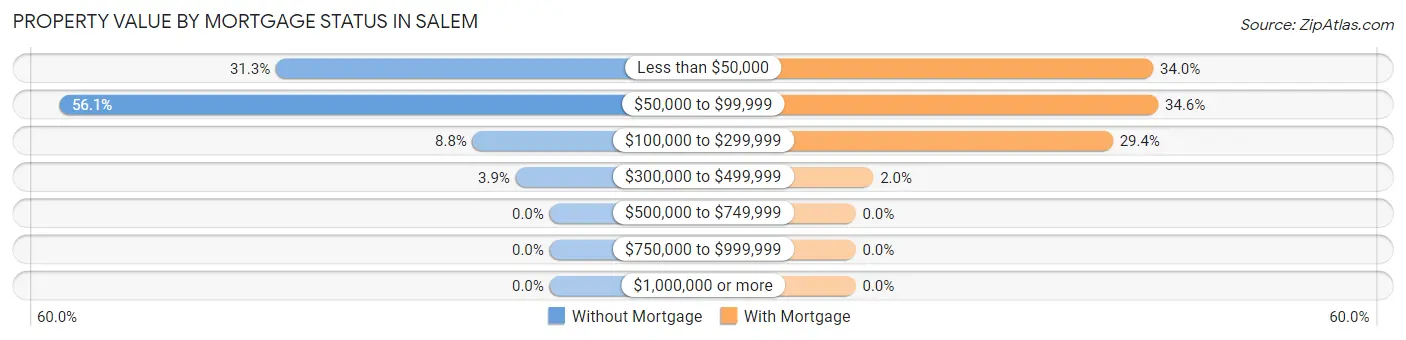
| Property Value | Without Mortgage | With Mortgage |
| Less than $50,000 | 121 (31.3%) | 118 (34.0%) |
| $50,000 to $99,999 | 217 (56.1%) | 120 (34.6%) |
| $100,000 to $299,999 | 34 (8.8%) | 102 (29.4%) |
| $300,000 to $499,999 | 15 (3.9%) | 7 (2.0%) |
| $500,000 to $749,999 | 0 (0.0%) | 0 (0.0%) |
| $750,000 to $999,999 | 0 (0.0%) | 0 (0.0%) |
| $1,000,000 or more | 0 (0.0%) | 0 (0.0%) |
| Total | 387 (100.0%) | 347 (100.0%) |
Household Income by Mortgage Status in Salem
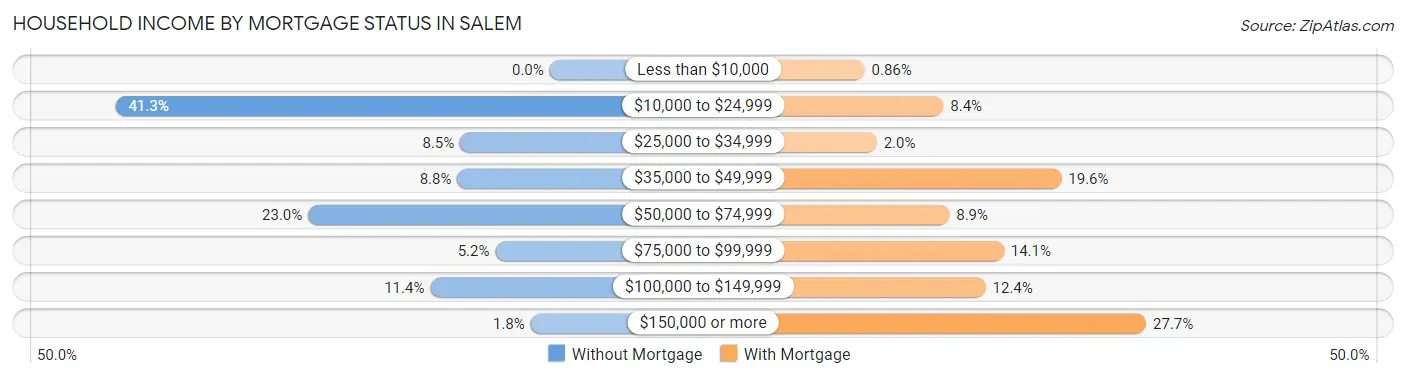
| Household Income | Without Mortgage | With Mortgage |
| Less than $10,000 | 0 (0.0%) | 3 (0.9%) |
| $10,000 to $24,999 | 160 (41.3%) | 29 (8.4%) |
| $25,000 to $34,999 | 33 (8.5%) | 7 (2.0%) |
| $35,000 to $49,999 | 34 (8.8%) | 68 (19.6%) |
| $50,000 to $74,999 | 89 (23.0%) | 31 (8.9%) |
| $75,000 to $99,999 | 20 (5.2%) | 49 (14.1%) |
| $100,000 to $149,999 | 44 (11.4%) | 43 (12.4%) |
| $150,000 or more | 7 (1.8%) | 96 (27.7%) |
| Total | 387 (100.0%) | 347 (100.0%) |
Property Value to Household Income Ratio in Salem
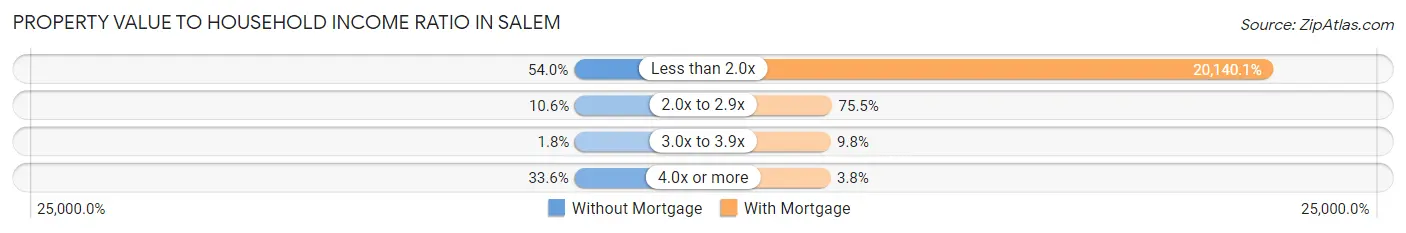
| Value-to-Income Ratio | Without Mortgage | With Mortgage |
| Less than 2.0x | 209 (54.0%) | 69,886 (20,140.1%) |
| 2.0x to 2.9x | 41 (10.6%) | 262 (75.5%) |
| 3.0x to 3.9x | 7 (1.8%) | 34 (9.8%) |
| 4.0x or more | 130 (33.6%) | 13 (3.7%) |
| Total | 387 (100.0%) | 347 (100.0%) |
Real Estate Taxes by Mortgage Status in Salem
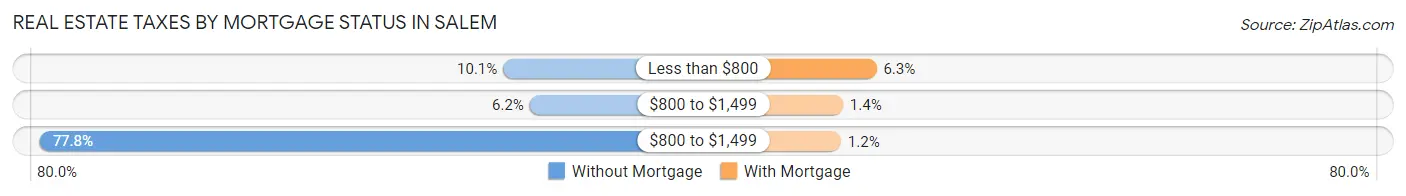
| Property Taxes | Without Mortgage | With Mortgage |
| Less than $800 | 39 (10.1%) | 22 (6.3%) |
| $800 to $1,499 | 24 (6.2%) | 5 (1.4%) |
| $800 to $1,499 | 301 (77.8%) | 4 (1.1%) |
| Total | 387 (100.0%) | 347 (100.0%) |
Health & Disability in Salem
Health Insurance Coverage by Age in Salem
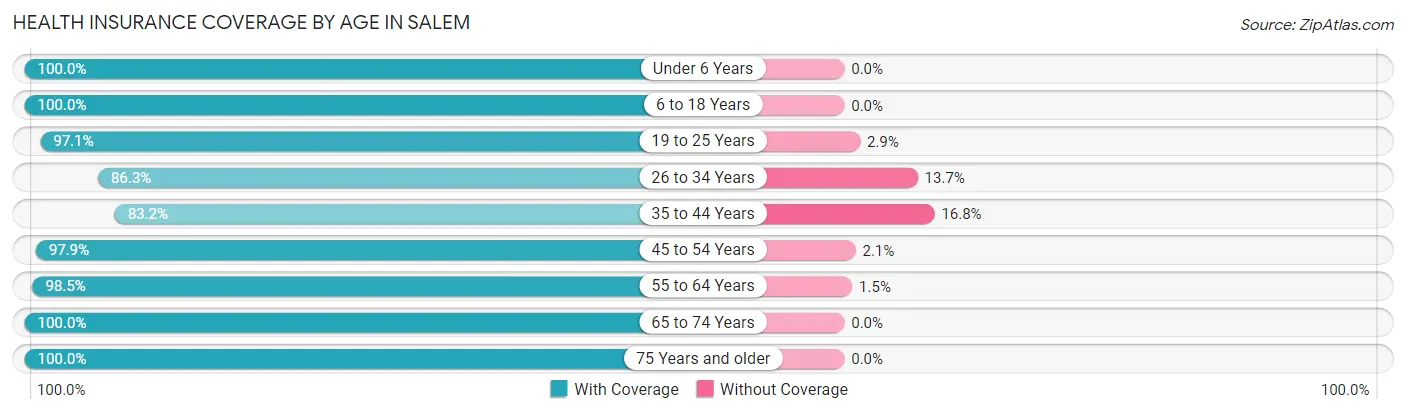
| Age Bracket | With Coverage | Without Coverage |
| Under 6 Years | 593 (100.0%) | 0 (0.0%) |
| 6 to 18 Years | 987 (100.0%) | 0 (0.0%) |
| 19 to 25 Years | 397 (97.1%) | 12 (2.9%) |
| 26 to 34 Years | 612 (86.3%) | 97 (13.7%) |
| 35 to 44 Years | 470 (83.2%) | 95 (16.8%) |
| 45 to 54 Years | 420 (97.9%) | 9 (2.1%) |
| 55 to 64 Years | 736 (98.5%) | 11 (1.5%) |
| 65 to 74 Years | 491 (100.0%) | 0 (0.0%) |
| 75 Years and older | 355 (100.0%) | 0 (0.0%) |
| Total | 5,061 (95.8%) | 224 (4.2%) |
Health Insurance Coverage by Citizenship Status in Salem
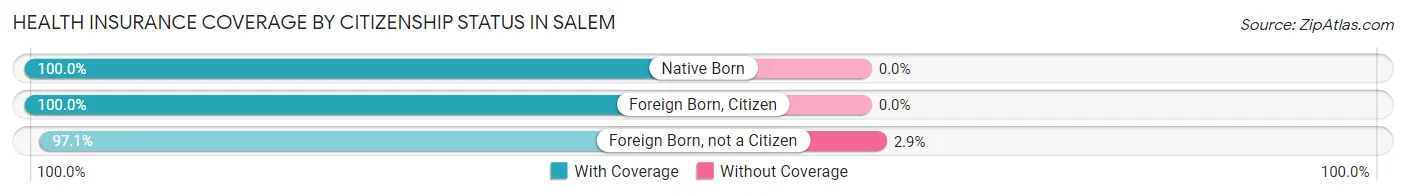
| Citizenship Status | With Coverage | Without Coverage |
| Native Born | 593 (100.0%) | 0 (0.0%) |
| Foreign Born, Citizen | 987 (100.0%) | 0 (0.0%) |
| Foreign Born, not a Citizen | 397 (97.1%) | 12 (2.9%) |
Health Insurance Coverage by Household Income in Salem
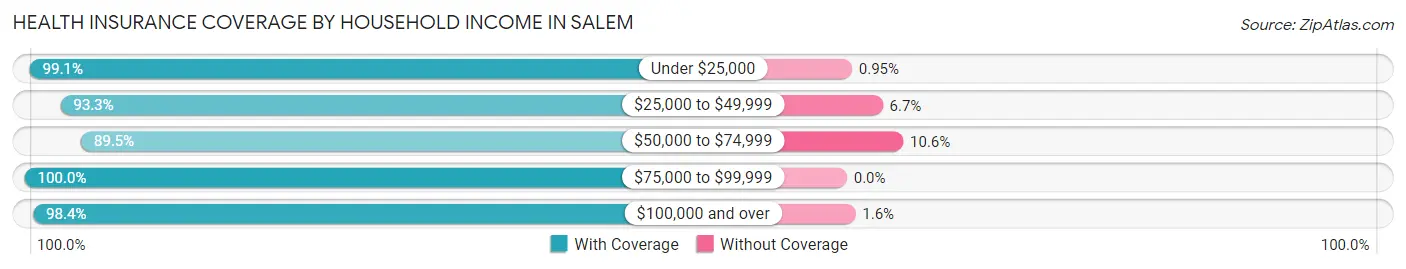
| Household Income | With Coverage | Without Coverage |
| Under $25,000 | 1,557 (99.1%) | 15 (0.9%) |
| $25,000 to $49,999 | 1,709 (93.3%) | 123 (6.7%) |
| $50,000 to $74,999 | 602 (89.4%) | 71 (10.5%) |
| $75,000 to $99,999 | 255 (100.0%) | 0 (0.0%) |
| $100,000 and over | 914 (98.4%) | 15 (1.6%) |
Public vs Private Health Insurance Coverage by Age in Salem
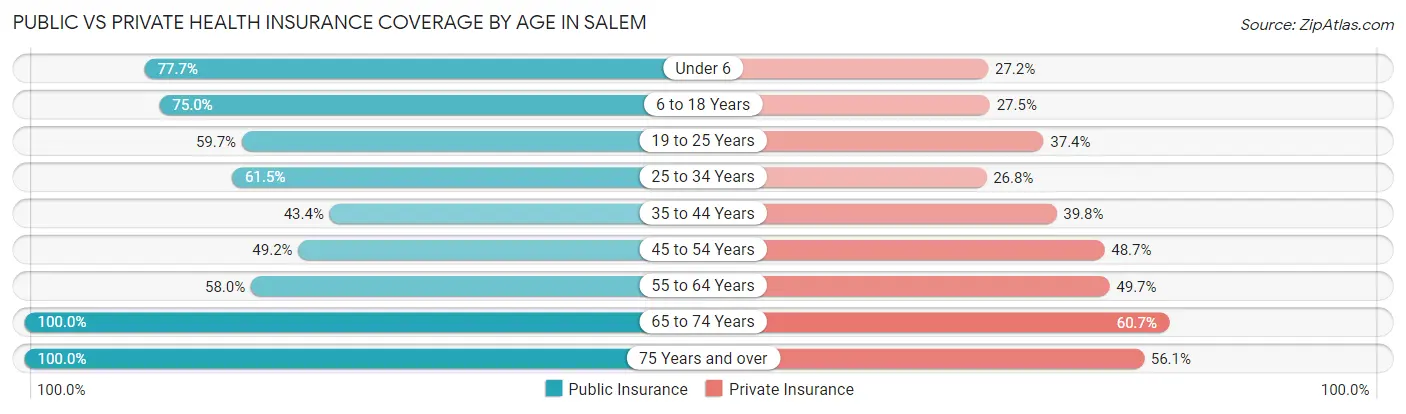
| Age Bracket | Public Insurance | Private Insurance |
| Under 6 | 461 (77.7%) | 161 (27.2%) |
| 6 to 18 Years | 740 (75.0%) | 271 (27.5%) |
| 19 to 25 Years | 244 (59.7%) | 153 (37.4%) |
| 25 to 34 Years | 436 (61.5%) | 190 (26.8%) |
| 35 to 44 Years | 245 (43.4%) | 225 (39.8%) |
| 45 to 54 Years | 211 (49.2%) | 209 (48.7%) |
| 55 to 64 Years | 433 (58.0%) | 371 (49.7%) |
| 65 to 74 Years | 491 (100.0%) | 298 (60.7%) |
| 75 Years and over | 355 (100.0%) | 199 (56.1%) |
| Total | 3,616 (68.4%) | 2,077 (39.3%) |
Disability Status by Sex by Age in Salem
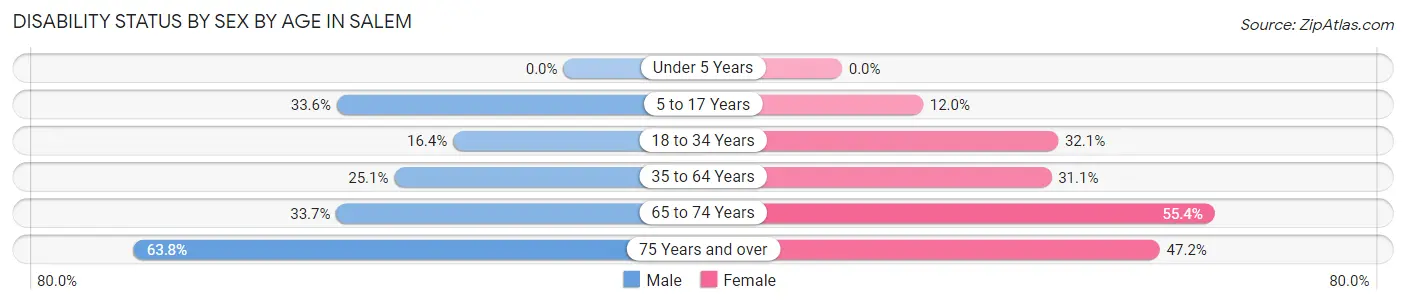
| Age Bracket | Male | Female |
| Under 5 Years | 0 (0.0%) | 0 (0.0%) |
| 5 to 17 Years | 145 (33.6%) | 70 (12.0%) |
| 18 to 34 Years | 77 (16.4%) | 208 (32.1%) |
| 35 to 64 Years | 194 (25.1%) | 301 (31.1%) |
| 65 to 74 Years | 90 (33.7%) | 124 (55.4%) |
| 75 Years and over | 44 (63.8%) | 135 (47.2%) |
Disability Class by Sex by Age in Salem
Disability Class: Hearing Difficulty
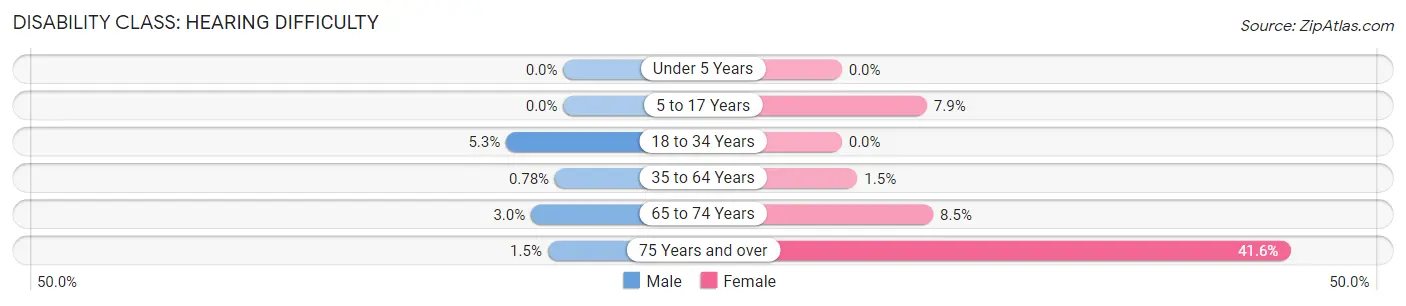
| Age Bracket | Male | Female |
| Under 5 Years | 0 (0.0%) | 0 (0.0%) |
| 5 to 17 Years | 0 (0.0%) | 46 (7.9%) |
| 18 to 34 Years | 25 (5.3%) | 0 (0.0%) |
| 35 to 64 Years | 6 (0.8%) | 14 (1.5%) |
| 65 to 74 Years | 8 (3.0%) | 19 (8.5%) |
| 75 Years and over | 1 (1.5%) | 119 (41.6%) |
Disability Class: Vision Difficulty
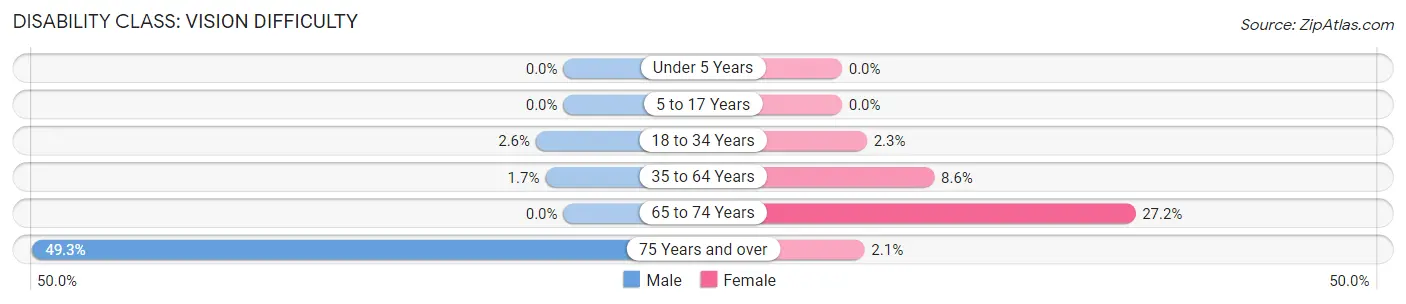
| Age Bracket | Male | Female |
| Under 5 Years | 0 (0.0%) | 0 (0.0%) |
| 5 to 17 Years | 0 (0.0%) | 0 (0.0%) |
| 18 to 34 Years | 12 (2.5%) | 15 (2.3%) |
| 35 to 64 Years | 13 (1.7%) | 83 (8.6%) |
| 65 to 74 Years | 0 (0.0%) | 61 (27.2%) |
| 75 Years and over | 34 (49.3%) | 6 (2.1%) |
Disability Class: Cognitive Difficulty
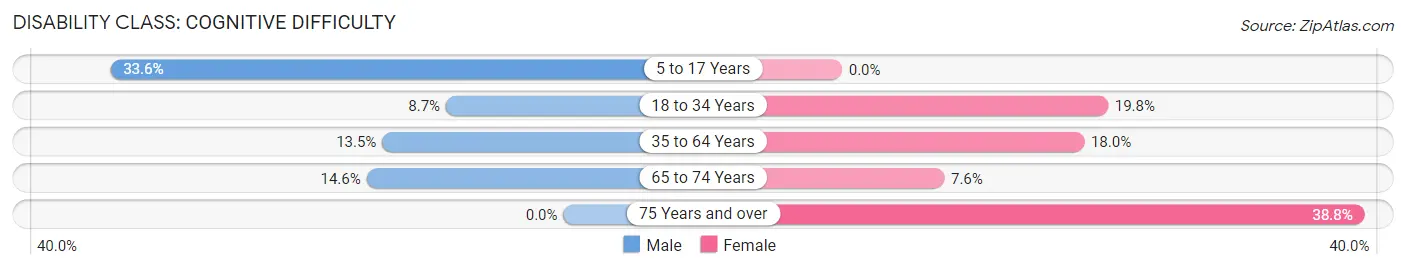
| Age Bracket | Male | Female |
| 5 to 17 Years | 145 (33.6%) | 0 (0.0%) |
| 18 to 34 Years | 41 (8.7%) | 128 (19.8%) |
| 35 to 64 Years | 104 (13.5%) | 174 (18.0%) |
| 65 to 74 Years | 39 (14.6%) | 17 (7.6%) |
| 75 Years and over | 0 (0.0%) | 111 (38.8%) |
Disability Class: Ambulatory Difficulty
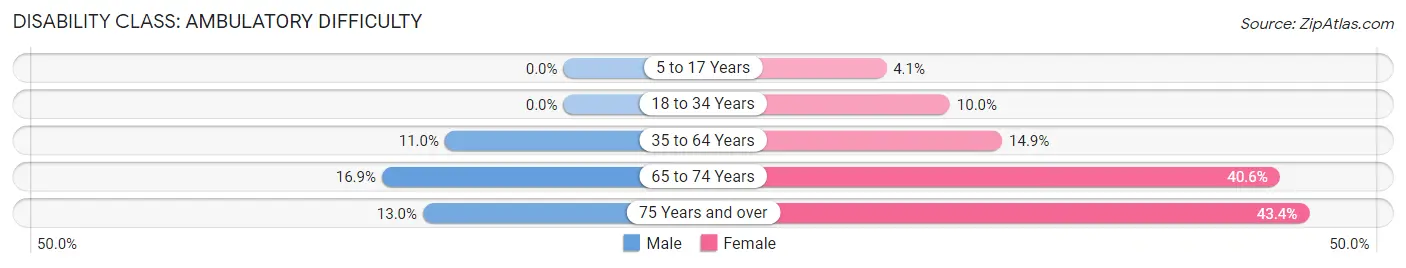
| Age Bracket | Male | Female |
| 5 to 17 Years | 0 (0.0%) | 24 (4.1%) |
| 18 to 34 Years | 0 (0.0%) | 65 (10.0%) |
| 35 to 64 Years | 85 (11.0%) | 144 (14.9%) |
| 65 to 74 Years | 45 (16.9%) | 91 (40.6%) |
| 75 Years and over | 9 (13.0%) | 124 (43.4%) |
Disability Class: Self-Care Difficulty
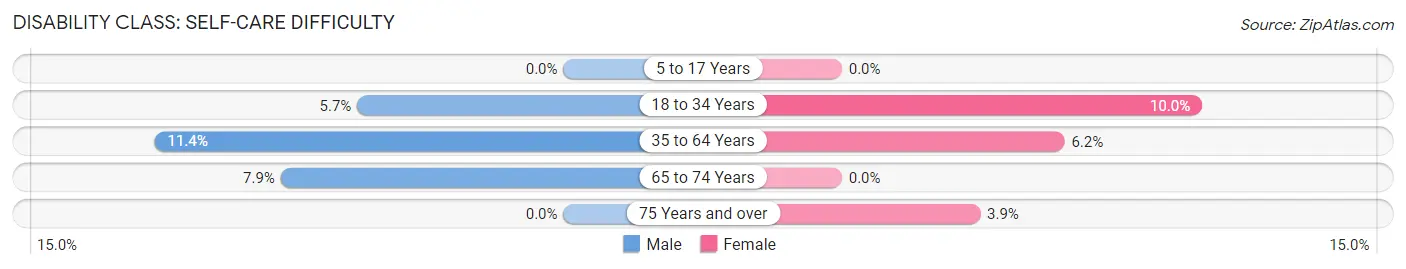
| Age Bracket | Male | Female |
| 5 to 17 Years | 0 (0.0%) | 0 (0.0%) |
| 18 to 34 Years | 27 (5.7%) | 65 (10.0%) |
| 35 to 64 Years | 88 (11.4%) | 60 (6.2%) |
| 65 to 74 Years | 21 (7.9%) | 0 (0.0%) |
| 75 Years and over | 0 (0.0%) | 11 (3.8%) |
Technology Access in Salem
Computing Device Access in Salem
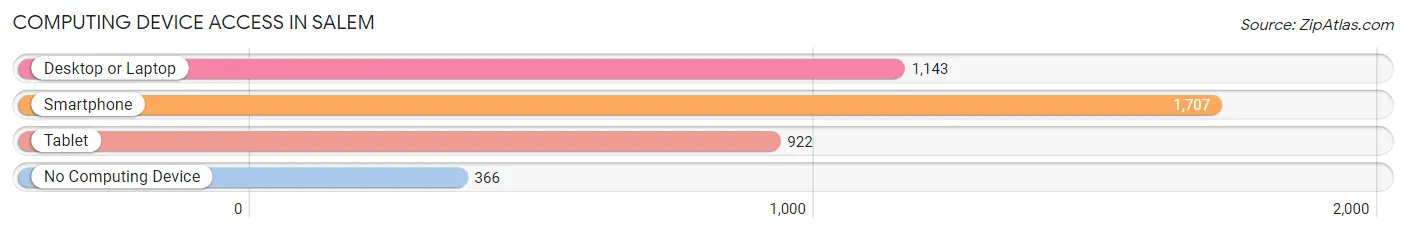
| Device Type | # Households | % Households |
| Desktop or Laptop | 1,143 | 52.6% |
| Smartphone | 1,707 | 78.6% |
| Tablet | 922 | 42.4% |
| No Computing Device | 366 | 16.9% |
| Total | 2,172 | 100.0% |
Internet Access in Salem
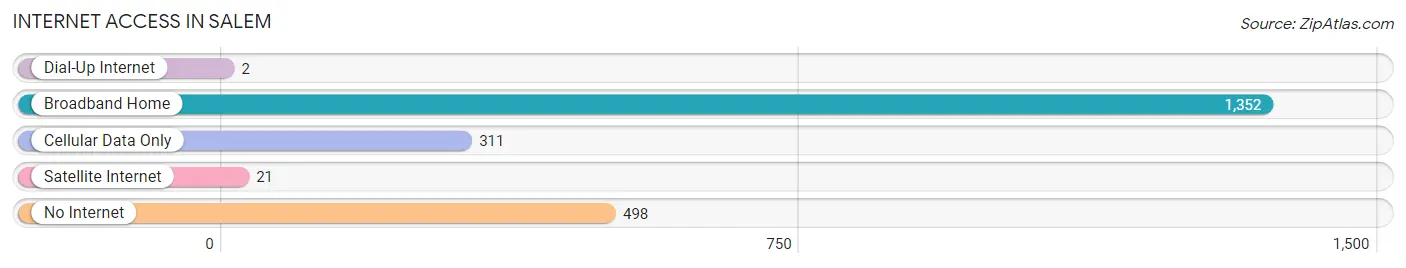
| Internet Type | # Households | % Households |
| Dial-Up Internet | 2 | 0.1% |
| Broadband Home | 1,352 | 62.3% |
| Cellular Data Only | 311 | 14.3% |
| Satellite Internet | 21 | 1.0% |
| No Internet | 498 | 22.9% |
| Total | 2,172 | 100.0% |
Salem Summary
Salem, New Jersey is a city located in Salem County, in the southwestern part of the state. It is situated on the Delaware River, near the Delaware Bay. The city has a population of 5,146, according to the 2010 census.
History
Salem was first settled in 1675 by a group of Quakers from England. The town was named after the biblical city of Salem, which was the home of the prophet Elijah. The town was incorporated in 1798 and was the county seat of Salem County until 1867.
The city was an important port during the colonial period, and was a major center for shipbuilding and trade. During the Revolutionary War, the city was the site of several battles, including the Battle of Salem.
In the 19th century, Salem became an important industrial center, with several factories and mills. The city was also a major center for the production of glass and pottery.
Geography
Salem is located in the southwestern part of New Jersey, on the Delaware River. It is bordered by Pennsville Township to the north, Mannington Township to the east, and Alloway Township to the south. The city has a total area of 2.3 square miles, all of which is land.
The city is located in the Delaware Valley, and is part of the Atlantic Coastal Plain. The climate is humid subtropical, with hot, humid summers and mild winters.
Economy
The economy of Salem is largely based on manufacturing and services. The city is home to several factories and mills, including a glass factory, a pottery factory, and a paper mill.
The city is also home to several retail stores, restaurants, and other businesses. The city is served by the Salem County Airport, which offers flights to Philadelphia and other cities.
Demographics
As of the 2010 census, the population of Salem was 5,146. The racial makeup of the city was 79.3% White, 15.2% African American, 0.7% Native American, 0.7% Asian, 0.1% Pacific Islander, 1.7% from other races, and 2.2% from two or more races. Hispanic or Latino of any race were 4.2% of the population.
The median income for a household in the city was $37,917, and the median income for a family was $45,938. The per capita income for the city was $18,945. About 16.2% of families and 19.2% of the population were below the poverty line, including 28.2% of those under age 18 and 11.2% of those age 65 or over.
Common Questions
What is Per Capita Income in Salem?
Per Capita income in Salem is $21,330.
What is the Median Family Income in Salem?
Median Family Income in Salem is $48,936.
What is the Median Household income in Salem?
Median Household Income in Salem is $35,143.
What is Income or Wage Gap in Salem?
Income or Wage Gap in Salem is 33.7%.
Women in Salem earn 66.3 cents for every dollar earned by a man.
What is Inequality or Gini Index in Salem?
Inequality or Gini Index in Salem is 0.47.
What is the Total Population of Salem?
Total Population of Salem is 5,285.
What is the Total Male Population of Salem?
Total Male Population of Salem is 2,323.
What is the Total Female Population of Salem?
Total Female Population of Salem is 2,962.
What is the Ratio of Males per 100 Females in Salem?
There are 78.43 Males per 100 Females in Salem.
What is the Ratio of Females per 100 Males in Salem?
There are 127.51 Females per 100 Males in Salem.
What is the Median Population Age in Salem?
Median Population Age in Salem is 34.6 Years.
What is the Average Family Size in Salem
Average Family Size in Salem is 3.4 People.
What is the Average Household Size in Salem
Average Household Size in Salem is 2.4 People.
How Large is the Labor Force in Salem?
There are 2,089 People in the Labor Forcein in Salem.
What is the Percentage of People in the Labor Force in Salem?
54.4% of People are in the Labor Force in Salem.
What is the Unemployment Rate in Salem?
Unemployment Rate in Salem is 12.5%.