North Arlington borough, NJ Map & Demographics
North Arlington borough Overview
$48,499
PER CAPITA INCOME
$114,538
AVG FAMILY INCOME
$96,869
AVG HOUSEHOLD INCOME
25.3%
WAGE / INCOME GAP [ % ]
74.7¢/ $1
WAGE / INCOME GAP [ $ ]
$7,808
FAMILY INCOME DEFICIT
0.40
INEQUALITY / GINI INDEX
16,352
TOTAL POPULATION
7,706
MALE POPULATION
8,646
FEMALE POPULATION
89.13
MALES / 100 FEMALES
112.20
FEMALES / 100 MALES
40.4
MEDIAN AGE
2.9
AVG FAMILY SIZE
2.5
AVG HOUSEHOLD SIZE
9,454
LABOR FORCE [ PEOPLE ]
68.9%
PERCENT IN LABOR FORCE
5.8%
UNEMPLOYMENT RATE
Income in North Arlington borough
Income Overview in North Arlington borough
Per Capita Income in North Arlington borough is $48,499, while median incomes of families and households are $114,538 and $96,869 respectively.
| Characteristic | Number | Measure |
| Per Capita Income | 16,352 | $48,499 |
| Median Family Income | 4,740 | $114,538 |
| Mean Family Income | 4,740 | $132,397 |
| Median Household Income | 6,634 | $96,869 |
| Mean Household Income | 6,634 | $116,983 |
| Income Deficit | 4,740 | $7,808 |
| Wage / Income Gap (%) | 16,352 | 25.29% |
| Wage / Income Gap ($) | 16,352 | 74.71¢ per $1 |
| Gini / Inequality Index | 16,352 | 0.40 |
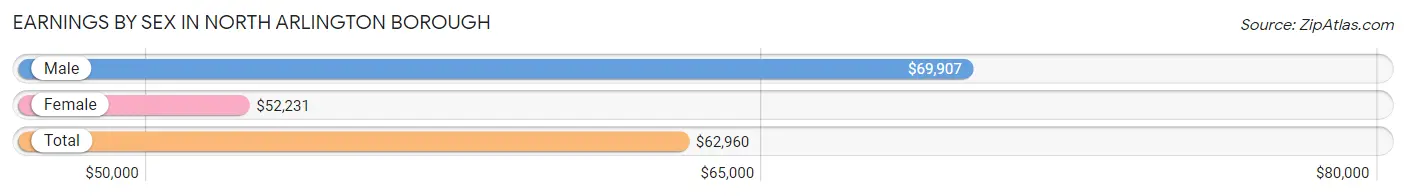
Earnings by Sex in North Arlington borough
Average Earnings in North Arlington borough are $62,960, $69,907 for men and $52,231 for women, a difference of 25.3%.
| Sex | Number | Average Earnings |
| Male | 5,070 (53.7%) | $69,907 |
| Female | 4,368 (46.3%) | $52,231 |
| Total | 9,438 (100.0%) | $62,960 |
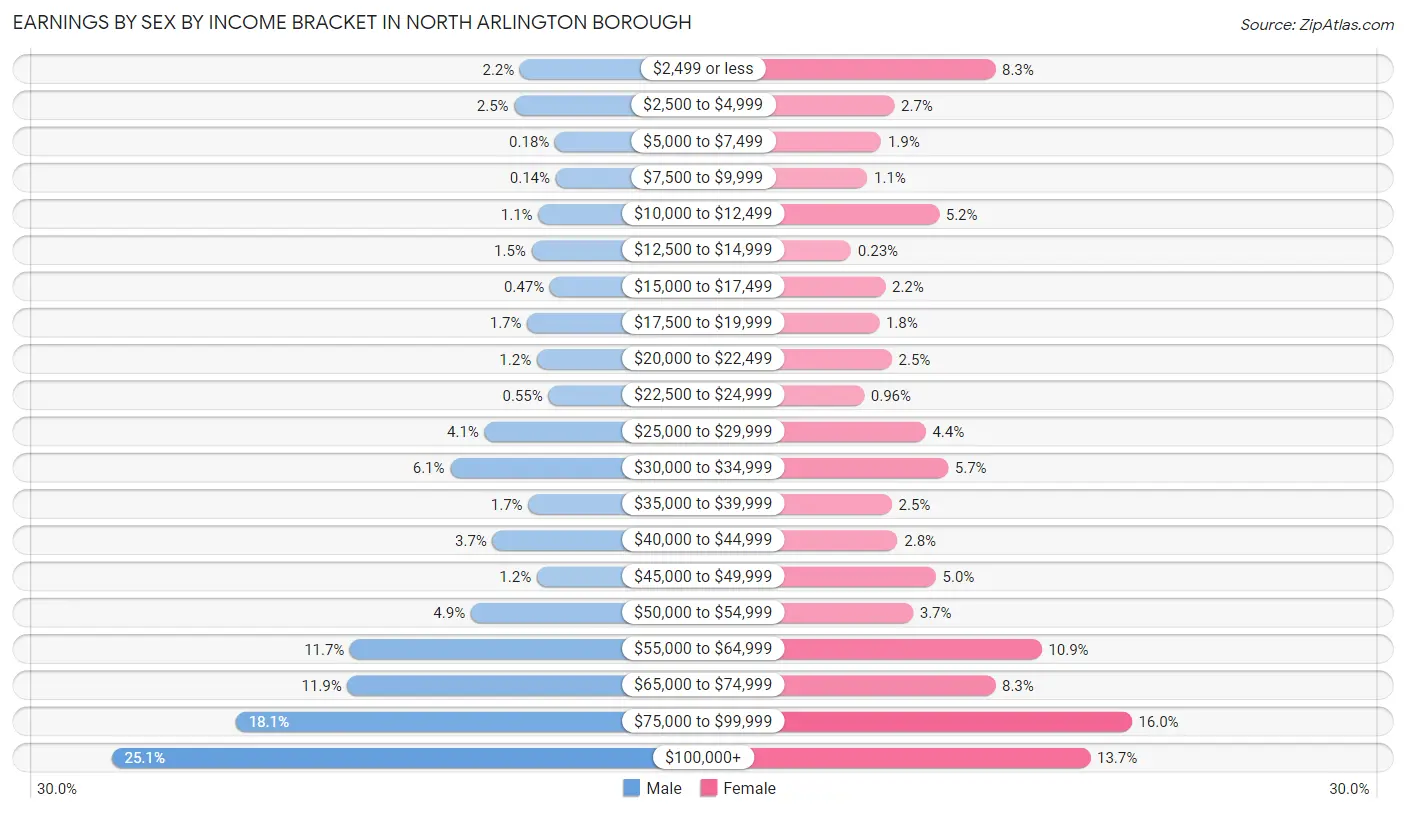
Earnings by Sex by Income Bracket in North Arlington borough
The most common earnings brackets in North Arlington borough are $100,000+ for men (1,273 | 25.1%) and $75,000 to $99,999 for women (699 | 16.0%).
| Income | Male | Female |
| $2,499 or less | 109 (2.1%) | 364 (8.3%) |
| $2,500 to $4,999 | 125 (2.5%) | 116 (2.7%) |
| $5,000 to $7,499 | 9 (0.2%) | 84 (1.9%) |
| $7,500 to $9,999 | 7 (0.1%) | 50 (1.1%) |
| $10,000 to $12,499 | 57 (1.1%) | 226 (5.2%) |
| $12,500 to $14,999 | 76 (1.5%) | 10 (0.2%) |
| $15,000 to $17,499 | 24 (0.5%) | 94 (2.1%) |
| $17,500 to $19,999 | 88 (1.7%) | 79 (1.8%) |
| $20,000 to $22,499 | 61 (1.2%) | 110 (2.5%) |
| $22,500 to $24,999 | 28 (0.5%) | 42 (1.0%) |
| $25,000 to $29,999 | 210 (4.1%) | 193 (4.4%) |
| $30,000 to $34,999 | 308 (6.1%) | 248 (5.7%) |
| $35,000 to $39,999 | 85 (1.7%) | 110 (2.5%) |
| $40,000 to $44,999 | 187 (3.7%) | 124 (2.8%) |
| $45,000 to $49,999 | 61 (1.2%) | 218 (5.0%) |
| $50,000 to $54,999 | 249 (4.9%) | 162 (3.7%) |
| $55,000 to $64,999 | 593 (11.7%) | 478 (10.9%) |
| $65,000 to $74,999 | 601 (11.8%) | 364 (8.3%) |
| $75,000 to $99,999 | 919 (18.1%) | 699 (16.0%) |
| $100,000+ | 1,273 (25.1%) | 597 (13.7%) |
| Total | 5,070 (100.0%) | 4,368 (100.0%) |
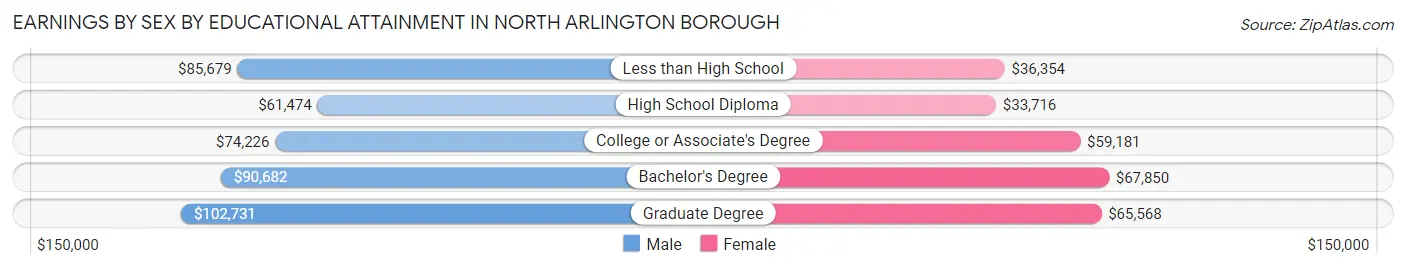
Earnings by Sex by Educational Attainment in North Arlington borough
Average earnings in North Arlington borough are $72,915 for men and $58,089 for women, a difference of 20.3%. Men with an educational attainment of graduate degree enjoy the highest average annual earnings of $102,731, while those with high school diploma education earn the least with $61,474. Women with an educational attainment of bachelor's degree earn the most with the average annual earnings of $67,850, while those with high school diploma education have the smallest earnings of $33,716.
| Educational Attainment | Male Income | Female Income |
| Less than High School | $85,679 | $36,354 |
| High School Diploma | $61,474 | $33,716 |
| College or Associate's Degree | $74,226 | $59,181 |
| Bachelor's Degree | $90,682 | $67,850 |
| Graduate Degree | $102,731 | $65,568 |
| Total | $72,915 | $58,089 |
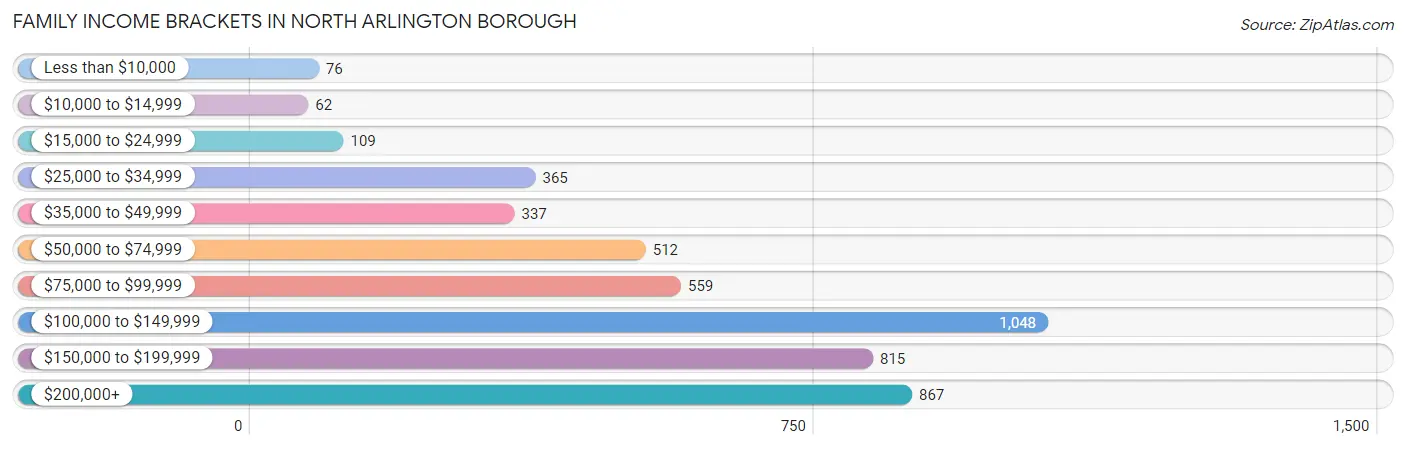
Family Income in North Arlington borough
Family Income Brackets in North Arlington borough
According to the North Arlington borough family income data, there are 1,048 families falling into the $100,000 to $149,999 income range, which is the most common income bracket and makes up 22.1% of all families. Conversely, the $10,000 to $14,999 income bracket is the least frequent group with only 62 families (1.3%) belonging to this category.
| Income Bracket | # Families | % Families |
| Less than $10,000 | 76 | 1.6% |
| $10,000 to $14,999 | 62 | 1.3% |
| $15,000 to $24,999 | 109 | 2.3% |
| $25,000 to $34,999 | 365 | 7.7% |
| $35,000 to $49,999 | 337 | 7.1% |
| $50,000 to $74,999 | 512 | 10.8% |
| $75,000 to $99,999 | 559 | 11.8% |
| $100,000 to $149,999 | 1,048 | 22.1% |
| $150,000 to $199,999 | 815 | 17.2% |
| $200,000+ | 867 | 18.3% |
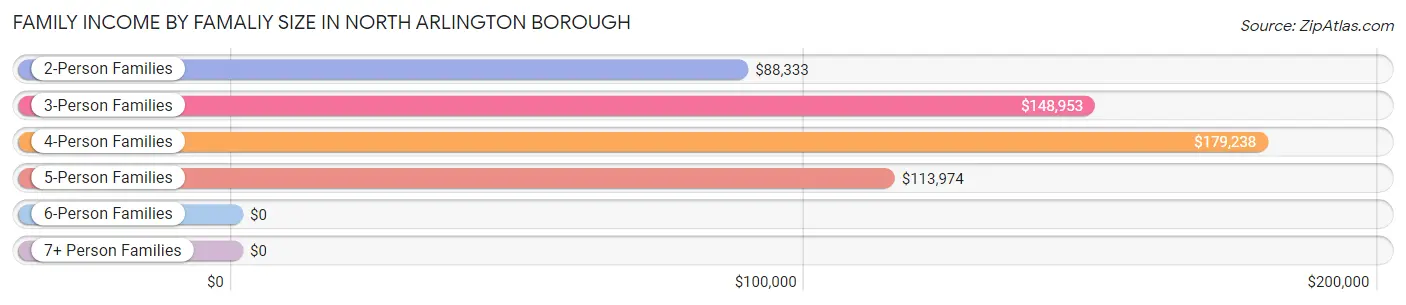
Family Income by Famaliy Size in North Arlington borough
4-person families (719 | 15.2%) account for the highest median family income in North Arlington borough with $179,238 per family, while 3-person families (1,417 | 29.9%) have the highest median income of $49,651 per family member.
| Income Bracket | # Families | Median Income |
| 2-Person Families | 2,196 (46.3%) | $88,333 |
| 3-Person Families | 1,417 (29.9%) | $148,953 |
| 4-Person Families | 719 (15.2%) | $179,238 |
| 5-Person Families | 391 (8.3%) | $113,974 |
| 6-Person Families | 17 (0.4%) | $0 |
| 7+ Person Families | 0 (0.0%) | $0 |
| Total | 4,740 (100.0%) | $114,538 |
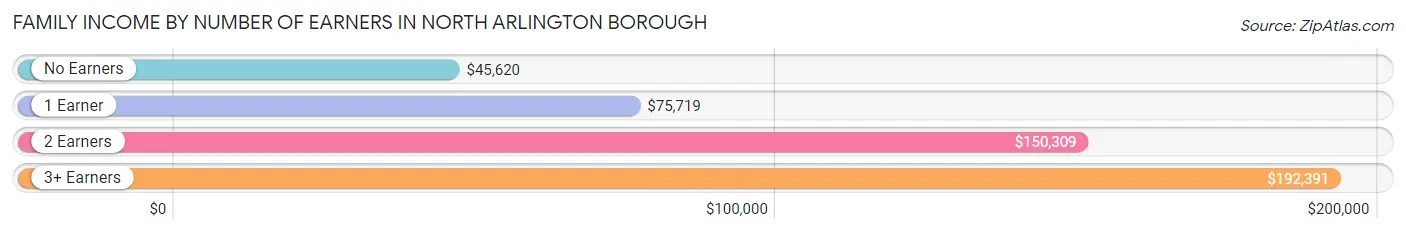
Family Income by Number of Earners in North Arlington borough
The median family income in North Arlington borough is $114,538, with families comprising 3+ earners (484) having the highest median family income of $192,391, while families with no earners (389) have the lowest median family income of $45,620, accounting for 10.2% and 8.2% of families, respectively.
| Number of Earners | # Families | Median Income |
| No Earners | 389 (8.2%) | $45,620 |
| 1 Earner | 1,578 (33.3%) | $75,719 |
| 2 Earners | 2,289 (48.3%) | $150,309 |
| 3+ Earners | 484 (10.2%) | $192,391 |
| Total | 4,740 (100.0%) | $114,538 |
Household Income in North Arlington borough
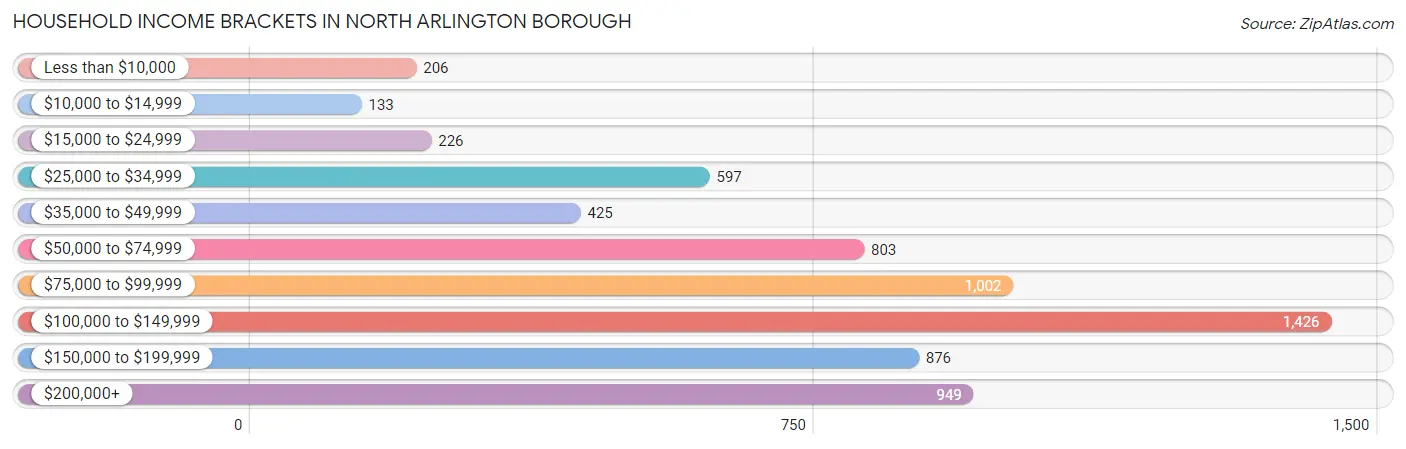
Household Income Brackets in North Arlington borough
With 1,426 households falling in the category, the $100,000 to $149,999 income range is the most frequent in North Arlington borough, accounting for 21.5% of all households. In contrast, only 133 households (2.0%) fall into the $10,000 to $14,999 income bracket, making it the least populous group.
| Income Bracket | # Households | % Households |
| Less than $10,000 | 206 | 3.1% |
| $10,000 to $14,999 | 133 | 2.0% |
| $15,000 to $24,999 | 226 | 3.4% |
| $25,000 to $34,999 | 597 | 9.0% |
| $35,000 to $49,999 | 425 | 6.4% |
| $50,000 to $74,999 | 803 | 12.1% |
| $75,000 to $99,999 | 1,002 | 15.1% |
| $100,000 to $149,999 | 1,426 | 21.5% |
| $150,000 to $199,999 | 876 | 13.2% |
| $200,000+ | 949 | 14.3% |
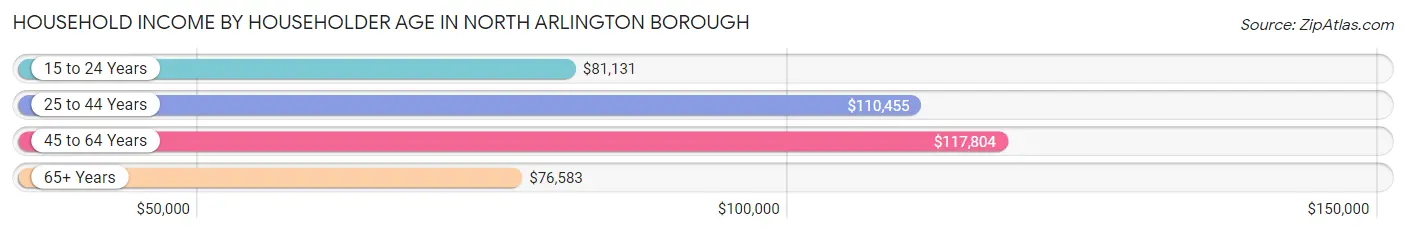
Household Income by Householder Age in North Arlington borough
The median household income in North Arlington borough is $96,869, with the highest median household income of $117,804 found in the 45 to 64 years age bracket for the primary householder. A total of 2,519 households (38.0%) fall into this category. Meanwhile, the 65+ years age bracket for the primary householder has the lowest median household income of $76,583, with 1,534 households (23.1%) in this group.
| Income Bracket | # Households | Median Income |
| 15 to 24 Years | 113 (1.7%) | $81,131 |
| 25 to 44 Years | 2,468 (37.2%) | $110,455 |
| 45 to 64 Years | 2,519 (38.0%) | $117,804 |
| 65+ Years | 1,534 (23.1%) | $76,583 |
| Total | 6,634 (100.0%) | $96,869 |
Poverty in North Arlington borough
Income Below Poverty by Sex and Age in North Arlington borough
With 7.2% poverty level for males and 10.8% for females among the residents of North Arlington borough, 12 to 14 year old males and 6 to 11 year old females are the most vulnerable to poverty, with 63 males (28.6%) and 167 females (31.2%) in their respective age groups living below the poverty level.
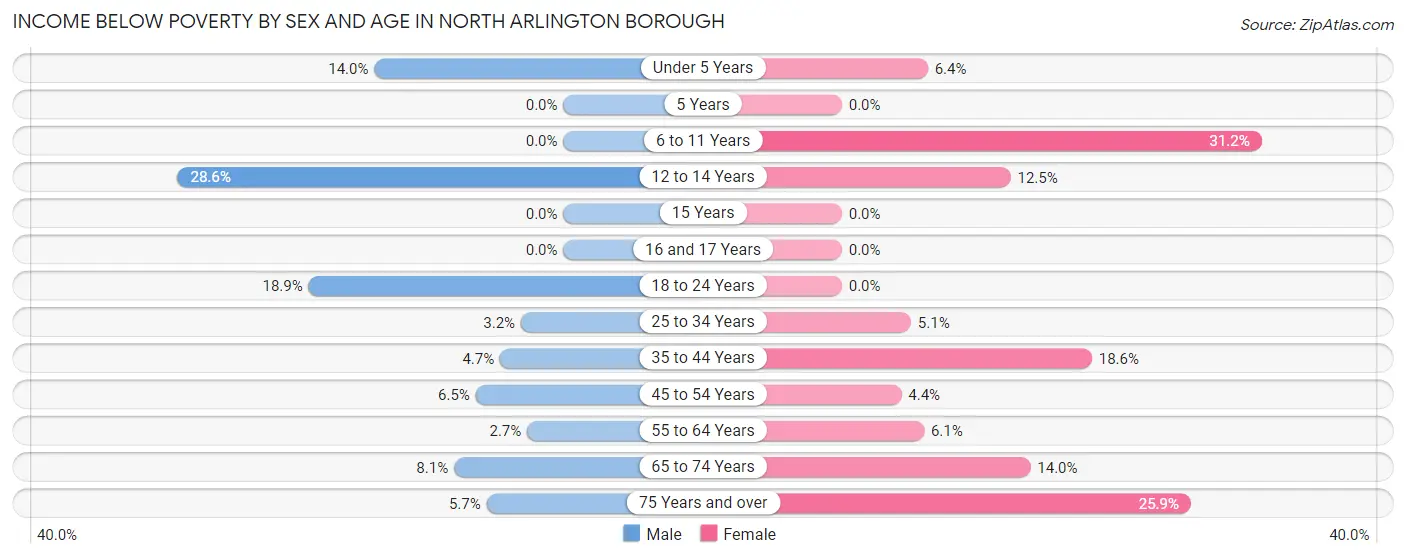
| Age Bracket | Male | Female |
| Under 5 Years | 56 (14.0%) | 28 (6.4%) |
| 5 Years | 0 (0.0%) | 0 (0.0%) |
| 6 to 11 Years | 0 (0.0%) | 167 (31.2%) |
| 12 to 14 Years | 63 (28.6%) | 56 (12.5%) |
| 15 Years | 0 (0.0%) | 0 (0.0%) |
| 16 and 17 Years | 0 (0.0%) | 0 (0.0%) |
| 18 to 24 Years | 164 (18.9%) | 0 (0.0%) |
| 25 to 34 Years | 40 (3.2%) | 82 (5.1%) |
| 35 to 44 Years | 62 (4.7%) | 203 (18.6%) |
| 45 to 54 Years | 60 (6.5%) | 56 (4.4%) |
| 55 to 64 Years | 33 (2.7%) | 65 (6.1%) |
| 65 to 74 Years | 48 (8.1%) | 131 (14.0%) |
| 75 Years and over | 30 (5.7%) | 149 (25.9%) |
| Total | 556 (7.2%) | 937 (10.8%) |
Income Above Poverty by Sex and Age in North Arlington borough
According to the poverty statistics in North Arlington borough, males aged 5 years and females aged 5 years are the age groups that are most secure financially, with 100.0% of males and 100.0% of females in these age groups living above the poverty line.
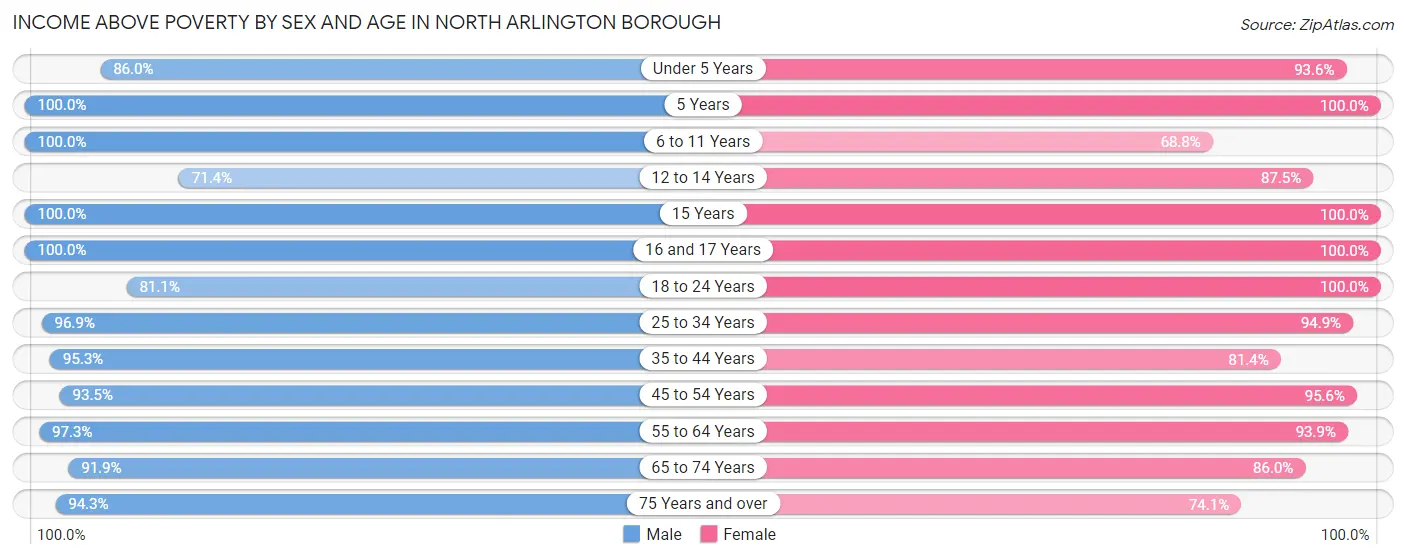
| Age Bracket | Male | Female |
| Under 5 Years | 343 (86.0%) | 411 (93.6%) |
| 5 Years | 26 (100.0%) | 123 (100.0%) |
| 6 to 11 Years | 223 (100.0%) | 369 (68.8%) |
| 12 to 14 Years | 157 (71.4%) | 391 (87.5%) |
| 15 Years | 86 (100.0%) | 131 (100.0%) |
| 16 and 17 Years | 33 (100.0%) | 87 (100.0%) |
| 18 to 24 Years | 703 (81.1%) | 350 (100.0%) |
| 25 to 34 Years | 1,228 (96.9%) | 1,515 (94.9%) |
| 35 to 44 Years | 1,257 (95.3%) | 891 (81.4%) |
| 45 to 54 Years | 862 (93.5%) | 1,210 (95.6%) |
| 55 to 64 Years | 1,193 (97.3%) | 1,000 (93.9%) |
| 65 to 74 Years | 543 (91.9%) | 805 (86.0%) |
| 75 Years and over | 496 (94.3%) | 426 (74.1%) |
| Total | 7,150 (92.8%) | 7,709 (89.2%) |
Income Below Poverty Among Married-Couple Families in North Arlington borough
The poverty statistics for married-couple families in North Arlington borough show that 3.6% or 129 of the total 3,621 families live below the poverty line. Families with 3 or 4 children have the highest poverty rate of 20.8%, comprising of 25 families. On the other hand, families with 1 or 2 children have the lowest poverty rate of 2.7%, which includes 35 families.
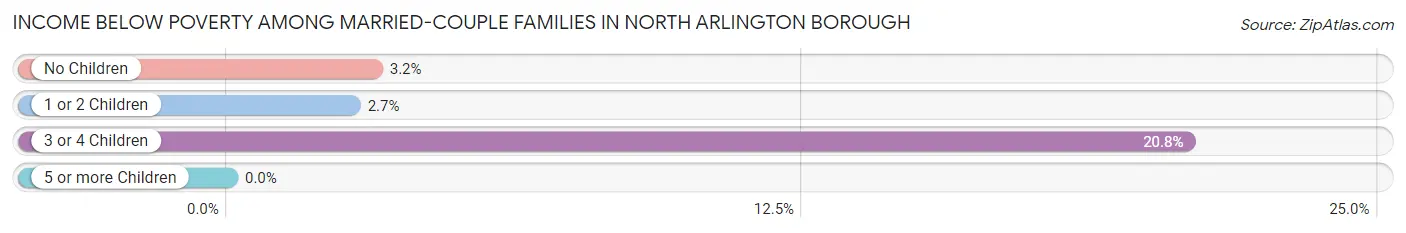
| Children | Above Poverty | Below Poverty |
| No Children | 2,123 (96.9%) | 69 (3.2%) |
| 1 or 2 Children | 1,274 (97.3%) | 35 (2.7%) |
| 3 or 4 Children | 95 (79.2%) | 25 (20.8%) |
| 5 or more Children | 0 (0.0%) | 0 (0.0%) |
| Total | 3,492 (96.4%) | 129 (3.6%) |
Income Below Poverty Among Single-Parent Households in North Arlington borough
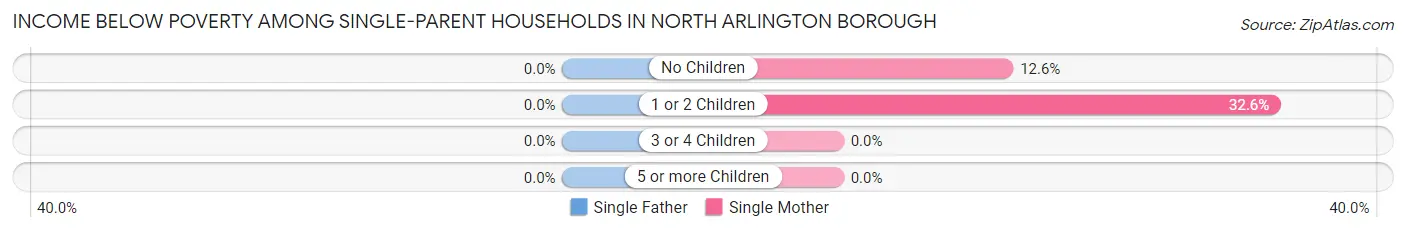
| Children | Single Father | Single Mother |
| No Children | 0 (0.0%) | 50 (12.6%) |
| 1 or 2 Children | 0 (0.0%) | 132 (32.6%) |
| 3 or 4 Children | 0 (0.0%) | 0 (0.0%) |
| 5 or more Children | 0 (0.0%) | 0 (0.0%) |
| Total | 0 (0.0%) | 182 (22.7%) |
Income Below Poverty Among Married-Couple vs Single-Parent Households in North Arlington borough
The poverty data for North Arlington borough shows that 129 of the married-couple family households (3.6%) and 182 of the single-parent households (16.3%) are living below the poverty level. Within the married-couple family households, those with 3 or 4 children have the highest poverty rate, with 25 households (20.8%) falling below the poverty line. Among the single-parent households, those with 1 or 2 children have the highest poverty rate, with 132 household (26.7%) living below poverty.
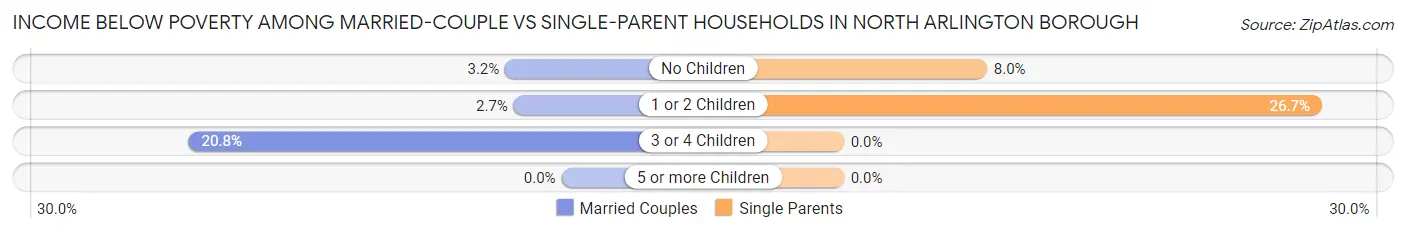
| Children | Married-Couple Families | Single-Parent Households |
| No Children | 69 (3.2%) | 50 (8.0%) |
| 1 or 2 Children | 35 (2.7%) | 132 (26.7%) |
| 3 or 4 Children | 25 (20.8%) | 0 (0.0%) |
| 5 or more Children | 0 (0.0%) | 0 (0.0%) |
| Total | 129 (3.6%) | 182 (16.3%) |
Race in North Arlington borough
The most populous races in North Arlington borough are White / Caucasian (11,723 | 71.7%), Hispanic or Latino (5,059 | 30.9%), and Two or more Races (1,549 | 9.5%).
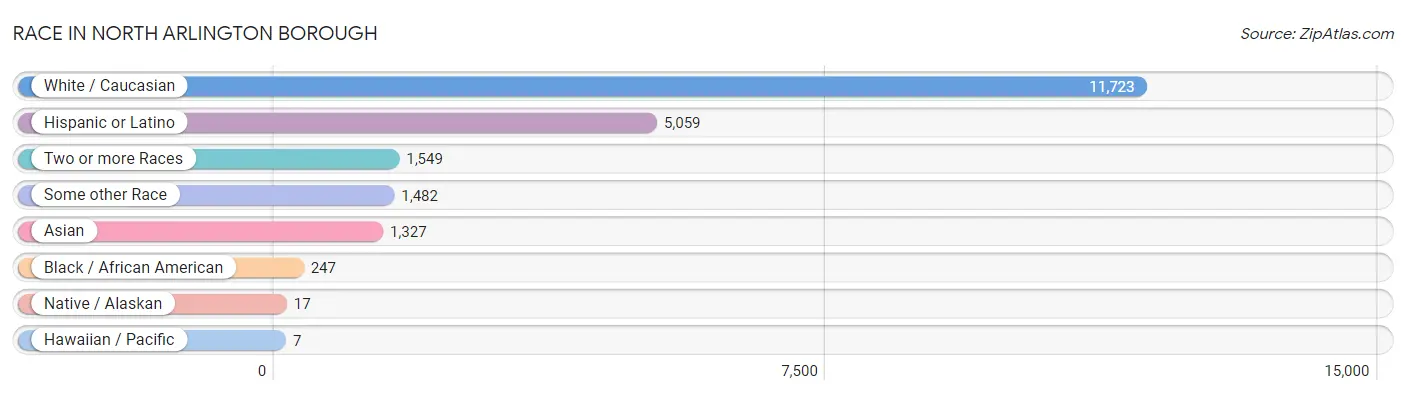
| Race | # Population | % Population |
| Asian | 1,327 | 8.1% |
| Black / African American | 247 | 1.5% |
| Hawaiian / Pacific | 7 | 0.0% |
| Hispanic or Latino | 5,059 | 30.9% |
| Native / Alaskan | 17 | 0.1% |
| White / Caucasian | 11,723 | 71.7% |
| Two or more Races | 1,549 | 9.5% |
| Some other Race | 1,482 | 9.1% |
| Total | 16,352 | 100.0% |
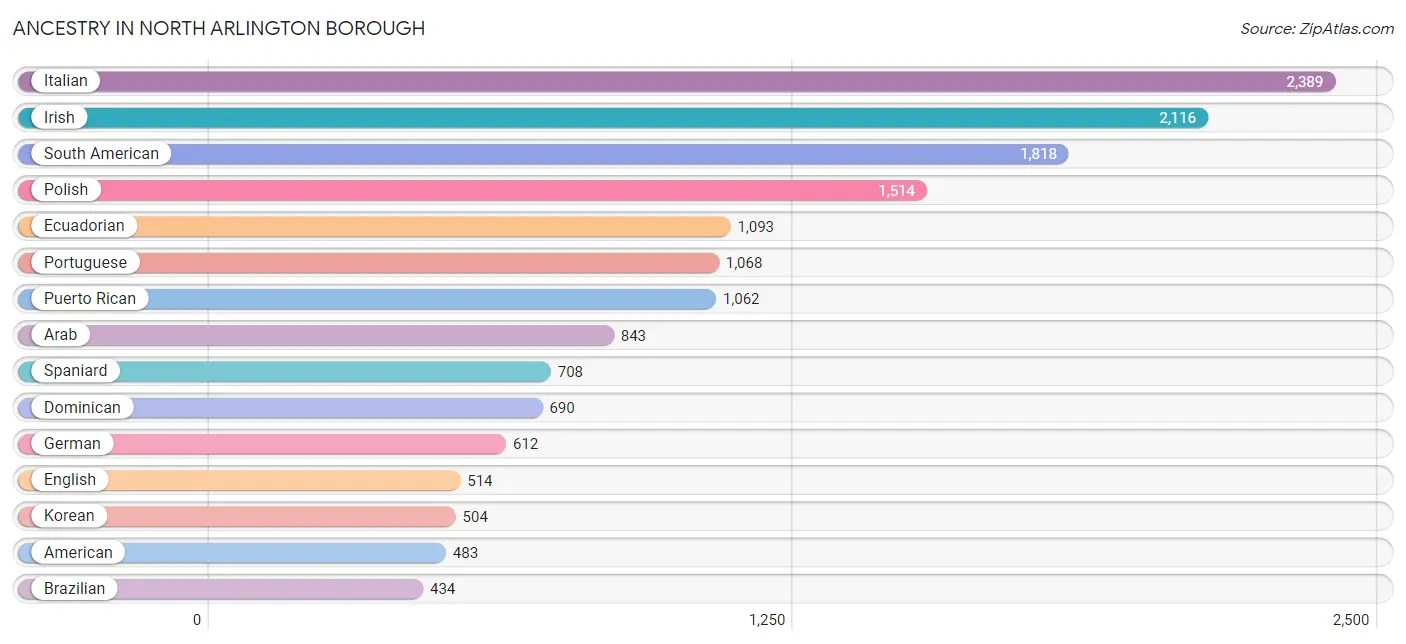
Ancestry in North Arlington borough
The most populous ancestries reported in North Arlington borough are Italian (2,389 | 14.6%), Irish (2,116 | 12.9%), South American (1,818 | 11.1%), Polish (1,514 | 9.3%), and Ecuadorian (1,093 | 6.7%), together accounting for 54.6% of all North Arlington borough residents.
| Ancestry | # Population | % Population |
| Afghan | 84 | 0.5% |
| African | 18 | 0.1% |
| American | 483 | 2.9% |
| Arab | 843 | 5.2% |
| Armenian | 104 | 0.6% |
| Austrian | 18 | 0.1% |
| Belgian | 6 | 0.0% |
| Bolivian | 18 | 0.1% |
| Brazilian | 434 | 2.6% |
| British | 37 | 0.2% |
| Burmese | 161 | 1.0% |
| Central American | 251 | 1.5% |
| Central American Indian | 25 | 0.2% |
| Chilean | 10 | 0.1% |
| Colombian | 246 | 1.5% |
| Cuban | 289 | 1.8% |
| Czech | 6 | 0.0% |
| Czechoslovakian | 12 | 0.1% |
| Danish | 21 | 0.1% |
| Dominican | 690 | 4.2% |
| Dutch | 102 | 0.6% |
| Eastern European | 34 | 0.2% |
| Ecuadorian | 1,093 | 6.7% |
| Egyptian | 389 | 2.4% |
| English | 514 | 3.1% |
| European | 149 | 0.9% |
| French | 190 | 1.2% |
| German | 612 | 3.7% |
| Greek | 56 | 0.3% |
| Guatemalan | 218 | 1.3% |
| Hungarian | 88 | 0.5% |
| Indian (Asian) | 250 | 1.5% |
| Iranian | 25 | 0.2% |
| Irish | 2,116 | 12.9% |
| Israeli | 33 | 0.2% |
| Italian | 2,389 | 14.6% |
| Korean | 504 | 3.1% |
| Lebanese | 23 | 0.1% |
| Lithuanian | 58 | 0.4% |
| Mexican | 59 | 0.4% |
| Moroccan | 40 | 0.2% |
| Norwegian | 101 | 0.6% |
| Pakistani | 60 | 0.4% |
| Peruvian | 354 | 2.2% |
| Polish | 1,514 | 9.3% |
| Portuguese | 1,068 | 6.5% |
| Puerto Rican | 1,062 | 6.5% |
| Romanian | 7 | 0.0% |
| Russian | 171 | 1.1% |
| Salvadoran | 33 | 0.2% |
| Samoan | 7 | 0.0% |
| Scotch-Irish | 46 | 0.3% |
| Scottish | 111 | 0.7% |
| South American | 1,818 | 11.1% |
| Spaniard | 708 | 4.3% |
| Spanish | 33 | 0.2% |
| Sri Lankan | 15 | 0.1% |
| Subsaharan African | 18 | 0.1% |
| Swedish | 36 | 0.2% |
| Thai | 309 | 1.9% |
| Turkish | 195 | 1.2% |
| Ukrainian | 44 | 0.3% |
| Uruguayan | 56 | 0.3% |
| Venezuelan | 21 | 0.1% |
| Welsh | 75 | 0.5% |
| West Indian | 18 | 0.1% | View All 66 Rows |
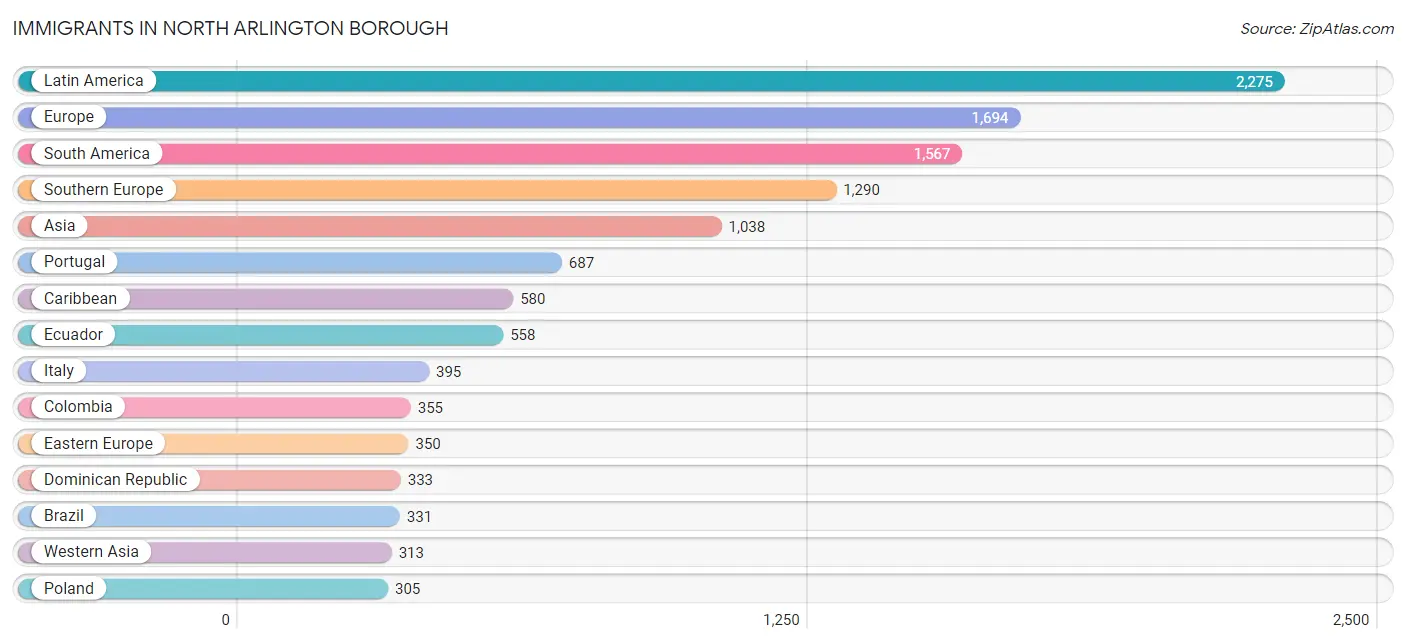
Immigrants in North Arlington borough
The most numerous immigrant groups reported in North Arlington borough came from Latin America (2,275 | 13.9%), Europe (1,694 | 10.4%), South America (1,567 | 9.6%), Southern Europe (1,290 | 7.9%), and Asia (1,038 | 6.4%), together accounting for 48.1% of all North Arlington borough residents.
| Immigration Origin | # Population | % Population |
| Afghanistan | 25 | 0.2% |
| Africa | 242 | 1.5% |
| Argentina | 62 | 0.4% |
| Asia | 1,038 | 6.4% |
| Azores | 29 | 0.2% |
| Belarus | 23 | 0.1% |
| Bolivia | 18 | 0.1% |
| Brazil | 331 | 2.0% |
| Caribbean | 580 | 3.5% |
| Central America | 128 | 0.8% |
| Chile | 5 | 0.0% |
| China | 76 | 0.5% |
| Colombia | 355 | 2.2% |
| Cuba | 229 | 1.4% |
| Dominican Republic | 333 | 2.0% |
| Eastern Asia | 138 | 0.8% |
| Eastern Europe | 350 | 2.1% |
| Ecuador | 558 | 3.4% |
| Egypt | 156 | 0.9% |
| England | 15 | 0.1% |
| Europe | 1,694 | 10.4% |
| France | 16 | 0.1% |
| Germany | 23 | 0.1% |
| Guatemala | 100 | 0.6% |
| Hong Kong | 9 | 0.1% |
| India | 251 | 1.5% |
| Italy | 395 | 2.4% |
| Korea | 62 | 0.4% |
| Latin America | 2,275 | 13.9% |
| Lebanon | 41 | 0.3% |
| Lithuania | 22 | 0.1% |
| Mexico | 28 | 0.2% |
| Morocco | 86 | 0.5% |
| Northern Africa | 242 | 1.5% |
| Northern Europe | 15 | 0.1% |
| Pakistan | 26 | 0.2% |
| Peru | 207 | 1.3% |
| Philippines | 225 | 1.4% |
| Poland | 305 | 1.9% |
| Portugal | 687 | 4.2% |
| South America | 1,567 | 9.6% |
| South Central Asia | 302 | 1.8% |
| South Eastern Asia | 285 | 1.7% |
| Southern Europe | 1,290 | 7.9% |
| Spain | 208 | 1.3% |
| Syria | 16 | 0.1% |
| Thailand | 60 | 0.4% |
| Turkey | 256 | 1.6% |
| Venezuela | 21 | 0.1% |
| West Indies | 18 | 0.1% |
| Western Asia | 313 | 1.9% |
| Western Europe | 39 | 0.2% | View All 52 Rows |
Sex and Age in North Arlington borough
Sex and Age in North Arlington borough
The most populous age groups in North Arlington borough are 55 to 59 Years (729 | 9.5%) for men and 25 to 29 Years (997 | 11.5%) for women.
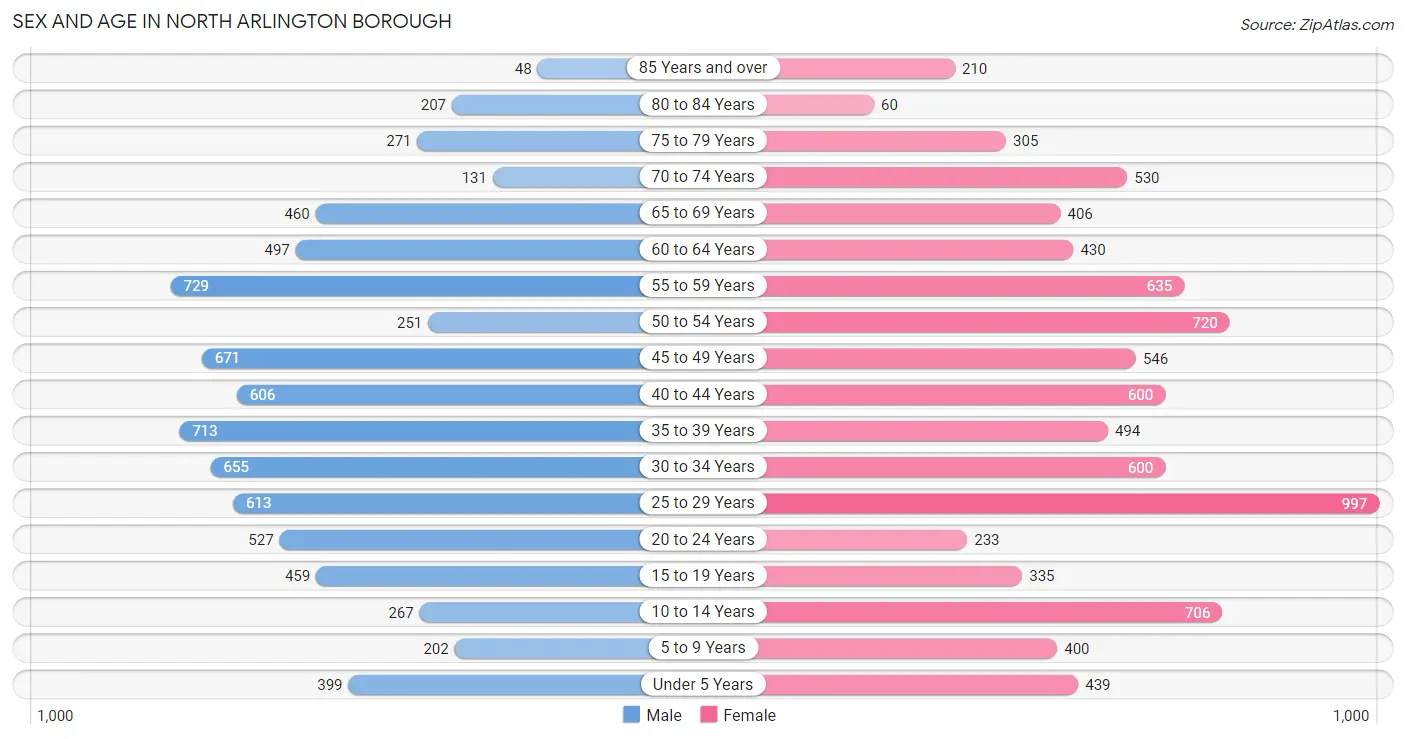
| Age Bracket | Male | Female |
| Under 5 Years | 399 (5.2%) | 439 (5.1%) |
| 5 to 9 Years | 202 (2.6%) | 400 (4.6%) |
| 10 to 14 Years | 267 (3.5%) | 706 (8.2%) |
| 15 to 19 Years | 459 (6.0%) | 335 (3.9%) |
| 20 to 24 Years | 527 (6.8%) | 233 (2.7%) |
| 25 to 29 Years | 613 (8.0%) | 997 (11.5%) |
| 30 to 34 Years | 655 (8.5%) | 600 (6.9%) |
| 35 to 39 Years | 713 (9.2%) | 494 (5.7%) |
| 40 to 44 Years | 606 (7.9%) | 600 (6.9%) |
| 45 to 49 Years | 671 (8.7%) | 546 (6.3%) |
| 50 to 54 Years | 251 (3.3%) | 720 (8.3%) |
| 55 to 59 Years | 729 (9.5%) | 635 (7.3%) |
| 60 to 64 Years | 497 (6.5%) | 430 (5.0%) |
| 65 to 69 Years | 460 (6.0%) | 406 (4.7%) |
| 70 to 74 Years | 131 (1.7%) | 530 (6.1%) |
| 75 to 79 Years | 271 (3.5%) | 305 (3.5%) |
| 80 to 84 Years | 207 (2.7%) | 60 (0.7%) |
| 85 Years and over | 48 (0.6%) | 210 (2.4%) |
| Total | 7,706 (100.0%) | 8,646 (100.0%) |
Families and Households in North Arlington borough
Median Family Size in North Arlington borough
The median family size in North Arlington borough is 2.93 persons per family, with married-couple families (3,621 | 76.4%) accounting for the largest median family size of 3 persons per family. On the other hand, single female/mother families (801 | 16.9%) represent the smallest median family size with 2.66 persons per family.
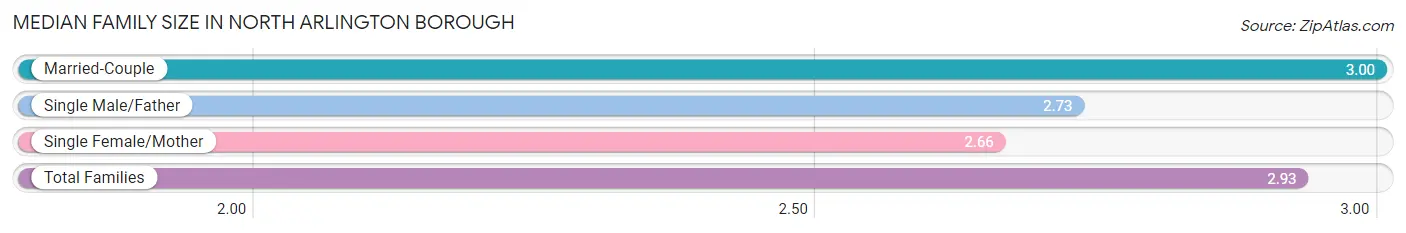
| Family Type | # Families | Family Size |
| Married-Couple | 3,621 (76.4%) | 3.00 |
| Single Male/Father | 318 (6.7%) | 2.73 |
| Single Female/Mother | 801 (16.9%) | 2.66 |
| Total Families | 4,740 (100.0%) | 2.93 |
Median Household Size in North Arlington borough
The median household size in North Arlington borough is 2.46 persons per household, with married-couple households (3,621 | 54.6%) accounting for the largest median household size of 3.03 persons per household. non-family households (1,894 | 28.5%) represent the smallest median household size with 1.16 persons per household.
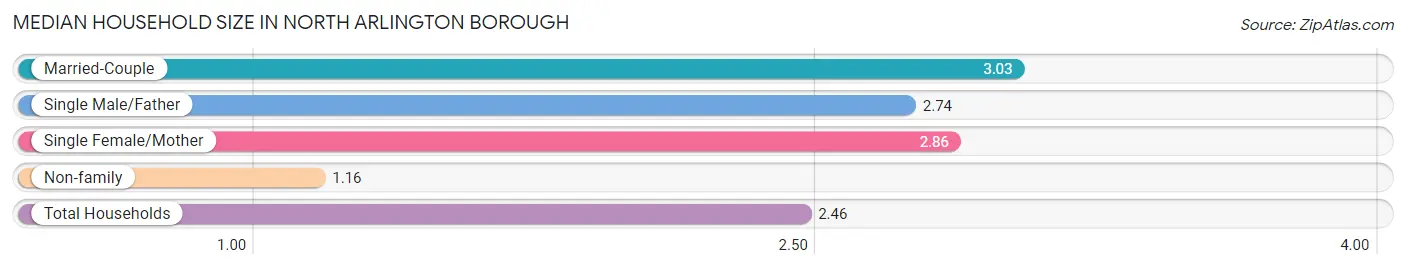
| Household Type | # Households | Household Size |
| Married-Couple | 3,621 (54.6%) | 3.03 |
| Single Male/Father | 318 (4.8%) | 2.74 |
| Single Female/Mother | 801 (12.1%) | 2.86 |
| Non-family | 1,894 (28.5%) | 1.16 |
| Total Households | 6,634 (100.0%) | 2.46 |
Household Size by Marriage Status in North Arlington borough
Out of a total of 6,634 households in North Arlington borough, 4,740 (71.5%) are family households, while 1,894 (28.5%) are nonfamily households. The most numerous type of family households are 2-person households, comprising 2,089, and the most common type of nonfamily households are 1-person households, comprising 1,606.
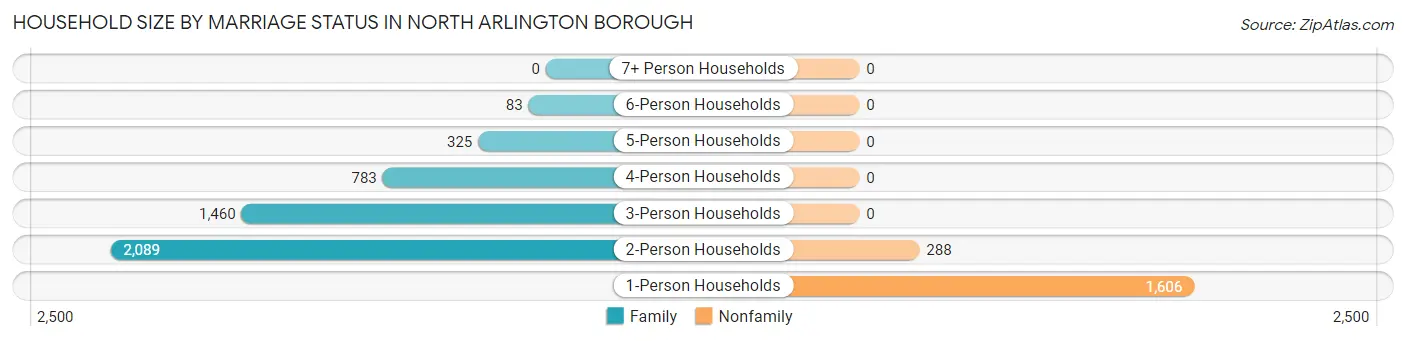
| Household Size | Family Households | Nonfamily Households |
| 1-Person Households | - | 1,606 (24.2%) |
| 2-Person Households | 2,089 (31.5%) | 288 (4.3%) |
| 3-Person Households | 1,460 (22.0%) | 0 (0.0%) |
| 4-Person Households | 783 (11.8%) | 0 (0.0%) |
| 5-Person Households | 325 (4.9%) | 0 (0.0%) |
| 6-Person Households | 83 (1.3%) | 0 (0.0%) |
| 7+ Person Households | 0 (0.0%) | 0 (0.0%) |
| Total | 4,740 (71.5%) | 1,894 (28.5%) |
Female Fertility in North Arlington borough
Fertility by Age in North Arlington borough
Average fertility rate in North Arlington borough is 136.0 births per 1,000 women. Women in the age bracket of 20 to 34 years have the highest fertility rate with 243.0 births per 1,000 women. Women in the age bracket of 20 to 34 years acount for 84.6% of all women with births.
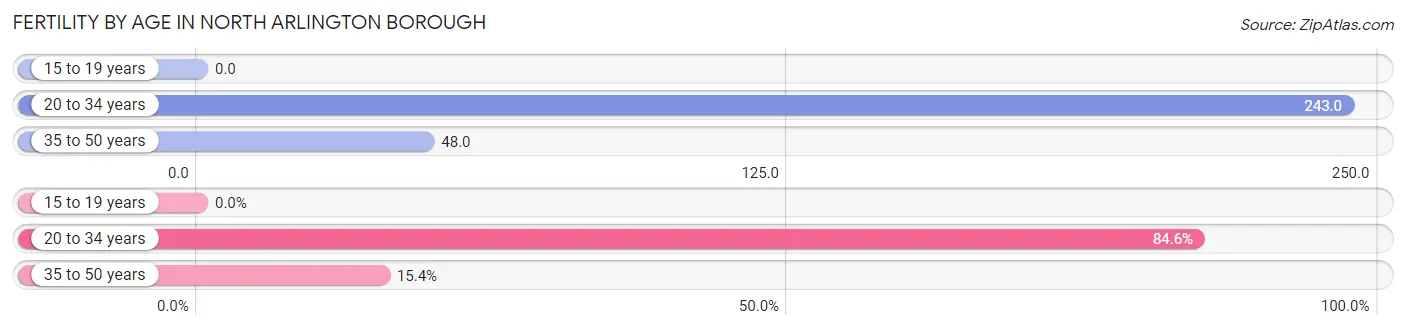
| Age Bracket | Women with Births | Births / 1,000 Women |
| 15 to 19 years | 0 (0.0%) | 0.0 |
| 20 to 34 years | 444 (84.6%) | 243.0 |
| 35 to 50 years | 81 (15.4%) | 48.0 |
| Total | 525 (100.0%) | 136.0 |
Fertility by Age by Marriage Status in North Arlington borough
80.2% of women with births (525) in North Arlington borough are married. The highest percentage of unmarried women with births falls into 35 to 50 years age bracket with 22.2% of them unmarried at the time of birth, while the lowest percentage of unmarried women with births belong to 20 to 34 years age bracket with 19.4% of them unmarried.
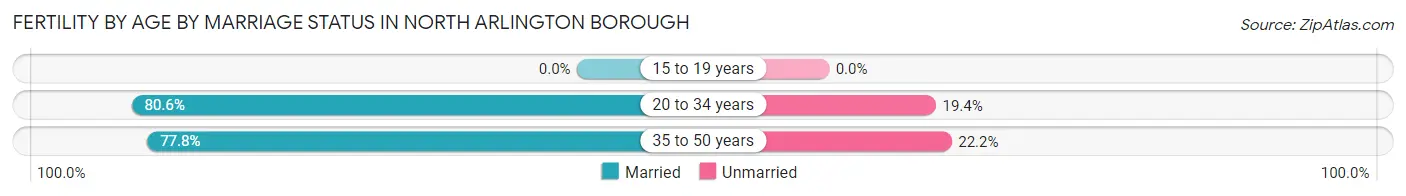
| Age Bracket | Married | Unmarried |
| 15 to 19 years | 0 (0.0%) | 0 (0.0%) |
| 20 to 34 years | 358 (80.6%) | 86 (19.4%) |
| 35 to 50 years | 63 (77.8%) | 18 (22.2%) |
| Total | 421 (80.2%) | 104 (19.8%) |
Fertility by Education in North Arlington borough
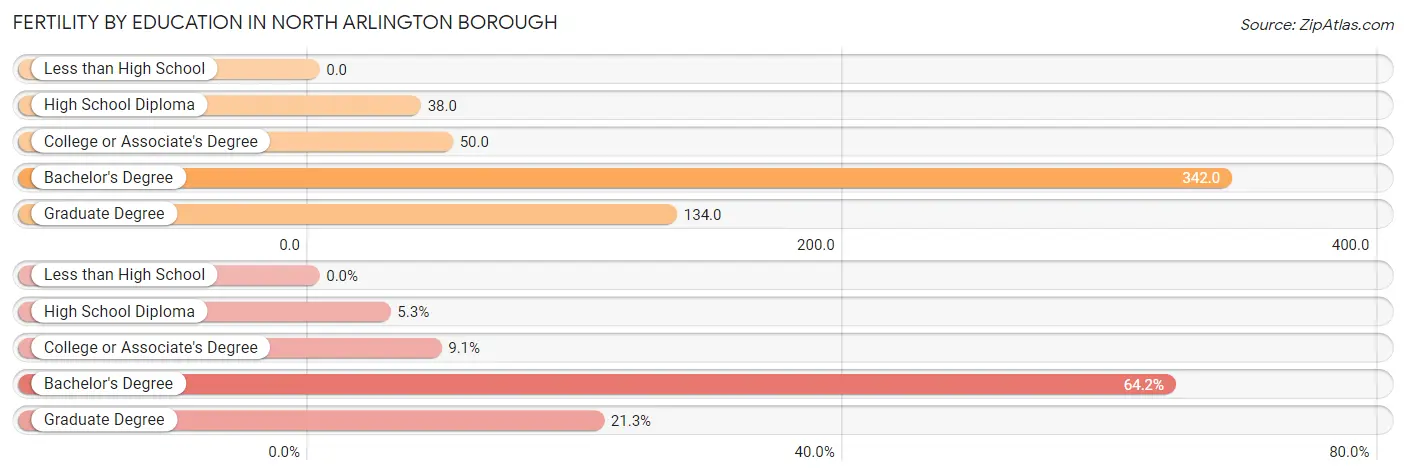
| Educational Attainment | Women with Births | Births / 1,000 Women |
| Less than High School | 0 (0.0%) | 0.0 |
| High School Diploma | 28 (5.3%) | 38.0 |
| College or Associate's Degree | 48 (9.1%) | 50.0 |
| Bachelor's Degree | 337 (64.2%) | 342.0 |
| Graduate Degree | 112 (21.3%) | 134.0 |
| Total | 525 (100.0%) | 136.0 |
Fertility by Education by Marriage Status in North Arlington borough
19.8% of women with births in North Arlington borough are unmarried. Women with the educational attainment of high school diploma are most likely to be married with 100.0% of them married at childbirth, while women with the educational attainment of graduate degree are least likely to be married with 29.5% of them unmarried at childbirth.
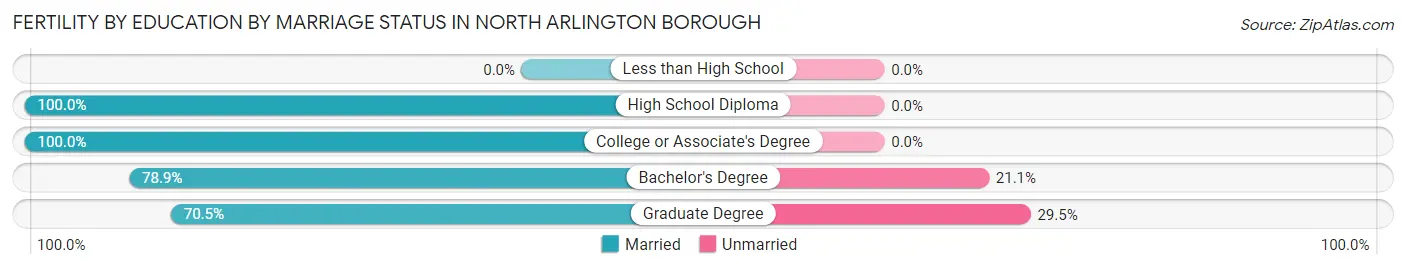
| Educational Attainment | Married | Unmarried |
| Less than High School | 0 (0.0%) | 0 (0.0%) |
| High School Diploma | 28 (100.0%) | 0 (0.0%) |
| College or Associate's Degree | 48 (100.0%) | 0 (0.0%) |
| Bachelor's Degree | 266 (78.9%) | 71 (21.1%) |
| Graduate Degree | 79 (70.5%) | 33 (29.5%) |
| Total | 421 (80.2%) | 104 (19.8%) |
Employment Characteristics in North Arlington borough
Employment by Class of Employer in North Arlington borough
Among the 8,679 employed individuals in North Arlington borough, private company employees (5,952 | 68.6%), local government employees (1,128 | 13.0%), and not-for-profit organizations (534 | 6.1%) make up the most common classes of employment.
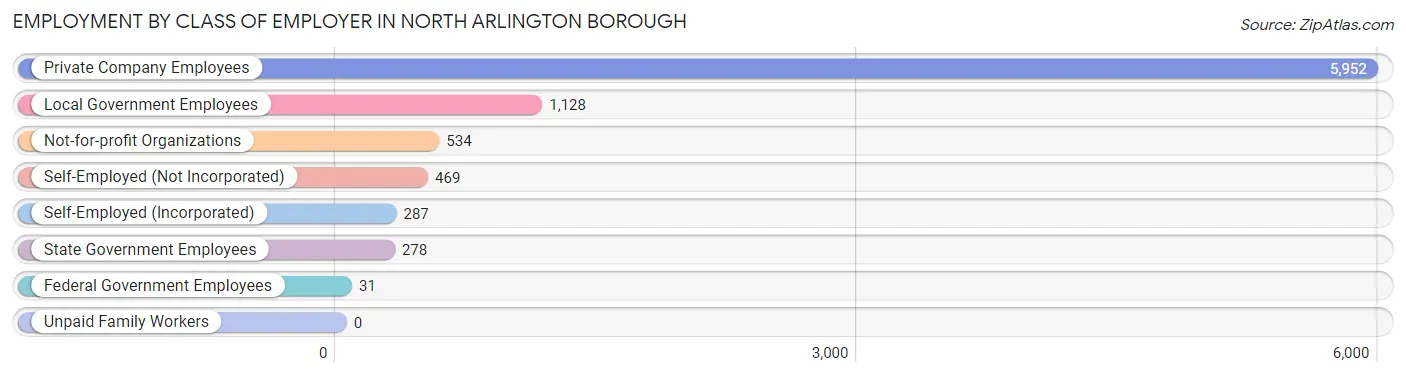
| Employer Class | # Employees | % Employees |
| Private Company Employees | 5,952 | 68.6% |
| Self-Employed (Incorporated) | 287 | 3.3% |
| Self-Employed (Not Incorporated) | 469 | 5.4% |
| Not-for-profit Organizations | 534 | 6.1% |
| Local Government Employees | 1,128 | 13.0% |
| State Government Employees | 278 | 3.2% |
| Federal Government Employees | 31 | 0.4% |
| Unpaid Family Workers | 0 | 0.0% |
| Total | 8,679 | 100.0% |
Employment Status by Age in North Arlington borough
According to the labor force statistics for North Arlington borough, out of the total population over 16 years of age (13,722), 68.9% or 9,454 individuals are in the labor force, with 5.8% or 548 of them unemployed. The age group with the highest labor force participation rate is 30 to 34 years, with 91.6% or 1,150 individuals in the labor force. Within the labor force, the 16 to 19 years age range has the highest percentage of unemployed individuals, with 53.7% or 79 of them being unemployed.
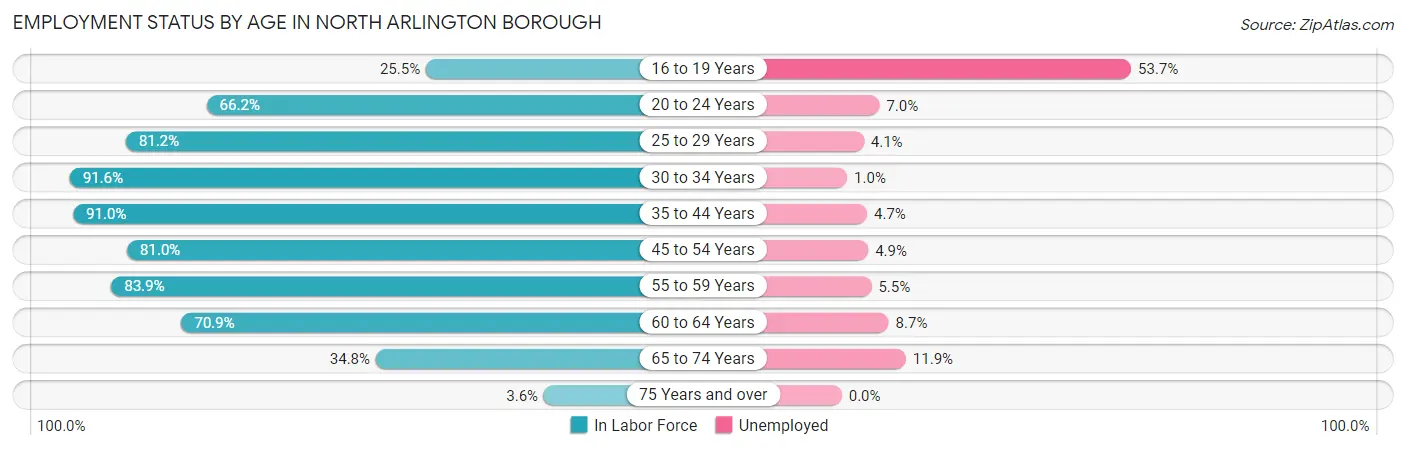
| Age Bracket | In Labor Force | Unemployed |
| 16 to 19 Years | 147 (25.5%) | 79 (53.7%) |
| 20 to 24 Years | 503 (66.2%) | 35 (7.0%) |
| 25 to 29 Years | 1,307 (81.2%) | 54 (4.1%) |
| 30 to 34 Years | 1,150 (91.6%) | 12 (1.0%) |
| 35 to 44 Years | 2,196 (91.0%) | 103 (4.7%) |
| 45 to 54 Years | 1,772 (81.0%) | 87 (4.9%) |
| 55 to 59 Years | 1,144 (83.9%) | 63 (5.5%) |
| 60 to 64 Years | 657 (70.9%) | 57 (8.7%) |
| 65 to 74 Years | 531 (34.8%) | 63 (11.9%) |
| 75 Years and over | 40 (3.6%) | 0 (0.0%) |
| Total | 9,454 (68.9%) | 548 (5.8%) |
Employment Status by Educational Attainment in North Arlington borough
According to labor force statistics for North Arlington borough, 84.3% of individuals (8,225) out of the total population between 25 and 64 years of age (9,757) are in the labor force, with 4.6% or 378 of them being unemployed. The group with the highest labor force participation rate are those with the educational attainment of college / associate degree, with 95.3% or 2,616 individuals in the labor force. Within the labor force, individuals with college / associate degree education have the highest percentage of unemployment, with 9.1% or 238 of them being unemployed.
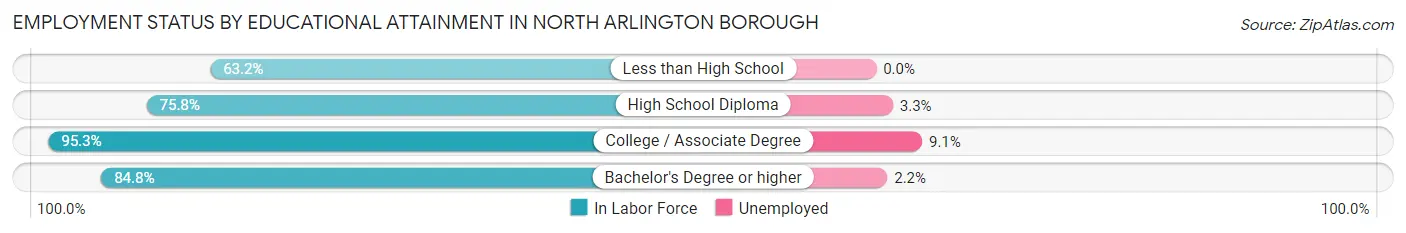
| Educational Attainment | In Labor Force | Unemployed |
| Less than High School | 295 (63.2%) | 0 (0.0%) |
| High School Diploma | 1,977 (75.8%) | 86 (3.3%) |
| College / Associate Degree | 2,616 (95.3%) | 250 (9.1%) |
| Bachelor's Degree or higher | 3,339 (84.8%) | 87 (2.2%) |
| Total | 8,225 (84.3%) | 449 (4.6%) |
Employment Occupations by Sex in North Arlington borough
Management, Business, Science and Arts Occupations
The most common Management, Business, Science and Arts occupations in North Arlington borough are Community & Social Service (1,346 | 15.1%), Management (1,020 | 11.5%), Computers, Engineering & Science (845 | 9.5%), Education Instruction & Library (793 | 8.9%), and Business & Financial (650 | 7.3%).
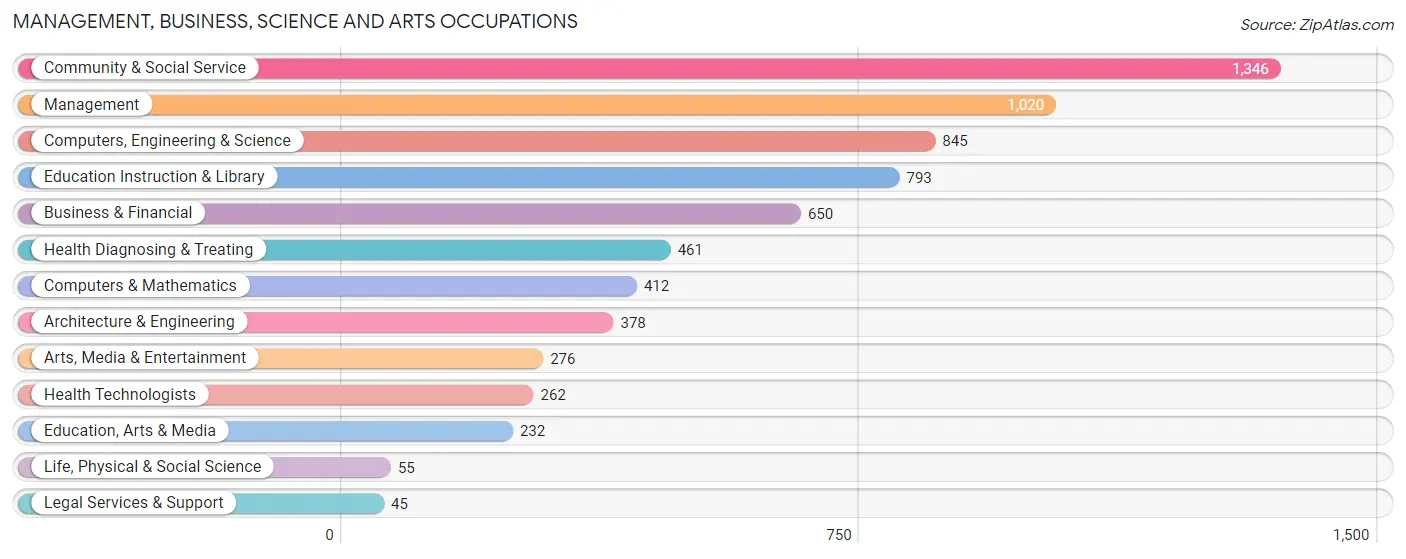
Management, Business, Science and Arts Occupations by Sex
Within the Management, Business, Science and Arts occupations in North Arlington borough, the most male-oriented occupations are Architecture & Engineering (100.0%), Computers, Engineering & Science (79.0%), and Management (73.6%), while the most female-oriented occupations are Life, Physical & Social Science (100.0%), Legal Services & Support (100.0%), and Education, Arts & Media (96.1%).
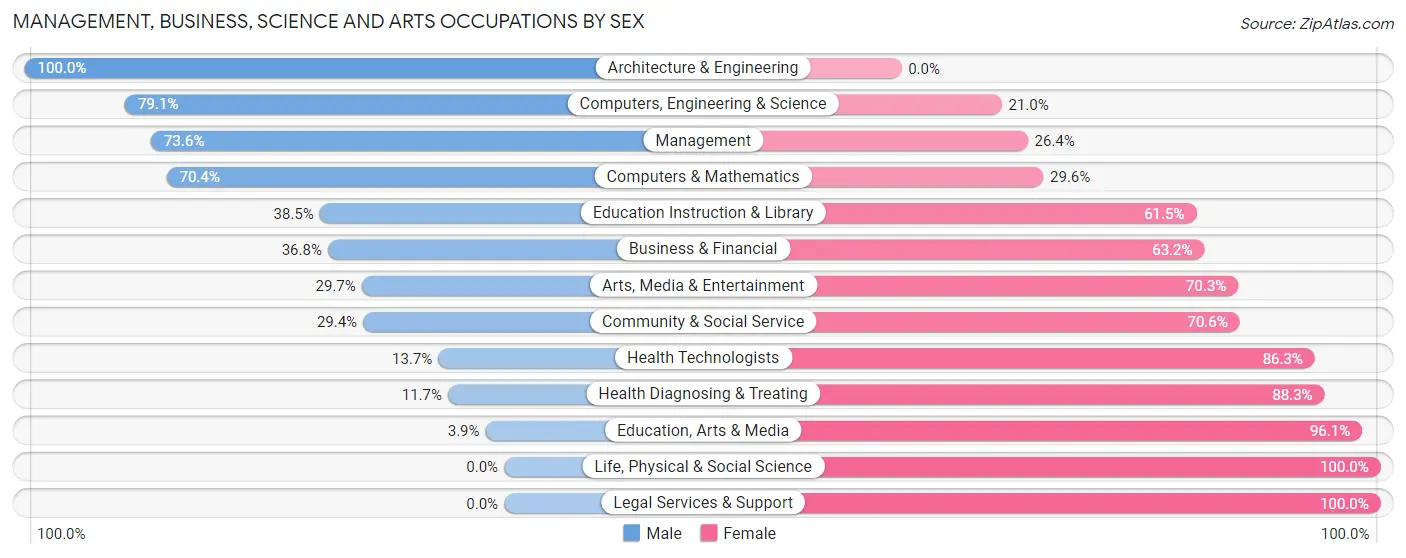
| Occupation | Male | Female |
| Management | 751 (73.6%) | 269 (26.4%) |
| Business & Financial | 239 (36.8%) | 411 (63.2%) |
| Computers, Engineering & Science | 668 (79.0%) | 177 (20.9%) |
| Computers & Mathematics | 290 (70.4%) | 122 (29.6%) |
| Architecture & Engineering | 378 (100.0%) | 0 (0.0%) |
| Life, Physical & Social Science | 0 (0.0%) | 55 (100.0%) |
| Community & Social Service | 396 (29.4%) | 950 (70.6%) |
| Education, Arts & Media | 9 (3.9%) | 223 (96.1%) |
| Legal Services & Support | 0 (0.0%) | 45 (100.0%) |
| Education Instruction & Library | 305 (38.5%) | 488 (61.5%) |
| Arts, Media & Entertainment | 82 (29.7%) | 194 (70.3%) |
| Health Diagnosing & Treating | 54 (11.7%) | 407 (88.3%) |
| Health Technologists | 36 (13.7%) | 226 (86.3%) |
| Total (Category) | 2,108 (48.8%) | 2,214 (51.2%) |
| Total (Overall) | 4,786 (53.8%) | 4,111 (46.2%) |
Services Occupations
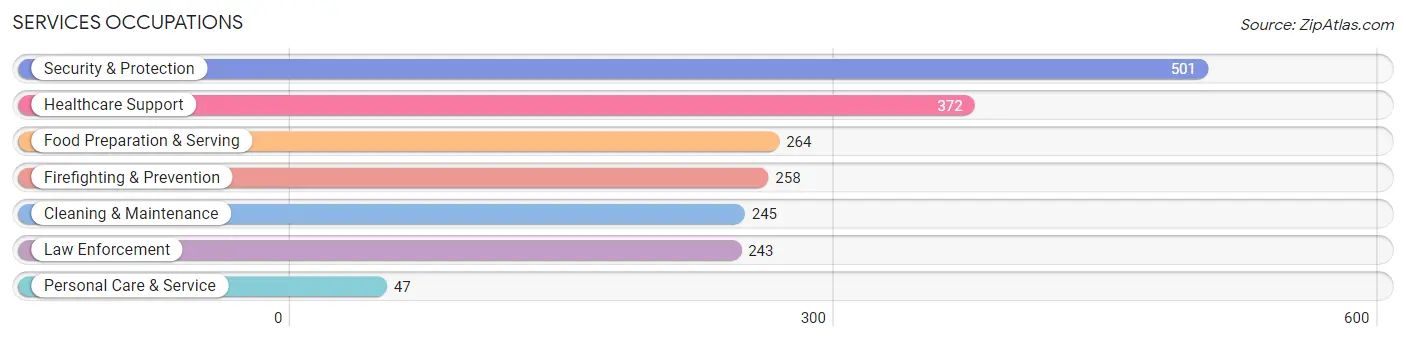
The most common Services occupations in North Arlington borough are Security & Protection (501 | 5.6%), Healthcare Support (372 | 4.2%), Food Preparation & Serving (264 | 3.0%), Firefighting & Prevention (258 | 2.9%), and Cleaning & Maintenance (245 | 2.8%).
Services Occupations by Sex
Within the Services occupations in North Arlington borough, the most male-oriented occupations are Law Enforcement (100.0%), Security & Protection (94.0%), and Firefighting & Prevention (88.4%), while the most female-oriented occupations are Healthcare Support (89.0%), Food Preparation & Serving (65.5%), and Personal Care & Service (63.8%).
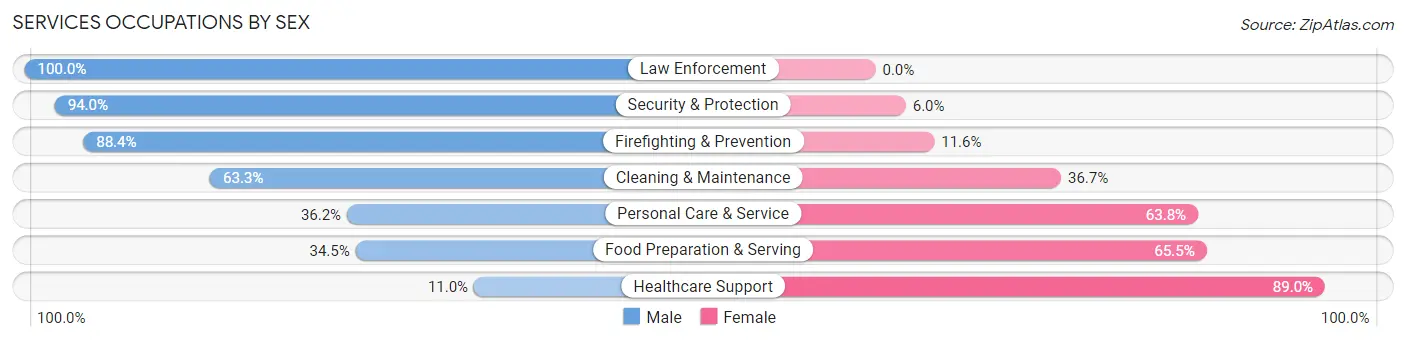
| Occupation | Male | Female |
| Healthcare Support | 41 (11.0%) | 331 (89.0%) |
| Security & Protection | 471 (94.0%) | 30 (6.0%) |
| Firefighting & Prevention | 228 (88.4%) | 30 (11.6%) |
| Law Enforcement | 243 (100.0%) | 0 (0.0%) |
| Food Preparation & Serving | 91 (34.5%) | 173 (65.5%) |
| Cleaning & Maintenance | 155 (63.3%) | 90 (36.7%) |
| Personal Care & Service | 17 (36.2%) | 30 (63.8%) |
| Total (Category) | 775 (54.2%) | 654 (45.8%) |
| Total (Overall) | 4,786 (53.8%) | 4,111 (46.2%) |
Sales and Office Occupations
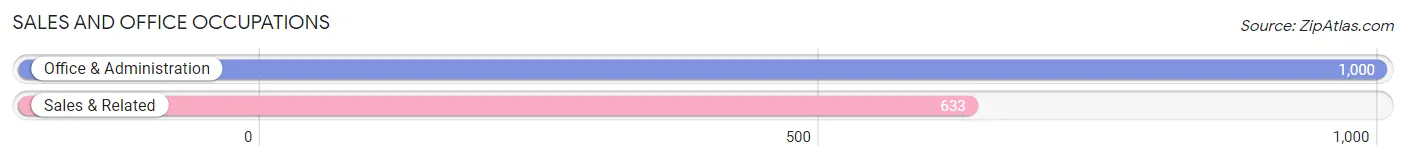
The most common Sales and Office occupations in North Arlington borough are Office & Administration (1,000 | 11.2%), and Sales & Related (633 | 7.1%).
Sales and Office Occupations by Sex
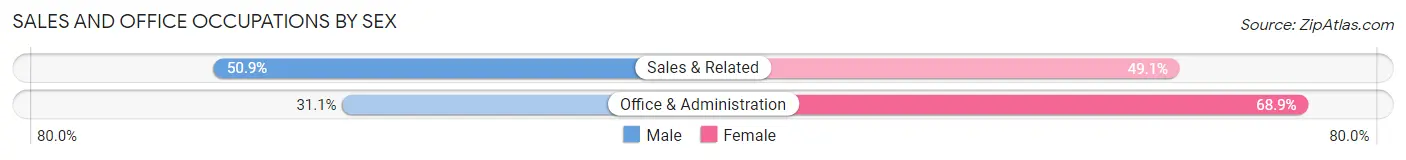
| Occupation | Male | Female |
| Sales & Related | 322 (50.9%) | 311 (49.1%) |
| Office & Administration | 311 (31.1%) | 689 (68.9%) |
| Total (Category) | 633 (38.8%) | 1,000 (61.2%) |
| Total (Overall) | 4,786 (53.8%) | 4,111 (46.2%) |
Natural Resources, Construction and Maintenance Occupations
The most common Natural Resources, Construction and Maintenance occupations in North Arlington borough are Construction & Extraction (479 | 5.4%), and Installation, Maintenance & Repair (301 | 3.4%).
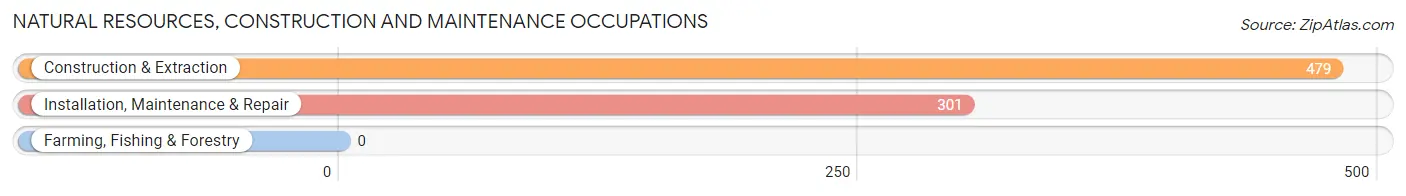
Natural Resources, Construction and Maintenance Occupations by Sex
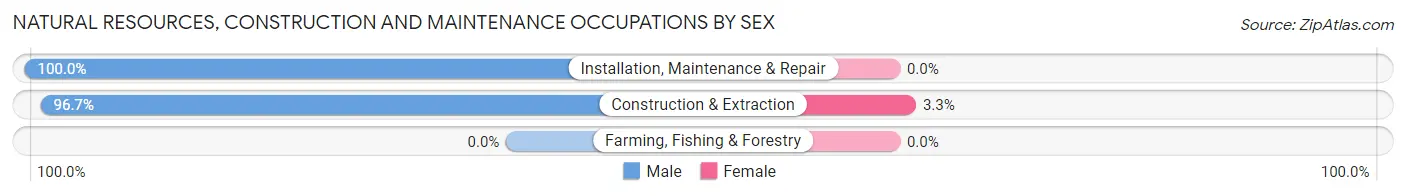
| Occupation | Male | Female |
| Farming, Fishing & Forestry | 0 (0.0%) | 0 (0.0%) |
| Construction & Extraction | 463 (96.7%) | 16 (3.3%) |
| Installation, Maintenance & Repair | 301 (100.0%) | 0 (0.0%) |
| Total (Category) | 764 (98.0%) | 16 (2.1%) |
| Total (Overall) | 4,786 (53.8%) | 4,111 (46.2%) |
Production, Transportation and Moving Occupations
The most common Production, Transportation and Moving occupations in North Arlington borough are Production (356 | 4.0%), Transportation (237 | 2.7%), and Material Moving (140 | 1.6%).
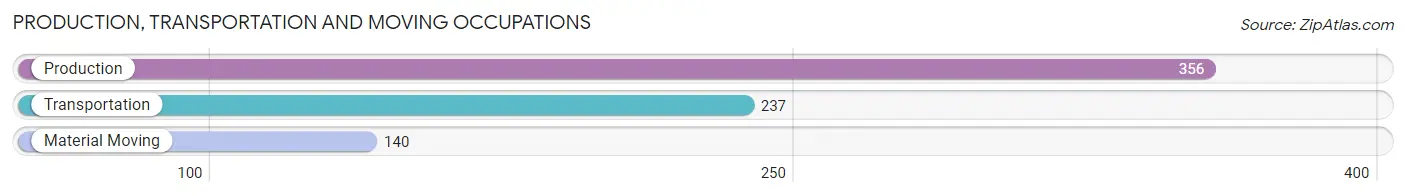
Production, Transportation and Moving Occupations by Sex
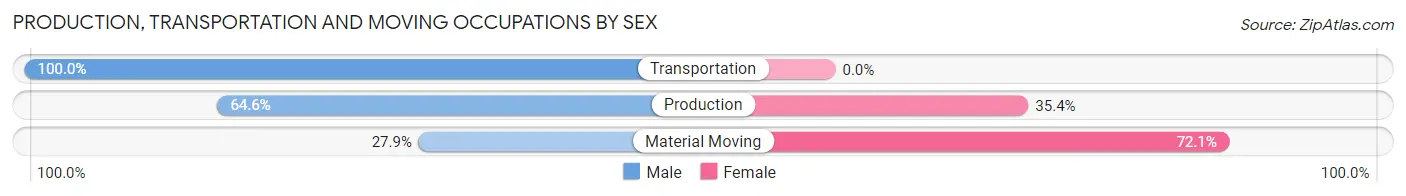
| Occupation | Male | Female |
| Production | 230 (64.6%) | 126 (35.4%) |
| Transportation | 237 (100.0%) | 0 (0.0%) |
| Material Moving | 39 (27.9%) | 101 (72.1%) |
| Total (Category) | 506 (69.0%) | 227 (31.0%) |
| Total (Overall) | 4,786 (53.8%) | 4,111 (46.2%) |
Employment Industries by Sex in North Arlington borough
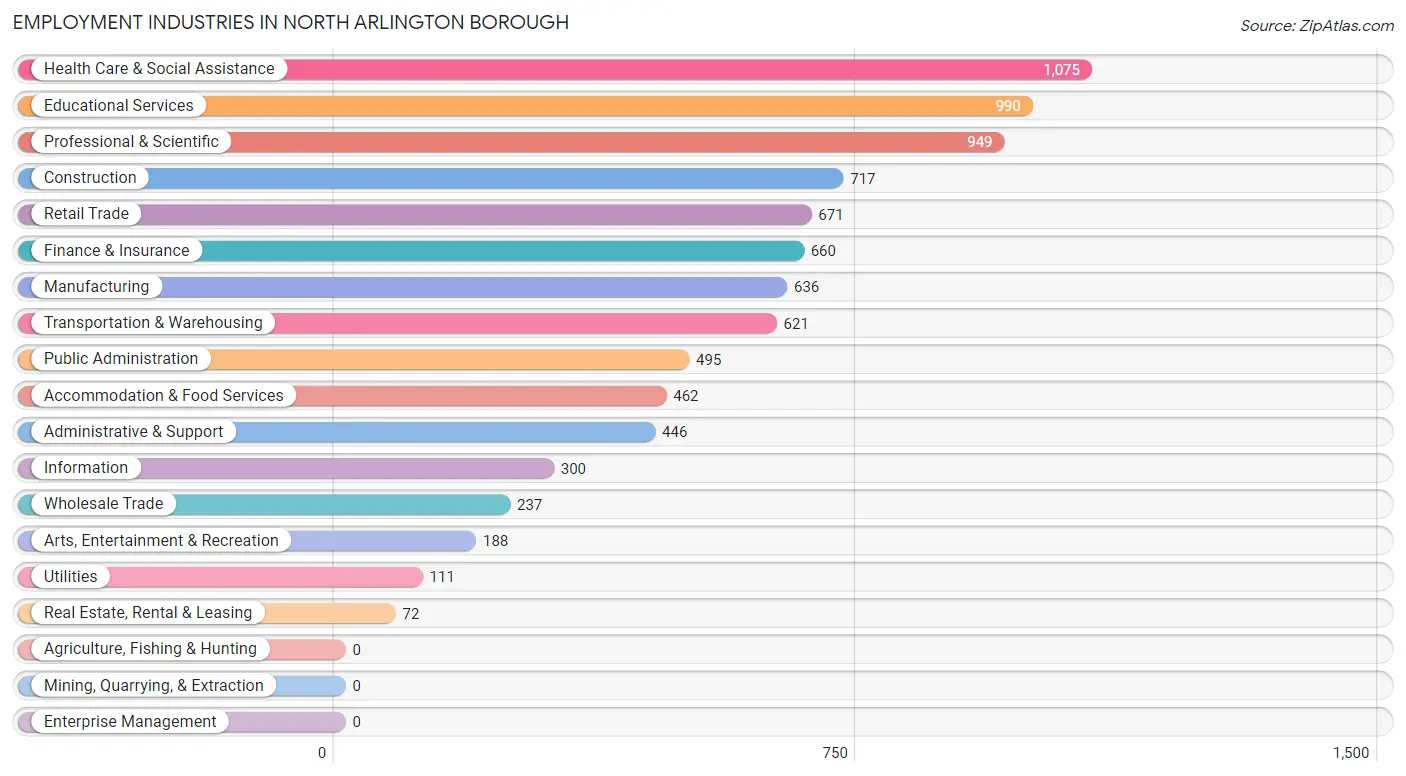
Employment Industries in North Arlington borough
The major employment industries in North Arlington borough include Health Care & Social Assistance (1,075 | 12.1%), Educational Services (990 | 11.1%), Professional & Scientific (949 | 10.7%), Construction (717 | 8.1%), and Retail Trade (671 | 7.5%).
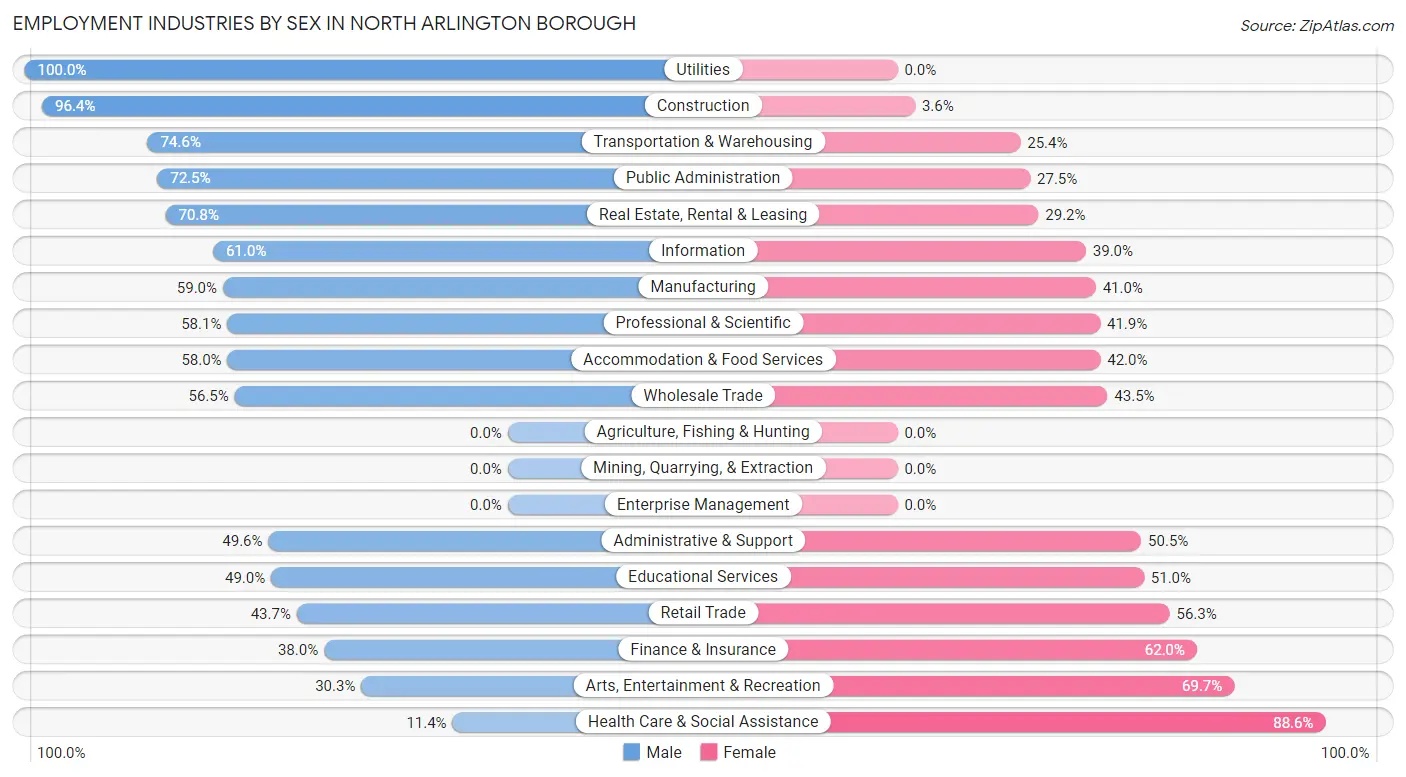
Employment Industries by Sex in North Arlington borough
The North Arlington borough industries that see more men than women are Utilities (100.0%), Construction (96.4%), and Transportation & Warehousing (74.6%), whereas the industries that tend to have a higher number of women are Health Care & Social Assistance (88.6%), Arts, Entertainment & Recreation (69.7%), and Finance & Insurance (62.0%).
| Industry | Male | Female |
| Agriculture, Fishing & Hunting | 0 (0.0%) | 0 (0.0%) |
| Mining, Quarrying, & Extraction | 0 (0.0%) | 0 (0.0%) |
| Construction | 691 (96.4%) | 26 (3.6%) |
| Manufacturing | 375 (59.0%) | 261 (41.0%) |
| Wholesale Trade | 134 (56.5%) | 103 (43.5%) |
| Retail Trade | 293 (43.7%) | 378 (56.3%) |
| Transportation & Warehousing | 463 (74.6%) | 158 (25.4%) |
| Utilities | 111 (100.0%) | 0 (0.0%) |
| Information | 183 (61.0%) | 117 (39.0%) |
| Finance & Insurance | 251 (38.0%) | 409 (62.0%) |
| Real Estate, Rental & Leasing | 51 (70.8%) | 21 (29.2%) |
| Professional & Scientific | 551 (58.1%) | 398 (41.9%) |
| Enterprise Management | 0 (0.0%) | 0 (0.0%) |
| Administrative & Support | 221 (49.5%) | 225 (50.4%) |
| Educational Services | 485 (49.0%) | 505 (51.0%) |
| Health Care & Social Assistance | 123 (11.4%) | 952 (88.6%) |
| Arts, Entertainment & Recreation | 57 (30.3%) | 131 (69.7%) |
| Accommodation & Food Services | 268 (58.0%) | 194 (42.0%) |
| Public Administration | 359 (72.5%) | 136 (27.5%) |
| Total | 4,786 (53.8%) | 4,111 (46.2%) |
Education in North Arlington borough
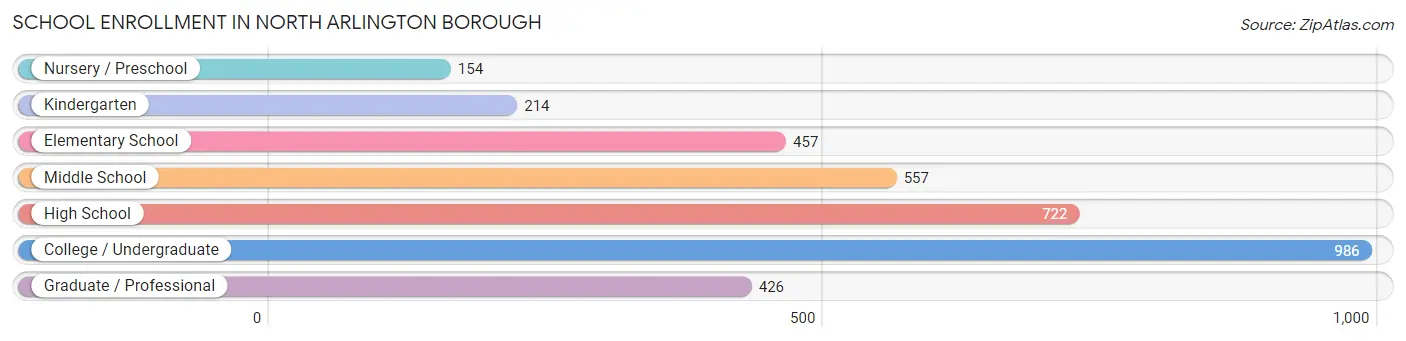
School Enrollment in North Arlington borough
The most common levels of schooling among the 3,516 students in North Arlington borough are college / undergraduate (986 | 28.0%), high school (722 | 20.5%), and middle school (557 | 15.8%).
| School Level | # Students | % Students |
| Nursery / Preschool | 154 | 4.4% |
| Kindergarten | 214 | 6.1% |
| Elementary School | 457 | 13.0% |
| Middle School | 557 | 15.8% |
| High School | 722 | 20.5% |
| College / Undergraduate | 986 | 28.0% |
| Graduate / Professional | 426 | 12.1% |
| Total | 3,516 | 100.0% |
School Enrollment by Age by Funding Source in North Arlington borough
Out of a total of 3,516 students who are enrolled in schools in North Arlington borough, 819 (23.3%) attend a private institution, while the remaining 2,697 (76.7%) are enrolled in public schools. The age group of 20 to 24 year olds has the highest likelihood of being enrolled in private schools, with 197 (51.4% in the age bracket) enrolled. Conversely, the age group of 15 to 17 year olds has the lowest likelihood of being enrolled in a private school, with 329 (97.6% in the age bracket) attending a public institution.
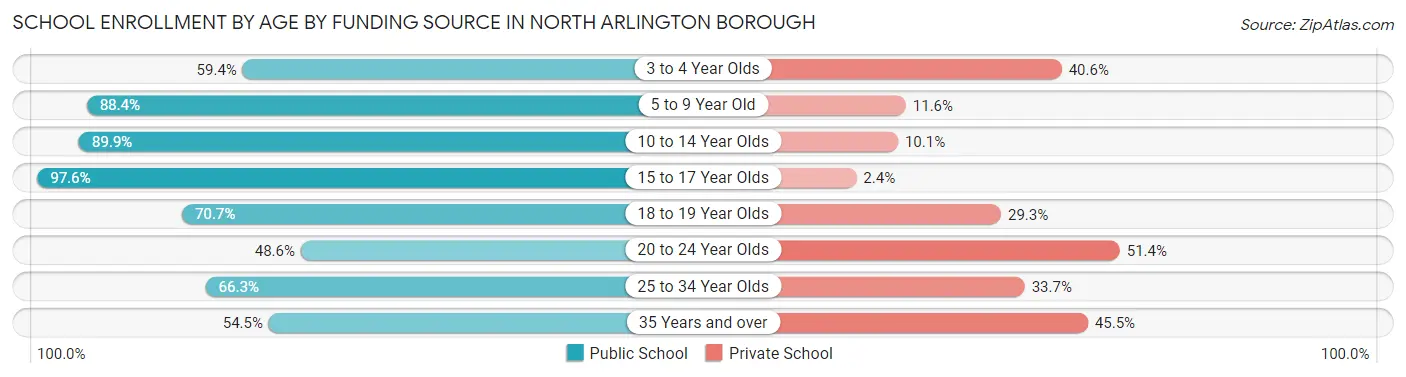
| Age Bracket | Public School | Private School |
| 3 to 4 Year Olds | 76 (59.4%) | 52 (40.6%) |
| 5 to 9 Year Old | 504 (88.4%) | 66 (11.6%) |
| 10 to 14 Year Olds | 853 (89.9%) | 96 (10.1%) |
| 15 to 17 Year Olds | 329 (97.6%) | 8 (2.4%) |
| 18 to 19 Year Olds | 323 (70.7%) | 134 (29.3%) |
| 20 to 24 Year Olds | 186 (48.6%) | 197 (51.4%) |
| 25 to 34 Year Olds | 275 (66.3%) | 140 (33.7%) |
| 35 Years and over | 151 (54.5%) | 126 (45.5%) |
| Total | 2,697 (76.7%) | 819 (23.3%) |
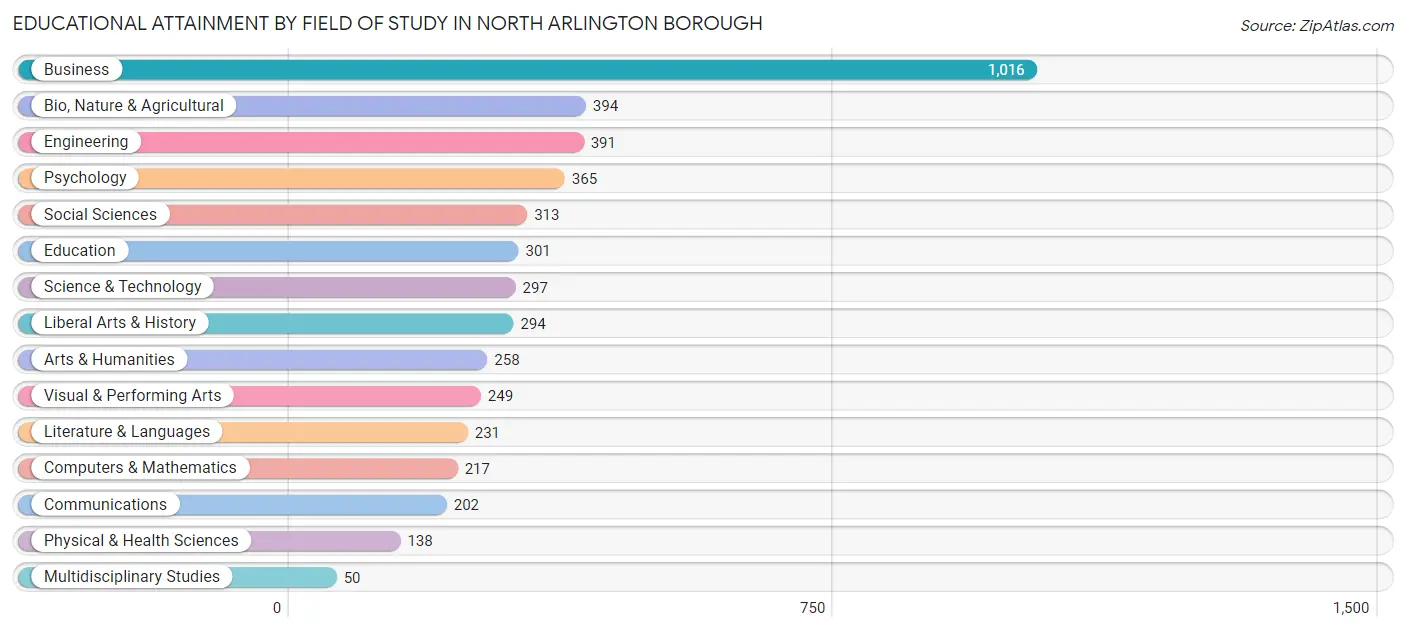
Educational Attainment by Field of Study in North Arlington borough
Business (1,016 | 21.5%), bio, nature & agricultural (394 | 8.4%), engineering (391 | 8.3%), psychology (365 | 7.7%), and social sciences (313 | 6.6%) are the most common fields of study among 4,716 individuals in North Arlington borough who have obtained a bachelor's degree or higher.
| Field of Study | # Graduates | % Graduates |
| Computers & Mathematics | 217 | 4.6% |
| Bio, Nature & Agricultural | 394 | 8.4% |
| Physical & Health Sciences | 138 | 2.9% |
| Psychology | 365 | 7.7% |
| Social Sciences | 313 | 6.6% |
| Engineering | 391 | 8.3% |
| Multidisciplinary Studies | 50 | 1.1% |
| Science & Technology | 297 | 6.3% |
| Business | 1,016 | 21.5% |
| Education | 301 | 6.4% |
| Literature & Languages | 231 | 4.9% |
| Liberal Arts & History | 294 | 6.2% |
| Visual & Performing Arts | 249 | 5.3% |
| Communications | 202 | 4.3% |
| Arts & Humanities | 258 | 5.5% |
| Total | 4,716 | 100.0% |
Transportation & Commute in North Arlington borough
Vehicle Availability by Sex in North Arlington borough
The most prevalent vehicle ownership categories in North Arlington borough are males with 2 vehicles (2,105, accounting for 44.4%) and females with 2 vehicles (2,075, making up 53.4%).
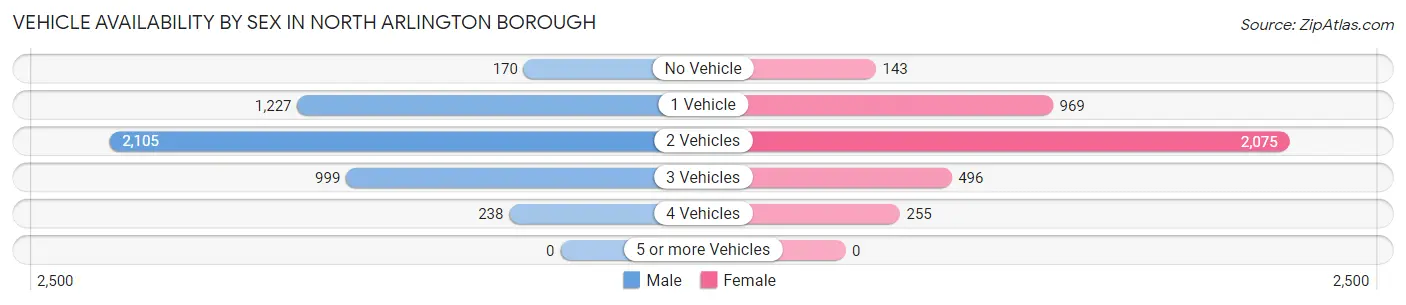
| Vehicles Available | Male | Female |
| No Vehicle | 170 (3.6%) | 143 (3.6%) |
| 1 Vehicle | 1,227 (25.9%) | 969 (24.6%) |
| 2 Vehicles | 2,105 (44.4%) | 2,075 (52.7%) |
| 3 Vehicles | 999 (21.1%) | 496 (12.6%) |
| 4 Vehicles | 238 (5.0%) | 255 (6.5%) |
| 5 or more Vehicles | 0 (0.0%) | 0 (0.0%) |
| Total | 4,739 (100.0%) | 3,938 (100.0%) |
Commute Time in North Arlington borough
The most frequently occuring commute durations in North Arlington borough are 20 to 24 minutes (1,391 commuters, 17.5%), 30 to 34 minutes (1,133 commuters, 14.3%), and 45 to 59 minutes (1,095 commuters, 13.8%).
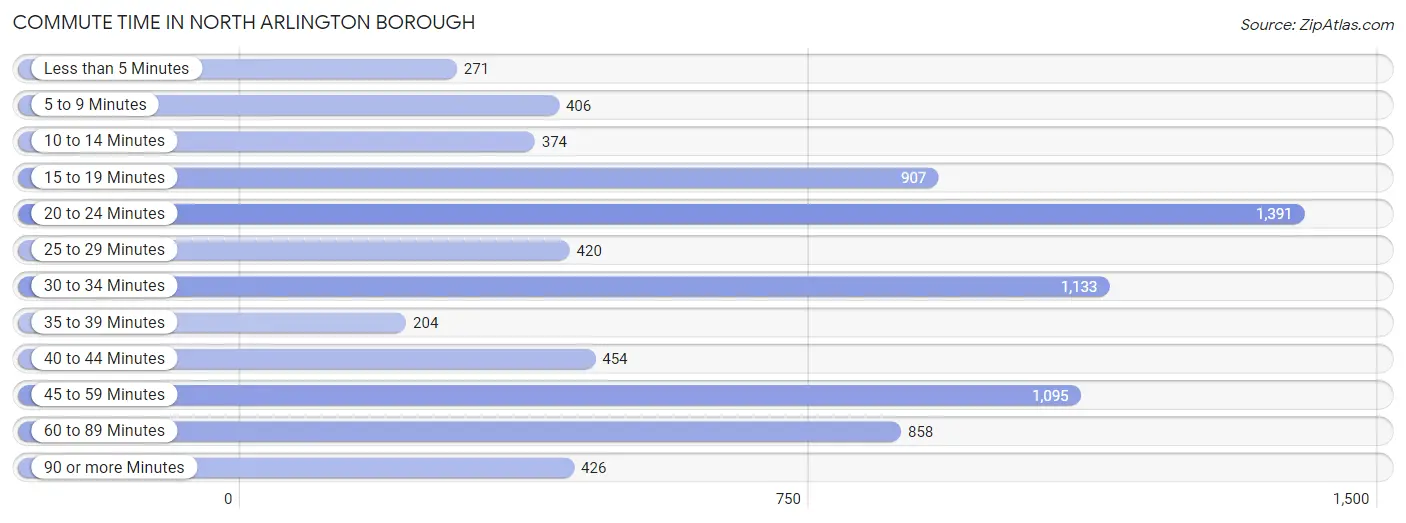
| Commute Time | # Commuters | % Commuters |
| Less than 5 Minutes | 271 | 3.4% |
| 5 to 9 Minutes | 406 | 5.1% |
| 10 to 14 Minutes | 374 | 4.7% |
| 15 to 19 Minutes | 907 | 11.4% |
| 20 to 24 Minutes | 1,391 | 17.5% |
| 25 to 29 Minutes | 420 | 5.3% |
| 30 to 34 Minutes | 1,133 | 14.3% |
| 35 to 39 Minutes | 204 | 2.6% |
| 40 to 44 Minutes | 454 | 5.7% |
| 45 to 59 Minutes | 1,095 | 13.8% |
| 60 to 89 Minutes | 858 | 10.8% |
| 90 or more Minutes | 426 | 5.4% |
Commute Time by Sex in North Arlington borough
The most common commute times in North Arlington borough are 30 to 34 minutes (871 commuters, 19.9%) for males and 20 to 24 minutes (614 commuters, 17.2%) for females.
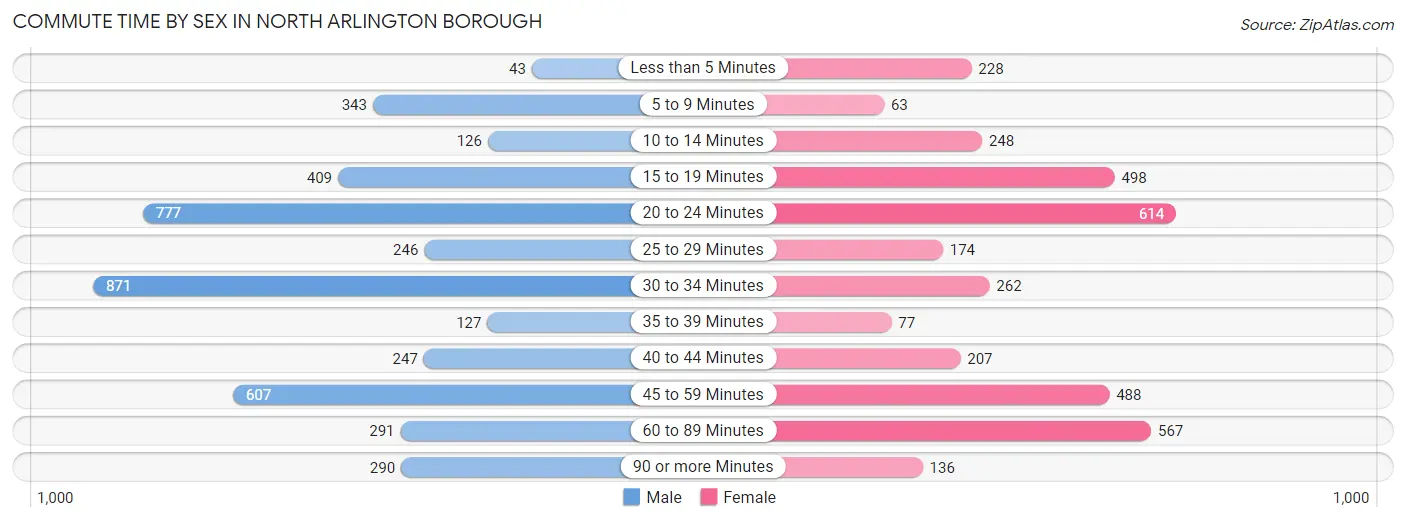
| Commute Time | Male | Female |
| Less than 5 Minutes | 43 (1.0%) | 228 (6.4%) |
| 5 to 9 Minutes | 343 (7.8%) | 63 (1.8%) |
| 10 to 14 Minutes | 126 (2.9%) | 248 (7.0%) |
| 15 to 19 Minutes | 409 (9.3%) | 498 (14.0%) |
| 20 to 24 Minutes | 777 (17.7%) | 614 (17.2%) |
| 25 to 29 Minutes | 246 (5.6%) | 174 (4.9%) |
| 30 to 34 Minutes | 871 (19.9%) | 262 (7.4%) |
| 35 to 39 Minutes | 127 (2.9%) | 77 (2.2%) |
| 40 to 44 Minutes | 247 (5.6%) | 207 (5.8%) |
| 45 to 59 Minutes | 607 (13.9%) | 488 (13.7%) |
| 60 to 89 Minutes | 291 (6.7%) | 567 (15.9%) |
| 90 or more Minutes | 290 (6.6%) | 136 (3.8%) |
Time of Departure to Work by Sex in North Arlington borough
The most frequent times of departure to work in North Arlington borough are 8:00 AM to 8:29 AM (938, 21.4%) for males and 7:00 AM to 7:29 AM (742, 20.8%) for females.
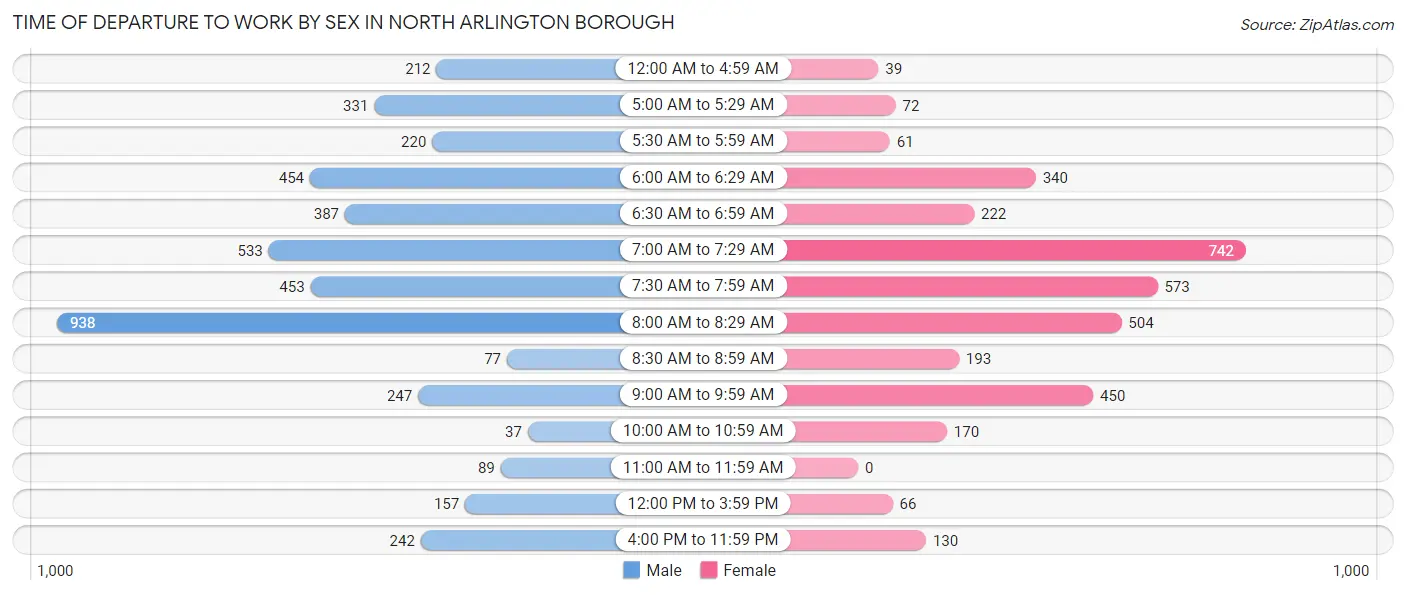
| Time of Departure | Male | Female |
| 12:00 AM to 4:59 AM | 212 (4.8%) | 39 (1.1%) |
| 5:00 AM to 5:29 AM | 331 (7.6%) | 72 (2.0%) |
| 5:30 AM to 5:59 AM | 220 (5.0%) | 61 (1.7%) |
| 6:00 AM to 6:29 AM | 454 (10.4%) | 340 (9.6%) |
| 6:30 AM to 6:59 AM | 387 (8.8%) | 222 (6.2%) |
| 7:00 AM to 7:29 AM | 533 (12.2%) | 742 (20.8%) |
| 7:30 AM to 7:59 AM | 453 (10.3%) | 573 (16.1%) |
| 8:00 AM to 8:29 AM | 938 (21.4%) | 504 (14.1%) |
| 8:30 AM to 8:59 AM | 77 (1.8%) | 193 (5.4%) |
| 9:00 AM to 9:59 AM | 247 (5.6%) | 450 (12.6%) |
| 10:00 AM to 10:59 AM | 37 (0.9%) | 170 (4.8%) |
| 11:00 AM to 11:59 AM | 89 (2.0%) | 0 (0.0%) |
| 12:00 PM to 3:59 PM | 157 (3.6%) | 66 (1.8%) |
| 4:00 PM to 11:59 PM | 242 (5.5%) | 130 (3.6%) |
| Total | 4,377 (100.0%) | 3,562 (100.0%) |
Housing Occupancy in North Arlington borough
Occupancy by Ownership in North Arlington borough
Of the total 6,634 dwellings in North Arlington borough, owner-occupied units account for 3,116 (47.0%), while renter-occupied units make up 3,518 (53.0%).
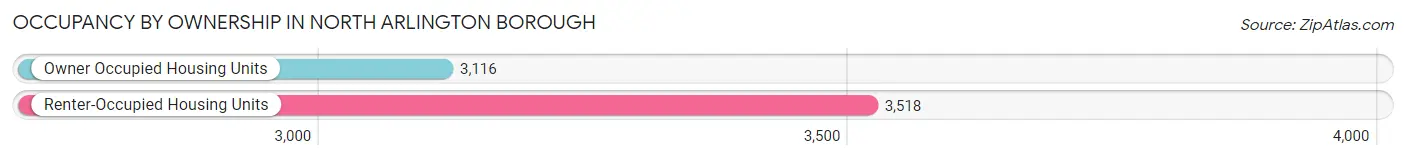
| Occupancy | # Housing Units | % Housing Units |
| Owner Occupied Housing Units | 3,116 | 47.0% |
| Renter-Occupied Housing Units | 3,518 | 53.0% |
| Total Occupied Housing Units | 6,634 | 100.0% |
Occupancy by Household Size in North Arlington borough
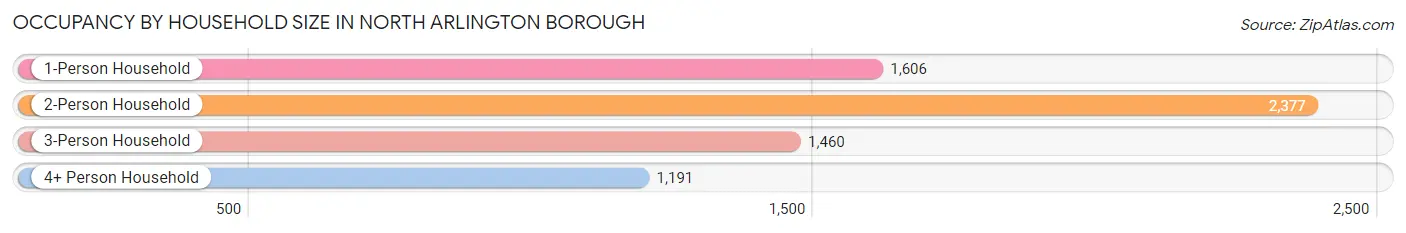
| Household Size | # Housing Units | % Housing Units |
| 1-Person Household | 1,606 | 24.2% |
| 2-Person Household | 2,377 | 35.8% |
| 3-Person Household | 1,460 | 22.0% |
| 4+ Person Household | 1,191 | 17.9% |
| Total Housing Units | 6,634 | 100.0% |
Occupancy by Ownership by Household Size in North Arlington borough
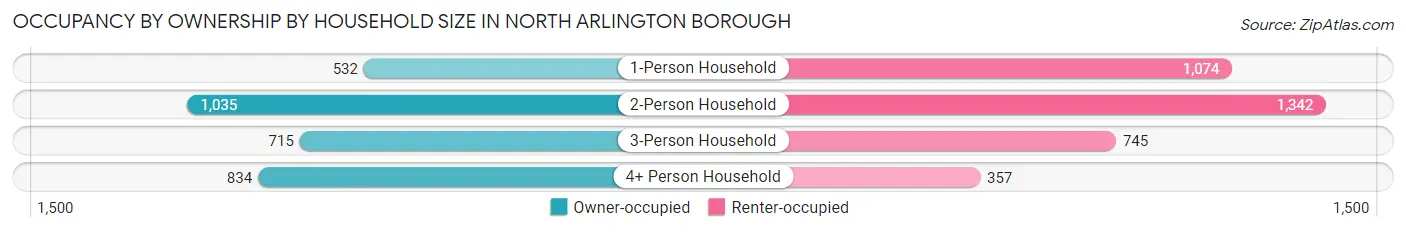
| Household Size | Owner-occupied | Renter-occupied |
| 1-Person Household | 532 (33.1%) | 1,074 (66.9%) |
| 2-Person Household | 1,035 (43.5%) | 1,342 (56.5%) |
| 3-Person Household | 715 (49.0%) | 745 (51.0%) |
| 4+ Person Household | 834 (70.0%) | 357 (30.0%) |
| Total Housing Units | 3,116 (47.0%) | 3,518 (53.0%) |
Occupancy by Educational Attainment in North Arlington borough
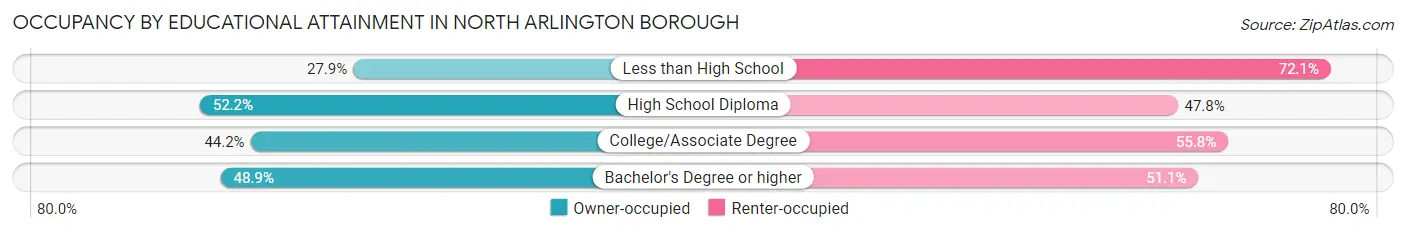
| Household Size | Owner-occupied | Renter-occupied |
| Less than High School | 125 (27.9%) | 323 (72.1%) |
| High School Diploma | 842 (52.2%) | 771 (47.8%) |
| College/Associate Degree | 820 (44.2%) | 1,036 (55.8%) |
| Bachelor's Degree or higher | 1,329 (48.9%) | 1,388 (51.1%) |
Occupancy by Age of Householder in North Arlington borough
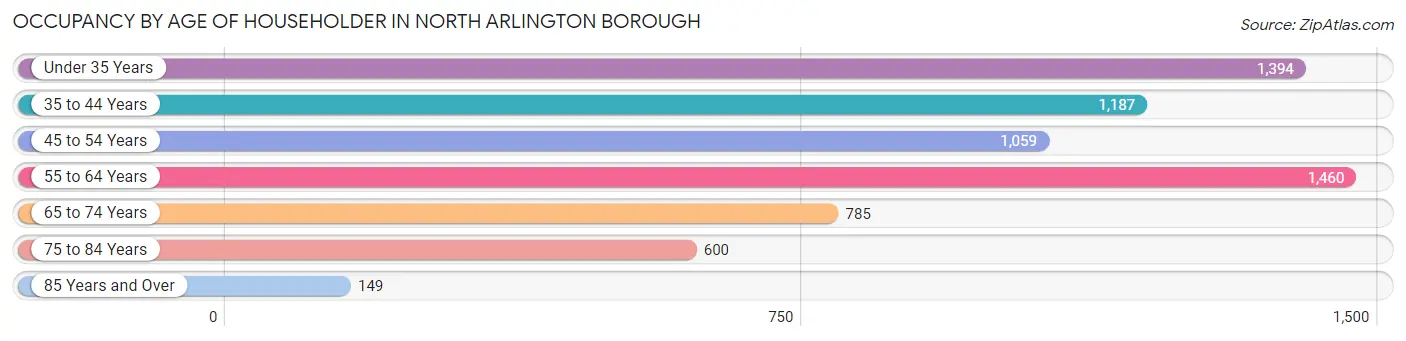
| Age Bracket | # Households | % Households |
| Under 35 Years | 1,394 | 21.0% |
| 35 to 44 Years | 1,187 | 17.9% |
| 45 to 54 Years | 1,059 | 16.0% |
| 55 to 64 Years | 1,460 | 22.0% |
| 65 to 74 Years | 785 | 11.8% |
| 75 to 84 Years | 600 | 9.0% |
| 85 Years and Over | 149 | 2.2% |
| Total | 6,634 | 100.0% |
Housing Finances in North Arlington borough
Median Income by Occupancy in North Arlington borough
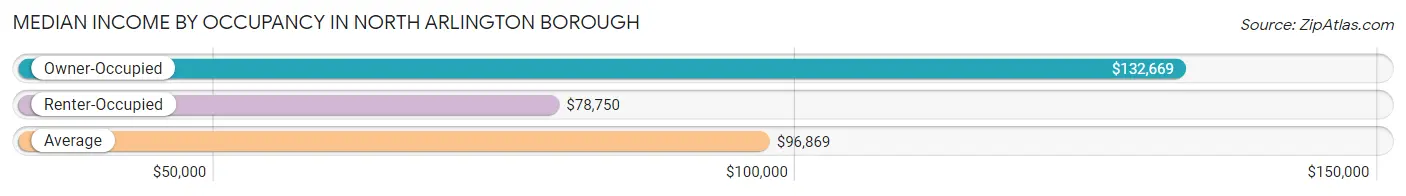
| Occupancy Type | # Households | Median Income |
| Owner-Occupied | 3,116 (47.0%) | $132,669 |
| Renter-Occupied | 3,518 (53.0%) | $78,750 |
| Average | 6,634 (100.0%) | $96,869 |
Occupancy by Householder Income Bracket in North Arlington borough
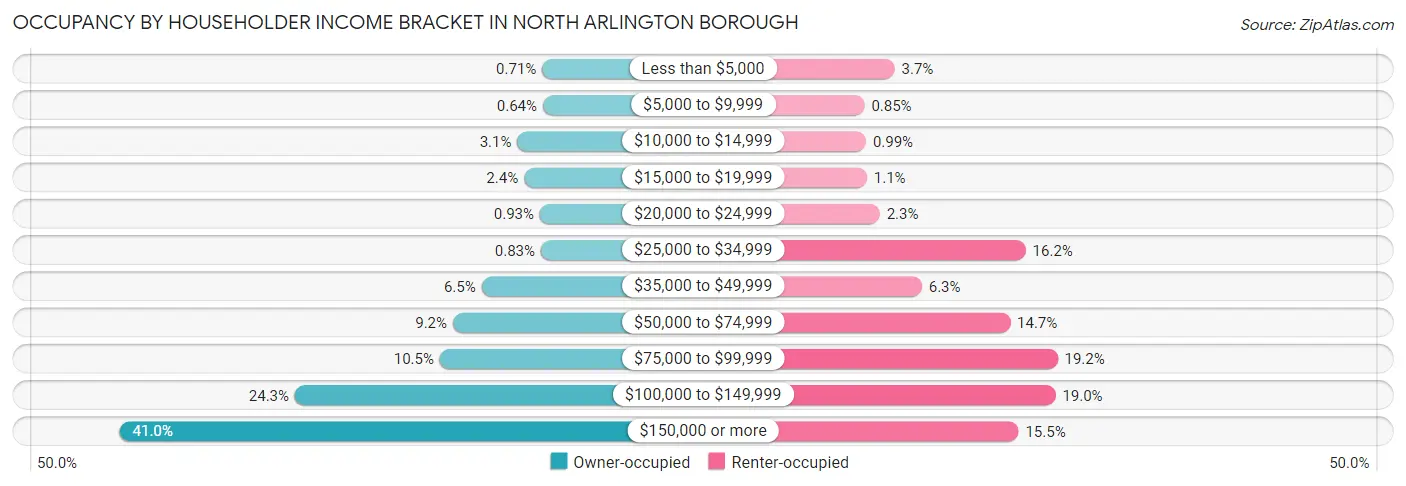
| Income Bracket | Owner-occupied | Renter-occupied |
| Less than $5,000 | 22 (0.7%) | 131 (3.7%) |
| $5,000 to $9,999 | 20 (0.6%) | 30 (0.9%) |
| $10,000 to $14,999 | 96 (3.1%) | 35 (1.0%) |
| $15,000 to $19,999 | 76 (2.4%) | 38 (1.1%) |
| $20,000 to $24,999 | 29 (0.9%) | 81 (2.3%) |
| $25,000 to $34,999 | 26 (0.8%) | 570 (16.2%) |
| $35,000 to $49,999 | 202 (6.5%) | 222 (6.3%) |
| $50,000 to $74,999 | 287 (9.2%) | 518 (14.7%) |
| $75,000 to $99,999 | 326 (10.5%) | 677 (19.2%) |
| $100,000 to $149,999 | 756 (24.3%) | 670 (19.0%) |
| $150,000 or more | 1,276 (40.9%) | 546 (15.5%) |
| Total | 3,116 (100.0%) | 3,518 (100.0%) |
Monthly Housing Cost Tiers in North Arlington borough
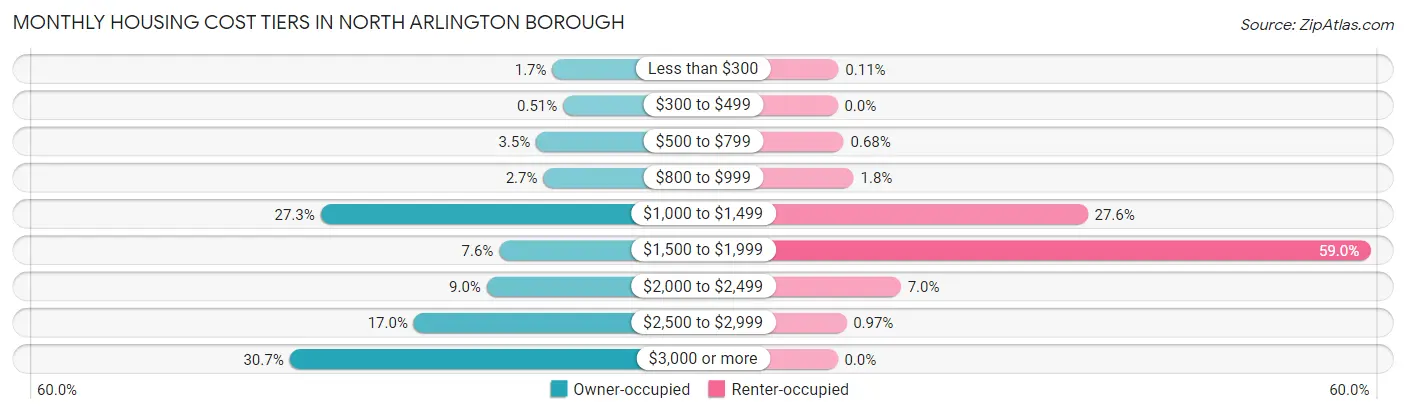
| Monthly Cost | Owner-occupied | Renter-occupied |
| Less than $300 | 53 (1.7%) | 4 (0.1%) |
| $300 to $499 | 16 (0.5%) | 0 (0.0%) |
| $500 to $799 | 109 (3.5%) | 24 (0.7%) |
| $800 to $999 | 84 (2.7%) | 63 (1.8%) |
| $1,000 to $1,499 | 851 (27.3%) | 972 (27.6%) |
| $1,500 to $1,999 | 236 (7.6%) | 2,074 (59.0%) |
| $2,000 to $2,499 | 279 (8.9%) | 246 (7.0%) |
| $2,500 to $2,999 | 530 (17.0%) | 34 (1.0%) |
| $3,000 or more | 958 (30.7%) | 0 (0.0%) |
| Total | 3,116 (100.0%) | 3,518 (100.0%) |
Physical Housing Characteristics in North Arlington borough
Housing Structures in North Arlington borough
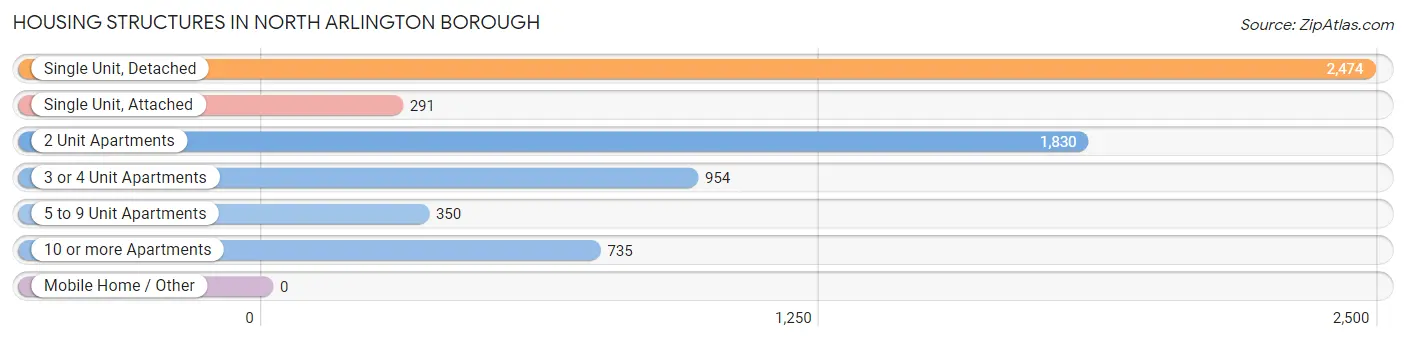
| Structure Type | # Housing Units | % Housing Units |
| Single Unit, Detached | 2,474 | 37.3% |
| Single Unit, Attached | 291 | 4.4% |
| 2 Unit Apartments | 1,830 | 27.6% |
| 3 or 4 Unit Apartments | 954 | 14.4% |
| 5 to 9 Unit Apartments | 350 | 5.3% |
| 10 or more Apartments | 735 | 11.1% |
| Mobile Home / Other | 0 | 0.0% |
| Total | 6,634 | 100.0% |
Housing Structures by Occupancy in North Arlington borough
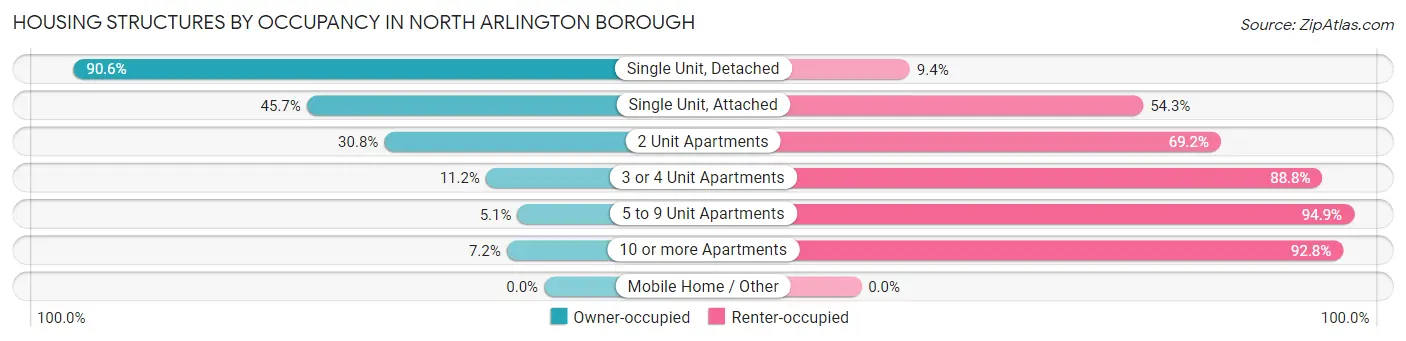
| Structure Type | Owner-occupied | Renter-occupied |
| Single Unit, Detached | 2,242 (90.6%) | 232 (9.4%) |
| Single Unit, Attached | 133 (45.7%) | 158 (54.3%) |
| 2 Unit Apartments | 563 (30.8%) | 1,267 (69.2%) |
| 3 or 4 Unit Apartments | 107 (11.2%) | 847 (88.8%) |
| 5 to 9 Unit Apartments | 18 (5.1%) | 332 (94.9%) |
| 10 or more Apartments | 53 (7.2%) | 682 (92.8%) |
| Mobile Home / Other | 0 (0.0%) | 0 (0.0%) |
| Total | 3,116 (47.0%) | 3,518 (53.0%) |
Housing Structures by Number of Rooms in North Arlington borough
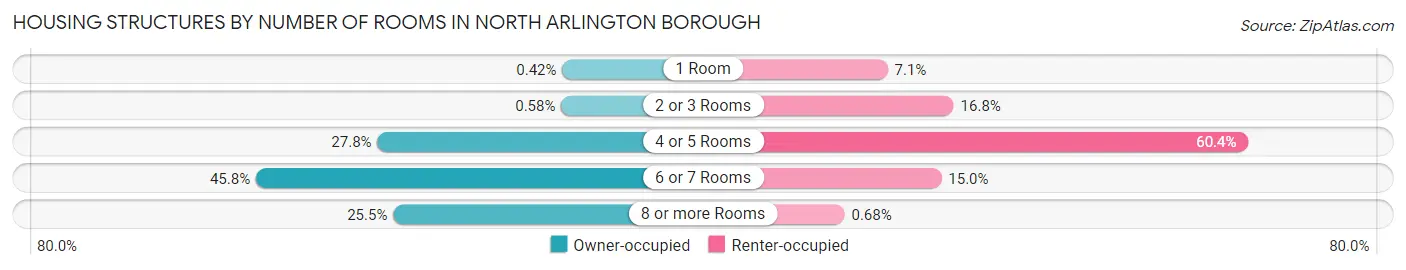
| Number of Rooms | Owner-occupied | Renter-occupied |
| 1 Room | 13 (0.4%) | 248 (7.0%) |
| 2 or 3 Rooms | 18 (0.6%) | 592 (16.8%) |
| 4 or 5 Rooms | 866 (27.8%) | 2,126 (60.4%) |
| 6 or 7 Rooms | 1,426 (45.8%) | 528 (15.0%) |
| 8 or more Rooms | 793 (25.5%) | 24 (0.7%) |
| Total | 3,116 (100.0%) | 3,518 (100.0%) |
Housing Structure by Heating Type in North Arlington borough
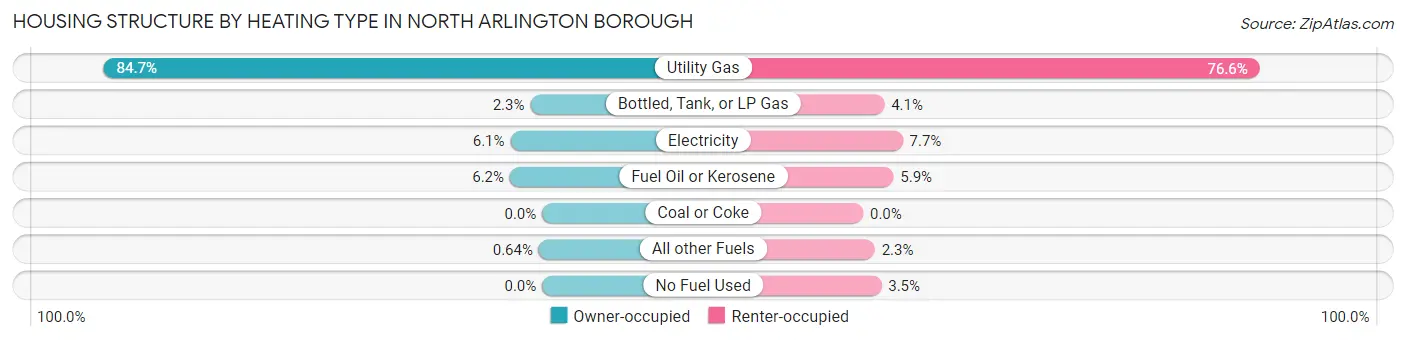
| Heating Type | Owner-occupied | Renter-occupied |
| Utility Gas | 2,640 (84.7%) | 2,696 (76.6%) |
| Bottled, Tank, or LP Gas | 71 (2.3%) | 144 (4.1%) |
| Electricity | 191 (6.1%) | 269 (7.6%) |
| Fuel Oil or Kerosene | 194 (6.2%) | 206 (5.9%) |
| Coal or Coke | 0 (0.0%) | 0 (0.0%) |
| All other Fuels | 20 (0.6%) | 79 (2.2%) |
| No Fuel Used | 0 (0.0%) | 124 (3.5%) |
| Total | 3,116 (100.0%) | 3,518 (100.0%) |
Household Vehicle Usage in North Arlington borough
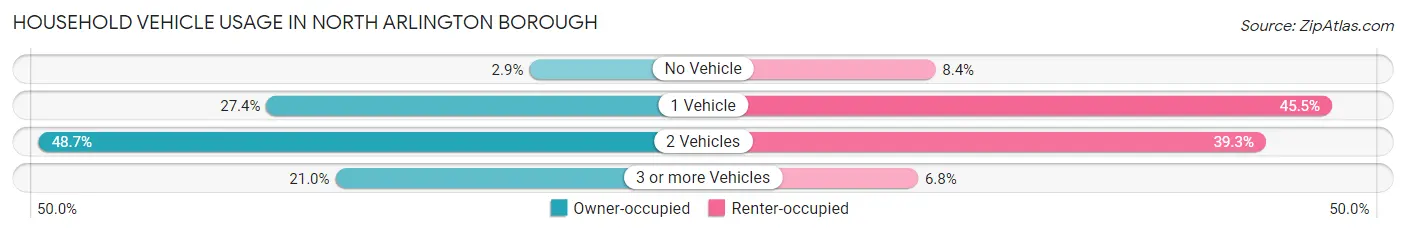
| Vehicles per Household | Owner-occupied | Renter-occupied |
| No Vehicle | 90 (2.9%) | 297 (8.4%) |
| 1 Vehicle | 855 (27.4%) | 1,599 (45.5%) |
| 2 Vehicles | 1,517 (48.7%) | 1,382 (39.3%) |
| 3 or more Vehicles | 654 (21.0%) | 240 (6.8%) |
| Total | 3,116 (100.0%) | 3,518 (100.0%) |
Real Estate & Mortgages in North Arlington borough
Real Estate and Mortgage Overview in North Arlington borough
| Characteristic | Without Mortgage | With Mortgage |
| Housing Units | 1,143 | 1,973 |
| Median Property Value | $415,000 | $459,400 |
| Median Household Income | $87,708 | $1,004 |
| Monthly Housing Costs | $1,165 | $958 |
| Real Estate Taxes | $9,654 | $0 |
Property Value by Mortgage Status in North Arlington borough
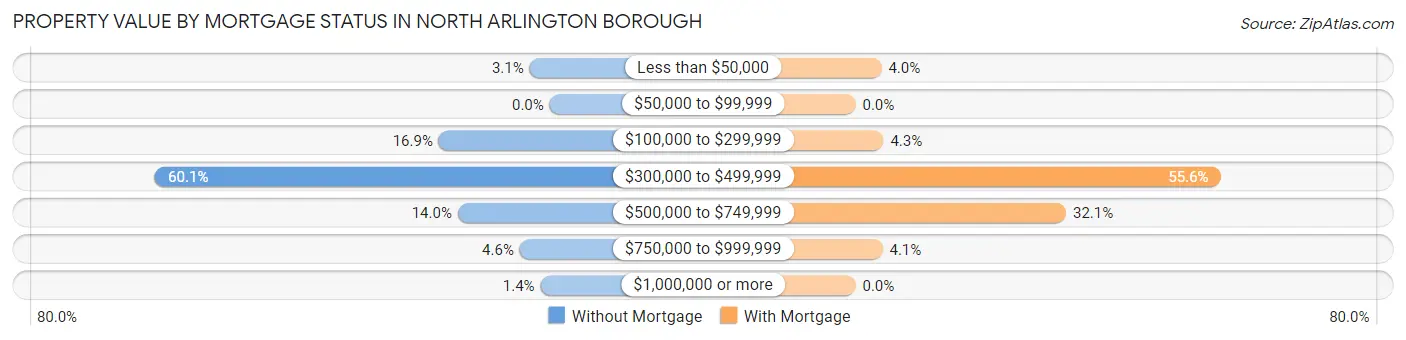
| Property Value | Without Mortgage | With Mortgage |
| Less than $50,000 | 35 (3.1%) | 78 (4.0%) |
| $50,000 to $99,999 | 0 (0.0%) | 0 (0.0%) |
| $100,000 to $299,999 | 193 (16.9%) | 84 (4.3%) |
| $300,000 to $499,999 | 687 (60.1%) | 1,097 (55.6%) |
| $500,000 to $749,999 | 160 (14.0%) | 633 (32.1%) |
| $750,000 to $999,999 | 52 (4.5%) | 81 (4.1%) |
| $1,000,000 or more | 16 (1.4%) | 0 (0.0%) |
| Total | 1,143 (100.0%) | 1,973 (100.0%) |
Household Income by Mortgage Status in North Arlington borough
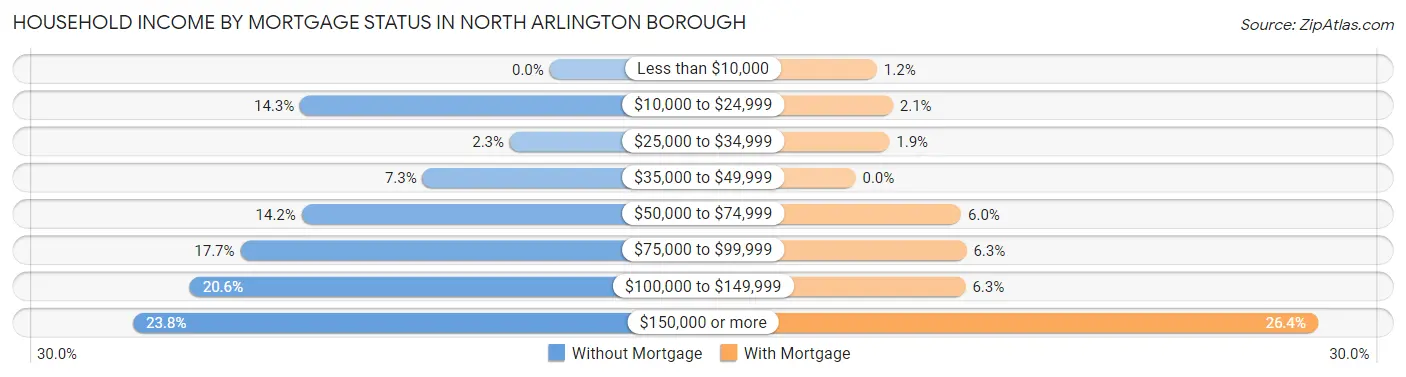
| Household Income | Without Mortgage | With Mortgage |
| Less than $10,000 | 0 (0.0%) | 24 (1.2%) |
| $10,000 to $24,999 | 163 (14.3%) | 42 (2.1%) |
| $25,000 to $34,999 | 26 (2.3%) | 38 (1.9%) |
| $35,000 to $49,999 | 83 (7.3%) | 0 (0.0%) |
| $50,000 to $74,999 | 162 (14.2%) | 119 (6.0%) |
| $75,000 to $99,999 | 202 (17.7%) | 125 (6.3%) |
| $100,000 to $149,999 | 235 (20.6%) | 124 (6.3%) |
| $150,000 or more | 272 (23.8%) | 521 (26.4%) |
| Total | 1,143 (100.0%) | 1,973 (100.0%) |
Property Value to Household Income Ratio in North Arlington borough
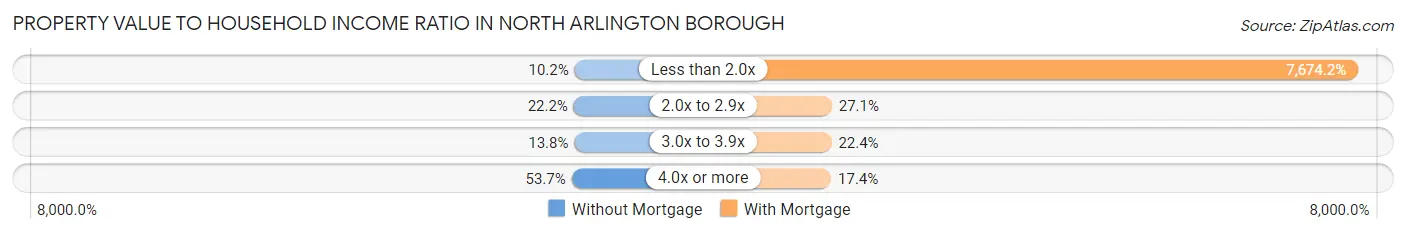
| Value-to-Income Ratio | Without Mortgage | With Mortgage |
| Less than 2.0x | 117 (10.2%) | 151,411 (7,674.2%) |
| 2.0x to 2.9x | 254 (22.2%) | 535 (27.1%) |
| 3.0x to 3.9x | 158 (13.8%) | 442 (22.4%) |
| 4.0x or more | 614 (53.7%) | 343 (17.4%) |
| Total | 1,143 (100.0%) | 1,973 (100.0%) |
Real Estate Taxes by Mortgage Status in North Arlington borough
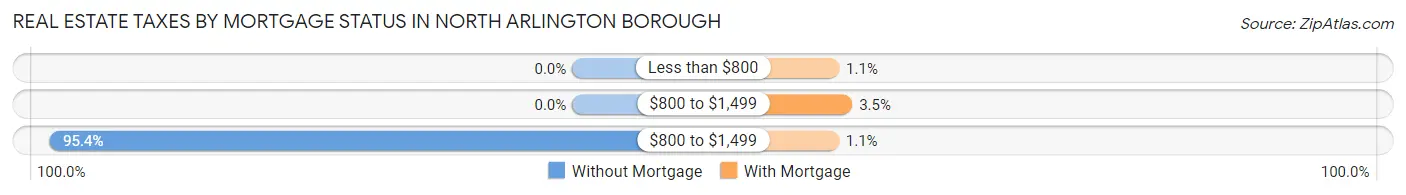
| Property Taxes | Without Mortgage | With Mortgage |
| Less than $800 | 0 (0.0%) | 22 (1.1%) |
| $800 to $1,499 | 0 (0.0%) | 69 (3.5%) |
| $800 to $1,499 | 1,090 (95.4%) | 21 (1.1%) |
| Total | 1,143 (100.0%) | 1,973 (100.0%) |
Health & Disability in North Arlington borough
Health Insurance Coverage by Age in North Arlington borough
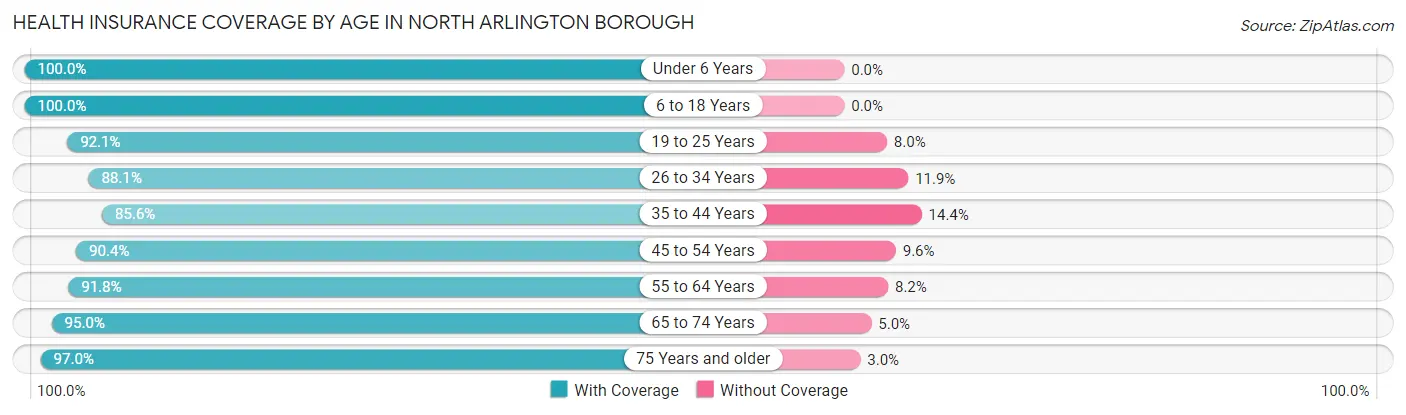
| Age Bracket | With Coverage | Without Coverage |
| Under 6 Years | 987 (100.0%) | 0 (0.0%) |
| 6 to 18 Years | 1,954 (100.0%) | 0 (0.0%) |
| 19 to 25 Years | 1,181 (92.0%) | 102 (8.0%) |
| 26 to 34 Years | 2,297 (88.1%) | 311 (11.9%) |
| 35 to 44 Years | 2,065 (85.6%) | 348 (14.4%) |
| 45 to 54 Years | 1,978 (90.4%) | 210 (9.6%) |
| 55 to 64 Years | 2,104 (91.8%) | 187 (8.2%) |
| 65 to 74 Years | 1,450 (95.0%) | 77 (5.0%) |
| 75 Years and older | 1,068 (97.0%) | 33 (3.0%) |
| Total | 15,084 (92.2%) | 1,268 (7.7%) |
Health Insurance Coverage by Citizenship Status in North Arlington borough
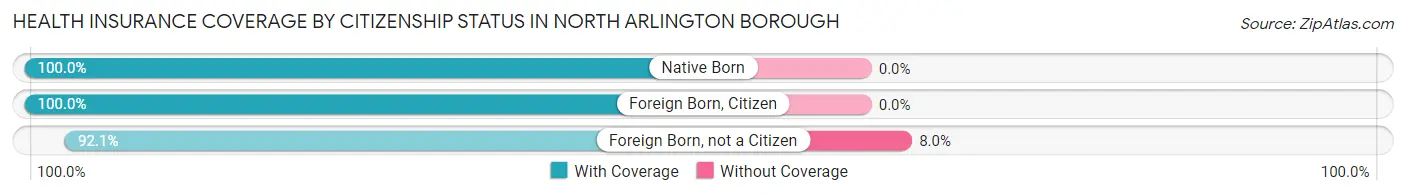
| Citizenship Status | With Coverage | Without Coverage |
| Native Born | 987 (100.0%) | 0 (0.0%) |
| Foreign Born, Citizen | 1,954 (100.0%) | 0 (0.0%) |
| Foreign Born, not a Citizen | 1,181 (92.0%) | 102 (8.0%) |
Health Insurance Coverage by Household Income in North Arlington borough
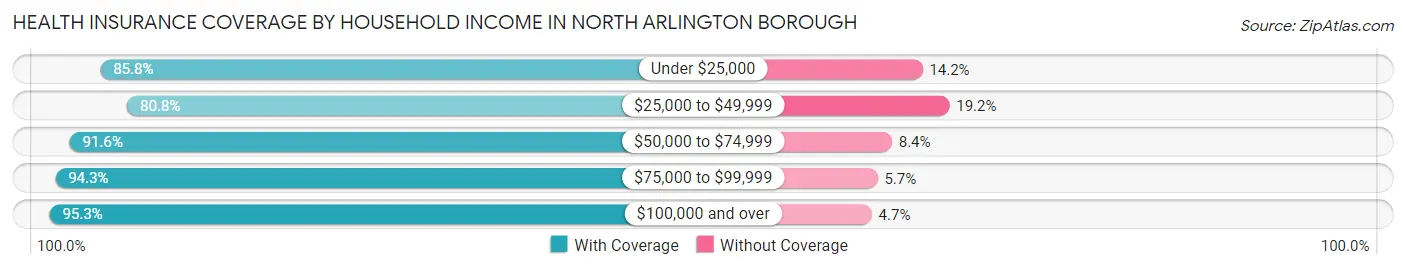
| Household Income | With Coverage | Without Coverage |
| Under $25,000 | 818 (85.8%) | 135 (14.2%) |
| $25,000 to $49,999 | 1,864 (80.8%) | 443 (19.2%) |
| $50,000 to $74,999 | 1,445 (91.6%) | 133 (8.4%) |
| $75,000 to $99,999 | 1,872 (94.3%) | 114 (5.7%) |
| $100,000 and over | 9,070 (95.3%) | 443 (4.7%) |
Public vs Private Health Insurance Coverage by Age in North Arlington borough
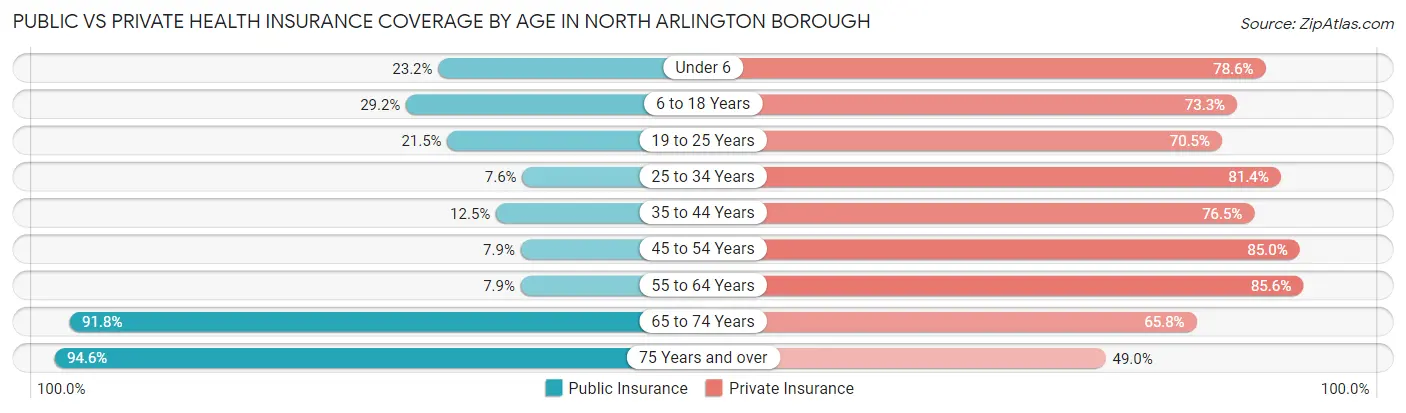
| Age Bracket | Public Insurance | Private Insurance |
| Under 6 | 229 (23.2%) | 776 (78.6%) |
| 6 to 18 Years | 570 (29.2%) | 1,433 (73.3%) |
| 19 to 25 Years | 276 (21.5%) | 905 (70.5%) |
| 25 to 34 Years | 198 (7.6%) | 2,124 (81.4%) |
| 35 to 44 Years | 301 (12.5%) | 1,847 (76.5%) |
| 45 to 54 Years | 173 (7.9%) | 1,859 (85.0%) |
| 55 to 64 Years | 181 (7.9%) | 1,961 (85.6%) |
| 65 to 74 Years | 1,401 (91.7%) | 1,005 (65.8%) |
| 75 Years and over | 1,041 (94.6%) | 539 (49.0%) |
| Total | 4,370 (26.7%) | 12,449 (76.1%) |
Disability Status by Sex by Age in North Arlington borough
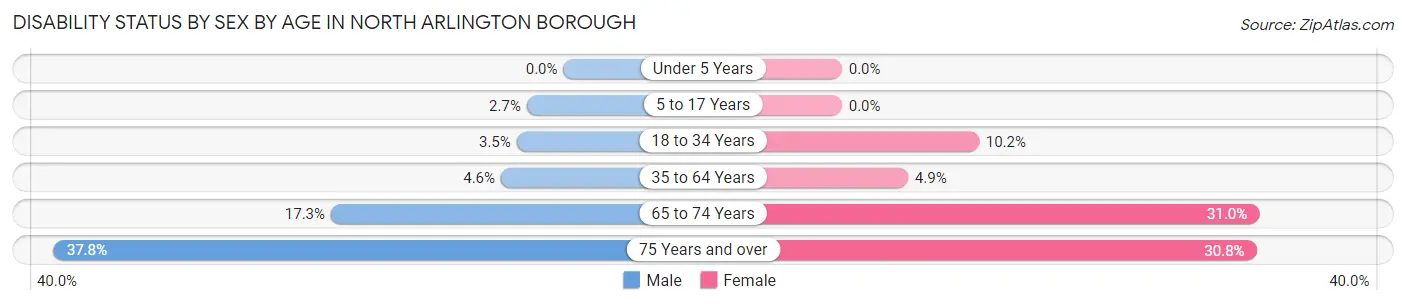
| Age Bracket | Male | Female |
| Under 5 Years | 0 (0.0%) | 0 (0.0%) |
| 5 to 17 Years | 16 (2.7%) | 0 (0.0%) |
| 18 to 34 Years | 74 (3.5%) | 198 (10.2%) |
| 35 to 64 Years | 161 (4.6%) | 168 (4.9%) |
| 65 to 74 Years | 102 (17.3%) | 290 (31.0%) |
| 75 Years and over | 199 (37.8%) | 177 (30.8%) |
Disability Class by Sex by Age in North Arlington borough
Disability Class: Hearing Difficulty
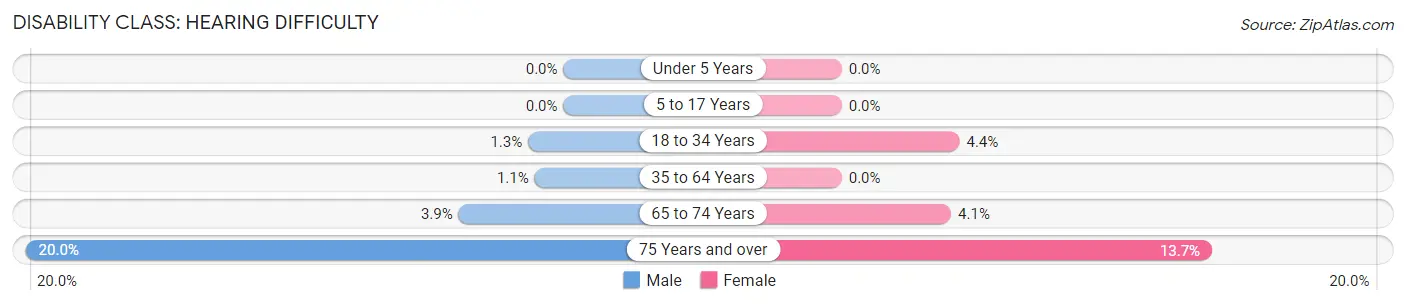
| Age Bracket | Male | Female |
| Under 5 Years | 0 (0.0%) | 0 (0.0%) |
| 5 to 17 Years | 0 (0.0%) | 0 (0.0%) |
| 18 to 34 Years | 28 (1.3%) | 85 (4.4%) |
| 35 to 64 Years | 37 (1.1%) | 0 (0.0%) |
| 65 to 74 Years | 23 (3.9%) | 38 (4.1%) |
| 75 Years and over | 105 (20.0%) | 79 (13.7%) |
Disability Class: Vision Difficulty
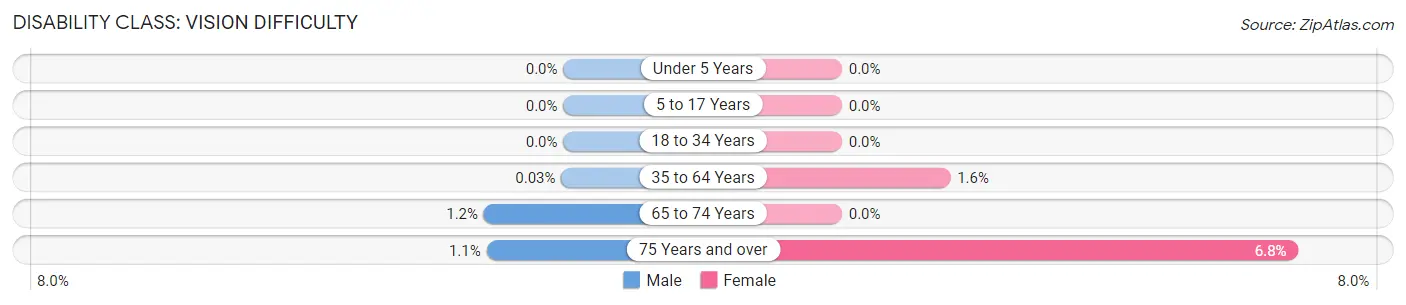
| Age Bracket | Male | Female |
| Under 5 Years | 0 (0.0%) | 0 (0.0%) |
| 5 to 17 Years | 0 (0.0%) | 0 (0.0%) |
| 18 to 34 Years | 0 (0.0%) | 0 (0.0%) |
| 35 to 64 Years | 1 (0.0%) | 55 (1.6%) |
| 65 to 74 Years | 7 (1.2%) | 0 (0.0%) |
| 75 Years and over | 6 (1.1%) | 39 (6.8%) |
Disability Class: Cognitive Difficulty
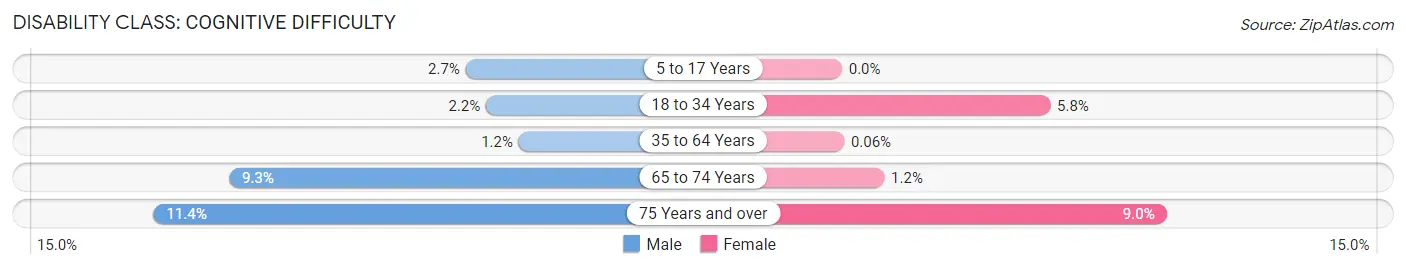
| Age Bracket | Male | Female |
| 5 to 17 Years | 16 (2.7%) | 0 (0.0%) |
| 18 to 34 Years | 46 (2.1%) | 113 (5.8%) |
| 35 to 64 Years | 43 (1.2%) | 2 (0.1%) |
| 65 to 74 Years | 55 (9.3%) | 11 (1.2%) |
| 75 Years and over | 60 (11.4%) | 52 (9.0%) |
Disability Class: Ambulatory Difficulty
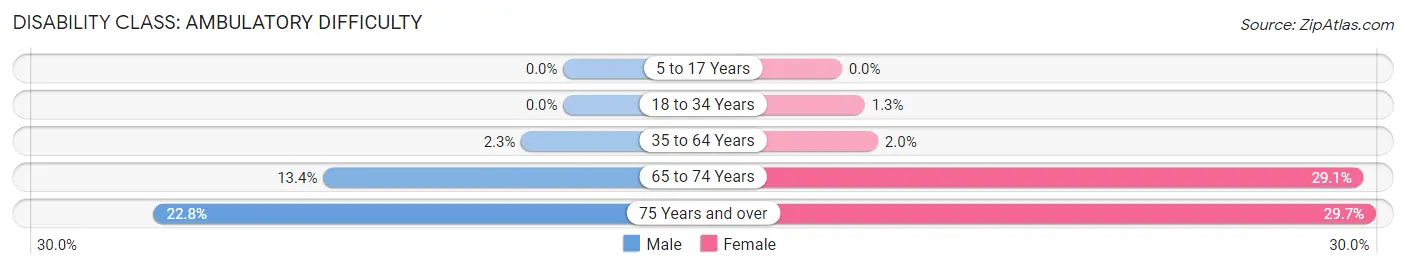
| Age Bracket | Male | Female |
| 5 to 17 Years | 0 (0.0%) | 0 (0.0%) |
| 18 to 34 Years | 0 (0.0%) | 25 (1.3%) |
| 35 to 64 Years | 81 (2.3%) | 69 (2.0%) |
| 65 to 74 Years | 79 (13.4%) | 272 (29.1%) |
| 75 Years and over | 120 (22.8%) | 171 (29.7%) |
Disability Class: Self-Care Difficulty
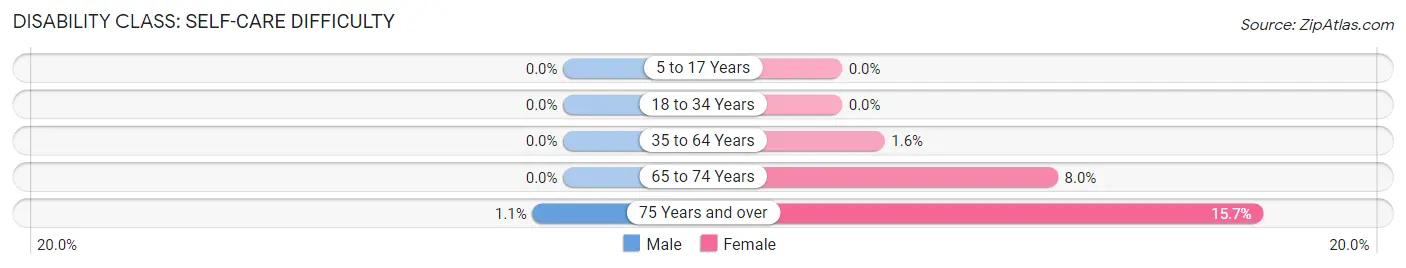
| Age Bracket | Male | Female |
| 5 to 17 Years | 0 (0.0%) | 0 (0.0%) |
| 18 to 34 Years | 0 (0.0%) | 0 (0.0%) |
| 35 to 64 Years | 0 (0.0%) | 54 (1.6%) |
| 65 to 74 Years | 0 (0.0%) | 75 (8.0%) |
| 75 Years and over | 6 (1.1%) | 90 (15.7%) |
Technology Access in North Arlington borough
Computing Device Access in North Arlington borough
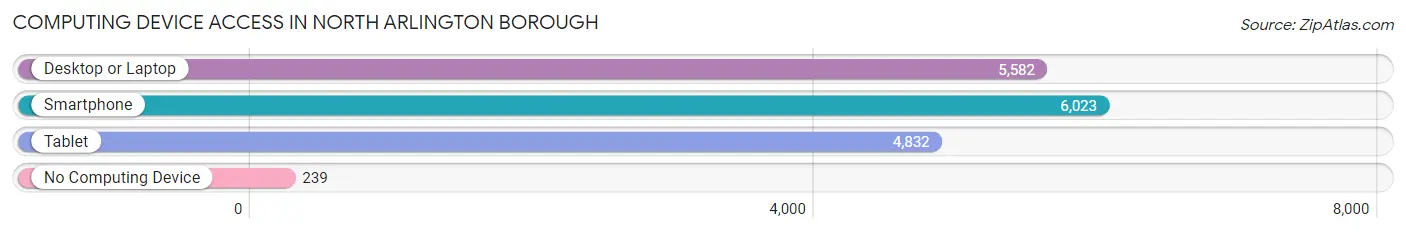
| Device Type | # Households | % Households |
| Desktop or Laptop | 5,582 | 84.1% |
| Smartphone | 6,023 | 90.8% |
| Tablet | 4,832 | 72.8% |
| No Computing Device | 239 | 3.6% |
| Total | 6,634 | 100.0% |
Internet Access in North Arlington borough
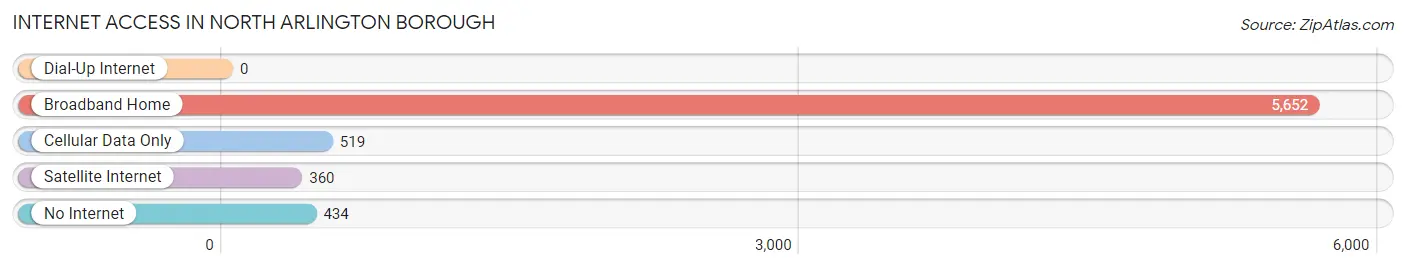
| Internet Type | # Households | % Households |
| Dial-Up Internet | 0 | 0.0% |
| Broadband Home | 5,652 | 85.2% |
| Cellular Data Only | 519 | 7.8% |
| Satellite Internet | 360 | 5.4% |
| No Internet | 434 | 6.5% |
| Total | 6,634 | 100.0% |
North Arlington borough Summary
Introduction
North Arlington is a borough located in Bergen County, New Jersey. It is situated in the heart of the New York metropolitan area and is part of the larger city of Newark. The borough is home to a diverse population of approximately 15,000 people and is known for its strong sense of community and vibrant culture.
History
North Arlington was originally part of the Township of Belleville, which was established in 1839. In 1896, the area was incorporated as the Borough of North Arlington. The borough was named after the Arlington Hotel, which was located in the area at the time.
The borough experienced rapid growth in the early 20th century, as many immigrants from Europe and other parts of the world moved to the area. This influx of new residents helped to shape the borough’s culture and economy.
Geography
North Arlington is located in the heart of Bergen County, New Jersey. It is bordered by the cities of Newark, Belleville, and Kearny. The borough is situated on the Passaic River and is home to several parks and recreational areas.
The borough has a total area of 2.2 square miles, with a population density of 6,845 people per square mile. The borough is located in the humid subtropical climate zone, with hot, humid summers and cold, wet winters.
Economy
North Arlington’s economy is largely based on the service industry. The borough is home to a variety of restaurants, retail stores, and other businesses. The borough is also home to several large corporations, including Panasonic, Prudential Financial, and Verizon.
The borough’s unemployment rate is lower than the national average, and the median household income is higher than the national average. The borough is also home to a number of small businesses, including restaurants, retail stores, and professional services.
Demographics
North Arlington is home to a diverse population of approximately 15,000 people. The borough is predominantly white, with a large Hispanic population. The median age in the borough is 38.7 years, and the median household income is $68,845.
Conclusion
North Arlington is a vibrant borough located in Bergen County, New Jersey. The borough is home to a diverse population of approximately 15,000 people and is known for its strong sense of community and vibrant culture. The borough’s economy is largely based on the service industry, and the median household income is higher than the national average. North Arlington is a great place to live, work, and play.
Common Questions
What is Per Capita Income in North Arlington borough?
Per Capita income in North Arlington borough is $48,499.
What is the Median Family Income in North Arlington borough?
Median Family Income in North Arlington borough is $114,538.
What is the Median Household income in North Arlington borough?
Median Household Income in North Arlington borough is $96,869.
What is Income or Wage Gap in North Arlington borough?
Income or Wage Gap in North Arlington borough is 25.3%.
Women in North Arlington borough earn 74.7 cents for every dollar earned by a man.
What is Family Income Deficit in North Arlington borough?
Family Income Deficit in North Arlington borough is $7,808.
Families that are below poverty line in North Arlington borough earn $7,808 less on average than the poverty threshold level.
What is Inequality or Gini Index in North Arlington borough?
Inequality or Gini Index in North Arlington borough is 0.40.
What is the Total Population of North Arlington borough?
Total Population of North Arlington borough is 16,352.
What is the Total Male Population of North Arlington borough?
Total Male Population of North Arlington borough is 7,706.
What is the Total Female Population of North Arlington borough?
Total Female Population of North Arlington borough is 8,646.
What is the Ratio of Males per 100 Females in North Arlington borough?
There are 89.13 Males per 100 Females in North Arlington borough.
What is the Ratio of Females per 100 Males in North Arlington borough?
There are 112.20 Females per 100 Males in North Arlington borough.
What is the Median Population Age in North Arlington borough?
Median Population Age in North Arlington borough is 40.4 Years.
What is the Average Family Size in North Arlington borough
Average Family Size in North Arlington borough is 2.9 People.
What is the Average Household Size in North Arlington borough
Average Household Size in North Arlington borough is 2.5 People.
How Large is the Labor Force in North Arlington borough?
There are 9,454 People in the Labor Forcein in North Arlington borough.
What is the Percentage of People in the Labor Force in North Arlington borough?
68.9% of People are in the Labor Force in North Arlington borough.
What is the Unemployment Rate in North Arlington borough?
Unemployment Rate in North Arlington borough is 5.8%.