Zip Codes with the Highest Percentage of Population Employed in Security & Protection in Clifton, NJ
RELATED REPORTS & OPTIONS
Security & Protection
Clifton
Compare Zip Codes
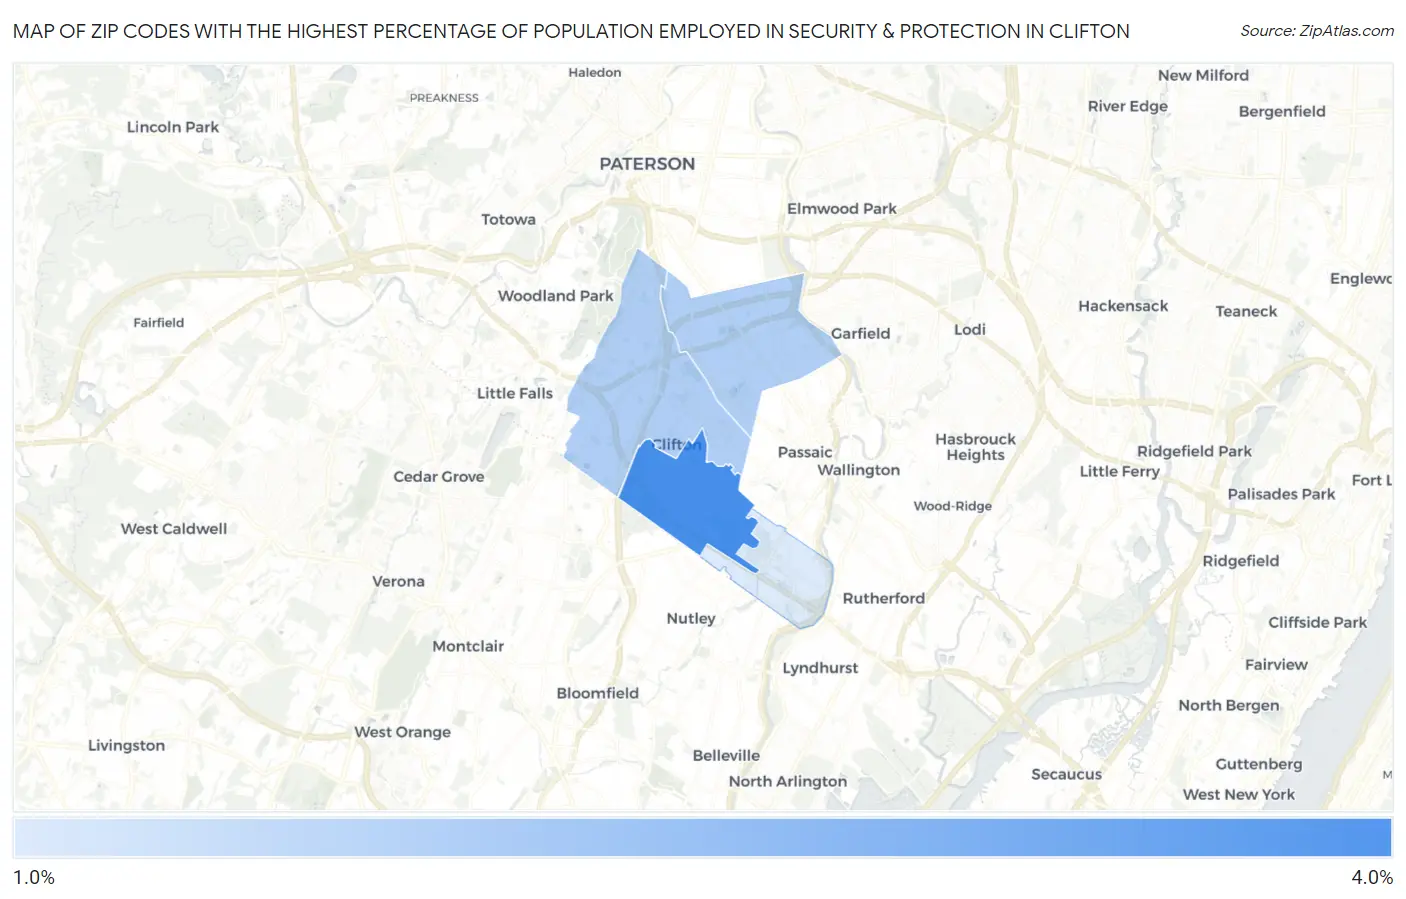
Map of Zip Codes with the Highest Percentage of Population Employed in Security & Protection in Clifton
1.1%
3.4%
Zip Codes with the Highest Percentage of Population Employed in Security & Protection in Clifton, NJ
| Zip Code | % Employed | vs State | vs National | |
| 1. | 07012 | 3.4% | 2.4%(+0.989)#126 | 2.1%(+1.24)#5,960 |
| 2. | 07013 | 1.8% | 2.4%(-0.573)#331 | 2.1%(-0.319)#13,719 |
| 3. | 07011 | 1.8% | 2.4%(-0.624)#340 | 2.1%(-0.370)#14,106 |
| 4. | 07014 | 1.1% | 2.4%(-1.27)#438 | 2.1%(-1.01)#19,027 |
1
Common Questions
What are the Top 3 Zip Codes with the Highest Percentage of Population Employed in Security & Protection in Clifton, NJ?
Top 3 Zip Codes with the Highest Percentage of Population Employed in Security & Protection in Clifton, NJ are:
What zip code has the Highest Percentage of Population Employed in Security & Protection in Clifton, NJ?
07012 has the Highest Percentage of Population Employed in Security & Protection in Clifton, NJ with 3.4%.
What is the Percentage of Population Employed in Security & Protection in Clifton, NJ?
Percentage of Population Employed in Security & Protection in Clifton is 2.0%.
What is the Percentage of Population Employed in Security & Protection in New Jersey?
Percentage of Population Employed in Security & Protection in New Jersey is 2.4%.
What is the Percentage of Population Employed in Security & Protection in the United States?
Percentage of Population Employed in Security & Protection in the United States is 2.1%.