Pemberton Heights, NJ Map & Demographics
Pemberton Heights Map
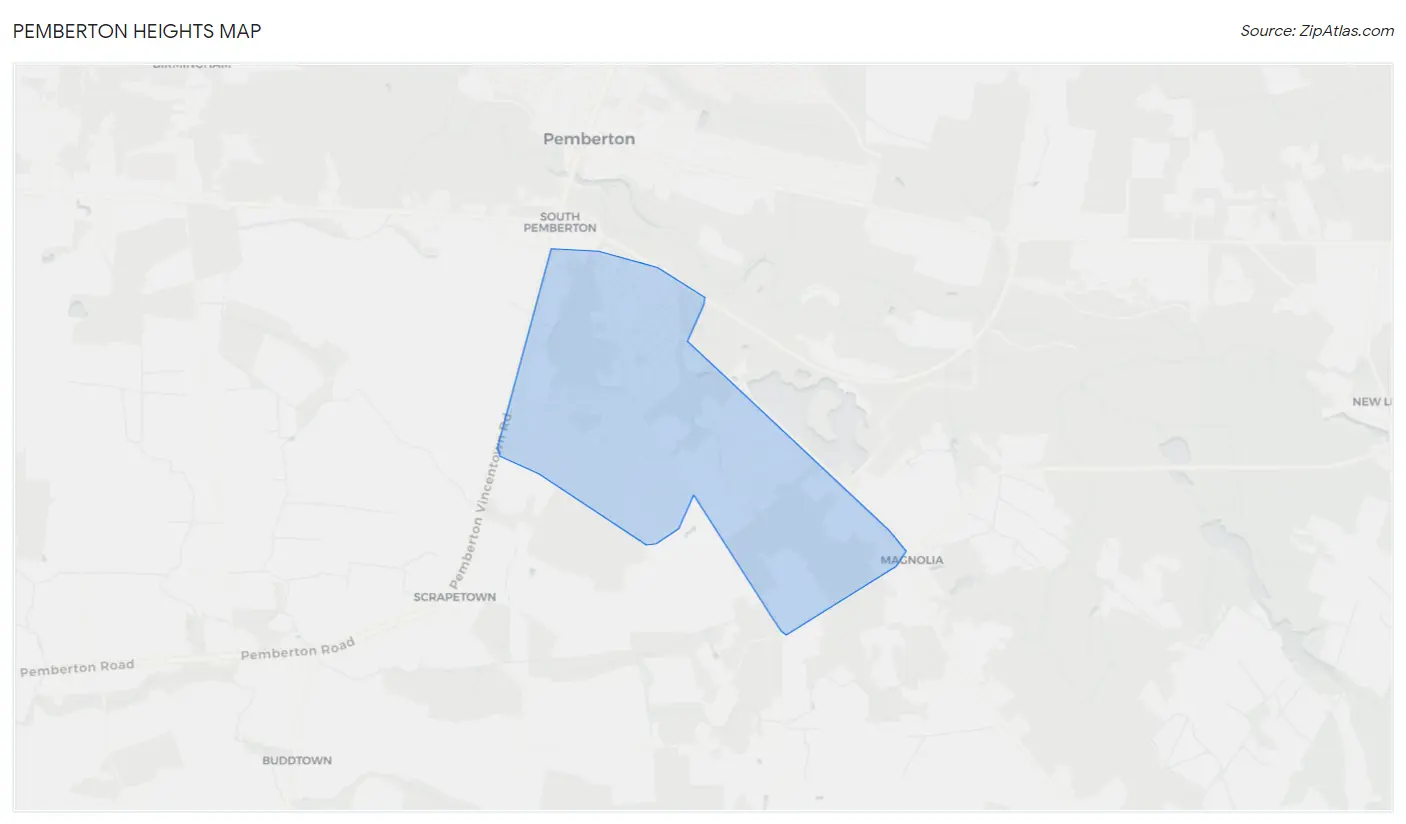
Pemberton Heights Overview
$48,973
PER CAPITA INCOME
$108,862
AVG FAMILY INCOME
$73,798
AVG HOUSEHOLD INCOME
9.7%
WAGE / INCOME GAP [ % ]
90.3¢/ $1
WAGE / INCOME GAP [ $ ]
0.46
INEQUALITY / GINI INDEX
2,776
TOTAL POPULATION
1,359
MALE POPULATION
1,417
FEMALE POPULATION
95.91
MALES / 100 FEMALES
104.27
FEMALES / 100 MALES
38.4
MEDIAN AGE
3.1
AVG FAMILY SIZE
2.2
AVG HOUSEHOLD SIZE
1,591
LABOR FORCE [ PEOPLE ]
65.7%
PERCENT IN LABOR FORCE
Income in Pemberton Heights
Income Overview in Pemberton Heights
Per Capita Income in Pemberton Heights is $48,973, while median incomes of families and households are $108,862 and $73,798 respectively.
| Characteristic | Number | Measure |
| Per Capita Income | 2,776 | $48,973 |
| Median Family Income | 617 | $108,862 |
| Mean Family Income | 617 | $154,434 |
| Median Household Income | 1,245 | $73,798 |
| Mean Household Income | 1,245 | $104,457 |
| Income Deficit | 617 | $0 |
| Wage / Income Gap (%) | 2,776 | 9.68% |
| Wage / Income Gap ($) | 2,776 | 90.32¢ per $1 |
| Gini / Inequality Index | 2,776 | 0.46 |
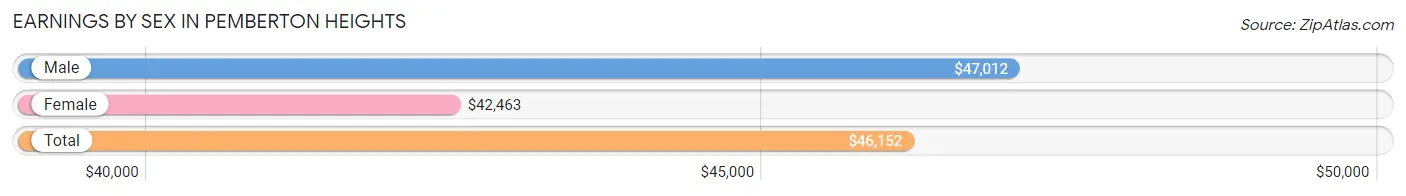
Earnings by Sex in Pemberton Heights
Average Earnings in Pemberton Heights are $46,152, $47,012 for men and $42,463 for women, a difference of 9.7%.
| Sex | Number | Average Earnings |
| Male | 783 (49.2%) | $47,012 |
| Female | 808 (50.8%) | $42,463 |
| Total | 1,591 (100.0%) | $46,152 |
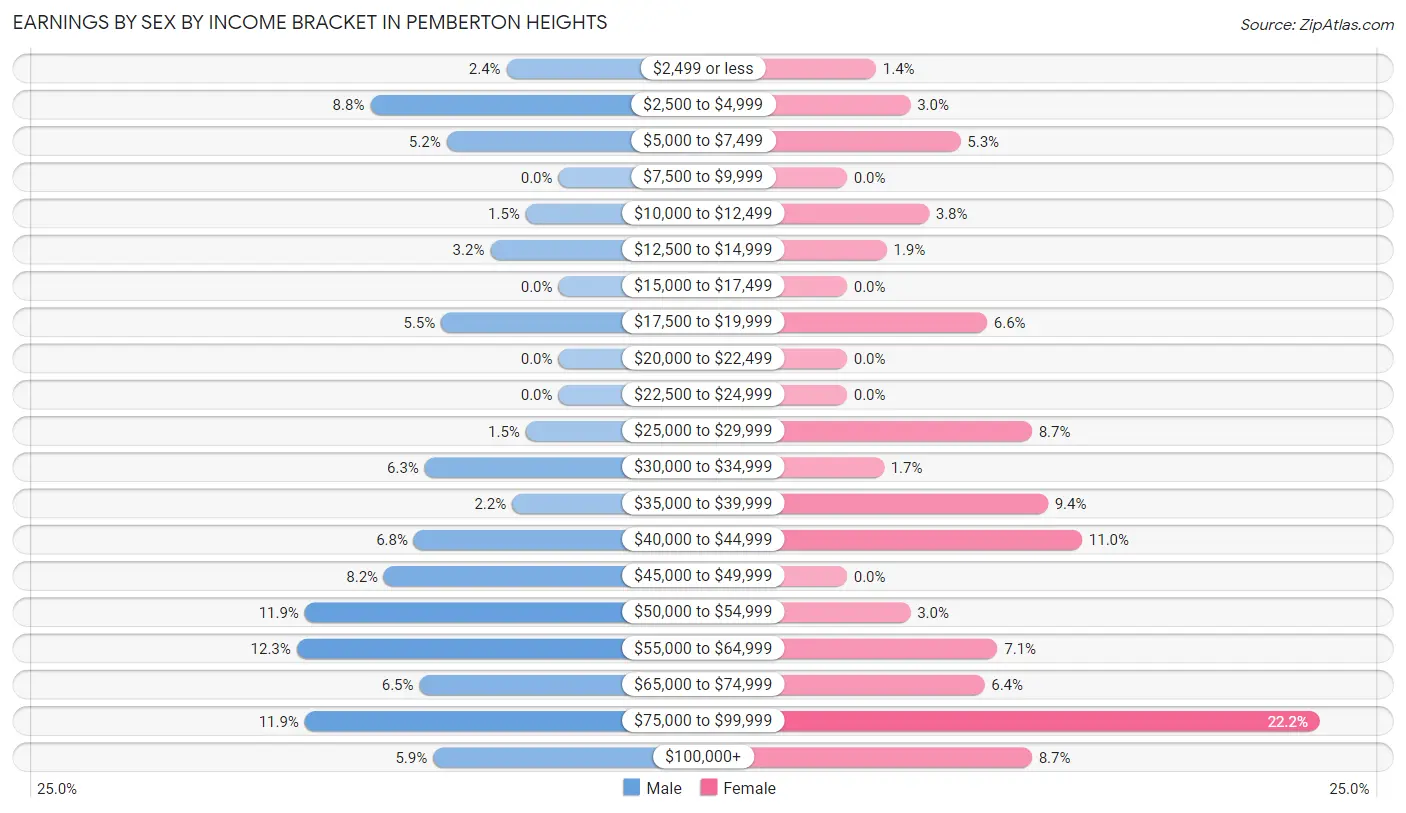
Earnings by Sex by Income Bracket in Pemberton Heights
The most common earnings brackets in Pemberton Heights are $55,000 to $64,999 for men (96 | 12.3%) and $75,000 to $99,999 for women (179 | 22.2%).
| Income | Male | Female |
| $2,499 or less | 19 (2.4%) | 11 (1.4%) |
| $2,500 to $4,999 | 69 (8.8%) | 24 (3.0%) |
| $5,000 to $7,499 | 41 (5.2%) | 43 (5.3%) |
| $7,500 to $9,999 | 0 (0.0%) | 0 (0.0%) |
| $10,000 to $12,499 | 12 (1.5%) | 31 (3.8%) |
| $12,500 to $14,999 | 25 (3.2%) | 15 (1.9%) |
| $15,000 to $17,499 | 0 (0.0%) | 0 (0.0%) |
| $17,500 to $19,999 | 43 (5.5%) | 53 (6.6%) |
| $20,000 to $22,499 | 0 (0.0%) | 0 (0.0%) |
| $22,500 to $24,999 | 0 (0.0%) | 0 (0.0%) |
| $25,000 to $29,999 | 12 (1.5%) | 70 (8.7%) |
| $30,000 to $34,999 | 49 (6.3%) | 14 (1.7%) |
| $35,000 to $39,999 | 17 (2.2%) | 76 (9.4%) |
| $40,000 to $44,999 | 53 (6.8%) | 89 (11.0%) |
| $45,000 to $49,999 | 64 (8.2%) | 0 (0.0%) |
| $50,000 to $54,999 | 93 (11.9%) | 24 (3.0%) |
| $55,000 to $64,999 | 96 (12.3%) | 57 (7.0%) |
| $65,000 to $74,999 | 51 (6.5%) | 52 (6.4%) |
| $75,000 to $99,999 | 93 (11.9%) | 179 (22.2%) |
| $100,000+ | 46 (5.9%) | 70 (8.7%) |
| Total | 783 (100.0%) | 808 (100.0%) |
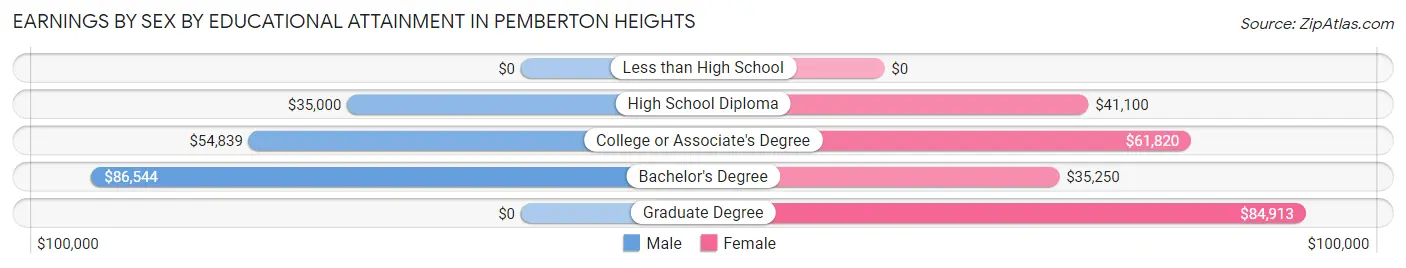
Earnings by Sex by Educational Attainment in Pemberton Heights
Average earnings in Pemberton Heights are $54,422 for men and $50,573 for women, a difference of 7.1%. Men with an educational attainment of bachelor's degree enjoy the highest average annual earnings of $86,544, while those with high school diploma education earn the least with $35,000. Women with an educational attainment of graduate degree earn the most with the average annual earnings of $84,913, while those with bachelor's degree education have the smallest earnings of $35,250.
| Educational Attainment | Male Income | Female Income |
| Less than High School | - | - |
| High School Diploma | $35,000 | $41,100 |
| College or Associate's Degree | $54,839 | $61,820 |
| Bachelor's Degree | $86,544 | $35,250 |
| Graduate Degree | - | - |
| Total | $54,422 | $50,573 |
Family Income in Pemberton Heights
Family Income Brackets in Pemberton Heights
According to the Pemberton Heights family income data, there are 199 families falling into the $100,000 to $149,999 income range, which is the most common income bracket and makes up 32.3% of all families.
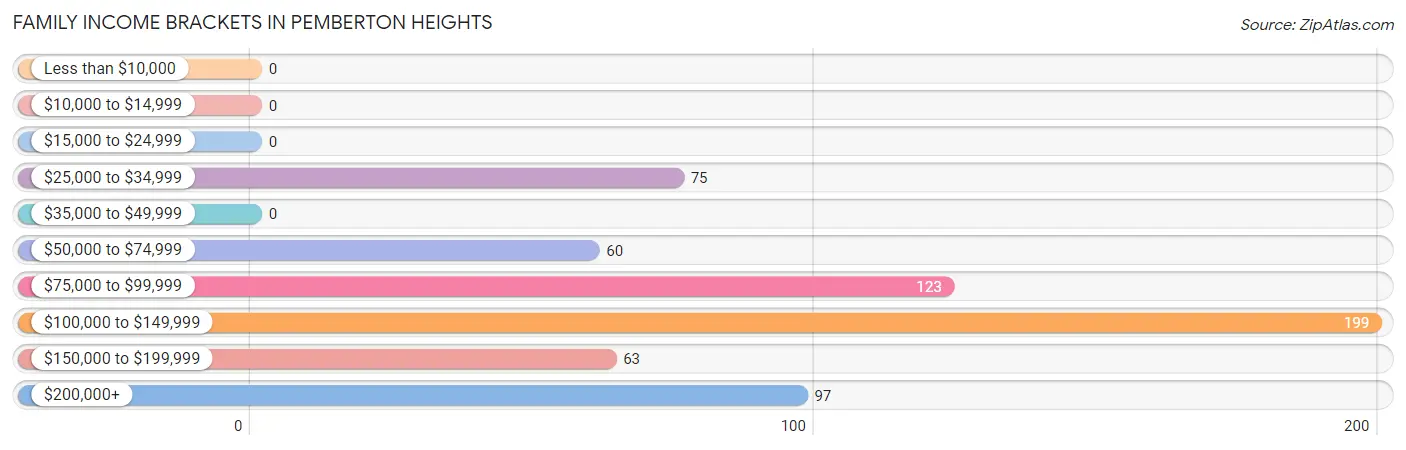
| Income Bracket | # Families | % Families |
| Less than $10,000 | 0 | 0.0% |
| $10,000 to $14,999 | 0 | 0.0% |
| $15,000 to $24,999 | 0 | 0.0% |
| $25,000 to $34,999 | 75 | 12.2% |
| $35,000 to $49,999 | 0 | 0.0% |
| $50,000 to $74,999 | 60 | 9.7% |
| $75,000 to $99,999 | 123 | 19.9% |
| $100,000 to $149,999 | 199 | 32.3% |
| $150,000 to $199,999 | 63 | 10.2% |
| $200,000+ | 97 | 15.7% |
Family Income by Famaliy Size in Pemberton Heights
5-person families (45 | 7.3%) account for the highest median family income in Pemberton Heights with $250,001 per family, while 2-person families (278 | 45.1%) have the highest median income of $53,810 per family member.
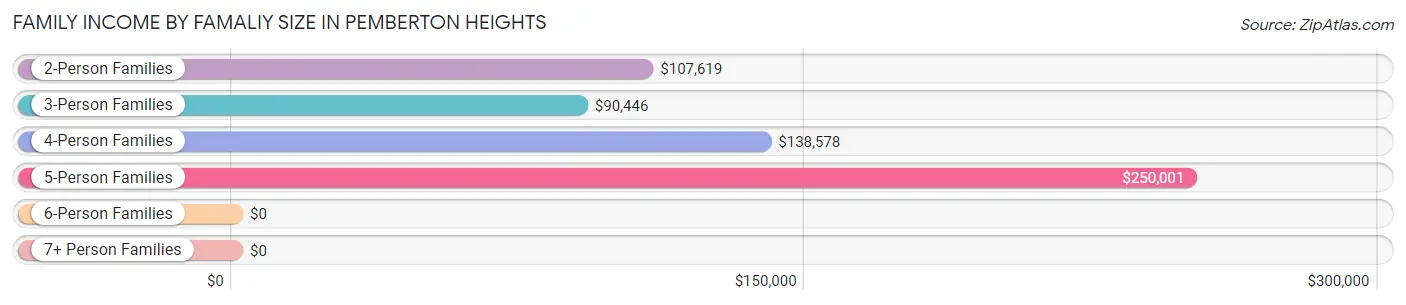
| Income Bracket | # Families | Median Income |
| 2-Person Families | 278 (45.1%) | $107,619 |
| 3-Person Families | 121 (19.6%) | $90,446 |
| 4-Person Families | 173 (28.0%) | $138,578 |
| 5-Person Families | 45 (7.3%) | $250,001 |
| 6-Person Families | 0 (0.0%) | $0 |
| 7+ Person Families | 0 (0.0%) | $0 |
| Total | 617 (100.0%) | $108,862 |
Family Income by Number of Earners in Pemberton Heights
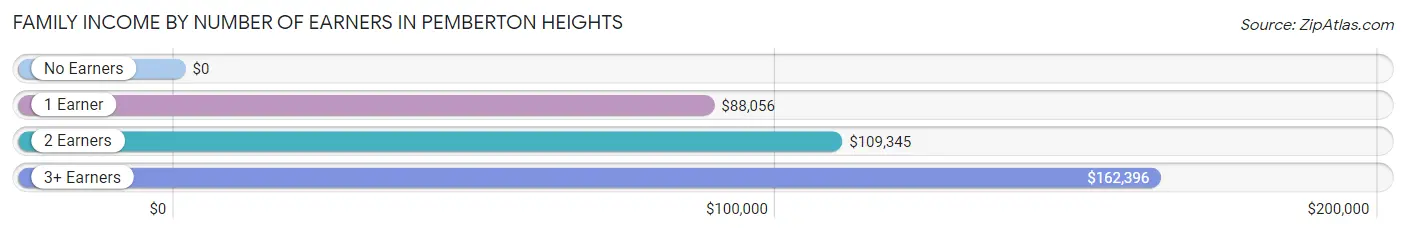
| Number of Earners | # Families | Median Income |
| No Earners | 109 (17.7%) | $0 |
| 1 Earner | 214 (34.7%) | $88,056 |
| 2 Earners | 200 (32.4%) | $109,345 |
| 3+ Earners | 94 (15.2%) | $162,396 |
| Total | 617 (100.0%) | $108,862 |
Household Income in Pemberton Heights
Household Income Brackets in Pemberton Heights
With 268 households falling in the category, the $50,000 to $74,999 income range is the most frequent in Pemberton Heights, accounting for 21.5% of all households. In contrast, only 15 households (1.2%) fall into the $10,000 to $14,999 income bracket, making it the least populous group.
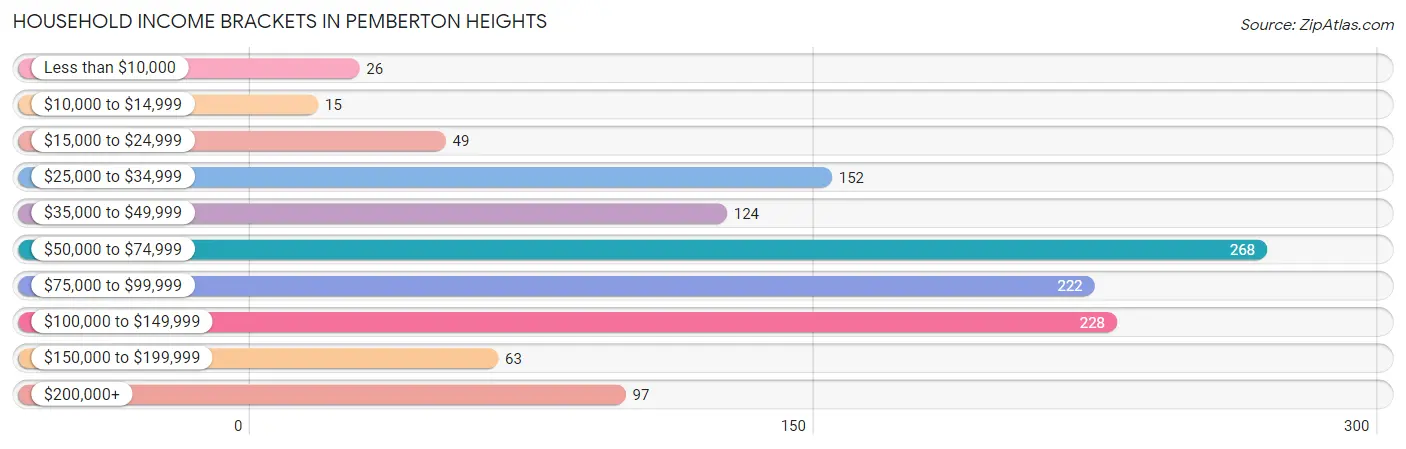
| Income Bracket | # Households | % Households |
| Less than $10,000 | 26 | 2.1% |
| $10,000 to $14,999 | 15 | 1.2% |
| $15,000 to $24,999 | 49 | 3.9% |
| $25,000 to $34,999 | 152 | 12.2% |
| $35,000 to $49,999 | 124 | 10.0% |
| $50,000 to $74,999 | 268 | 21.5% |
| $75,000 to $99,999 | 222 | 17.8% |
| $100,000 to $149,999 | 228 | 18.3% |
| $150,000 to $199,999 | 63 | 5.1% |
| $200,000+ | 97 | 7.8% |
Household Income by Householder Age in Pemberton Heights
The median household income in Pemberton Heights is $73,798, with the highest median household income of $96,136 found in the 45 to 64 years age bracket for the primary householder. A total of 344 households (27.6%) fall into this category. Meanwhile, the 15 to 24 years age bracket for the primary householder has the lowest median household income of $61,146, with 108 households (8.7%) in this group.
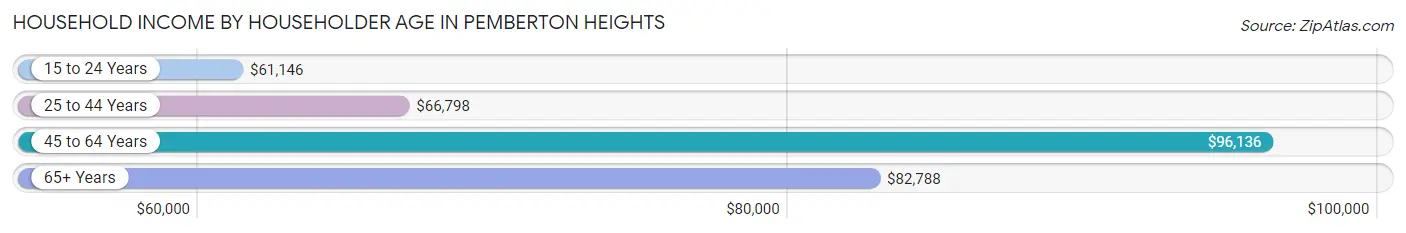
| Income Bracket | # Households | Median Income |
| 15 to 24 Years | 108 (8.7%) | $61,146 |
| 25 to 44 Years | 470 (37.8%) | $66,798 |
| 45 to 64 Years | 344 (27.6%) | $96,136 |
| 65+ Years | 323 (25.9%) | $82,788 |
| Total | 1,245 (100.0%) | $73,798 |
Poverty in Pemberton Heights
Income Below Poverty by Sex and Age in Pemberton Heights
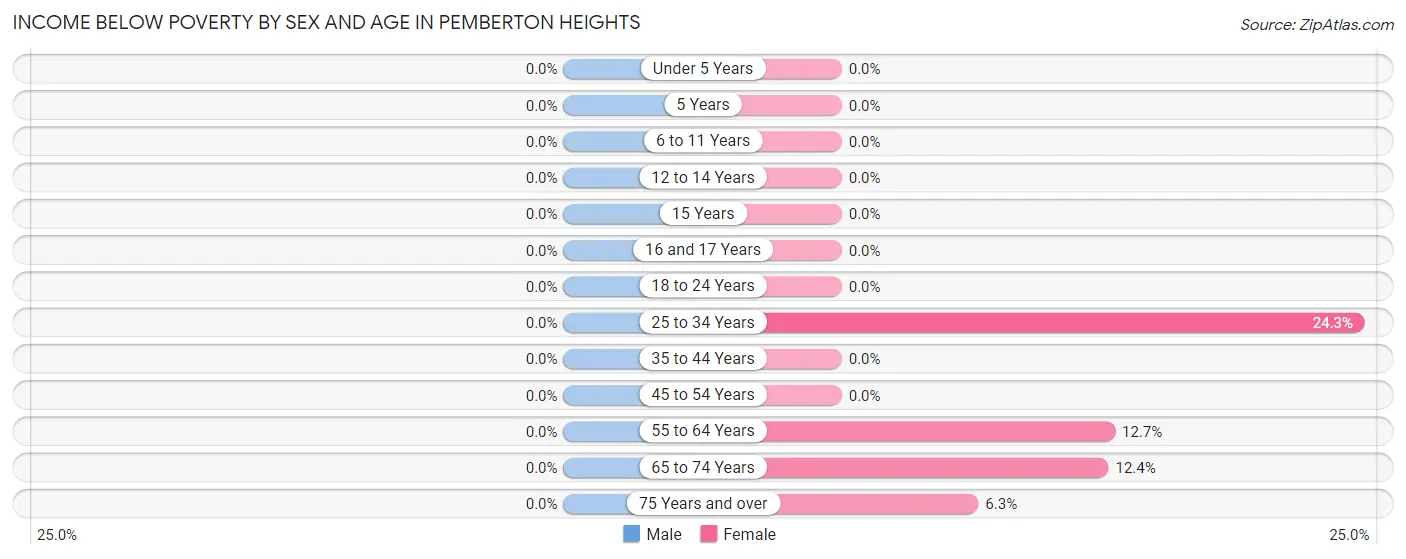
| Age Bracket | Male | Female |
| Under 5 Years | 0 (0.0%) | 0 (0.0%) |
| 5 Years | 0 (0.0%) | 0 (0.0%) |
| 6 to 11 Years | 0 (0.0%) | 0 (0.0%) |
| 12 to 14 Years | 0 (0.0%) | 0 (0.0%) |
| 15 Years | 0 (0.0%) | 0 (0.0%) |
| 16 and 17 Years | 0 (0.0%) | 0 (0.0%) |
| 18 to 24 Years | 0 (0.0%) | 0 (0.0%) |
| 25 to 34 Years | 0 (0.0%) | 100 (24.3%) |
| 35 to 44 Years | 0 (0.0%) | 0 (0.0%) |
| 45 to 54 Years | 0 (0.0%) | 0 (0.0%) |
| 55 to 64 Years | 0 (0.0%) | 35 (12.7%) |
| 65 to 74 Years | 0 (0.0%) | 13 (12.4%) |
| 75 Years and over | 0 (0.0%) | 13 (6.3%) |
| Total | 0 (0.0%) | 161 (11.4%) |
Income Above Poverty by Sex and Age in Pemberton Heights
According to the poverty statistics in Pemberton Heights, males aged under 5 years and females aged under 5 years are the age groups that are most secure financially, with 100.0% of males and 100.0% of females in these age groups living above the poverty line.
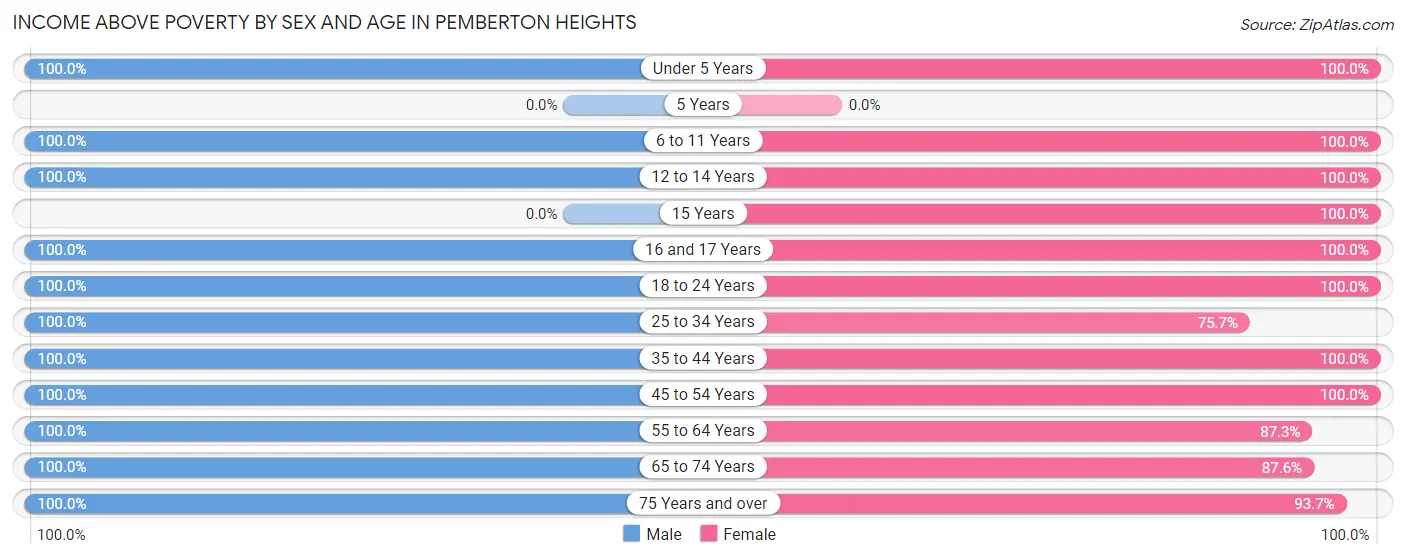
| Age Bracket | Male | Female |
| Under 5 Years | 108 (100.0%) | 50 (100.0%) |
| 5 Years | 0 (0.0%) | 0 (0.0%) |
| 6 to 11 Years | 51 (100.0%) | 24 (100.0%) |
| 12 to 14 Years | 38 (100.0%) | 20 (100.0%) |
| 15 Years | 0 (0.0%) | 38 (100.0%) |
| 16 and 17 Years | 18 (100.0%) | 34 (100.0%) |
| 18 to 24 Years | 216 (100.0%) | 55 (100.0%) |
| 25 to 34 Years | 206 (100.0%) | 312 (75.7%) |
| 35 to 44 Years | 150 (100.0%) | 58 (100.0%) |
| 45 to 54 Years | 120 (100.0%) | 140 (100.0%) |
| 55 to 64 Years | 209 (100.0%) | 241 (87.3%) |
| 65 to 74 Years | 79 (100.0%) | 92 (87.6%) |
| 75 Years and over | 138 (100.0%) | 192 (93.7%) |
| Total | 1,333 (100.0%) | 1,256 (88.6%) |
Income Below Poverty Among Married-Couple Families in Pemberton Heights
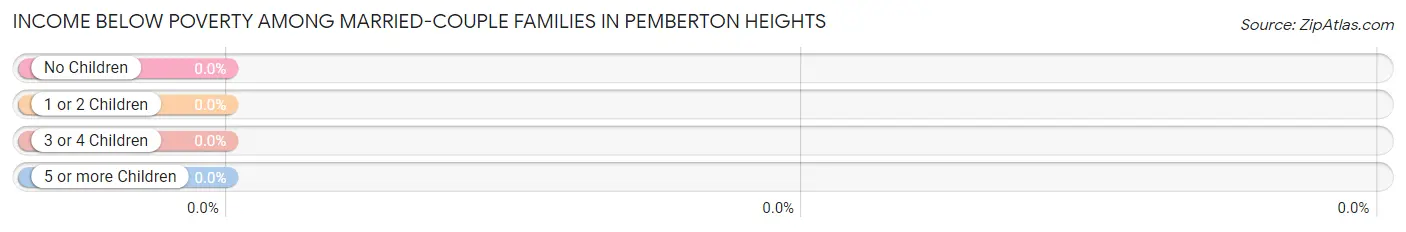
| Children | Above Poverty | Below Poverty |
| No Children | 280 (100.0%) | 0 (0.0%) |
| 1 or 2 Children | 66 (100.0%) | 0 (0.0%) |
| 3 or 4 Children | 10 (100.0%) | 0 (0.0%) |
| 5 or more Children | 0 (0.0%) | 0 (0.0%) |
| Total | 356 (100.0%) | 0 (0.0%) |
Income Below Poverty Among Single-Parent Households in Pemberton Heights
| Children | Single Father | Single Mother |
| No Children | 0 (0.0%) | 0 (0.0%) |
| 1 or 2 Children | 0 (0.0%) | 0 (0.0%) |
| 3 or 4 Children | 0 (0.0%) | 0 (0.0%) |
| 5 or more Children | 0 (0.0%) | 0 (0.0%) |
| Total | 0 (0.0%) | 0 (0.0%) |
Income Below Poverty Among Married-Couple vs Single-Parent Households in Pemberton Heights
| Children | Married-Couple Families | Single-Parent Households |
| No Children | 0 (0.0%) | 0 (0.0%) |
| 1 or 2 Children | 0 (0.0%) | 0 (0.0%) |
| 3 or 4 Children | 0 (0.0%) | 0 (0.0%) |
| 5 or more Children | 0 (0.0%) | 0 (0.0%) |
| Total | 0 (0.0%) | 0 (0.0%) |
Race in Pemberton Heights
The most populous races in Pemberton Heights are Black / African American (1,332 | 48.0%), White / Caucasian (1,011 | 36.4%), and Two or more Races (257 | 9.3%).
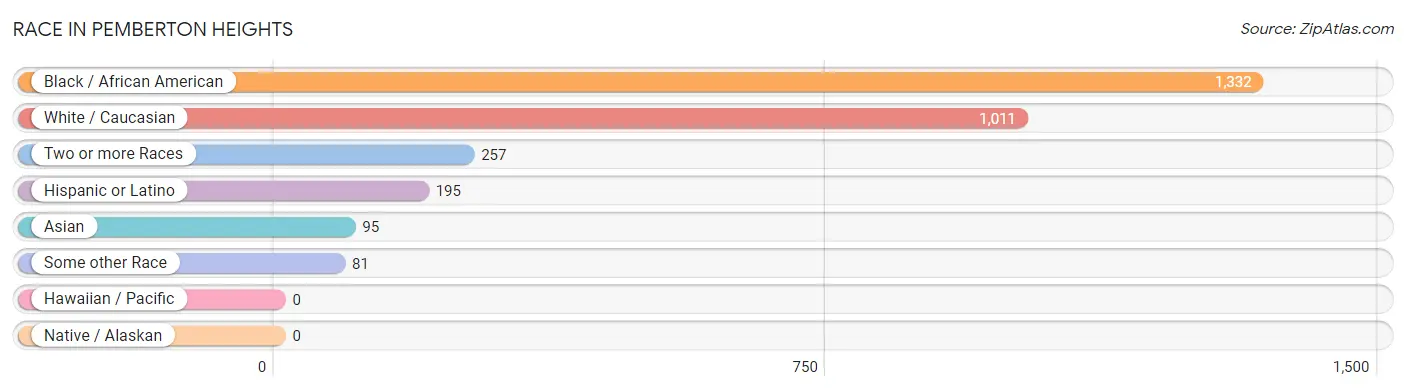
| Race | # Population | % Population |
| Asian | 95 | 3.4% |
| Black / African American | 1,332 | 48.0% |
| Hawaiian / Pacific | 0 | 0.0% |
| Hispanic or Latino | 195 | 7.0% |
| Native / Alaskan | 0 | 0.0% |
| White / Caucasian | 1,011 | 36.4% |
| Two or more Races | 257 | 9.3% |
| Some other Race | 81 | 2.9% |
| Total | 2,776 | 100.0% |
Ancestry in Pemberton Heights
The most populous ancestries reported in Pemberton Heights are German (278 | 10.0%), Irish (138 | 5.0%), Subsaharan African (130 | 4.7%), Italian (125 | 4.5%), and French (120 | 4.3%), together accounting for 28.5% of all Pemberton Heights residents.
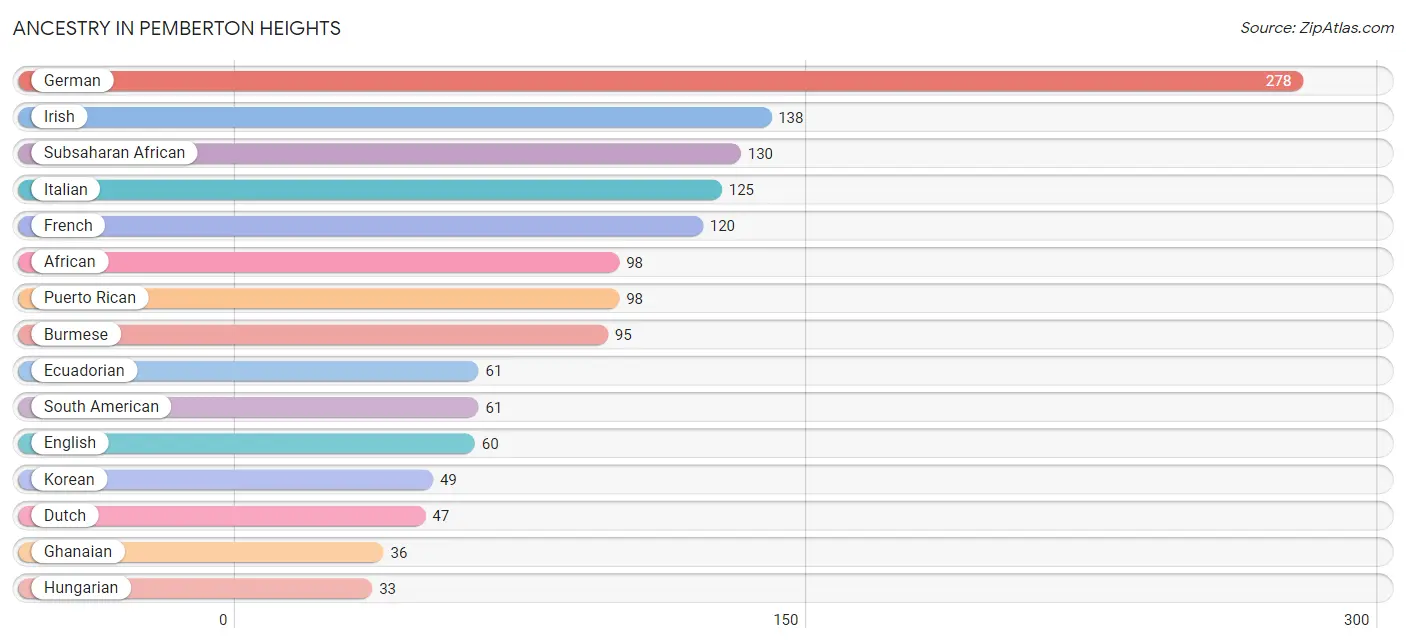
| Ancestry | # Population | % Population |
| African | 98 | 3.5% |
| American | 13 | 0.5% |
| Arab | 20 | 0.7% |
| Burmese | 95 | 3.4% |
| Cape Verdean | 20 | 0.7% |
| Central American | 23 | 0.8% |
| Cherokee | 16 | 0.6% |
| Creek | 16 | 0.6% |
| Dutch | 47 | 1.7% |
| Ecuadorian | 61 | 2.2% |
| Egyptian | 20 | 0.7% |
| English | 60 | 2.2% |
| European | 28 | 1.0% |
| French | 120 | 4.3% |
| German | 278 | 10.0% |
| Ghanaian | 36 | 1.3% |
| Greek | 14 | 0.5% |
| Hungarian | 33 | 1.2% |
| Indian (Asian) | 6 | 0.2% |
| Irish | 138 | 5.0% |
| Italian | 125 | 4.5% |
| Korean | 49 | 1.8% |
| Mexican | 13 | 0.5% |
| Norwegian | 15 | 0.5% |
| Panamanian | 23 | 0.8% |
| Pennsylvania German | 13 | 0.5% |
| Polish | 20 | 0.7% |
| Puerto Rican | 98 | 3.5% |
| Russian | 24 | 0.9% |
| Scottish | 9 | 0.3% |
| South American | 61 | 2.2% |
| Subsaharan African | 130 | 4.7% |
| Trinidadian and Tobagonian | 26 | 0.9% | View All 33 Rows |
Immigrants in Pemberton Heights
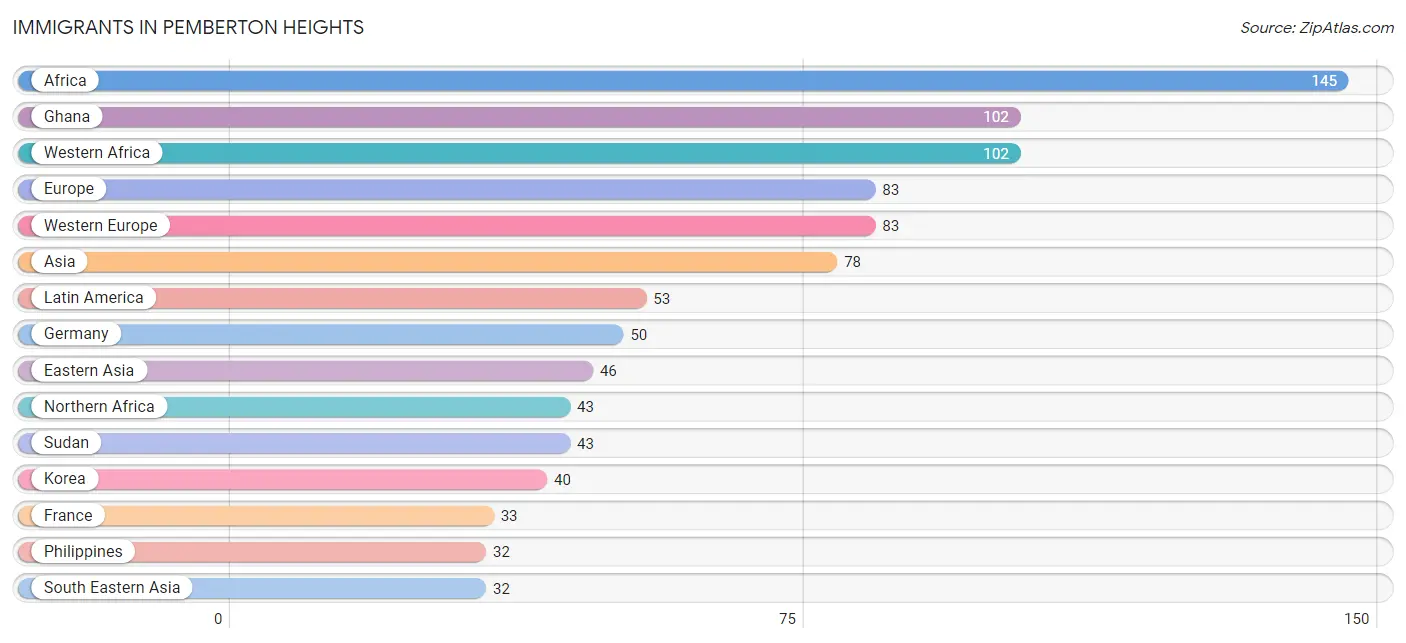
The most numerous immigrant groups reported in Pemberton Heights came from Africa (145 | 5.2%), Ghana (102 | 3.7%), Western Africa (102 | 3.7%), Europe (83 | 3.0%), and Western Europe (83 | 3.0%), together accounting for 18.5% of all Pemberton Heights residents.
| Immigration Origin | # Population | % Population |
| Africa | 145 | 5.2% |
| Asia | 78 | 2.8% |
| Central America | 23 | 0.8% |
| China | 6 | 0.2% |
| Eastern Asia | 46 | 1.7% |
| Ecuador | 30 | 1.1% |
| Europe | 83 | 3.0% |
| France | 33 | 1.2% |
| Germany | 50 | 1.8% |
| Ghana | 102 | 3.7% |
| Korea | 40 | 1.4% |
| Latin America | 53 | 1.9% |
| Northern Africa | 43 | 1.5% |
| Panama | 23 | 0.8% |
| Philippines | 32 | 1.1% |
| South America | 30 | 1.1% |
| South Eastern Asia | 32 | 1.1% |
| Sudan | 43 | 1.5% |
| Western Africa | 102 | 3.7% |
| Western Europe | 83 | 3.0% | View All 20 Rows |
Sex and Age in Pemberton Heights
Sex and Age in Pemberton Heights
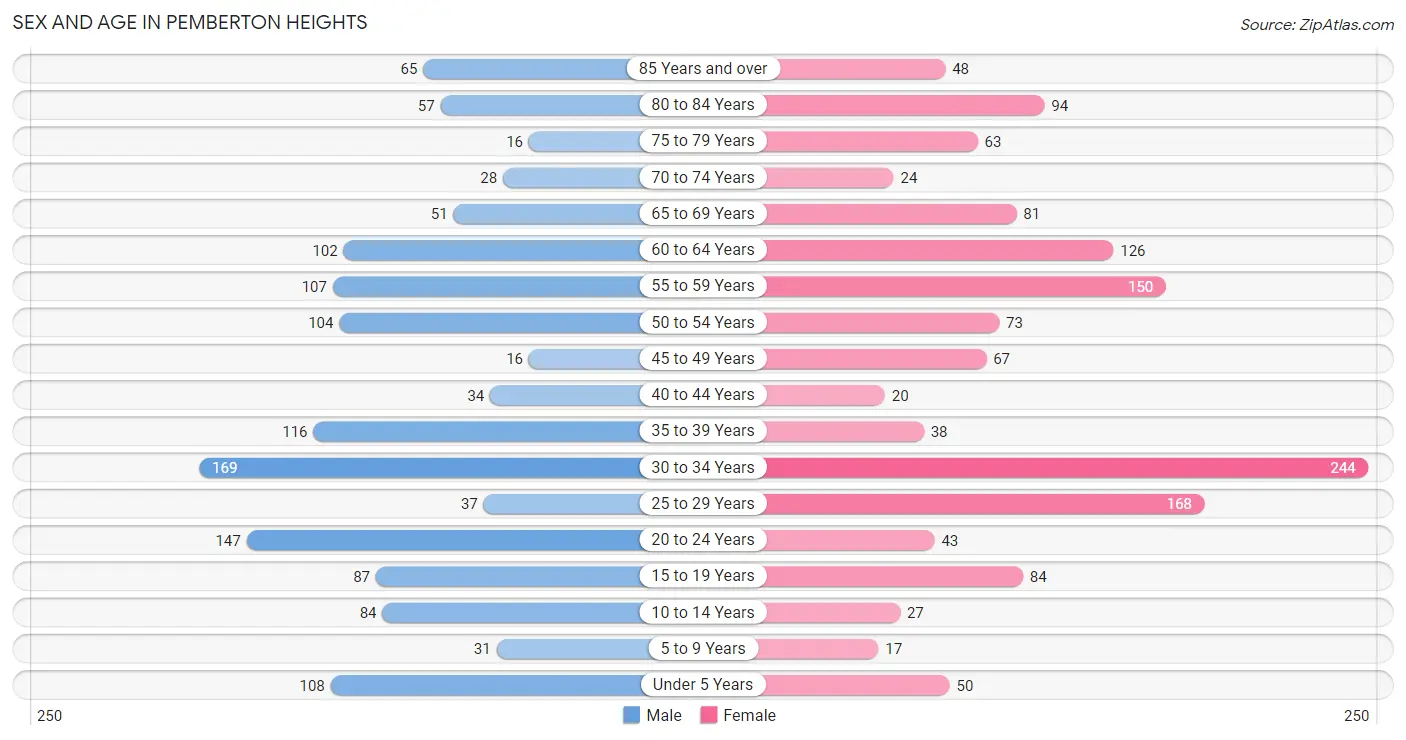
The most populous age groups in Pemberton Heights are 30 to 34 Years (169 | 12.4%) for men and 30 to 34 Years (244 | 17.2%) for women.
| Age Bracket | Male | Female |
| Under 5 Years | 108 (8.0%) | 50 (3.5%) |
| 5 to 9 Years | 31 (2.3%) | 17 (1.2%) |
| 10 to 14 Years | 84 (6.2%) | 27 (1.9%) |
| 15 to 19 Years | 87 (6.4%) | 84 (5.9%) |
| 20 to 24 Years | 147 (10.8%) | 43 (3.0%) |
| 25 to 29 Years | 37 (2.7%) | 168 (11.9%) |
| 30 to 34 Years | 169 (12.4%) | 244 (17.2%) |
| 35 to 39 Years | 116 (8.5%) | 38 (2.7%) |
| 40 to 44 Years | 34 (2.5%) | 20 (1.4%) |
| 45 to 49 Years | 16 (1.2%) | 67 (4.7%) |
| 50 to 54 Years | 104 (7.6%) | 73 (5.1%) |
| 55 to 59 Years | 107 (7.9%) | 150 (10.6%) |
| 60 to 64 Years | 102 (7.5%) | 126 (8.9%) |
| 65 to 69 Years | 51 (3.7%) | 81 (5.7%) |
| 70 to 74 Years | 28 (2.1%) | 24 (1.7%) |
| 75 to 79 Years | 16 (1.2%) | 63 (4.4%) |
| 80 to 84 Years | 57 (4.2%) | 94 (6.6%) |
| 85 Years and over | 65 (4.8%) | 48 (3.4%) |
| Total | 1,359 (100.0%) | 1,417 (100.0%) |
Families and Households in Pemberton Heights
Median Family Size in Pemberton Heights
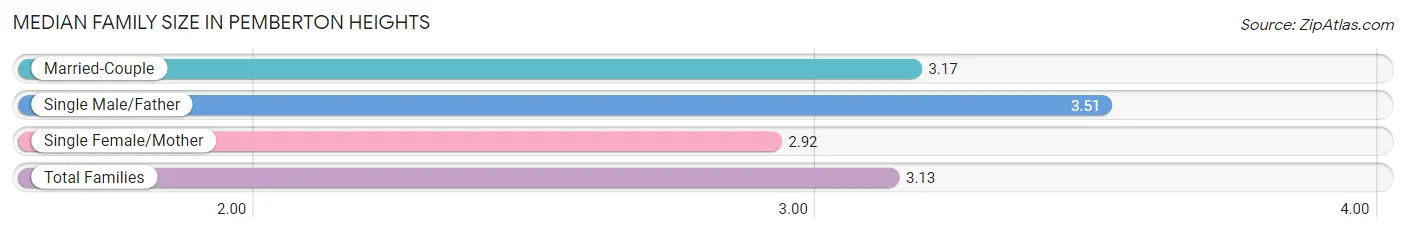
The median family size in Pemberton Heights is 3.13 persons per family, with single male/father families (69 | 11.2%) accounting for the largest median family size of 3.51 persons per family. On the other hand, single female/mother families (192 | 31.1%) represent the smallest median family size with 2.92 persons per family.
| Family Type | # Families | Family Size |
| Married-Couple | 356 (57.7%) | 3.17 |
| Single Male/Father | 69 (11.2%) | 3.51 |
| Single Female/Mother | 192 (31.1%) | 2.92 |
| Total Families | 617 (100.0%) | 3.13 |
Median Household Size in Pemberton Heights
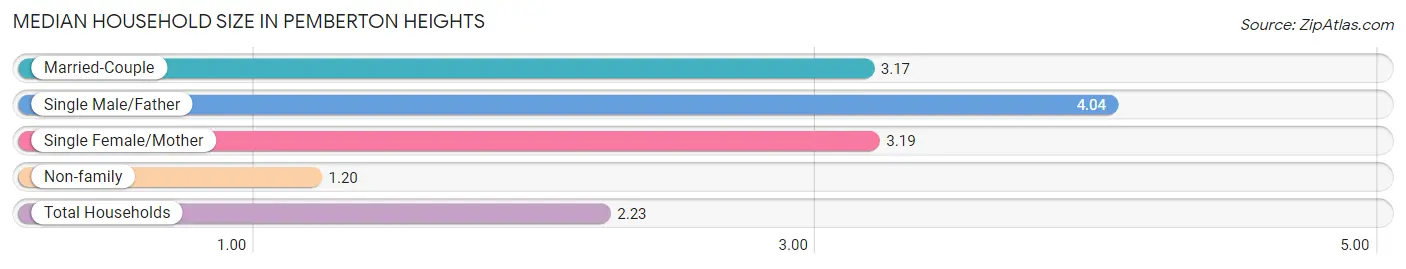
The median household size in Pemberton Heights is 2.23 persons per household, with single male/father households (69 | 5.5%) accounting for the largest median household size of 4.04 persons per household. non-family households (628 | 50.4%) represent the smallest median household size with 1.20 persons per household.
| Household Type | # Households | Household Size |
| Married-Couple | 356 (28.6%) | 3.17 |
| Single Male/Father | 69 (5.5%) | 4.04 |
| Single Female/Mother | 192 (15.4%) | 3.19 |
| Non-family | 628 (50.4%) | 1.20 |
| Total Households | 1,245 (100.0%) | 2.23 |
Household Size by Marriage Status in Pemberton Heights
Out of a total of 1,245 households in Pemberton Heights, 617 (49.6%) are family households, while 628 (50.4%) are nonfamily households. The most numerous type of family households are 2-person households, comprising 278, and the most common type of nonfamily households are 1-person households, comprising 499.
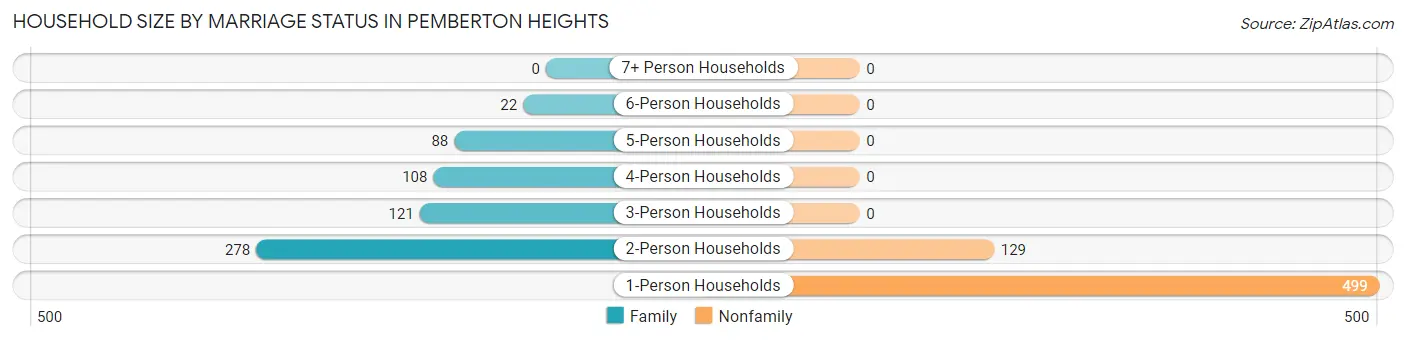
| Household Size | Family Households | Nonfamily Households |
| 1-Person Households | - | 499 (40.1%) |
| 2-Person Households | 278 (22.3%) | 129 (10.4%) |
| 3-Person Households | 121 (9.7%) | 0 (0.0%) |
| 4-Person Households | 108 (8.7%) | 0 (0.0%) |
| 5-Person Households | 88 (7.1%) | 0 (0.0%) |
| 6-Person Households | 22 (1.8%) | 0 (0.0%) |
| 7+ Person Households | 0 (0.0%) | 0 (0.0%) |
| Total | 617 (49.6%) | 628 (50.4%) |
Female Fertility in Pemberton Heights
Fertility by Age in Pemberton Heights
Average fertility rate in Pemberton Heights is 134.0 births per 1,000 women. Women in the age bracket of 20 to 34 years have the highest fertility rate with 196.0 births per 1,000 women. Women in the age bracket of 20 to 34 years acount for 100.0% of all women with births.
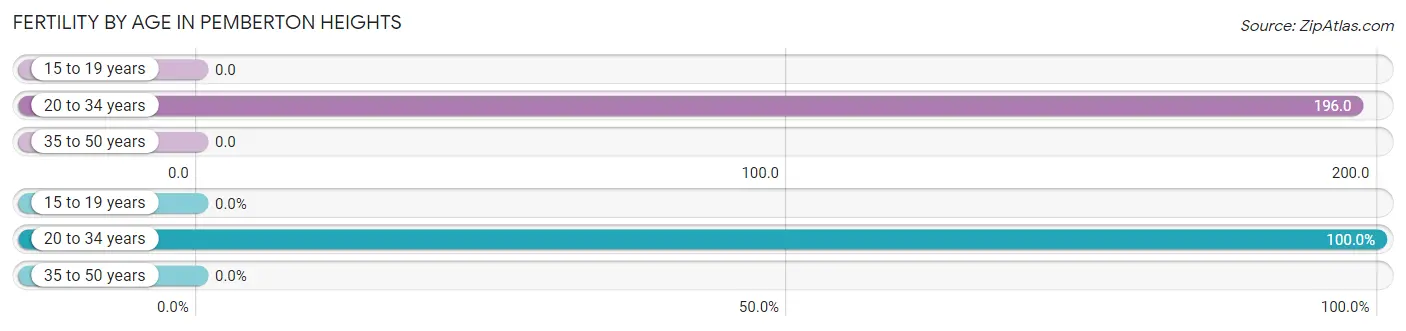
| Age Bracket | Women with Births | Births / 1,000 Women |
| 15 to 19 years | 0 (0.0%) | 0.0 |
| 20 to 34 years | 89 (100.0%) | 196.0 |
| 35 to 50 years | 0 (0.0%) | 0.0 |
| Total | 89 (100.0%) | 134.0 |
Fertility by Age by Marriage Status in Pemberton Heights
25.8% of women with births (89) in Pemberton Heights are married. The highest percentage of unmarried women with births falls into 20 to 34 years age bracket with 74.2% of them unmarried at the time of birth, while the lowest percentage of unmarried women with births belong to 20 to 34 years age bracket with 74.2% of them unmarried.
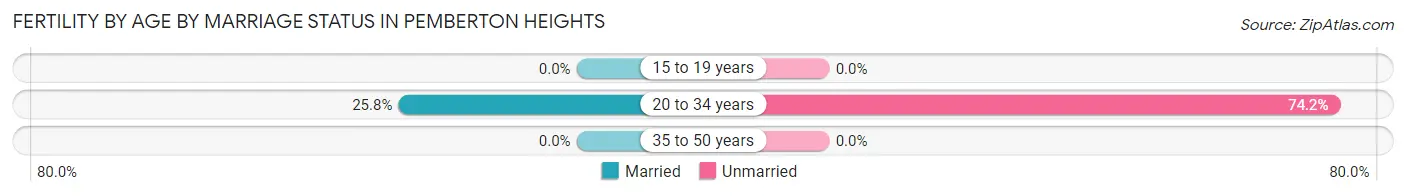
| Age Bracket | Married | Unmarried |
| 15 to 19 years | 0 (0.0%) | 0 (0.0%) |
| 20 to 34 years | 23 (25.8%) | 66 (74.2%) |
| 35 to 50 years | 0 (0.0%) | 0 (0.0%) |
| Total | 23 (25.8%) | 66 (74.2%) |
Fertility by Education in Pemberton Heights
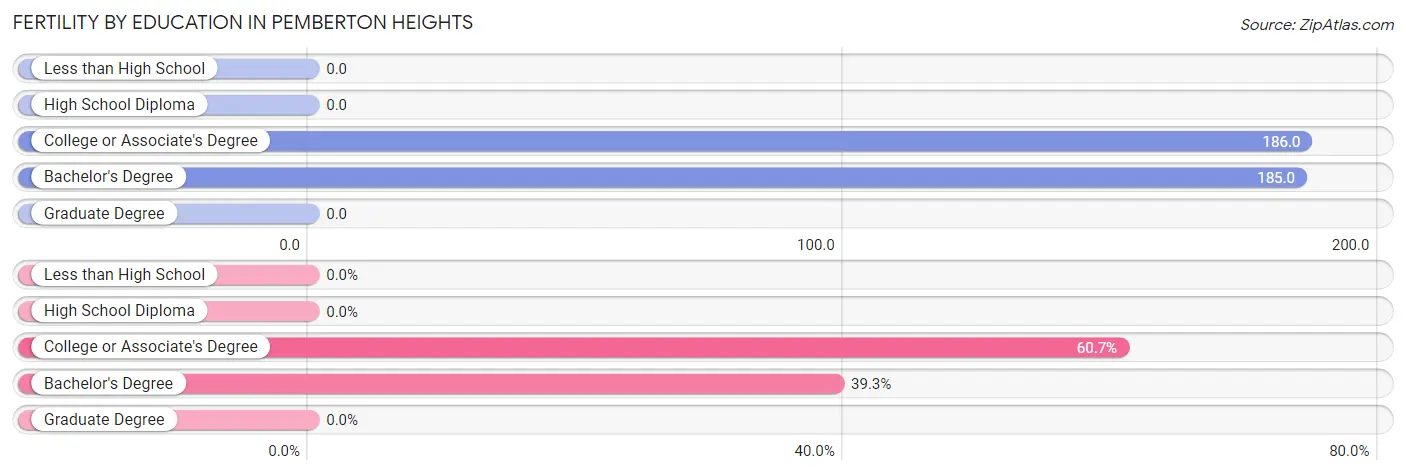
| Educational Attainment | Women with Births | Births / 1,000 Women |
| Less than High School | 0 (0.0%) | 0.0 |
| High School Diploma | 0 (0.0%) | 0.0 |
| College or Associate's Degree | 54 (60.7%) | 186.0 |
| Bachelor's Degree | 35 (39.3%) | 185.0 |
| Graduate Degree | 0 (0.0%) | 0.0 |
| Total | 89 (100.0%) | 134.0 |
Fertility by Education by Marriage Status in Pemberton Heights
74.2% of women with births in Pemberton Heights are unmarried. Women with the educational attainment of college or associate's degree are most likely to be married with 42.6% of them married at childbirth, while women with the educational attainment of bachelor's degree are least likely to be married with 100.0% of them unmarried at childbirth.
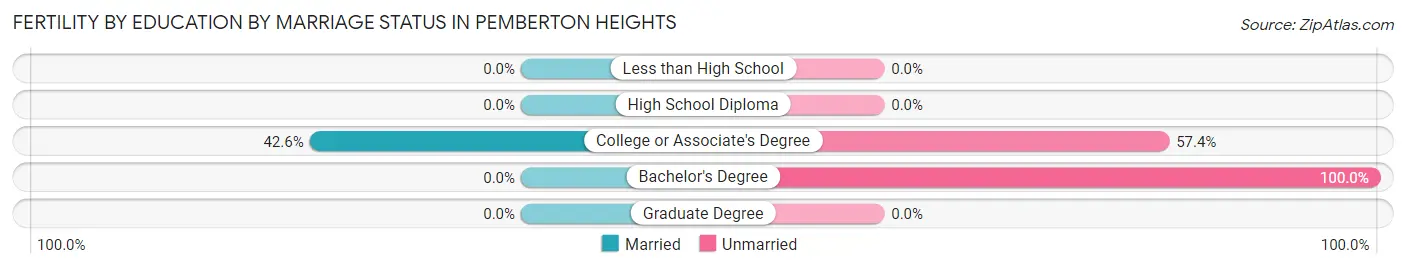
| Educational Attainment | Married | Unmarried |
| Less than High School | 0 (0.0%) | 0 (0.0%) |
| High School Diploma | 0 (0.0%) | 0 (0.0%) |
| College or Associate's Degree | 23 (42.6%) | 31 (57.4%) |
| Bachelor's Degree | 0 (0.0%) | 35 (100.0%) |
| Graduate Degree | 0 (0.0%) | 0 (0.0%) |
| Total | 23 (25.8%) | 66 (74.2%) |
Employment Characteristics in Pemberton Heights
Employment by Class of Employer in Pemberton Heights
Among the 1,504 employed individuals in Pemberton Heights, private company employees (817 | 54.3%), local government employees (252 | 16.8%), and state government employees (203 | 13.5%) make up the most common classes of employment.
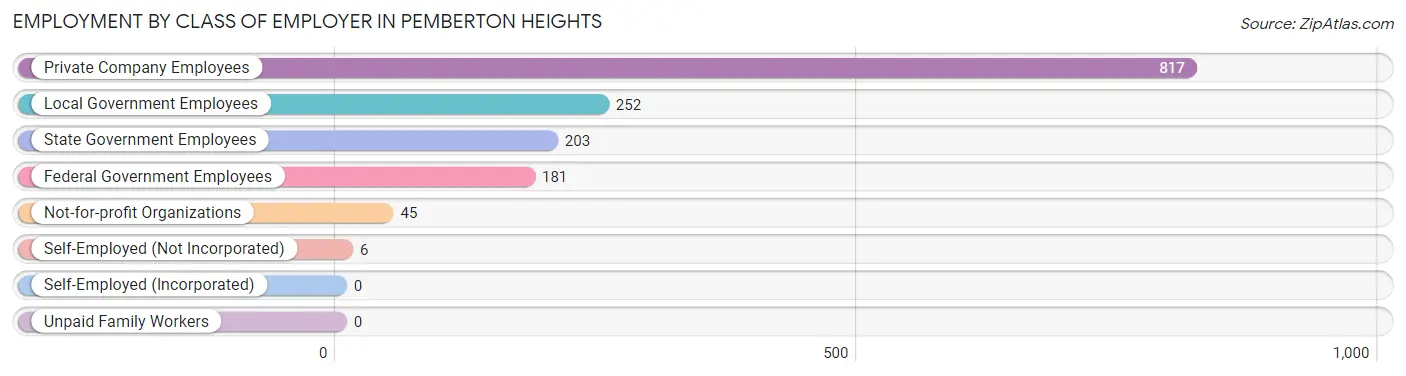
| Employer Class | # Employees | % Employees |
| Private Company Employees | 817 | 54.3% |
| Self-Employed (Incorporated) | 0 | 0.0% |
| Self-Employed (Not Incorporated) | 6 | 0.4% |
| Not-for-profit Organizations | 45 | 3.0% |
| Local Government Employees | 252 | 16.8% |
| State Government Employees | 203 | 13.5% |
| Federal Government Employees | 181 | 12.0% |
| Unpaid Family Workers | 0 | 0.0% |
| Total | 1,504 | 100.0% |
Employment Status by Age in Pemberton Heights
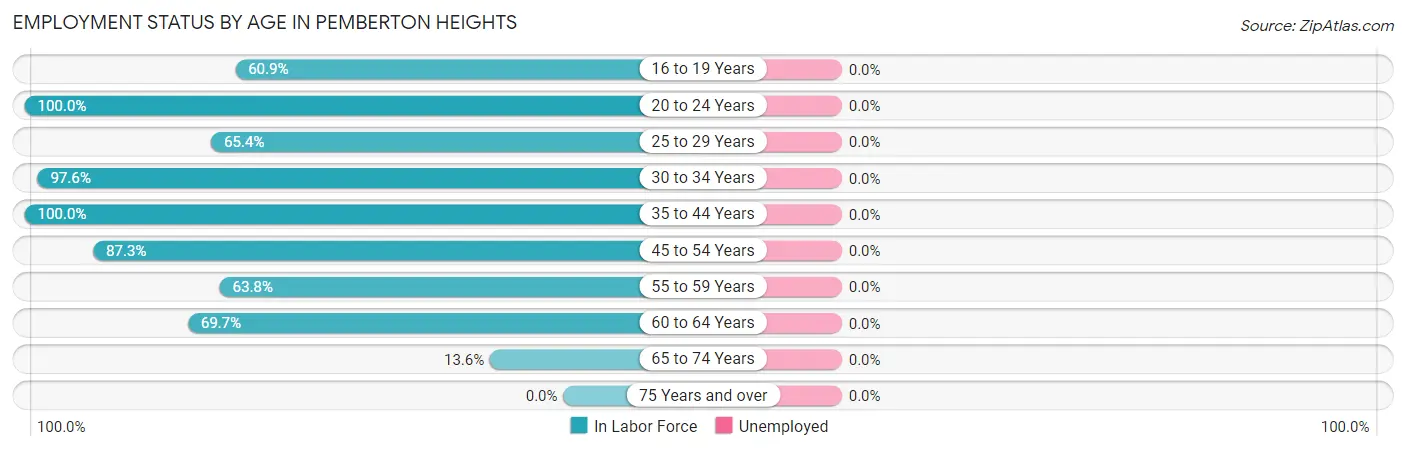
| Age Bracket | In Labor Force | Unemployed |
| 16 to 19 Years | 81 (60.9%) | 0 (0.0%) |
| 20 to 24 Years | 190 (100.0%) | 0 (0.0%) |
| 25 to 29 Years | 134 (65.4%) | 0 (0.0%) |
| 30 to 34 Years | 403 (97.6%) | 0 (0.0%) |
| 35 to 44 Years | 208 (100.0%) | 0 (0.0%) |
| 45 to 54 Years | 227 (87.3%) | 0 (0.0%) |
| 55 to 59 Years | 164 (63.8%) | 0 (0.0%) |
| 60 to 64 Years | 159 (69.7%) | 0 (0.0%) |
| 65 to 74 Years | 25 (13.6%) | 0 (0.0%) |
| 75 Years and over | 0 (0.0%) | 0 (0.0%) |
| Total | 1,591 (65.7%) | 0 (0.0%) |
Employment Status by Educational Attainment in Pemberton Heights
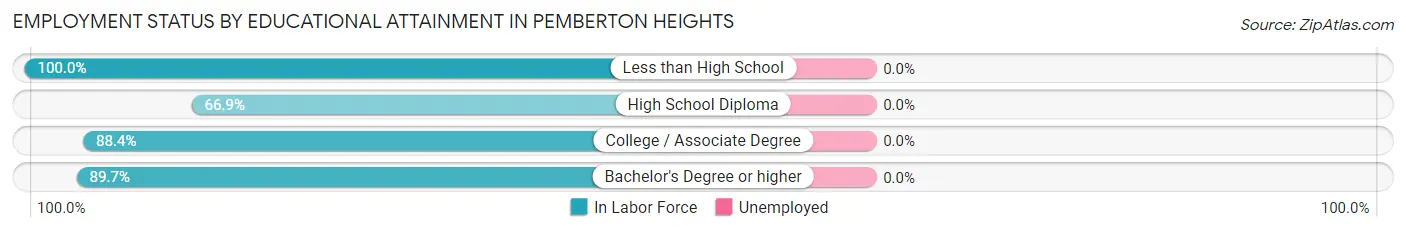
| Educational Attainment | In Labor Force | Unemployed |
| Less than High School | 13 (100.0%) | 0 (0.0%) |
| High School Diploma | 318 (66.9%) | 0 (0.0%) |
| College / Associate Degree | 493 (88.4%) | 0 (0.0%) |
| Bachelor's Degree or higher | 471 (89.7%) | 0 (0.0%) |
| Total | 1,295 (82.4%) | 0 (0.0%) |
Employment Occupations by Sex in Pemberton Heights
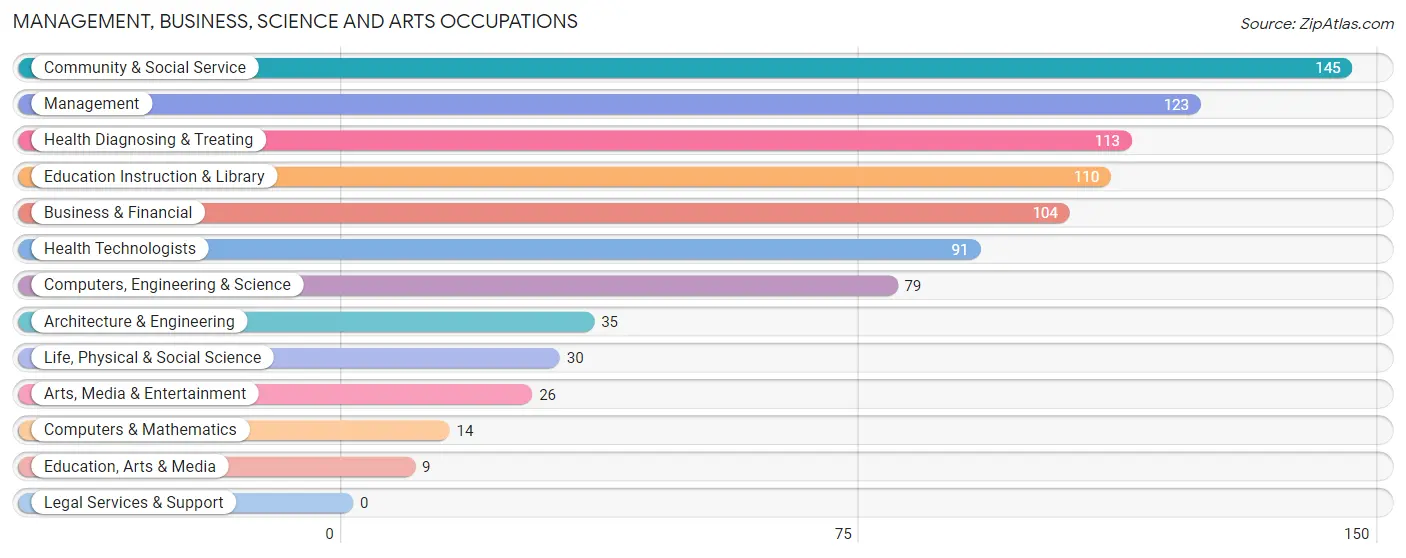
Management, Business, Science and Arts Occupations
The most common Management, Business, Science and Arts occupations in Pemberton Heights are Community & Social Service (145 | 9.8%), Management (123 | 8.3%), Health Diagnosing & Treating (113 | 7.6%), Education Instruction & Library (110 | 7.4%), and Business & Financial (104 | 7.0%).
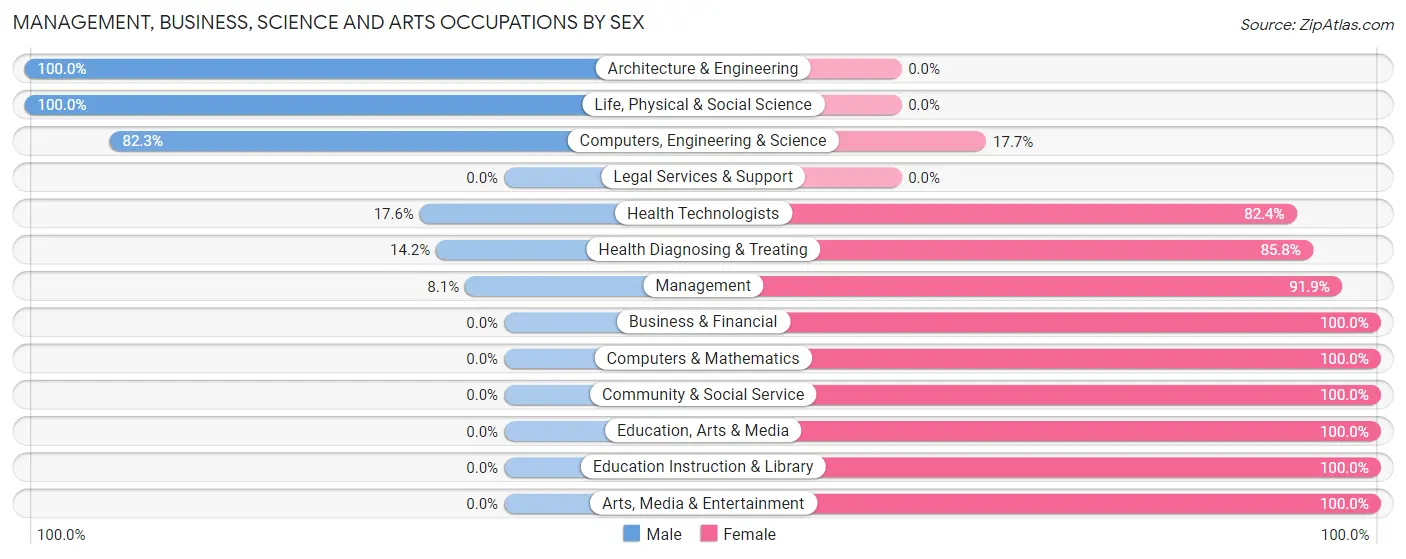
Management, Business, Science and Arts Occupations by Sex
Within the Management, Business, Science and Arts occupations in Pemberton Heights, the most male-oriented occupations are Architecture & Engineering (100.0%), Life, Physical & Social Science (100.0%), and Computers, Engineering & Science (82.3%), while the most female-oriented occupations are Business & Financial (100.0%), Computers & Mathematics (100.0%), and Community & Social Service (100.0%).
| Occupation | Male | Female |
| Management | 10 (8.1%) | 113 (91.9%) |
| Business & Financial | 0 (0.0%) | 104 (100.0%) |
| Computers, Engineering & Science | 65 (82.3%) | 14 (17.7%) |
| Computers & Mathematics | 0 (0.0%) | 14 (100.0%) |
| Architecture & Engineering | 35 (100.0%) | 0 (0.0%) |
| Life, Physical & Social Science | 30 (100.0%) | 0 (0.0%) |
| Community & Social Service | 0 (0.0%) | 145 (100.0%) |
| Education, Arts & Media | 0 (0.0%) | 9 (100.0%) |
| Legal Services & Support | 0 (0.0%) | 0 (0.0%) |
| Education Instruction & Library | 0 (0.0%) | 110 (100.0%) |
| Arts, Media & Entertainment | 0 (0.0%) | 26 (100.0%) |
| Health Diagnosing & Treating | 16 (14.2%) | 97 (85.8%) |
| Health Technologists | 16 (17.6%) | 75 (82.4%) |
| Total (Category) | 91 (16.1%) | 473 (83.9%) |
| Total (Overall) | 691 (46.5%) | 794 (53.5%) |
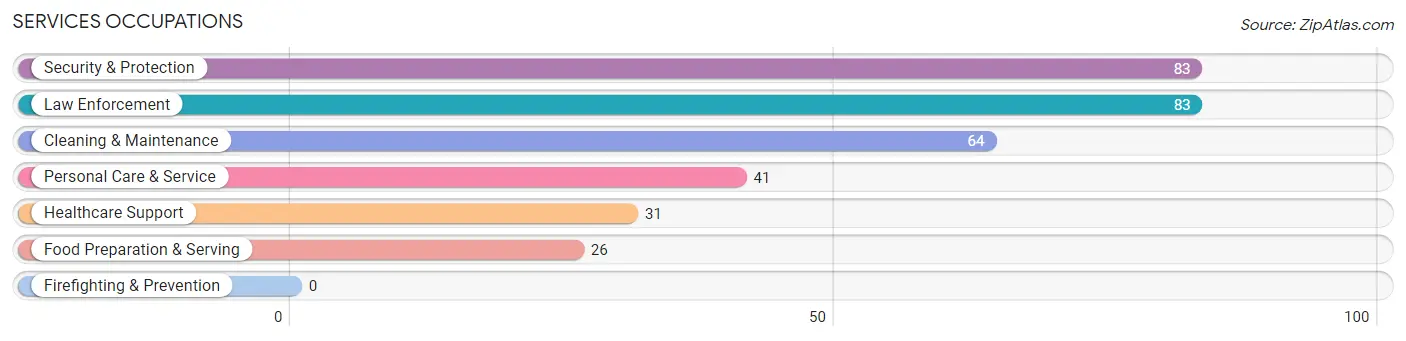
Services Occupations
The most common Services occupations in Pemberton Heights are Security & Protection (83 | 5.6%), Law Enforcement (83 | 5.6%), Cleaning & Maintenance (64 | 4.3%), Personal Care & Service (41 | 2.8%), and Healthcare Support (31 | 2.1%).
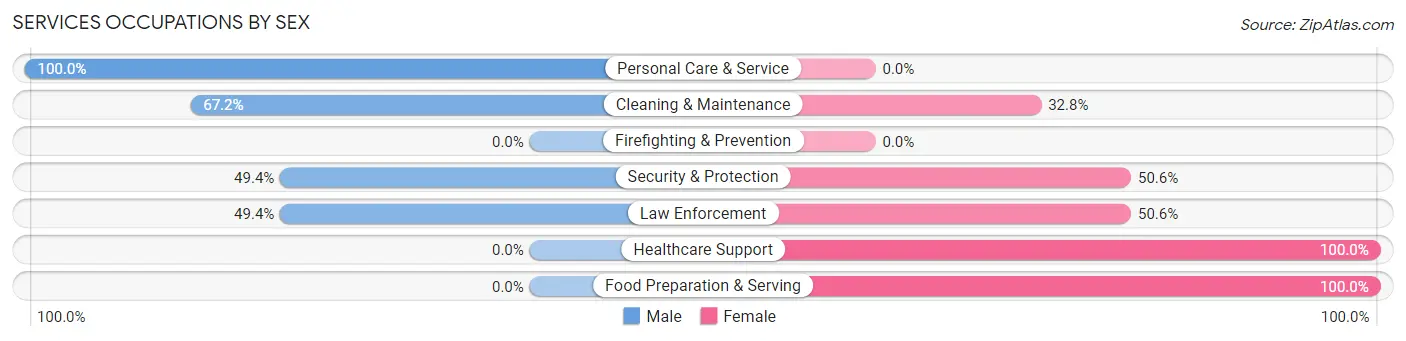
Services Occupations by Sex
Within the Services occupations in Pemberton Heights, the most male-oriented occupations are Personal Care & Service (100.0%), Cleaning & Maintenance (67.2%), and Security & Protection (49.4%), while the most female-oriented occupations are Healthcare Support (100.0%), Food Preparation & Serving (100.0%), and Security & Protection (50.6%).
| Occupation | Male | Female |
| Healthcare Support | 0 (0.0%) | 31 (100.0%) |
| Security & Protection | 41 (49.4%) | 42 (50.6%) |
| Firefighting & Prevention | 0 (0.0%) | 0 (0.0%) |
| Law Enforcement | 41 (49.4%) | 42 (50.6%) |
| Food Preparation & Serving | 0 (0.0%) | 26 (100.0%) |
| Cleaning & Maintenance | 43 (67.2%) | 21 (32.8%) |
| Personal Care & Service | 41 (100.0%) | 0 (0.0%) |
| Total (Category) | 125 (51.0%) | 120 (49.0%) |
| Total (Overall) | 691 (46.5%) | 794 (53.5%) |
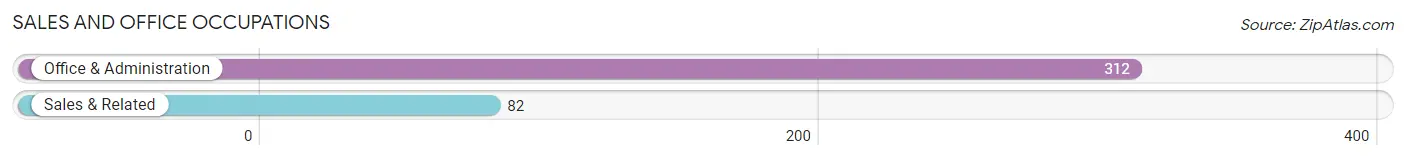
Sales and Office Occupations
The most common Sales and Office occupations in Pemberton Heights are Office & Administration (312 | 21.0%), and Sales & Related (82 | 5.5%).
Sales and Office Occupations by Sex
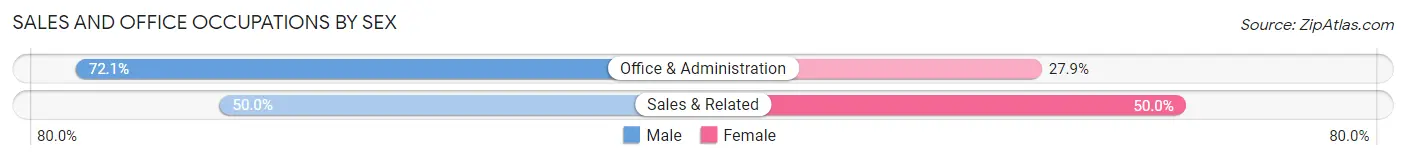
| Occupation | Male | Female |
| Sales & Related | 41 (50.0%) | 41 (50.0%) |
| Office & Administration | 225 (72.1%) | 87 (27.9%) |
| Total (Category) | 266 (67.5%) | 128 (32.5%) |
| Total (Overall) | 691 (46.5%) | 794 (53.5%) |
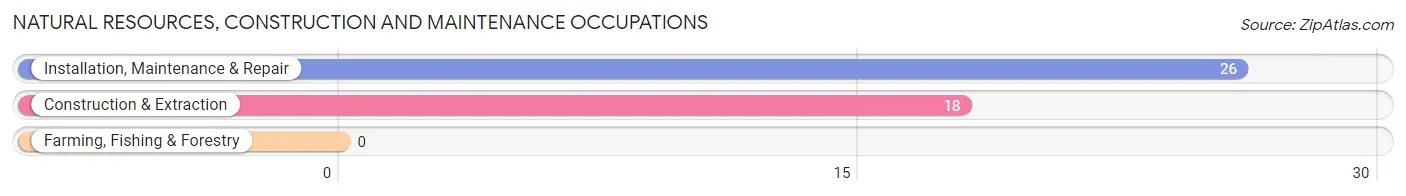
Natural Resources, Construction and Maintenance Occupations
The most common Natural Resources, Construction and Maintenance occupations in Pemberton Heights are Installation, Maintenance & Repair (26 | 1.8%), and Construction & Extraction (18 | 1.2%).
Natural Resources, Construction and Maintenance Occupations by Sex
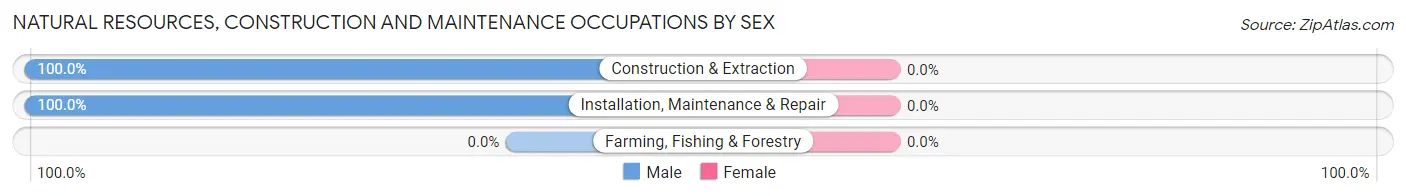
| Occupation | Male | Female |
| Farming, Fishing & Forestry | 0 (0.0%) | 0 (0.0%) |
| Construction & Extraction | 18 (100.0%) | 0 (0.0%) |
| Installation, Maintenance & Repair | 26 (100.0%) | 0 (0.0%) |
| Total (Category) | 44 (100.0%) | 0 (0.0%) |
| Total (Overall) | 691 (46.5%) | 794 (53.5%) |
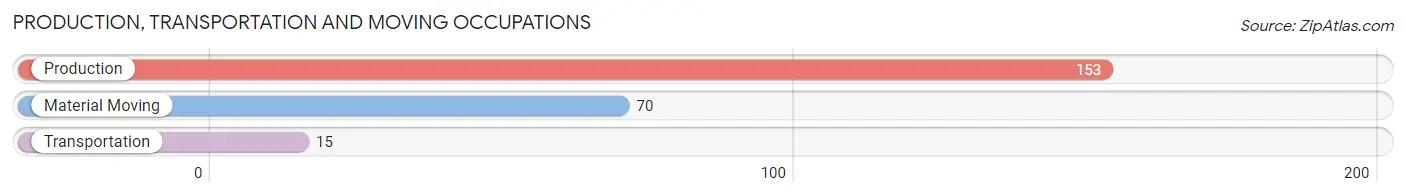
Production, Transportation and Moving Occupations
The most common Production, Transportation and Moving occupations in Pemberton Heights are Production (153 | 10.3%), Material Moving (70 | 4.7%), and Transportation (15 | 1.0%).
Production, Transportation and Moving Occupations by Sex
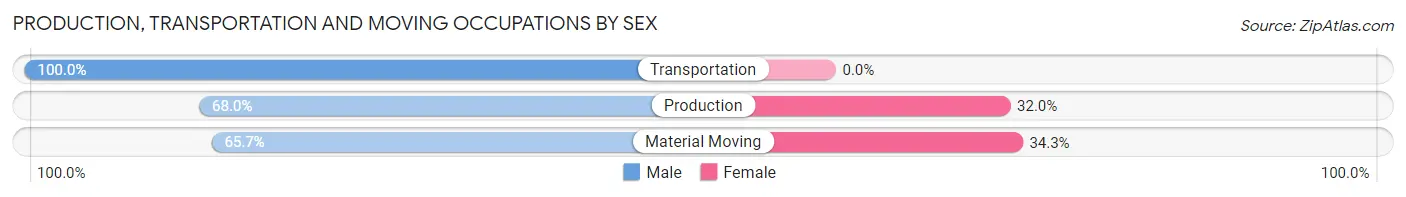
| Occupation | Male | Female |
| Production | 104 (68.0%) | 49 (32.0%) |
| Transportation | 15 (100.0%) | 0 (0.0%) |
| Material Moving | 46 (65.7%) | 24 (34.3%) |
| Total (Category) | 165 (69.3%) | 73 (30.7%) |
| Total (Overall) | 691 (46.5%) | 794 (53.5%) |
Employment Industries by Sex in Pemberton Heights
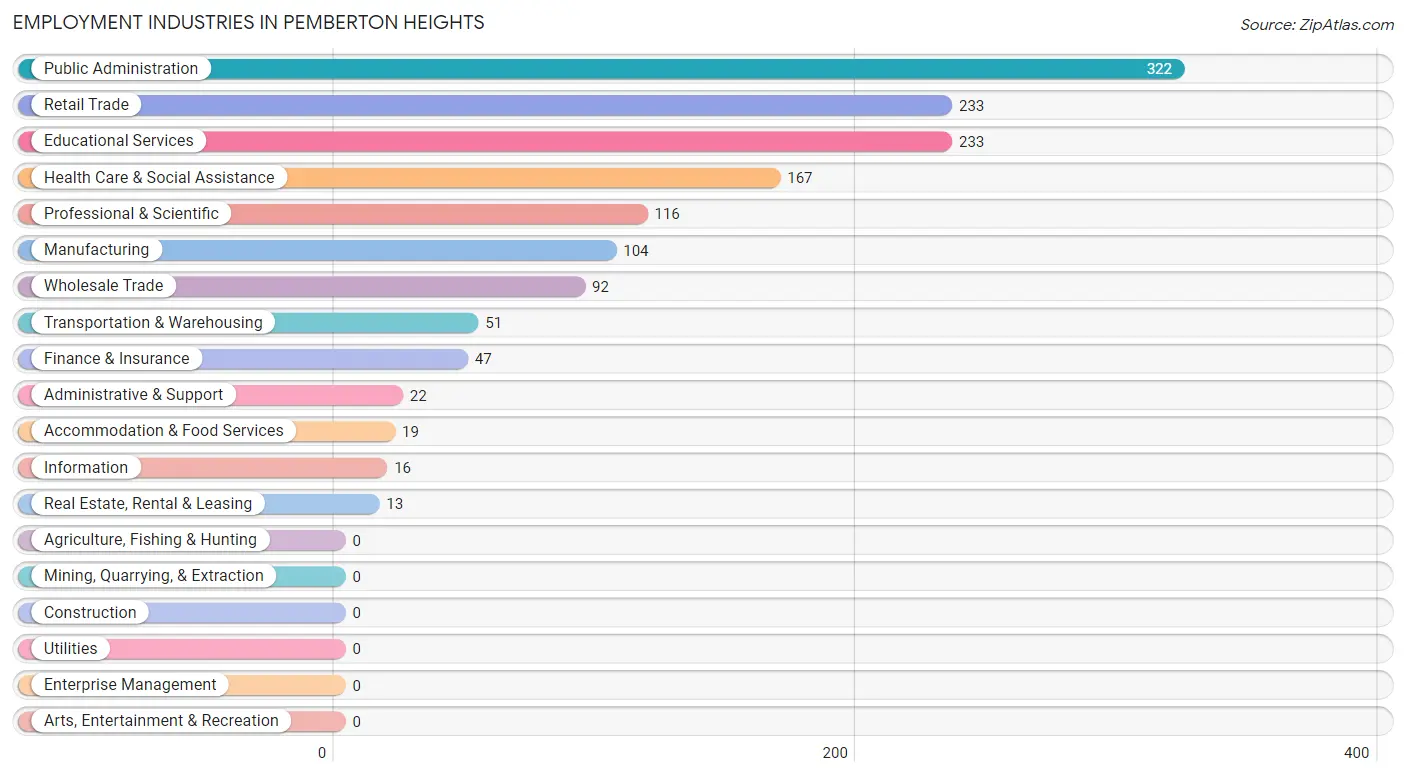
Employment Industries in Pemberton Heights
The major employment industries in Pemberton Heights include Public Administration (322 | 21.7%), Retail Trade (233 | 15.7%), Educational Services (233 | 15.7%), Health Care & Social Assistance (167 | 11.3%), and Professional & Scientific (116 | 7.8%).
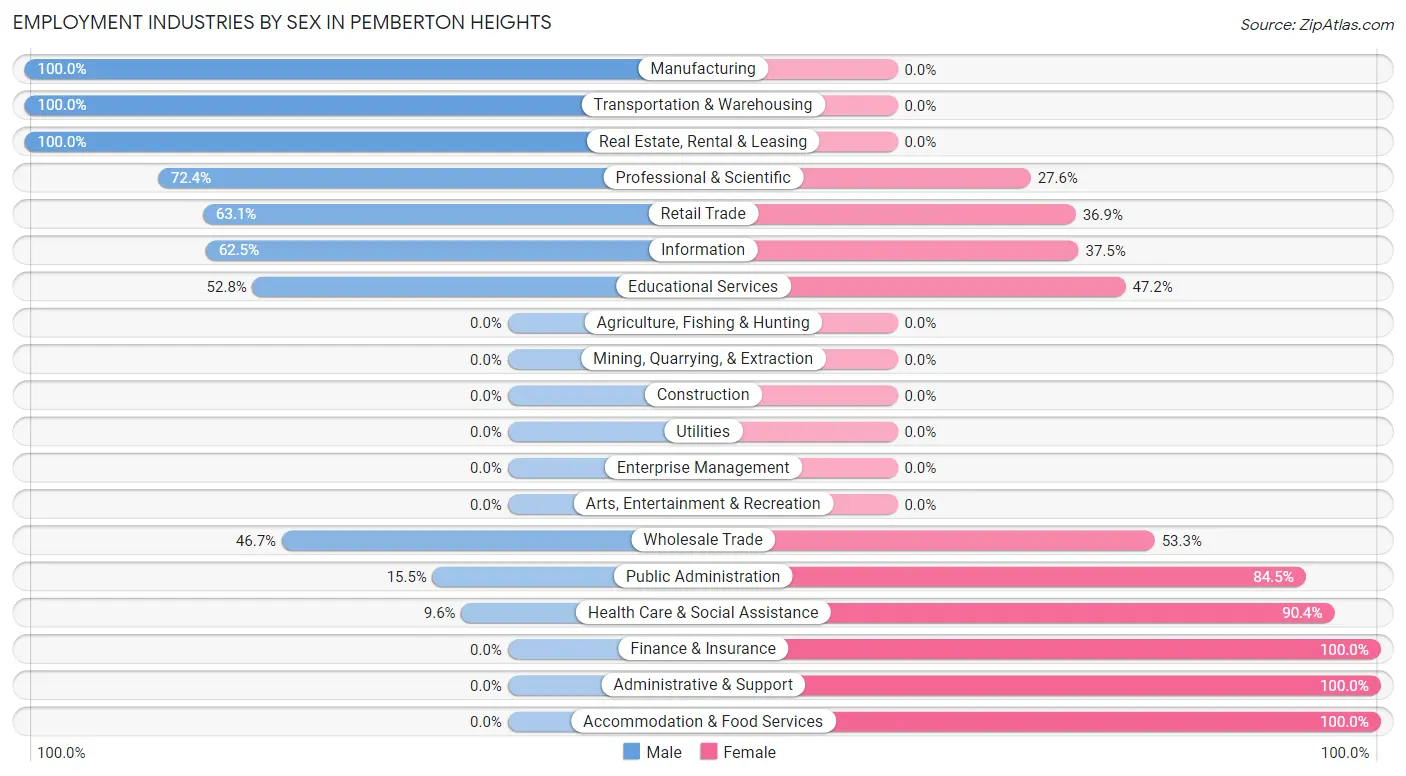
Employment Industries by Sex in Pemberton Heights
The Pemberton Heights industries that see more men than women are Manufacturing (100.0%), Transportation & Warehousing (100.0%), and Real Estate, Rental & Leasing (100.0%), whereas the industries that tend to have a higher number of women are Finance & Insurance (100.0%), Administrative & Support (100.0%), and Accommodation & Food Services (100.0%).
| Industry | Male | Female |
| Agriculture, Fishing & Hunting | 0 (0.0%) | 0 (0.0%) |
| Mining, Quarrying, & Extraction | 0 (0.0%) | 0 (0.0%) |
| Construction | 0 (0.0%) | 0 (0.0%) |
| Manufacturing | 104 (100.0%) | 0 (0.0%) |
| Wholesale Trade | 43 (46.7%) | 49 (53.3%) |
| Retail Trade | 147 (63.1%) | 86 (36.9%) |
| Transportation & Warehousing | 51 (100.0%) | 0 (0.0%) |
| Utilities | 0 (0.0%) | 0 (0.0%) |
| Information | 10 (62.5%) | 6 (37.5%) |
| Finance & Insurance | 0 (0.0%) | 47 (100.0%) |
| Real Estate, Rental & Leasing | 13 (100.0%) | 0 (0.0%) |
| Professional & Scientific | 84 (72.4%) | 32 (27.6%) |
| Enterprise Management | 0 (0.0%) | 0 (0.0%) |
| Administrative & Support | 0 (0.0%) | 22 (100.0%) |
| Educational Services | 123 (52.8%) | 110 (47.2%) |
| Health Care & Social Assistance | 16 (9.6%) | 151 (90.4%) |
| Arts, Entertainment & Recreation | 0 (0.0%) | 0 (0.0%) |
| Accommodation & Food Services | 0 (0.0%) | 19 (100.0%) |
| Public Administration | 50 (15.5%) | 272 (84.5%) |
| Total | 691 (46.5%) | 794 (53.5%) |
Education in Pemberton Heights
School Enrollment in Pemberton Heights
The most common levels of schooling among the 446 students in Pemberton Heights are high school (161 | 36.1%), middle school (111 | 24.9%), and college / undergraduate (84 | 18.8%).
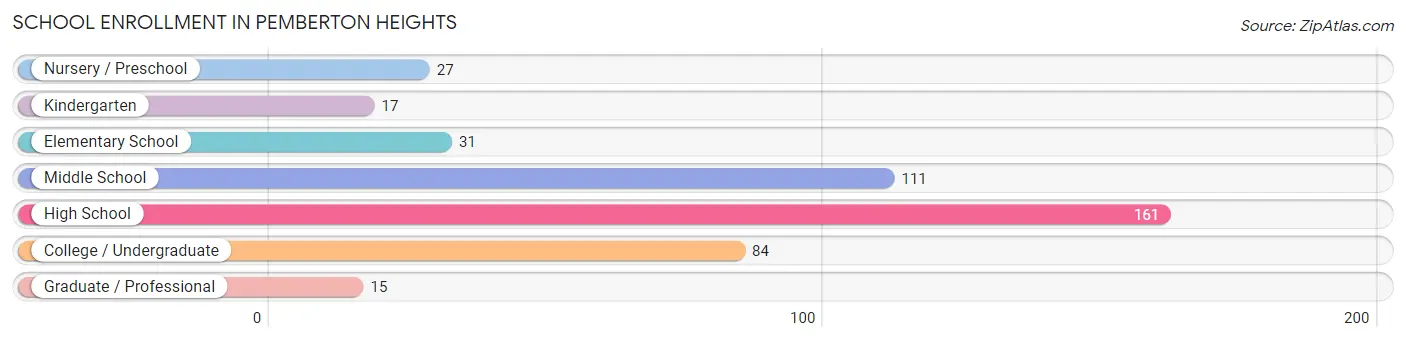
| School Level | # Students | % Students |
| Nursery / Preschool | 27 | 6.0% |
| Kindergarten | 17 | 3.8% |
| Elementary School | 31 | 7.0% |
| Middle School | 111 | 24.9% |
| High School | 161 | 36.1% |
| College / Undergraduate | 84 | 18.8% |
| Graduate / Professional | 15 | 3.4% |
| Total | 446 | 100.0% |
School Enrollment by Age by Funding Source in Pemberton Heights
Out of a total of 446 students who are enrolled in schools in Pemberton Heights, 95 (21.3%) attend a private institution, while the remaining 351 (78.7%) are enrolled in public schools. The age group of 15 to 17 year olds has the highest likelihood of being enrolled in private schools, with 58 (64.4% in the age bracket) enrolled. Conversely, the age group of 20 to 24 year olds has the lowest likelihood of being enrolled in a private school, with 31 (100.0% in the age bracket) attending a public institution.
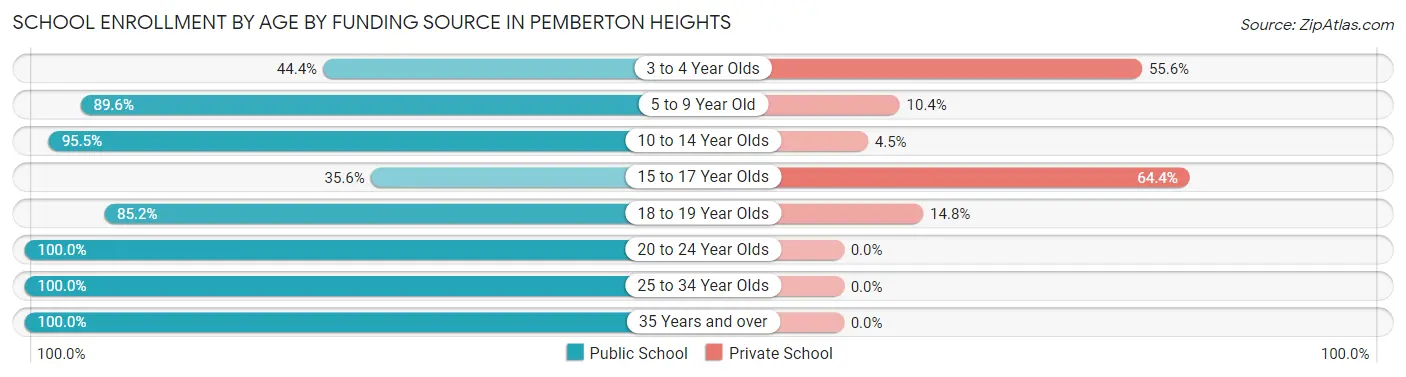
| Age Bracket | Public School | Private School |
| 3 to 4 Year Olds | 12 (44.4%) | 15 (55.6%) |
| 5 to 9 Year Old | 43 (89.6%) | 5 (10.4%) |
| 10 to 14 Year Olds | 106 (95.5%) | 5 (4.5%) |
| 15 to 17 Year Olds | 32 (35.6%) | 58 (64.4%) |
| 18 to 19 Year Olds | 69 (85.2%) | 12 (14.8%) |
| 20 to 24 Year Olds | 31 (100.0%) | 0 (0.0%) |
| 25 to 34 Year Olds | 15 (100.0%) | 0 (0.0%) |
| 35 Years and over | 43 (100.0%) | 0 (0.0%) |
| Total | 351 (78.7%) | 95 (21.3%) |
Educational Attainment by Field of Study in Pemberton Heights
Business (192 | 31.3%), arts & humanities (137 | 22.3%), visual & performing arts (50 | 8.1%), social sciences (49 | 8.0%), and engineering (38 | 6.2%) are the most common fields of study among 614 individuals in Pemberton Heights who have obtained a bachelor's degree or higher.
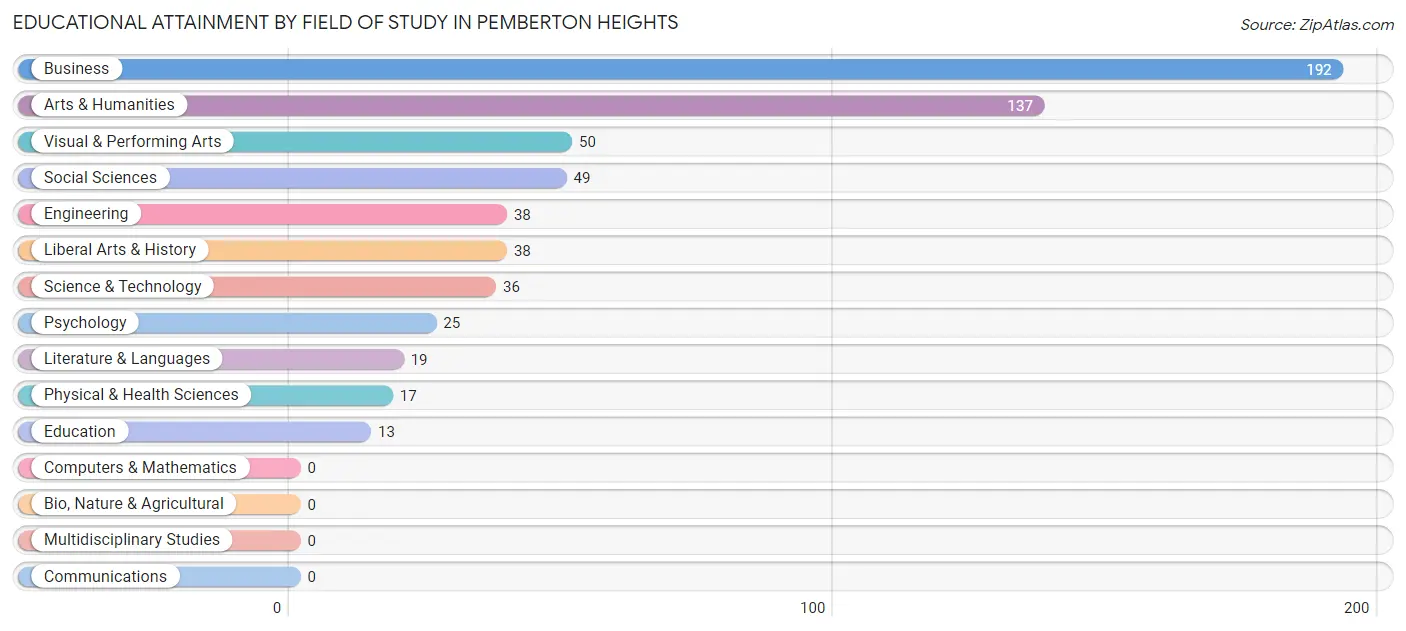
| Field of Study | # Graduates | % Graduates |
| Computers & Mathematics | 0 | 0.0% |
| Bio, Nature & Agricultural | 0 | 0.0% |
| Physical & Health Sciences | 17 | 2.8% |
| Psychology | 25 | 4.1% |
| Social Sciences | 49 | 8.0% |
| Engineering | 38 | 6.2% |
| Multidisciplinary Studies | 0 | 0.0% |
| Science & Technology | 36 | 5.9% |
| Business | 192 | 31.3% |
| Education | 13 | 2.1% |
| Literature & Languages | 19 | 3.1% |
| Liberal Arts & History | 38 | 6.2% |
| Visual & Performing Arts | 50 | 8.1% |
| Communications | 0 | 0.0% |
| Arts & Humanities | 137 | 22.3% |
| Total | 614 | 100.0% |
Transportation & Commute in Pemberton Heights
Vehicle Availability by Sex in Pemberton Heights
The most prevalent vehicle ownership categories in Pemberton Heights are males with 1 vehicle (348, accounting for 44.4%) and females with 1 vehicle (275, making up 48.3%).
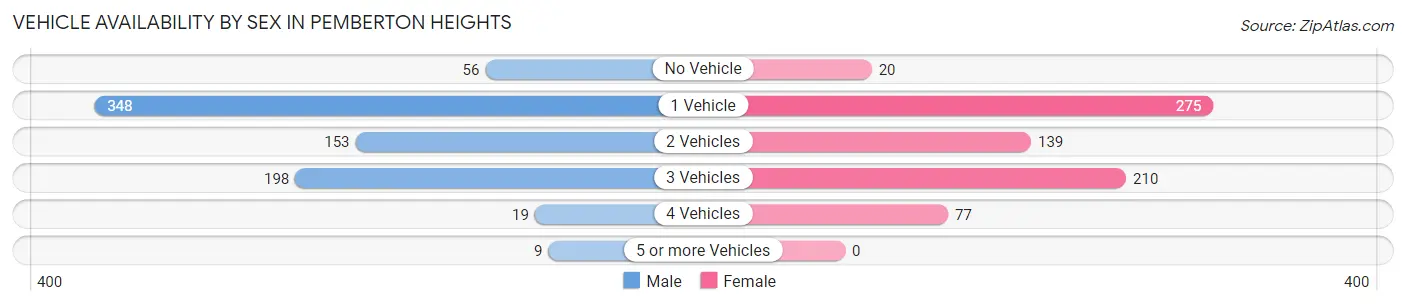
| Vehicles Available | Male | Female |
| No Vehicle | 56 (7.1%) | 20 (2.8%) |
| 1 Vehicle | 348 (44.4%) | 275 (38.1%) |
| 2 Vehicles | 153 (19.5%) | 139 (19.3%) |
| 3 Vehicles | 198 (25.3%) | 210 (29.1%) |
| 4 Vehicles | 19 (2.4%) | 77 (10.7%) |
| 5 or more Vehicles | 9 (1.1%) | 0 (0.0%) |
| Total | 783 (100.0%) | 721 (100.0%) |
Commute Time in Pemberton Heights
The most frequently occuring commute durations in Pemberton Heights are 30 to 34 minutes (378 commuters, 25.5%), 15 to 19 minutes (320 commuters, 21.6%), and 20 to 24 minutes (177 commuters, 11.9%).
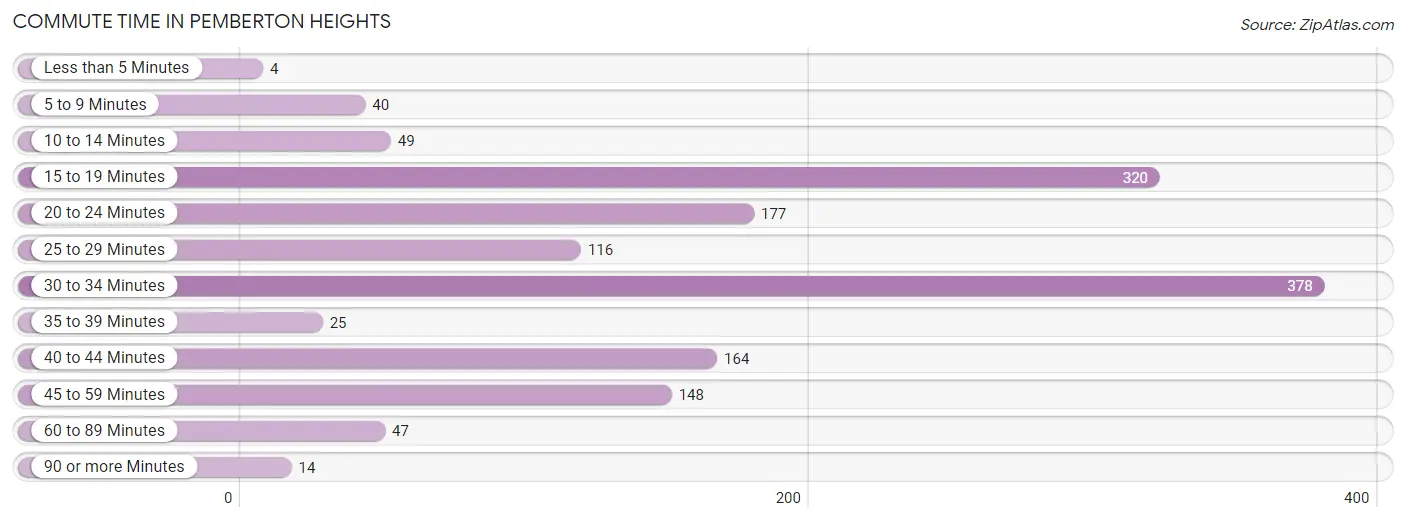
| Commute Time | # Commuters | % Commuters |
| Less than 5 Minutes | 4 | 0.3% |
| 5 to 9 Minutes | 40 | 2.7% |
| 10 to 14 Minutes | 49 | 3.3% |
| 15 to 19 Minutes | 320 | 21.6% |
| 20 to 24 Minutes | 177 | 11.9% |
| 25 to 29 Minutes | 116 | 7.8% |
| 30 to 34 Minutes | 378 | 25.5% |
| 35 to 39 Minutes | 25 | 1.7% |
| 40 to 44 Minutes | 164 | 11.1% |
| 45 to 59 Minutes | 148 | 10.0% |
| 60 to 89 Minutes | 47 | 3.2% |
| 90 or more Minutes | 14 | 0.9% |
Commute Time by Sex in Pemberton Heights
The most common commute times in Pemberton Heights are 30 to 34 minutes (307 commuters, 39.2%) for males and 15 to 19 minutes (187 commuters, 26.8%) for females.
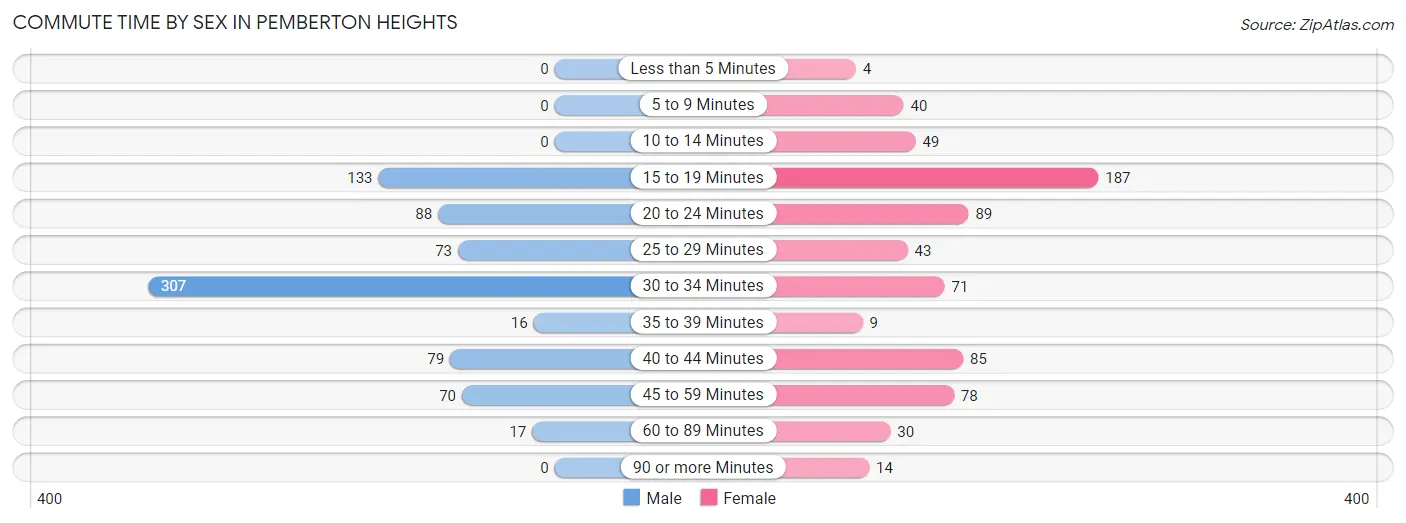
| Commute Time | Male | Female |
| Less than 5 Minutes | 0 (0.0%) | 4 (0.6%) |
| 5 to 9 Minutes | 0 (0.0%) | 40 (5.7%) |
| 10 to 14 Minutes | 0 (0.0%) | 49 (7.0%) |
| 15 to 19 Minutes | 133 (17.0%) | 187 (26.8%) |
| 20 to 24 Minutes | 88 (11.2%) | 89 (12.7%) |
| 25 to 29 Minutes | 73 (9.3%) | 43 (6.1%) |
| 30 to 34 Minutes | 307 (39.2%) | 71 (10.2%) |
| 35 to 39 Minutes | 16 (2.0%) | 9 (1.3%) |
| 40 to 44 Minutes | 79 (10.1%) | 85 (12.2%) |
| 45 to 59 Minutes | 70 (8.9%) | 78 (11.2%) |
| 60 to 89 Minutes | 17 (2.2%) | 30 (4.3%) |
| 90 or more Minutes | 0 (0.0%) | 14 (2.0%) |
Time of Departure to Work by Sex in Pemberton Heights
The most frequent times of departure to work in Pemberton Heights are 7:00 AM to 7:29 AM (240, 30.6%) for males and 8:00 AM to 8:29 AM (175, 25.0%) for females.
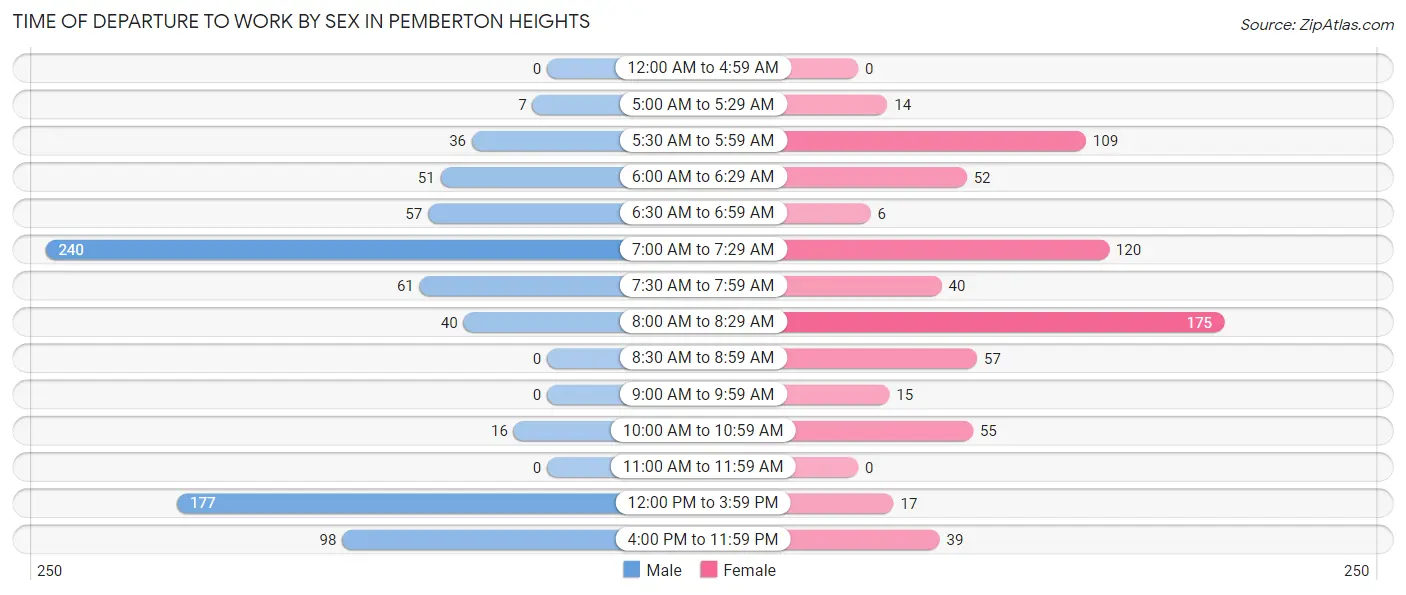
| Time of Departure | Male | Female |
| 12:00 AM to 4:59 AM | 0 (0.0%) | 0 (0.0%) |
| 5:00 AM to 5:29 AM | 7 (0.9%) | 14 (2.0%) |
| 5:30 AM to 5:59 AM | 36 (4.6%) | 109 (15.6%) |
| 6:00 AM to 6:29 AM | 51 (6.5%) | 52 (7.4%) |
| 6:30 AM to 6:59 AM | 57 (7.3%) | 6 (0.9%) |
| 7:00 AM to 7:29 AM | 240 (30.6%) | 120 (17.2%) |
| 7:30 AM to 7:59 AM | 61 (7.8%) | 40 (5.7%) |
| 8:00 AM to 8:29 AM | 40 (5.1%) | 175 (25.0%) |
| 8:30 AM to 8:59 AM | 0 (0.0%) | 57 (8.2%) |
| 9:00 AM to 9:59 AM | 0 (0.0%) | 15 (2.1%) |
| 10:00 AM to 10:59 AM | 16 (2.0%) | 55 (7.9%) |
| 11:00 AM to 11:59 AM | 0 (0.0%) | 0 (0.0%) |
| 12:00 PM to 3:59 PM | 177 (22.6%) | 17 (2.4%) |
| 4:00 PM to 11:59 PM | 98 (12.5%) | 39 (5.6%) |
| Total | 783 (100.0%) | 699 (100.0%) |
Housing Occupancy in Pemberton Heights
Occupancy by Ownership in Pemberton Heights
Of the total 1,245 dwellings in Pemberton Heights, owner-occupied units account for 677 (54.4%), while renter-occupied units make up 568 (45.6%).
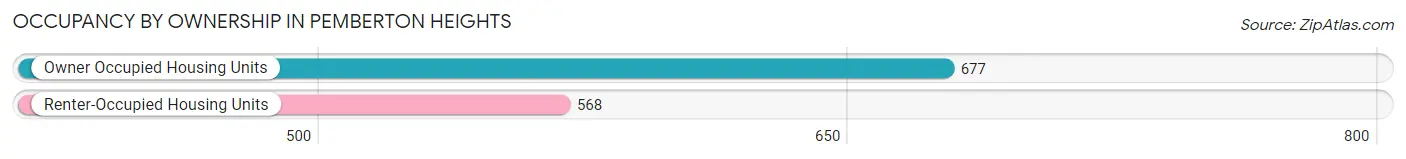
| Occupancy | # Housing Units | % Housing Units |
| Owner Occupied Housing Units | 677 | 54.4% |
| Renter-Occupied Housing Units | 568 | 45.6% |
| Total Occupied Housing Units | 1,245 | 100.0% |
Occupancy by Household Size in Pemberton Heights
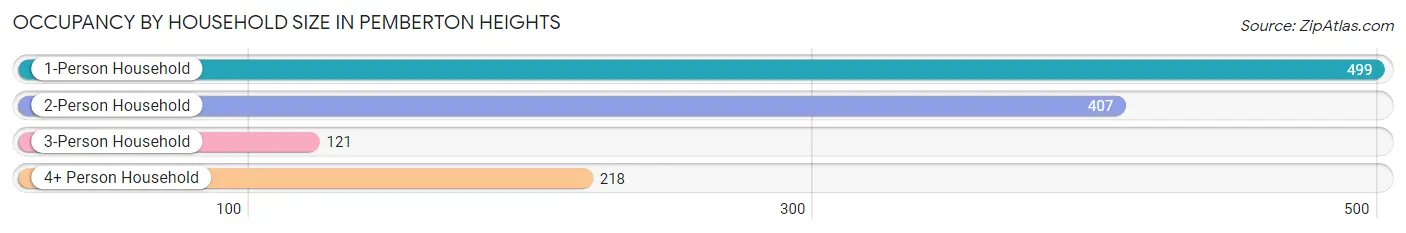
| Household Size | # Housing Units | % Housing Units |
| 1-Person Household | 499 | 40.1% |
| 2-Person Household | 407 | 32.7% |
| 3-Person Household | 121 | 9.7% |
| 4+ Person Household | 218 | 17.5% |
| Total Housing Units | 1,245 | 100.0% |
Occupancy by Ownership by Household Size in Pemberton Heights
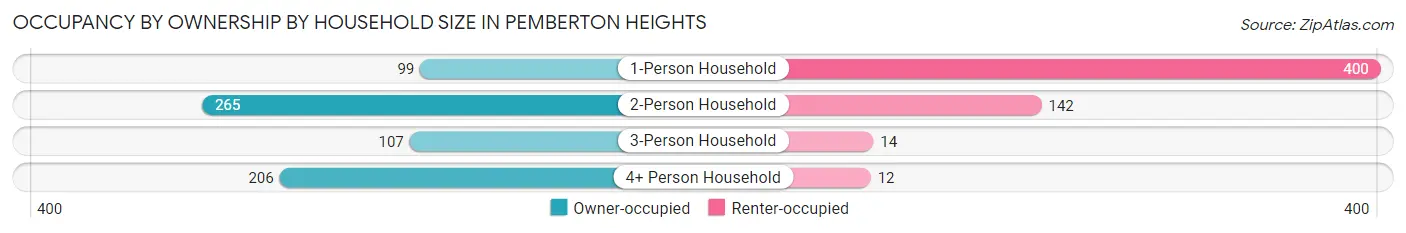
| Household Size | Owner-occupied | Renter-occupied |
| 1-Person Household | 99 (19.8%) | 400 (80.2%) |
| 2-Person Household | 265 (65.1%) | 142 (34.9%) |
| 3-Person Household | 107 (88.4%) | 14 (11.6%) |
| 4+ Person Household | 206 (94.5%) | 12 (5.5%) |
| Total Housing Units | 677 (54.4%) | 568 (45.6%) |
Occupancy by Educational Attainment in Pemberton Heights
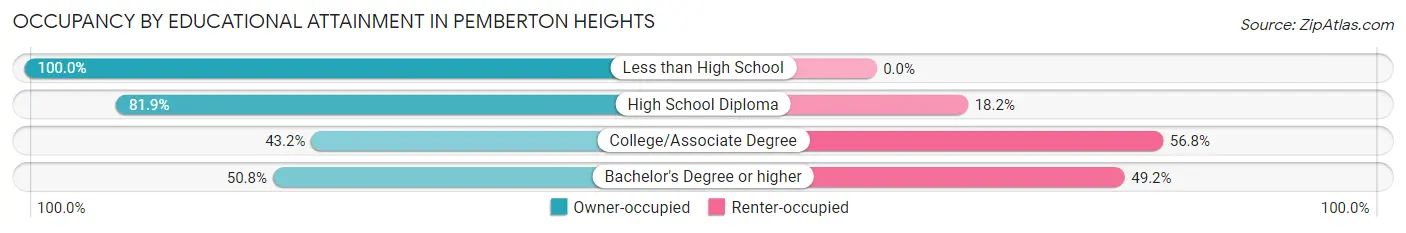
| Household Size | Owner-occupied | Renter-occupied |
| Less than High School | 27 (100.0%) | 0 (0.0%) |
| High School Diploma | 212 (81.9%) | 47 (18.1%) |
| College/Associate Degree | 278 (43.2%) | 366 (56.8%) |
| Bachelor's Degree or higher | 160 (50.8%) | 155 (49.2%) |
Occupancy by Age of Householder in Pemberton Heights
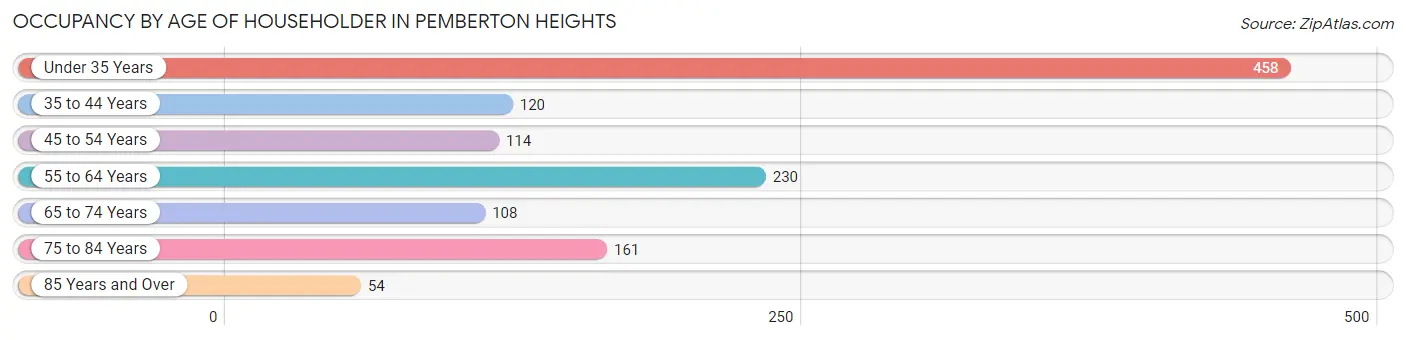
| Age Bracket | # Households | % Households |
| Under 35 Years | 458 | 36.8% |
| 35 to 44 Years | 120 | 9.6% |
| 45 to 54 Years | 114 | 9.2% |
| 55 to 64 Years | 230 | 18.5% |
| 65 to 74 Years | 108 | 8.7% |
| 75 to 84 Years | 161 | 12.9% |
| 85 Years and Over | 54 | 4.3% |
| Total | 1,245 | 100.0% |
Housing Finances in Pemberton Heights
Median Income by Occupancy in Pemberton Heights
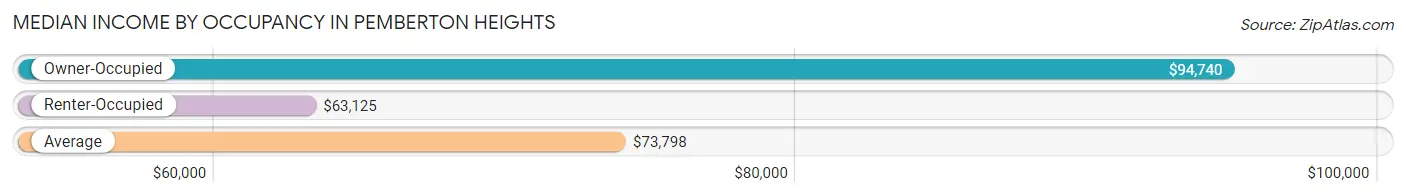
| Occupancy Type | # Households | Median Income |
| Owner-Occupied | 677 (54.4%) | $94,740 |
| Renter-Occupied | 568 (45.6%) | $63,125 |
| Average | 1,245 (100.0%) | $73,798 |
Occupancy by Householder Income Bracket in Pemberton Heights
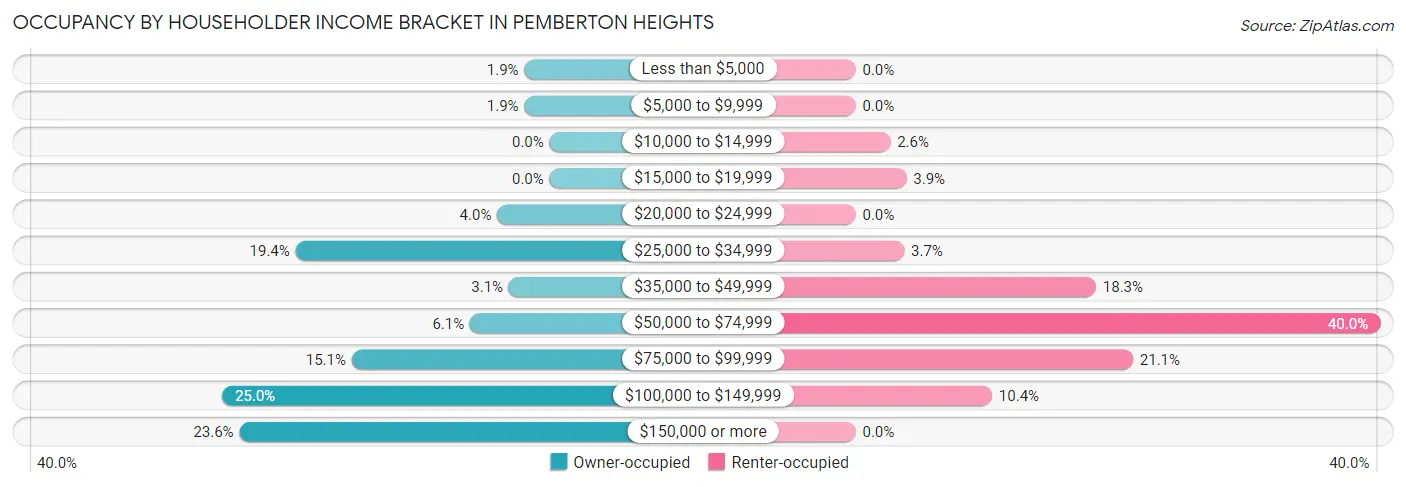
| Income Bracket | Owner-occupied | Renter-occupied |
| Less than $5,000 | 13 (1.9%) | 0 (0.0%) |
| $5,000 to $9,999 | 13 (1.9%) | 0 (0.0%) |
| $10,000 to $14,999 | 0 (0.0%) | 15 (2.6%) |
| $15,000 to $19,999 | 0 (0.0%) | 22 (3.9%) |
| $20,000 to $24,999 | 27 (4.0%) | 0 (0.0%) |
| $25,000 to $34,999 | 131 (19.4%) | 21 (3.7%) |
| $35,000 to $49,999 | 21 (3.1%) | 104 (18.3%) |
| $50,000 to $74,999 | 41 (6.1%) | 227 (40.0%) |
| $75,000 to $99,999 | 102 (15.1%) | 120 (21.1%) |
| $100,000 to $149,999 | 169 (25.0%) | 59 (10.4%) |
| $150,000 or more | 160 (23.6%) | 0 (0.0%) |
| Total | 677 (100.0%) | 568 (100.0%) |
Monthly Housing Cost Tiers in Pemberton Heights
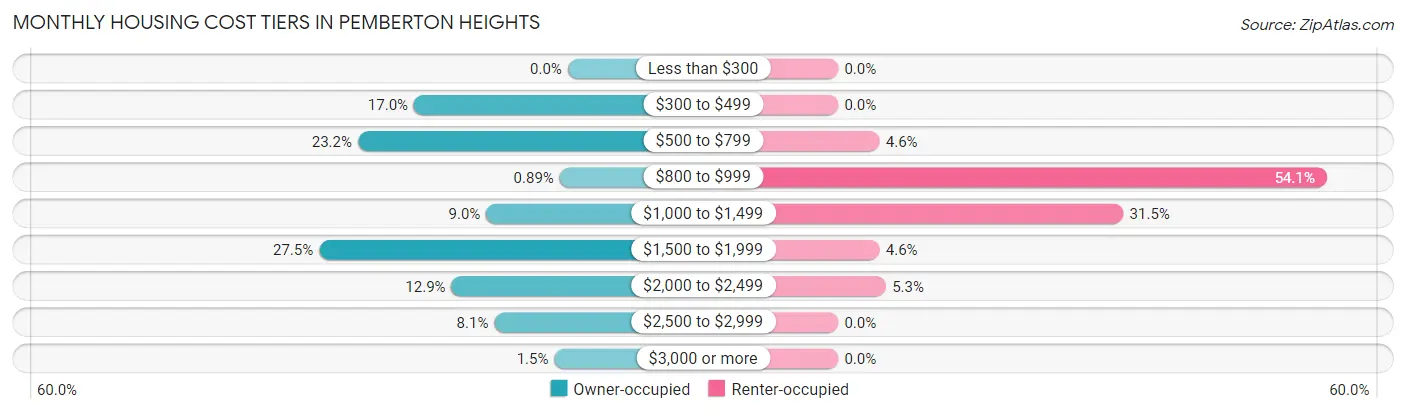
| Monthly Cost | Owner-occupied | Renter-occupied |
| Less than $300 | 0 (0.0%) | 0 (0.0%) |
| $300 to $499 | 115 (17.0%) | 0 (0.0%) |
| $500 to $799 | 157 (23.2%) | 26 (4.6%) |
| $800 to $999 | 6 (0.9%) | 307 (54.0%) |
| $1,000 to $1,499 | 61 (9.0%) | 179 (31.5%) |
| $1,500 to $1,999 | 186 (27.5%) | 26 (4.6%) |
| $2,000 to $2,499 | 87 (12.9%) | 30 (5.3%) |
| $2,500 to $2,999 | 55 (8.1%) | 0 (0.0%) |
| $3,000 or more | 10 (1.5%) | 0 (0.0%) |
| Total | 677 (100.0%) | 568 (100.0%) |
Physical Housing Characteristics in Pemberton Heights
Housing Structures in Pemberton Heights
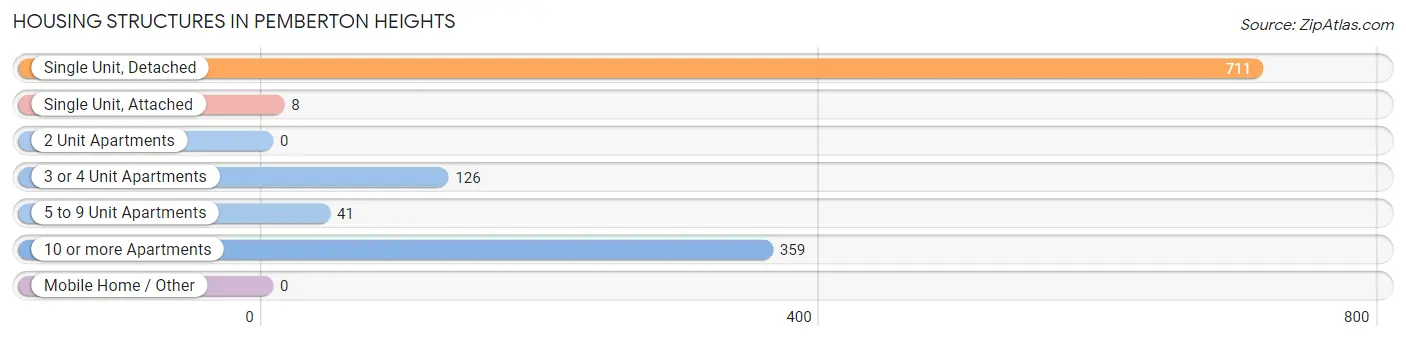
| Structure Type | # Housing Units | % Housing Units |
| Single Unit, Detached | 711 | 57.1% |
| Single Unit, Attached | 8 | 0.6% |
| 2 Unit Apartments | 0 | 0.0% |
| 3 or 4 Unit Apartments | 126 | 10.1% |
| 5 to 9 Unit Apartments | 41 | 3.3% |
| 10 or more Apartments | 359 | 28.8% |
| Mobile Home / Other | 0 | 0.0% |
| Total | 1,245 | 100.0% |
Housing Structures by Occupancy in Pemberton Heights
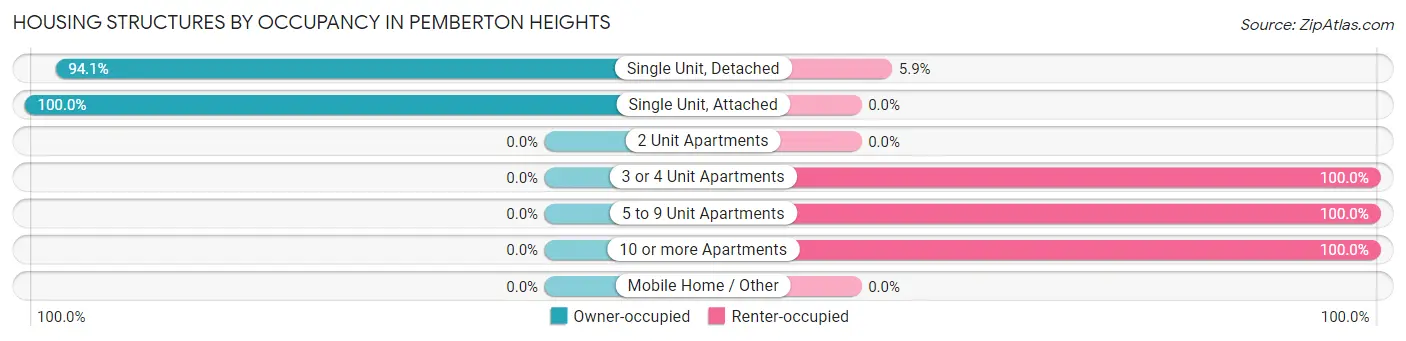
| Structure Type | Owner-occupied | Renter-occupied |
| Single Unit, Detached | 669 (94.1%) | 42 (5.9%) |
| Single Unit, Attached | 8 (100.0%) | 0 (0.0%) |
| 2 Unit Apartments | 0 (0.0%) | 0 (0.0%) |
| 3 or 4 Unit Apartments | 0 (0.0%) | 126 (100.0%) |
| 5 to 9 Unit Apartments | 0 (0.0%) | 41 (100.0%) |
| 10 or more Apartments | 0 (0.0%) | 359 (100.0%) |
| Mobile Home / Other | 0 (0.0%) | 0 (0.0%) |
| Total | 677 (54.4%) | 568 (45.6%) |
Housing Structures by Number of Rooms in Pemberton Heights
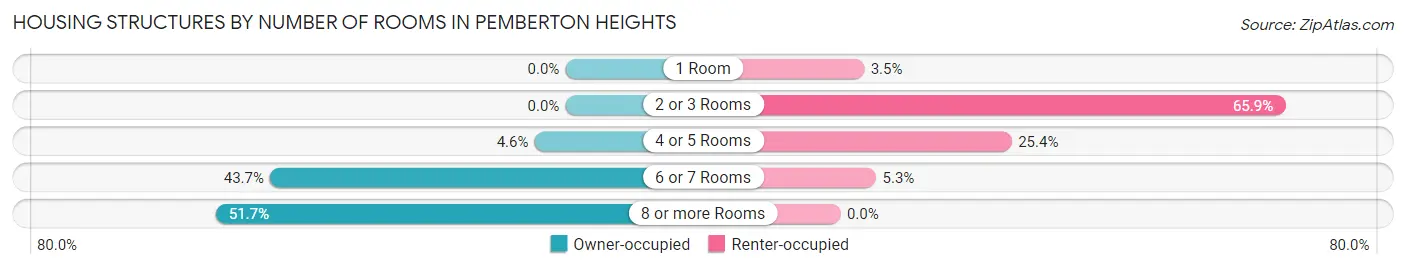
| Number of Rooms | Owner-occupied | Renter-occupied |
| 1 Room | 0 (0.0%) | 20 (3.5%) |
| 2 or 3 Rooms | 0 (0.0%) | 374 (65.8%) |
| 4 or 5 Rooms | 31 (4.6%) | 144 (25.4%) |
| 6 or 7 Rooms | 296 (43.7%) | 30 (5.3%) |
| 8 or more Rooms | 350 (51.7%) | 0 (0.0%) |
| Total | 677 (100.0%) | 568 (100.0%) |
Housing Structure by Heating Type in Pemberton Heights
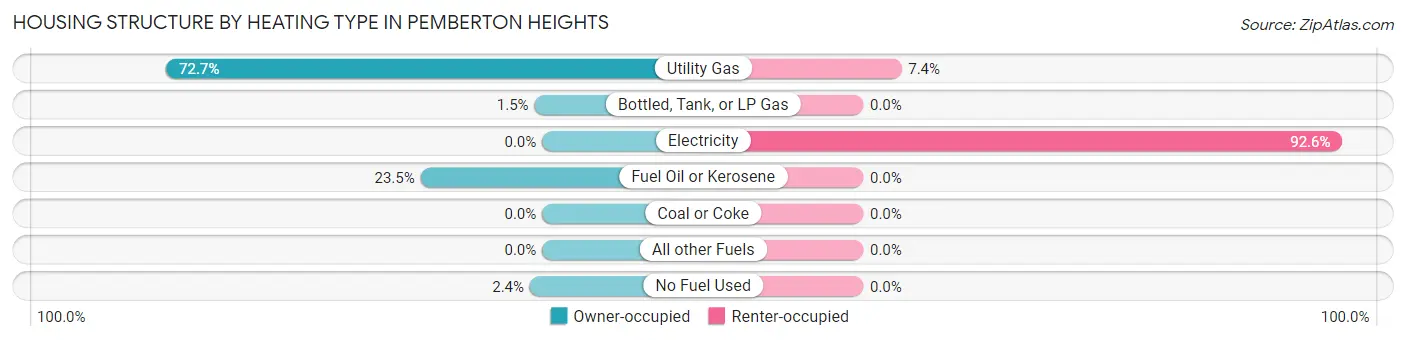
| Heating Type | Owner-occupied | Renter-occupied |
| Utility Gas | 492 (72.7%) | 42 (7.4%) |
| Bottled, Tank, or LP Gas | 10 (1.5%) | 0 (0.0%) |
| Electricity | 0 (0.0%) | 526 (92.6%) |
| Fuel Oil or Kerosene | 159 (23.5%) | 0 (0.0%) |
| Coal or Coke | 0 (0.0%) | 0 (0.0%) |
| All other Fuels | 0 (0.0%) | 0 (0.0%) |
| No Fuel Used | 16 (2.4%) | 0 (0.0%) |
| Total | 677 (100.0%) | 568 (100.0%) |
Household Vehicle Usage in Pemberton Heights
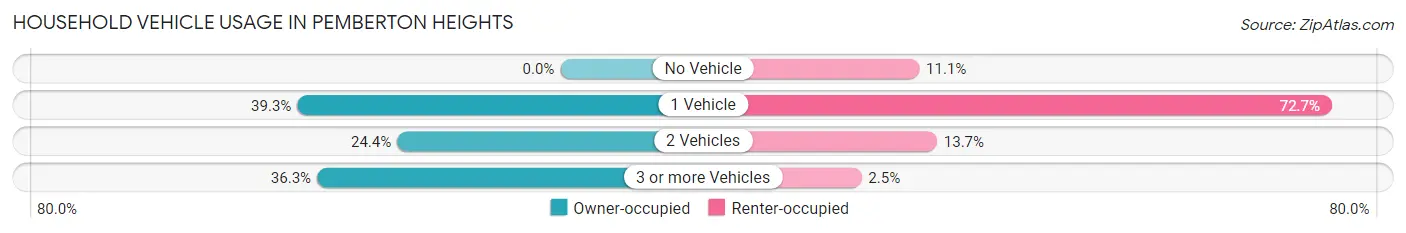
| Vehicles per Household | Owner-occupied | Renter-occupied |
| No Vehicle | 0 (0.0%) | 63 (11.1%) |
| 1 Vehicle | 266 (39.3%) | 413 (72.7%) |
| 2 Vehicles | 165 (24.4%) | 78 (13.7%) |
| 3 or more Vehicles | 246 (36.3%) | 14 (2.5%) |
| Total | 677 (100.0%) | 568 (100.0%) |
Real Estate & Mortgages in Pemberton Heights
Real Estate and Mortgage Overview in Pemberton Heights
| Characteristic | Without Mortgage | With Mortgage |
| Housing Units | 265 | 412 |
| Median Property Value | $216,300 | $230,200 |
| Median Household Income | $108,988 | $52 |
| Monthly Housing Costs | $603 | $10 |
| Real Estate Taxes | $4,340 | $33 |
Property Value by Mortgage Status in Pemberton Heights
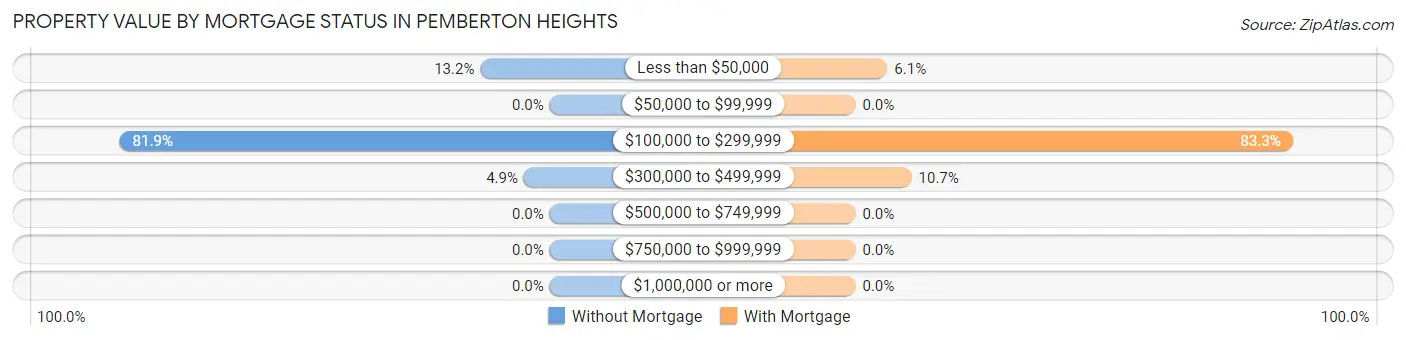
| Property Value | Without Mortgage | With Mortgage |
| Less than $50,000 | 35 (13.2%) | 25 (6.1%) |
| $50,000 to $99,999 | 0 (0.0%) | 0 (0.0%) |
| $100,000 to $299,999 | 217 (81.9%) | 343 (83.3%) |
| $300,000 to $499,999 | 13 (4.9%) | 44 (10.7%) |
| $500,000 to $749,999 | 0 (0.0%) | 0 (0.0%) |
| $750,000 to $999,999 | 0 (0.0%) | 0 (0.0%) |
| $1,000,000 or more | 0 (0.0%) | 0 (0.0%) |
| Total | 265 (100.0%) | 412 (100.0%) |
Household Income by Mortgage Status in Pemberton Heights
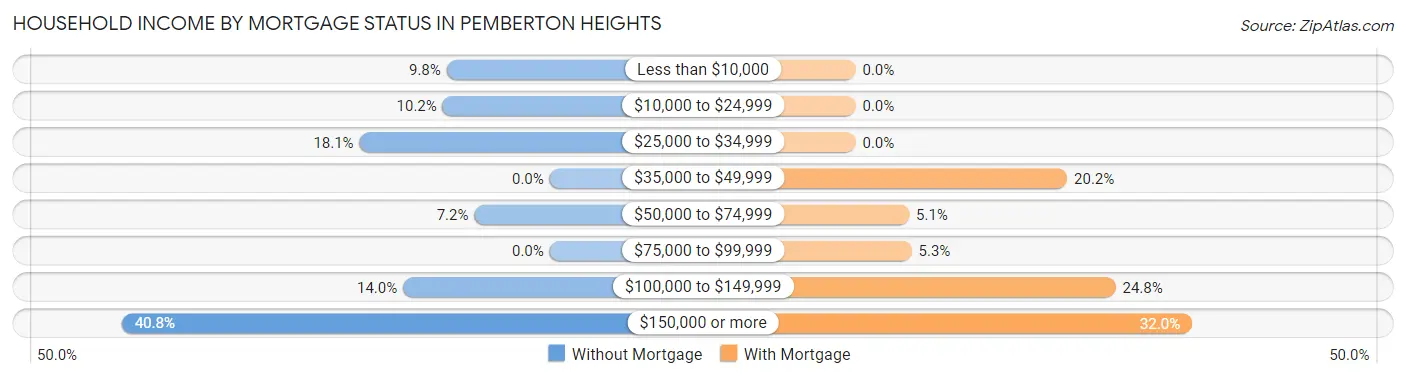
| Household Income | Without Mortgage | With Mortgage |
| Less than $10,000 | 26 (9.8%) | 0 (0.0%) |
| $10,000 to $24,999 | 27 (10.2%) | 0 (0.0%) |
| $25,000 to $34,999 | 48 (18.1%) | 0 (0.0%) |
| $35,000 to $49,999 | 0 (0.0%) | 83 (20.2%) |
| $50,000 to $74,999 | 19 (7.2%) | 21 (5.1%) |
| $75,000 to $99,999 | 0 (0.0%) | 22 (5.3%) |
| $100,000 to $149,999 | 37 (14.0%) | 102 (24.8%) |
| $150,000 or more | 108 (40.7%) | 132 (32.0%) |
| Total | 265 (100.0%) | 412 (100.0%) |
Property Value to Household Income Ratio in Pemberton Heights
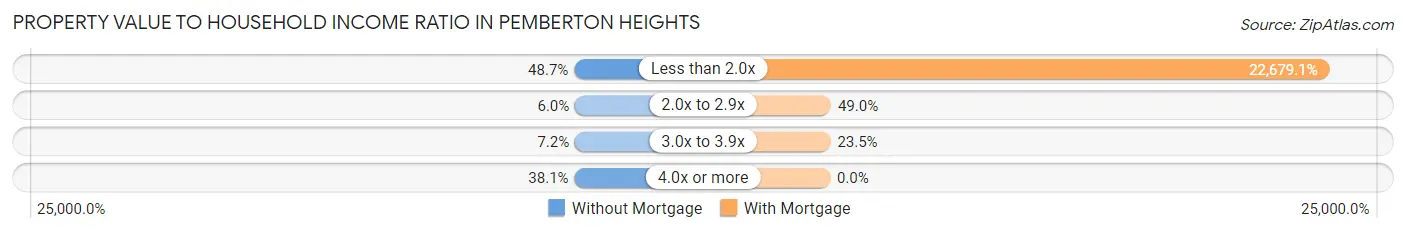
| Value-to-Income Ratio | Without Mortgage | With Mortgage |
| Less than 2.0x | 129 (48.7%) | 93,438 (22,679.1%) |
| 2.0x to 2.9x | 16 (6.0%) | 202 (49.0%) |
| 3.0x to 3.9x | 19 (7.2%) | 97 (23.5%) |
| 4.0x or more | 101 (38.1%) | 0 (0.0%) |
| Total | 265 (100.0%) | 412 (100.0%) |
Real Estate Taxes by Mortgage Status in Pemberton Heights
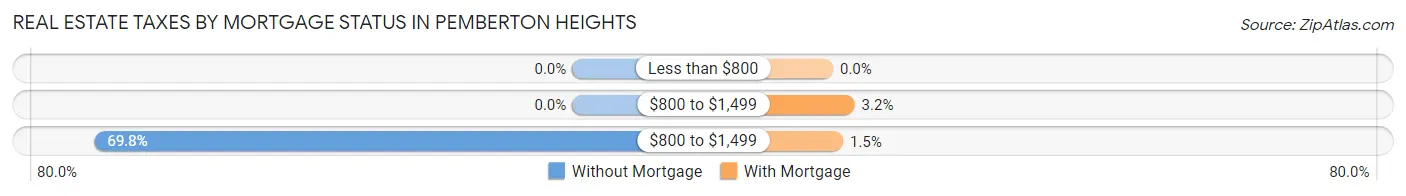
| Property Taxes | Without Mortgage | With Mortgage |
| Less than $800 | 0 (0.0%) | 0 (0.0%) |
| $800 to $1,499 | 0 (0.0%) | 13 (3.2%) |
| $800 to $1,499 | 185 (69.8%) | 6 (1.5%) |
| Total | 265 (100.0%) | 412 (100.0%) |
Health & Disability in Pemberton Heights
Health Insurance Coverage by Age in Pemberton Heights
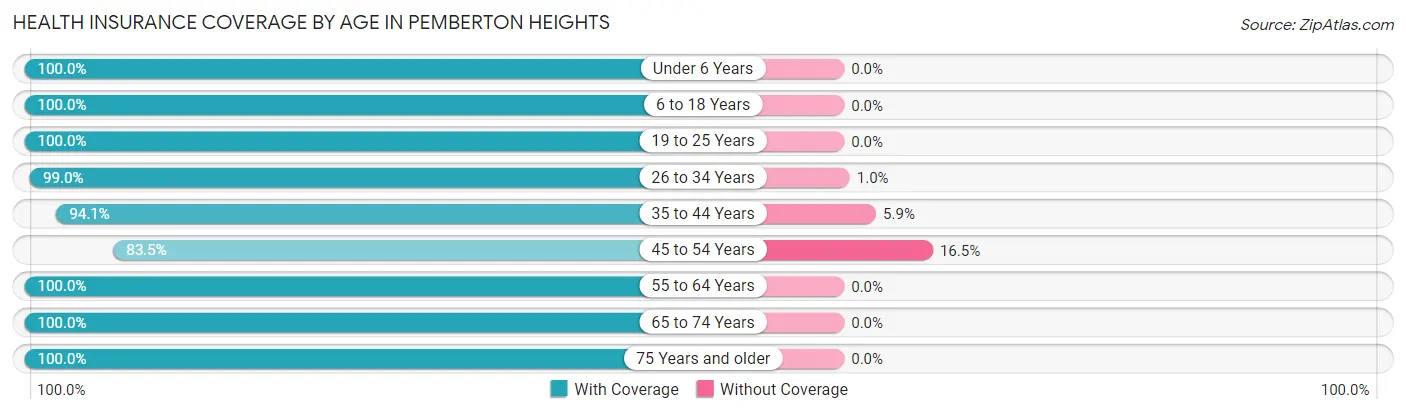
| Age Bracket | With Coverage | Without Coverage |
| Under 6 Years | 158 (100.0%) | 0 (0.0%) |
| 6 to 18 Years | 330 (100.0%) | 0 (0.0%) |
| 19 to 25 Years | 133 (100.0%) | 0 (0.0%) |
| 26 to 34 Years | 569 (99.0%) | 6 (1.0%) |
| 35 to 44 Years | 190 (94.1%) | 12 (5.9%) |
| 45 to 54 Years | 217 (83.5%) | 43 (16.5%) |
| 55 to 64 Years | 485 (100.0%) | 0 (0.0%) |
| 65 to 74 Years | 184 (100.0%) | 0 (0.0%) |
| 75 Years and older | 343 (100.0%) | 0 (0.0%) |
| Total | 2,609 (97.7%) | 61 (2.3%) |
Health Insurance Coverage by Citizenship Status in Pemberton Heights
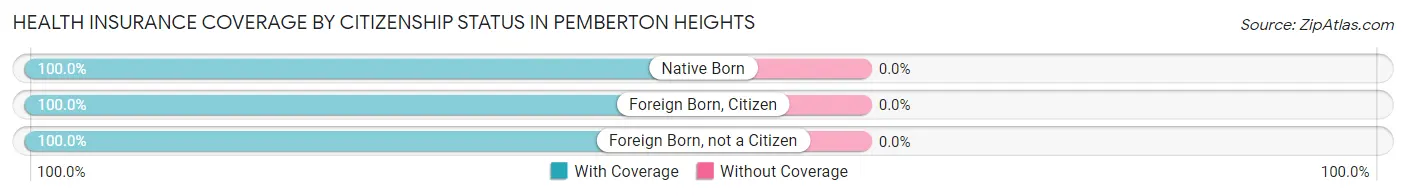
| Citizenship Status | With Coverage | Without Coverage |
| Native Born | 158 (100.0%) | 0 (0.0%) |
| Foreign Born, Citizen | 330 (100.0%) | 0 (0.0%) |
| Foreign Born, not a Citizen | 133 (100.0%) | 0 (0.0%) |
Health Insurance Coverage by Household Income in Pemberton Heights
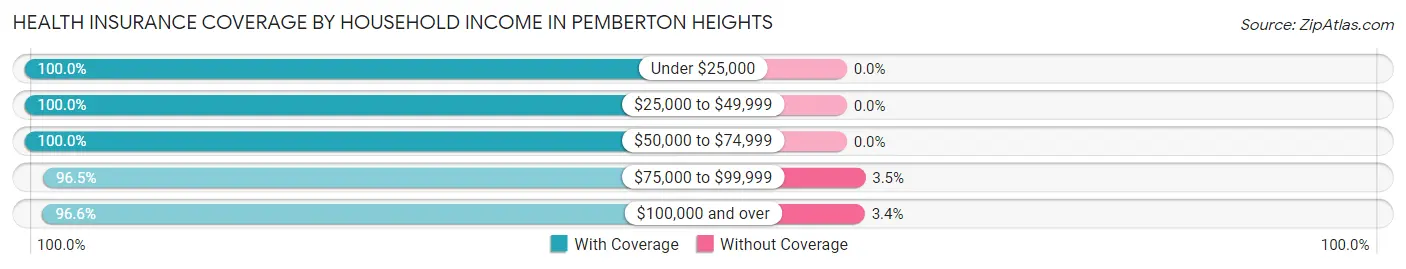
| Household Income | With Coverage | Without Coverage |
| Under $25,000 | 90 (100.0%) | 0 (0.0%) |
| $25,000 to $49,999 | 451 (100.0%) | 0 (0.0%) |
| $50,000 to $74,999 | 329 (100.0%) | 0 (0.0%) |
| $75,000 to $99,999 | 502 (96.5%) | 18 (3.5%) |
| $100,000 and over | 1,237 (96.6%) | 43 (3.4%) |
Public vs Private Health Insurance Coverage by Age in Pemberton Heights
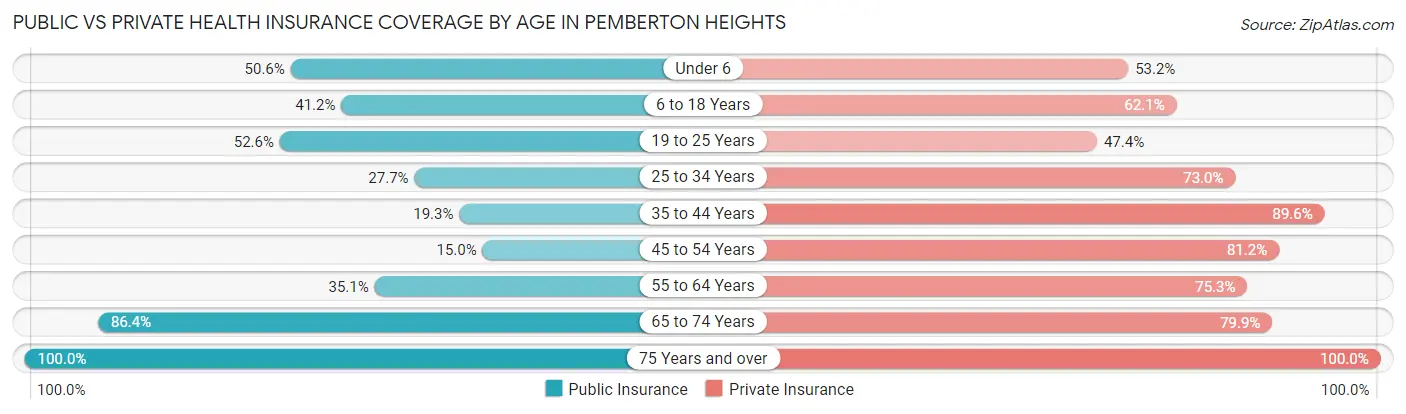
| Age Bracket | Public Insurance | Private Insurance |
| Under 6 | 80 (50.6%) | 84 (53.2%) |
| 6 to 18 Years | 136 (41.2%) | 205 (62.1%) |
| 19 to 25 Years | 70 (52.6%) | 63 (47.4%) |
| 25 to 34 Years | 159 (27.7%) | 420 (73.0%) |
| 35 to 44 Years | 39 (19.3%) | 181 (89.6%) |
| 45 to 54 Years | 39 (15.0%) | 211 (81.1%) |
| 55 to 64 Years | 170 (35.0%) | 365 (75.3%) |
| 65 to 74 Years | 159 (86.4%) | 147 (79.9%) |
| 75 Years and over | 343 (100.0%) | 343 (100.0%) |
| Total | 1,195 (44.8%) | 2,019 (75.6%) |
Disability Status by Sex by Age in Pemberton Heights
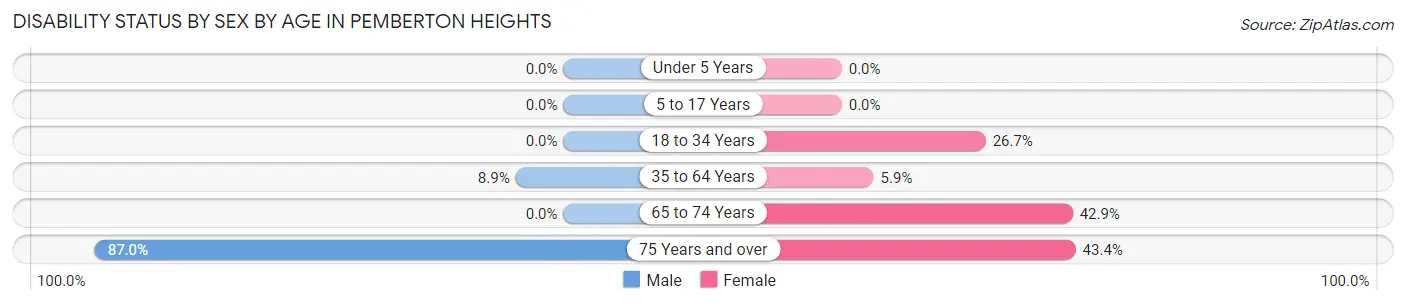
| Age Bracket | Male | Female |
| Under 5 Years | 0 (0.0%) | 0 (0.0%) |
| 5 to 17 Years | 0 (0.0%) | 0 (0.0%) |
| 18 to 34 Years | 0 (0.0%) | 121 (26.7%) |
| 35 to 64 Years | 42 (8.9%) | 28 (5.9%) |
| 65 to 74 Years | 0 (0.0%) | 45 (42.9%) |
| 75 Years and over | 120 (87.0%) | 89 (43.4%) |
Disability Class by Sex by Age in Pemberton Heights
Disability Class: Hearing Difficulty
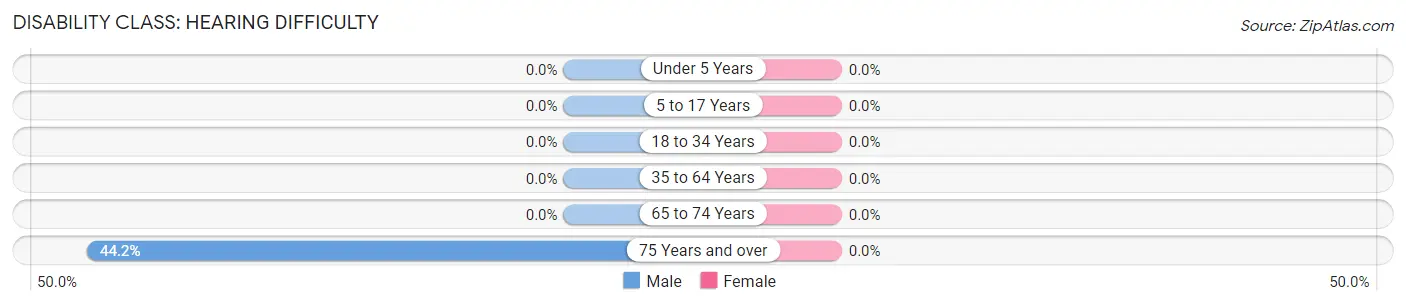
| Age Bracket | Male | Female |
| Under 5 Years | 0 (0.0%) | 0 (0.0%) |
| 5 to 17 Years | 0 (0.0%) | 0 (0.0%) |
| 18 to 34 Years | 0 (0.0%) | 0 (0.0%) |
| 35 to 64 Years | 0 (0.0%) | 0 (0.0%) |
| 65 to 74 Years | 0 (0.0%) | 0 (0.0%) |
| 75 Years and over | 61 (44.2%) | 0 (0.0%) |
Disability Class: Vision Difficulty
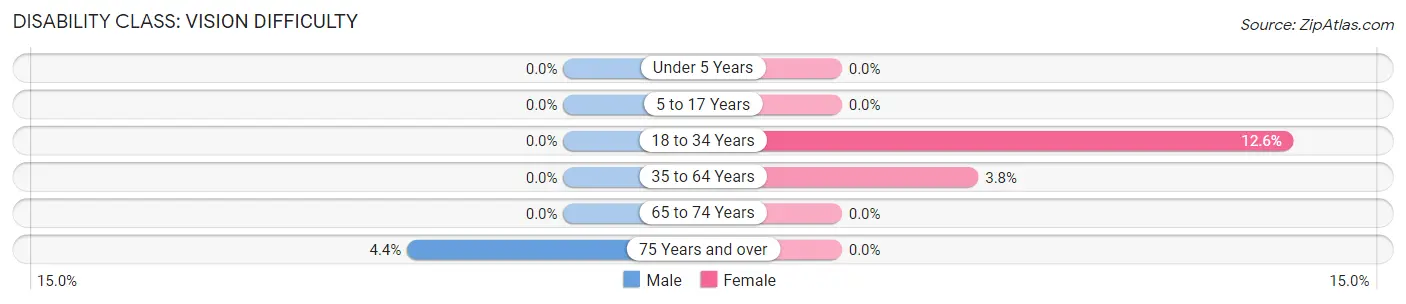
| Age Bracket | Male | Female |
| Under 5 Years | 0 (0.0%) | 0 (0.0%) |
| 5 to 17 Years | 0 (0.0%) | 0 (0.0%) |
| 18 to 34 Years | 0 (0.0%) | 57 (12.6%) |
| 35 to 64 Years | 0 (0.0%) | 18 (3.8%) |
| 65 to 74 Years | 0 (0.0%) | 0 (0.0%) |
| 75 Years and over | 6 (4.3%) | 0 (0.0%) |
Disability Class: Cognitive Difficulty
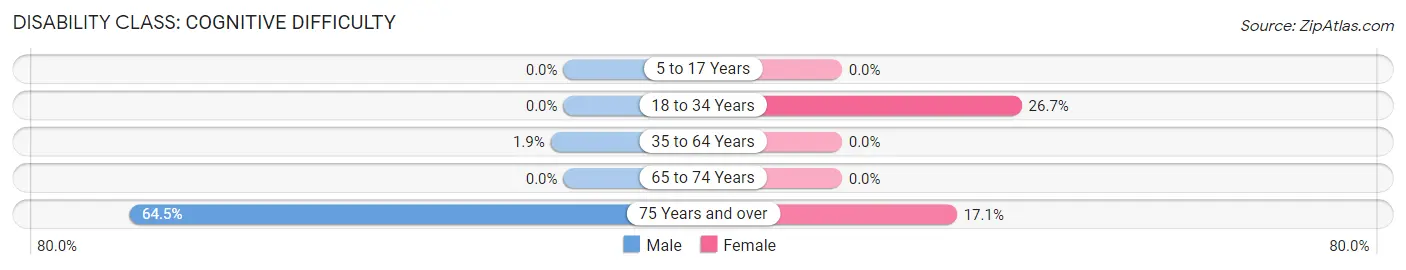
| Age Bracket | Male | Female |
| 5 to 17 Years | 0 (0.0%) | 0 (0.0%) |
| 18 to 34 Years | 0 (0.0%) | 121 (26.7%) |
| 35 to 64 Years | 9 (1.9%) | 0 (0.0%) |
| 65 to 74 Years | 0 (0.0%) | 0 (0.0%) |
| 75 Years and over | 89 (64.5%) | 35 (17.1%) |
Disability Class: Ambulatory Difficulty
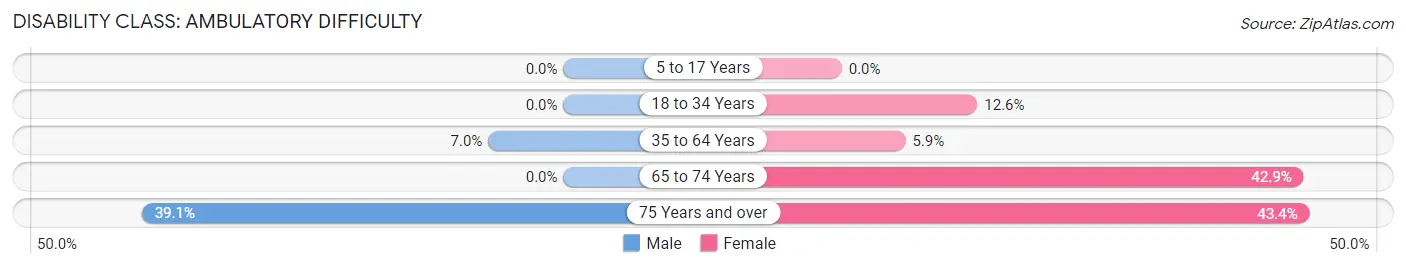
| Age Bracket | Male | Female |
| 5 to 17 Years | 0 (0.0%) | 0 (0.0%) |
| 18 to 34 Years | 0 (0.0%) | 57 (12.6%) |
| 35 to 64 Years | 33 (7.0%) | 28 (5.9%) |
| 65 to 74 Years | 0 (0.0%) | 45 (42.9%) |
| 75 Years and over | 54 (39.1%) | 89 (43.4%) |
Disability Class: Self-Care Difficulty
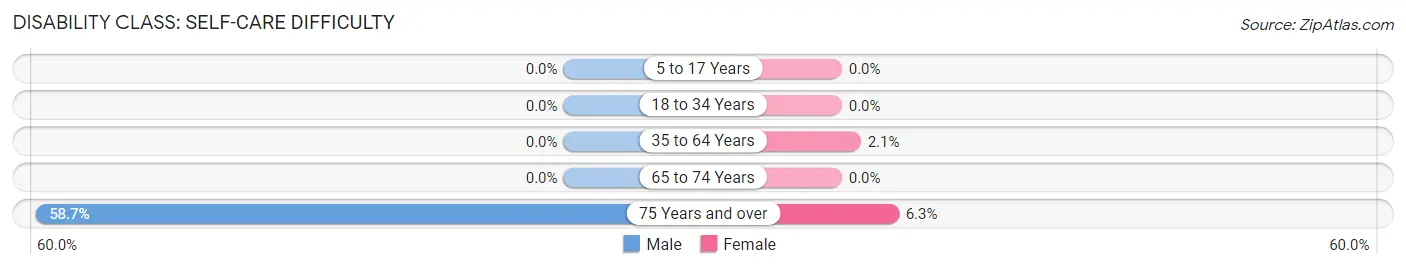
| Age Bracket | Male | Female |
| 5 to 17 Years | 0 (0.0%) | 0 (0.0%) |
| 18 to 34 Years | 0 (0.0%) | 0 (0.0%) |
| 35 to 64 Years | 0 (0.0%) | 10 (2.1%) |
| 65 to 74 Years | 0 (0.0%) | 0 (0.0%) |
| 75 Years and over | 81 (58.7%) | 13 (6.3%) |
Technology Access in Pemberton Heights
Computing Device Access in Pemberton Heights
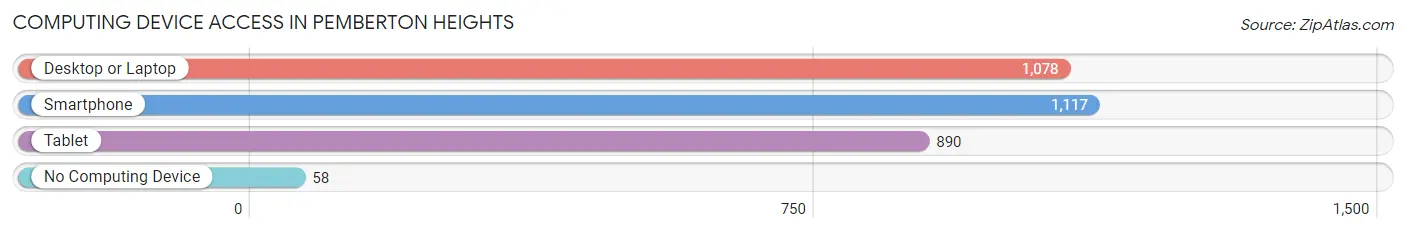
| Device Type | # Households | % Households |
| Desktop or Laptop | 1,078 | 86.6% |
| Smartphone | 1,117 | 89.7% |
| Tablet | 890 | 71.5% |
| No Computing Device | 58 | 4.7% |
| Total | 1,245 | 100.0% |
Internet Access in Pemberton Heights
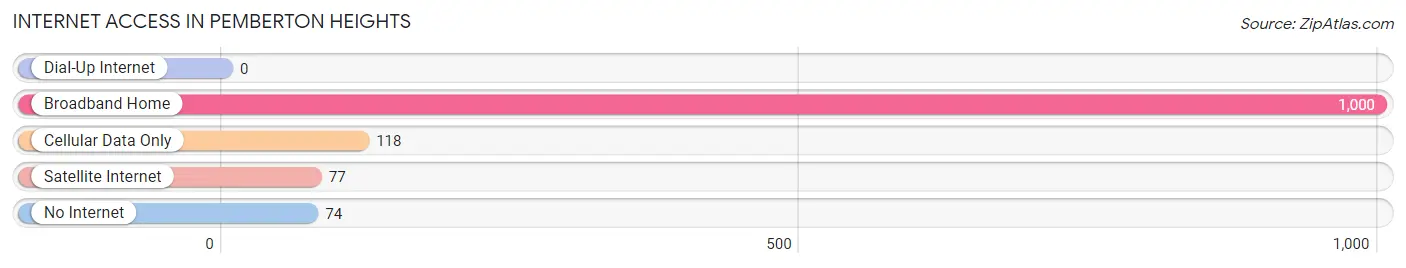
| Internet Type | # Households | % Households |
| Dial-Up Internet | 0 | 0.0% |
| Broadband Home | 1,000 | 80.3% |
| Cellular Data Only | 118 | 9.5% |
| Satellite Internet | 77 | 6.2% |
| No Internet | 74 | 5.9% |
| Total | 1,245 | 100.0% |
Pemberton Heights Summary
Pemberton Heights is a small, unincorporated community located in Burlington County, New Jersey. It is situated in the northern part of the county, just south of the city of Mount Holly. The community is bordered by the townships of Pemberton, Eastampton, and Lumberton. Pemberton Heights is a rural area with a population of approximately 1,000 people.
History
Pemberton Heights was originally part of the Lenape Indian territory. The area was first settled by Europeans in the late 1600s. The first settlers were Quakers from England who established a small farming community. The area was known as Pemberton Township until 1846 when it was incorporated as a borough. The name Pemberton was chosen in honor of the Pemberton family, who were prominent landowners in the area.
In the late 1800s, the area began to experience rapid growth due to the development of the railroad. The railroad allowed for the transportation of goods and people to and from the area. This led to the development of several industries, including a brickyard, a sawmill, and a paper mill.
The area continued to grow throughout the 20th century. In the 1950s, the area experienced a population boom due to the construction of several housing developments. This led to the construction of several schools, churches, and other amenities.
Geography
Pemberton Heights is located in the northern part of Burlington County, New Jersey. It is situated in the Pine Barrens, a large area of pine forests and wetlands. The area is characterized by rolling hills and sandy soil. The area is also home to several small lakes and streams.
The climate in Pemberton Heights is typical of the northeastern United States. Summers are hot and humid, while winters are cold and snowy. The average annual temperature is around 50 degrees Fahrenheit.
Economy
The economy of Pemberton Heights is largely based on agriculture and tourism. The area is home to several farms, which produce a variety of fruits and vegetables. The area is also home to several wineries, which produce a variety of wines.
Tourism is also an important part of the local economy. The area is home to several historic sites, including the Pemberton Historical Society Museum and the Pemberton Mill. The area is also home to several parks and recreational areas, including the Pemberton Park and the Pemberton Wildlife Management Area.
Demographics
As of the 2010 census, the population of Pemberton Heights was 1,000 people. The racial makeup of the area was 94.2% White, 2.2% African American, 0.7% Asian, 0.3% Native American, and 2.6% from other races. The median household income was $50,000.
Pemberton Heights is a small, rural community with a close-knit community. The area is home to several churches, schools, and other amenities. The area is also home to several small businesses, including restaurants, shops, and other services.
Common Questions
What is Per Capita Income in Pemberton Heights?
Per Capita income in Pemberton Heights is $48,973.
What is the Median Family Income in Pemberton Heights?
Median Family Income in Pemberton Heights is $108,862.
What is the Median Household income in Pemberton Heights?
Median Household Income in Pemberton Heights is $73,798.
What is Income or Wage Gap in Pemberton Heights?
Income or Wage Gap in Pemberton Heights is 9.7%.
Women in Pemberton Heights earn 90.3 cents for every dollar earned by a man.
What is Inequality or Gini Index in Pemberton Heights?
Inequality or Gini Index in Pemberton Heights is 0.46.
What is the Total Population of Pemberton Heights?
Total Population of Pemberton Heights is 2,776.
What is the Total Male Population of Pemberton Heights?
Total Male Population of Pemberton Heights is 1,359.
What is the Total Female Population of Pemberton Heights?
Total Female Population of Pemberton Heights is 1,417.
What is the Ratio of Males per 100 Females in Pemberton Heights?
There are 95.91 Males per 100 Females in Pemberton Heights.
What is the Ratio of Females per 100 Males in Pemberton Heights?
There are 104.27 Females per 100 Males in Pemberton Heights.
What is the Median Population Age in Pemberton Heights?
Median Population Age in Pemberton Heights is 38.4 Years.
What is the Average Family Size in Pemberton Heights
Average Family Size in Pemberton Heights is 3.1 People.
What is the Average Household Size in Pemberton Heights
Average Household Size in Pemberton Heights is 2.2 People.
How Large is the Labor Force in Pemberton Heights?
There are 1,591 People in the Labor Forcein in Pemberton Heights.
What is the Percentage of People in the Labor Force in Pemberton Heights?
65.7% of People are in the Labor Force in Pemberton Heights.