Finesville, NJ Map & Demographics
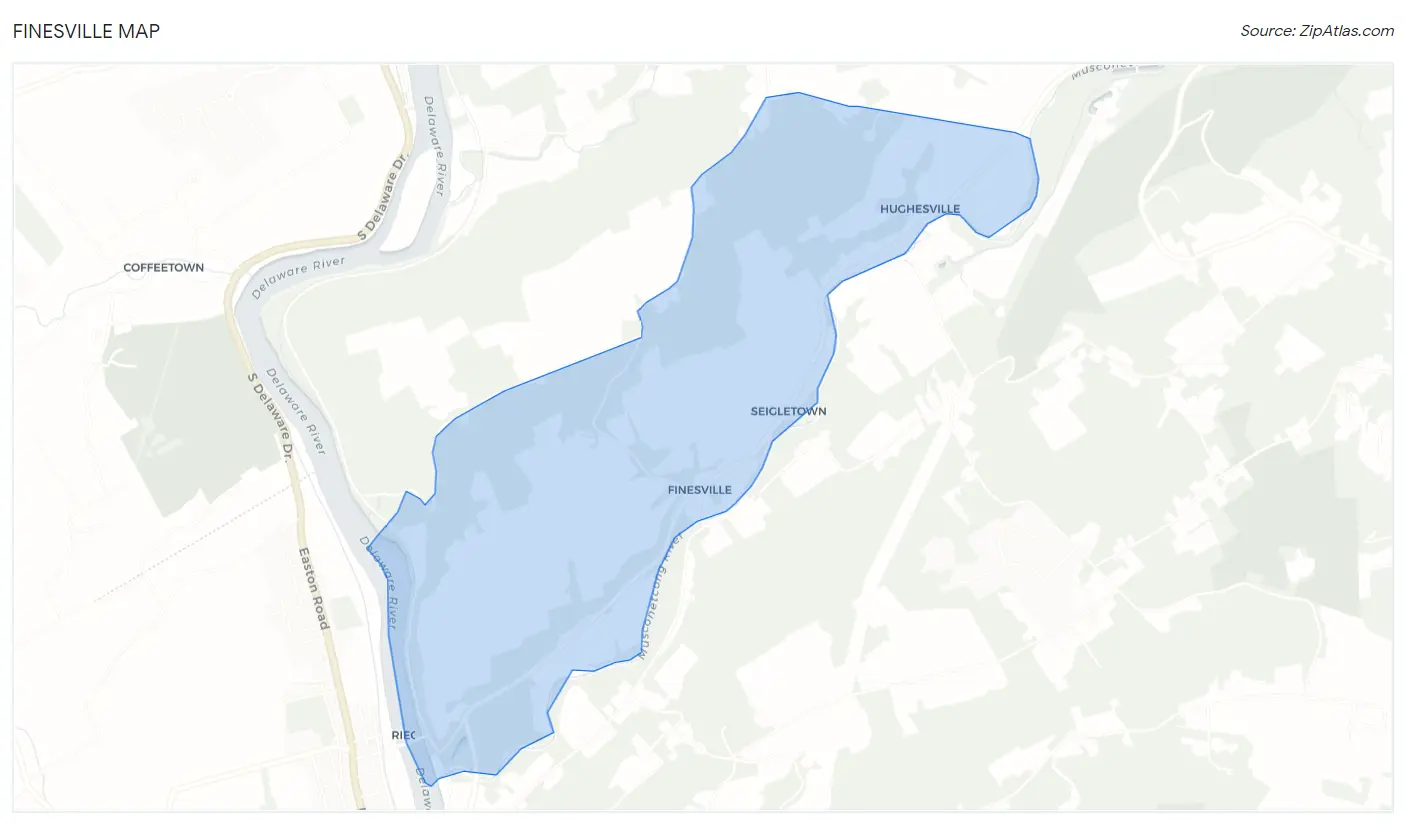
Finesville Map
Finesville Overview
$60,247
PER CAPITA INCOME
$118,917
AVG FAMILY INCOME
$63,833
AVG HOUSEHOLD INCOME
20.7%
WAGE / INCOME GAP [ % ]
79.3¢/ $1
WAGE / INCOME GAP [ $ ]
0.49
INEQUALITY / GINI INDEX
331
TOTAL POPULATION
138
MALE POPULATION
193
FEMALE POPULATION
71.50
MALES / 100 FEMALES
139.86
FEMALES / 100 MALES
61.6
MEDIAN AGE
2.4
AVG FAMILY SIZE
1.8
AVG HOUSEHOLD SIZE
163
LABOR FORCE [ PEOPLE ]
51.6%
PERCENT IN LABOR FORCE
14.7%
UNEMPLOYMENT RATE
Income in Finesville
Income Overview in Finesville
Per Capita Income in Finesville is $60,247, while median incomes of families and households are $118,917 and $63,833 respectively.
| Characteristic | Number | Measure |
| Per Capita Income | 331 | $60,247 |
| Median Family Income | 95 | $118,917 |
| Mean Family Income | 95 | $165,283 |
| Median Household Income | 188 | $63,833 |
| Mean Household Income | 188 | $106,339 |
| Income Deficit | 95 | $0 |
| Wage / Income Gap (%) | 331 | 20.72% |
| Wage / Income Gap ($) | 331 | 79.28¢ per $1 |
| Gini / Inequality Index | 331 | 0.49 |
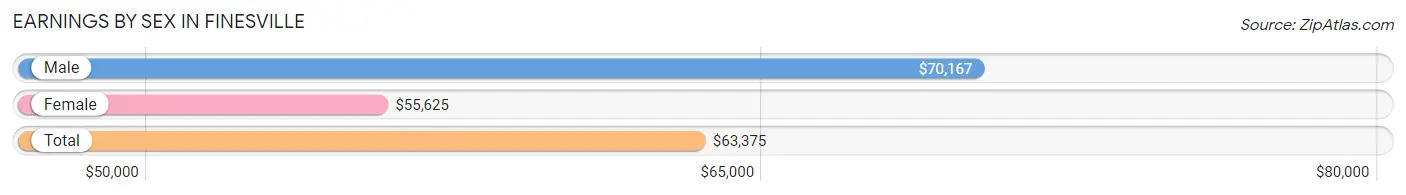
Earnings by Sex in Finesville
Average Earnings in Finesville are $63,375, $70,167 for men and $55,625 for women, a difference of 20.7%.
| Sex | Number | Average Earnings |
| Male | 74 (45.4%) | $70,167 |
| Female | 89 (54.6%) | $55,625 |
| Total | 163 (100.0%) | $63,375 |
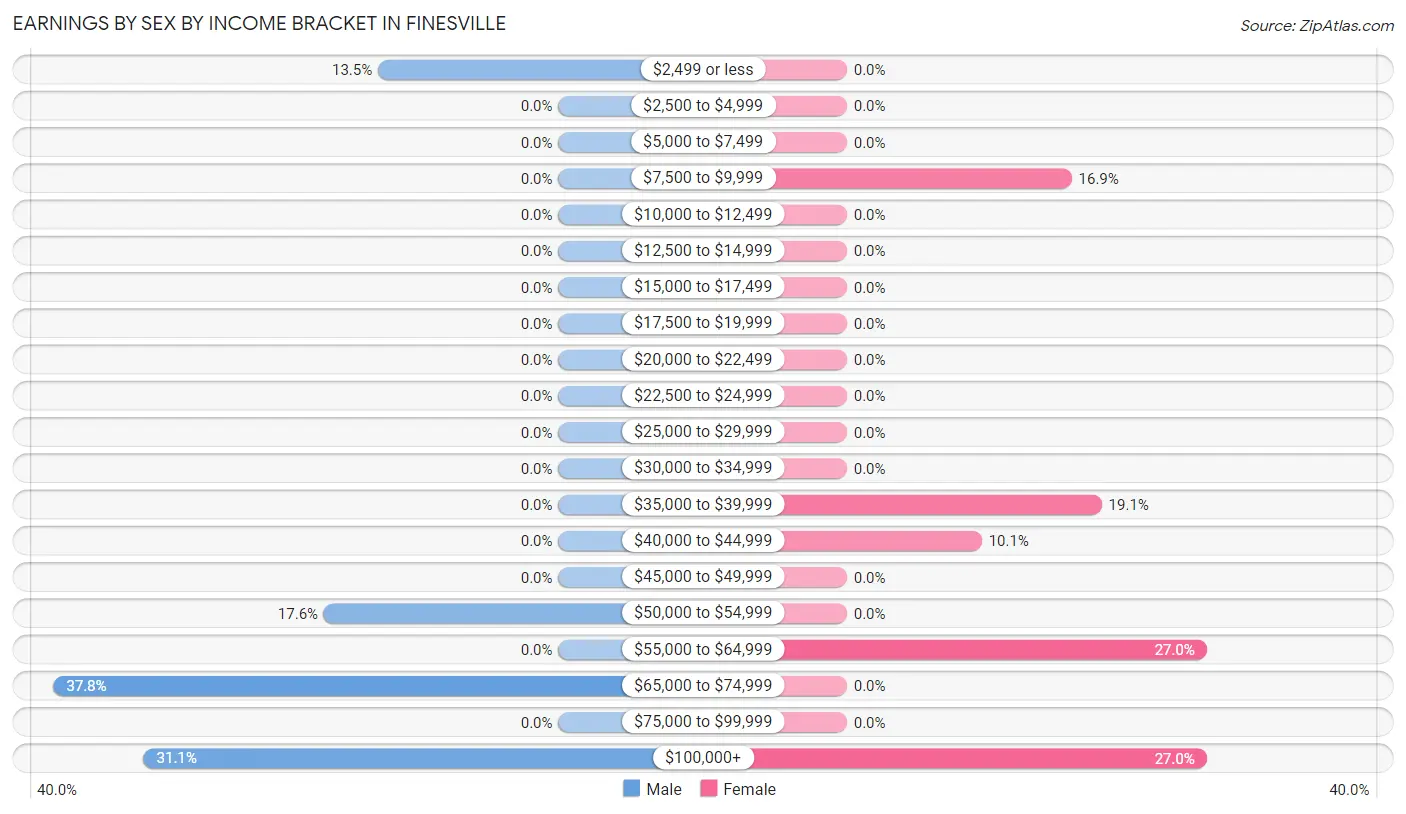
Earnings by Sex by Income Bracket in Finesville
The most common earnings brackets in Finesville are $65,000 to $74,999 for men (28 | 37.8%) and $55,000 to $64,999 for women (24 | 27.0%).
| Income | Male | Female |
| $2,499 or less | 10 (13.5%) | 0 (0.0%) |
| $2,500 to $4,999 | 0 (0.0%) | 0 (0.0%) |
| $5,000 to $7,499 | 0 (0.0%) | 0 (0.0%) |
| $7,500 to $9,999 | 0 (0.0%) | 15 (16.9%) |
| $10,000 to $12,499 | 0 (0.0%) | 0 (0.0%) |
| $12,500 to $14,999 | 0 (0.0%) | 0 (0.0%) |
| $15,000 to $17,499 | 0 (0.0%) | 0 (0.0%) |
| $17,500 to $19,999 | 0 (0.0%) | 0 (0.0%) |
| $20,000 to $22,499 | 0 (0.0%) | 0 (0.0%) |
| $22,500 to $24,999 | 0 (0.0%) | 0 (0.0%) |
| $25,000 to $29,999 | 0 (0.0%) | 0 (0.0%) |
| $30,000 to $34,999 | 0 (0.0%) | 0 (0.0%) |
| $35,000 to $39,999 | 0 (0.0%) | 17 (19.1%) |
| $40,000 to $44,999 | 0 (0.0%) | 9 (10.1%) |
| $45,000 to $49,999 | 0 (0.0%) | 0 (0.0%) |
| $50,000 to $54,999 | 13 (17.6%) | 0 (0.0%) |
| $55,000 to $64,999 | 0 (0.0%) | 24 (27.0%) |
| $65,000 to $74,999 | 28 (37.8%) | 0 (0.0%) |
| $75,000 to $99,999 | 0 (0.0%) | 0 (0.0%) |
| $100,000+ | 23 (31.1%) | 24 (27.0%) |
| Total | 74 (100.0%) | 89 (100.0%) |
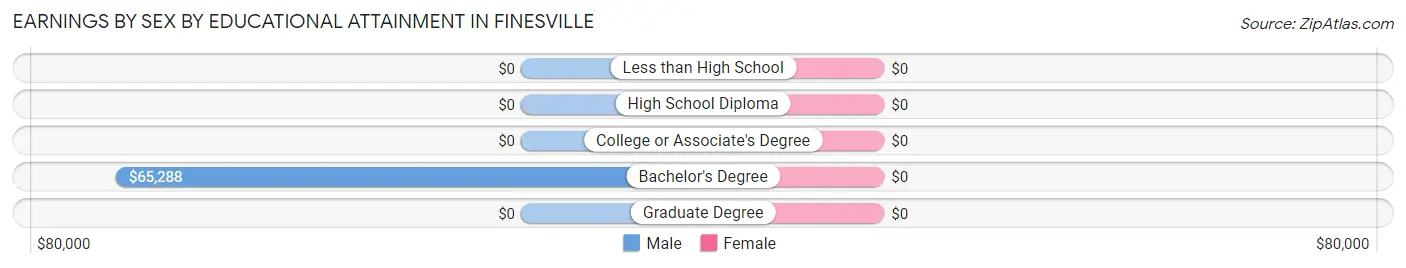
Earnings by Sex by Educational Attainment in Finesville
| Educational Attainment | Male Income | Female Income |
| Less than High School | - | - |
| High School Diploma | - | - |
| College or Associate's Degree | - | - |
| Bachelor's Degree | $65,288 | $0 |
| Graduate Degree | - | - |
| Total | $70,167 | $55,625 |
Family Income in Finesville
Family Income Brackets in Finesville
According to the Finesville family income data, there are 34 families falling into the $100,000 to $149,999 income range, which is the most common income bracket and makes up 35.8% of all families.
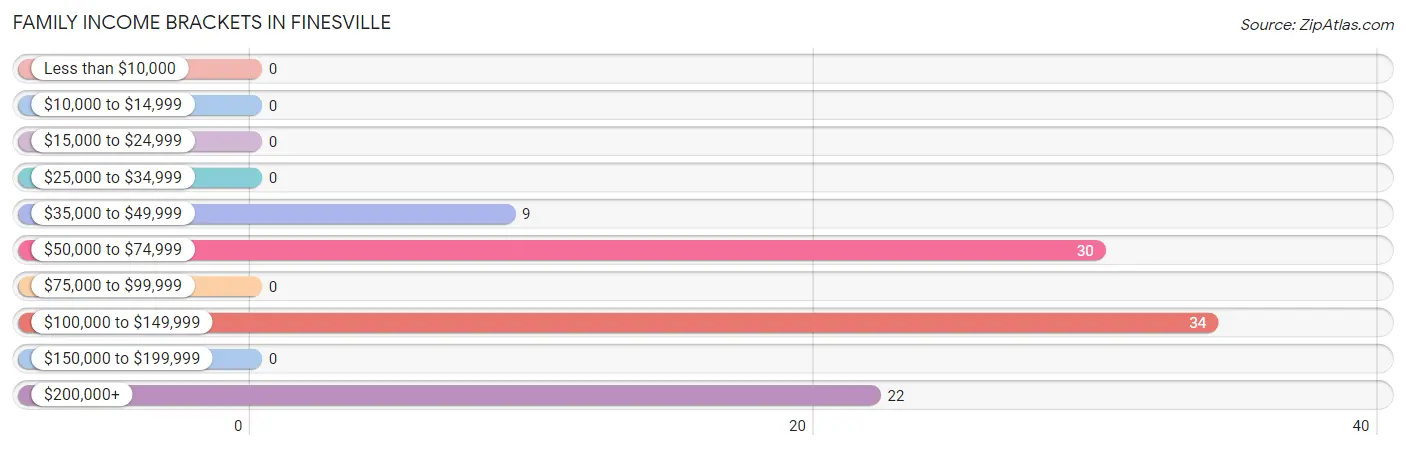
| Income Bracket | # Families | % Families |
| Less than $10,000 | 0 | 0.0% |
| $10,000 to $14,999 | 0 | 0.0% |
| $15,000 to $24,999 | 0 | 0.0% |
| $25,000 to $34,999 | 0 | 0.0% |
| $35,000 to $49,999 | 9 | 9.5% |
| $50,000 to $74,999 | 30 | 31.6% |
| $75,000 to $99,999 | 0 | 0.0% |
| $100,000 to $149,999 | 34 | 35.8% |
| $150,000 to $199,999 | 0 | 0.0% |
| $200,000+ | 22 | 23.2% |
Family Income by Famaliy Size in Finesville
2-person families (38 | 40.0%) account for the highest median family income in Finesville with $133,750 per family, while 2-person families (38 | 40.0%) have the highest median income of $66,875 per family member.
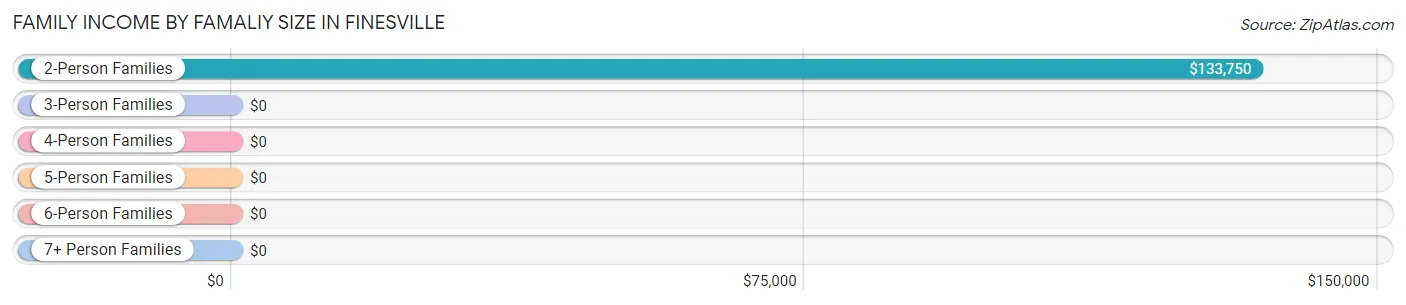
| Income Bracket | # Families | Median Income |
| 2-Person Families | 38 (40.0%) | $133,750 |
| 3-Person Families | 45 (47.4%) | $0 |
| 4-Person Families | 12 (12.6%) | $0 |
| 5-Person Families | 0 (0.0%) | $0 |
| 6-Person Families | 0 (0.0%) | $0 |
| 7+ Person Families | 0 (0.0%) | $0 |
| Total | 95 (100.0%) | $118,917 |
Family Income by Number of Earners in Finesville
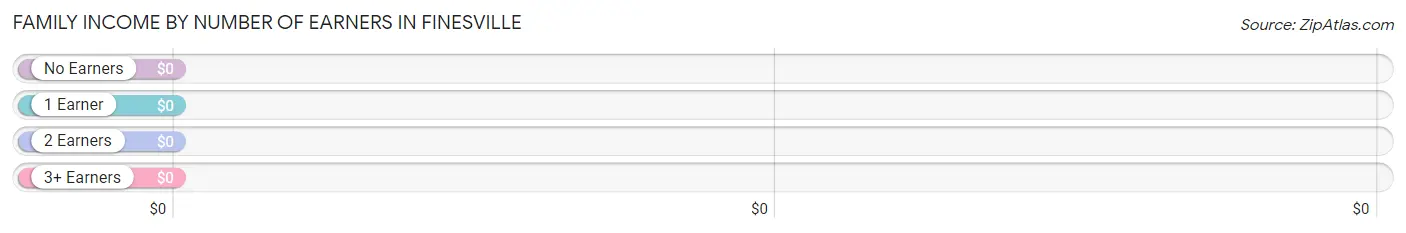
| Number of Earners | # Families | Median Income |
| No Earners | 9 (9.5%) | $0 |
| 1 Earner | 49 (51.6%) | $0 |
| 2 Earners | 10 (10.5%) | $0 |
| 3+ Earners | 27 (28.4%) | $0 |
| Total | 95 (100.0%) | $118,917 |
Household Income in Finesville
Household Income Brackets in Finesville
With 93 households falling in the category, the $50,000 to $74,999 income range is the most frequent in Finesville, accounting for 49.5% of all households.
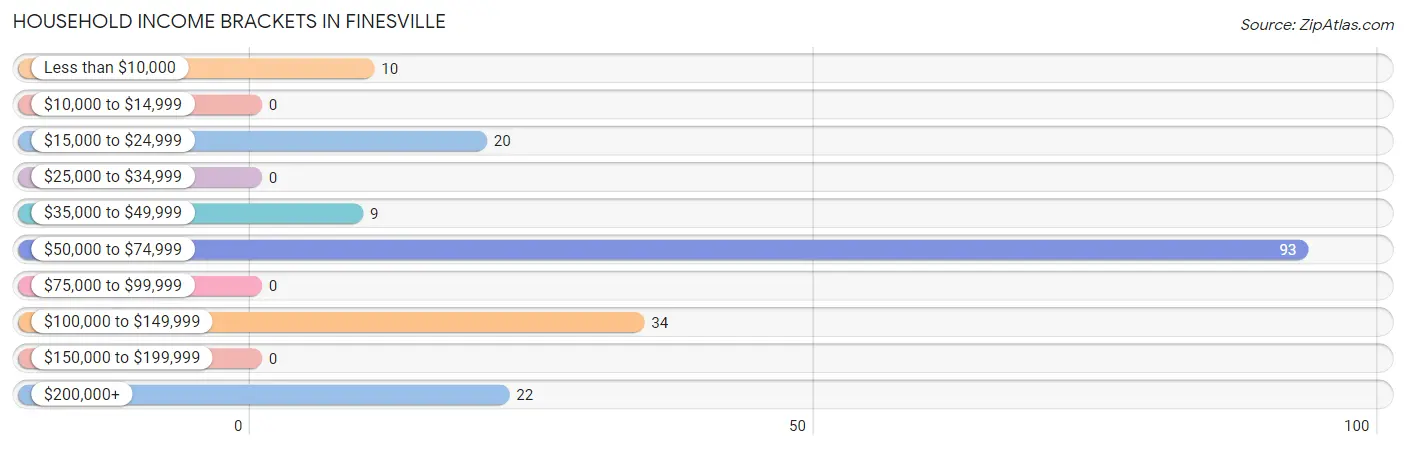
| Income Bracket | # Households | % Households |
| Less than $10,000 | 10 | 5.3% |
| $10,000 to $14,999 | 0 | 0.0% |
| $15,000 to $24,999 | 20 | 10.6% |
| $25,000 to $34,999 | 0 | 0.0% |
| $35,000 to $49,999 | 9 | 4.8% |
| $50,000 to $74,999 | 93 | 49.5% |
| $75,000 to $99,999 | 0 | 0.0% |
| $100,000 to $149,999 | 34 | 18.1% |
| $150,000 to $199,999 | 0 | 0.0% |
| $200,000+ | 22 | 11.7% |
Household Income by Householder Age in Finesville
The median household income in Finesville is $63,833, with the highest median household income of $56,250 found in the 45 to 64 years age bracket for the primary householder. A total of 103 households (54.8%) fall into this category. Meanwhile, the 15 to 24 years age bracket for the primary householder has the lowest median household income of $0, with 30 households (16.0%) in this group.
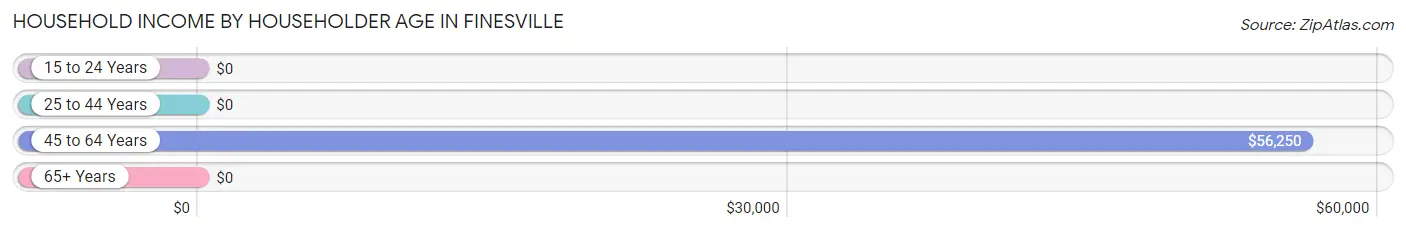
| Income Bracket | # Households | Median Income |
| 15 to 24 Years | 30 (16.0%) | $0 |
| 25 to 44 Years | 0 (0.0%) | $0 |
| 45 to 64 Years | 103 (54.8%) | $56,250 |
| 65+ Years | 55 (29.3%) | $0 |
| Total | 188 (100.0%) | $63,833 |
Poverty in Finesville
Income Below Poverty by Sex and Age in Finesville
With 7.2% poverty level for males and 4.2% for females among the residents of Finesville, 55 to 64 year old males and 55 to 64 year old females are the most vulnerable to poverty, with 10 males (14.1%) and 8 females (11.1%) in their respective age groups living below the poverty level.
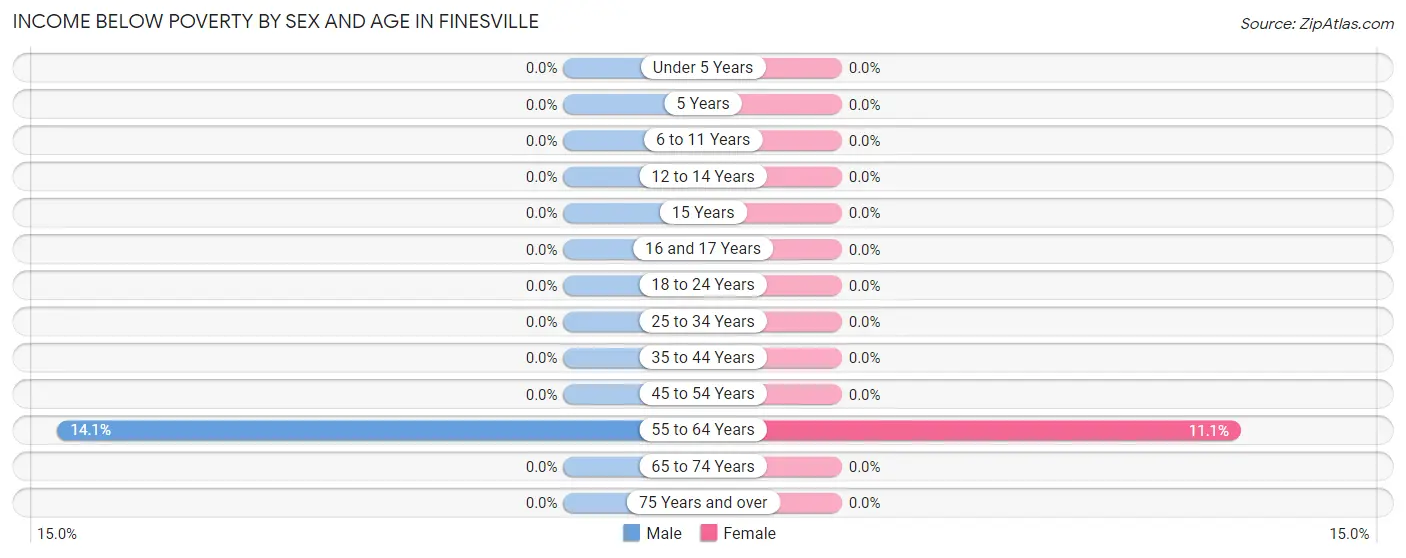
| Age Bracket | Male | Female |
| Under 5 Years | 0 (0.0%) | 0 (0.0%) |
| 5 Years | 0 (0.0%) | 0 (0.0%) |
| 6 to 11 Years | 0 (0.0%) | 0 (0.0%) |
| 12 to 14 Years | 0 (0.0%) | 0 (0.0%) |
| 15 Years | 0 (0.0%) | 0 (0.0%) |
| 16 and 17 Years | 0 (0.0%) | 0 (0.0%) |
| 18 to 24 Years | 0 (0.0%) | 0 (0.0%) |
| 25 to 34 Years | 0 (0.0%) | 0 (0.0%) |
| 35 to 44 Years | 0 (0.0%) | 0 (0.0%) |
| 45 to 54 Years | 0 (0.0%) | 0 (0.0%) |
| 55 to 64 Years | 10 (14.1%) | 8 (11.1%) |
| 65 to 74 Years | 0 (0.0%) | 0 (0.0%) |
| 75 Years and over | 0 (0.0%) | 0 (0.0%) |
| Total | 10 (7.2%) | 8 (4.2%) |
Income Above Poverty by Sex and Age in Finesville
According to the poverty statistics in Finesville, males aged under 5 years and females aged 18 to 24 years are the age groups that are most secure financially, with 100.0% of males and 100.0% of females in these age groups living above the poverty line.
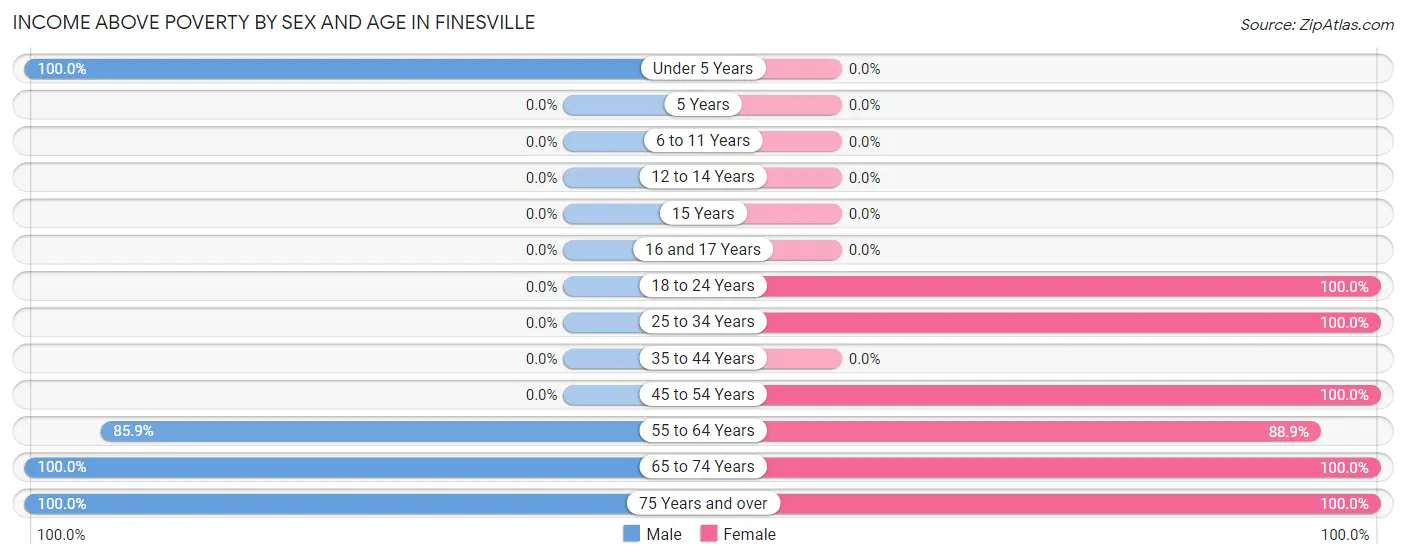
| Age Bracket | Male | Female |
| Under 5 Years | 15 (100.0%) | 0 (0.0%) |
| 5 Years | 0 (0.0%) | 0 (0.0%) |
| 6 to 11 Years | 0 (0.0%) | 0 (0.0%) |
| 12 to 14 Years | 0 (0.0%) | 0 (0.0%) |
| 15 Years | 0 (0.0%) | 0 (0.0%) |
| 16 and 17 Years | 0 (0.0%) | 0 (0.0%) |
| 18 to 24 Years | 0 (0.0%) | 30 (100.0%) |
| 25 to 34 Years | 0 (0.0%) | 15 (100.0%) |
| 35 to 44 Years | 0 (0.0%) | 0 (0.0%) |
| 45 to 54 Years | 0 (0.0%) | 31 (100.0%) |
| 55 to 64 Years | 61 (85.9%) | 64 (88.9%) |
| 65 to 74 Years | 39 (100.0%) | 23 (100.0%) |
| 75 Years and over | 13 (100.0%) | 22 (100.0%) |
| Total | 128 (92.7%) | 185 (95.9%) |
Income Below Poverty Among Married-Couple Families in Finesville
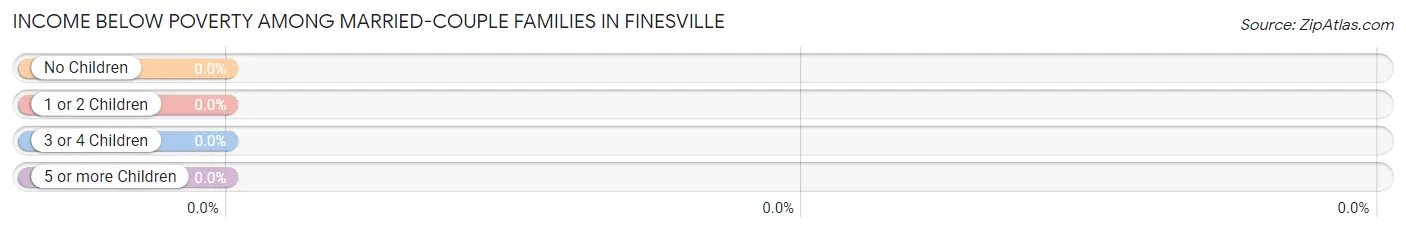
| Children | Above Poverty | Below Poverty |
| No Children | 65 (100.0%) | 0 (0.0%) |
| 1 or 2 Children | 0 (0.0%) | 0 (0.0%) |
| 3 or 4 Children | 0 (0.0%) | 0 (0.0%) |
| 5 or more Children | 0 (0.0%) | 0 (0.0%) |
| Total | 65 (100.0%) | 0 (0.0%) |
Income Below Poverty Among Single-Parent Households in Finesville
| Children | Single Father | Single Mother |
| No Children | 0 (0.0%) | 0 (0.0%) |
| 1 or 2 Children | 0 (0.0%) | 0 (0.0%) |
| 3 or 4 Children | 0 (0.0%) | 0 (0.0%) |
| 5 or more Children | 0 (0.0%) | 0 (0.0%) |
| Total | 0 (0.0%) | 0 (0.0%) |
Income Below Poverty Among Married-Couple vs Single-Parent Households in Finesville
| Children | Married-Couple Families | Single-Parent Households |
| No Children | 0 (0.0%) | 0 (0.0%) |
| 1 or 2 Children | 0 (0.0%) | 0 (0.0%) |
| 3 or 4 Children | 0 (0.0%) | 0 (0.0%) |
| 5 or more Children | 0 (0.0%) | 0 (0.0%) |
| Total | 0 (0.0%) | 0 (0.0%) |
Race in Finesville
The most populous races in Finesville are , and White / Caucasian (331 | 100.0%).
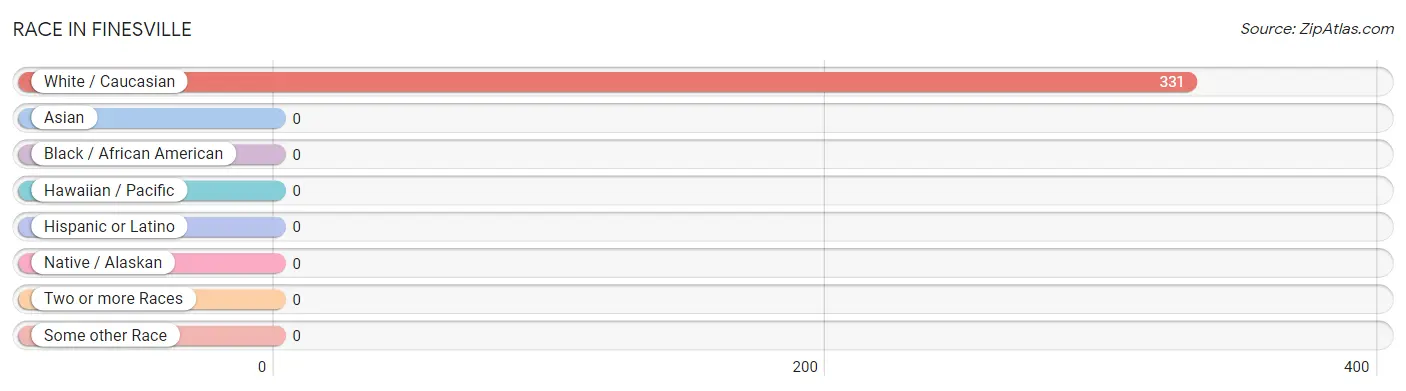
| Race | # Population | % Population |
| Asian | 0 | 0.0% |
| Black / African American | 0 | 0.0% |
| Hawaiian / Pacific | 0 | 0.0% |
| Hispanic or Latino | 0 | 0.0% |
| Native / Alaskan | 0 | 0.0% |
| White / Caucasian | 331 | 100.0% |
| Two or more Races | 0 | 0.0% |
| Some other Race | 0 | 0.0% |
| Total | 331 | 100.0% |
Ancestry in Finesville
The most populous ancestries reported in Finesville are English (181 | 54.7%), Irish (127 | 38.4%), German (53 | 16.0%), Polish (35 | 10.6%), and Italian (30 | 9.1%), together accounting for 128.7% of all Finesville residents.
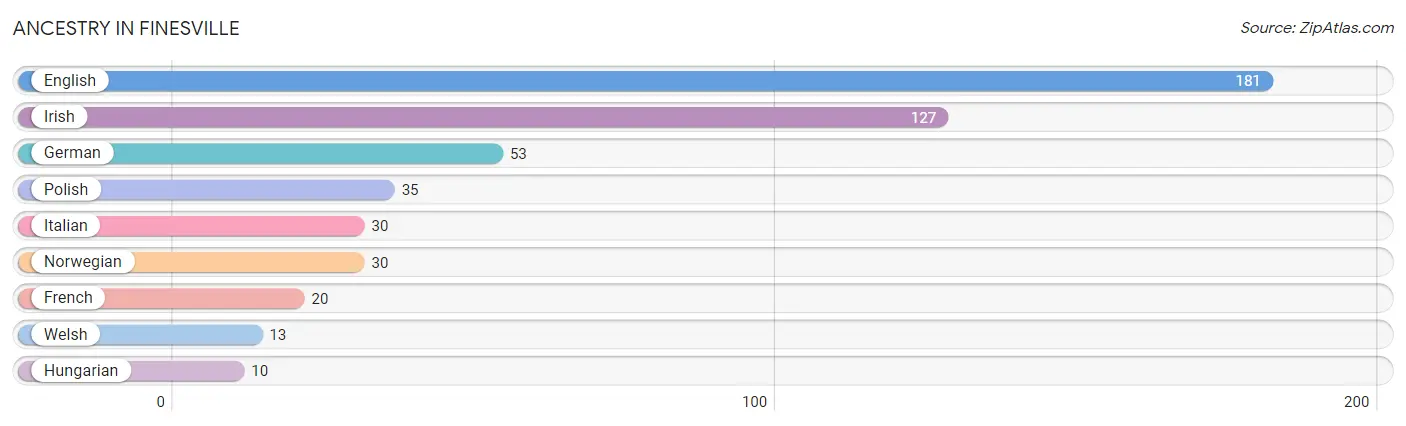
| Ancestry | # Population | % Population |
| English | 181 | 54.7% |
| French | 20 | 6.0% |
| German | 53 | 16.0% |
| Hungarian | 10 | 3.0% |
| Irish | 127 | 38.4% |
| Italian | 30 | 9.1% |
| Norwegian | 30 | 9.1% |
| Polish | 35 | 10.6% |
| Welsh | 13 | 3.9% | View All 9 Rows |
Immigrants in Finesville

| Immigration Origin | # Population | % Population | View All 0 Rows |
Sex and Age in Finesville
Sex and Age in Finesville
The most populous age groups in Finesville are 55 to 59 Years (41 | 29.7%) for men and 60 to 64 Years (63 | 32.6%) for women.
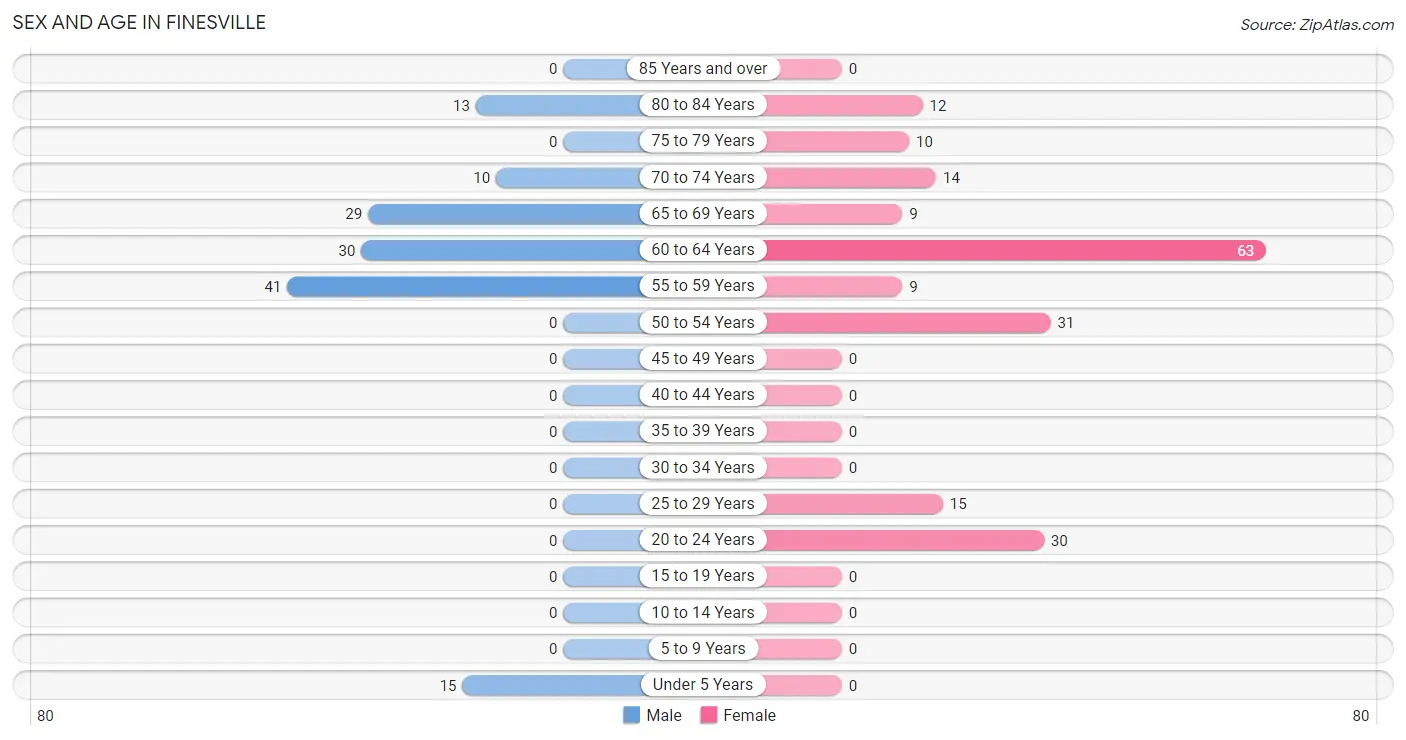
| Age Bracket | Male | Female |
| Under 5 Years | 15 (10.9%) | 0 (0.0%) |
| 5 to 9 Years | 0 (0.0%) | 0 (0.0%) |
| 10 to 14 Years | 0 (0.0%) | 0 (0.0%) |
| 15 to 19 Years | 0 (0.0%) | 0 (0.0%) |
| 20 to 24 Years | 0 (0.0%) | 30 (15.5%) |
| 25 to 29 Years | 0 (0.0%) | 15 (7.8%) |
| 30 to 34 Years | 0 (0.0%) | 0 (0.0%) |
| 35 to 39 Years | 0 (0.0%) | 0 (0.0%) |
| 40 to 44 Years | 0 (0.0%) | 0 (0.0%) |
| 45 to 49 Years | 0 (0.0%) | 0 (0.0%) |
| 50 to 54 Years | 0 (0.0%) | 31 (16.1%) |
| 55 to 59 Years | 41 (29.7%) | 9 (4.7%) |
| 60 to 64 Years | 30 (21.7%) | 63 (32.6%) |
| 65 to 69 Years | 29 (21.0%) | 9 (4.7%) |
| 70 to 74 Years | 10 (7.2%) | 14 (7.2%) |
| 75 to 79 Years | 0 (0.0%) | 10 (5.2%) |
| 80 to 84 Years | 13 (9.4%) | 12 (6.2%) |
| 85 Years and over | 0 (0.0%) | 0 (0.0%) |
| Total | 138 (100.0%) | 193 (100.0%) |
Families and Households in Finesville
Median Family Size in Finesville
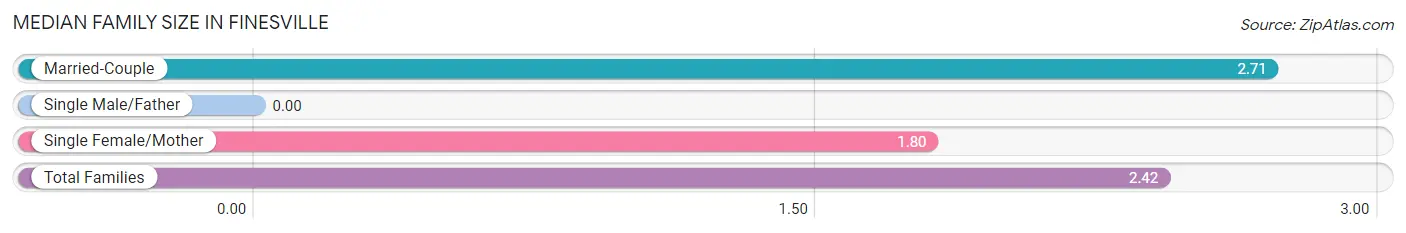
| Family Type | # Families | Family Size |
| Married-Couple | 65 (68.4%) | 2.71 |
| Single Male/Father | 0 (0.0%) | - |
| Single Female/Mother | 30 (31.6%) | 1.80 |
| Total Families | 95 (100.0%) | 2.42 |
Median Household Size in Finesville
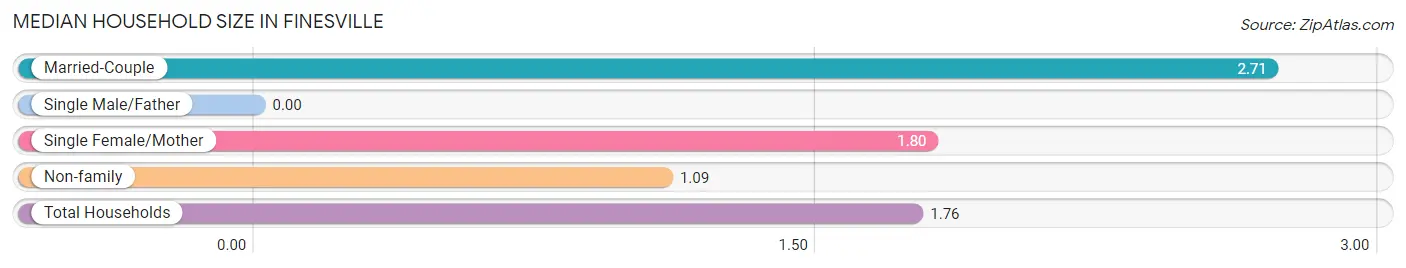
| Household Type | # Households | Household Size |
| Married-Couple | 65 (34.6%) | 2.71 |
| Single Male/Father | 0 (0.0%) | - |
| Single Female/Mother | 30 (16.0%) | 1.80 |
| Non-family | 93 (49.5%) | 1.09 |
| Total Households | 188 (100.0%) | 1.76 |
Household Size by Marriage Status in Finesville
Out of a total of 188 households in Finesville, 95 (50.5%) are family households, while 93 (49.5%) are nonfamily households. The most numerous type of family households are 3-person households, comprising 45, and the most common type of nonfamily households are 1-person households, comprising 83.
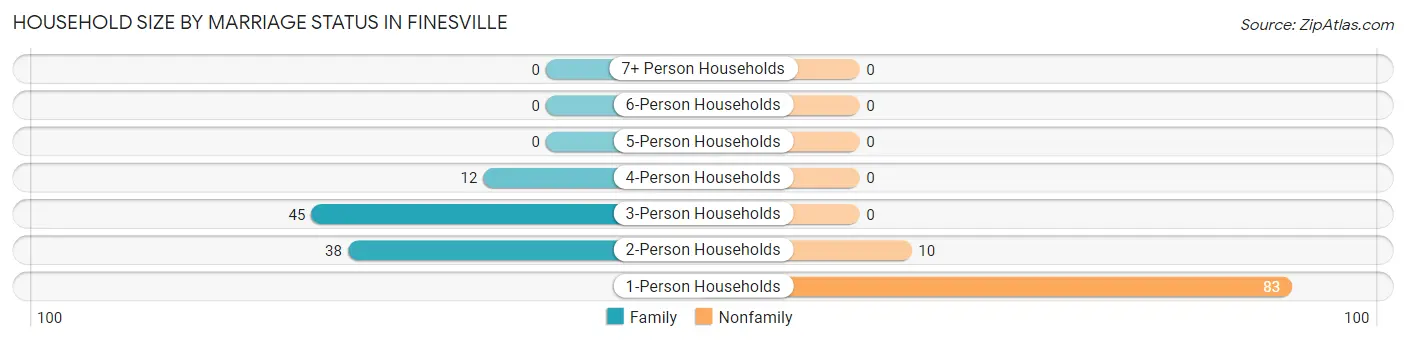
| Household Size | Family Households | Nonfamily Households |
| 1-Person Households | - | 83 (44.2%) |
| 2-Person Households | 38 (20.2%) | 10 (5.3%) |
| 3-Person Households | 45 (23.9%) | 0 (0.0%) |
| 4-Person Households | 12 (6.4%) | 0 (0.0%) |
| 5-Person Households | 0 (0.0%) | 0 (0.0%) |
| 6-Person Households | 0 (0.0%) | 0 (0.0%) |
| 7+ Person Households | 0 (0.0%) | 0 (0.0%) |
| Total | 95 (50.5%) | 93 (49.5%) |
Female Fertility in Finesville
Fertility by Age in Finesville
| Age Bracket | Women with Births | Births / 1,000 Women |
| 15 to 19 years | 0 (0.0%) | 0.0 |
| 20 to 34 years | 0 (0.0%) | 0.0 |
| 35 to 50 years | 0 (0.0%) | 0.0 |
| Total | 0 (0.0%) | 0.0 |
Fertility by Age by Marriage Status in Finesville
| Age Bracket | Married | Unmarried |
| 15 to 19 years | 0 (0.0%) | 0 (0.0%) |
| 20 to 34 years | 0 (0.0%) | 0 (0.0%) |
| 35 to 50 years | 0 (0.0%) | 0 (0.0%) |
| Total | 0 (0.0%) | 0 (0.0%) |
Fertility by Education in Finesville
| Educational Attainment | Women with Births | Births / 1,000 Women |
| Less than High School | 0 (0.0%) | 0.0 |
| High School Diploma | 0 (0.0%) | 0.0 |
| College or Associate's Degree | 0 (0.0%) | 0.0 |
| Bachelor's Degree | 0 (0.0%) | 0.0 |
| Graduate Degree | 0 (0.0%) | 0.0 |
| Total | 0 (0.0%) | 0.0 |
Fertility by Education by Marriage Status in Finesville
| Educational Attainment | Married | Unmarried |
| Less than High School | 0 (0.0%) | 0 (0.0%) |
| High School Diploma | 0 (0.0%) | 0 (0.0%) |
| College or Associate's Degree | 0 (0.0%) | 0 (0.0%) |
| Bachelor's Degree | 0 (0.0%) | 0 (0.0%) |
| Graduate Degree | 0 (0.0%) | 0 (0.0%) |
| Total | 0 (0.0%) | 0 (0.0%) |
Employment Characteristics in Finesville
Employment by Class of Employer in Finesville
Among the 139 employed individuals in Finesville, private company employees (72 | 51.8%), state government employees (28 | 20.1%), and not-for-profit organizations (25 | 18.0%) make up the most common classes of employment.
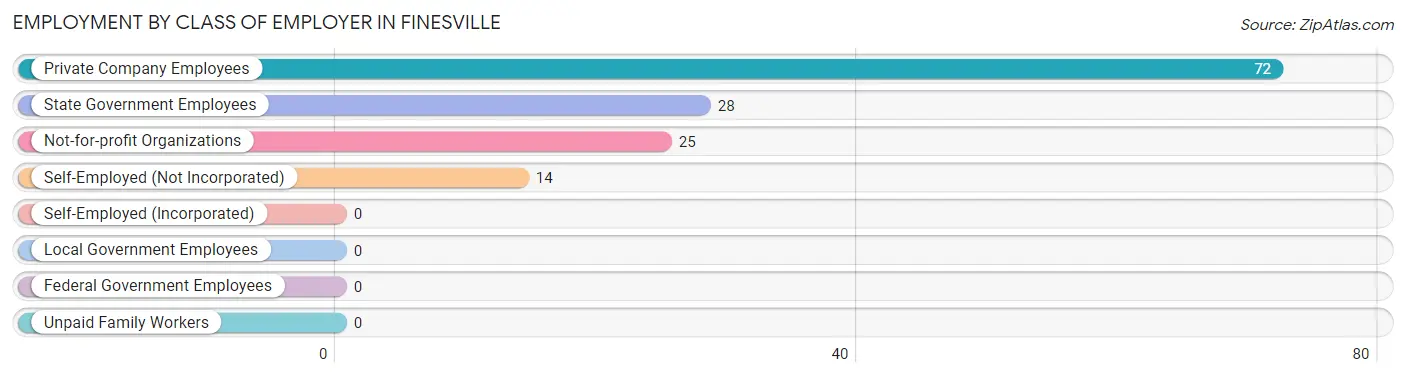
| Employer Class | # Employees | % Employees |
| Private Company Employees | 72 | 51.8% |
| Self-Employed (Incorporated) | 0 | 0.0% |
| Self-Employed (Not Incorporated) | 14 | 10.1% |
| Not-for-profit Organizations | 25 | 18.0% |
| Local Government Employees | 0 | 0.0% |
| State Government Employees | 28 | 20.1% |
| Federal Government Employees | 0 | 0.0% |
| Unpaid Family Workers | 0 | 0.0% |
| Total | 139 | 100.0% |
Employment Status by Age in Finesville
According to the labor force statistics for Finesville, out of the total population over 16 years of age (316), 51.6% or 163 individuals are in the labor force, with 14.7% or 24 of them unemployed. The age group with the highest labor force participation rate is 25 to 29 years, with 100.0% or 15 individuals in the labor force. Within the labor force, the 45 to 54 years age range has the highest percentage of unemployed individuals, with 45.2% or 14 of them being unemployed.
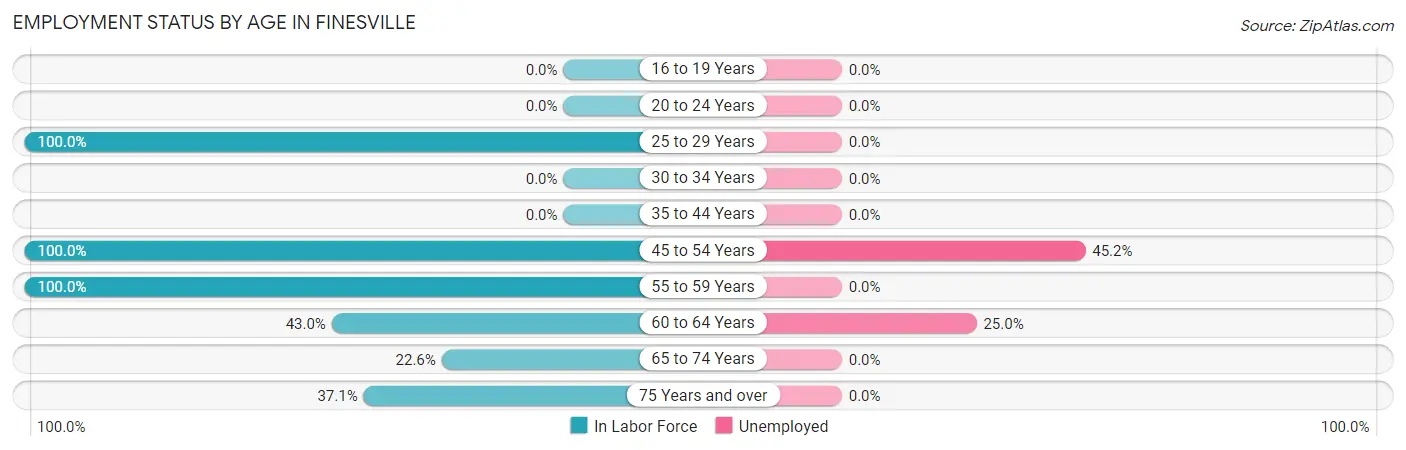
| Age Bracket | In Labor Force | Unemployed |
| 16 to 19 Years | 0 (0.0%) | 0 (0.0%) |
| 20 to 24 Years | 0 (0.0%) | 0 (0.0%) |
| 25 to 29 Years | 15 (100.0%) | 0 (0.0%) |
| 30 to 34 Years | 0 (0.0%) | 0 (0.0%) |
| 35 to 44 Years | 0 (0.0%) | 0 (0.0%) |
| 45 to 54 Years | 31 (100.0%) | 14 (45.2%) |
| 55 to 59 Years | 50 (100.0%) | 0 (0.0%) |
| 60 to 64 Years | 40 (43.0%) | 10 (25.0%) |
| 65 to 74 Years | 14 (22.6%) | 0 (0.0%) |
| 75 Years and over | 13 (37.1%) | 0 (0.0%) |
| Total | 163 (51.6%) | 24 (14.7%) |
Employment Status by Educational Attainment in Finesville
According to labor force statistics for Finesville, 72.0% of individuals (136) out of the total population between 25 and 64 years of age (189) are in the labor force, with 17.6% or 24 of them being unemployed. The group with the highest labor force participation rate are those with the educational attainment of less than high school, with 100.0% or 10 individuals in the labor force. Within the labor force, individuals with less than high school education have the highest percentage of unemployment, with 100.0% or 10 of them being unemployed.
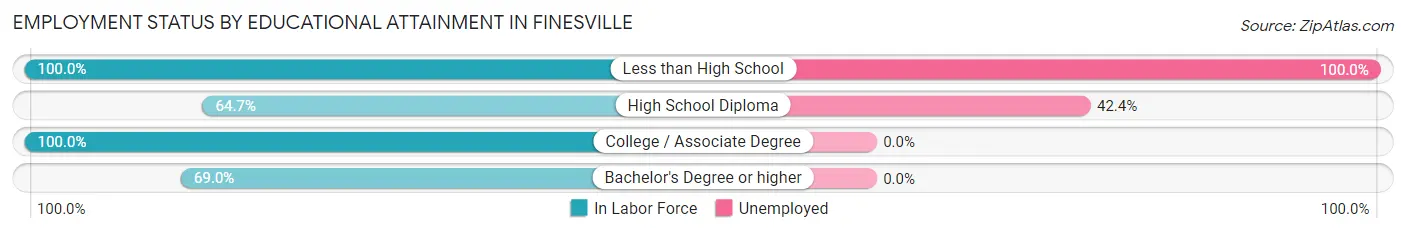
| Educational Attainment | In Labor Force | Unemployed |
| Less than High School | 10 (100.0%) | 10 (100.0%) |
| High School Diploma | 33 (64.7%) | 22 (42.4%) |
| College / Associate Degree | 15 (100.0%) | 0 (0.0%) |
| Bachelor's Degree or higher | 78 (69.0%) | 0 (0.0%) |
| Total | 136 (72.0%) | 33 (17.6%) |
Employment Occupations by Sex in Finesville
Management, Business, Science and Arts Occupations
The most common Management, Business, Science and Arts occupations in Finesville are Management (25 | 18.0%), Community & Social Service (23 | 16.6%), Business & Financial (13 | 9.3%), Education Instruction & Library (13 | 9.3%), and Computers, Engineering & Science (10 | 7.2%).
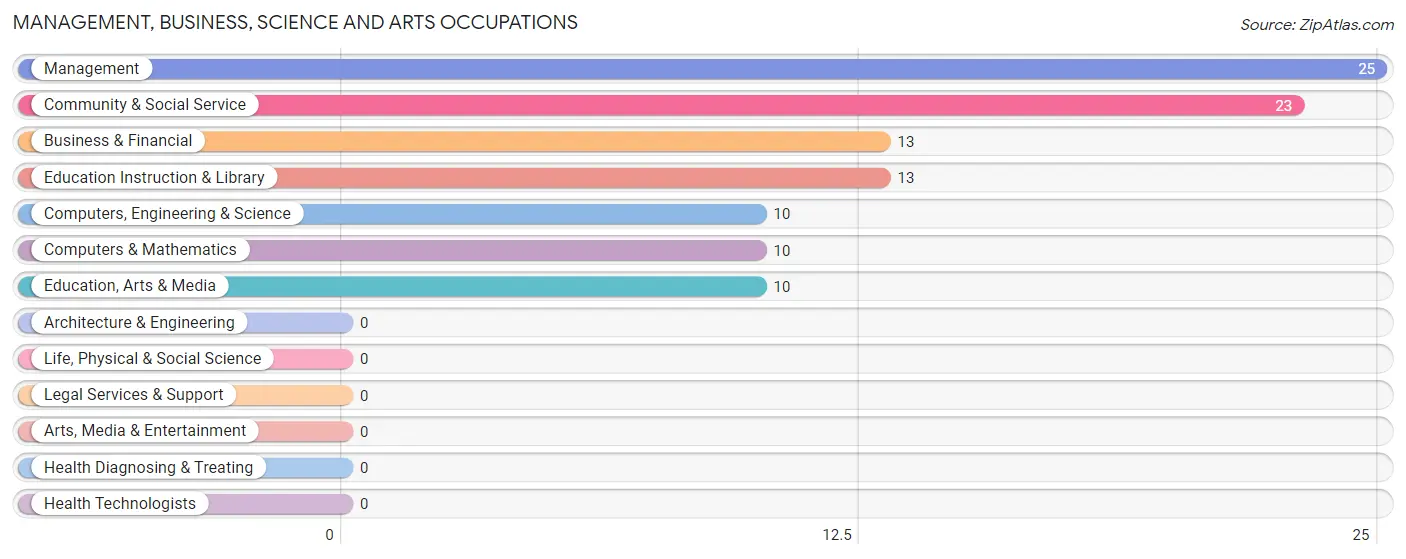
Management, Business, Science and Arts Occupations by Sex
Within the Management, Business, Science and Arts occupations in Finesville, the most male-oriented occupations are Business & Financial (100.0%), Computers, Engineering & Science (100.0%), and Computers & Mathematics (100.0%), while the most female-oriented occupations are Management (100.0%), Education, Arts & Media (100.0%), and Community & Social Service (43.5%).
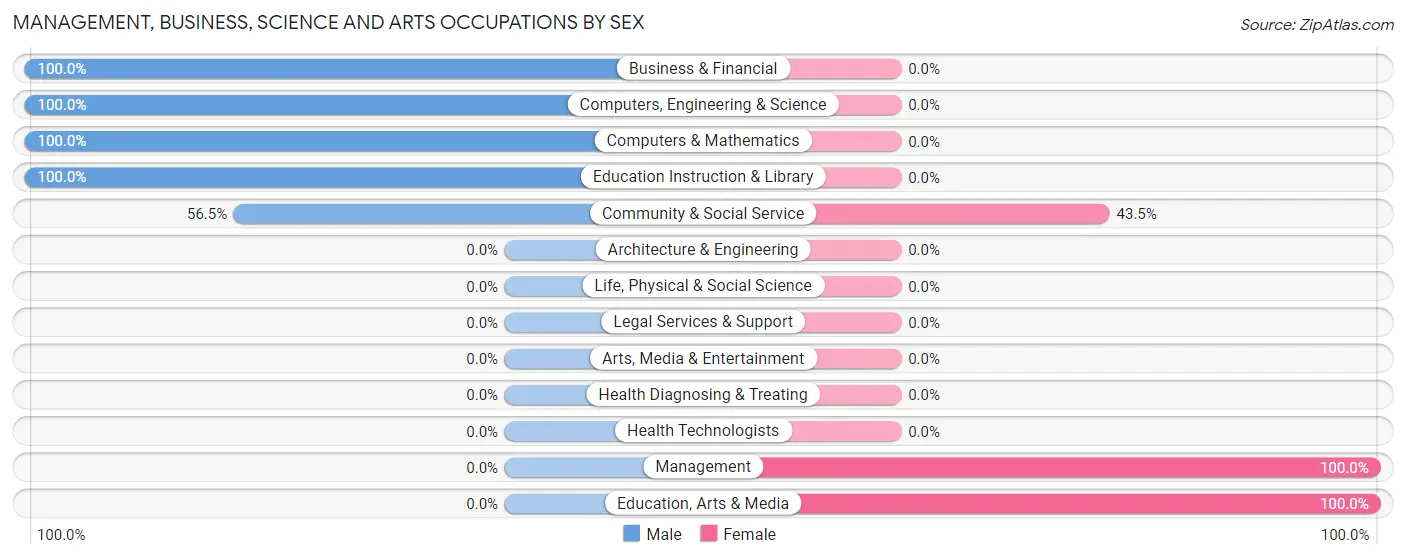
| Occupation | Male | Female |
| Management | 0 (0.0%) | 25 (100.0%) |
| Business & Financial | 13 (100.0%) | 0 (0.0%) |
| Computers, Engineering & Science | 10 (100.0%) | 0 (0.0%) |
| Computers & Mathematics | 10 (100.0%) | 0 (0.0%) |
| Architecture & Engineering | 0 (0.0%) | 0 (0.0%) |
| Life, Physical & Social Science | 0 (0.0%) | 0 (0.0%) |
| Community & Social Service | 13 (56.5%) | 10 (43.5%) |
| Education, Arts & Media | 0 (0.0%) | 10 (100.0%) |
| Legal Services & Support | 0 (0.0%) | 0 (0.0%) |
| Education Instruction & Library | 13 (100.0%) | 0 (0.0%) |
| Arts, Media & Entertainment | 0 (0.0%) | 0 (0.0%) |
| Health Diagnosing & Treating | 0 (0.0%) | 0 (0.0%) |
| Health Technologists | 0 (0.0%) | 0 (0.0%) |
| Total (Category) | 36 (50.7%) | 35 (49.3%) |
| Total (Overall) | 64 (46.0%) | 75 (54.0%) |
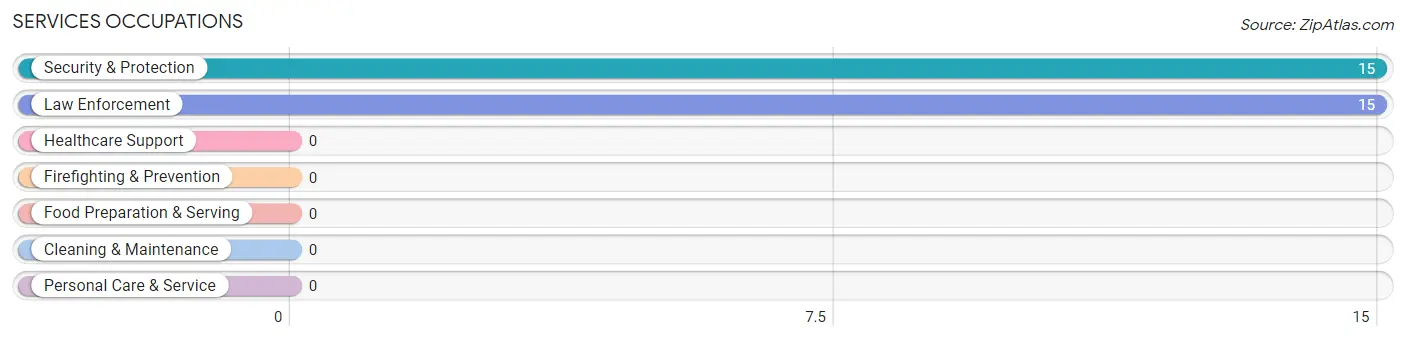
Services Occupations
The most common Services occupations in Finesville are Security & Protection (15 | 10.8%), and Law Enforcement (15 | 10.8%).
Services Occupations by Sex
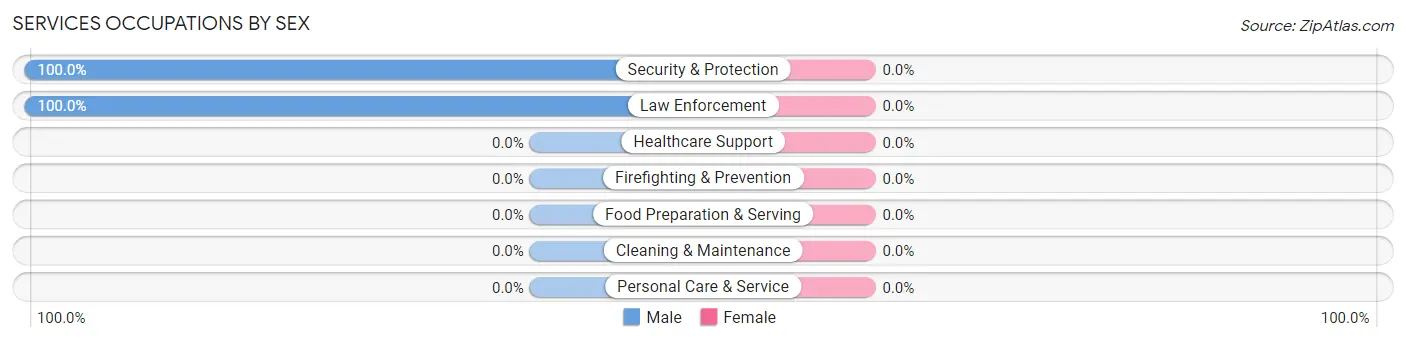
| Occupation | Male | Female |
| Healthcare Support | 0 (0.0%) | 0 (0.0%) |
| Security & Protection | 15 (100.0%) | 0 (0.0%) |
| Firefighting & Prevention | 0 (0.0%) | 0 (0.0%) |
| Law Enforcement | 15 (100.0%) | 0 (0.0%) |
| Food Preparation & Serving | 0 (0.0%) | 0 (0.0%) |
| Cleaning & Maintenance | 0 (0.0%) | 0 (0.0%) |
| Personal Care & Service | 0 (0.0%) | 0 (0.0%) |
| Total (Category) | 15 (100.0%) | 0 (0.0%) |
| Total (Overall) | 64 (46.0%) | 75 (54.0%) |
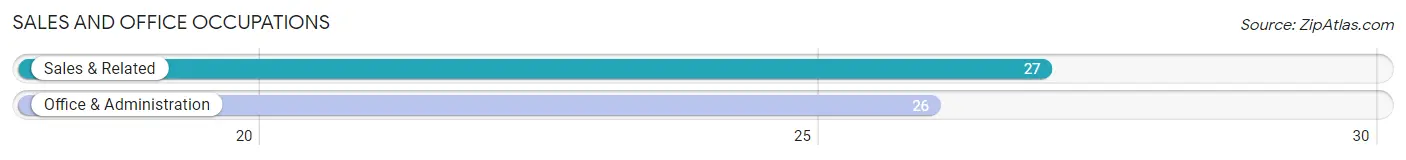
Sales and Office Occupations
The most common Sales and Office occupations in Finesville are Sales & Related (27 | 19.4%), and Office & Administration (26 | 18.7%).
Sales and Office Occupations by Sex
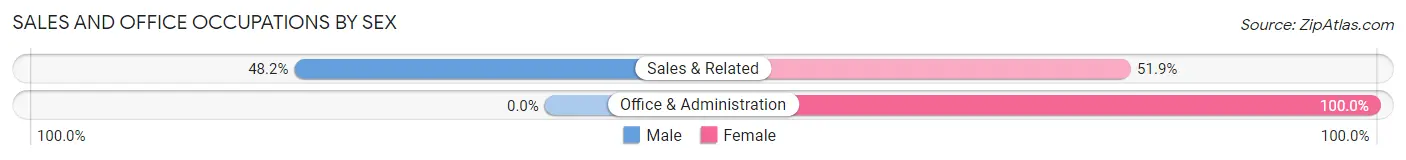
| Occupation | Male | Female |
| Sales & Related | 13 (48.1%) | 14 (51.8%) |
| Office & Administration | 0 (0.0%) | 26 (100.0%) |
| Total (Category) | 13 (24.5%) | 40 (75.5%) |
| Total (Overall) | 64 (46.0%) | 75 (54.0%) |
Natural Resources, Construction and Maintenance Occupations
Natural Resources, Construction and Maintenance Occupations by Sex
| Occupation | Male | Female |
| Farming, Fishing & Forestry | 0 (0.0%) | 0 (0.0%) |
| Construction & Extraction | 0 (0.0%) | 0 (0.0%) |
| Installation, Maintenance & Repair | 0 (0.0%) | 0 (0.0%) |
| Total (Category) | 0 (0.0%) | 0 (0.0%) |
| Total (Overall) | 64 (46.0%) | 75 (54.0%) |
Production, Transportation and Moving Occupations
Production, Transportation and Moving Occupations by Sex
| Occupation | Male | Female |
| Production | 0 (0.0%) | 0 (0.0%) |
| Transportation | 0 (0.0%) | 0 (0.0%) |
| Material Moving | 0 (0.0%) | 0 (0.0%) |
| Total (Category) | 0 (0.0%) | 0 (0.0%) |
| Total (Overall) | 64 (46.0%) | 75 (54.0%) |
Employment Industries by Sex in Finesville
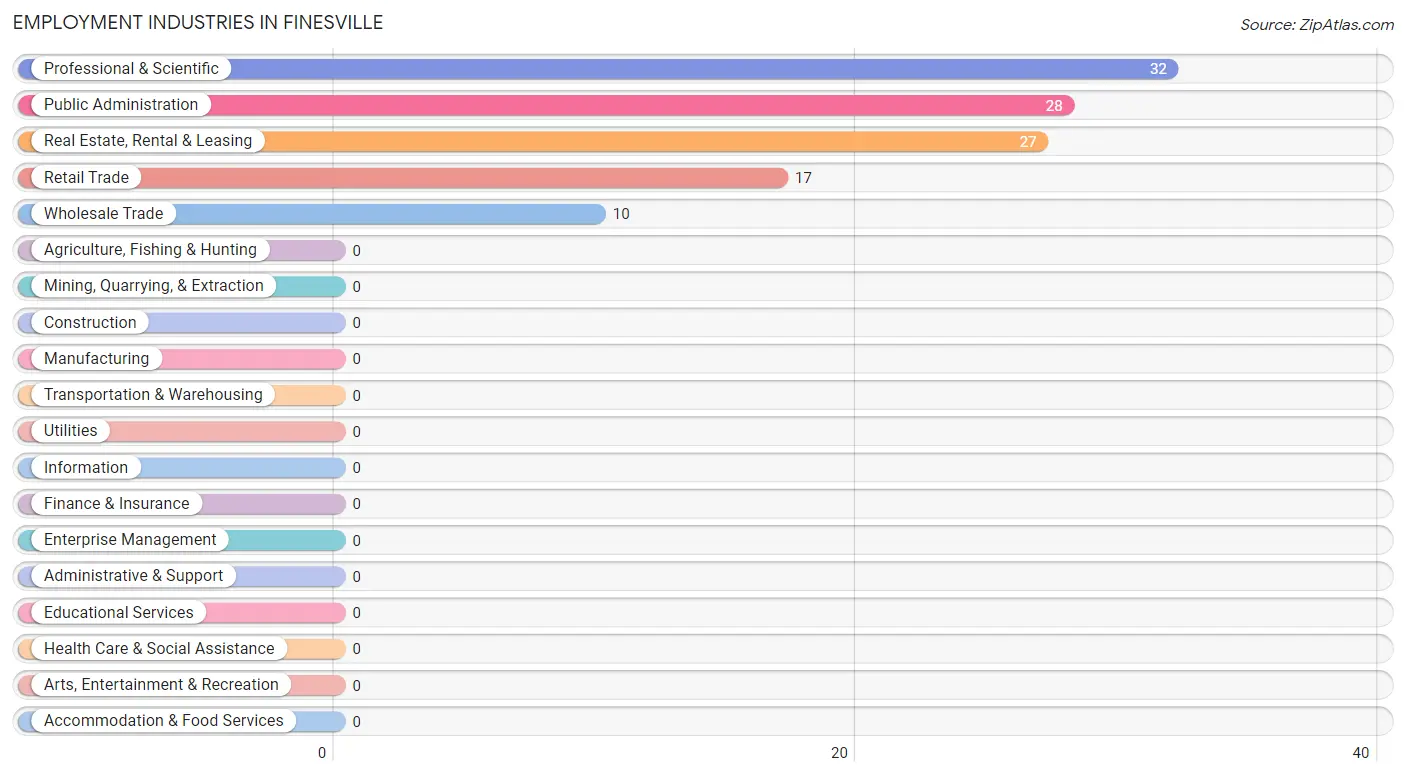
Employment Industries in Finesville
The major employment industries in Finesville include Professional & Scientific (32 | 23.0%), Public Administration (28 | 20.1%), Real Estate, Rental & Leasing (27 | 19.4%), Retail Trade (17 | 12.2%), and Wholesale Trade (10 | 7.2%).
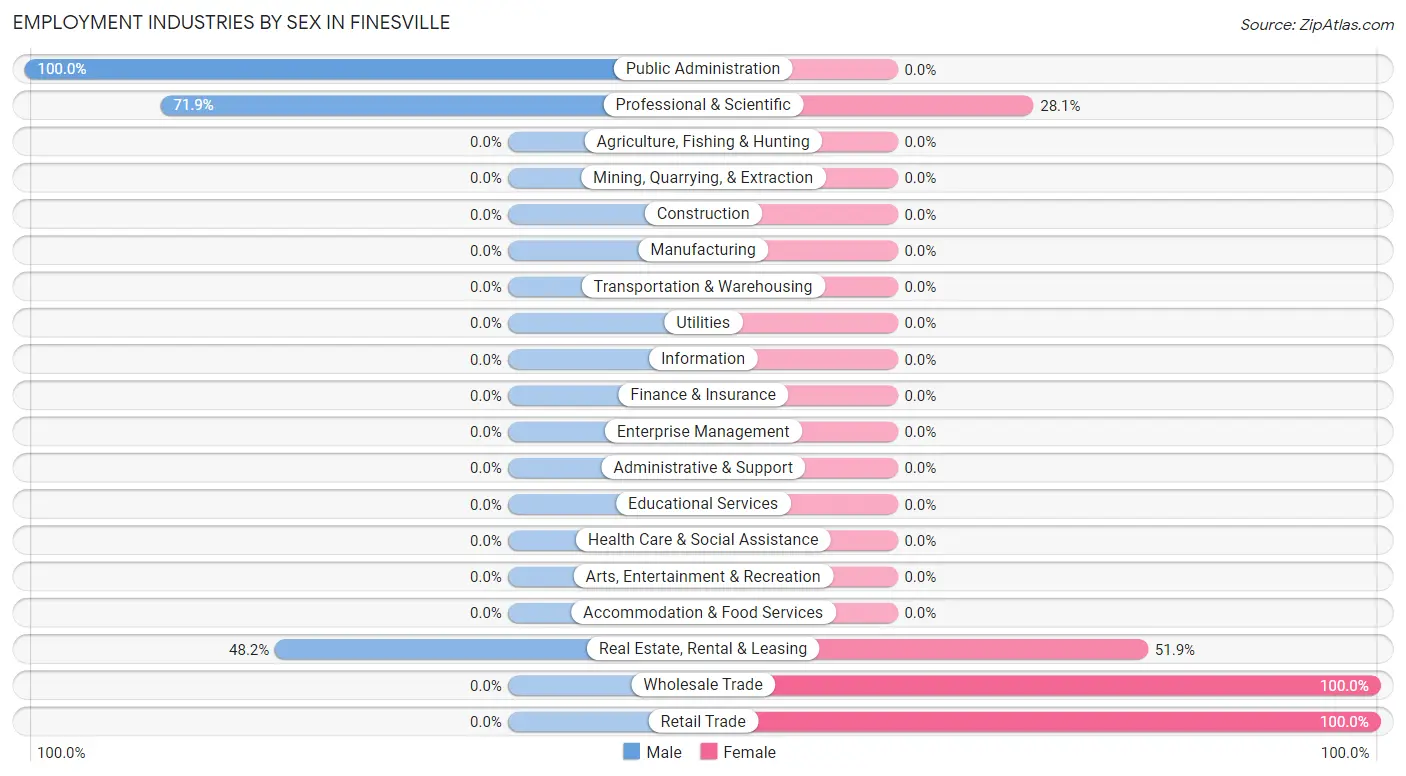
Employment Industries by Sex in Finesville
The Finesville industries that see more men than women are Public Administration (100.0%), Professional & Scientific (71.9%), and Real Estate, Rental & Leasing (48.1%), whereas the industries that tend to have a higher number of women are Wholesale Trade (100.0%), Retail Trade (100.0%), and Real Estate, Rental & Leasing (51.8%).
| Industry | Male | Female |
| Agriculture, Fishing & Hunting | 0 (0.0%) | 0 (0.0%) |
| Mining, Quarrying, & Extraction | 0 (0.0%) | 0 (0.0%) |
| Construction | 0 (0.0%) | 0 (0.0%) |
| Manufacturing | 0 (0.0%) | 0 (0.0%) |
| Wholesale Trade | 0 (0.0%) | 10 (100.0%) |
| Retail Trade | 0 (0.0%) | 17 (100.0%) |
| Transportation & Warehousing | 0 (0.0%) | 0 (0.0%) |
| Utilities | 0 (0.0%) | 0 (0.0%) |
| Information | 0 (0.0%) | 0 (0.0%) |
| Finance & Insurance | 0 (0.0%) | 0 (0.0%) |
| Real Estate, Rental & Leasing | 13 (48.1%) | 14 (51.8%) |
| Professional & Scientific | 23 (71.9%) | 9 (28.1%) |
| Enterprise Management | 0 (0.0%) | 0 (0.0%) |
| Administrative & Support | 0 (0.0%) | 0 (0.0%) |
| Educational Services | 0 (0.0%) | 0 (0.0%) |
| Health Care & Social Assistance | 0 (0.0%) | 0 (0.0%) |
| Arts, Entertainment & Recreation | 0 (0.0%) | 0 (0.0%) |
| Accommodation & Food Services | 0 (0.0%) | 0 (0.0%) |
| Public Administration | 28 (100.0%) | 0 (0.0%) |
| Total | 64 (46.0%) | 75 (54.0%) |
Education in Finesville
School Enrollment in Finesville
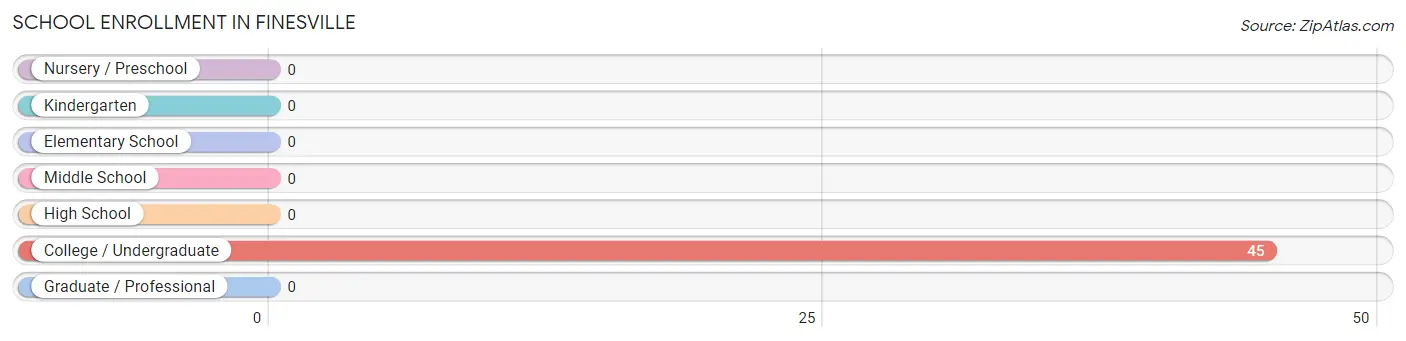
| School Level | # Students | % Students |
| Nursery / Preschool | 0 | 0.0% |
| Kindergarten | 0 | 0.0% |
| Elementary School | 0 | 0.0% |
| Middle School | 0 | 0.0% |
| High School | 0 | 0.0% |
| College / Undergraduate | 45 | 100.0% |
| Graduate / Professional | 0 | 0.0% |
| Total | 45 | 100.0% |
School Enrollment by Age by Funding Source in Finesville
Out of a total of 45 students who are enrolled in schools in Finesville, 15 (33.3%) attend a private institution, while the remaining 30 (66.7%) are enrolled in public schools. The age group of 25 to 34 year olds has the highest likelihood of being enrolled in private schools, with 15 (100.0% in the age bracket) enrolled. Conversely, the age group of 20 to 24 year olds has the lowest likelihood of being enrolled in a private school, with 30 (100.0% in the age bracket) attending a public institution.
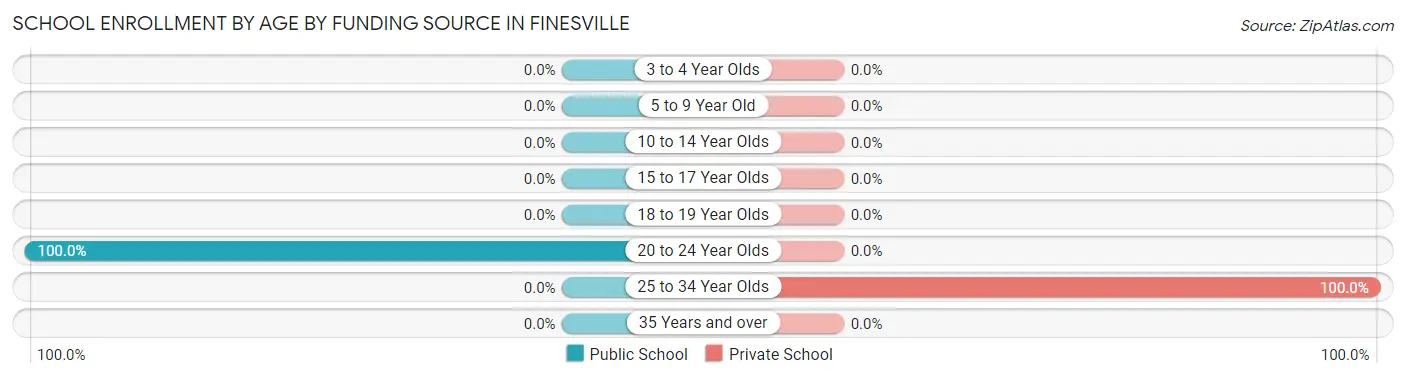
| Age Bracket | Public School | Private School |
| 3 to 4 Year Olds | 0 (0.0%) | 0 (0.0%) |
| 5 to 9 Year Old | 0 (0.0%) | 0 (0.0%) |
| 10 to 14 Year Olds | 0 (0.0%) | 0 (0.0%) |
| 15 to 17 Year Olds | 0 (0.0%) | 0 (0.0%) |
| 18 to 19 Year Olds | 0 (0.0%) | 0 (0.0%) |
| 20 to 24 Year Olds | 30 (100.0%) | 0 (0.0%) |
| 25 to 34 Year Olds | 0 (0.0%) | 15 (100.0%) |
| 35 Years and over | 0 (0.0%) | 0 (0.0%) |
| Total | 30 (66.7%) | 15 (33.3%) |
Educational Attainment by Field of Study in Finesville
Bio, nature & agricultural (41 | 22.7%), engineering (33 | 18.2%), science & technology (29 | 16.0%), business (22 | 12.1%), and social sciences (15 | 8.3%) are the most common fields of study among 181 individuals in Finesville who have obtained a bachelor's degree or higher.
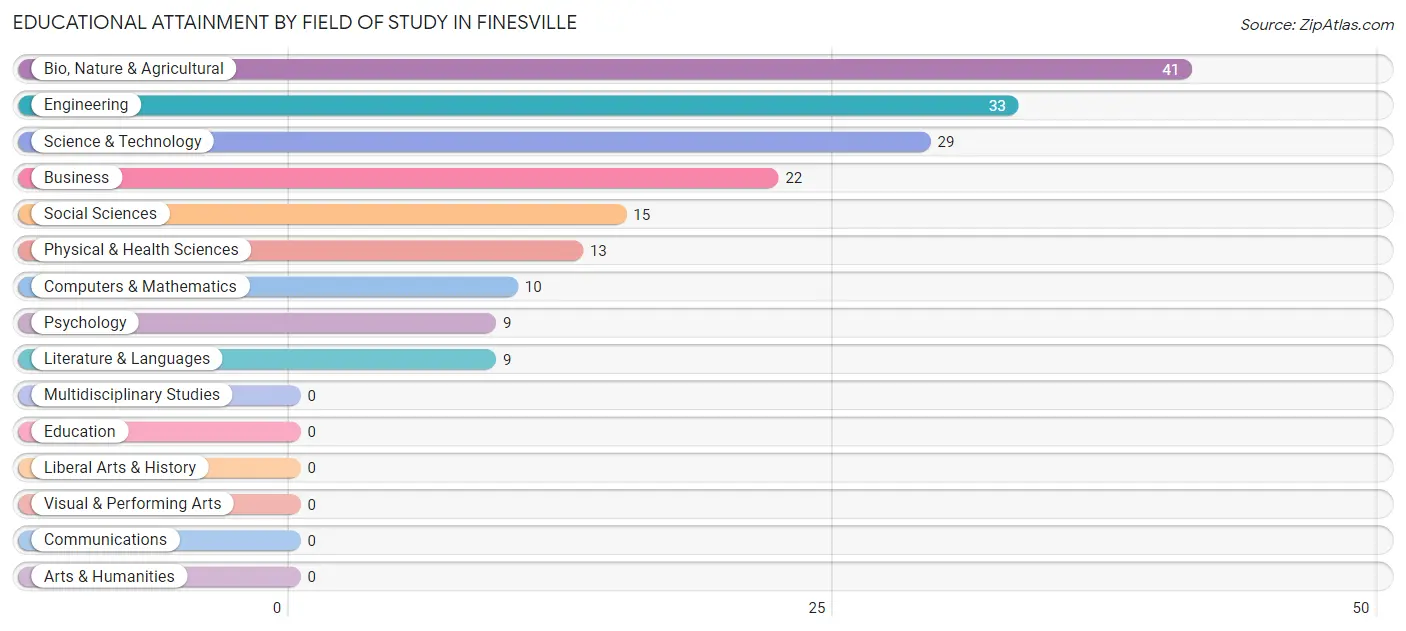
| Field of Study | # Graduates | % Graduates |
| Computers & Mathematics | 10 | 5.5% |
| Bio, Nature & Agricultural | 41 | 22.7% |
| Physical & Health Sciences | 13 | 7.2% |
| Psychology | 9 | 5.0% |
| Social Sciences | 15 | 8.3% |
| Engineering | 33 | 18.2% |
| Multidisciplinary Studies | 0 | 0.0% |
| Science & Technology | 29 | 16.0% |
| Business | 22 | 12.1% |
| Education | 0 | 0.0% |
| Literature & Languages | 9 | 5.0% |
| Liberal Arts & History | 0 | 0.0% |
| Visual & Performing Arts | 0 | 0.0% |
| Communications | 0 | 0.0% |
| Arts & Humanities | 0 | 0.0% |
| Total | 181 | 100.0% |
Transportation & Commute in Finesville
Vehicle Availability by Sex in Finesville
The most prevalent vehicle ownership categories in Finesville are males with 5 or more vehicles (26, accounting for 40.6%) and females with 5 or more vehicles (0, making up 34.7%).
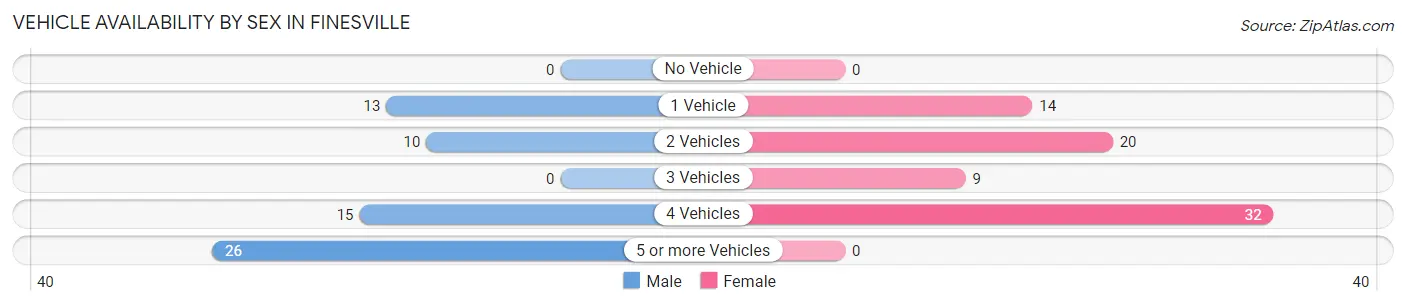
| Vehicles Available | Male | Female |
| No Vehicle | 0 (0.0%) | 0 (0.0%) |
| 1 Vehicle | 13 (20.3%) | 14 (18.7%) |
| 2 Vehicles | 10 (15.6%) | 20 (26.7%) |
| 3 Vehicles | 0 (0.0%) | 9 (12.0%) |
| 4 Vehicles | 15 (23.4%) | 32 (42.7%) |
| 5 or more Vehicles | 26 (40.6%) | 0 (0.0%) |
| Total | 64 (100.0%) | 75 (100.0%) |
Commute Time in Finesville
The most frequently occuring commute durations in Finesville are 10 to 14 minutes (32 commuters, 23.0%), 35 to 39 minutes (26 commuters, 18.7%), and 45 to 59 minutes (19 commuters, 13.7%).
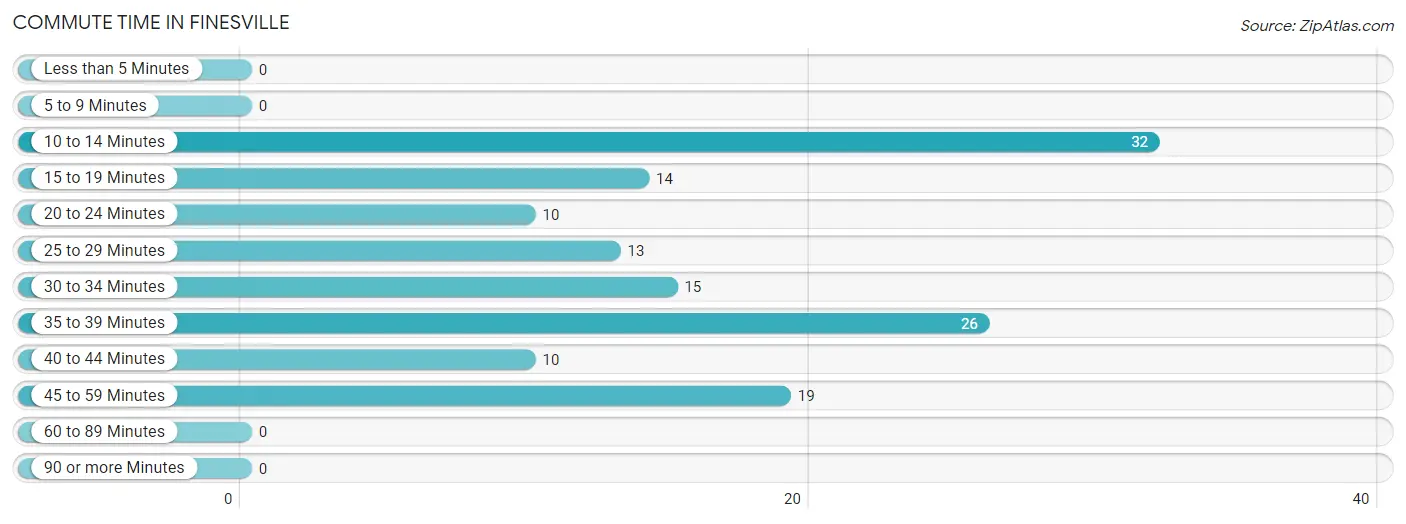
| Commute Time | # Commuters | % Commuters |
| Less than 5 Minutes | 0 | 0.0% |
| 5 to 9 Minutes | 0 | 0.0% |
| 10 to 14 Minutes | 32 | 23.0% |
| 15 to 19 Minutes | 14 | 10.1% |
| 20 to 24 Minutes | 10 | 7.2% |
| 25 to 29 Minutes | 13 | 9.3% |
| 30 to 34 Minutes | 15 | 10.8% |
| 35 to 39 Minutes | 26 | 18.7% |
| 40 to 44 Minutes | 10 | 7.2% |
| 45 to 59 Minutes | 19 | 13.7% |
| 60 to 89 Minutes | 0 | 0.0% |
| 90 or more Minutes | 0 | 0.0% |
Commute Time by Sex in Finesville
The most common commute times in Finesville are 35 to 39 minutes (26 commuters, 40.6%) for males and 10 to 14 minutes (32 commuters, 42.7%) for females.
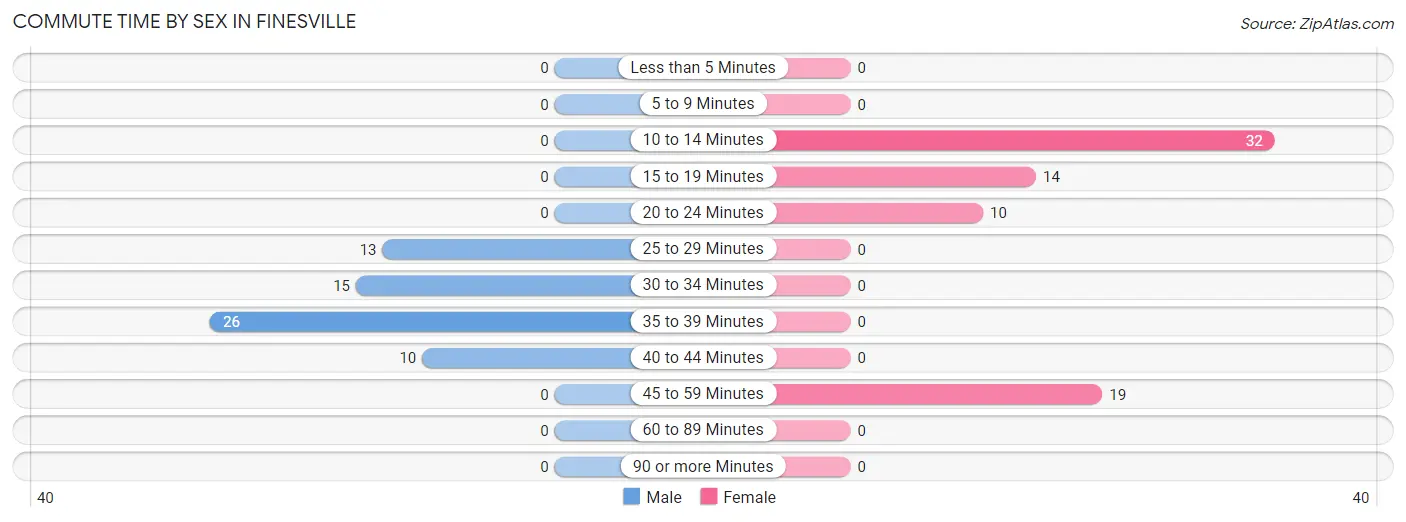
| Commute Time | Male | Female |
| Less than 5 Minutes | 0 (0.0%) | 0 (0.0%) |
| 5 to 9 Minutes | 0 (0.0%) | 0 (0.0%) |
| 10 to 14 Minutes | 0 (0.0%) | 32 (42.7%) |
| 15 to 19 Minutes | 0 (0.0%) | 14 (18.7%) |
| 20 to 24 Minutes | 0 (0.0%) | 10 (13.3%) |
| 25 to 29 Minutes | 13 (20.3%) | 0 (0.0%) |
| 30 to 34 Minutes | 15 (23.4%) | 0 (0.0%) |
| 35 to 39 Minutes | 26 (40.6%) | 0 (0.0%) |
| 40 to 44 Minutes | 10 (15.6%) | 0 (0.0%) |
| 45 to 59 Minutes | 0 (0.0%) | 19 (25.3%) |
| 60 to 89 Minutes | 0 (0.0%) | 0 (0.0%) |
| 90 or more Minutes | 0 (0.0%) | 0 (0.0%) |
Time of Departure to Work by Sex in Finesville
The most frequent times of departure to work in Finesville are 5:00 AM to 5:29 AM (26, 40.6%) for males and 7:30 AM to 7:59 AM (29, 38.7%) for females.
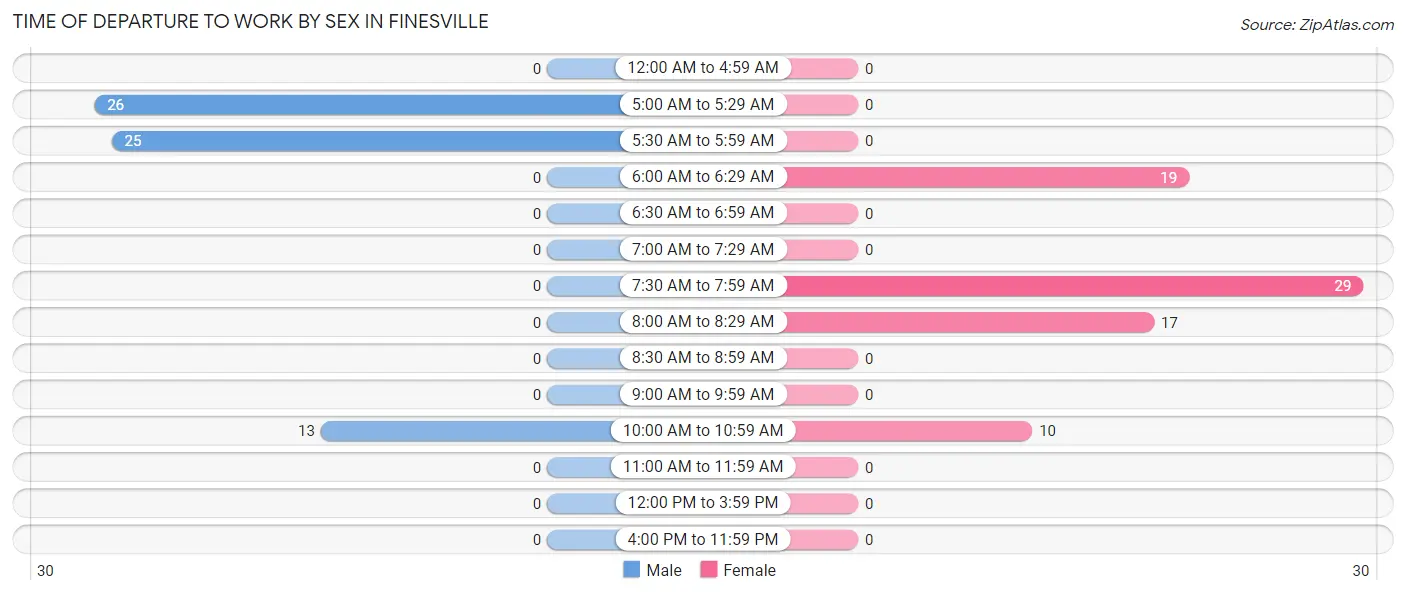
| Time of Departure | Male | Female |
| 12:00 AM to 4:59 AM | 0 (0.0%) | 0 (0.0%) |
| 5:00 AM to 5:29 AM | 26 (40.6%) | 0 (0.0%) |
| 5:30 AM to 5:59 AM | 25 (39.1%) | 0 (0.0%) |
| 6:00 AM to 6:29 AM | 0 (0.0%) | 19 (25.3%) |
| 6:30 AM to 6:59 AM | 0 (0.0%) | 0 (0.0%) |
| 7:00 AM to 7:29 AM | 0 (0.0%) | 0 (0.0%) |
| 7:30 AM to 7:59 AM | 0 (0.0%) | 29 (38.7%) |
| 8:00 AM to 8:29 AM | 0 (0.0%) | 17 (22.7%) |
| 8:30 AM to 8:59 AM | 0 (0.0%) | 0 (0.0%) |
| 9:00 AM to 9:59 AM | 0 (0.0%) | 0 (0.0%) |
| 10:00 AM to 10:59 AM | 13 (20.3%) | 10 (13.3%) |
| 11:00 AM to 11:59 AM | 0 (0.0%) | 0 (0.0%) |
| 12:00 PM to 3:59 PM | 0 (0.0%) | 0 (0.0%) |
| 4:00 PM to 11:59 PM | 0 (0.0%) | 0 (0.0%) |
| Total | 64 (100.0%) | 75 (100.0%) |
Housing Occupancy in Finesville
Occupancy by Ownership in Finesville
Of the total 188 dwellings in Finesville, owner-occupied units account for 125 (66.5%), while renter-occupied units make up 63 (33.5%).
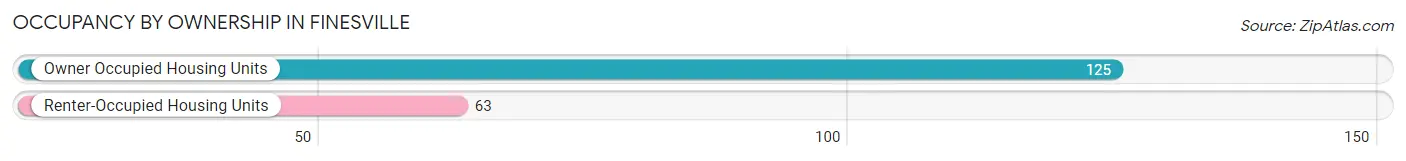
| Occupancy | # Housing Units | % Housing Units |
| Owner Occupied Housing Units | 125 | 66.5% |
| Renter-Occupied Housing Units | 63 | 33.5% |
| Total Occupied Housing Units | 188 | 100.0% |
Occupancy by Household Size in Finesville
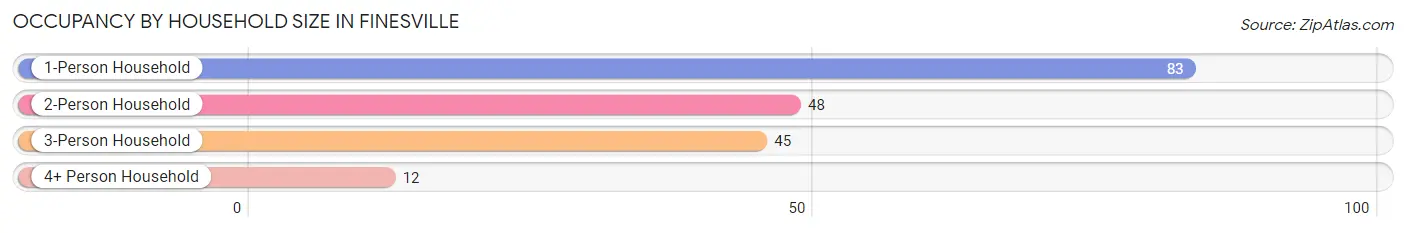
| Household Size | # Housing Units | % Housing Units |
| 1-Person Household | 83 | 44.2% |
| 2-Person Household | 48 | 25.5% |
| 3-Person Household | 45 | 23.9% |
| 4+ Person Household | 12 | 6.4% |
| Total Housing Units | 188 | 100.0% |
Occupancy by Ownership by Household Size in Finesville
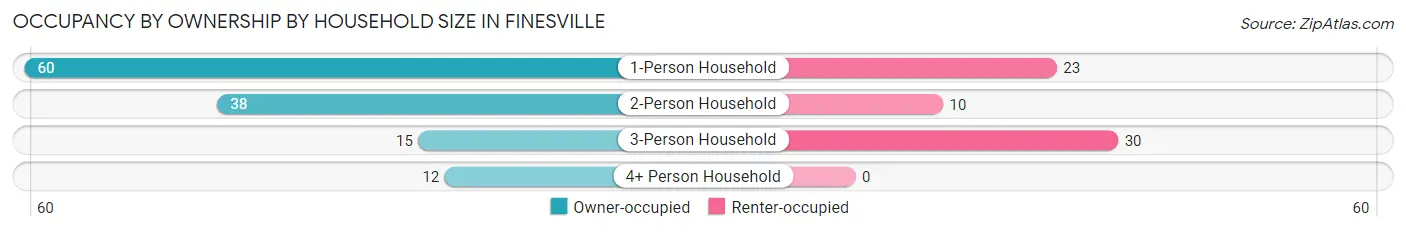
| Household Size | Owner-occupied | Renter-occupied |
| 1-Person Household | 60 (72.3%) | 23 (27.7%) |
| 2-Person Household | 38 (79.2%) | 10 (20.8%) |
| 3-Person Household | 15 (33.3%) | 30 (66.7%) |
| 4+ Person Household | 12 (100.0%) | 0 (0.0%) |
| Total Housing Units | 125 (66.5%) | 63 (33.5%) |
Occupancy by Educational Attainment in Finesville
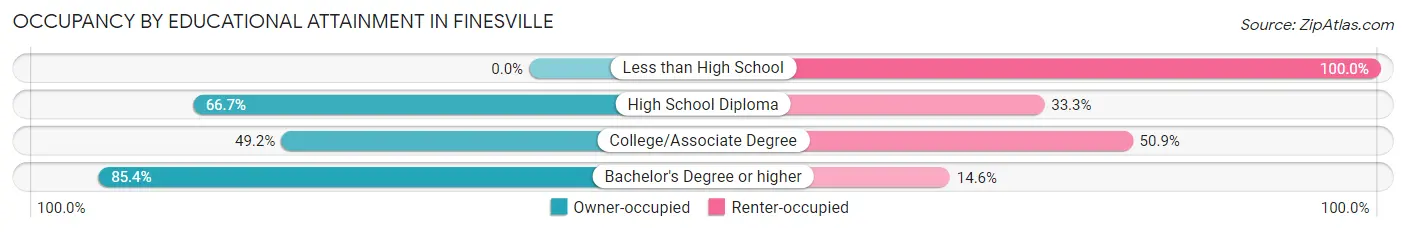
| Household Size | Owner-occupied | Renter-occupied |
| Less than High School | 0 (0.0%) | 10 (100.0%) |
| High School Diploma | 20 (66.7%) | 10 (33.3%) |
| College/Associate Degree | 29 (49.1%) | 30 (50.8%) |
| Bachelor's Degree or higher | 76 (85.4%) | 13 (14.6%) |
Occupancy by Age of Householder in Finesville
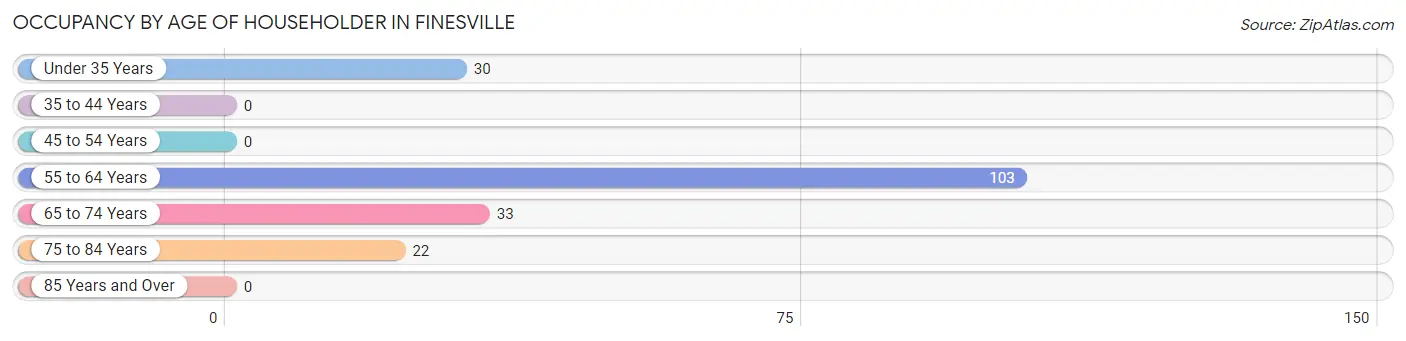
| Age Bracket | # Households | % Households |
| Under 35 Years | 30 | 16.0% |
| 35 to 44 Years | 0 | 0.0% |
| 45 to 54 Years | 0 | 0.0% |
| 55 to 64 Years | 103 | 54.8% |
| 65 to 74 Years | 33 | 17.5% |
| 75 to 84 Years | 22 | 11.7% |
| 85 Years and Over | 0 | 0.0% |
| Total | 188 | 100.0% |
Housing Finances in Finesville
Median Income by Occupancy in Finesville
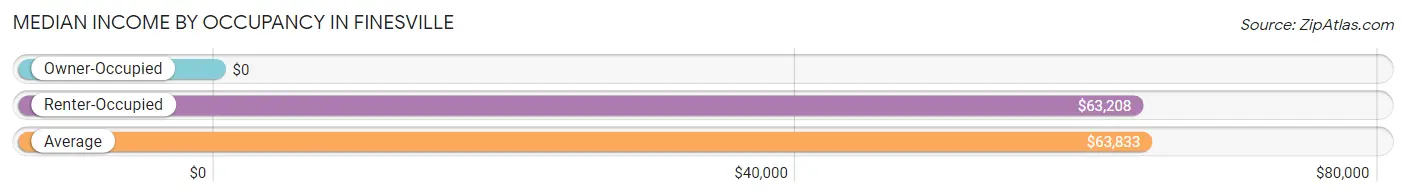
| Occupancy Type | # Households | Median Income |
| Owner-Occupied | 125 (66.5%) | $0 |
| Renter-Occupied | 63 (33.5%) | $63,208 |
| Average | 188 (100.0%) | $63,833 |
Occupancy by Householder Income Bracket in Finesville
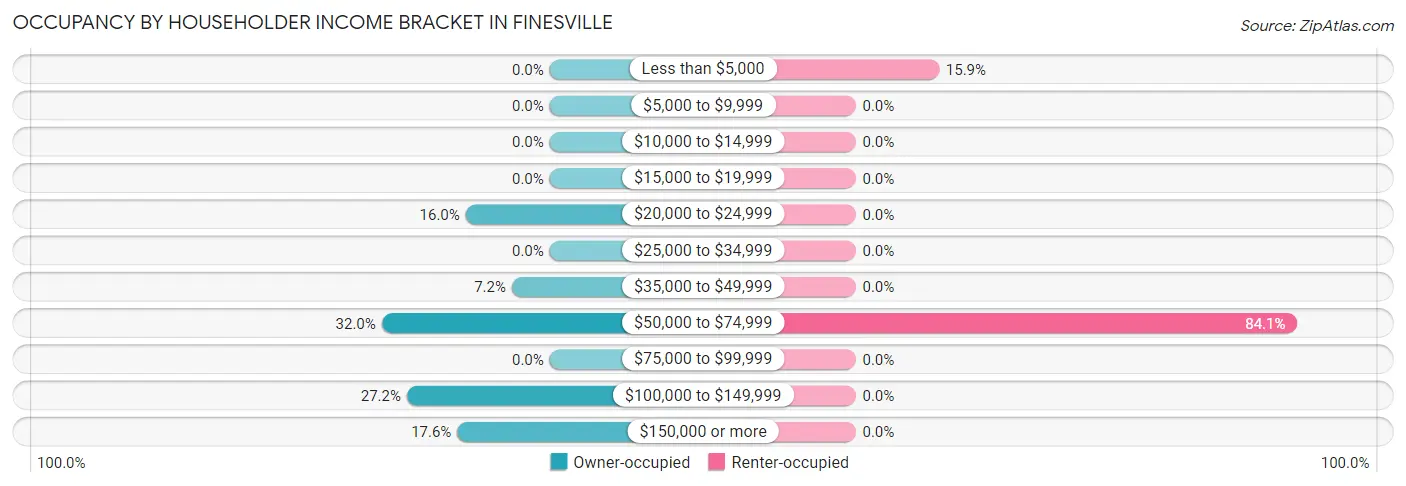
| Income Bracket | Owner-occupied | Renter-occupied |
| Less than $5,000 | 0 (0.0%) | 10 (15.9%) |
| $5,000 to $9,999 | 0 (0.0%) | 0 (0.0%) |
| $10,000 to $14,999 | 0 (0.0%) | 0 (0.0%) |
| $15,000 to $19,999 | 0 (0.0%) | 0 (0.0%) |
| $20,000 to $24,999 | 20 (16.0%) | 0 (0.0%) |
| $25,000 to $34,999 | 0 (0.0%) | 0 (0.0%) |
| $35,000 to $49,999 | 9 (7.2%) | 0 (0.0%) |
| $50,000 to $74,999 | 40 (32.0%) | 53 (84.1%) |
| $75,000 to $99,999 | 0 (0.0%) | 0 (0.0%) |
| $100,000 to $149,999 | 34 (27.2%) | 0 (0.0%) |
| $150,000 or more | 22 (17.6%) | 0 (0.0%) |
| Total | 125 (100.0%) | 63 (100.0%) |
Monthly Housing Cost Tiers in Finesville
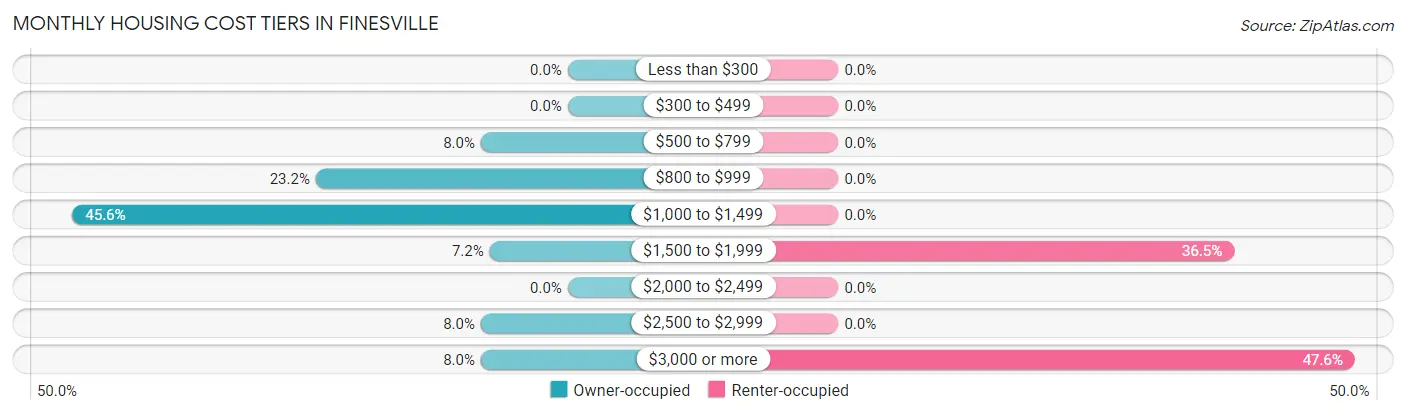
| Monthly Cost | Owner-occupied | Renter-occupied |
| Less than $300 | 0 (0.0%) | 0 (0.0%) |
| $300 to $499 | 0 (0.0%) | 0 (0.0%) |
| $500 to $799 | 10 (8.0%) | 0 (0.0%) |
| $800 to $999 | 29 (23.2%) | 0 (0.0%) |
| $1,000 to $1,499 | 57 (45.6%) | 0 (0.0%) |
| $1,500 to $1,999 | 9 (7.2%) | 23 (36.5%) |
| $2,000 to $2,499 | 0 (0.0%) | 0 (0.0%) |
| $2,500 to $2,999 | 10 (8.0%) | 0 (0.0%) |
| $3,000 or more | 10 (8.0%) | 30 (47.6%) |
| Total | 125 (100.0%) | 63 (100.0%) |
Physical Housing Characteristics in Finesville
Housing Structures in Finesville
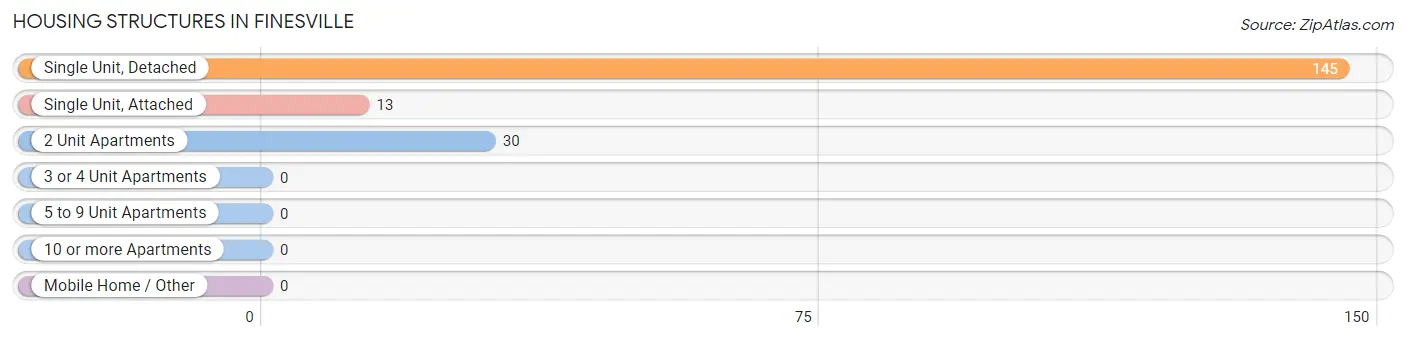
| Structure Type | # Housing Units | % Housing Units |
| Single Unit, Detached | 145 | 77.1% |
| Single Unit, Attached | 13 | 6.9% |
| 2 Unit Apartments | 30 | 16.0% |
| 3 or 4 Unit Apartments | 0 | 0.0% |
| 5 to 9 Unit Apartments | 0 | 0.0% |
| 10 or more Apartments | 0 | 0.0% |
| Mobile Home / Other | 0 | 0.0% |
| Total | 188 | 100.0% |
Housing Structures by Occupancy in Finesville
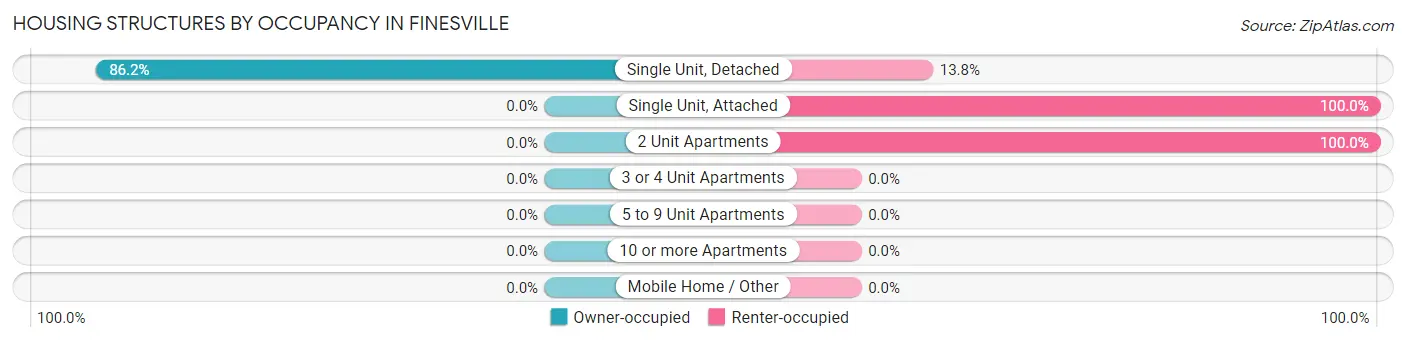
| Structure Type | Owner-occupied | Renter-occupied |
| Single Unit, Detached | 125 (86.2%) | 20 (13.8%) |
| Single Unit, Attached | 0 (0.0%) | 13 (100.0%) |
| 2 Unit Apartments | 0 (0.0%) | 30 (100.0%) |
| 3 or 4 Unit Apartments | 0 (0.0%) | 0 (0.0%) |
| 5 to 9 Unit Apartments | 0 (0.0%) | 0 (0.0%) |
| 10 or more Apartments | 0 (0.0%) | 0 (0.0%) |
| Mobile Home / Other | 0 (0.0%) | 0 (0.0%) |
| Total | 125 (66.5%) | 63 (33.5%) |
Housing Structures by Number of Rooms in Finesville
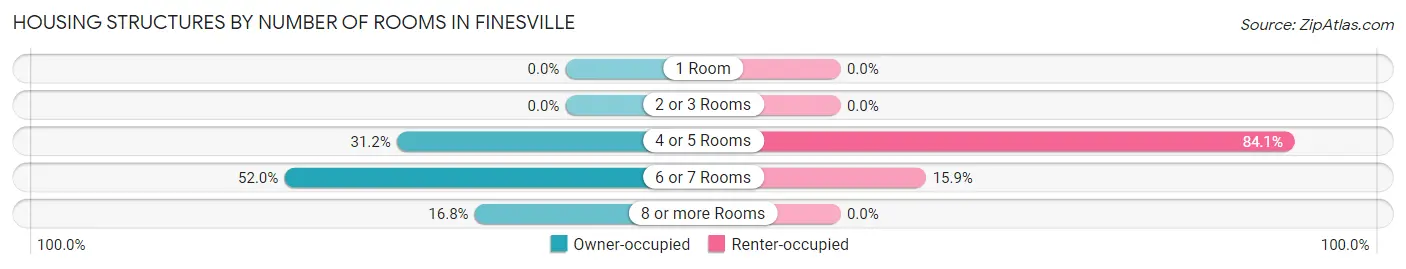
| Number of Rooms | Owner-occupied | Renter-occupied |
| 1 Room | 0 (0.0%) | 0 (0.0%) |
| 2 or 3 Rooms | 0 (0.0%) | 0 (0.0%) |
| 4 or 5 Rooms | 39 (31.2%) | 53 (84.1%) |
| 6 or 7 Rooms | 65 (52.0%) | 10 (15.9%) |
| 8 or more Rooms | 21 (16.8%) | 0 (0.0%) |
| Total | 125 (100.0%) | 63 (100.0%) |
Housing Structure by Heating Type in Finesville
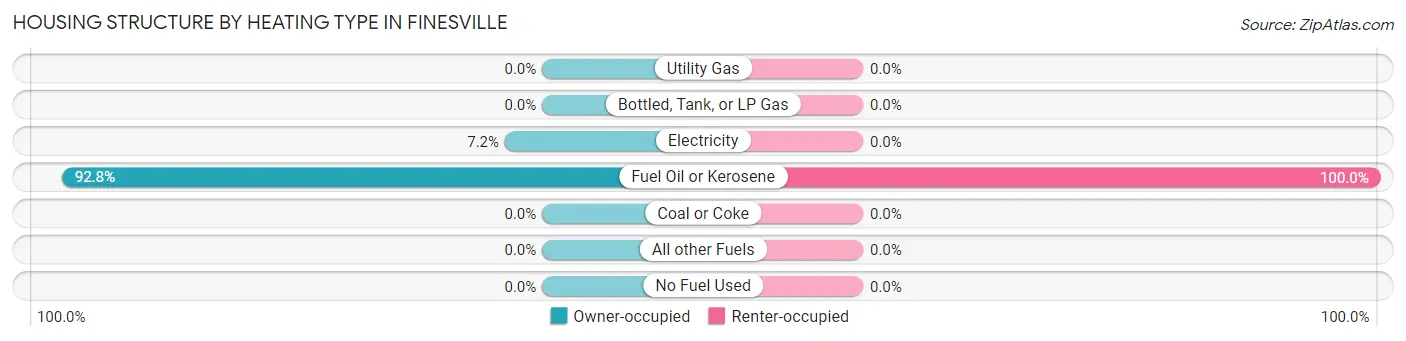
| Heating Type | Owner-occupied | Renter-occupied |
| Utility Gas | 0 (0.0%) | 0 (0.0%) |
| Bottled, Tank, or LP Gas | 0 (0.0%) | 0 (0.0%) |
| Electricity | 9 (7.2%) | 0 (0.0%) |
| Fuel Oil or Kerosene | 116 (92.8%) | 63 (100.0%) |
| Coal or Coke | 0 (0.0%) | 0 (0.0%) |
| All other Fuels | 0 (0.0%) | 0 (0.0%) |
| No Fuel Used | 0 (0.0%) | 0 (0.0%) |
| Total | 125 (100.0%) | 63 (100.0%) |
Household Vehicle Usage in Finesville
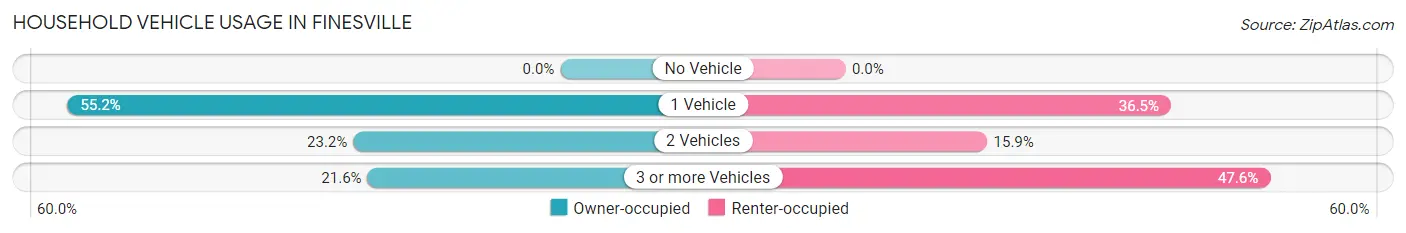
| Vehicles per Household | Owner-occupied | Renter-occupied |
| No Vehicle | 0 (0.0%) | 0 (0.0%) |
| 1 Vehicle | 69 (55.2%) | 23 (36.5%) |
| 2 Vehicles | 29 (23.2%) | 10 (15.9%) |
| 3 or more Vehicles | 27 (21.6%) | 30 (47.6%) |
| Total | 125 (100.0%) | 63 (100.0%) |
Real Estate & Mortgages in Finesville
Real Estate and Mortgage Overview in Finesville
| Characteristic | Without Mortgage | With Mortgage |
| Housing Units | 82 | 43 |
| Median Property Value | $311,400 | $275,000 |
| Median Household Income | - | - |
| Monthly Housing Costs | $1,309 | $10 |
| Real Estate Taxes | $10,001 | $0 |
Property Value by Mortgage Status in Finesville
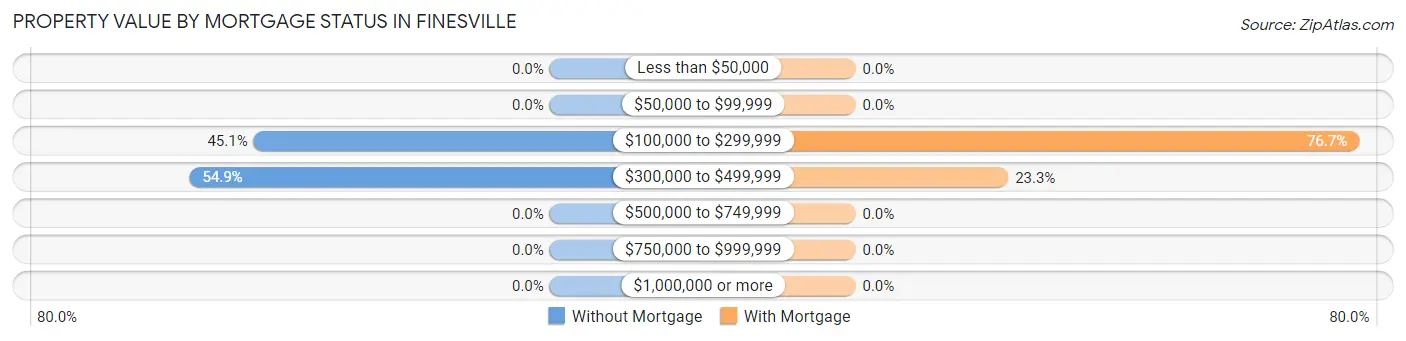
| Property Value | Without Mortgage | With Mortgage |
| Less than $50,000 | 0 (0.0%) | 0 (0.0%) |
| $50,000 to $99,999 | 0 (0.0%) | 0 (0.0%) |
| $100,000 to $299,999 | 37 (45.1%) | 33 (76.7%) |
| $300,000 to $499,999 | 45 (54.9%) | 10 (23.3%) |
| $500,000 to $749,999 | 0 (0.0%) | 0 (0.0%) |
| $750,000 to $999,999 | 0 (0.0%) | 0 (0.0%) |
| $1,000,000 or more | 0 (0.0%) | 0 (0.0%) |
| Total | 82 (100.0%) | 43 (100.0%) |
Household Income by Mortgage Status in Finesville
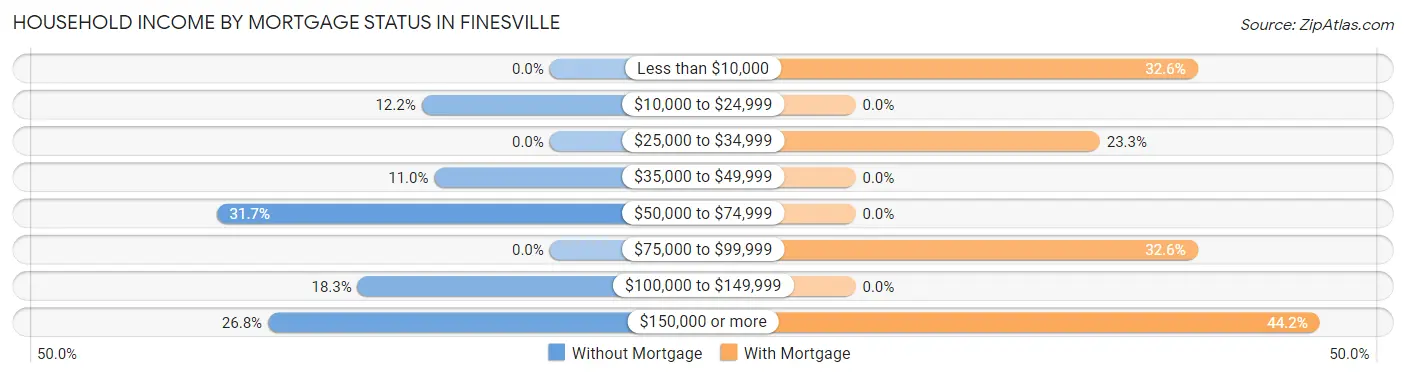
| Household Income | Without Mortgage | With Mortgage |
| Less than $10,000 | 0 (0.0%) | 14 (32.6%) |
| $10,000 to $24,999 | 10 (12.2%) | 0 (0.0%) |
| $25,000 to $34,999 | 0 (0.0%) | 10 (23.3%) |
| $35,000 to $49,999 | 9 (11.0%) | 0 (0.0%) |
| $50,000 to $74,999 | 26 (31.7%) | 0 (0.0%) |
| $75,000 to $99,999 | 0 (0.0%) | 14 (32.6%) |
| $100,000 to $149,999 | 15 (18.3%) | 0 (0.0%) |
| $150,000 or more | 22 (26.8%) | 19 (44.2%) |
| Total | 82 (100.0%) | 43 (100.0%) |
Property Value to Household Income Ratio in Finesville
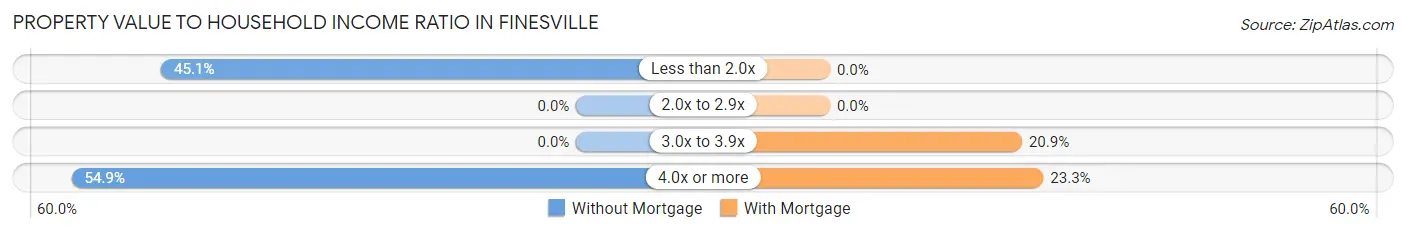
| Value-to-Income Ratio | Without Mortgage | With Mortgage |
| Less than 2.0x | 37 (45.1%) | 0 (0.0%) |
| 2.0x to 2.9x | 0 (0.0%) | 0 (0.0%) |
| 3.0x to 3.9x | 0 (0.0%) | 9 (20.9%) |
| 4.0x or more | 45 (54.9%) | 10 (23.3%) |
| Total | 82 (100.0%) | 43 (100.0%) |
Real Estate Taxes by Mortgage Status in Finesville
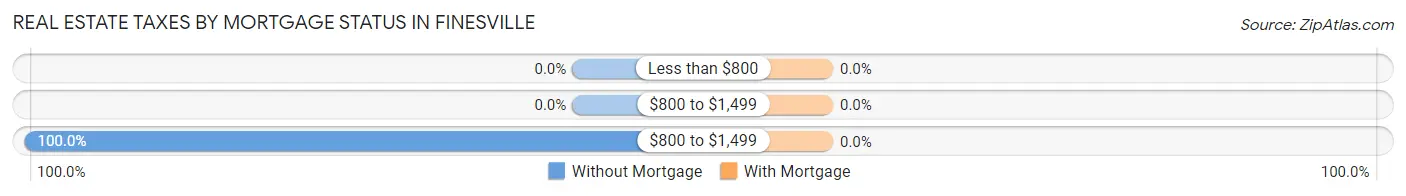
| Property Taxes | Without Mortgage | With Mortgage |
| Less than $800 | 0 (0.0%) | 0 (0.0%) |
| $800 to $1,499 | 0 (0.0%) | 0 (0.0%) |
| $800 to $1,499 | 82 (100.0%) | 0 (0.0%) |
| Total | 82 (100.0%) | 43 (100.0%) |
Health & Disability in Finesville
Health Insurance Coverage by Age in Finesville
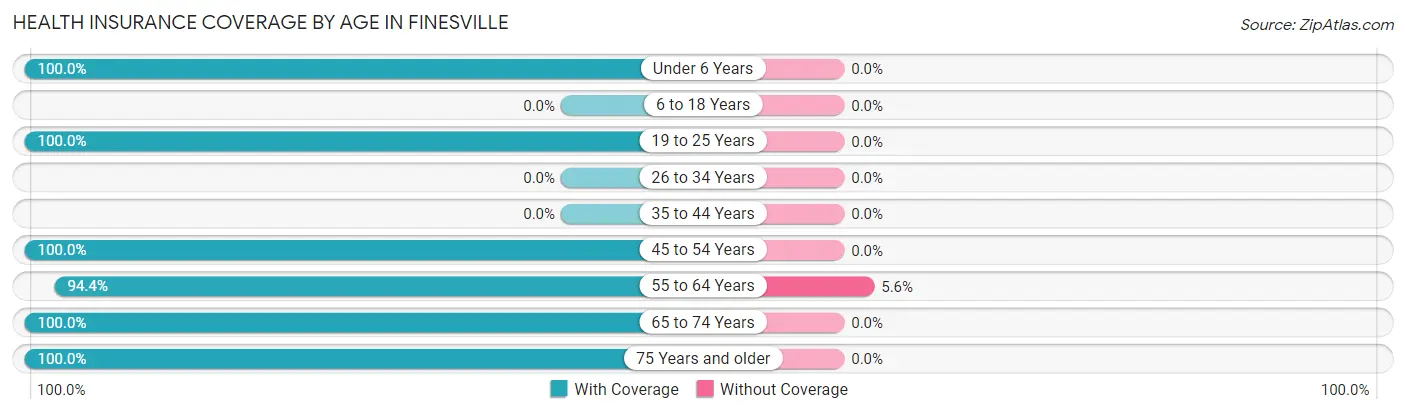
| Age Bracket | With Coverage | Without Coverage |
| Under 6 Years | 15 (100.0%) | 0 (0.0%) |
| 6 to 18 Years | 0 (0.0%) | 0 (0.0%) |
| 19 to 25 Years | 45 (100.0%) | 0 (0.0%) |
| 26 to 34 Years | 0 (0.0%) | 0 (0.0%) |
| 35 to 44 Years | 0 (0.0%) | 0 (0.0%) |
| 45 to 54 Years | 31 (100.0%) | 0 (0.0%) |
| 55 to 64 Years | 135 (94.4%) | 8 (5.6%) |
| 65 to 74 Years | 62 (100.0%) | 0 (0.0%) |
| 75 Years and older | 35 (100.0%) | 0 (0.0%) |
| Total | 323 (97.6%) | 8 (2.4%) |
Health Insurance Coverage by Citizenship Status in Finesville
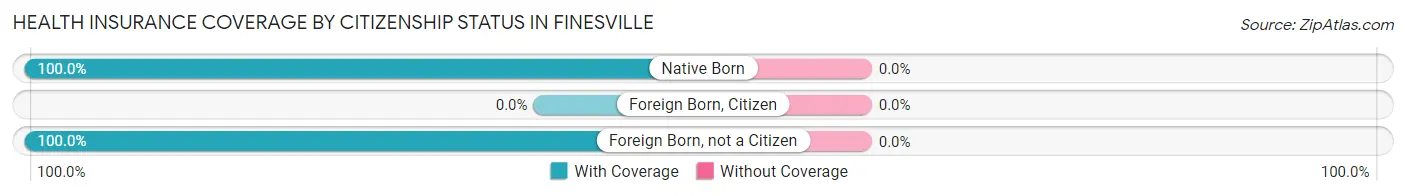
| Citizenship Status | With Coverage | Without Coverage |
| Native Born | 15 (100.0%) | 0 (0.0%) |
| Foreign Born, Citizen | 0 (0.0%) | 0 (0.0%) |
| Foreign Born, not a Citizen | 45 (100.0%) | 0 (0.0%) |
Health Insurance Coverage by Household Income in Finesville
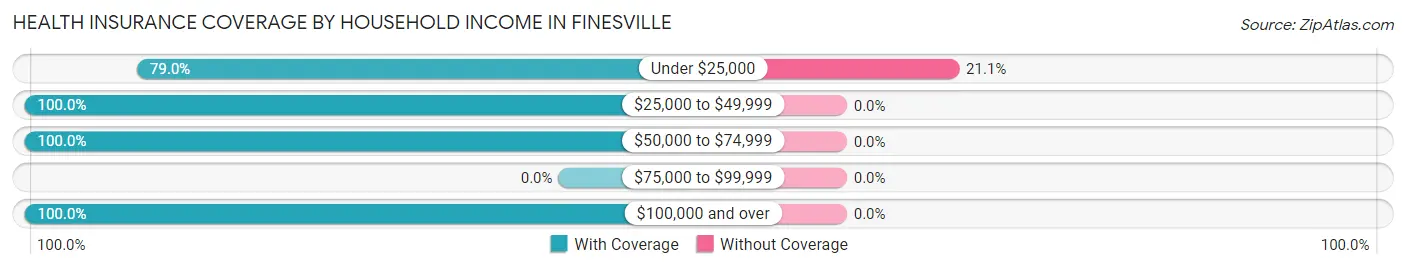
| Household Income | With Coverage | Without Coverage |
| Under $25,000 | 30 (78.9%) | 8 (21.0%) |
| $25,000 to $49,999 | 18 (100.0%) | 0 (0.0%) |
| $50,000 to $74,999 | 117 (100.0%) | 0 (0.0%) |
| $75,000 to $99,999 | 0 (0.0%) | 0 (0.0%) |
| $100,000 and over | 158 (100.0%) | 0 (0.0%) |
Public vs Private Health Insurance Coverage by Age in Finesville
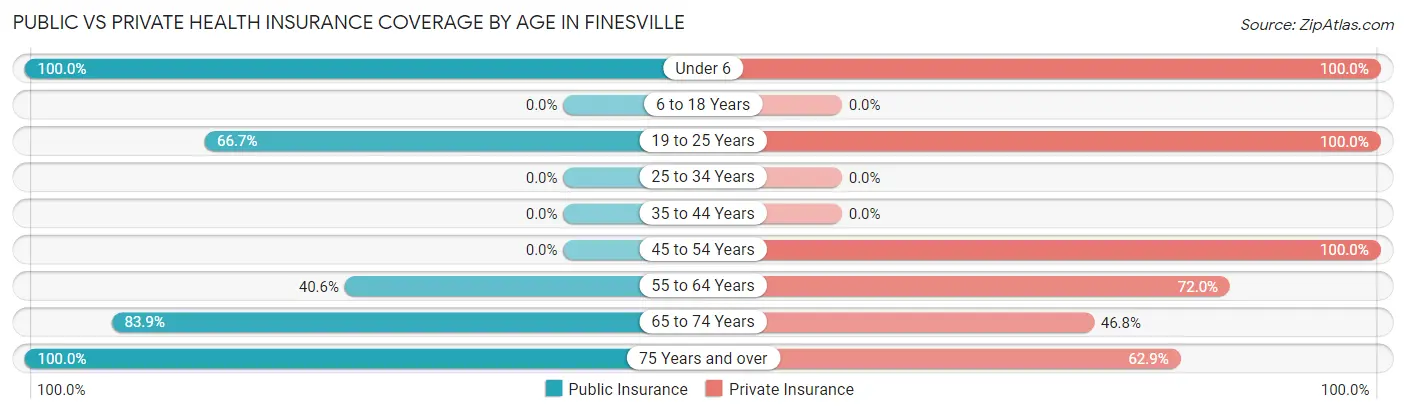
| Age Bracket | Public Insurance | Private Insurance |
| Under 6 | 15 (100.0%) | 15 (100.0%) |
| 6 to 18 Years | 0 (0.0%) | 0 (0.0%) |
| 19 to 25 Years | 30 (66.7%) | 45 (100.0%) |
| 25 to 34 Years | 0 (0.0%) | 0 (0.0%) |
| 35 to 44 Years | 0 (0.0%) | 0 (0.0%) |
| 45 to 54 Years | 0 (0.0%) | 31 (100.0%) |
| 55 to 64 Years | 58 (40.6%) | 103 (72.0%) |
| 65 to 74 Years | 52 (83.9%) | 29 (46.8%) |
| 75 Years and over | 35 (100.0%) | 22 (62.9%) |
| Total | 190 (57.4%) | 245 (74.0%) |
Disability Status by Sex by Age in Finesville
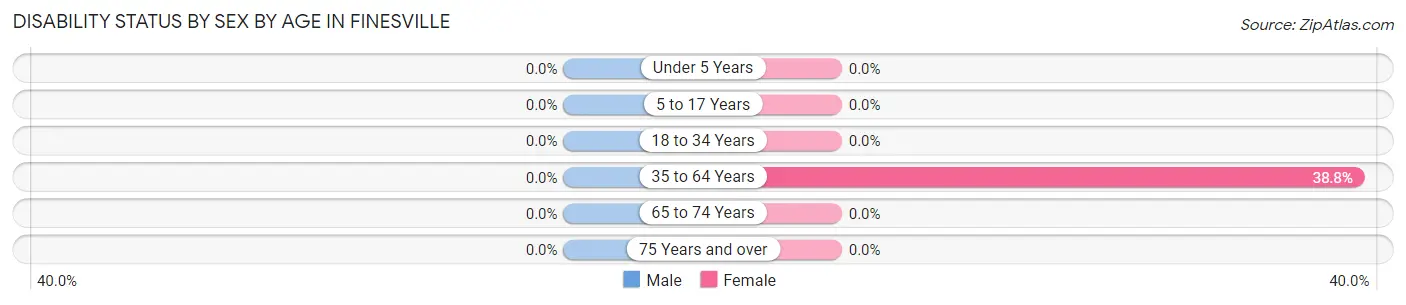
| Age Bracket | Male | Female |
| Under 5 Years | 0 (0.0%) | 0 (0.0%) |
| 5 to 17 Years | 0 (0.0%) | 0 (0.0%) |
| 18 to 34 Years | 0 (0.0%) | 0 (0.0%) |
| 35 to 64 Years | 0 (0.0%) | 40 (38.8%) |
| 65 to 74 Years | 0 (0.0%) | 0 (0.0%) |
| 75 Years and over | 0 (0.0%) | 0 (0.0%) |
Disability Class by Sex by Age in Finesville
Disability Class: Hearing Difficulty
| Age Bracket | Male | Female |
| Under 5 Years | 0 (0.0%) | 0 (0.0%) |
| 5 to 17 Years | 0 (0.0%) | 0 (0.0%) |
| 18 to 34 Years | 0 (0.0%) | 0 (0.0%) |
| 35 to 64 Years | 0 (0.0%) | 0 (0.0%) |
| 65 to 74 Years | 0 (0.0%) | 0 (0.0%) |
| 75 Years and over | 0 (0.0%) | 0 (0.0%) |
Disability Class: Vision Difficulty
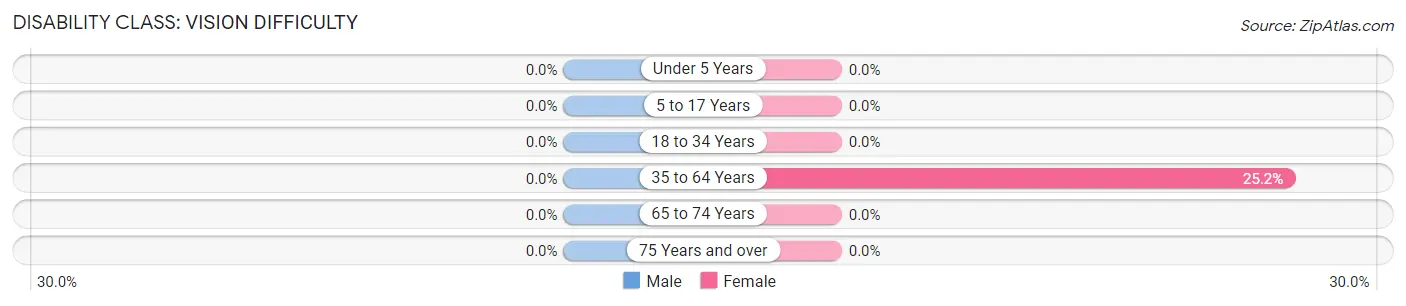
| Age Bracket | Male | Female |
| Under 5 Years | 0 (0.0%) | 0 (0.0%) |
| 5 to 17 Years | 0 (0.0%) | 0 (0.0%) |
| 18 to 34 Years | 0 (0.0%) | 0 (0.0%) |
| 35 to 64 Years | 0 (0.0%) | 26 (25.2%) |
| 65 to 74 Years | 0 (0.0%) | 0 (0.0%) |
| 75 Years and over | 0 (0.0%) | 0 (0.0%) |
Disability Class: Cognitive Difficulty
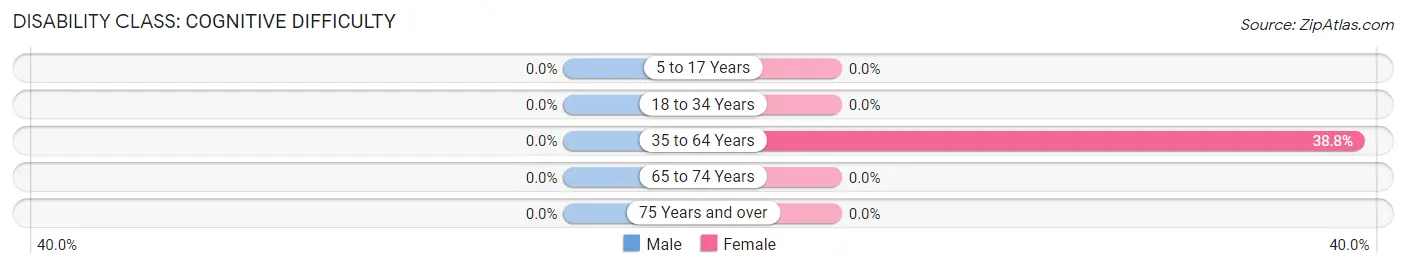
| Age Bracket | Male | Female |
| 5 to 17 Years | 0 (0.0%) | 0 (0.0%) |
| 18 to 34 Years | 0 (0.0%) | 0 (0.0%) |
| 35 to 64 Years | 0 (0.0%) | 40 (38.8%) |
| 65 to 74 Years | 0 (0.0%) | 0 (0.0%) |
| 75 Years and over | 0 (0.0%) | 0 (0.0%) |
Disability Class: Ambulatory Difficulty
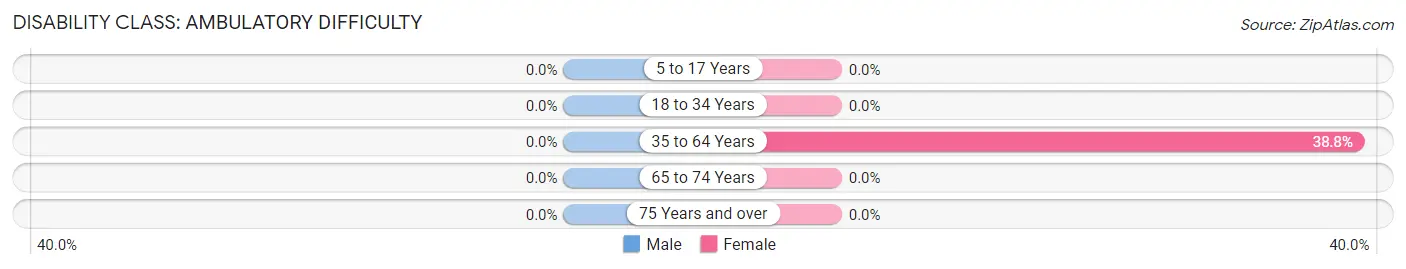
| Age Bracket | Male | Female |
| 5 to 17 Years | 0 (0.0%) | 0 (0.0%) |
| 18 to 34 Years | 0 (0.0%) | 0 (0.0%) |
| 35 to 64 Years | 0 (0.0%) | 40 (38.8%) |
| 65 to 74 Years | 0 (0.0%) | 0 (0.0%) |
| 75 Years and over | 0 (0.0%) | 0 (0.0%) |
Disability Class: Self-Care Difficulty
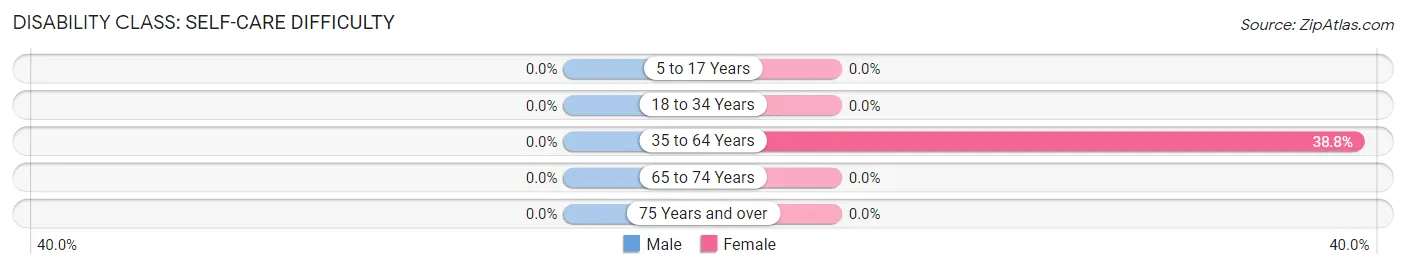
| Age Bracket | Male | Female |
| 5 to 17 Years | 0 (0.0%) | 0 (0.0%) |
| 18 to 34 Years | 0 (0.0%) | 0 (0.0%) |
| 35 to 64 Years | 0 (0.0%) | 40 (38.8%) |
| 65 to 74 Years | 0 (0.0%) | 0 (0.0%) |
| 75 Years and over | 0 (0.0%) | 0 (0.0%) |
Technology Access in Finesville
Computing Device Access in Finesville
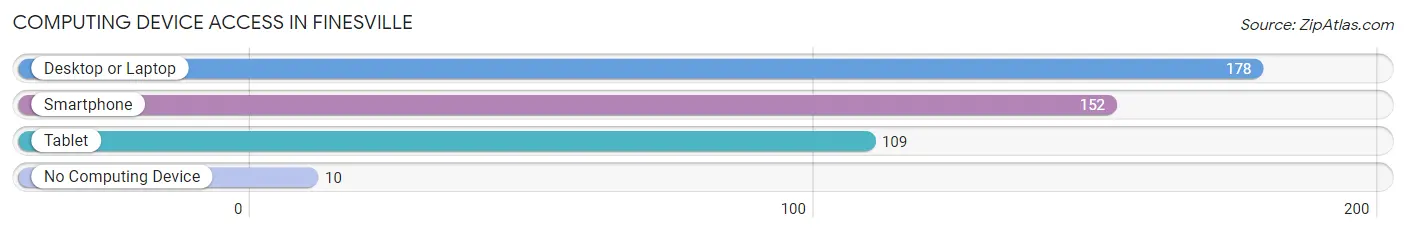
| Device Type | # Households | % Households |
| Desktop or Laptop | 178 | 94.7% |
| Smartphone | 152 | 80.8% |
| Tablet | 109 | 58.0% |
| No Computing Device | 10 | 5.3% |
| Total | 188 | 100.0% |
Internet Access in Finesville
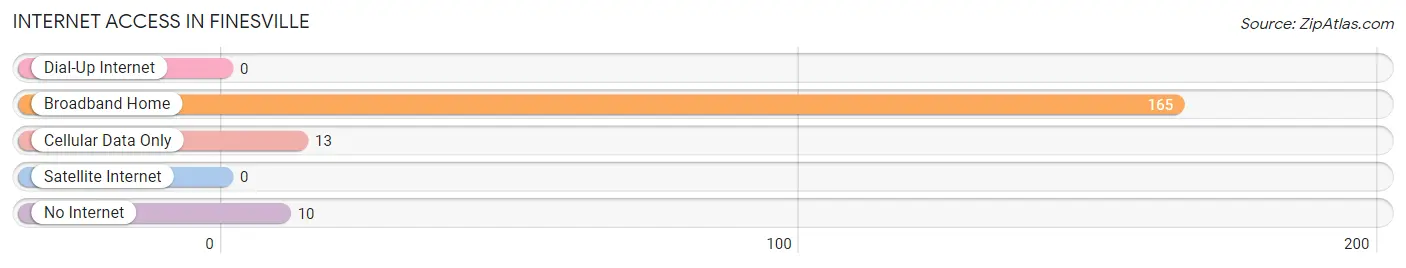
| Internet Type | # Households | % Households |
| Dial-Up Internet | 0 | 0.0% |
| Broadband Home | 165 | 87.8% |
| Cellular Data Only | 13 | 6.9% |
| Satellite Internet | 0 | 0.0% |
| No Internet | 10 | 5.3% |
| Total | 188 | 100.0% |
Finesville Summary
Finesville is a small unincorporated community located in western Hunterdon County, New Jersey. It is situated in the township of Alexandria, and is bordered by the towns of Holland and Milford. The community is located along the banks of the Musconetcong River, and is home to a population of approximately 500 people.
History
Finesville was first settled in the late 1700s by a group of German immigrants. The community was named after the Fines family, who were among the first settlers. The Fines family owned a large tract of land in the area, and the community grew up around their homestead.
In the early 1800s, the community was home to a number of small businesses, including a grist mill, a saw mill, and a blacksmith shop. The community also had a post office, which was established in 1845.
In the late 1800s, the community began to decline as the local economy shifted away from agriculture and towards industry. The post office closed in 1891, and the grist mill and saw mill were both shut down in the early 1900s.
Geography
Finesville is located in western Hunterdon County, New Jersey. It is situated in the township of Alexandria, and is bordered by the towns of Holland and Milford. The community is located along the banks of the Musconetcong River, and is home to a population of approximately 500 people.
The Musconetcong River is a major tributary of the Delaware River, and is a popular destination for fishing and boating. The river is also home to a variety of wildlife, including bald eagles, ospreys, and beavers.
Economy
Finesville is a primarily residential community, and the local economy is largely based on tourism and recreation. The Musconetcong River is a popular destination for fishing and boating, and the community is home to a number of small businesses, including restaurants, antique shops, and art galleries.
The community is also home to a number of small farms, which produce a variety of fruits and vegetables. The farms also provide employment for local residents.
Demographics
As of the 2010 census, the population of Finesville was 498. The racial makeup of the community was 97.2% White, 0.6% African American, 0.2% Native American, 0.4% Asian, and 1.6% from other races.
The median household income in Finesville was $63,750, and the median family income was $76,250. The per capita income was $30,945. The unemployment rate was 4.2%.
Conclusion
Finesville is a small unincorporated community located in western Hunterdon County, New Jersey. It is situated in the township of Alexandria, and is bordered by the towns of Holland and Milford. The community is located along the banks of the Musconetcong River, and is home to a population of approximately 500 people. The local economy is largely based on tourism and recreation, and the community is home to a number of small businesses, farms, and restaurants. The population of Finesville is predominantly white, and the median household income is $63,750.
Common Questions
What is Per Capita Income in Finesville?
Per Capita income in Finesville is $60,247.
What is the Median Family Income in Finesville?
Median Family Income in Finesville is $118,917.
What is the Median Household income in Finesville?
Median Household Income in Finesville is $63,833.
What is Income or Wage Gap in Finesville?
Income or Wage Gap in Finesville is 20.7%.
Women in Finesville earn 79.3 cents for every dollar earned by a man.
What is Inequality or Gini Index in Finesville?
Inequality or Gini Index in Finesville is 0.49.
What is the Total Population of Finesville?
Total Population of Finesville is 331.
What is the Total Male Population of Finesville?
Total Male Population of Finesville is 138.
What is the Total Female Population of Finesville?
Total Female Population of Finesville is 193.
What is the Ratio of Males per 100 Females in Finesville?
There are 71.50 Males per 100 Females in Finesville.
What is the Ratio of Females per 100 Males in Finesville?
There are 139.86 Females per 100 Males in Finesville.
What is the Median Population Age in Finesville?
Median Population Age in Finesville is 61.6 Years.
What is the Average Family Size in Finesville
Average Family Size in Finesville is 2.4 People.
What is the Average Household Size in Finesville
Average Household Size in Finesville is 1.8 People.
How Large is the Labor Force in Finesville?
There are 163 People in the Labor Forcein in Finesville.
What is the Percentage of People in the Labor Force in Finesville?
51.6% of People are in the Labor Force in Finesville.
What is the Unemployment Rate in Finesville?
Unemployment Rate in Finesville is 14.7%.