Ringwood borough, NJ Map & Demographics
Ringwood borough Overview
$62,750
PER CAPITA INCOME
$162,192
AVG FAMILY INCOME
$141,800
AVG HOUSEHOLD INCOME
21.3%
WAGE / INCOME GAP [ % ]
78.7¢/ $1
WAGE / INCOME GAP [ $ ]
0.39
INEQUALITY / GINI INDEX
11,692
TOTAL POPULATION
6,044
MALE POPULATION
5,648
FEMALE POPULATION
107.01
MALES / 100 FEMALES
93.45
FEMALES / 100 MALES
43.5
MEDIAN AGE
3.1
AVG FAMILY SIZE
2.7
AVG HOUSEHOLD SIZE
6,854
LABOR FORCE [ PEOPLE ]
70.7%
PERCENT IN LABOR FORCE
4.9%
UNEMPLOYMENT RATE
Income in Ringwood borough
Income Overview in Ringwood borough
Per Capita Income in Ringwood borough is $62,750, while median incomes of families and households are $162,192 and $141,800 respectively.
| Characteristic | Number | Measure |
| Per Capita Income | 11,692 | $62,750 |
| Median Family Income | 3,381 | $162,192 |
| Mean Family Income | 3,381 | $182,826 |
| Median Household Income | 4,256 | $141,800 |
| Mean Household Income | 4,256 | $170,445 |
| Income Deficit | 3,381 | $0 |
| Wage / Income Gap (%) | 11,692 | 21.32% |
| Wage / Income Gap ($) | 11,692 | 78.68¢ per $1 |
| Gini / Inequality Index | 11,692 | 0.39 |
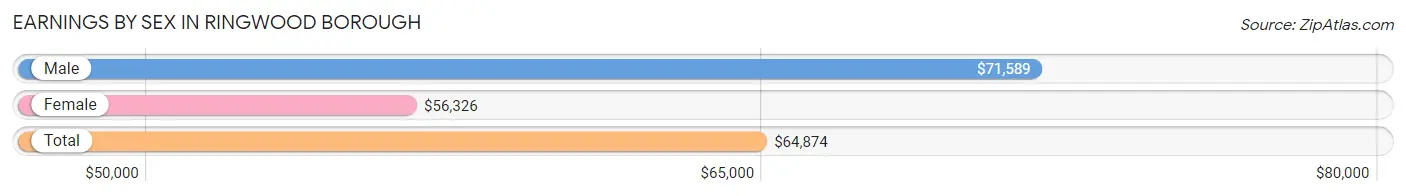
Earnings by Sex in Ringwood borough
Average Earnings in Ringwood borough are $64,874, $71,589 for men and $56,326 for women, a difference of 21.3%.
| Sex | Number | Average Earnings |
| Male | 3,874 (55.5%) | $71,589 |
| Female | 3,103 (44.5%) | $56,326 |
| Total | 6,977 (100.0%) | $64,874 |
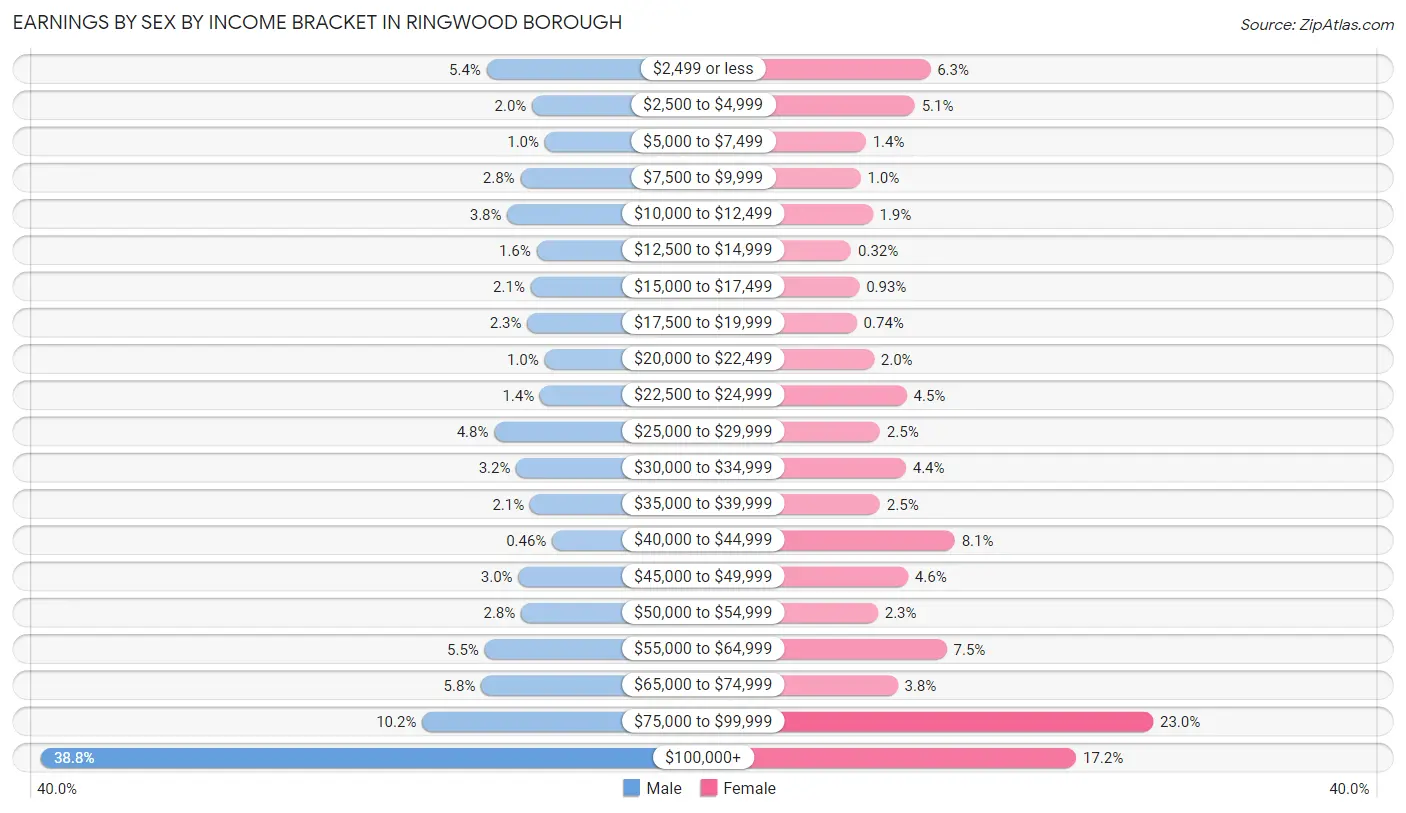
Earnings by Sex by Income Bracket in Ringwood borough
The most common earnings brackets in Ringwood borough are $100,000+ for men (1,502 | 38.8%) and $75,000 to $99,999 for women (712 | 23.0%).
| Income | Male | Female |
| $2,499 or less | 208 (5.4%) | 194 (6.2%) |
| $2,500 to $4,999 | 76 (2.0%) | 158 (5.1%) |
| $5,000 to $7,499 | 39 (1.0%) | 44 (1.4%) |
| $7,500 to $9,999 | 110 (2.8%) | 32 (1.0%) |
| $10,000 to $12,499 | 148 (3.8%) | 60 (1.9%) |
| $12,500 to $14,999 | 63 (1.6%) | 10 (0.3%) |
| $15,000 to $17,499 | 80 (2.1%) | 29 (0.9%) |
| $17,500 to $19,999 | 90 (2.3%) | 23 (0.7%) |
| $20,000 to $22,499 | 40 (1.0%) | 63 (2.0%) |
| $22,500 to $24,999 | 53 (1.4%) | 139 (4.5%) |
| $25,000 to $29,999 | 186 (4.8%) | 77 (2.5%) |
| $30,000 to $34,999 | 122 (3.2%) | 137 (4.4%) |
| $35,000 to $39,999 | 82 (2.1%) | 77 (2.5%) |
| $40,000 to $44,999 | 18 (0.5%) | 251 (8.1%) |
| $45,000 to $49,999 | 116 (3.0%) | 142 (4.6%) |
| $50,000 to $54,999 | 108 (2.8%) | 72 (2.3%) |
| $55,000 to $64,999 | 214 (5.5%) | 232 (7.5%) |
| $65,000 to $74,999 | 224 (5.8%) | 118 (3.8%) |
| $75,000 to $99,999 | 395 (10.2%) | 712 (23.0%) |
| $100,000+ | 1,502 (38.8%) | 533 (17.2%) |
| Total | 3,874 (100.0%) | 3,103 (100.0%) |
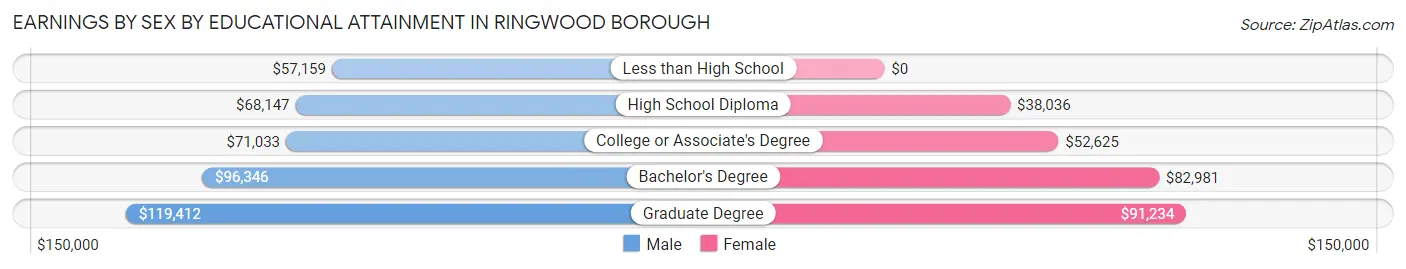
Earnings by Sex by Educational Attainment in Ringwood borough
Average earnings in Ringwood borough are $81,217 for men and $64,325 for women, a difference of 20.8%. Men with an educational attainment of graduate degree enjoy the highest average annual earnings of $119,412, while those with less than high school education earn the least with $57,159. Women with an educational attainment of graduate degree earn the most with the average annual earnings of $91,234, while those with high school diploma education have the smallest earnings of $38,036.
| Educational Attainment | Male Income | Female Income |
| Less than High School | $57,159 | $0 |
| High School Diploma | $68,147 | $38,036 |
| College or Associate's Degree | $71,033 | $52,625 |
| Bachelor's Degree | $96,346 | $82,981 |
| Graduate Degree | $119,412 | $91,234 |
| Total | $81,217 | $64,325 |
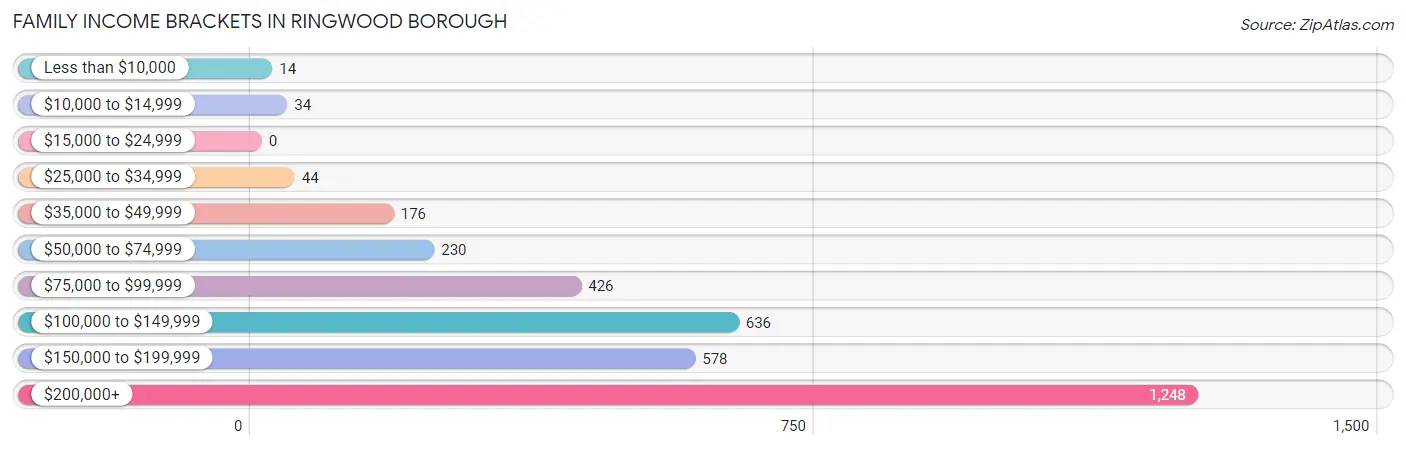
Family Income in Ringwood borough
Family Income Brackets in Ringwood borough
According to the Ringwood borough family income data, there are 1,248 families falling into the $200,000+ income range, which is the most common income bracket and makes up 36.9% of all families.
| Income Bracket | # Families | % Families |
| Less than $10,000 | 14 | 0.4% |
| $10,000 to $14,999 | 34 | 1.0% |
| $15,000 to $24,999 | 0 | 0.0% |
| $25,000 to $34,999 | 44 | 1.3% |
| $35,000 to $49,999 | 176 | 5.2% |
| $50,000 to $74,999 | 230 | 6.8% |
| $75,000 to $99,999 | 426 | 12.6% |
| $100,000 to $149,999 | 636 | 18.8% |
| $150,000 to $199,999 | 578 | 17.1% |
| $200,000+ | 1,248 | 36.9% |
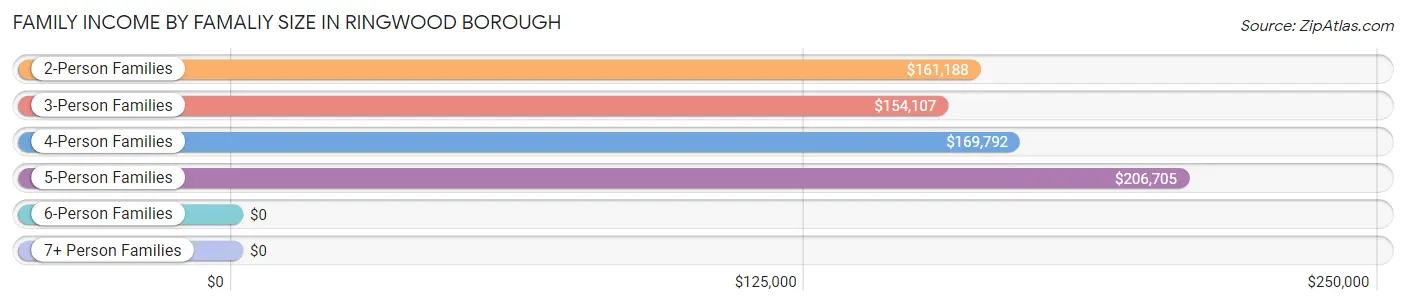
Family Income by Famaliy Size in Ringwood borough
5-person families (245 | 7.2%) account for the highest median family income in Ringwood borough with $206,705 per family, while 2-person families (1,561 | 46.2%) have the highest median income of $80,594 per family member.
| Income Bracket | # Families | Median Income |
| 2-Person Families | 1,561 (46.2%) | $161,188 |
| 3-Person Families | 611 (18.1%) | $154,107 |
| 4-Person Families | 934 (27.6%) | $169,792 |
| 5-Person Families | 245 (7.2%) | $206,705 |
| 6-Person Families | 30 (0.9%) | $0 |
| 7+ Person Families | 0 (0.0%) | $0 |
| Total | 3,381 (100.0%) | $162,192 |
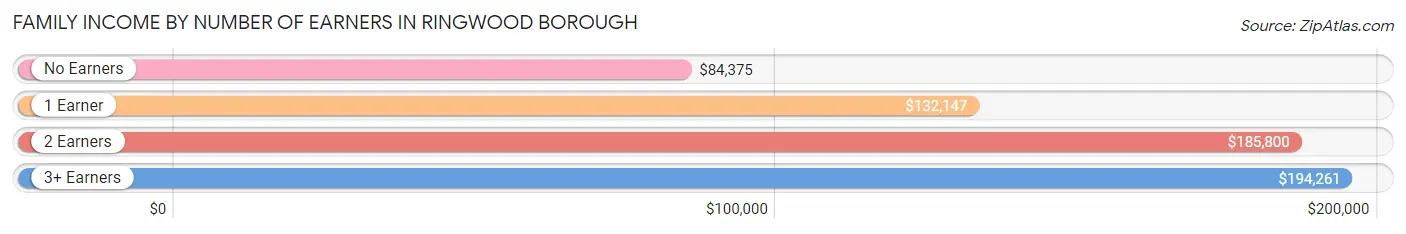
Family Income by Number of Earners in Ringwood borough
The median family income in Ringwood borough is $162,192, with families comprising 3+ earners (547) having the highest median family income of $194,261, while families with no earners (347) have the lowest median family income of $84,375, accounting for 16.2% and 10.3% of families, respectively.
| Number of Earners | # Families | Median Income |
| No Earners | 347 (10.3%) | $84,375 |
| 1 Earner | 797 (23.6%) | $132,147 |
| 2 Earners | 1,690 (50.0%) | $185,800 |
| 3+ Earners | 547 (16.2%) | $194,261 |
| Total | 3,381 (100.0%) | $162,192 |
Household Income in Ringwood borough
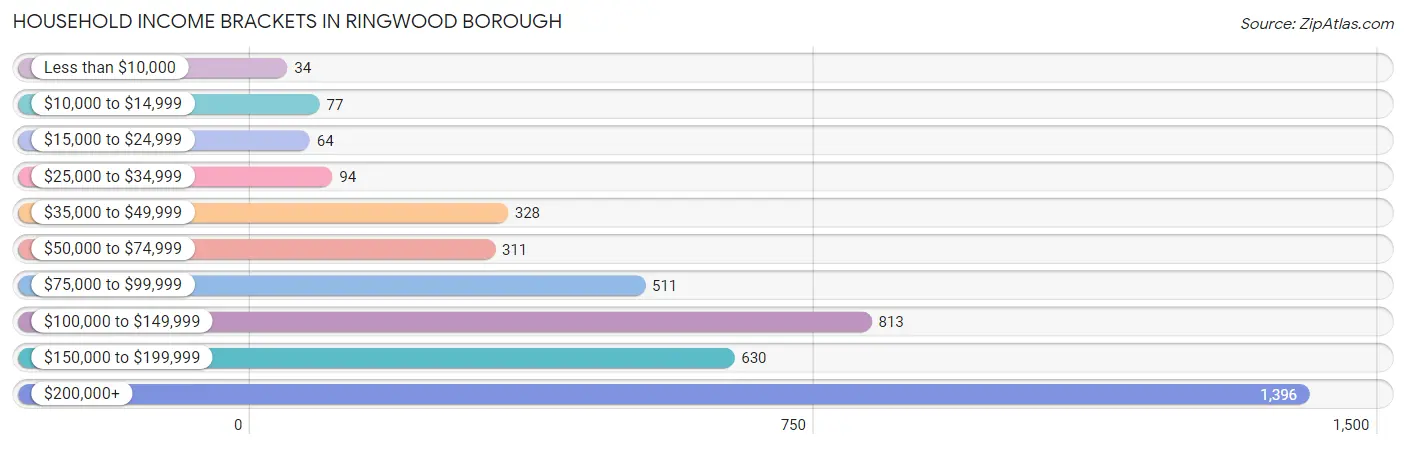
Household Income Brackets in Ringwood borough
With 1,396 households falling in the category, the $200,000+ income range is the most frequent in Ringwood borough, accounting for 32.8% of all households. In contrast, only 34 households (0.8%) fall into the less than $10,000 income bracket, making it the least populous group.
| Income Bracket | # Households | % Households |
| Less than $10,000 | 34 | 0.8% |
| $10,000 to $14,999 | 77 | 1.8% |
| $15,000 to $24,999 | 64 | 1.5% |
| $25,000 to $34,999 | 94 | 2.2% |
| $35,000 to $49,999 | 328 | 7.7% |
| $50,000 to $74,999 | 311 | 7.3% |
| $75,000 to $99,999 | 511 | 12.0% |
| $100,000 to $149,999 | 813 | 19.1% |
| $150,000 to $199,999 | 630 | 14.8% |
| $200,000+ | 1,396 | 32.8% |
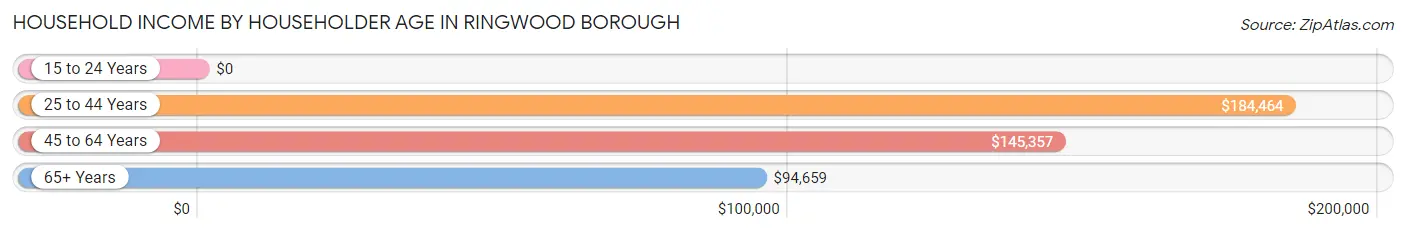
Household Income by Householder Age in Ringwood borough
The median household income in Ringwood borough is $141,800, with the highest median household income of $184,464 found in the 25 to 44 years age bracket for the primary householder. A total of 1,180 households (27.7%) fall into this category.
| Income Bracket | # Households | Median Income |
| 15 to 24 Years | 0 (0.0%) | $0 |
| 25 to 44 Years | 1,180 (27.7%) | $184,464 |
| 45 to 64 Years | 1,982 (46.6%) | $145,357 |
| 65+ Years | 1,094 (25.7%) | $94,659 |
| Total | 4,256 (100.0%) | $141,800 |
Poverty in Ringwood borough
Income Below Poverty by Sex and Age in Ringwood borough
With 2.8% poverty level for males and 1.6% for females among the residents of Ringwood borough, 5 year old males and 75 year old and over females are the most vulnerable to poverty, with 12 males (11.3%) and 25 females (7.2%) in their respective age groups living below the poverty level.
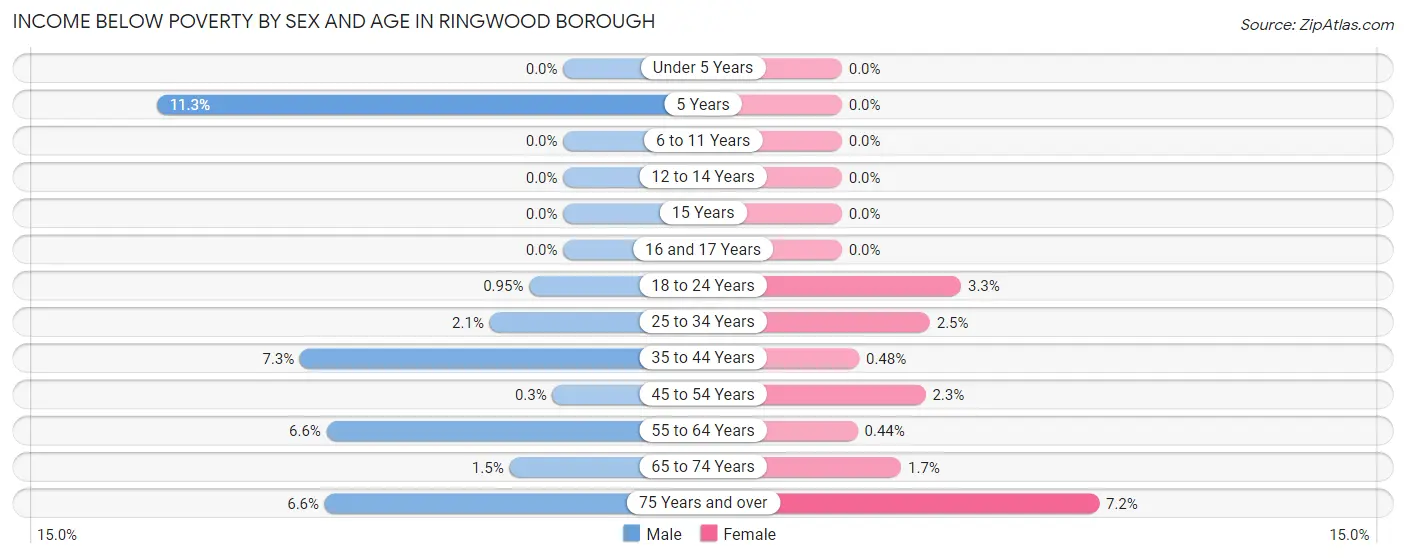
| Age Bracket | Male | Female |
| Under 5 Years | 0 (0.0%) | 0 (0.0%) |
| 5 Years | 12 (11.3%) | 0 (0.0%) |
| 6 to 11 Years | 0 (0.0%) | 0 (0.0%) |
| 12 to 14 Years | 0 (0.0%) | 0 (0.0%) |
| 15 Years | 0 (0.0%) | 0 (0.0%) |
| 16 and 17 Years | 0 (0.0%) | 0 (0.0%) |
| 18 to 24 Years | 5 (0.9%) | 12 (3.3%) |
| 25 to 34 Years | 19 (2.1%) | 19 (2.5%) |
| 35 to 44 Years | 40 (7.3%) | 3 (0.5%) |
| 45 to 54 Years | 3 (0.3%) | 18 (2.3%) |
| 55 to 64 Years | 61 (6.6%) | 4 (0.4%) |
| 65 to 74 Years | 10 (1.5%) | 11 (1.7%) |
| 75 Years and over | 20 (6.6%) | 25 (7.2%) |
| Total | 170 (2.8%) | 92 (1.6%) |
Income Above Poverty by Sex and Age in Ringwood borough
According to the poverty statistics in Ringwood borough, males aged under 5 years and females aged under 5 years are the age groups that are most secure financially, with 100.0% of males and 100.0% of females in these age groups living above the poverty line.
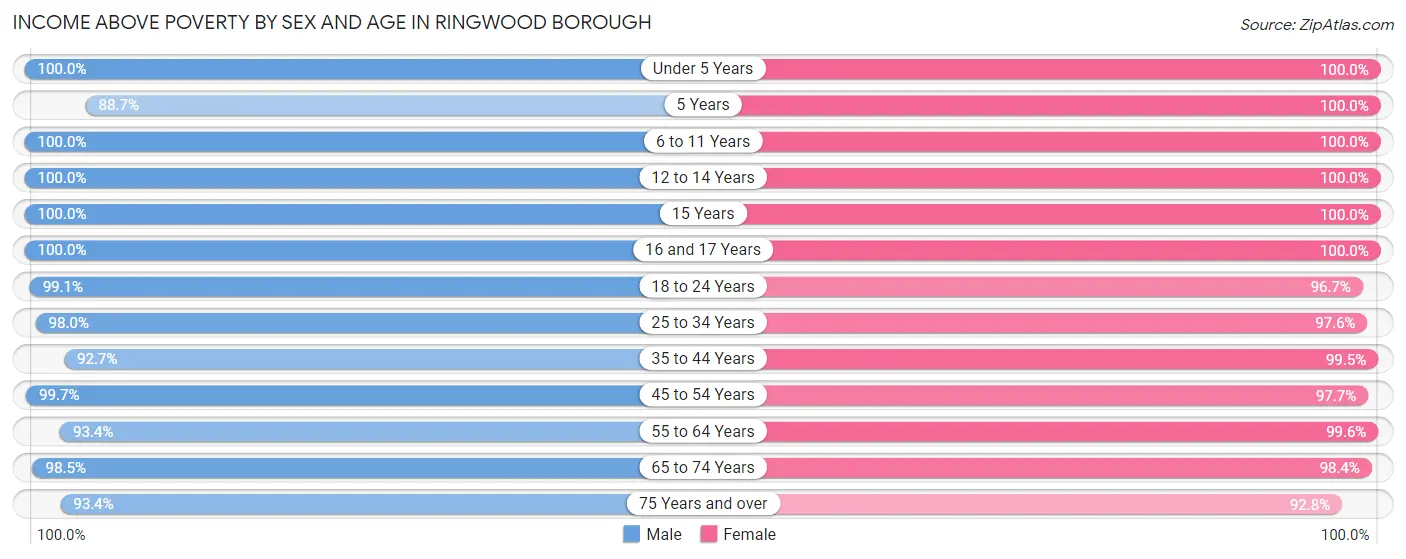
| Age Bracket | Male | Female |
| Under 5 Years | 303 (100.0%) | 184 (100.0%) |
| 5 Years | 94 (88.7%) | 30 (100.0%) |
| 6 to 11 Years | 259 (100.0%) | 370 (100.0%) |
| 12 to 14 Years | 266 (100.0%) | 361 (100.0%) |
| 15 Years | 82 (100.0%) | 26 (100.0%) |
| 16 and 17 Years | 83 (100.0%) | 201 (100.0%) |
| 18 to 24 Years | 520 (99.1%) | 349 (96.7%) |
| 25 to 34 Years | 910 (98.0%) | 758 (97.6%) |
| 35 to 44 Years | 506 (92.7%) | 624 (99.5%) |
| 45 to 54 Years | 1,013 (99.7%) | 753 (97.7%) |
| 55 to 64 Years | 865 (93.4%) | 909 (99.6%) |
| 65 to 74 Years | 656 (98.5%) | 657 (98.4%) |
| 75 Years and over | 281 (93.4%) | 324 (92.8%) |
| Total | 5,838 (97.2%) | 5,546 (98.4%) |
Income Below Poverty Among Married-Couple Families in Ringwood borough
The poverty statistics for married-couple families in Ringwood borough show that 1.1% or 33 of the total 2,924 families live below the poverty line. Families with no children have the highest poverty rate of 1.8%, comprising of 33 families. On the other hand, families with 1 or 2 children have the lowest poverty rate of 0.0%, which includes 0 families.
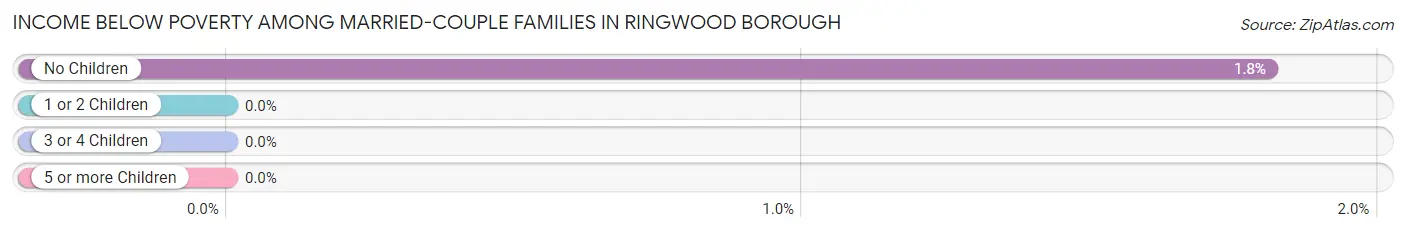
| Children | Above Poverty | Below Poverty |
| No Children | 1,788 (98.2%) | 33 (1.8%) |
| 1 or 2 Children | 995 (100.0%) | 0 (0.0%) |
| 3 or 4 Children | 108 (100.0%) | 0 (0.0%) |
| 5 or more Children | 0 (0.0%) | 0 (0.0%) |
| Total | 2,891 (98.9%) | 33 (1.1%) |
Income Below Poverty Among Single-Parent Households in Ringwood borough
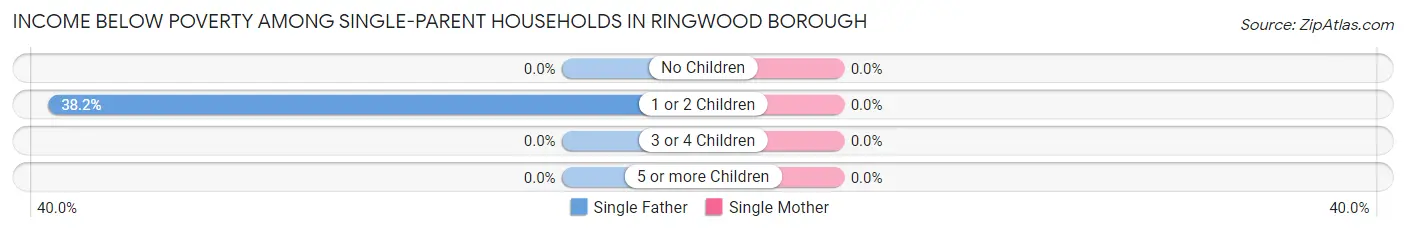
| Children | Single Father | Single Mother |
| No Children | 0 (0.0%) | 0 (0.0%) |
| 1 or 2 Children | 13 (38.2%) | 0 (0.0%) |
| 3 or 4 Children | 0 (0.0%) | 0 (0.0%) |
| 5 or more Children | 0 (0.0%) | 0 (0.0%) |
| Total | 13 (9.9%) | 0 (0.0%) |
Income Below Poverty Among Married-Couple vs Single-Parent Households in Ringwood borough
The poverty data for Ringwood borough shows that 33 of the married-couple family households (1.1%) and 13 of the single-parent households (2.8%) are living below the poverty level. Within the married-couple family households, those with no children have the highest poverty rate, with 33 households (1.8%) falling below the poverty line. Among the single-parent households, those with 1 or 2 children have the highest poverty rate, with 13 household (6.1%) living below poverty.
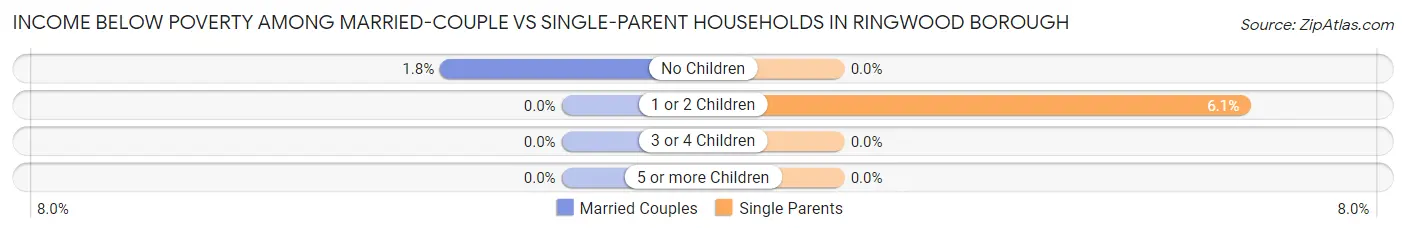
| Children | Married-Couple Families | Single-Parent Households |
| No Children | 33 (1.8%) | 0 (0.0%) |
| 1 or 2 Children | 0 (0.0%) | 13 (6.1%) |
| 3 or 4 Children | 0 (0.0%) | 0 (0.0%) |
| 5 or more Children | 0 (0.0%) | 0 (0.0%) |
| Total | 33 (1.1%) | 13 (2.8%) |
Race in Ringwood borough
The most populous races in Ringwood borough are White / Caucasian (10,061 | 86.1%), Hispanic or Latino (1,360 | 11.6%), and Two or more Races (895 | 7.6%).
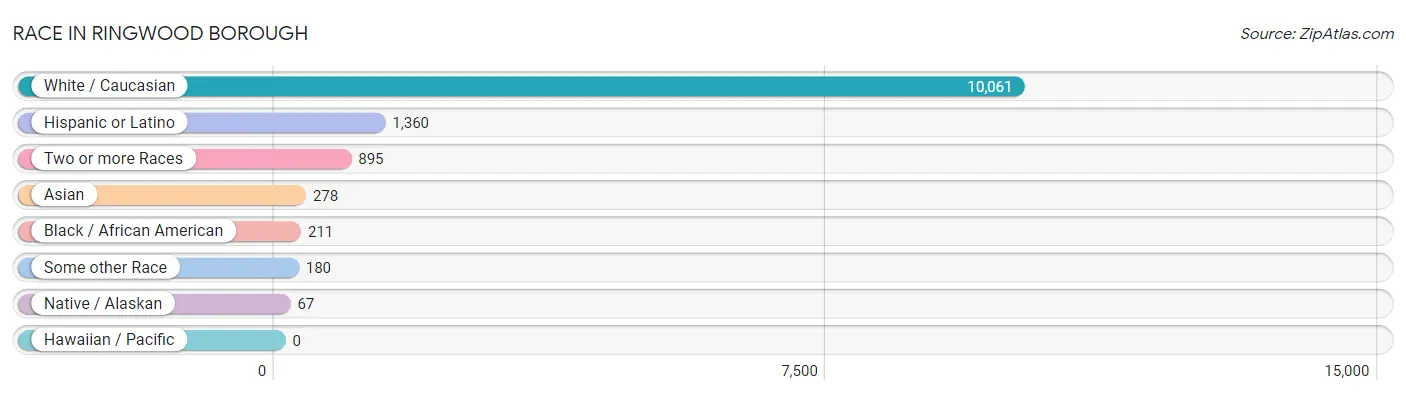
| Race | # Population | % Population |
| Asian | 278 | 2.4% |
| Black / African American | 211 | 1.8% |
| Hawaiian / Pacific | 0 | 0.0% |
| Hispanic or Latino | 1,360 | 11.6% |
| Native / Alaskan | 67 | 0.6% |
| White / Caucasian | 10,061 | 86.1% |
| Two or more Races | 895 | 7.6% |
| Some other Race | 180 | 1.5% |
| Total | 11,692 | 100.0% |
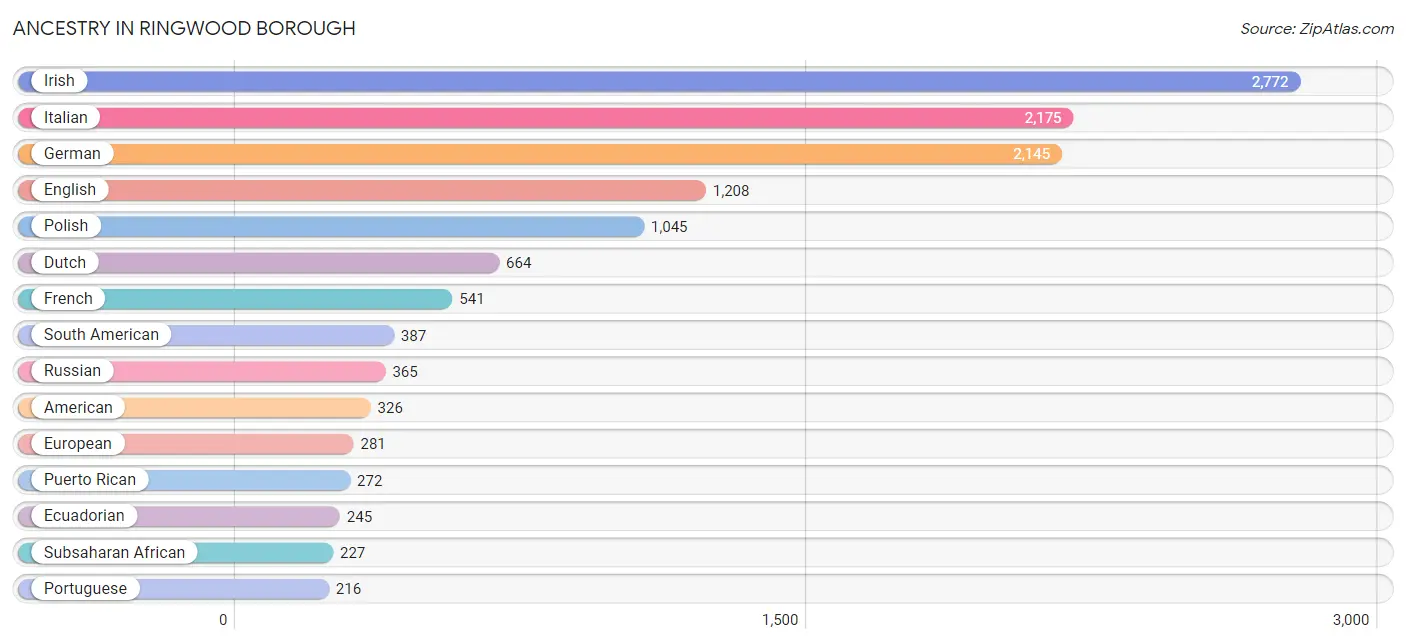
Ancestry in Ringwood borough
The most populous ancestries reported in Ringwood borough are Irish (2,772 | 23.7%), Italian (2,175 | 18.6%), German (2,145 | 18.3%), English (1,208 | 10.3%), and Polish (1,045 | 8.9%), together accounting for 79.9% of all Ringwood borough residents.
| Ancestry | # Population | % Population |
| African | 92 | 0.8% |
| American | 326 | 2.8% |
| Arab | 16 | 0.1% |
| Assyrian / Chaldean / Syriac | 2 | 0.0% |
| Austrian | 82 | 0.7% |
| Belgian | 37 | 0.3% |
| Bhutanese | 54 | 0.5% |
| Brazilian | 151 | 1.3% |
| British | 121 | 1.0% |
| Burmese | 77 | 0.7% |
| Central American | 206 | 1.8% |
| Chippewa | 1 | 0.0% |
| Colombian | 60 | 0.5% |
| Costa Rican | 166 | 1.4% |
| Cuban | 91 | 0.8% |
| Czech | 24 | 0.2% |
| Danish | 27 | 0.2% |
| Delaware | 60 | 0.5% |
| Dominican | 207 | 1.8% |
| Dutch | 664 | 5.7% |
| Eastern European | 81 | 0.7% |
| Ecuadorian | 245 | 2.1% |
| English | 1,208 | 10.3% |
| European | 281 | 2.4% |
| Finnish | 19 | 0.2% |
| French | 541 | 4.6% |
| French Canadian | 35 | 0.3% |
| German | 2,145 | 18.3% |
| Greek | 97 | 0.8% |
| Guyanese | 31 | 0.3% |
| Haitian | 10 | 0.1% |
| Hungarian | 116 | 1.0% |
| Indian (Asian) | 28 | 0.2% |
| Irish | 2,772 | 23.7% |
| Iroquois | 101 | 0.9% |
| Israeli | 12 | 0.1% |
| Italian | 2,175 | 18.6% |
| Jamaican | 168 | 1.4% |
| Korean | 129 | 1.1% |
| Lithuanian | 31 | 0.3% |
| Maltese | 11 | 0.1% |
| Mexican | 123 | 1.1% |
| Norwegian | 54 | 0.5% |
| Peruvian | 82 | 0.7% |
| Polish | 1,045 | 8.9% |
| Portuguese | 216 | 1.8% |
| Pueblo | 10 | 0.1% |
| Puerto Rican | 272 | 2.3% |
| Romanian | 10 | 0.1% |
| Russian | 365 | 3.1% |
| Salvadoran | 40 | 0.3% |
| Scotch-Irish | 56 | 0.5% |
| Scottish | 131 | 1.1% |
| Serbian | 22 | 0.2% |
| Sioux | 9 | 0.1% |
| Slavic | 22 | 0.2% |
| Slovak | 8 | 0.1% |
| South African | 114 | 1.0% |
| South American | 387 | 3.3% |
| Spaniard | 70 | 0.6% |
| Sri Lankan | 65 | 0.6% |
| Subsaharan African | 227 | 1.9% |
| Swedish | 28 | 0.2% |
| Swiss | 19 | 0.2% |
| Syrian | 16 | 0.1% |
| Thai | 63 | 0.5% |
| Ukrainian | 29 | 0.3% |
| Welsh | 33 | 0.3% | View All 68 Rows |
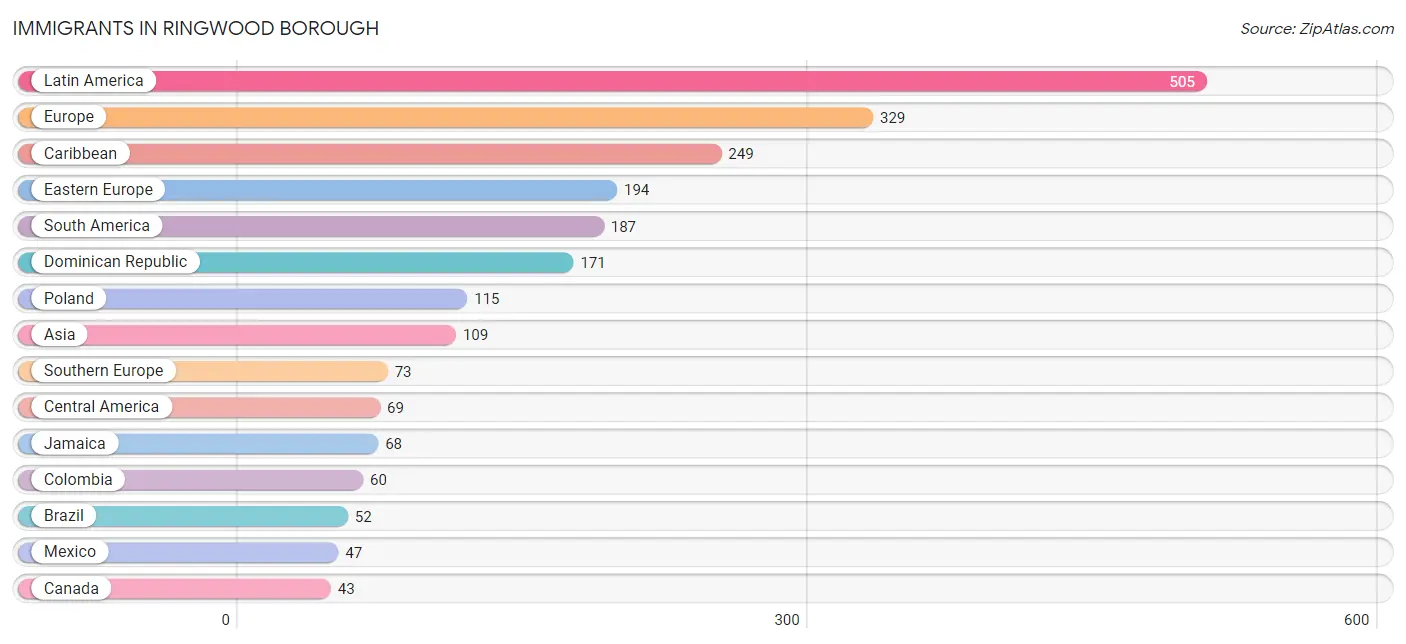
Immigrants in Ringwood borough
The most numerous immigrant groups reported in Ringwood borough came from Latin America (505 | 4.3%), Europe (329 | 2.8%), Caribbean (249 | 2.1%), Eastern Europe (194 | 1.7%), and South America (187 | 1.6%), together accounting for 12.5% of all Ringwood borough residents.
| Immigration Origin | # Population | % Population |
| Africa | 36 | 0.3% |
| Asia | 109 | 0.9% |
| Brazil | 52 | 0.4% |
| Canada | 43 | 0.4% |
| Caribbean | 249 | 2.1% |
| Central America | 69 | 0.6% |
| China | 8 | 0.1% |
| Colombia | 60 | 0.5% |
| Costa Rica | 20 | 0.2% |
| Czechoslovakia | 8 | 0.1% |
| Dominican Republic | 171 | 1.5% |
| Eastern Asia | 8 | 0.1% |
| Eastern Europe | 194 | 1.7% |
| Ecuador | 41 | 0.4% |
| Europe | 329 | 2.8% |
| France | 15 | 0.1% |
| Germany | 19 | 0.2% |
| Greece | 9 | 0.1% |
| Guyana | 21 | 0.2% |
| Haiti | 10 | 0.1% |
| Honduras | 2 | 0.0% |
| Hungary | 13 | 0.1% |
| India | 32 | 0.3% |
| Israel | 28 | 0.2% |
| Italy | 32 | 0.3% |
| Jamaica | 68 | 0.6% |
| Latin America | 505 | 4.3% |
| Lebanon | 7 | 0.1% |
| Mexico | 47 | 0.4% |
| Netherlands | 9 | 0.1% |
| North Macedonia | 18 | 0.2% |
| Northern Europe | 19 | 0.2% |
| Peru | 13 | 0.1% |
| Poland | 115 | 1.0% |
| Portugal | 32 | 0.3% |
| Russia | 18 | 0.2% |
| Serbia | 22 | 0.2% |
| South Africa | 36 | 0.3% |
| South America | 187 | 1.6% |
| South Central Asia | 32 | 0.3% |
| South Eastern Asia | 32 | 0.3% |
| Southern Europe | 73 | 0.6% |
| Syria | 2 | 0.0% |
| Vietnam | 32 | 0.3% |
| Western Asia | 37 | 0.3% |
| Western Europe | 43 | 0.4% | View All 46 Rows |
Sex and Age in Ringwood borough
Sex and Age in Ringwood borough
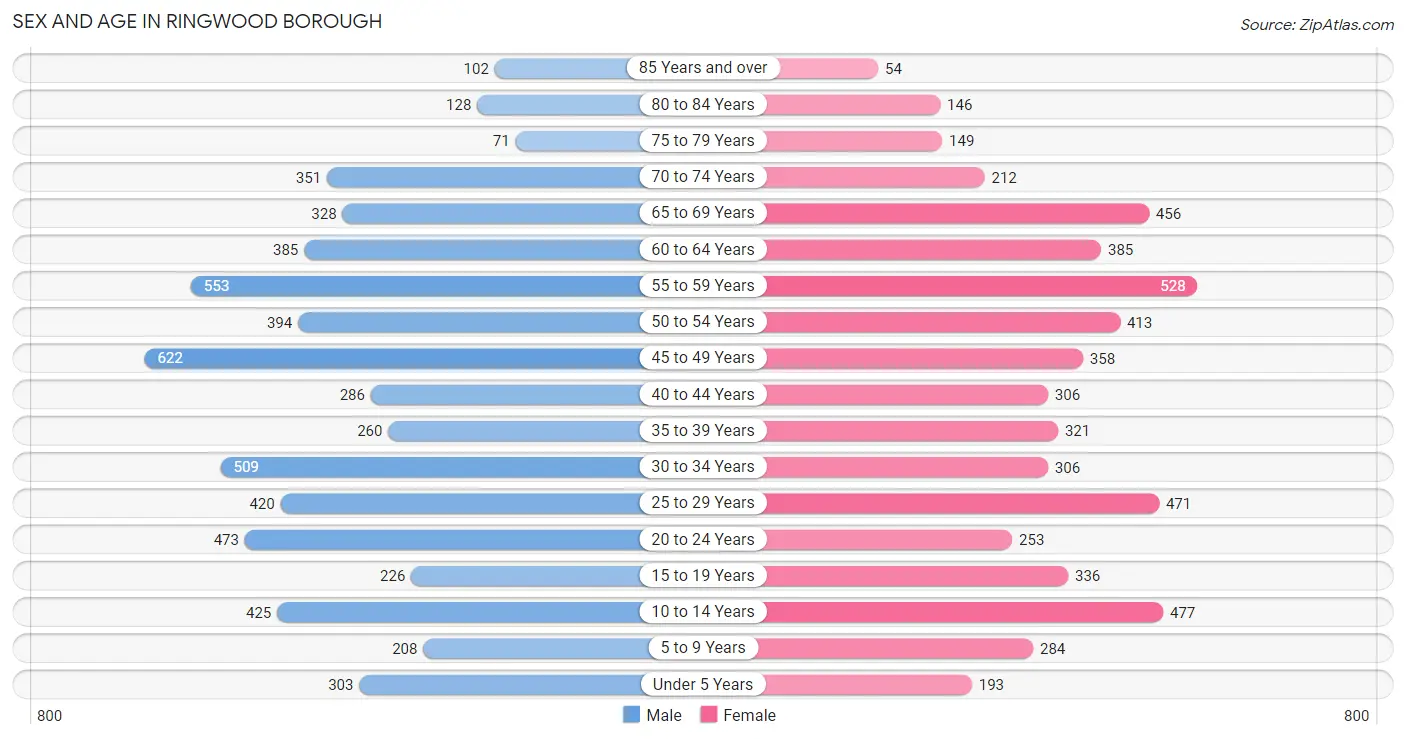
The most populous age groups in Ringwood borough are 45 to 49 Years (622 | 10.3%) for men and 55 to 59 Years (528 | 9.3%) for women.
| Age Bracket | Male | Female |
| Under 5 Years | 303 (5.0%) | 193 (3.4%) |
| 5 to 9 Years | 208 (3.4%) | 284 (5.0%) |
| 10 to 14 Years | 425 (7.0%) | 477 (8.5%) |
| 15 to 19 Years | 226 (3.7%) | 336 (5.9%) |
| 20 to 24 Years | 473 (7.8%) | 253 (4.5%) |
| 25 to 29 Years | 420 (7.0%) | 471 (8.3%) |
| 30 to 34 Years | 509 (8.4%) | 306 (5.4%) |
| 35 to 39 Years | 260 (4.3%) | 321 (5.7%) |
| 40 to 44 Years | 286 (4.7%) | 306 (5.4%) |
| 45 to 49 Years | 622 (10.3%) | 358 (6.3%) |
| 50 to 54 Years | 394 (6.5%) | 413 (7.3%) |
| 55 to 59 Years | 553 (9.1%) | 528 (9.3%) |
| 60 to 64 Years | 385 (6.4%) | 385 (6.8%) |
| 65 to 69 Years | 328 (5.4%) | 456 (8.1%) |
| 70 to 74 Years | 351 (5.8%) | 212 (3.7%) |
| 75 to 79 Years | 71 (1.2%) | 149 (2.6%) |
| 80 to 84 Years | 128 (2.1%) | 146 (2.6%) |
| 85 Years and over | 102 (1.7%) | 54 (1.0%) |
| Total | 6,044 (100.0%) | 5,648 (100.0%) |
Families and Households in Ringwood borough
Median Family Size in Ringwood borough
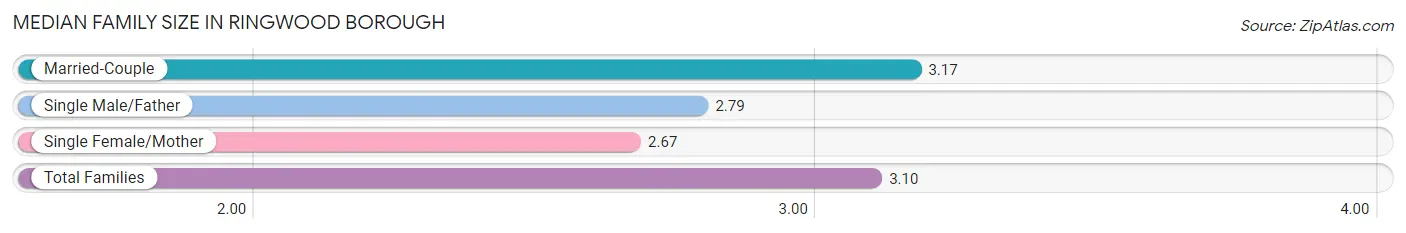
The median family size in Ringwood borough is 3.10 persons per family, with married-couple families (2,924 | 86.5%) accounting for the largest median family size of 3.17 persons per family. On the other hand, single female/mother families (326 | 9.6%) represent the smallest median family size with 2.67 persons per family.
| Family Type | # Families | Family Size |
| Married-Couple | 2,924 (86.5%) | 3.17 |
| Single Male/Father | 131 (3.9%) | 2.79 |
| Single Female/Mother | 326 (9.6%) | 2.67 |
| Total Families | 3,381 (100.0%) | 3.10 |
Median Household Size in Ringwood borough
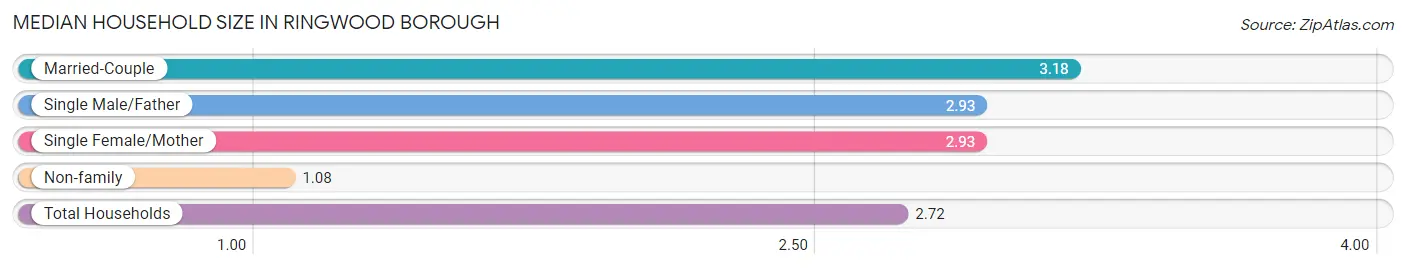
The median household size in Ringwood borough is 2.72 persons per household, with married-couple households (2,924 | 68.7%) accounting for the largest median household size of 3.18 persons per household. non-family households (875 | 20.6%) represent the smallest median household size with 1.08 persons per household.
| Household Type | # Households | Household Size |
| Married-Couple | 2,924 (68.7%) | 3.18 |
| Single Male/Father | 131 (3.1%) | 2.93 |
| Single Female/Mother | 326 (7.7%) | 2.93 |
| Non-family | 875 (20.6%) | 1.08 |
| Total Households | 4,256 (100.0%) | 2.72 |
Household Size by Marriage Status in Ringwood borough
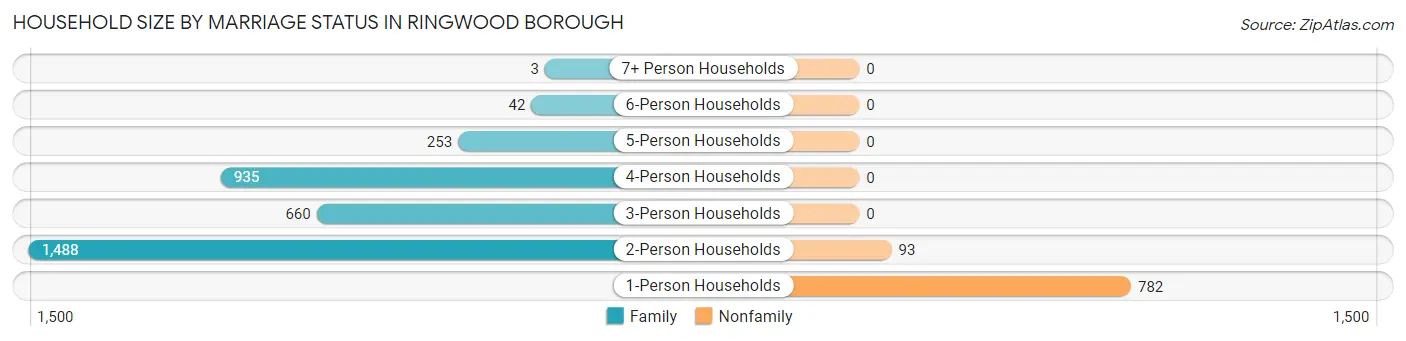
Out of a total of 4,256 households in Ringwood borough, 3,381 (79.4%) are family households, while 875 (20.6%) are nonfamily households. The most numerous type of family households are 2-person households, comprising 1,488, and the most common type of nonfamily households are 1-person households, comprising 782.
| Household Size | Family Households | Nonfamily Households |
| 1-Person Households | - | 782 (18.4%) |
| 2-Person Households | 1,488 (35.0%) | 93 (2.2%) |
| 3-Person Households | 660 (15.5%) | 0 (0.0%) |
| 4-Person Households | 935 (22.0%) | 0 (0.0%) |
| 5-Person Households | 253 (5.9%) | 0 (0.0%) |
| 6-Person Households | 42 (1.0%) | 0 (0.0%) |
| 7+ Person Households | 3 (0.1%) | 0 (0.0%) |
| Total | 3,381 (79.4%) | 875 (20.6%) |
Female Fertility in Ringwood borough
Fertility by Age in Ringwood borough
Average fertility rate in Ringwood borough is 20.0 births per 1,000 women. Women in the age bracket of 20 to 34 years have the highest fertility rate with 40.0 births per 1,000 women. Women in the age bracket of 20 to 34 years acount for 83.7% of all women with births.
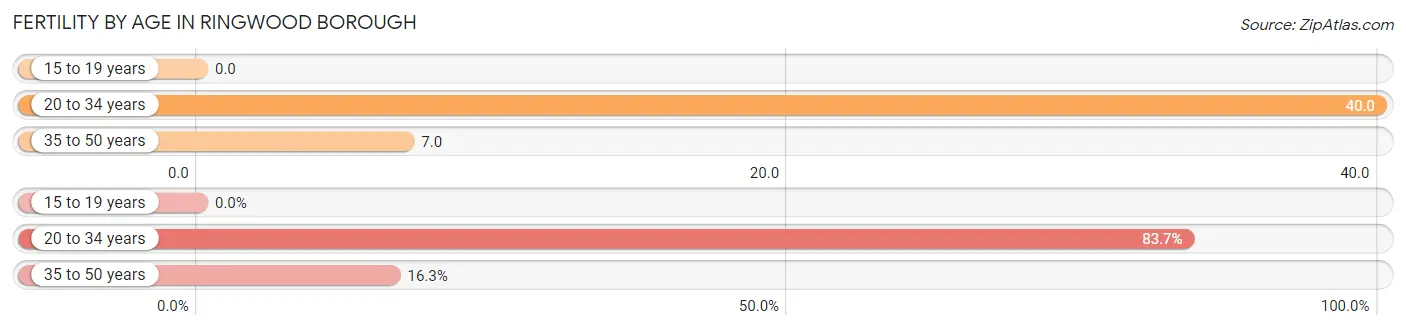
| Age Bracket | Women with Births | Births / 1,000 Women |
| 15 to 19 years | 0 (0.0%) | 0.0 |
| 20 to 34 years | 41 (83.7%) | 40.0 |
| 35 to 50 years | 8 (16.3%) | 7.0 |
| Total | 49 (100.0%) | 20.0 |
Fertility by Age by Marriage Status in Ringwood borough
79.6% of women with births (49) in Ringwood borough are married. The highest percentage of unmarried women with births falls into 35 to 50 years age bracket with 100.0% of them unmarried at the time of birth, while the lowest percentage of unmarried women with births belong to 20 to 34 years age bracket with 4.9% of them unmarried.
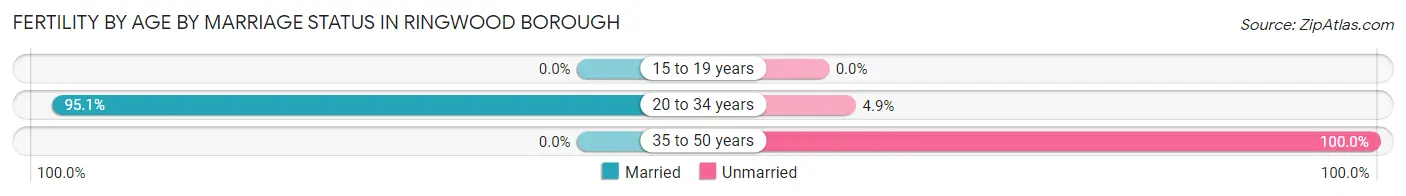
| Age Bracket | Married | Unmarried |
| 15 to 19 years | 0 (0.0%) | 0 (0.0%) |
| 20 to 34 years | 39 (95.1%) | 2 (4.9%) |
| 35 to 50 years | 0 (0.0%) | 8 (100.0%) |
| Total | 39 (79.6%) | 10 (20.4%) |
Fertility by Education in Ringwood borough
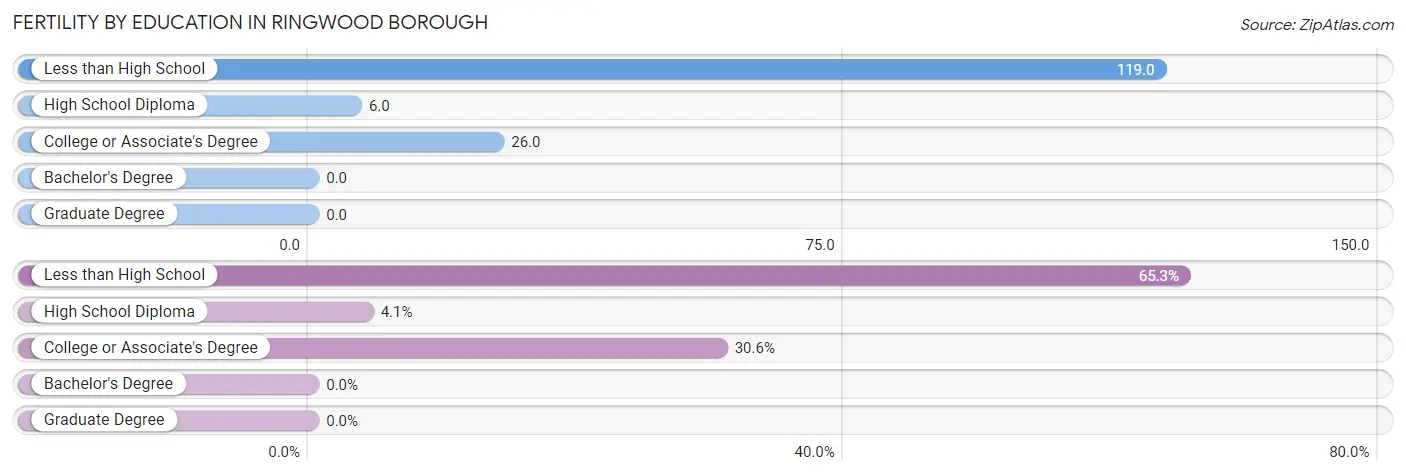
| Educational Attainment | Women with Births | Births / 1,000 Women |
| Less than High School | 32 (65.3%) | 119.0 |
| High School Diploma | 2 (4.1%) | 6.0 |
| College or Associate's Degree | 15 (30.6%) | 26.0 |
| Bachelor's Degree | 0 (0.0%) | 0.0 |
| Graduate Degree | 0 (0.0%) | 0.0 |
| Total | 49 (100.0%) | 20.0 |
Fertility by Education by Marriage Status in Ringwood borough
20.4% of women with births in Ringwood borough are unmarried. Women with the educational attainment of less than high school are most likely to be married with 100.0% of them married at childbirth, while women with the educational attainment of high school diploma are least likely to be married with 100.0% of them unmarried at childbirth.
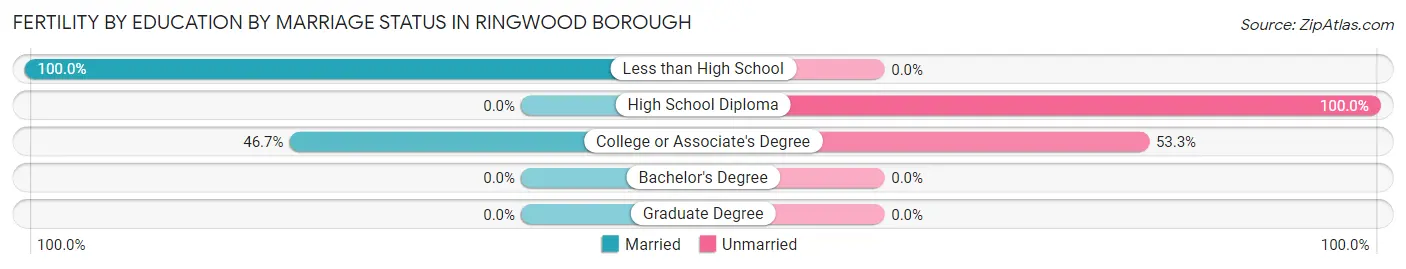
| Educational Attainment | Married | Unmarried |
| Less than High School | 32 (100.0%) | 0 (0.0%) |
| High School Diploma | 0 (0.0%) | 2 (100.0%) |
| College or Associate's Degree | 7 (46.7%) | 8 (53.3%) |
| Bachelor's Degree | 0 (0.0%) | 0 (0.0%) |
| Graduate Degree | 0 (0.0%) | 0 (0.0%) |
| Total | 39 (79.6%) | 10 (20.4%) |
Employment Characteristics in Ringwood borough
Employment by Class of Employer in Ringwood borough
Among the 6,381 employed individuals in Ringwood borough, private company employees (4,300 | 67.4%), local government employees (789 | 12.4%), and self-employed (not incorporated) (393 | 6.2%) make up the most common classes of employment.
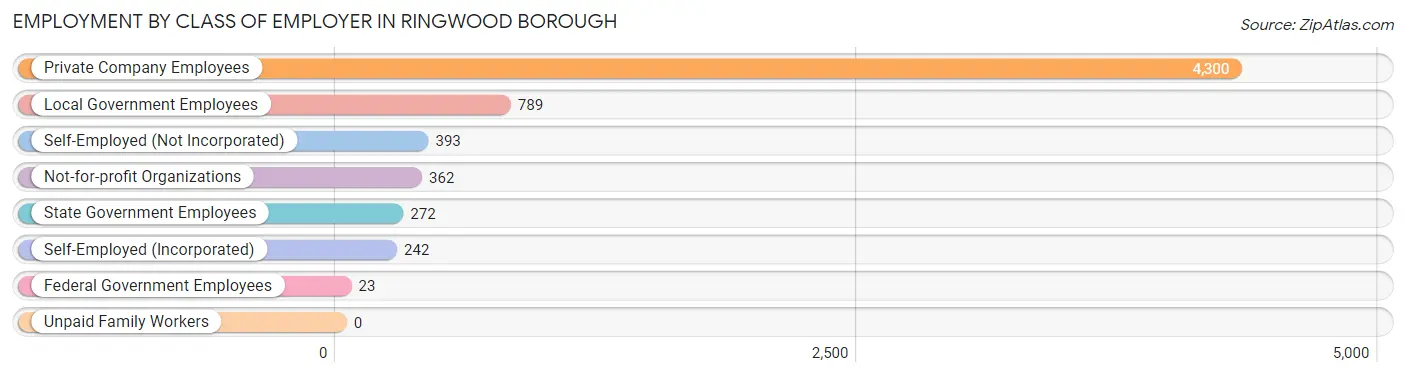
| Employer Class | # Employees | % Employees |
| Private Company Employees | 4,300 | 67.4% |
| Self-Employed (Incorporated) | 242 | 3.8% |
| Self-Employed (Not Incorporated) | 393 | 6.2% |
| Not-for-profit Organizations | 362 | 5.7% |
| Local Government Employees | 789 | 12.4% |
| State Government Employees | 272 | 4.3% |
| Federal Government Employees | 23 | 0.4% |
| Unpaid Family Workers | 0 | 0.0% |
| Total | 6,381 | 100.0% |
Employment Status by Age in Ringwood borough
According to the labor force statistics for Ringwood borough, out of the total population over 16 years of age (9,694), 70.7% or 6,854 individuals are in the labor force, with 4.9% or 336 of them unemployed. The age group with the highest labor force participation rate is 25 to 29 years, with 93.0% or 829 individuals in the labor force. Within the labor force, the 60 to 64 years age range has the highest percentage of unemployed individuals, with 13.9% or 78 of them being unemployed.
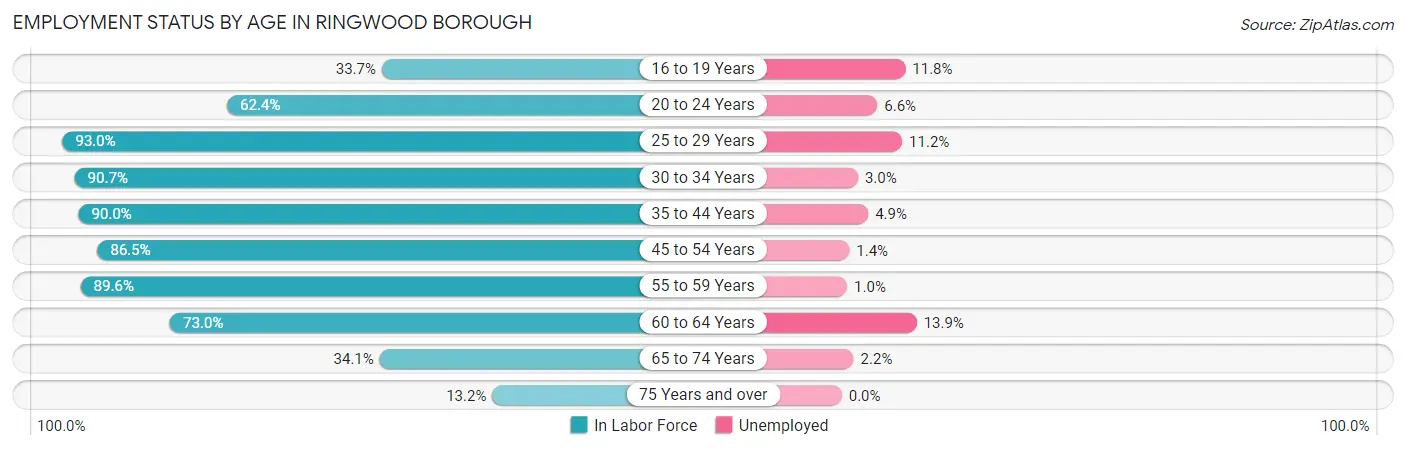
| Age Bracket | In Labor Force | Unemployed |
| 16 to 19 Years | 153 (33.7%) | 18 (11.8%) |
| 20 to 24 Years | 453 (62.4%) | 30 (6.6%) |
| 25 to 29 Years | 829 (93.0%) | 93 (11.2%) |
| 30 to 34 Years | 739 (90.7%) | 22 (3.0%) |
| 35 to 44 Years | 1,056 (90.0%) | 52 (4.9%) |
| 45 to 54 Years | 1,546 (86.5%) | 22 (1.4%) |
| 55 to 59 Years | 969 (89.6%) | 10 (1.0%) |
| 60 to 64 Years | 562 (73.0%) | 78 (13.9%) |
| 65 to 74 Years | 459 (34.1%) | 10 (2.2%) |
| 75 Years and over | 86 (13.2%) | 0 (0.0%) |
| Total | 6,854 (70.7%) | 336 (4.9%) |
Employment Status by Educational Attainment in Ringwood borough
According to labor force statistics for Ringwood borough, 87.5% of individuals (5,702) out of the total population between 25 and 64 years of age (6,517) are in the labor force, with 4.8% or 274 of them being unemployed. The group with the highest labor force participation rate are those with the educational attainment of bachelor's degree or higher, with 93.2% or 3,055 individuals in the labor force. Within the labor force, individuals with less than high school education have the highest percentage of unemployment, with 13.5% or 12 of them being unemployed.
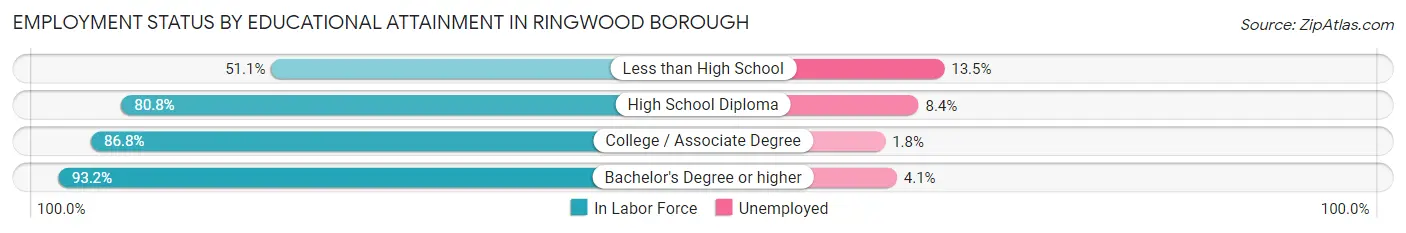
| Educational Attainment | In Labor Force | Unemployed |
| Less than High School | 89 (51.1%) | 23 (13.5%) |
| High School Diploma | 1,399 (80.8%) | 145 (8.4%) |
| College / Associate Degree | 1,157 (86.8%) | 24 (1.8%) |
| Bachelor's Degree or higher | 3,055 (93.2%) | 134 (4.1%) |
| Total | 5,702 (87.5%) | 313 (4.8%) |
Employment Occupations by Sex in Ringwood borough
Management, Business, Science and Arts Occupations
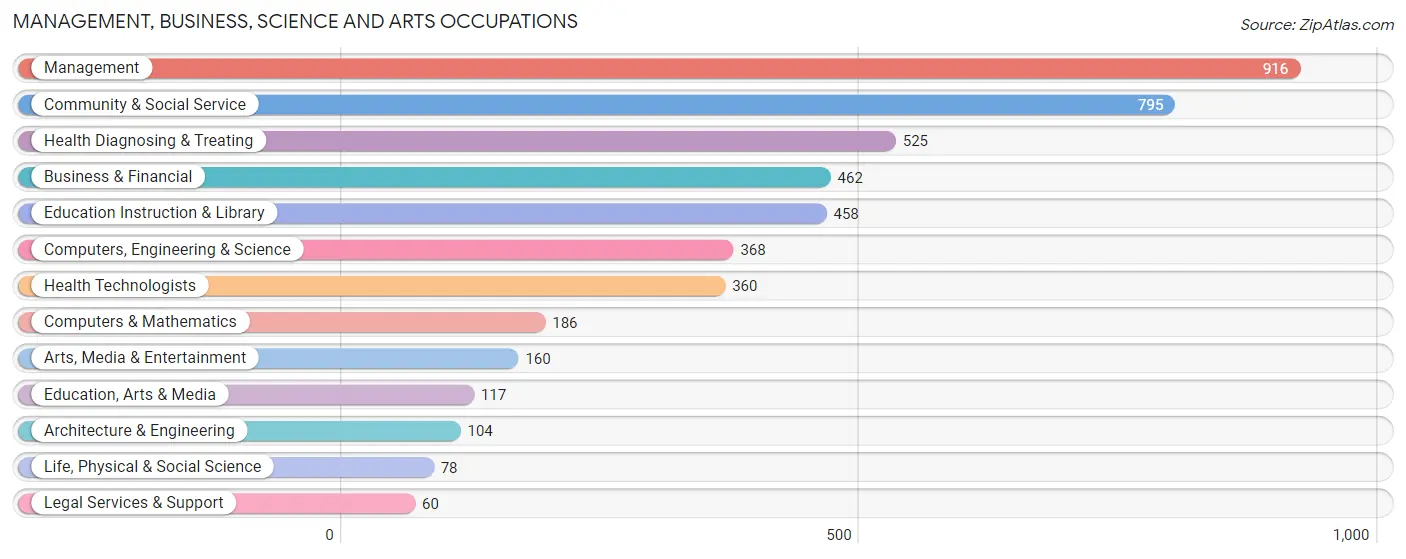
The most common Management, Business, Science and Arts occupations in Ringwood borough are Management (916 | 14.1%), Community & Social Service (795 | 12.2%), Health Diagnosing & Treating (525 | 8.1%), Business & Financial (462 | 7.1%), and Education Instruction & Library (458 | 7.0%).
Management, Business, Science and Arts Occupations by Sex
Within the Management, Business, Science and Arts occupations in Ringwood borough, the most male-oriented occupations are Architecture & Engineering (76.0%), Management (67.6%), and Computers, Engineering & Science (65.8%), while the most female-oriented occupations are Education Instruction & Library (80.6%), Health Diagnosing & Treating (79.2%), and Health Technologists (71.9%).
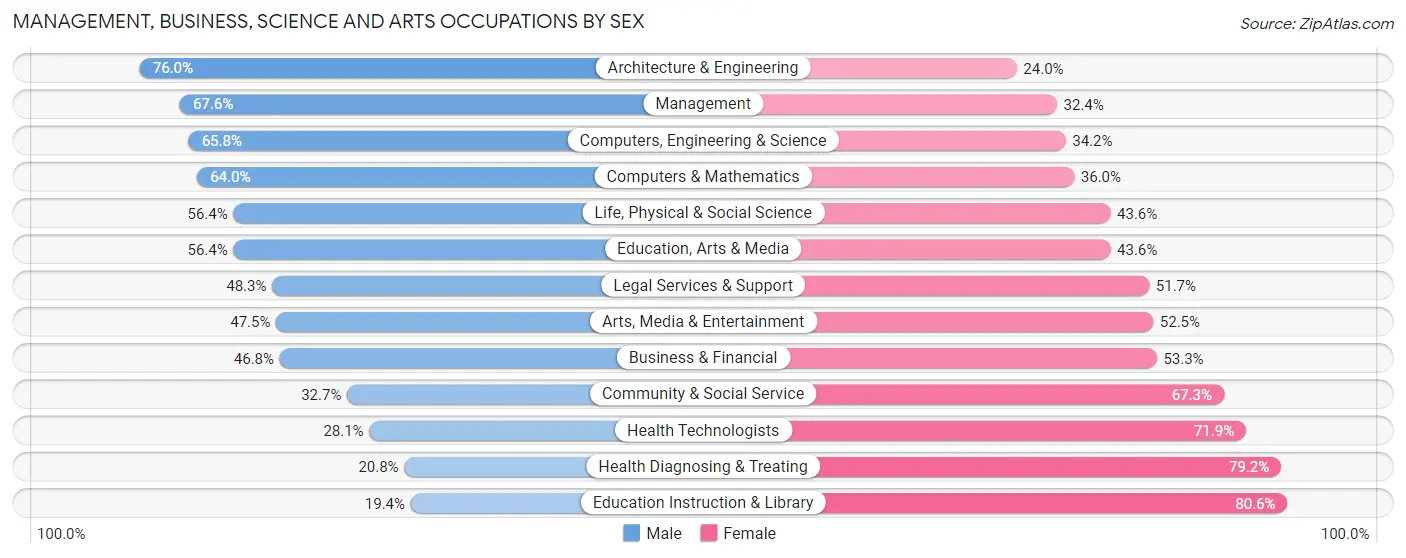
| Occupation | Male | Female |
| Management | 619 (67.6%) | 297 (32.4%) |
| Business & Financial | 216 (46.8%) | 246 (53.2%) |
| Computers, Engineering & Science | 242 (65.8%) | 126 (34.2%) |
| Computers & Mathematics | 119 (64.0%) | 67 (36.0%) |
| Architecture & Engineering | 79 (76.0%) | 25 (24.0%) |
| Life, Physical & Social Science | 44 (56.4%) | 34 (43.6%) |
| Community & Social Service | 260 (32.7%) | 535 (67.3%) |
| Education, Arts & Media | 66 (56.4%) | 51 (43.6%) |
| Legal Services & Support | 29 (48.3%) | 31 (51.7%) |
| Education Instruction & Library | 89 (19.4%) | 369 (80.6%) |
| Arts, Media & Entertainment | 76 (47.5%) | 84 (52.5%) |
| Health Diagnosing & Treating | 109 (20.8%) | 416 (79.2%) |
| Health Technologists | 101 (28.1%) | 259 (71.9%) |
| Total (Category) | 1,446 (47.2%) | 1,620 (52.8%) |
| Total (Overall) | 3,452 (52.9%) | 3,067 (47.0%) |
Services Occupations
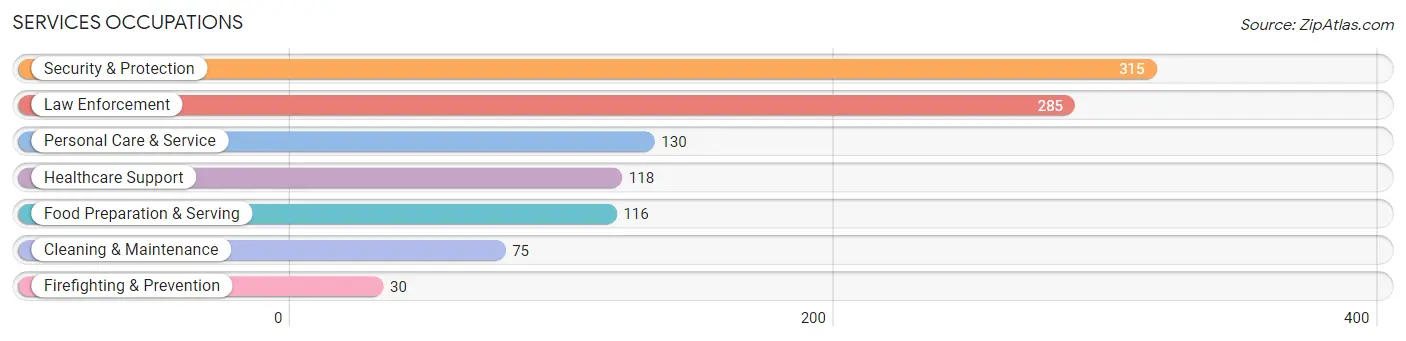
The most common Services occupations in Ringwood borough are Security & Protection (315 | 4.8%), Law Enforcement (285 | 4.4%), Personal Care & Service (130 | 2.0%), Healthcare Support (118 | 1.8%), and Food Preparation & Serving (116 | 1.8%).
Services Occupations by Sex
Within the Services occupations in Ringwood borough, the most male-oriented occupations are Law Enforcement (100.0%), Security & Protection (96.5%), and Cleaning & Maintenance (74.7%), while the most female-oriented occupations are Healthcare Support (98.3%), Personal Care & Service (90.8%), and Firefighting & Prevention (36.7%).
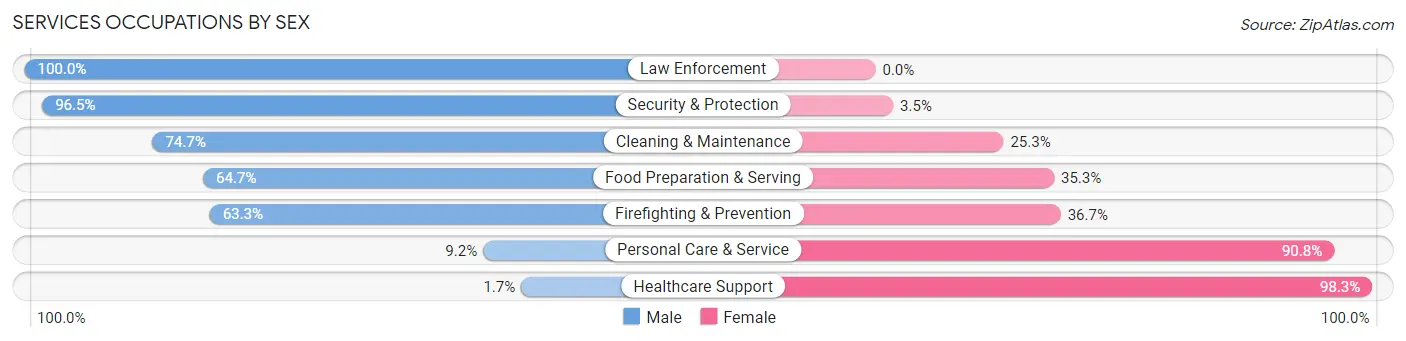
| Occupation | Male | Female |
| Healthcare Support | 2 (1.7%) | 116 (98.3%) |
| Security & Protection | 304 (96.5%) | 11 (3.5%) |
| Firefighting & Prevention | 19 (63.3%) | 11 (36.7%) |
| Law Enforcement | 285 (100.0%) | 0 (0.0%) |
| Food Preparation & Serving | 75 (64.7%) | 41 (35.3%) |
| Cleaning & Maintenance | 56 (74.7%) | 19 (25.3%) |
| Personal Care & Service | 12 (9.2%) | 118 (90.8%) |
| Total (Category) | 449 (59.6%) | 305 (40.5%) |
| Total (Overall) | 3,452 (52.9%) | 3,067 (47.0%) |
Sales and Office Occupations
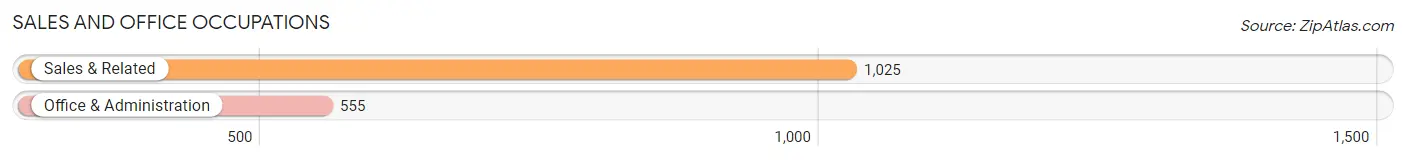
The most common Sales and Office occupations in Ringwood borough are Sales & Related (1,025 | 15.7%), and Office & Administration (555 | 8.5%).
Sales and Office Occupations by Sex
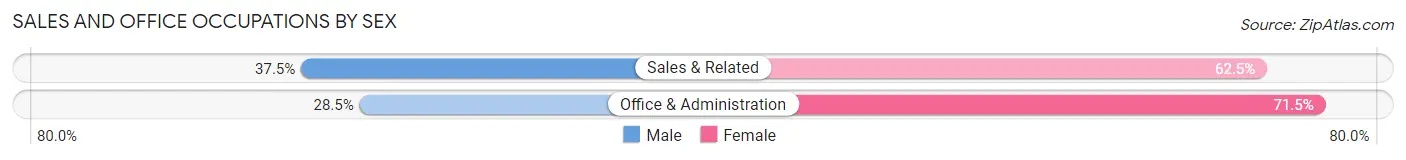
| Occupation | Male | Female |
| Sales & Related | 384 (37.5%) | 641 (62.5%) |
| Office & Administration | 158 (28.5%) | 397 (71.5%) |
| Total (Category) | 542 (34.3%) | 1,038 (65.7%) |
| Total (Overall) | 3,452 (52.9%) | 3,067 (47.0%) |
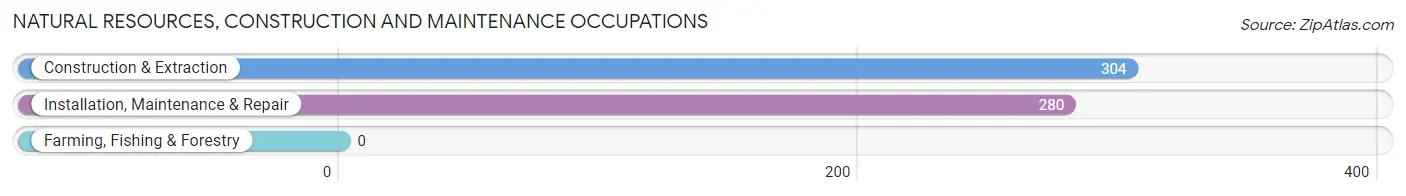
Natural Resources, Construction and Maintenance Occupations
The most common Natural Resources, Construction and Maintenance occupations in Ringwood borough are Construction & Extraction (304 | 4.7%), and Installation, Maintenance & Repair (280 | 4.3%).
Natural Resources, Construction and Maintenance Occupations by Sex
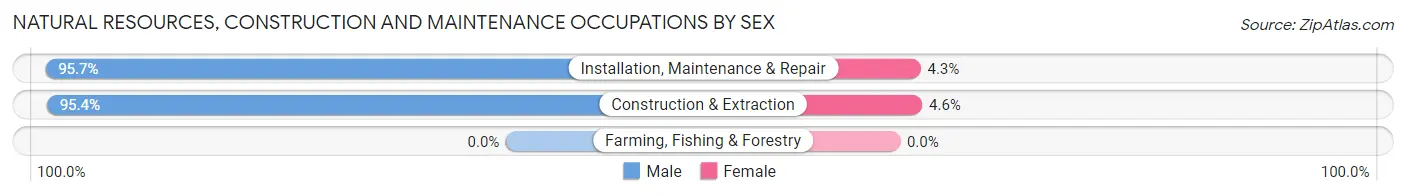
| Occupation | Male | Female |
| Farming, Fishing & Forestry | 0 (0.0%) | 0 (0.0%) |
| Construction & Extraction | 290 (95.4%) | 14 (4.6%) |
| Installation, Maintenance & Repair | 268 (95.7%) | 12 (4.3%) |
| Total (Category) | 558 (95.6%) | 26 (4.4%) |
| Total (Overall) | 3,452 (52.9%) | 3,067 (47.0%) |
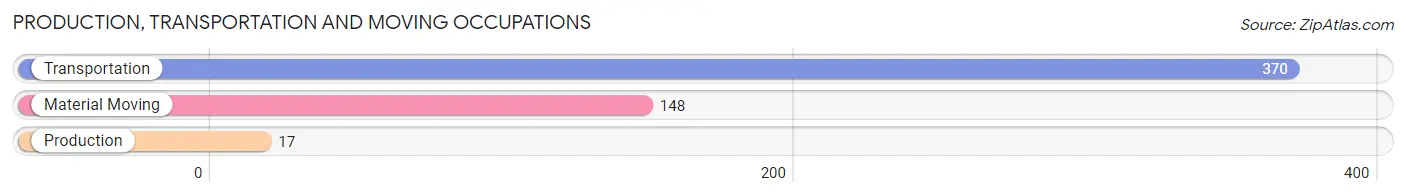
Production, Transportation and Moving Occupations
The most common Production, Transportation and Moving occupations in Ringwood borough are Transportation (370 | 5.7%), Material Moving (148 | 2.3%), and Production (17 | 0.3%).
Production, Transportation and Moving Occupations by Sex
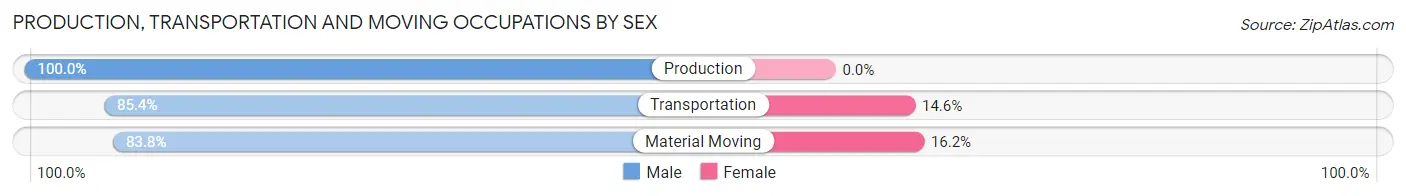
| Occupation | Male | Female |
| Production | 17 (100.0%) | 0 (0.0%) |
| Transportation | 316 (85.4%) | 54 (14.6%) |
| Material Moving | 124 (83.8%) | 24 (16.2%) |
| Total (Category) | 457 (85.4%) | 78 (14.6%) |
| Total (Overall) | 3,452 (52.9%) | 3,067 (47.0%) |
Employment Industries by Sex in Ringwood borough
Employment Industries in Ringwood borough
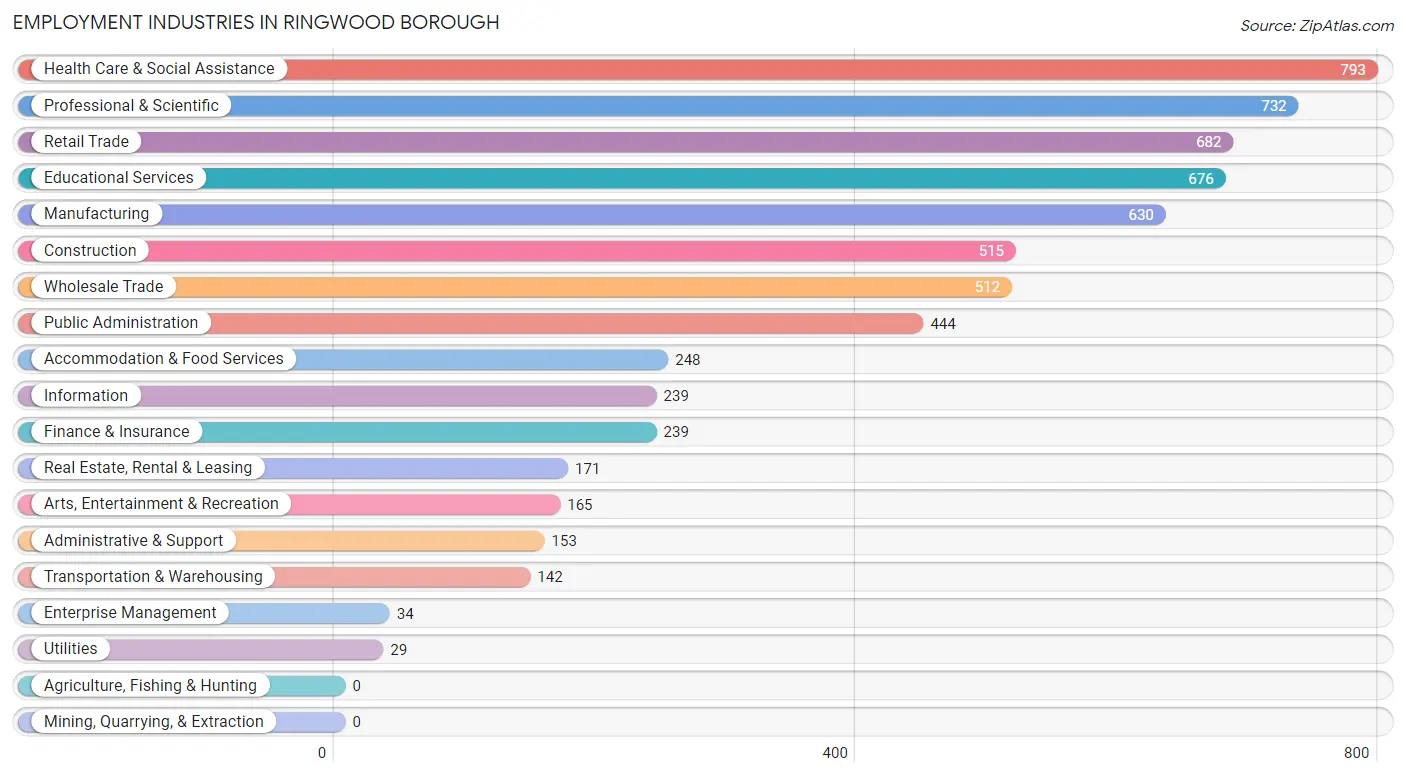
The major employment industries in Ringwood borough include Health Care & Social Assistance (793 | 12.2%), Professional & Scientific (732 | 11.2%), Retail Trade (682 | 10.5%), Educational Services (676 | 10.4%), and Manufacturing (630 | 9.7%).
Employment Industries by Sex in Ringwood borough
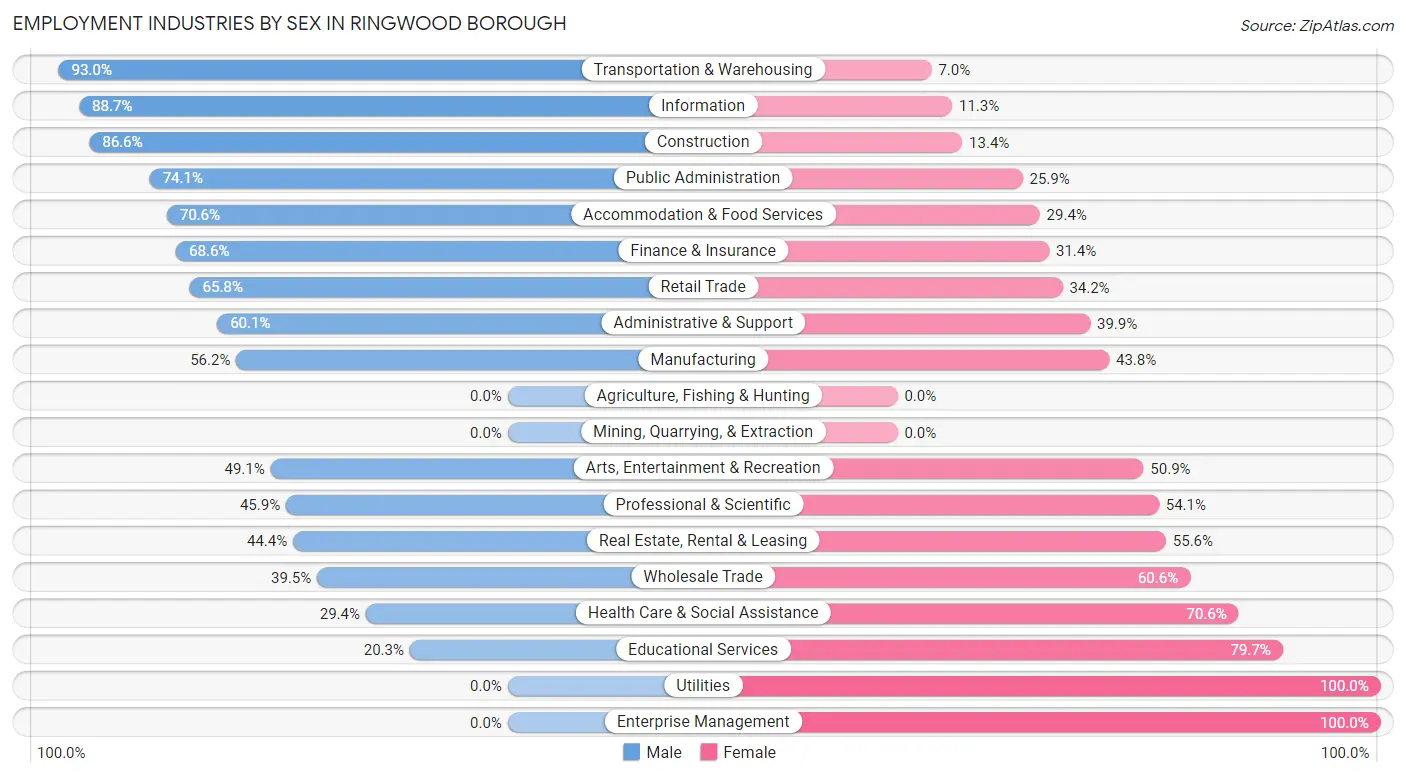
The Ringwood borough industries that see more men than women are Transportation & Warehousing (93.0%), Information (88.7%), and Construction (86.6%), whereas the industries that tend to have a higher number of women are Utilities (100.0%), Enterprise Management (100.0%), and Educational Services (79.7%).
| Industry | Male | Female |
| Agriculture, Fishing & Hunting | 0 (0.0%) | 0 (0.0%) |
| Mining, Quarrying, & Extraction | 0 (0.0%) | 0 (0.0%) |
| Construction | 446 (86.6%) | 69 (13.4%) |
| Manufacturing | 354 (56.2%) | 276 (43.8%) |
| Wholesale Trade | 202 (39.5%) | 310 (60.6%) |
| Retail Trade | 449 (65.8%) | 233 (34.2%) |
| Transportation & Warehousing | 132 (93.0%) | 10 (7.0%) |
| Utilities | 0 (0.0%) | 29 (100.0%) |
| Information | 212 (88.7%) | 27 (11.3%) |
| Finance & Insurance | 164 (68.6%) | 75 (31.4%) |
| Real Estate, Rental & Leasing | 76 (44.4%) | 95 (55.6%) |
| Professional & Scientific | 336 (45.9%) | 396 (54.1%) |
| Enterprise Management | 0 (0.0%) | 34 (100.0%) |
| Administrative & Support | 92 (60.1%) | 61 (39.9%) |
| Educational Services | 137 (20.3%) | 539 (79.7%) |
| Health Care & Social Assistance | 233 (29.4%) | 560 (70.6%) |
| Arts, Entertainment & Recreation | 81 (49.1%) | 84 (50.9%) |
| Accommodation & Food Services | 175 (70.6%) | 73 (29.4%) |
| Public Administration | 329 (74.1%) | 115 (25.9%) |
| Total | 3,452 (52.9%) | 3,067 (47.0%) |
Education in Ringwood borough
School Enrollment in Ringwood borough
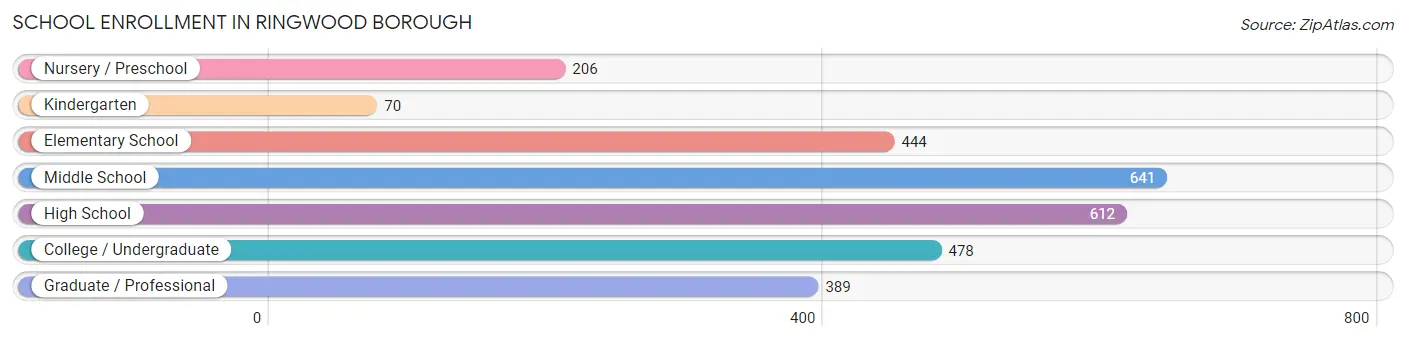
The most common levels of schooling among the 2,840 students in Ringwood borough are middle school (641 | 22.6%), high school (612 | 21.5%), and college / undergraduate (478 | 16.8%).
| School Level | # Students | % Students |
| Nursery / Preschool | 206 | 7.2% |
| Kindergarten | 70 | 2.5% |
| Elementary School | 444 | 15.6% |
| Middle School | 641 | 22.6% |
| High School | 612 | 21.5% |
| College / Undergraduate | 478 | 16.8% |
| Graduate / Professional | 389 | 13.7% |
| Total | 2,840 | 100.0% |
School Enrollment by Age by Funding Source in Ringwood borough
Out of a total of 2,840 students who are enrolled in schools in Ringwood borough, 761 (26.8%) attend a private institution, while the remaining 2,079 (73.2%) are enrolled in public schools. The age group of 25 to 34 year olds has the highest likelihood of being enrolled in private schools, with 312 (86.9% in the age bracket) enrolled. Conversely, the age group of 18 to 19 year olds has the lowest likelihood of being enrolled in a private school, with 146 (100.0% in the age bracket) attending a public institution.
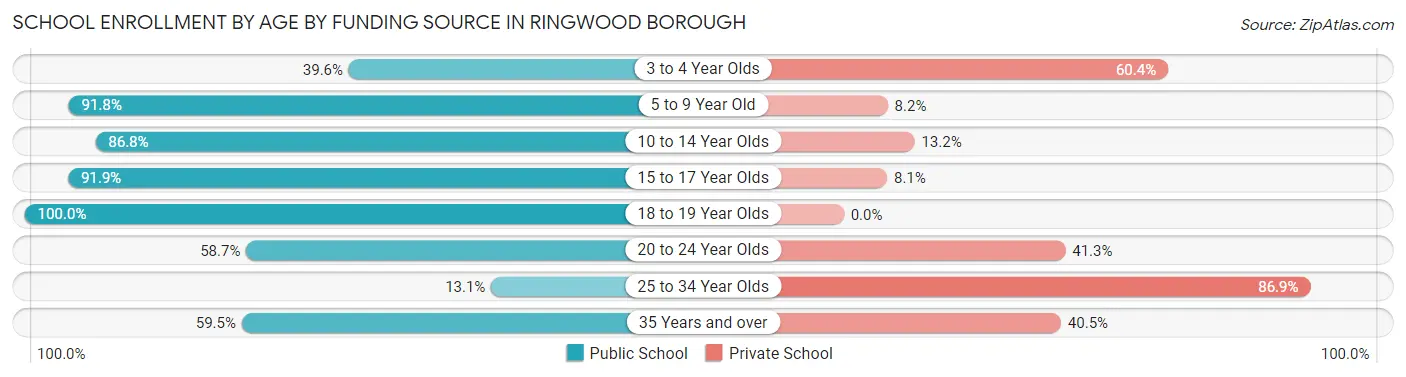
| Age Bracket | Public School | Private School |
| 3 to 4 Year Olds | 59 (39.6%) | 90 (60.4%) |
| 5 to 9 Year Old | 437 (91.8%) | 39 (8.2%) |
| 10 to 14 Year Olds | 783 (86.8%) | 119 (13.2%) |
| 15 to 17 Year Olds | 364 (91.9%) | 32 (8.1%) |
| 18 to 19 Year Olds | 146 (100.0%) | 0 (0.0%) |
| 20 to 24 Year Olds | 165 (58.7%) | 116 (41.3%) |
| 25 to 34 Year Olds | 47 (13.1%) | 312 (86.9%) |
| 35 Years and over | 78 (59.5%) | 53 (40.5%) |
| Total | 2,079 (73.2%) | 761 (26.8%) |
Educational Attainment by Field of Study in Ringwood borough
Business (1,048 | 23.6%), education (548 | 12.4%), social sciences (367 | 8.3%), literature & languages (338 | 7.6%), and engineering (324 | 7.3%) are the most common fields of study among 4,432 individuals in Ringwood borough who have obtained a bachelor's degree or higher.
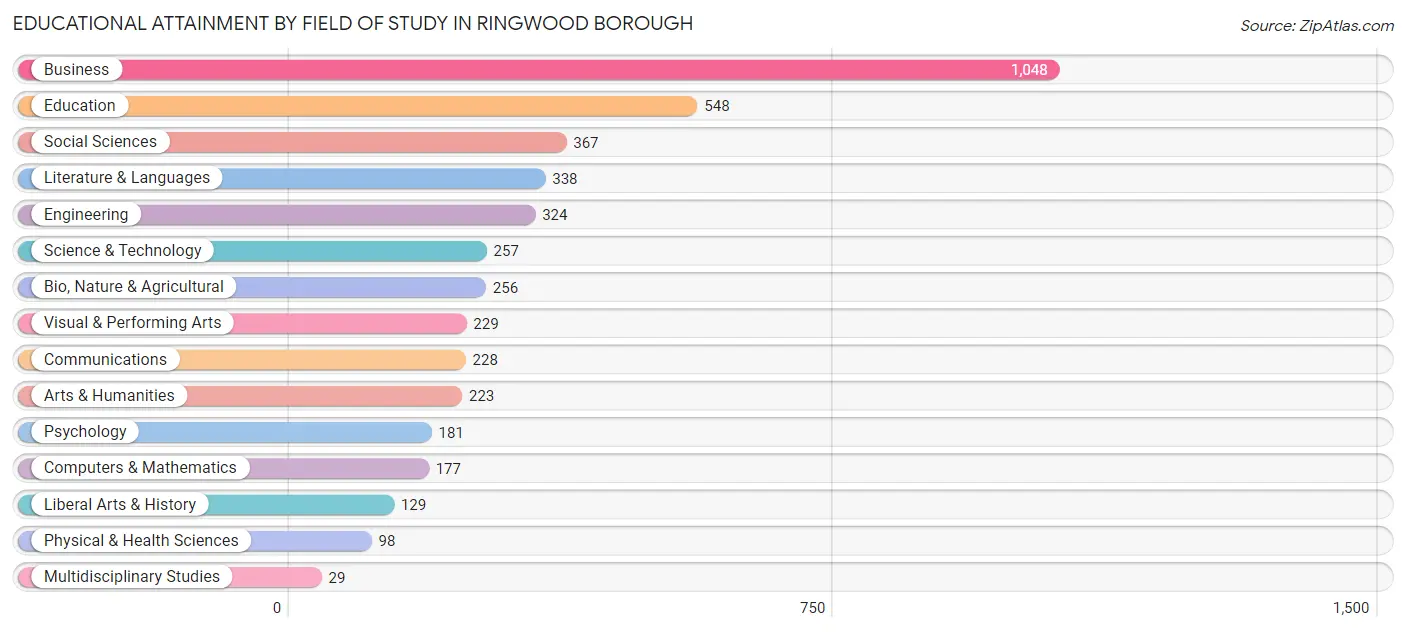
| Field of Study | # Graduates | % Graduates |
| Computers & Mathematics | 177 | 4.0% |
| Bio, Nature & Agricultural | 256 | 5.8% |
| Physical & Health Sciences | 98 | 2.2% |
| Psychology | 181 | 4.1% |
| Social Sciences | 367 | 8.3% |
| Engineering | 324 | 7.3% |
| Multidisciplinary Studies | 29 | 0.6% |
| Science & Technology | 257 | 5.8% |
| Business | 1,048 | 23.6% |
| Education | 548 | 12.4% |
| Literature & Languages | 338 | 7.6% |
| Liberal Arts & History | 129 | 2.9% |
| Visual & Performing Arts | 229 | 5.2% |
| Communications | 228 | 5.1% |
| Arts & Humanities | 223 | 5.0% |
| Total | 4,432 | 100.0% |
Transportation & Commute in Ringwood borough
Vehicle Availability by Sex in Ringwood borough
The most prevalent vehicle ownership categories in Ringwood borough are males with 2 vehicles (1,720, accounting for 51.0%) and females with 2 vehicles (1,532, making up 57.4%).
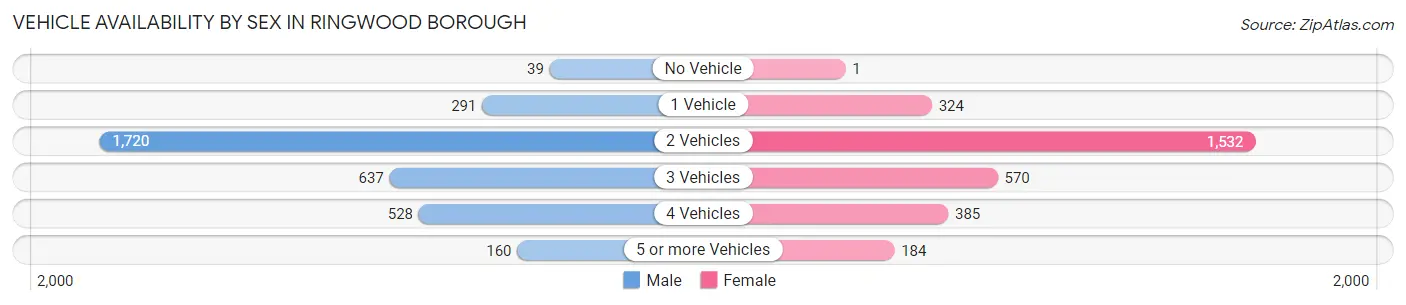
| Vehicles Available | Male | Female |
| No Vehicle | 39 (1.2%) | 1 (0.0%) |
| 1 Vehicle | 291 (8.6%) | 324 (10.8%) |
| 2 Vehicles | 1,720 (51.0%) | 1,532 (51.1%) |
| 3 Vehicles | 637 (18.9%) | 570 (19.0%) |
| 4 Vehicles | 528 (15.6%) | 385 (12.9%) |
| 5 or more Vehicles | 160 (4.7%) | 184 (6.1%) |
| Total | 3,375 (100.0%) | 2,996 (100.0%) |
Commute Time in Ringwood borough
The most frequently occuring commute durations in Ringwood borough are 45 to 59 minutes (765 commuters, 13.8%), 20 to 24 minutes (716 commuters, 12.9%), and 15 to 19 minutes (693 commuters, 12.5%).
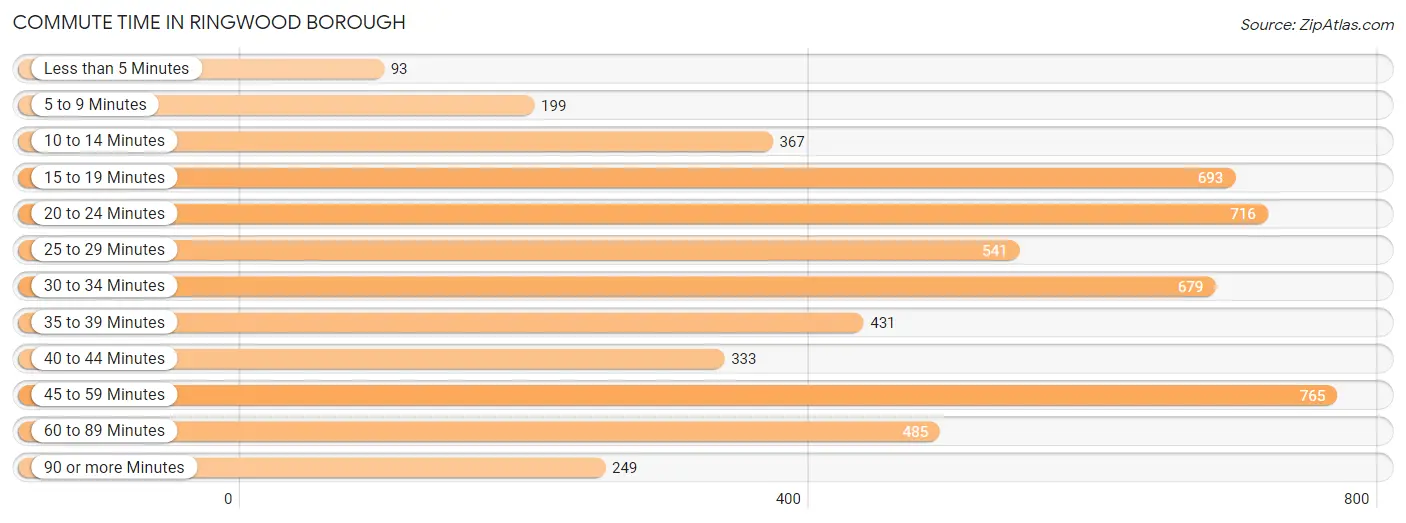
| Commute Time | # Commuters | % Commuters |
| Less than 5 Minutes | 93 | 1.7% |
| 5 to 9 Minutes | 199 | 3.6% |
| 10 to 14 Minutes | 367 | 6.6% |
| 15 to 19 Minutes | 693 | 12.5% |
| 20 to 24 Minutes | 716 | 12.9% |
| 25 to 29 Minutes | 541 | 9.8% |
| 30 to 34 Minutes | 679 | 12.2% |
| 35 to 39 Minutes | 431 | 7.8% |
| 40 to 44 Minutes | 333 | 6.0% |
| 45 to 59 Minutes | 765 | 13.8% |
| 60 to 89 Minutes | 485 | 8.7% |
| 90 or more Minutes | 249 | 4.5% |
Commute Time by Sex in Ringwood borough
The most common commute times in Ringwood borough are 15 to 19 minutes (522 commuters, 16.9%) for males and 45 to 59 minutes (333 commuters, 13.5%) for females.
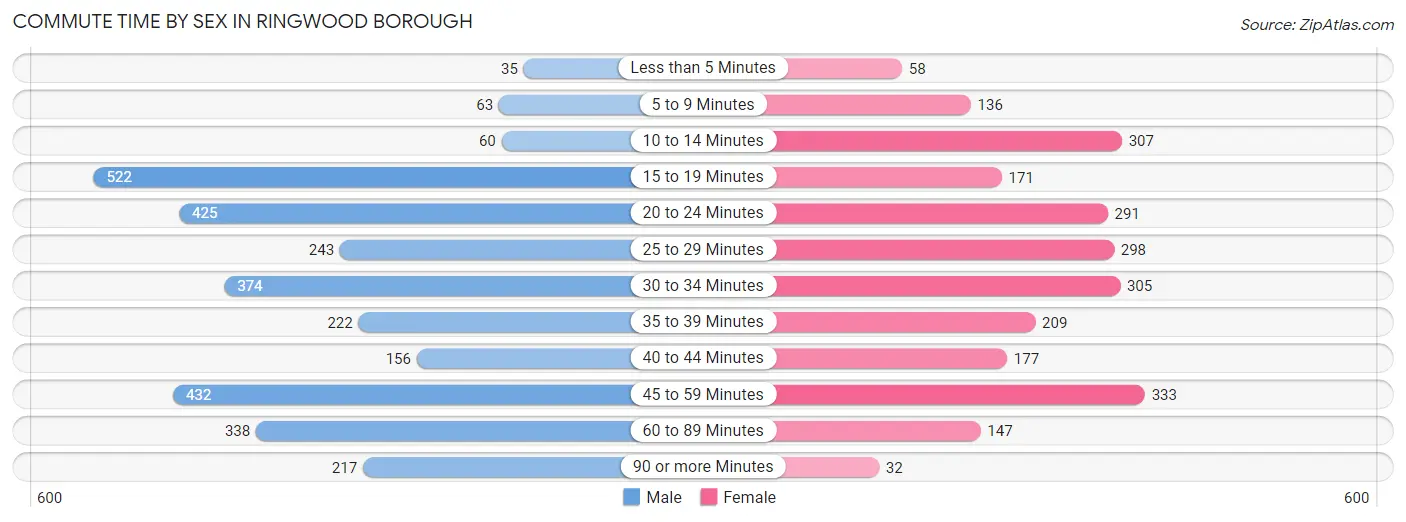
| Commute Time | Male | Female |
| Less than 5 Minutes | 35 (1.1%) | 58 (2.4%) |
| 5 to 9 Minutes | 63 (2.0%) | 136 (5.5%) |
| 10 to 14 Minutes | 60 (1.9%) | 307 (12.5%) |
| 15 to 19 Minutes | 522 (16.9%) | 171 (6.9%) |
| 20 to 24 Minutes | 425 (13.8%) | 291 (11.8%) |
| 25 to 29 Minutes | 243 (7.9%) | 298 (12.1%) |
| 30 to 34 Minutes | 374 (12.1%) | 305 (12.4%) |
| 35 to 39 Minutes | 222 (7.2%) | 209 (8.5%) |
| 40 to 44 Minutes | 156 (5.1%) | 177 (7.2%) |
| 45 to 59 Minutes | 432 (14.0%) | 333 (13.5%) |
| 60 to 89 Minutes | 338 (11.0%) | 147 (6.0%) |
| 90 or more Minutes | 217 (7.0%) | 32 (1.3%) |
Time of Departure to Work by Sex in Ringwood borough
The most frequent times of departure to work in Ringwood borough are 6:00 AM to 6:29 AM (543, 17.6%) for males and 7:30 AM to 7:59 AM (428, 17.4%) for females.
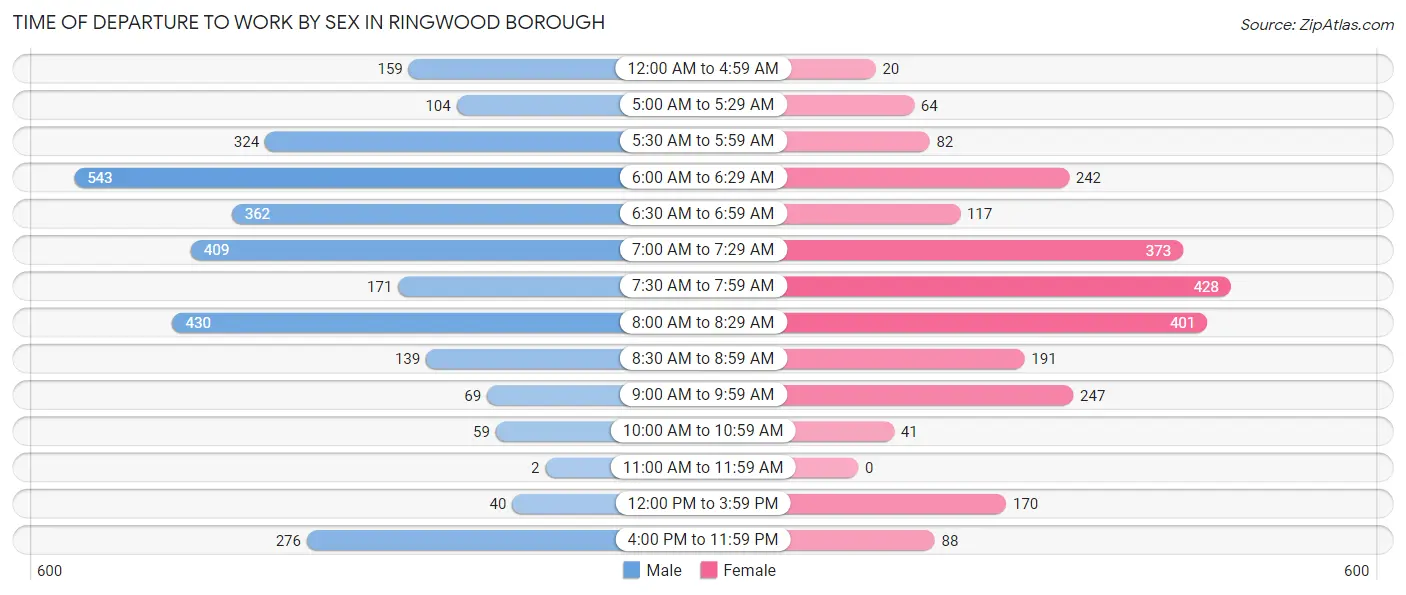
| Time of Departure | Male | Female |
| 12:00 AM to 4:59 AM | 159 (5.1%) | 20 (0.8%) |
| 5:00 AM to 5:29 AM | 104 (3.4%) | 64 (2.6%) |
| 5:30 AM to 5:59 AM | 324 (10.5%) | 82 (3.3%) |
| 6:00 AM to 6:29 AM | 543 (17.6%) | 242 (9.8%) |
| 6:30 AM to 6:59 AM | 362 (11.7%) | 117 (4.8%) |
| 7:00 AM to 7:29 AM | 409 (13.3%) | 373 (15.1%) |
| 7:30 AM to 7:59 AM | 171 (5.5%) | 428 (17.4%) |
| 8:00 AM to 8:29 AM | 430 (13.9%) | 401 (16.3%) |
| 8:30 AM to 8:59 AM | 139 (4.5%) | 191 (7.7%) |
| 9:00 AM to 9:59 AM | 69 (2.2%) | 247 (10.0%) |
| 10:00 AM to 10:59 AM | 59 (1.9%) | 41 (1.7%) |
| 11:00 AM to 11:59 AM | 2 (0.1%) | 0 (0.0%) |
| 12:00 PM to 3:59 PM | 40 (1.3%) | 170 (6.9%) |
| 4:00 PM to 11:59 PM | 276 (8.9%) | 88 (3.6%) |
| Total | 3,087 (100.0%) | 2,464 (100.0%) |
Housing Occupancy in Ringwood borough
Occupancy by Ownership in Ringwood borough
Of the total 4,256 dwellings in Ringwood borough, owner-occupied units account for 4,038 (94.9%), while renter-occupied units make up 218 (5.1%).
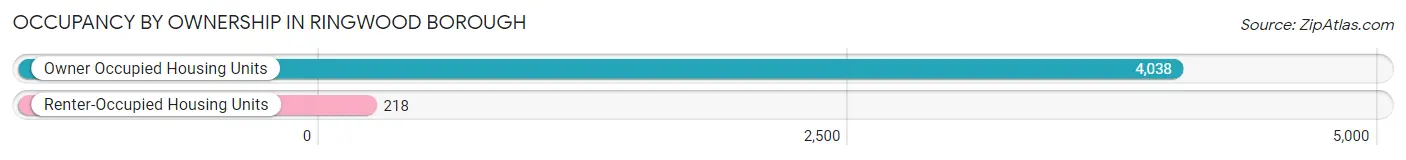
| Occupancy | # Housing Units | % Housing Units |
| Owner Occupied Housing Units | 4,038 | 94.9% |
| Renter-Occupied Housing Units | 218 | 5.1% |
| Total Occupied Housing Units | 4,256 | 100.0% |
Occupancy by Household Size in Ringwood borough
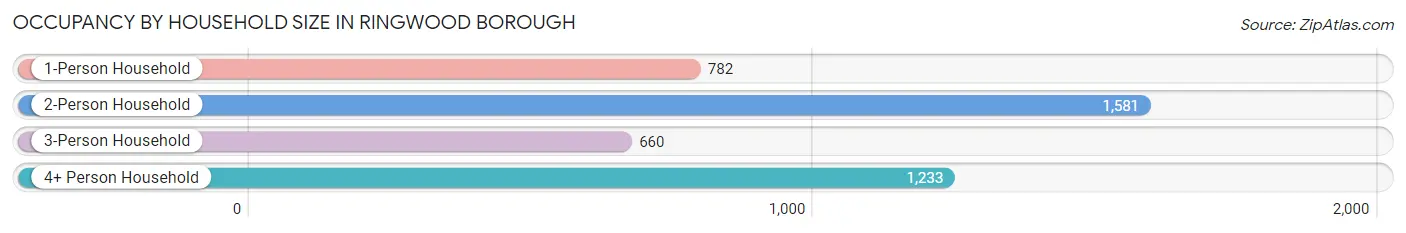
| Household Size | # Housing Units | % Housing Units |
| 1-Person Household | 782 | 18.4% |
| 2-Person Household | 1,581 | 37.1% |
| 3-Person Household | 660 | 15.5% |
| 4+ Person Household | 1,233 | 29.0% |
| Total Housing Units | 4,256 | 100.0% |
Occupancy by Ownership by Household Size in Ringwood borough
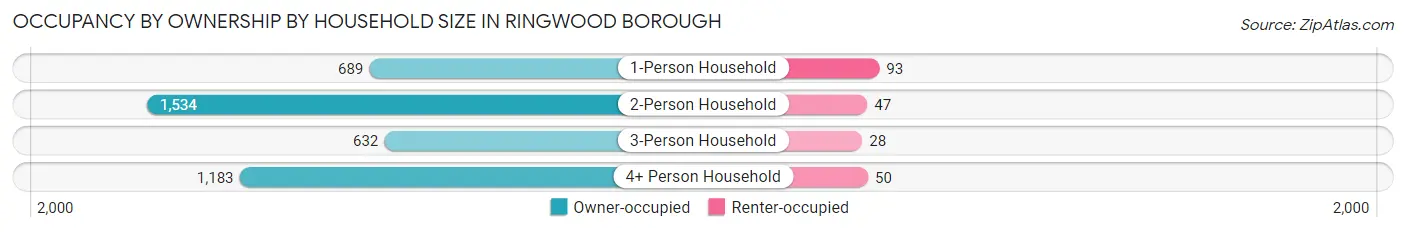
| Household Size | Owner-occupied | Renter-occupied |
| 1-Person Household | 689 (88.1%) | 93 (11.9%) |
| 2-Person Household | 1,534 (97.0%) | 47 (3.0%) |
| 3-Person Household | 632 (95.8%) | 28 (4.2%) |
| 4+ Person Household | 1,183 (95.9%) | 50 (4.1%) |
| Total Housing Units | 4,038 (94.9%) | 218 (5.1%) |
Occupancy by Educational Attainment in Ringwood borough
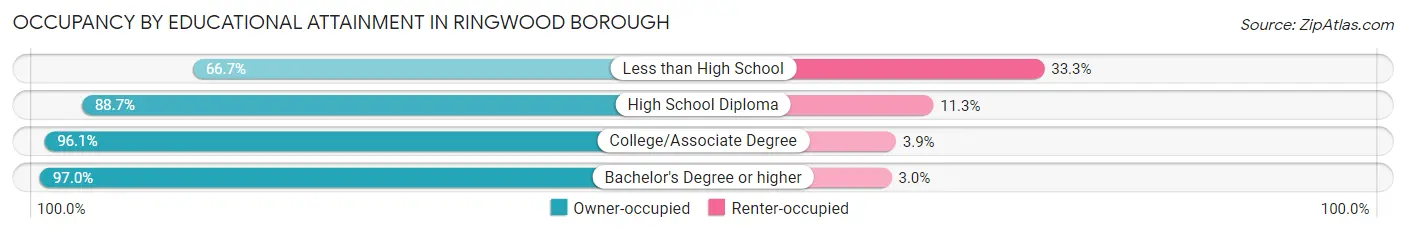
| Household Size | Owner-occupied | Renter-occupied |
| Less than High School | 4 (66.7%) | 2 (33.3%) |
| High School Diploma | 837 (88.7%) | 107 (11.3%) |
| College/Associate Degree | 936 (96.1%) | 38 (3.9%) |
| Bachelor's Degree or higher | 2,261 (97.0%) | 71 (3.0%) |
Occupancy by Age of Householder in Ringwood borough
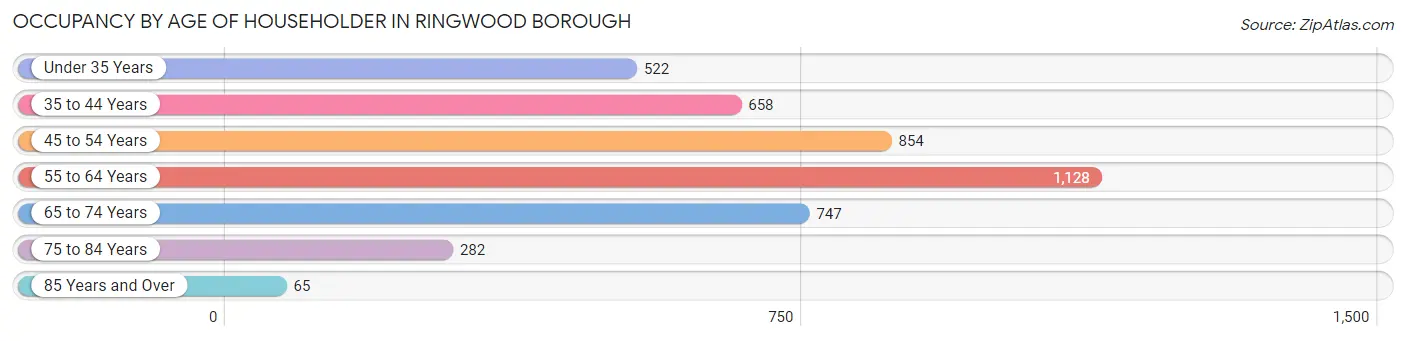
| Age Bracket | # Households | % Households |
| Under 35 Years | 522 | 12.3% |
| 35 to 44 Years | 658 | 15.5% |
| 45 to 54 Years | 854 | 20.1% |
| 55 to 64 Years | 1,128 | 26.5% |
| 65 to 74 Years | 747 | 17.5% |
| 75 to 84 Years | 282 | 6.6% |
| 85 Years and Over | 65 | 1.5% |
| Total | 4,256 | 100.0% |
Housing Finances in Ringwood borough
Median Income by Occupancy in Ringwood borough
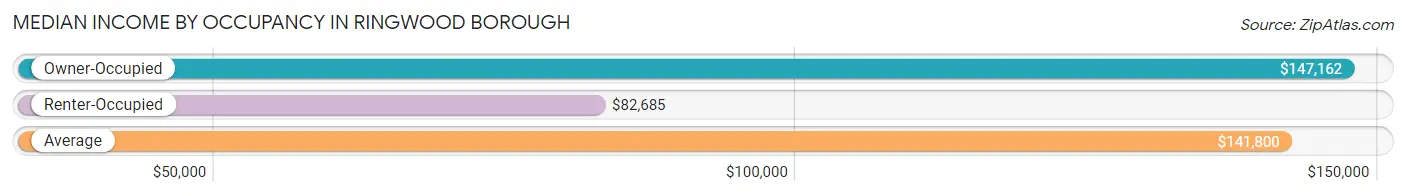
| Occupancy Type | # Households | Median Income |
| Owner-Occupied | 4,038 (94.9%) | $147,162 |
| Renter-Occupied | 218 (5.1%) | $82,685 |
| Average | 4,256 (100.0%) | $141,800 |
Occupancy by Householder Income Bracket in Ringwood borough
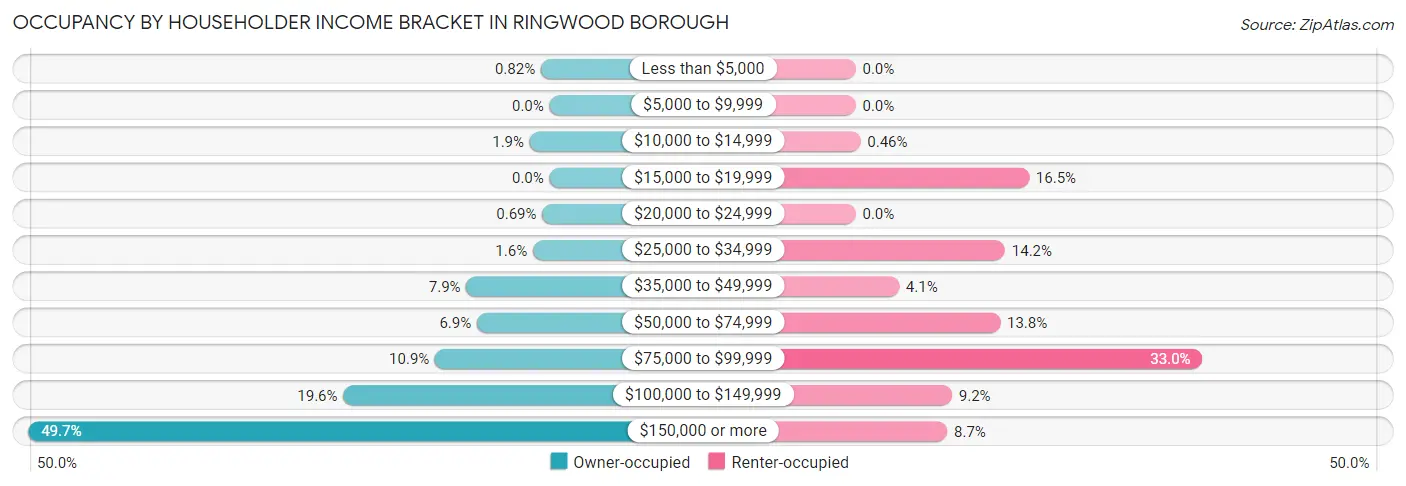
| Income Bracket | Owner-occupied | Renter-occupied |
| Less than $5,000 | 33 (0.8%) | 0 (0.0%) |
| $5,000 to $9,999 | 0 (0.0%) | 0 (0.0%) |
| $10,000 to $14,999 | 76 (1.9%) | 1 (0.5%) |
| $15,000 to $19,999 | 0 (0.0%) | 36 (16.5%) |
| $20,000 to $24,999 | 28 (0.7%) | 0 (0.0%) |
| $25,000 to $34,999 | 64 (1.6%) | 31 (14.2%) |
| $35,000 to $49,999 | 320 (7.9%) | 9 (4.1%) |
| $50,000 to $74,999 | 279 (6.9%) | 30 (13.8%) |
| $75,000 to $99,999 | 440 (10.9%) | 72 (33.0%) |
| $100,000 to $149,999 | 793 (19.6%) | 20 (9.2%) |
| $150,000 or more | 2,005 (49.6%) | 19 (8.7%) |
| Total | 4,038 (100.0%) | 218 (100.0%) |
Monthly Housing Cost Tiers in Ringwood borough
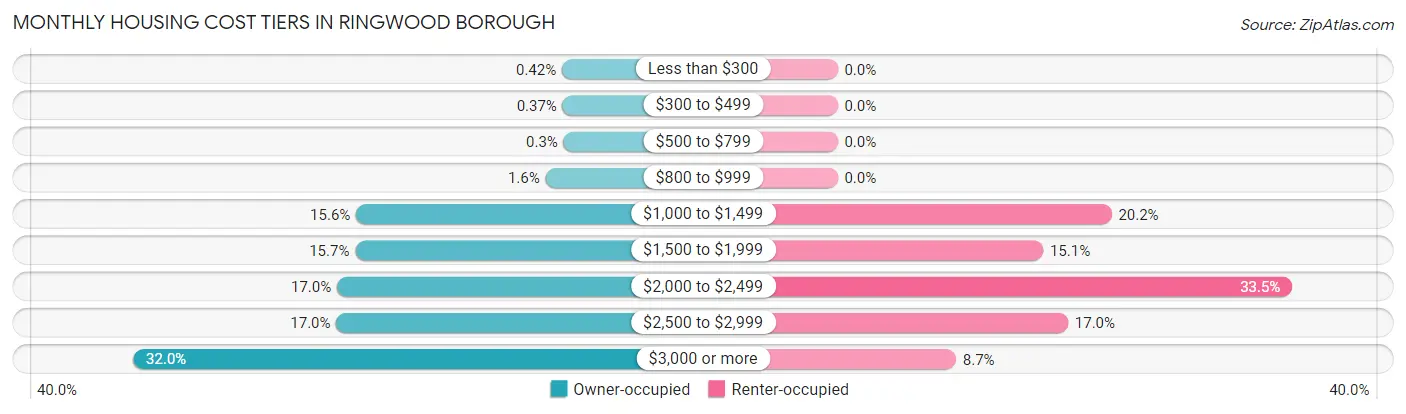
| Monthly Cost | Owner-occupied | Renter-occupied |
| Less than $300 | 17 (0.4%) | 0 (0.0%) |
| $300 to $499 | 15 (0.4%) | 0 (0.0%) |
| $500 to $799 | 12 (0.3%) | 0 (0.0%) |
| $800 to $999 | 66 (1.6%) | 0 (0.0%) |
| $1,000 to $1,499 | 629 (15.6%) | 44 (20.2%) |
| $1,500 to $1,999 | 632 (15.7%) | 33 (15.1%) |
| $2,000 to $2,499 | 686 (17.0%) | 73 (33.5%) |
| $2,500 to $2,999 | 688 (17.0%) | 37 (17.0%) |
| $3,000 or more | 1,293 (32.0%) | 19 (8.7%) |
| Total | 4,038 (100.0%) | 218 (100.0%) |
Physical Housing Characteristics in Ringwood borough
Housing Structures in Ringwood borough
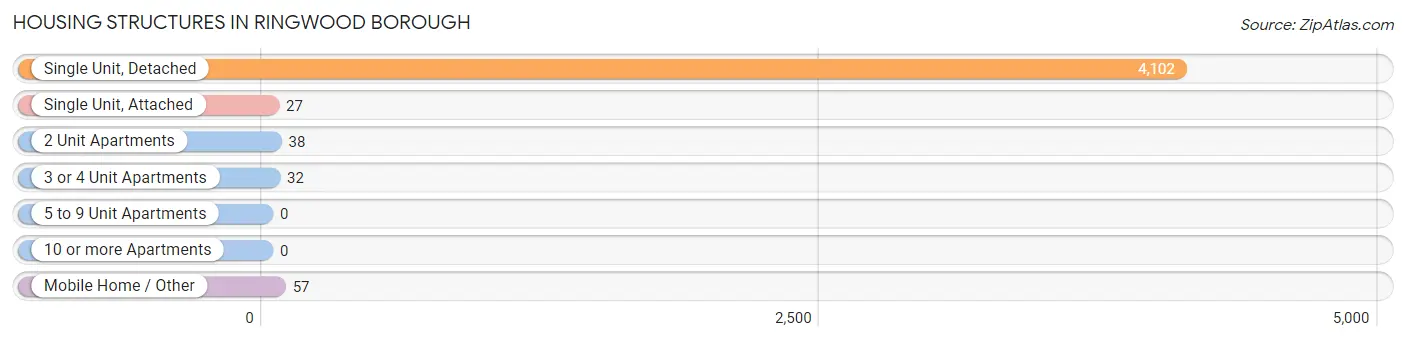
| Structure Type | # Housing Units | % Housing Units |
| Single Unit, Detached | 4,102 | 96.4% |
| Single Unit, Attached | 27 | 0.6% |
| 2 Unit Apartments | 38 | 0.9% |
| 3 or 4 Unit Apartments | 32 | 0.7% |
| 5 to 9 Unit Apartments | 0 | 0.0% |
| 10 or more Apartments | 0 | 0.0% |
| Mobile Home / Other | 57 | 1.3% |
| Total | 4,256 | 100.0% |
Housing Structures by Occupancy in Ringwood borough
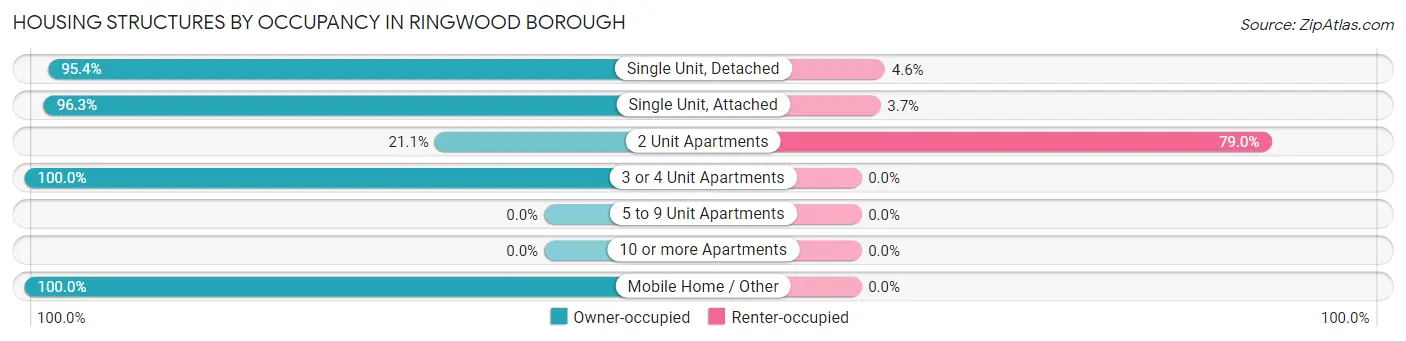
| Structure Type | Owner-occupied | Renter-occupied |
| Single Unit, Detached | 3,915 (95.4%) | 187 (4.6%) |
| Single Unit, Attached | 26 (96.3%) | 1 (3.7%) |
| 2 Unit Apartments | 8 (21.0%) | 30 (78.9%) |
| 3 or 4 Unit Apartments | 32 (100.0%) | 0 (0.0%) |
| 5 to 9 Unit Apartments | 0 (0.0%) | 0 (0.0%) |
| 10 or more Apartments | 0 (0.0%) | 0 (0.0%) |
| Mobile Home / Other | 57 (100.0%) | 0 (0.0%) |
| Total | 4,038 (94.9%) | 218 (5.1%) |
Housing Structures by Number of Rooms in Ringwood borough
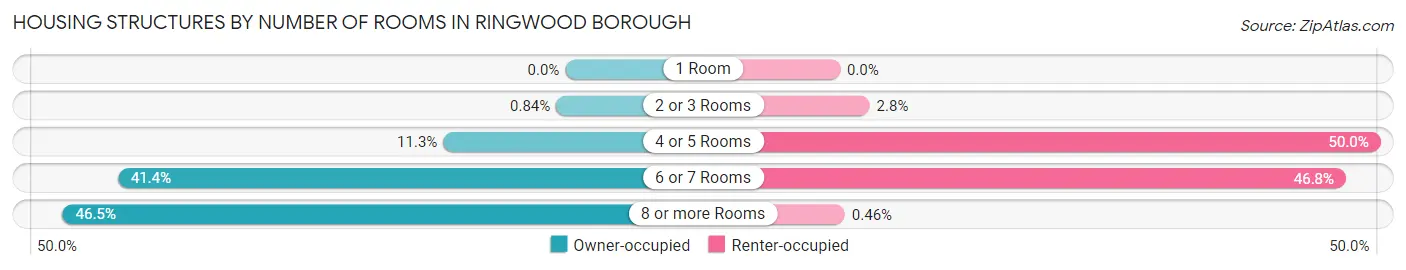
| Number of Rooms | Owner-occupied | Renter-occupied |
| 1 Room | 0 (0.0%) | 0 (0.0%) |
| 2 or 3 Rooms | 34 (0.8%) | 6 (2.8%) |
| 4 or 5 Rooms | 456 (11.3%) | 109 (50.0%) |
| 6 or 7 Rooms | 1,671 (41.4%) | 102 (46.8%) |
| 8 or more Rooms | 1,877 (46.5%) | 1 (0.5%) |
| Total | 4,038 (100.0%) | 218 (100.0%) |
Housing Structure by Heating Type in Ringwood borough
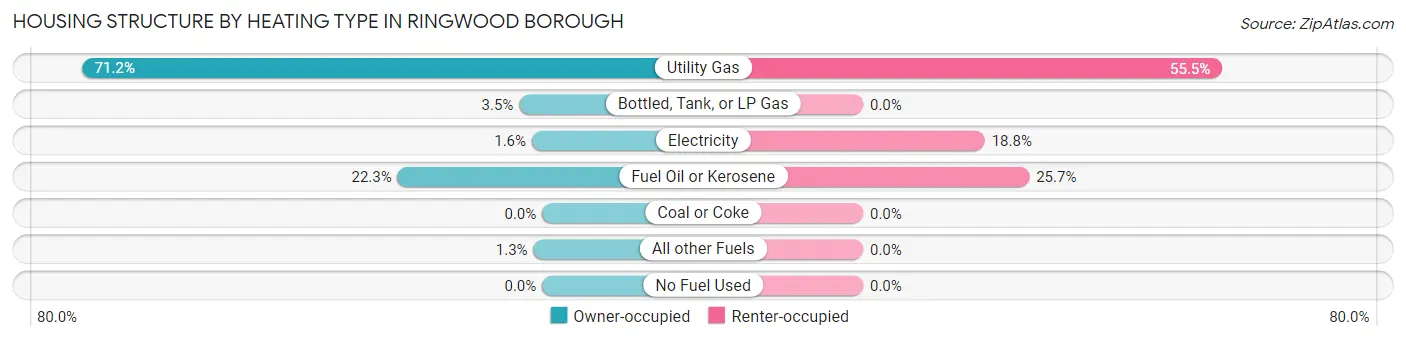
| Heating Type | Owner-occupied | Renter-occupied |
| Utility Gas | 2,875 (71.2%) | 121 (55.5%) |
| Bottled, Tank, or LP Gas | 143 (3.5%) | 0 (0.0%) |
| Electricity | 64 (1.6%) | 41 (18.8%) |
| Fuel Oil or Kerosene | 902 (22.3%) | 56 (25.7%) |
| Coal or Coke | 0 (0.0%) | 0 (0.0%) |
| All other Fuels | 54 (1.3%) | 0 (0.0%) |
| No Fuel Used | 0 (0.0%) | 0 (0.0%) |
| Total | 4,038 (100.0%) | 218 (100.0%) |
Household Vehicle Usage in Ringwood borough
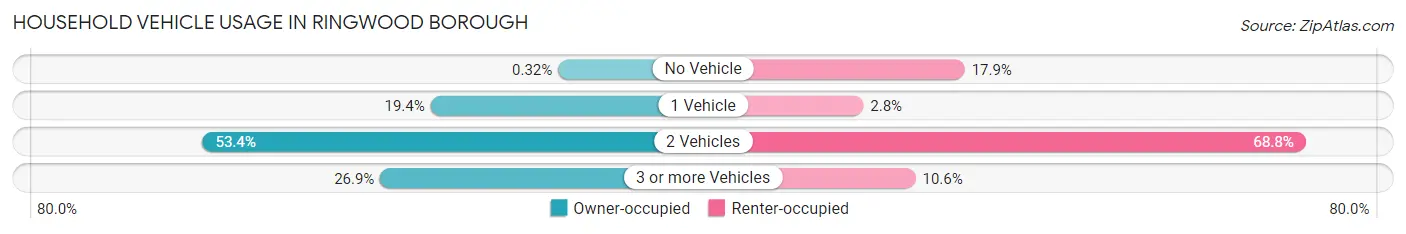
| Vehicles per Household | Owner-occupied | Renter-occupied |
| No Vehicle | 13 (0.3%) | 39 (17.9%) |
| 1 Vehicle | 782 (19.4%) | 6 (2.8%) |
| 2 Vehicles | 2,157 (53.4%) | 150 (68.8%) |
| 3 or more Vehicles | 1,086 (26.9%) | 23 (10.5%) |
| Total | 4,038 (100.0%) | 218 (100.0%) |
Real Estate & Mortgages in Ringwood borough
Real Estate and Mortgage Overview in Ringwood borough
| Characteristic | Without Mortgage | With Mortgage |
| Housing Units | 1,351 | 2,687 |
| Median Property Value | $423,700 | $414,500 |
| Median Household Income | $110,820 | $1,477 |
| Monthly Housing Costs | $1,501 | $1,270 |
| Real Estate Taxes | $10,001 | $24 |
Property Value by Mortgage Status in Ringwood borough
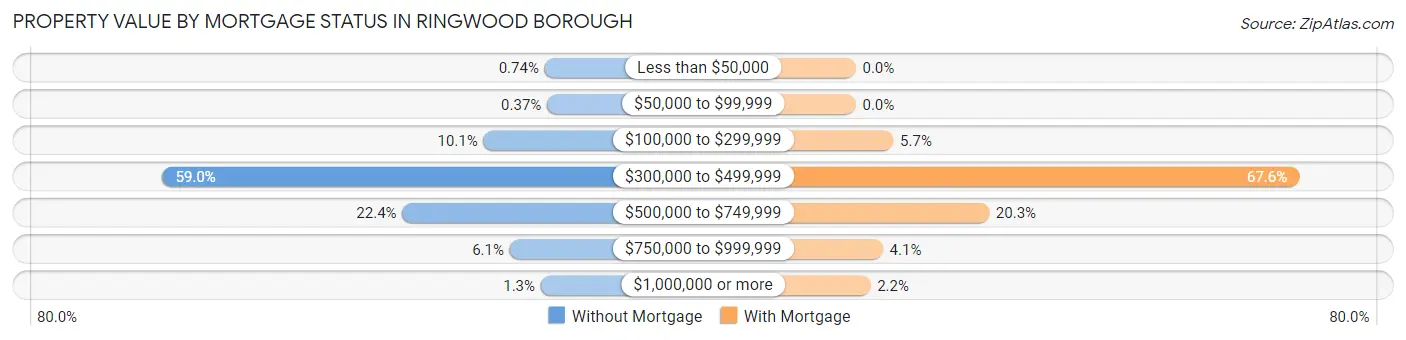
| Property Value | Without Mortgage | With Mortgage |
| Less than $50,000 | 10 (0.7%) | 0 (0.0%) |
| $50,000 to $99,999 | 5 (0.4%) | 0 (0.0%) |
| $100,000 to $299,999 | 136 (10.1%) | 154 (5.7%) |
| $300,000 to $499,999 | 797 (59.0%) | 1,816 (67.6%) |
| $500,000 to $749,999 | 303 (22.4%) | 546 (20.3%) |
| $750,000 to $999,999 | 82 (6.1%) | 111 (4.1%) |
| $1,000,000 or more | 18 (1.3%) | 60 (2.2%) |
| Total | 1,351 (100.0%) | 2,687 (100.0%) |
Household Income by Mortgage Status in Ringwood borough
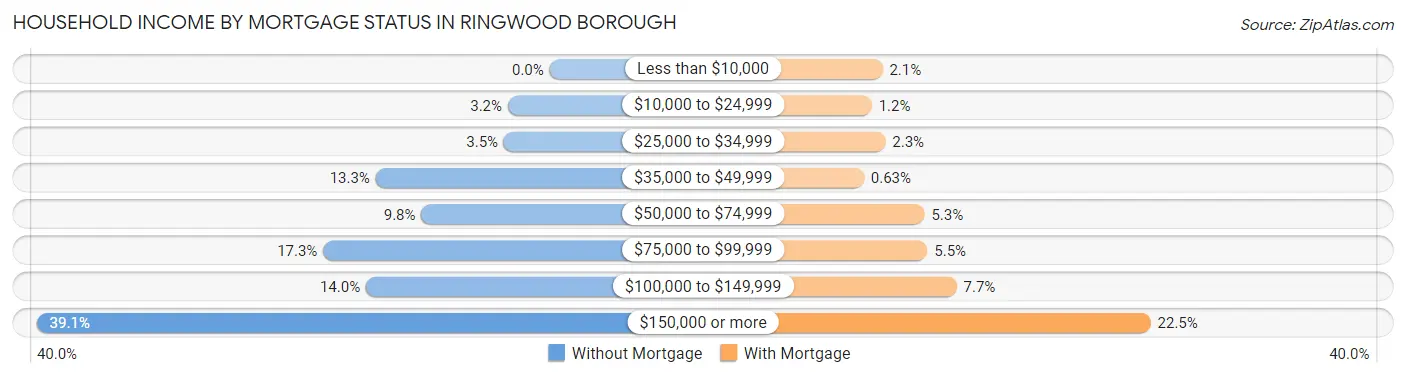
| Household Income | Without Mortgage | With Mortgage |
| Less than $10,000 | 0 (0.0%) | 55 (2.1%) |
| $10,000 to $24,999 | 43 (3.2%) | 33 (1.2%) |
| $25,000 to $34,999 | 47 (3.5%) | 61 (2.3%) |
| $35,000 to $49,999 | 179 (13.3%) | 17 (0.6%) |
| $50,000 to $74,999 | 132 (9.8%) | 141 (5.2%) |
| $75,000 to $99,999 | 233 (17.2%) | 147 (5.5%) |
| $100,000 to $149,999 | 189 (14.0%) | 207 (7.7%) |
| $150,000 or more | 528 (39.1%) | 604 (22.5%) |
| Total | 1,351 (100.0%) | 2,687 (100.0%) |
Property Value to Household Income Ratio in Ringwood borough
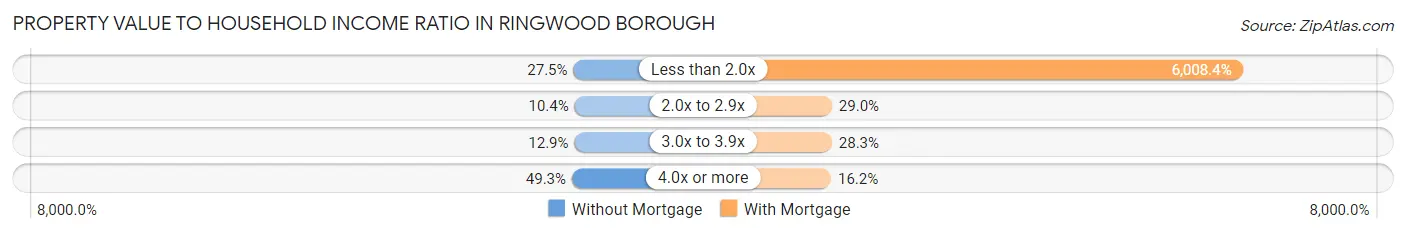
| Value-to-Income Ratio | Without Mortgage | With Mortgage |
| Less than 2.0x | 371 (27.5%) | 161,445 (6,008.4%) |
| 2.0x to 2.9x | 140 (10.4%) | 780 (29.0%) |
| 3.0x to 3.9x | 174 (12.9%) | 761 (28.3%) |
| 4.0x or more | 666 (49.3%) | 434 (16.2%) |
| Total | 1,351 (100.0%) | 2,687 (100.0%) |
Real Estate Taxes by Mortgage Status in Ringwood borough
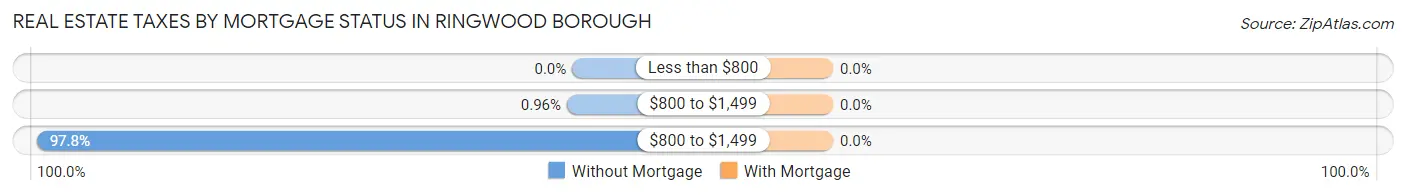
| Property Taxes | Without Mortgage | With Mortgage |
| Less than $800 | 0 (0.0%) | 0 (0.0%) |
| $800 to $1,499 | 13 (1.0%) | 0 (0.0%) |
| $800 to $1,499 | 1,321 (97.8%) | 0 (0.0%) |
| Total | 1,351 (100.0%) | 2,687 (100.0%) |
Health & Disability in Ringwood borough
Health Insurance Coverage by Age in Ringwood borough
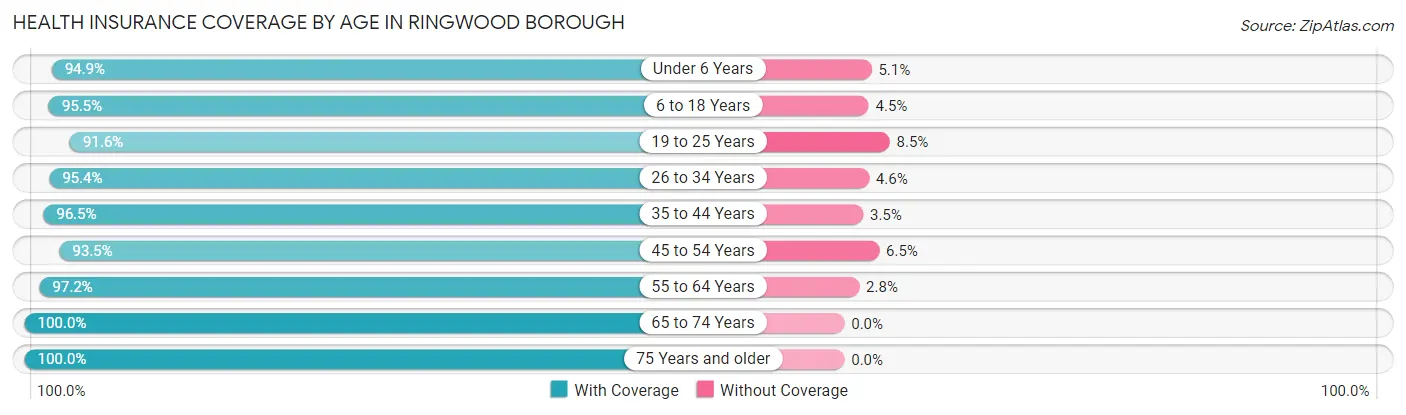
| Age Bracket | With Coverage | Without Coverage |
| Under 6 Years | 600 (94.9%) | 32 (5.1%) |
| 6 to 18 Years | 1,642 (95.5%) | 78 (4.5%) |
| 19 to 25 Years | 910 (91.5%) | 84 (8.5%) |
| 26 to 34 Years | 1,456 (95.4%) | 70 (4.6%) |
| 35 to 44 Years | 1,132 (96.5%) | 41 (3.5%) |
| 45 to 54 Years | 1,671 (93.5%) | 116 (6.5%) |
| 55 to 64 Years | 1,788 (97.2%) | 51 (2.8%) |
| 65 to 74 Years | 1,334 (100.0%) | 0 (0.0%) |
| 75 Years and older | 650 (100.0%) | 0 (0.0%) |
| Total | 11,183 (96.0%) | 472 (4.1%) |
Health Insurance Coverage by Citizenship Status in Ringwood borough
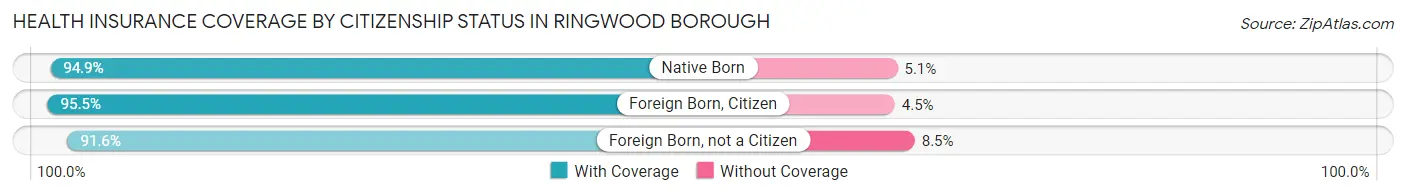
| Citizenship Status | With Coverage | Without Coverage |
| Native Born | 600 (94.9%) | 32 (5.1%) |
| Foreign Born, Citizen | 1,642 (95.5%) | 78 (4.5%) |
| Foreign Born, not a Citizen | 910 (91.5%) | 84 (8.5%) |
Health Insurance Coverage by Household Income in Ringwood borough
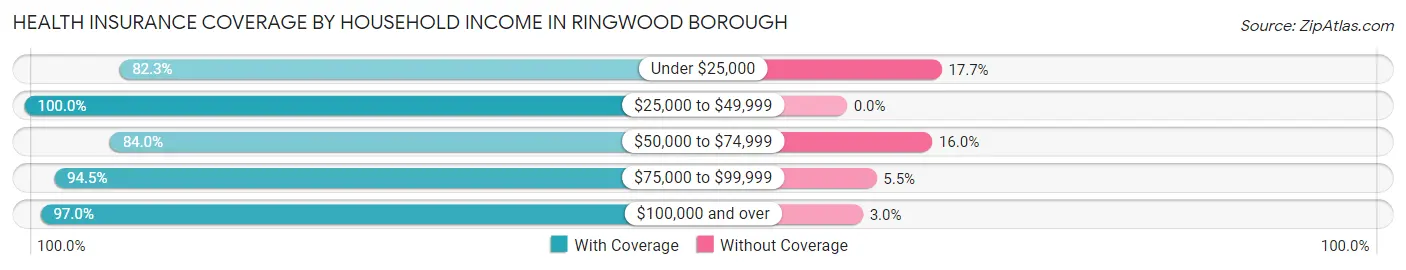
| Household Income | With Coverage | Without Coverage |
| Under $25,000 | 167 (82.3%) | 36 (17.7%) |
| $25,000 to $49,999 | 991 (100.0%) | 0 (0.0%) |
| $50,000 to $74,999 | 537 (84.0%) | 102 (16.0%) |
| $75,000 to $99,999 | 1,228 (94.5%) | 72 (5.5%) |
| $100,000 and over | 8,197 (97.0%) | 252 (3.0%) |
Public vs Private Health Insurance Coverage by Age in Ringwood borough
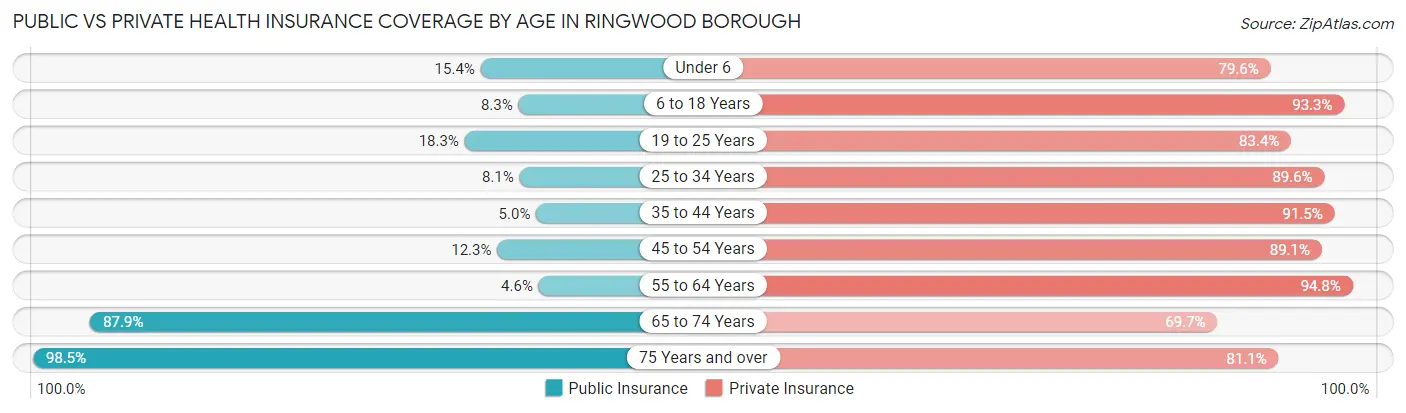
| Age Bracket | Public Insurance | Private Insurance |
| Under 6 | 97 (15.3%) | 503 (79.6%) |
| 6 to 18 Years | 143 (8.3%) | 1,604 (93.3%) |
| 19 to 25 Years | 182 (18.3%) | 829 (83.4%) |
| 25 to 34 Years | 124 (8.1%) | 1,367 (89.6%) |
| 35 to 44 Years | 59 (5.0%) | 1,073 (91.5%) |
| 45 to 54 Years | 219 (12.3%) | 1,592 (89.1%) |
| 55 to 64 Years | 84 (4.6%) | 1,744 (94.8%) |
| 65 to 74 Years | 1,172 (87.9%) | 930 (69.7%) |
| 75 Years and over | 640 (98.5%) | 527 (81.1%) |
| Total | 2,720 (23.3%) | 10,169 (87.3%) |
Disability Status by Sex by Age in Ringwood borough
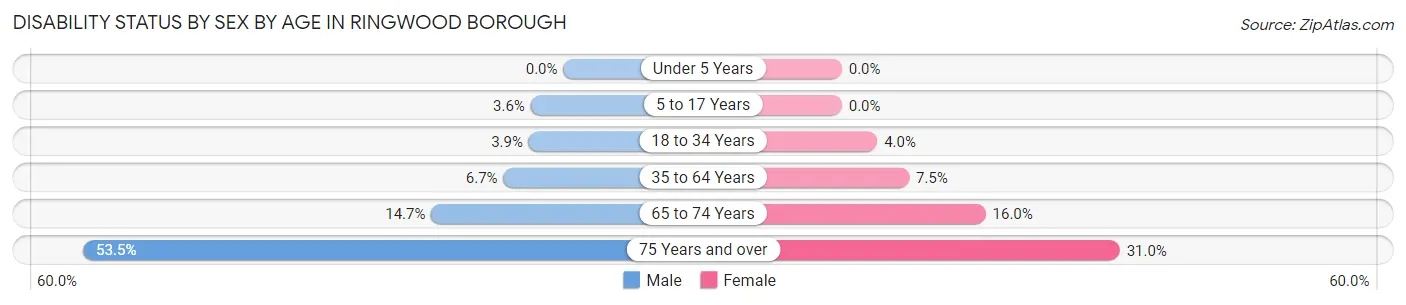
| Age Bracket | Male | Female |
| Under 5 Years | 0 (0.0%) | 0 (0.0%) |
| 5 to 17 Years | 29 (3.6%) | 0 (0.0%) |
| 18 to 34 Years | 56 (3.8%) | 45 (4.0%) |
| 35 to 64 Years | 166 (6.7%) | 173 (7.5%) |
| 65 to 74 Years | 98 (14.7%) | 107 (16.0%) |
| 75 Years and over | 161 (53.5%) | 108 (30.9%) |
Disability Class by Sex by Age in Ringwood borough
Disability Class: Hearing Difficulty
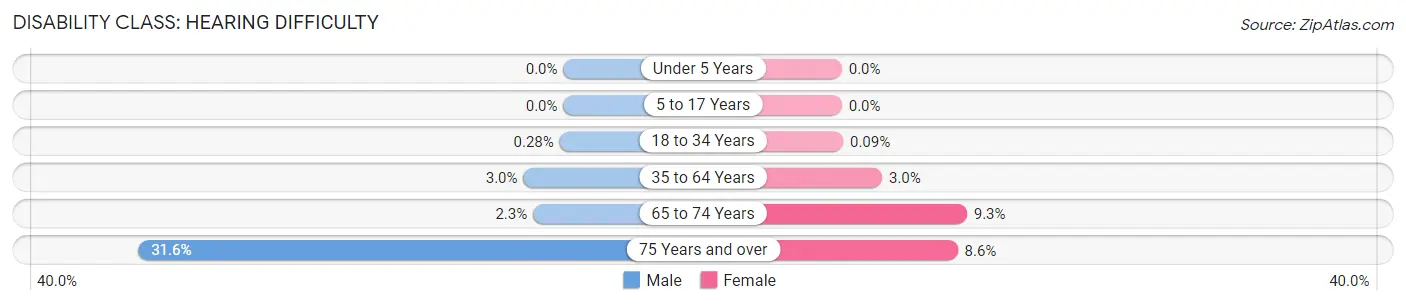
| Age Bracket | Male | Female |
| Under 5 Years | 0 (0.0%) | 0 (0.0%) |
| 5 to 17 Years | 0 (0.0%) | 0 (0.0%) |
| 18 to 34 Years | 4 (0.3%) | 1 (0.1%) |
| 35 to 64 Years | 74 (3.0%) | 69 (3.0%) |
| 65 to 74 Years | 15 (2.2%) | 62 (9.3%) |
| 75 Years and over | 95 (31.6%) | 30 (8.6%) |
Disability Class: Vision Difficulty
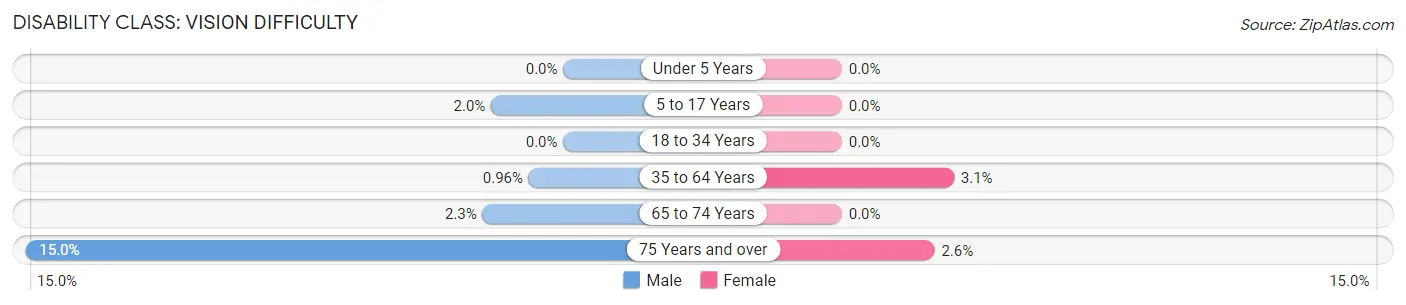
| Age Bracket | Male | Female |
| Under 5 Years | 0 (0.0%) | 0 (0.0%) |
| 5 to 17 Years | 16 (2.0%) | 0 (0.0%) |
| 18 to 34 Years | 0 (0.0%) | 0 (0.0%) |
| 35 to 64 Years | 24 (1.0%) | 72 (3.1%) |
| 65 to 74 Years | 15 (2.2%) | 0 (0.0%) |
| 75 Years and over | 45 (14.9%) | 9 (2.6%) |
Disability Class: Cognitive Difficulty
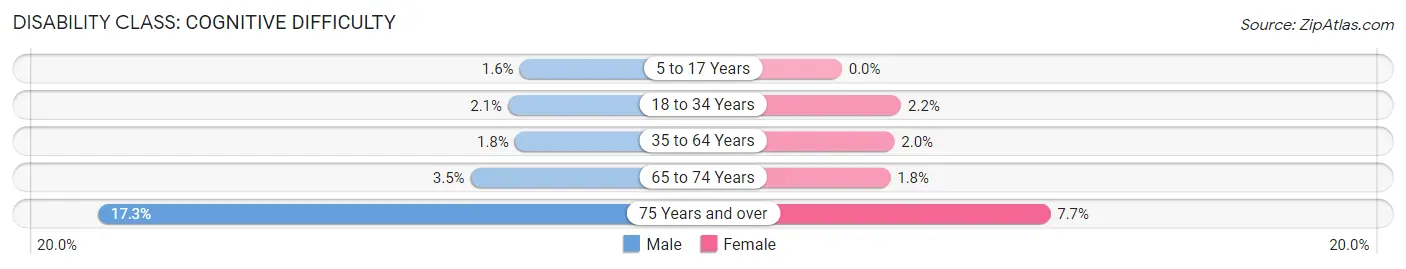
| Age Bracket | Male | Female |
| 5 to 17 Years | 13 (1.6%) | 0 (0.0%) |
| 18 to 34 Years | 30 (2.1%) | 25 (2.2%) |
| 35 to 64 Years | 45 (1.8%) | 45 (1.9%) |
| 65 to 74 Years | 23 (3.5%) | 12 (1.8%) |
| 75 Years and over | 52 (17.3%) | 27 (7.7%) |
Disability Class: Ambulatory Difficulty
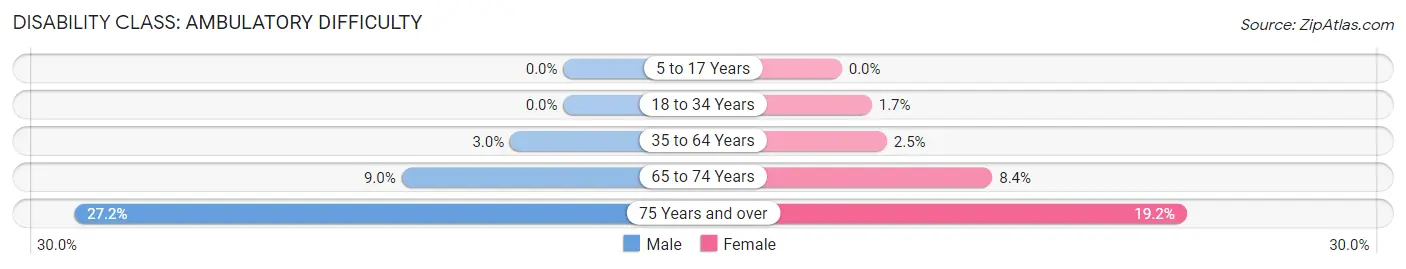
| Age Bracket | Male | Female |
| 5 to 17 Years | 0 (0.0%) | 0 (0.0%) |
| 18 to 34 Years | 0 (0.0%) | 19 (1.7%) |
| 35 to 64 Years | 74 (3.0%) | 58 (2.5%) |
| 65 to 74 Years | 60 (9.0%) | 56 (8.4%) |
| 75 Years and over | 82 (27.2%) | 67 (19.2%) |
Disability Class: Self-Care Difficulty
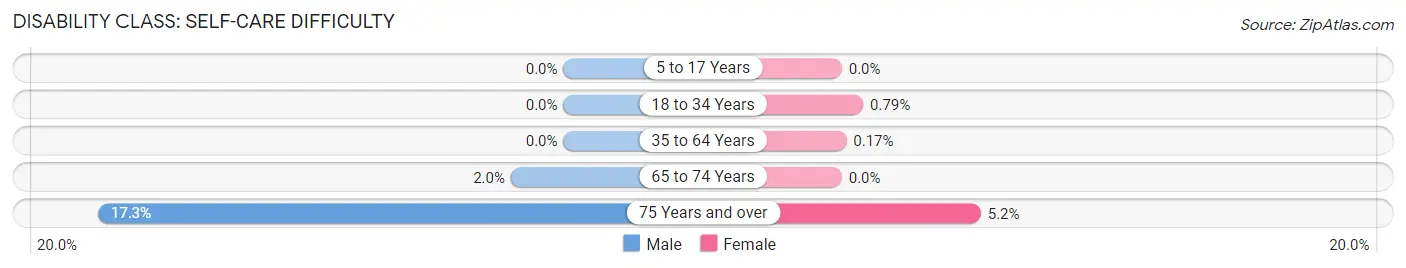
| Age Bracket | Male | Female |
| 5 to 17 Years | 0 (0.0%) | 0 (0.0%) |
| 18 to 34 Years | 0 (0.0%) | 9 (0.8%) |
| 35 to 64 Years | 0 (0.0%) | 4 (0.2%) |
| 65 to 74 Years | 13 (1.9%) | 0 (0.0%) |
| 75 Years and over | 52 (17.3%) | 18 (5.2%) |
Technology Access in Ringwood borough
Computing Device Access in Ringwood borough
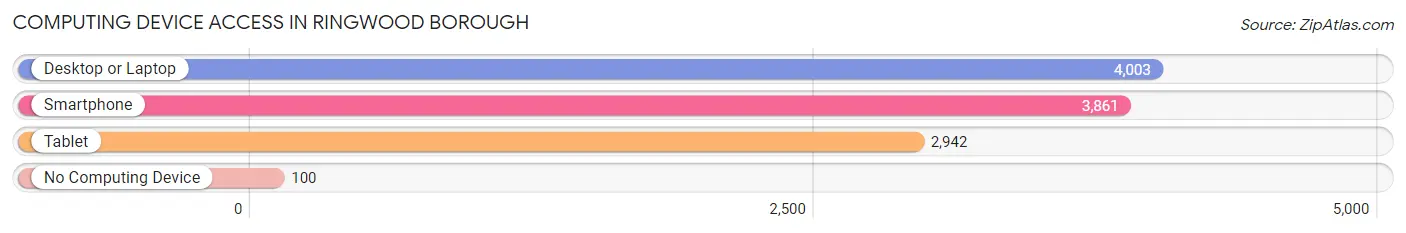
| Device Type | # Households | % Households |
| Desktop or Laptop | 4,003 | 94.1% |
| Smartphone | 3,861 | 90.7% |
| Tablet | 2,942 | 69.1% |
| No Computing Device | 100 | 2.4% |
| Total | 4,256 | 100.0% |
Internet Access in Ringwood borough
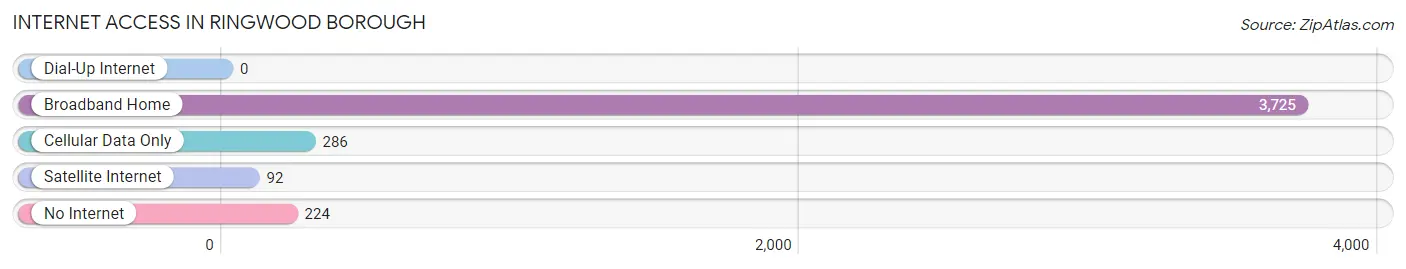
| Internet Type | # Households | % Households |
| Dial-Up Internet | 0 | 0.0% |
| Broadband Home | 3,725 | 87.5% |
| Cellular Data Only | 286 | 6.7% |
| Satellite Internet | 92 | 2.2% |
| No Internet | 224 | 5.3% |
| Total | 4,256 | 100.0% |
Ringwood borough Summary
Introduction
Ringwood Borough is a borough located in Passaic County, New Jersey. It is situated in the Ramapo Mountains and is part of the New York metropolitan area. The borough is home to a population of approximately 12,000 people and is known for its rich history, diverse geography, and vibrant economy. This paper will provide an overview of Ringwood Borough’s history, geography, economy, and demographics.
History
Ringwood Borough was first settled in the late 17th century by Dutch and English settlers. The area was originally part of the Ramapo Township, which was established in 1740. In 1826, the area was incorporated as a borough and named after the Ringwood Ironworks, which was located in the area. The ironworks was established in 1741 and was one of the first ironworks in the United States. The ironworks was a major source of employment for the area and helped to spur the growth of the borough.
In the late 19th century, Ringwood Borough became a popular summer resort destination for wealthy New Yorkers. The area was known for its natural beauty and was home to several large estates. The most famous of these estates was Skylands Manor, which was built in the early 20th century by the Ringwood Company. The estate is now a National Historic Landmark and is open to the public.
Geography
Ringwood Borough is located in the Ramapo Mountains in Passaic County, New Jersey. The borough is situated in the northern part of the state and is bordered by the towns of West Milford, Oakland, and Wanaque. The borough is approximately 25 square miles in size and is home to a variety of terrain, including forests, wetlands, and lakes. The borough is also home to several parks, including Ringwood State Park, which is the largest state park in New Jersey.
Economy
Ringwood Borough’s economy is largely based on tourism and manufacturing. The borough is home to several large manufacturing companies, including the Ringwood Company, which produces iron and steel products. The borough is also home to several small businesses, including restaurants, retail stores, and professional services.
The borough is also home to several tourist attractions, including Skylands Manor, Ringwood State Park, and the Ringwood Ironworks. These attractions draw visitors from all over the region and help to support the local economy.
Demographics
As of the 2010 census, Ringwood Borough had a population of 12,228 people. The population is largely white (87.3%) and the median household income is $87,813. The borough is also home to a large Hispanic population (10.3%) and a small African American population (1.2%).
Conclusion
Ringwood Borough is a borough located in Passaic County, New Jersey. It is home to a population of approximately 12,000 people and is known for its rich history, diverse geography, and vibrant economy. The borough is home to several large manufacturing companies, tourist attractions, and small businesses. The population is largely white and the median household income is $87,813. Ringwood Borough is a great place to live and work and is a great example of a thriving community.
Common Questions
What is Per Capita Income in Ringwood borough?
Per Capita income in Ringwood borough is $62,750.
What is the Median Family Income in Ringwood borough?
Median Family Income in Ringwood borough is $162,192.
What is the Median Household income in Ringwood borough?
Median Household Income in Ringwood borough is $141,800.
What is Income or Wage Gap in Ringwood borough?
Income or Wage Gap in Ringwood borough is 21.3%.
Women in Ringwood borough earn 78.7 cents for every dollar earned by a man.
What is Inequality or Gini Index in Ringwood borough?
Inequality or Gini Index in Ringwood borough is 0.39.
What is the Total Population of Ringwood borough?
Total Population of Ringwood borough is 11,692.
What is the Total Male Population of Ringwood borough?
Total Male Population of Ringwood borough is 6,044.
What is the Total Female Population of Ringwood borough?
Total Female Population of Ringwood borough is 5,648.
What is the Ratio of Males per 100 Females in Ringwood borough?
There are 107.01 Males per 100 Females in Ringwood borough.
What is the Ratio of Females per 100 Males in Ringwood borough?
There are 93.45 Females per 100 Males in Ringwood borough.
What is the Median Population Age in Ringwood borough?
Median Population Age in Ringwood borough is 43.5 Years.
What is the Average Family Size in Ringwood borough
Average Family Size in Ringwood borough is 3.1 People.
What is the Average Household Size in Ringwood borough
Average Household Size in Ringwood borough is 2.7 People.
How Large is the Labor Force in Ringwood borough?
There are 6,854 People in the Labor Forcein in Ringwood borough.
What is the Percentage of People in the Labor Force in Ringwood borough?
70.7% of People are in the Labor Force in Ringwood borough.
What is the Unemployment Rate in Ringwood borough?
Unemployment Rate in Ringwood borough is 4.9%.