Olivet, NJ Map & Demographics
Olivet Map
Olivet Overview
$44,203
PER CAPITA INCOME
$118,365
AVG FAMILY INCOME
$118,058
AVG HOUSEHOLD INCOME
46.9%
WAGE / INCOME GAP [ % ]
53.1¢/ $1
WAGE / INCOME GAP [ $ ]
0.32
INEQUALITY / GINI INDEX
1,535
TOTAL POPULATION
714
MALE POPULATION
821
FEMALE POPULATION
86.97
MALES / 100 FEMALES
114.99
FEMALES / 100 MALES
37.2
MEDIAN AGE
3.3
AVG FAMILY SIZE
3.1
AVG HOUSEHOLD SIZE
855
LABOR FORCE [ PEOPLE ]
74.0%
PERCENT IN LABOR FORCE
6.8%
UNEMPLOYMENT RATE
Income in Olivet
Income Overview in Olivet
Per Capita Income in Olivet is $44,203, while median incomes of families and households are $118,365 and $118,058 respectively.
| Characteristic | Number | Measure |
| Per Capita Income | 1,535 | $44,203 |
| Median Family Income | 447 | $118,365 |
| Mean Family Income | 447 | $133,076 |
| Median Household Income | 501 | $118,058 |
| Mean Household Income | 501 | $137,151 |
| Income Deficit | 447 | $0 |
| Wage / Income Gap (%) | 1,535 | 46.86% |
| Wage / Income Gap ($) | 1,535 | 53.14¢ per $1 |
| Gini / Inequality Index | 1,535 | 0.32 |
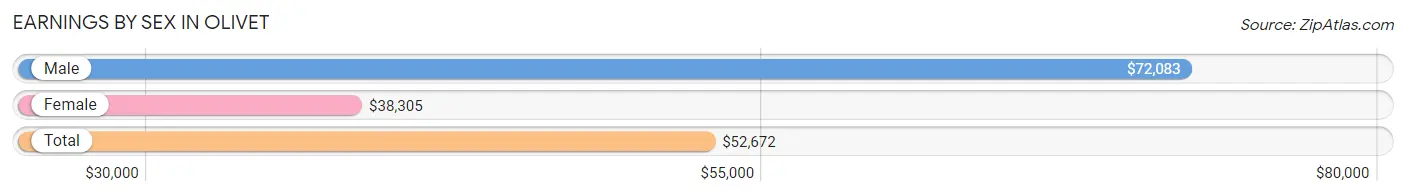
Earnings by Sex in Olivet
Average Earnings in Olivet are $52,672, $72,083 for men and $38,305 for women, a difference of 46.9%.
| Sex | Number | Average Earnings |
| Male | 459 (53.8%) | $72,083 |
| Female | 394 (46.2%) | $38,305 |
| Total | 853 (100.0%) | $52,672 |
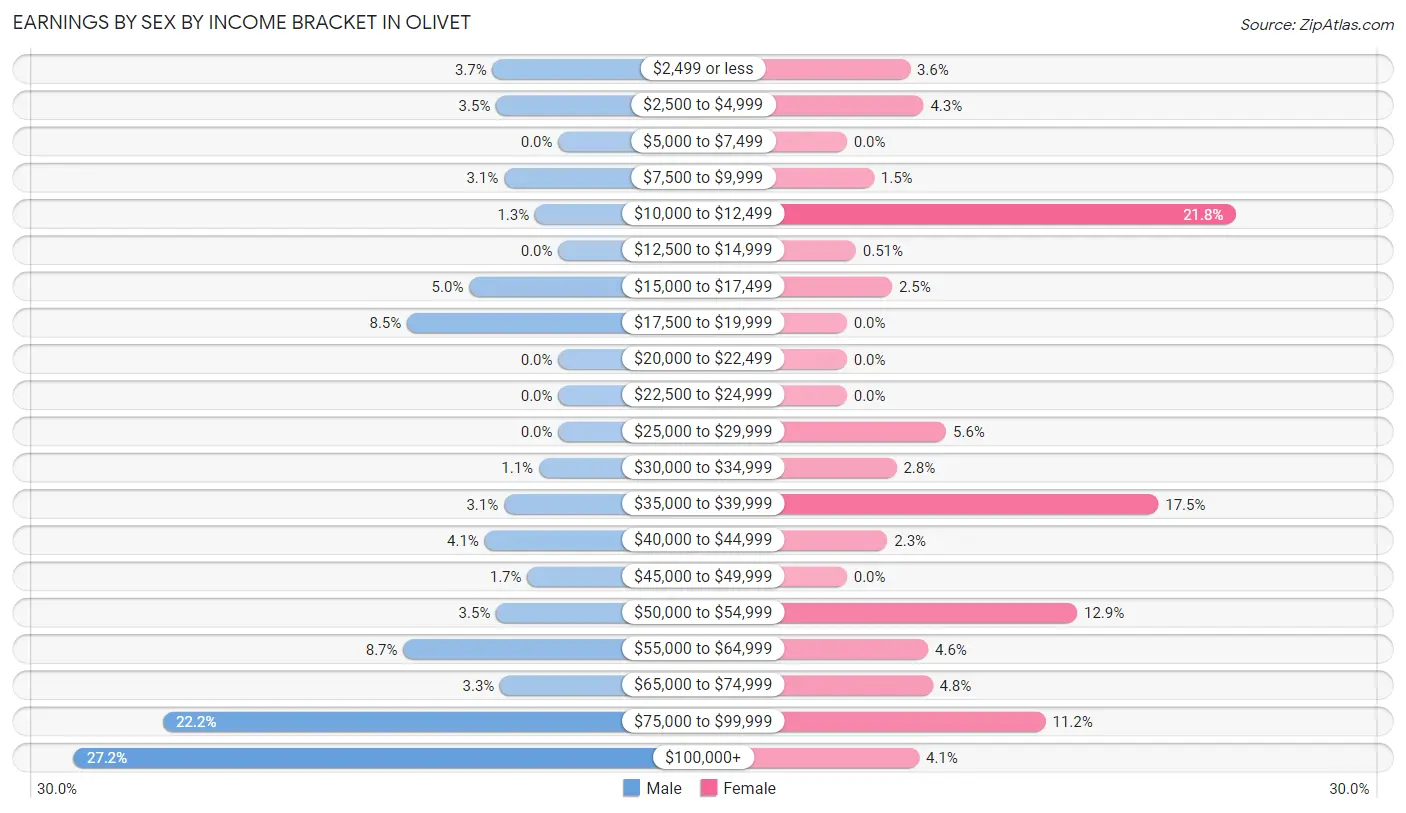
Earnings by Sex by Income Bracket in Olivet
The most common earnings brackets in Olivet are $100,000+ for men (125 | 27.2%) and $10,000 to $12,499 for women (86 | 21.8%).
| Income | Male | Female |
| $2,499 or less | 17 (3.7%) | 14 (3.5%) |
| $2,500 to $4,999 | 16 (3.5%) | 17 (4.3%) |
| $5,000 to $7,499 | 0 (0.0%) | 0 (0.0%) |
| $7,500 to $9,999 | 14 (3.0%) | 6 (1.5%) |
| $10,000 to $12,499 | 6 (1.3%) | 86 (21.8%) |
| $12,500 to $14,999 | 0 (0.0%) | 2 (0.5%) |
| $15,000 to $17,499 | 23 (5.0%) | 10 (2.5%) |
| $17,500 to $19,999 | 39 (8.5%) | 0 (0.0%) |
| $20,000 to $22,499 | 0 (0.0%) | 0 (0.0%) |
| $22,500 to $24,999 | 0 (0.0%) | 0 (0.0%) |
| $25,000 to $29,999 | 0 (0.0%) | 22 (5.6%) |
| $30,000 to $34,999 | 5 (1.1%) | 11 (2.8%) |
| $35,000 to $39,999 | 14 (3.0%) | 69 (17.5%) |
| $40,000 to $44,999 | 19 (4.1%) | 9 (2.3%) |
| $45,000 to $49,999 | 8 (1.7%) | 0 (0.0%) |
| $50,000 to $54,999 | 16 (3.5%) | 51 (12.9%) |
| $55,000 to $64,999 | 40 (8.7%) | 18 (4.6%) |
| $65,000 to $74,999 | 15 (3.3%) | 19 (4.8%) |
| $75,000 to $99,999 | 102 (22.2%) | 44 (11.2%) |
| $100,000+ | 125 (27.2%) | 16 (4.1%) |
| Total | 459 (100.0%) | 394 (100.0%) |
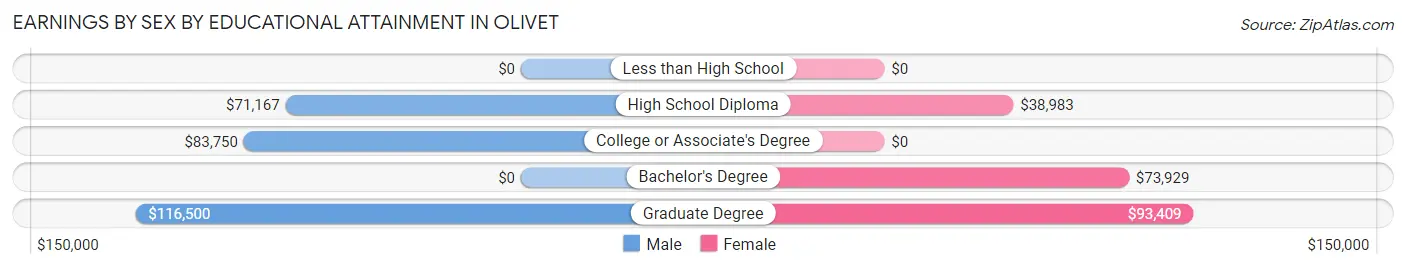
Earnings by Sex by Educational Attainment in Olivet
Average earnings in Olivet are $78,542 for men and $38,750 for women, a difference of 50.7%. Men with an educational attainment of graduate degree enjoy the highest average annual earnings of $116,500, while those with high school diploma education earn the least with $71,167. Women with an educational attainment of graduate degree earn the most with the average annual earnings of $93,409, while those with high school diploma education have the smallest earnings of $38,983.
| Educational Attainment | Male Income | Female Income |
| Less than High School | - | - |
| High School Diploma | $71,167 | $38,983 |
| College or Associate's Degree | $83,750 | $0 |
| Bachelor's Degree | - | - |
| Graduate Degree | $116,500 | $93,409 |
| Total | $78,542 | $38,750 |
Family Income in Olivet
Family Income Brackets in Olivet
According to the Olivet family income data, there are 166 families falling into the $100,000 to $149,999 income range, which is the most common income bracket and makes up 37.1% of all families.
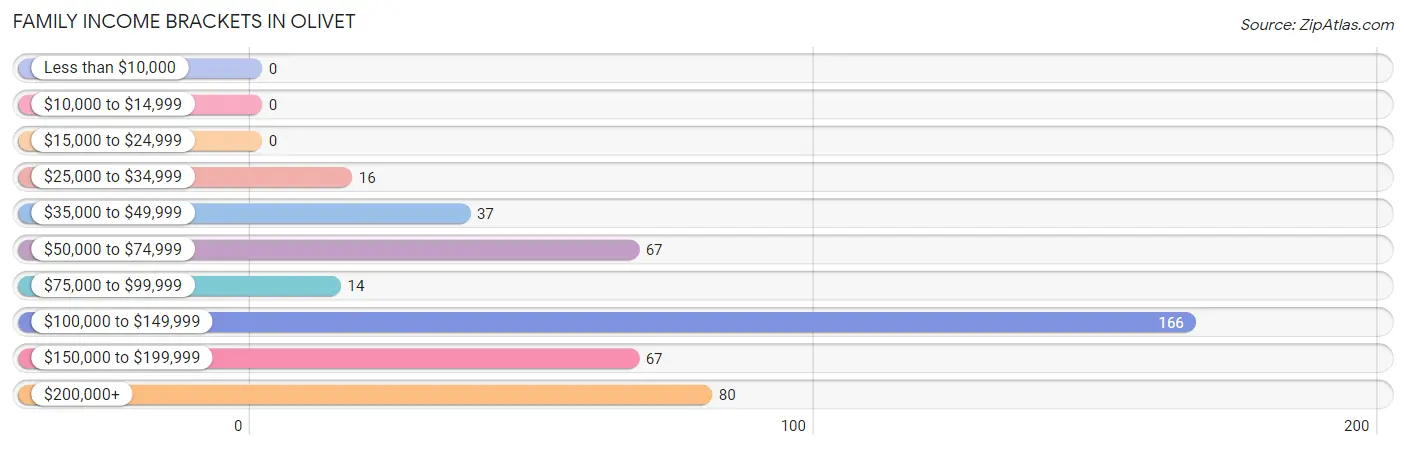
| Income Bracket | # Families | % Families |
| Less than $10,000 | 0 | 0.0% |
| $10,000 to $14,999 | 0 | 0.0% |
| $15,000 to $24,999 | 0 | 0.0% |
| $25,000 to $34,999 | 16 | 3.6% |
| $35,000 to $49,999 | 37 | 8.3% |
| $50,000 to $74,999 | 67 | 15.0% |
| $75,000 to $99,999 | 14 | 3.1% |
| $100,000 to $149,999 | 166 | 37.1% |
| $150,000 to $199,999 | 67 | 15.0% |
| $200,000+ | 80 | 17.9% |
Family Income by Famaliy Size in Olivet
5-person families (33 | 7.4%) account for the highest median family income in Olivet with $210,446 per family, while 2-person families (206 | 46.1%) have the highest median income of $58,053 per family member.
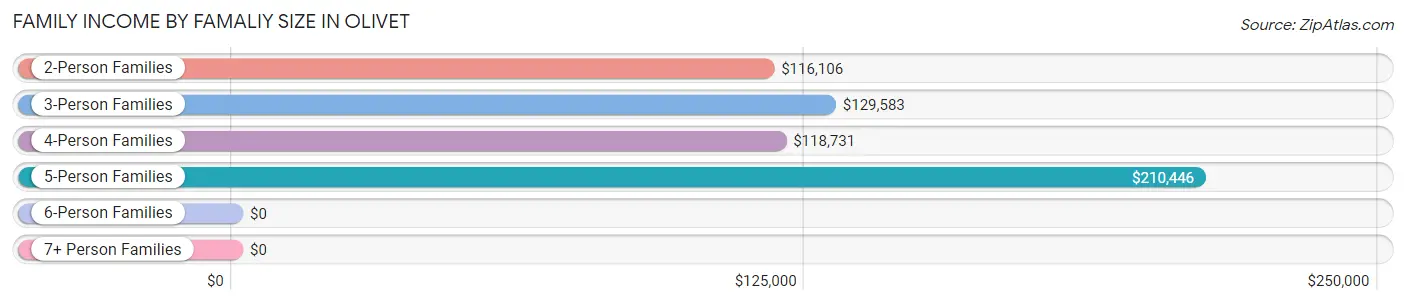
| Income Bracket | # Families | Median Income |
| 2-Person Families | 206 (46.1%) | $116,106 |
| 3-Person Families | 48 (10.7%) | $129,583 |
| 4-Person Families | 118 (26.4%) | $118,731 |
| 5-Person Families | 33 (7.4%) | $210,446 |
| 6-Person Families | 33 (7.4%) | $0 |
| 7+ Person Families | 9 (2.0%) | $0 |
| Total | 447 (100.0%) | $118,365 |
Family Income by Number of Earners in Olivet
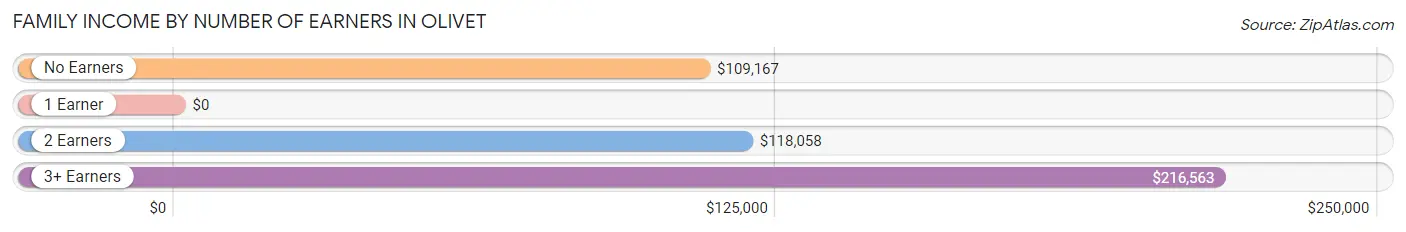
| Number of Earners | # Families | Median Income |
| No Earners | 42 (9.4%) | $109,167 |
| 1 Earner | 88 (19.7%) | $0 |
| 2 Earners | 257 (57.5%) | $118,058 |
| 3+ Earners | 60 (13.4%) | $216,563 |
| Total | 447 (100.0%) | $118,365 |
Household Income in Olivet
Household Income Brackets in Olivet
With 166 households falling in the category, the $100,000 to $149,999 income range is the most frequent in Olivet, accounting for 33.1% of all households.
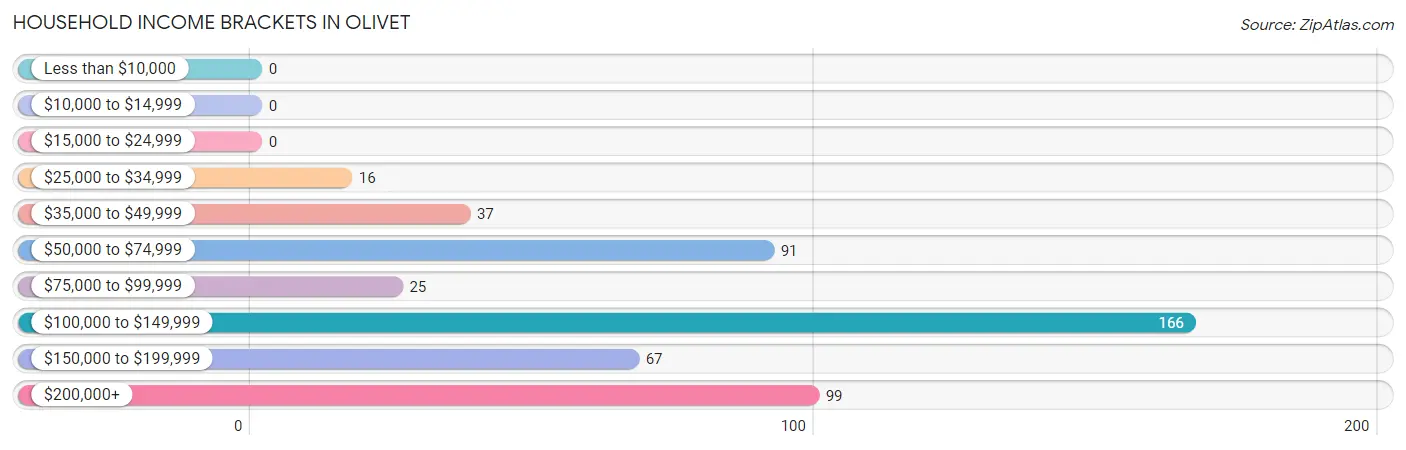
| Income Bracket | # Households | % Households |
| Less than $10,000 | 0 | 0.0% |
| $10,000 to $14,999 | 0 | 0.0% |
| $15,000 to $24,999 | 0 | 0.0% |
| $25,000 to $34,999 | 16 | 3.2% |
| $35,000 to $49,999 | 37 | 7.4% |
| $50,000 to $74,999 | 91 | 18.2% |
| $75,000 to $99,999 | 25 | 5.0% |
| $100,000 to $149,999 | 166 | 33.1% |
| $150,000 to $199,999 | 67 | 13.4% |
| $200,000+ | 99 | 19.8% |
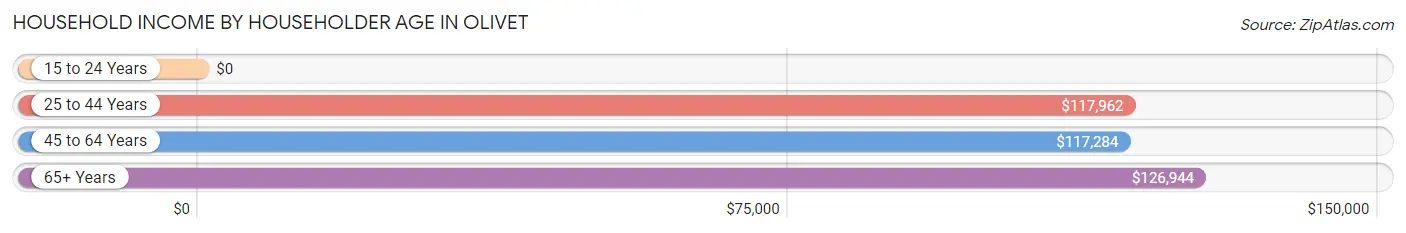
Household Income by Householder Age in Olivet
The median household income in Olivet is $118,058, with the highest median household income of $126,944 found in the 65+ years age bracket for the primary householder. A total of 110 households (22.0%) fall into this category.
| Income Bracket | # Households | Median Income |
| 15 to 24 Years | 0 (0.0%) | $0 |
| 25 to 44 Years | 134 (26.8%) | $117,962 |
| 45 to 64 Years | 257 (51.3%) | $117,284 |
| 65+ Years | 110 (22.0%) | $126,944 |
| Total | 501 (100.0%) | $118,058 |
Poverty in Olivet
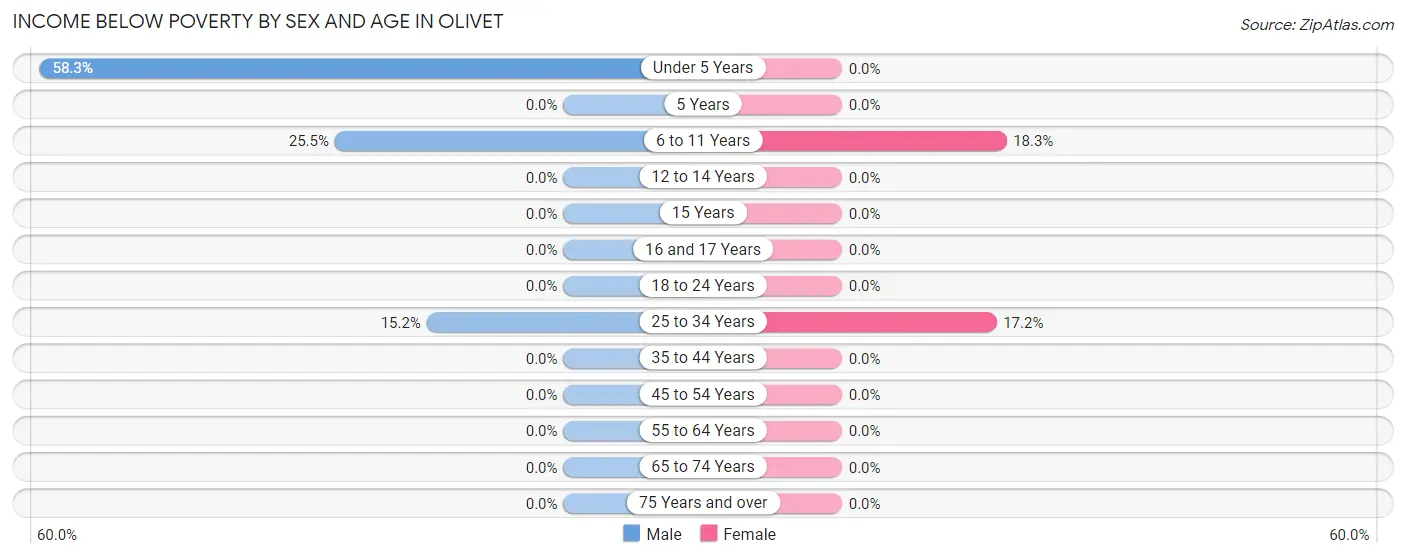
Income Below Poverty by Sex and Age in Olivet
With 8.8% poverty level for males and 3.5% for females among the residents of Olivet, under 5 year old males and 6 to 11 year old females are the most vulnerable to poverty, with 35 males (58.3%) and 13 females (18.3%) in their respective age groups living below the poverty level.
| Age Bracket | Male | Female |
| Under 5 Years | 35 (58.3%) | 0 (0.0%) |
| 5 Years | 0 (0.0%) | 0 (0.0%) |
| 6 to 11 Years | 14 (25.5%) | 13 (18.3%) |
| 12 to 14 Years | 0 (0.0%) | 0 (0.0%) |
| 15 Years | 0 (0.0%) | 0 (0.0%) |
| 16 and 17 Years | 0 (0.0%) | 0 (0.0%) |
| 18 to 24 Years | 0 (0.0%) | 0 (0.0%) |
| 25 to 34 Years | 14 (15.2%) | 16 (17.2%) |
| 35 to 44 Years | 0 (0.0%) | 0 (0.0%) |
| 45 to 54 Years | 0 (0.0%) | 0 (0.0%) |
| 55 to 64 Years | 0 (0.0%) | 0 (0.0%) |
| 65 to 74 Years | 0 (0.0%) | 0 (0.0%) |
| 75 Years and over | 0 (0.0%) | 0 (0.0%) |
| Total | 63 (8.8%) | 29 (3.5%) |
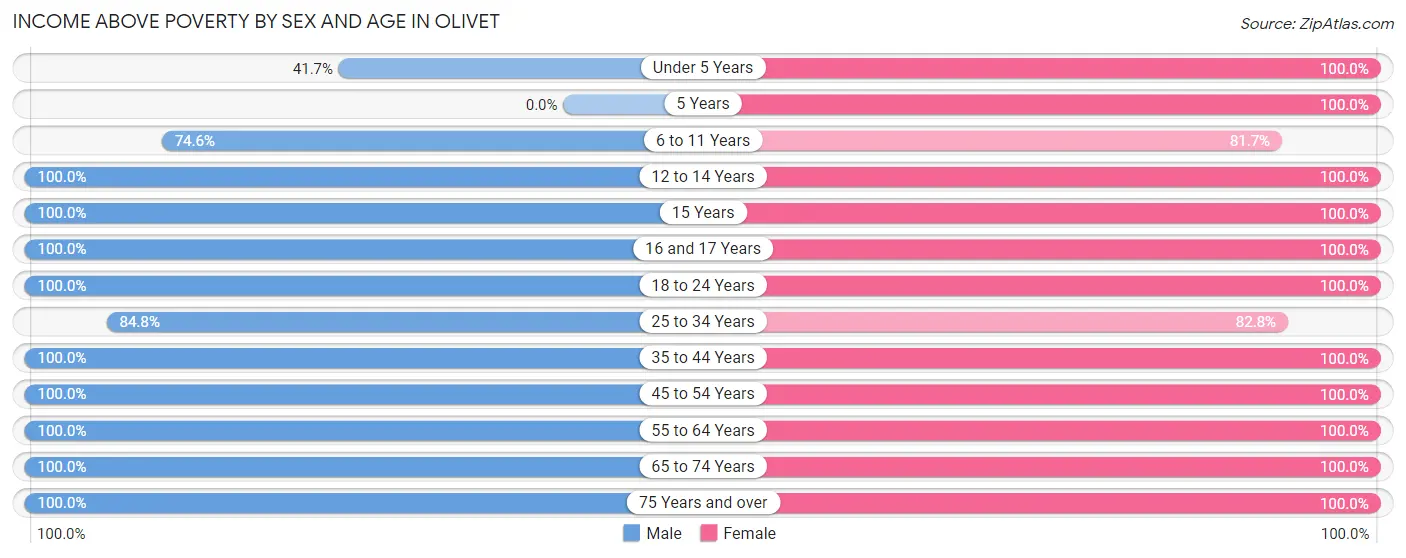
Income Above Poverty by Sex and Age in Olivet
According to the poverty statistics in Olivet, males aged 12 to 14 years and females aged under 5 years are the age groups that are most secure financially, with 100.0% of males and 100.0% of females in these age groups living above the poverty line.
| Age Bracket | Male | Female |
| Under 5 Years | 25 (41.7%) | 79 (100.0%) |
| 5 Years | 0 (0.0%) | 59 (100.0%) |
| 6 to 11 Years | 41 (74.6%) | 58 (81.7%) |
| 12 to 14 Years | 30 (100.0%) | 10 (100.0%) |
| 15 Years | 6 (100.0%) | 9 (100.0%) |
| 16 and 17 Years | 25 (100.0%) | 19 (100.0%) |
| 18 to 24 Years | 50 (100.0%) | 56 (100.0%) |
| 25 to 34 Years | 78 (84.8%) | 77 (82.8%) |
| 35 to 44 Years | 109 (100.0%) | 105 (100.0%) |
| 45 to 54 Years | 115 (100.0%) | 117 (100.0%) |
| 55 to 64 Years | 68 (100.0%) | 101 (100.0%) |
| 65 to 74 Years | 90 (100.0%) | 92 (100.0%) |
| 75 Years and over | 14 (100.0%) | 10 (100.0%) |
| Total | 651 (91.2%) | 792 (96.5%) |
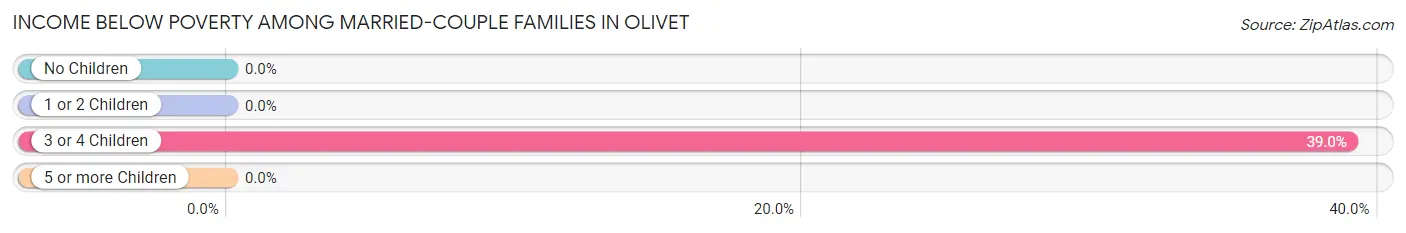
Income Below Poverty Among Married-Couple Families in Olivet
The poverty statistics for married-couple families in Olivet show that 4.5% or 16 of the total 353 families live below the poverty line. Families with 3 or 4 children have the highest poverty rate of 39.0%, comprising of 16 families. On the other hand, families with no children have the lowest poverty rate of 0.0%, which includes 0 families.
| Children | Above Poverty | Below Poverty |
| No Children | 185 (100.0%) | 0 (0.0%) |
| 1 or 2 Children | 127 (100.0%) | 0 (0.0%) |
| 3 or 4 Children | 25 (61.0%) | 16 (39.0%) |
| 5 or more Children | 0 (0.0%) | 0 (0.0%) |
| Total | 337 (95.5%) | 16 (4.5%) |
Income Below Poverty Among Single-Parent Households in Olivet
| Children | Single Father | Single Mother |
| No Children | 0 (0.0%) | 0 (0.0%) |
| 1 or 2 Children | 0 (0.0%) | 0 (0.0%) |
| 3 or 4 Children | 0 (0.0%) | 0 (0.0%) |
| 5 or more Children | 0 (0.0%) | 0 (0.0%) |
| Total | 0 (0.0%) | 0 (0.0%) |
Income Below Poverty Among Married-Couple vs Single-Parent Households in Olivet
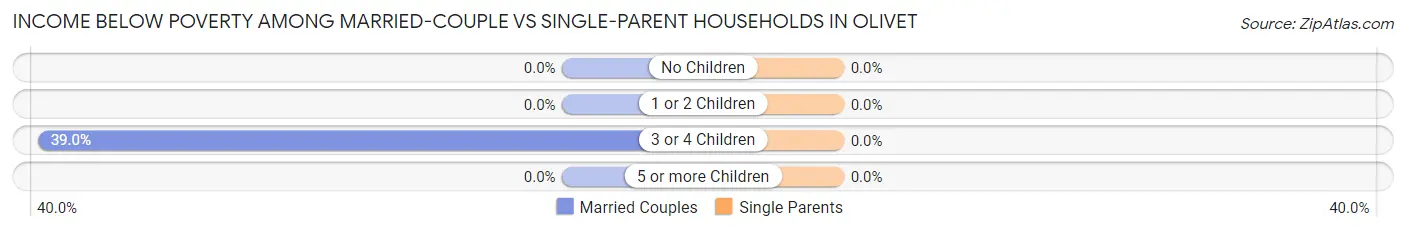
| Children | Married-Couple Families | Single-Parent Households |
| No Children | 0 (0.0%) | 0 (0.0%) |
| 1 or 2 Children | 0 (0.0%) | 0 (0.0%) |
| 3 or 4 Children | 16 (39.0%) | 0 (0.0%) |
| 5 or more Children | 0 (0.0%) | 0 (0.0%) |
| Total | 16 (4.5%) | 0 (0.0%) |
Race in Olivet
The most populous races in Olivet are White / Caucasian (1,479 | 96.4%), Hispanic or Latino (106 | 6.9%), and Two or more Races (56 | 3.6%).
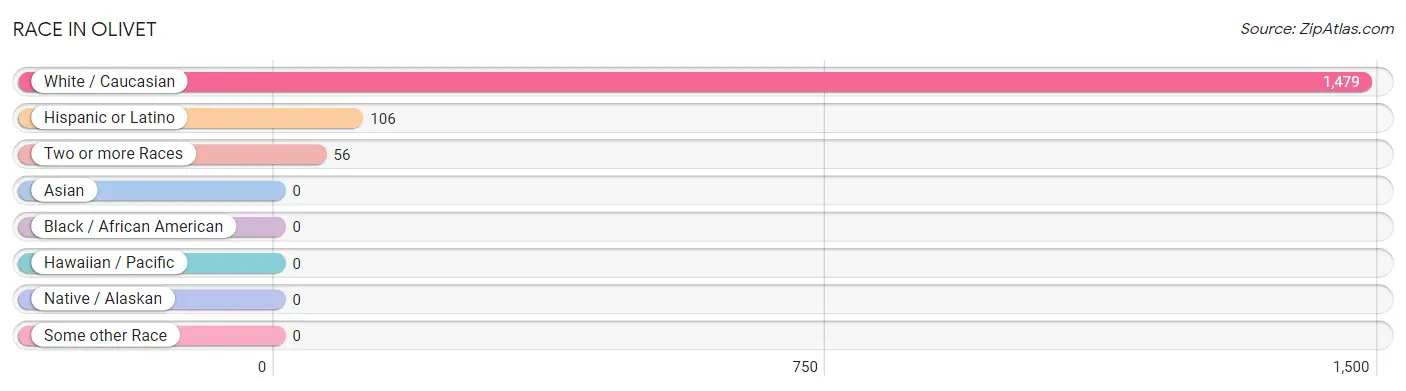
| Race | # Population | % Population |
| Asian | 0 | 0.0% |
| Black / African American | 0 | 0.0% |
| Hawaiian / Pacific | 0 | 0.0% |
| Hispanic or Latino | 106 | 6.9% |
| Native / Alaskan | 0 | 0.0% |
| White / Caucasian | 1,479 | 96.4% |
| Two or more Races | 56 | 3.6% |
| Some other Race | 0 | 0.0% |
| Total | 1,535 | 100.0% |
Ancestry in Olivet
The most populous ancestries reported in Olivet are Italian (298 | 19.4%), Irish (282 | 18.4%), German (256 | 16.7%), English (190 | 12.4%), and Swedish (99 | 6.5%), together accounting for 73.3% of all Olivet residents.
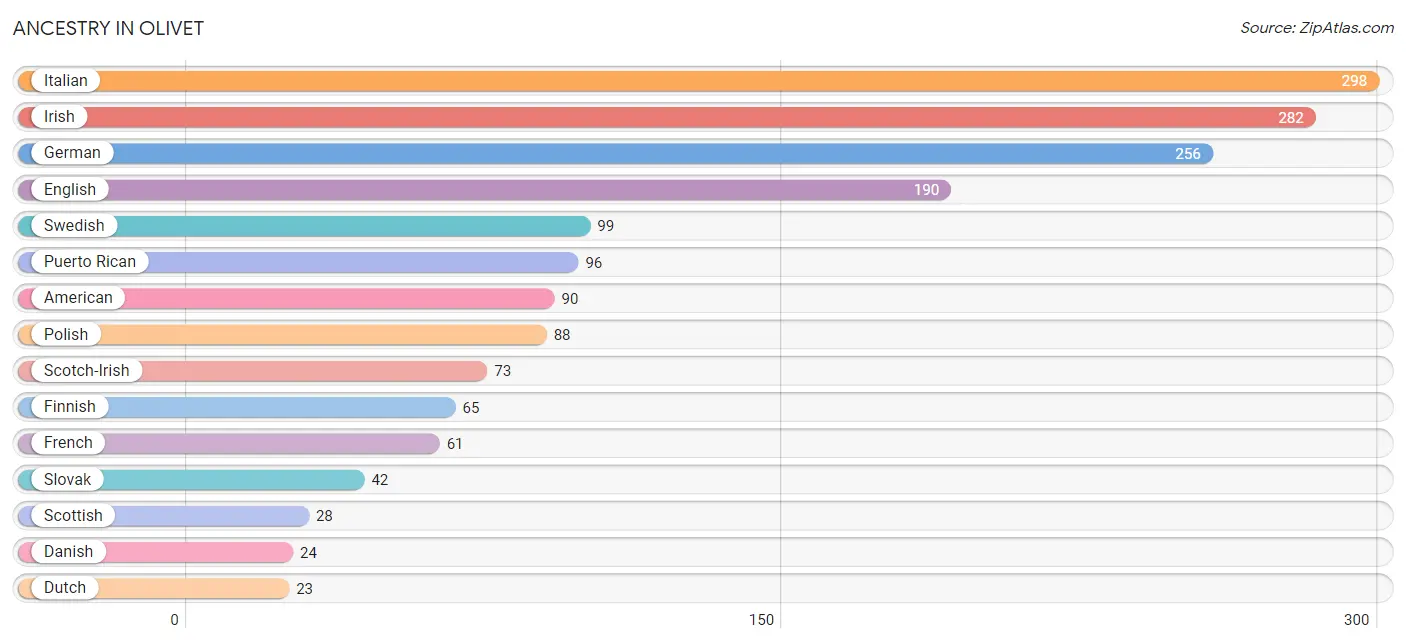
| Ancestry | # Population | % Population |
| American | 90 | 5.9% |
| Cherokee | 2 | 0.1% |
| Czech | 5 | 0.3% |
| Danish | 24 | 1.6% |
| Dutch | 23 | 1.5% |
| English | 190 | 12.4% |
| European | 6 | 0.4% |
| Finnish | 65 | 4.2% |
| French | 61 | 4.0% |
| German | 256 | 16.7% |
| Hungarian | 20 | 1.3% |
| Irish | 282 | 18.4% |
| Italian | 298 | 19.4% |
| Mexican | 10 | 0.6% |
| Norwegian | 9 | 0.6% |
| Polish | 88 | 5.7% |
| Puerto Rican | 96 | 6.2% |
| Scotch-Irish | 73 | 4.8% |
| Scottish | 28 | 1.8% |
| Slovak | 42 | 2.7% |
| Swedish | 99 | 6.5% |
| Ukrainian | 11 | 0.7% |
| Welsh | 23 | 1.5% | View All 23 Rows |
Immigrants in Olivet

| Immigration Origin | # Population | % Population | View All 0 Rows |
Sex and Age in Olivet
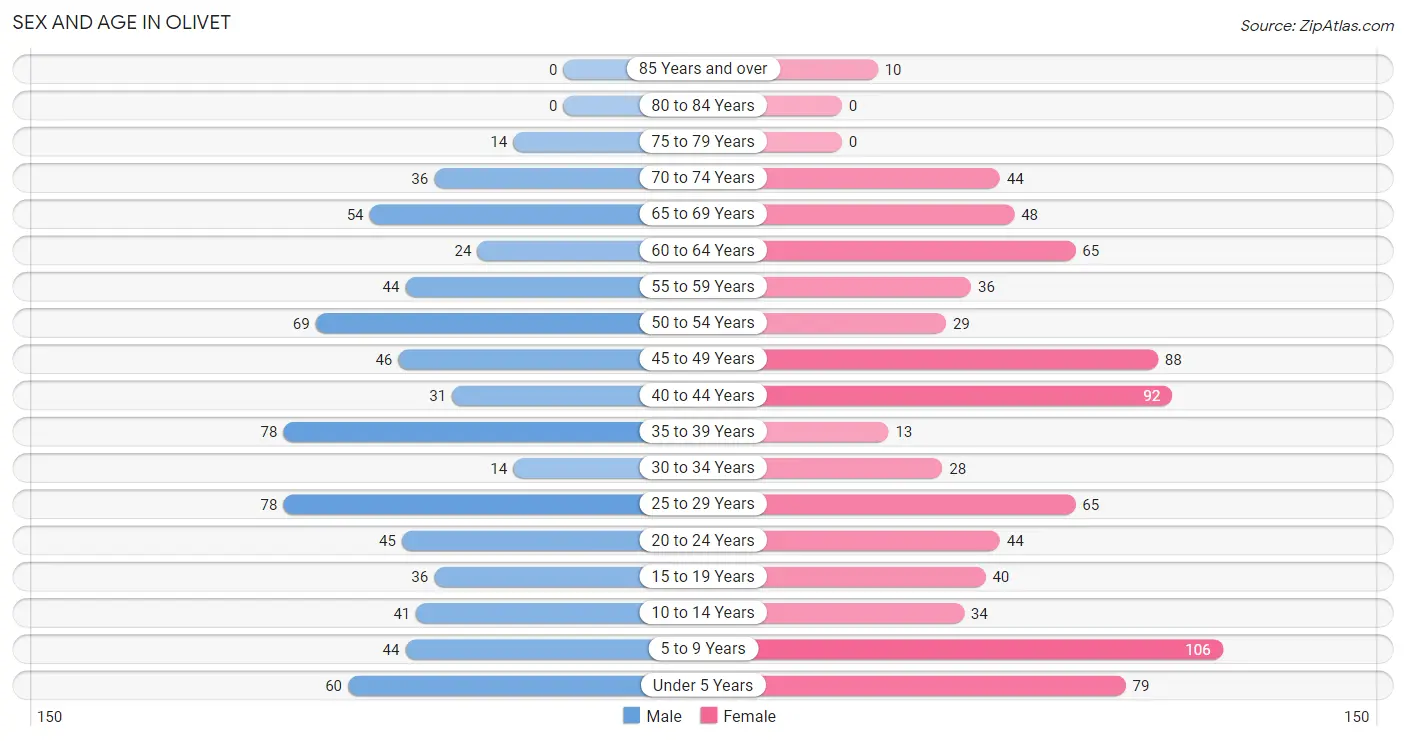
Sex and Age in Olivet
The most populous age groups in Olivet are 25 to 29 Years (78 | 10.9%) for men and 5 to 9 Years (106 | 12.9%) for women.
| Age Bracket | Male | Female |
| Under 5 Years | 60 (8.4%) | 79 (9.6%) |
| 5 to 9 Years | 44 (6.2%) | 106 (12.9%) |
| 10 to 14 Years | 41 (5.7%) | 34 (4.1%) |
| 15 to 19 Years | 36 (5.0%) | 40 (4.9%) |
| 20 to 24 Years | 45 (6.3%) | 44 (5.4%) |
| 25 to 29 Years | 78 (10.9%) | 65 (7.9%) |
| 30 to 34 Years | 14 (2.0%) | 28 (3.4%) |
| 35 to 39 Years | 78 (10.9%) | 13 (1.6%) |
| 40 to 44 Years | 31 (4.3%) | 92 (11.2%) |
| 45 to 49 Years | 46 (6.4%) | 88 (10.7%) |
| 50 to 54 Years | 69 (9.7%) | 29 (3.5%) |
| 55 to 59 Years | 44 (6.2%) | 36 (4.4%) |
| 60 to 64 Years | 24 (3.4%) | 65 (7.9%) |
| 65 to 69 Years | 54 (7.6%) | 48 (5.9%) |
| 70 to 74 Years | 36 (5.0%) | 44 (5.4%) |
| 75 to 79 Years | 14 (2.0%) | 0 (0.0%) |
| 80 to 84 Years | 0 (0.0%) | 0 (0.0%) |
| 85 Years and over | 0 (0.0%) | 10 (1.2%) |
| Total | 714 (100.0%) | 821 (100.0%) |
Families and Households in Olivet
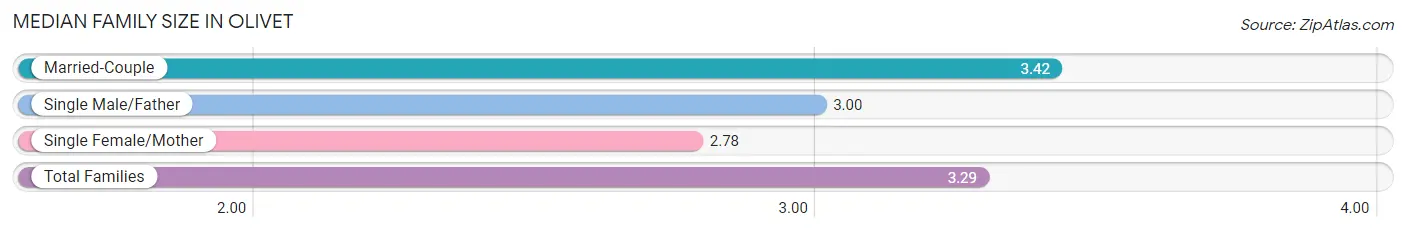
Median Family Size in Olivet
The median family size in Olivet is 3.29 persons per family, with married-couple families (353 | 79.0%) accounting for the largest median family size of 3.42 persons per family. On the other hand, single female/mother families (85 | 19.0%) represent the smallest median family size with 2.78 persons per family.
| Family Type | # Families | Family Size |
| Married-Couple | 353 (79.0%) | 3.42 |
| Single Male/Father | 9 (2.0%) | 3.00 |
| Single Female/Mother | 85 (19.0%) | 2.78 |
| Total Families | 447 (100.0%) | 3.29 |
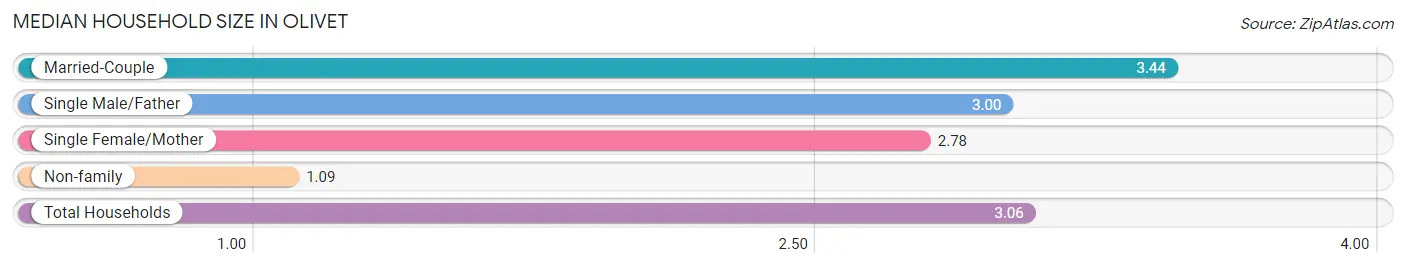
Median Household Size in Olivet
The median household size in Olivet is 3.06 persons per household, with married-couple households (353 | 70.5%) accounting for the largest median household size of 3.44 persons per household. non-family households (54 | 10.8%) represent the smallest median household size with 1.09 persons per household.
| Household Type | # Households | Household Size |
| Married-Couple | 353 (70.5%) | 3.44 |
| Single Male/Father | 9 (1.8%) | 3.00 |
| Single Female/Mother | 85 (17.0%) | 2.78 |
| Non-family | 54 (10.8%) | 1.09 |
| Total Households | 501 (100.0%) | 3.06 |
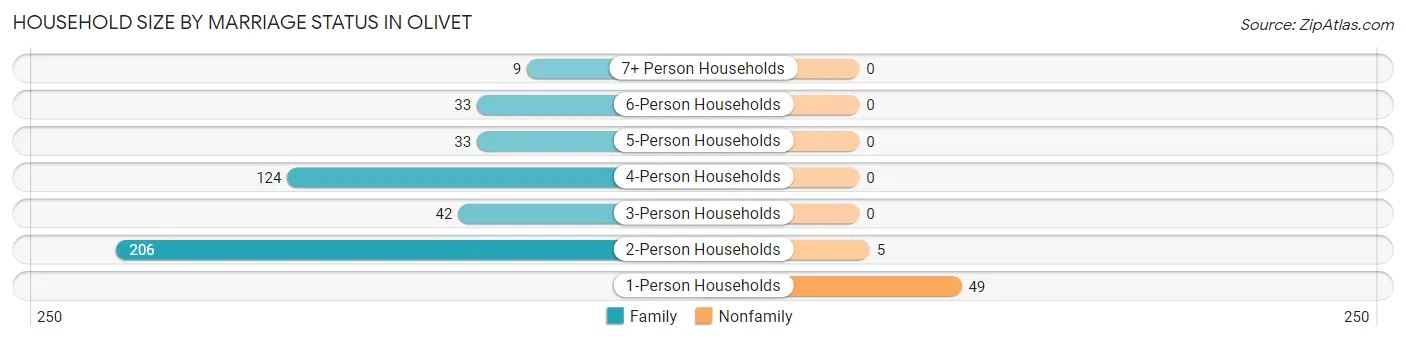
Household Size by Marriage Status in Olivet
Out of a total of 501 households in Olivet, 447 (89.2%) are family households, while 54 (10.8%) are nonfamily households. The most numerous type of family households are 2-person households, comprising 206, and the most common type of nonfamily households are 1-person households, comprising 49.
| Household Size | Family Households | Nonfamily Households |
| 1-Person Households | - | 49 (9.8%) |
| 2-Person Households | 206 (41.1%) | 5 (1.0%) |
| 3-Person Households | 42 (8.4%) | 0 (0.0%) |
| 4-Person Households | 124 (24.7%) | 0 (0.0%) |
| 5-Person Households | 33 (6.6%) | 0 (0.0%) |
| 6-Person Households | 33 (6.6%) | 0 (0.0%) |
| 7+ Person Households | 9 (1.8%) | 0 (0.0%) |
| Total | 447 (89.2%) | 54 (10.8%) |
Female Fertility in Olivet
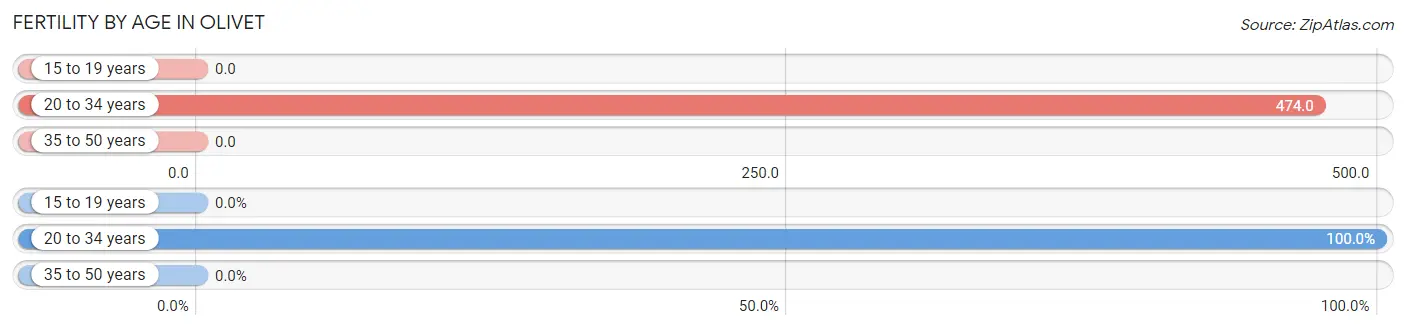
Fertility by Age in Olivet
Average fertility rate in Olivet is 176.0 births per 1,000 women. Women in the age bracket of 20 to 34 years have the highest fertility rate with 474.0 births per 1,000 women. Women in the age bracket of 20 to 34 years acount for 100.0% of all women with births.
| Age Bracket | Women with Births | Births / 1,000 Women |
| 15 to 19 years | 0 (0.0%) | 0.0 |
| 20 to 34 years | 65 (100.0%) | 474.0 |
| 35 to 50 years | 0 (0.0%) | 0.0 |
| Total | 65 (100.0%) | 176.0 |
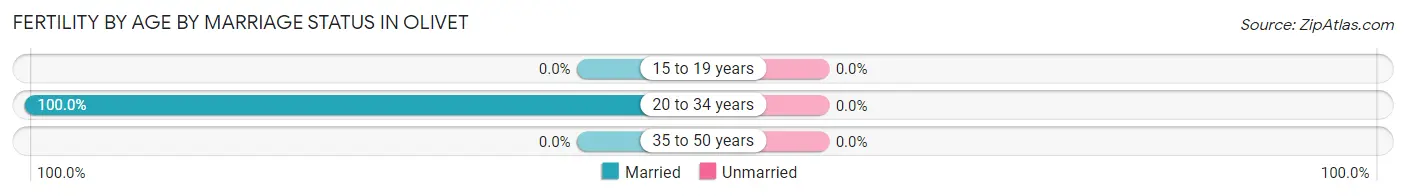
Fertility by Age by Marriage Status in Olivet
| Age Bracket | Married | Unmarried |
| 15 to 19 years | 0 (0.0%) | 0 (0.0%) |
| 20 to 34 years | 65 (100.0%) | 0 (0.0%) |
| 35 to 50 years | 0 (0.0%) | 0 (0.0%) |
| Total | 65 (100.0%) | 0 (0.0%) |
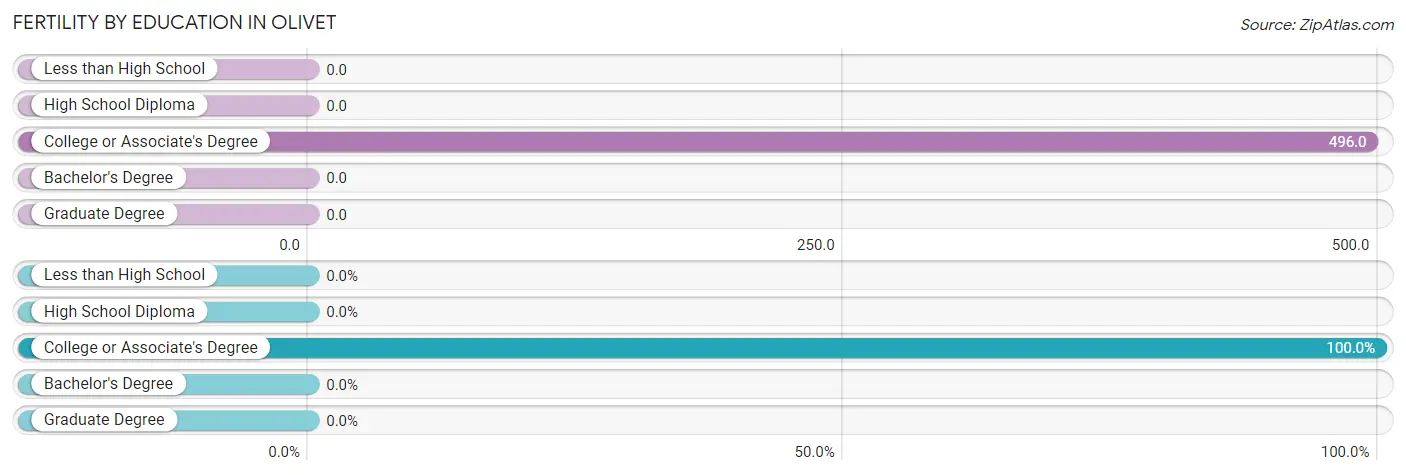
Fertility by Education in Olivet
| Educational Attainment | Women with Births | Births / 1,000 Women |
| Less than High School | 0 (0.0%) | 0.0 |
| High School Diploma | 0 (0.0%) | 0.0 |
| College or Associate's Degree | 65 (100.0%) | 496.0 |
| Bachelor's Degree | 0 (0.0%) | 0.0 |
| Graduate Degree | 0 (0.0%) | 0.0 |
| Total | 65 (100.0%) | 176.0 |
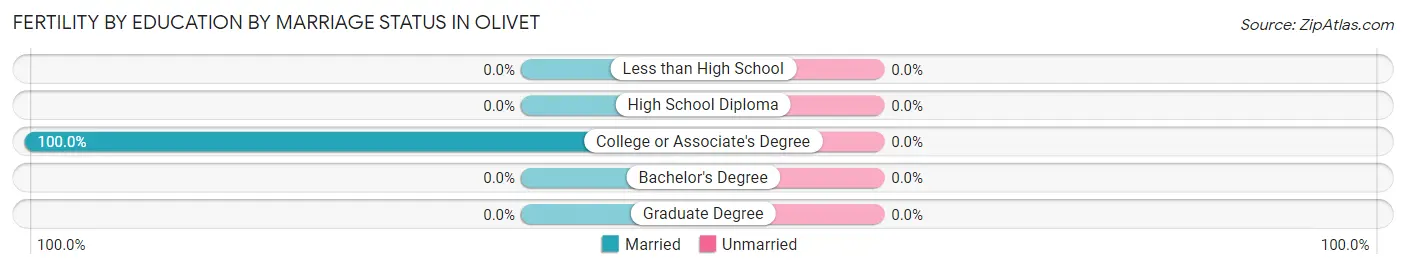
Fertility by Education by Marriage Status in Olivet
| Educational Attainment | Married | Unmarried |
| Less than High School | 0 (0.0%) | 0 (0.0%) |
| High School Diploma | 0 (0.0%) | 0 (0.0%) |
| College or Associate's Degree | 65 (100.0%) | 0 (0.0%) |
| Bachelor's Degree | 0 (0.0%) | 0 (0.0%) |
| Graduate Degree | 0 (0.0%) | 0 (0.0%) |
| Total | 65 (100.0%) | 0 (0.0%) |
Employment Characteristics in Olivet
Employment by Class of Employer in Olivet
Among the 655 employed individuals in Olivet, private company employees (405 | 61.8%), local government employees (100 | 15.3%), and state government employees (71 | 10.8%) make up the most common classes of employment.
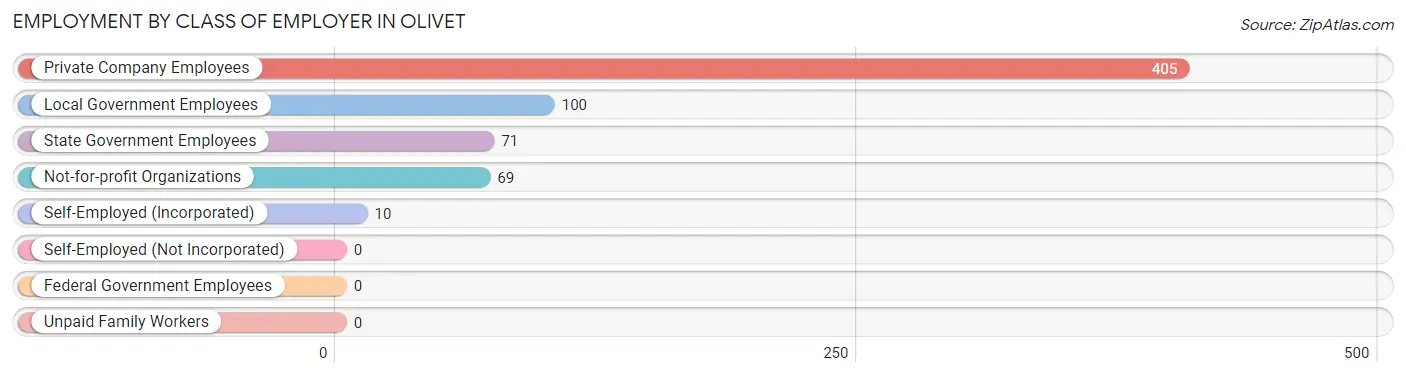
| Employer Class | # Employees | % Employees |
| Private Company Employees | 405 | 61.8% |
| Self-Employed (Incorporated) | 10 | 1.5% |
| Self-Employed (Not Incorporated) | 0 | 0.0% |
| Not-for-profit Organizations | 69 | 10.5% |
| Local Government Employees | 100 | 15.3% |
| State Government Employees | 71 | 10.8% |
| Federal Government Employees | 0 | 0.0% |
| Unpaid Family Workers | 0 | 0.0% |
| Total | 655 | 100.0% |
Employment Status by Age in Olivet
According to the labor force statistics for Olivet, out of the total population over 16 years of age (1,156), 74.0% or 855 individuals are in the labor force, with 6.8% or 58 of them unemployed. The age group with the highest labor force participation rate is 25 to 29 years, with 100.0% or 143 individuals in the labor force. Within the labor force, the 20 to 24 years age range has the highest percentage of unemployed individuals, with 32.5% or 13 of them being unemployed.
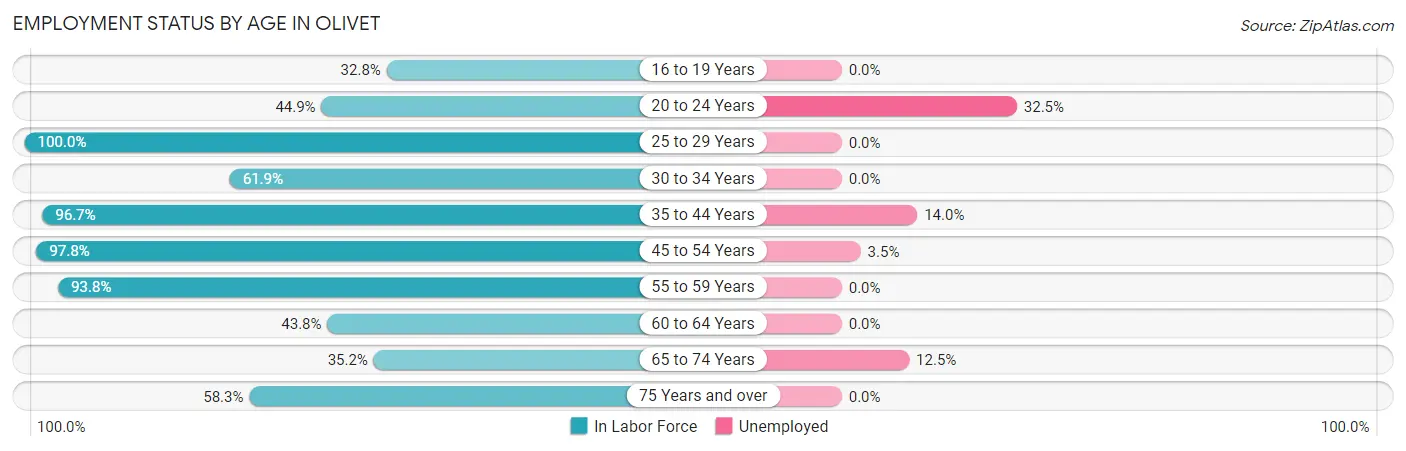
| Age Bracket | In Labor Force | Unemployed |
| 16 to 19 Years | 20 (32.8%) | 0 (0.0%) |
| 20 to 24 Years | 40 (44.9%) | 13 (32.5%) |
| 25 to 29 Years | 143 (100.0%) | 0 (0.0%) |
| 30 to 34 Years | 26 (61.9%) | 0 (0.0%) |
| 35 to 44 Years | 207 (96.7%) | 29 (14.0%) |
| 45 to 54 Years | 227 (97.8%) | 8 (3.5%) |
| 55 to 59 Years | 75 (93.8%) | 0 (0.0%) |
| 60 to 64 Years | 39 (43.8%) | 0 (0.0%) |
| 65 to 74 Years | 64 (35.2%) | 8 (12.5%) |
| 75 Years and over | 14 (58.3%) | 0 (0.0%) |
| Total | 855 (74.0%) | 58 (6.8%) |
Employment Status by Educational Attainment in Olivet
According to labor force statistics for Olivet, 89.6% of individuals (717) out of the total population between 25 and 64 years of age (800) are in the labor force, with 5.2% or 37 of them being unemployed. The group with the highest labor force participation rate are those with the educational attainment of college / associate degree, with 93.4% or 197 individuals in the labor force. Within the labor force, individuals with high school diploma education have the highest percentage of unemployment, with 11.0% or 37 of them being unemployed.
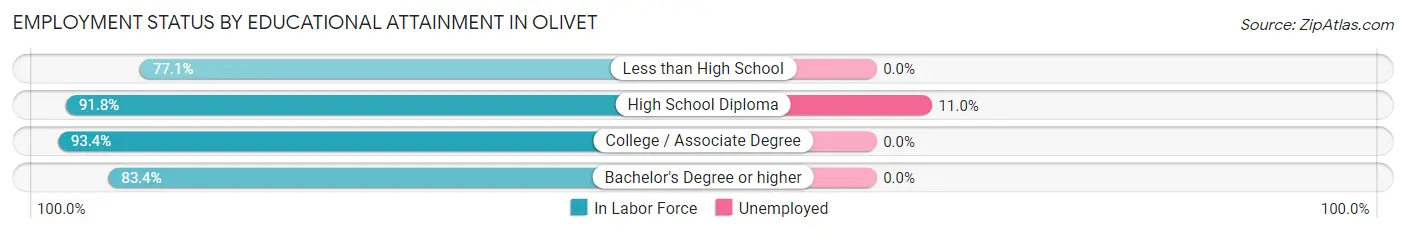
| Educational Attainment | In Labor Force | Unemployed |
| Less than High School | 27 (77.1%) | 0 (0.0%) |
| High School Diploma | 337 (91.8%) | 40 (11.0%) |
| College / Associate Degree | 197 (93.4%) | 0 (0.0%) |
| Bachelor's Degree or higher | 156 (83.4%) | 0 (0.0%) |
| Total | 717 (89.6%) | 42 (5.2%) |
Employment Occupations by Sex in Olivet
Management, Business, Science and Arts Occupations
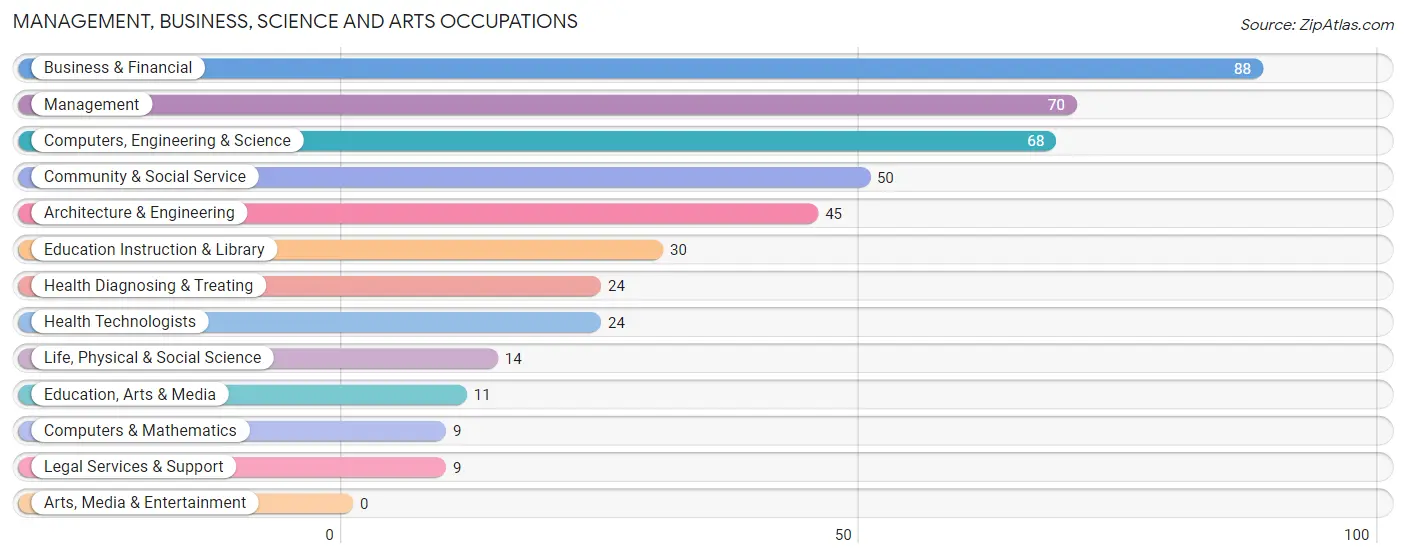
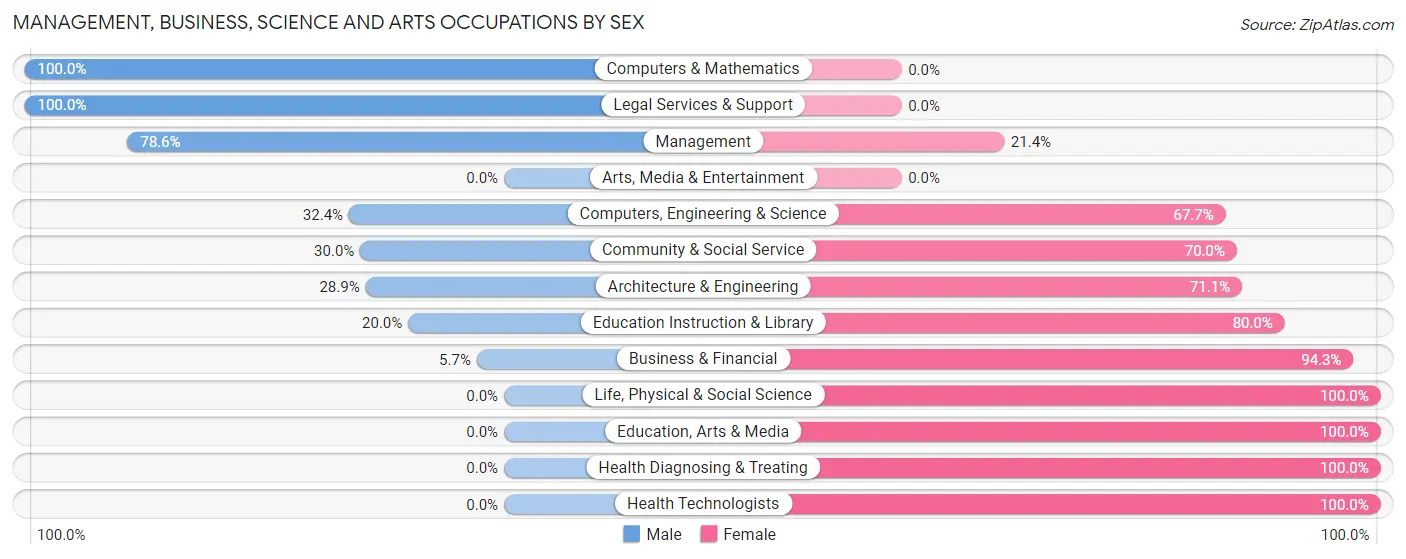
The most common Management, Business, Science and Arts occupations in Olivet are Business & Financial (88 | 11.0%), Management (70 | 8.8%), Computers, Engineering & Science (68 | 8.5%), Community & Social Service (50 | 6.3%), and Architecture & Engineering (45 | 5.7%).
Management, Business, Science and Arts Occupations by Sex
Within the Management, Business, Science and Arts occupations in Olivet, the most male-oriented occupations are Computers & Mathematics (100.0%), Legal Services & Support (100.0%), and Management (78.6%), while the most female-oriented occupations are Life, Physical & Social Science (100.0%), Education, Arts & Media (100.0%), and Health Diagnosing & Treating (100.0%).
| Occupation | Male | Female |
| Management | 55 (78.6%) | 15 (21.4%) |
| Business & Financial | 5 (5.7%) | 83 (94.3%) |
| Computers, Engineering & Science | 22 (32.4%) | 46 (67.6%) |
| Computers & Mathematics | 9 (100.0%) | 0 (0.0%) |
| Architecture & Engineering | 13 (28.9%) | 32 (71.1%) |
| Life, Physical & Social Science | 0 (0.0%) | 14 (100.0%) |
| Community & Social Service | 15 (30.0%) | 35 (70.0%) |
| Education, Arts & Media | 0 (0.0%) | 11 (100.0%) |
| Legal Services & Support | 9 (100.0%) | 0 (0.0%) |
| Education Instruction & Library | 6 (20.0%) | 24 (80.0%) |
| Arts, Media & Entertainment | 0 (0.0%) | 0 (0.0%) |
| Health Diagnosing & Treating | 0 (0.0%) | 24 (100.0%) |
| Health Technologists | 0 (0.0%) | 24 (100.0%) |
| Total (Category) | 97 (32.3%) | 203 (67.7%) |
| Total (Overall) | 413 (51.8%) | 384 (48.2%) |
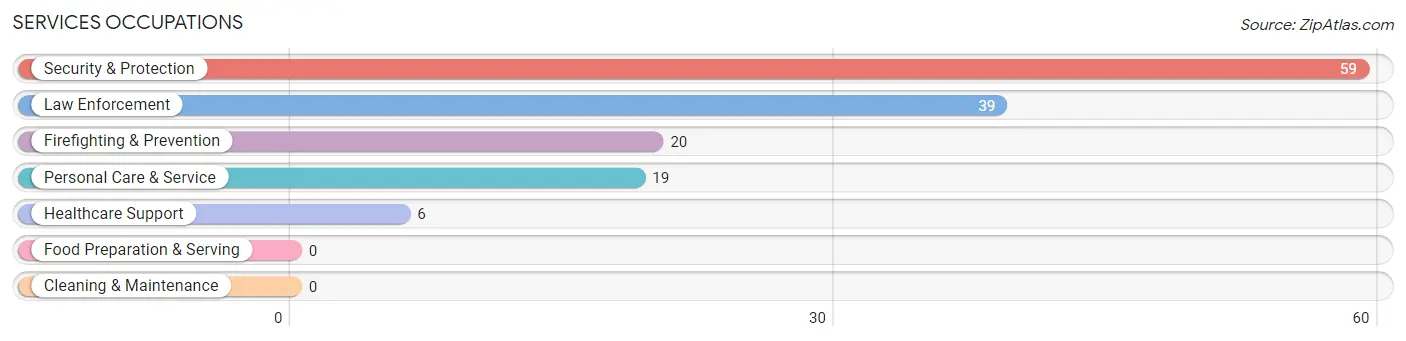
Services Occupations
The most common Services occupations in Olivet are Security & Protection (59 | 7.4%), Law Enforcement (39 | 4.9%), Firefighting & Prevention (20 | 2.5%), Personal Care & Service (19 | 2.4%), and Healthcare Support (6 | 0.7%).
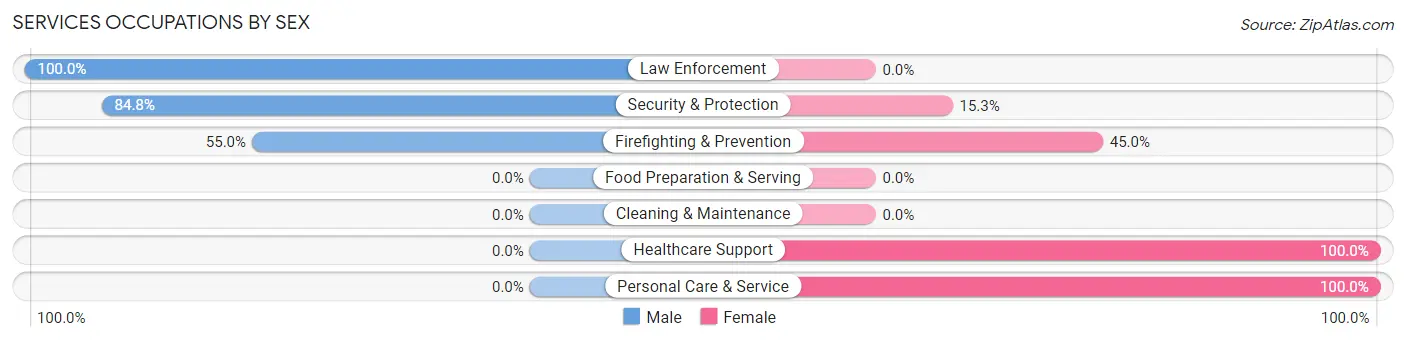
Services Occupations by Sex
Within the Services occupations in Olivet, the most male-oriented occupations are Law Enforcement (100.0%), Security & Protection (84.8%), and Firefighting & Prevention (55.0%), while the most female-oriented occupations are Healthcare Support (100.0%), Personal Care & Service (100.0%), and Firefighting & Prevention (45.0%).
| Occupation | Male | Female |
| Healthcare Support | 0 (0.0%) | 6 (100.0%) |
| Security & Protection | 50 (84.8%) | 9 (15.2%) |
| Firefighting & Prevention | 11 (55.0%) | 9 (45.0%) |
| Law Enforcement | 39 (100.0%) | 0 (0.0%) |
| Food Preparation & Serving | 0 (0.0%) | 0 (0.0%) |
| Cleaning & Maintenance | 0 (0.0%) | 0 (0.0%) |
| Personal Care & Service | 0 (0.0%) | 19 (100.0%) |
| Total (Category) | 50 (59.5%) | 34 (40.5%) |
| Total (Overall) | 413 (51.8%) | 384 (48.2%) |
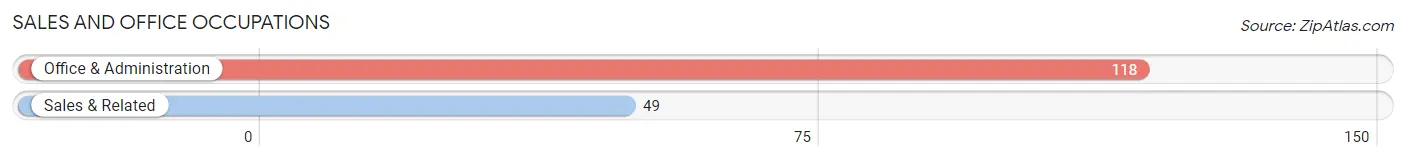
Sales and Office Occupations
The most common Sales and Office occupations in Olivet are Office & Administration (118 | 14.8%), and Sales & Related (49 | 6.1%).
Sales and Office Occupations by Sex
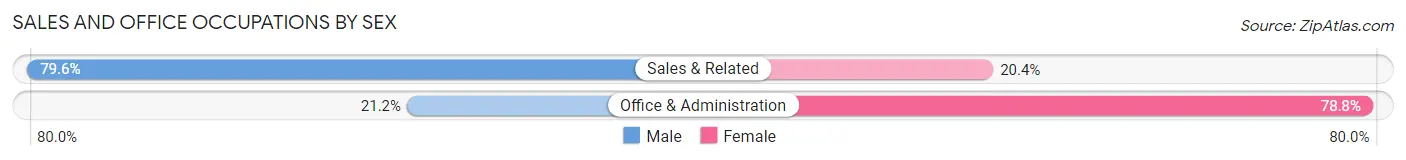
| Occupation | Male | Female |
| Sales & Related | 39 (79.6%) | 10 (20.4%) |
| Office & Administration | 25 (21.2%) | 93 (78.8%) |
| Total (Category) | 64 (38.3%) | 103 (61.7%) |
| Total (Overall) | 413 (51.8%) | 384 (48.2%) |
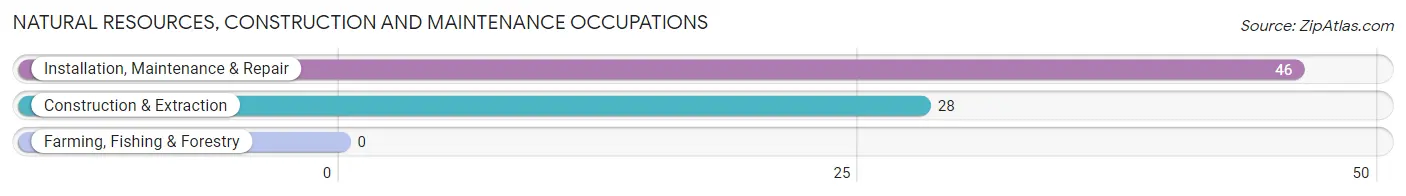
Natural Resources, Construction and Maintenance Occupations
The most common Natural Resources, Construction and Maintenance occupations in Olivet are Installation, Maintenance & Repair (46 | 5.8%), and Construction & Extraction (28 | 3.5%).
Natural Resources, Construction and Maintenance Occupations by Sex
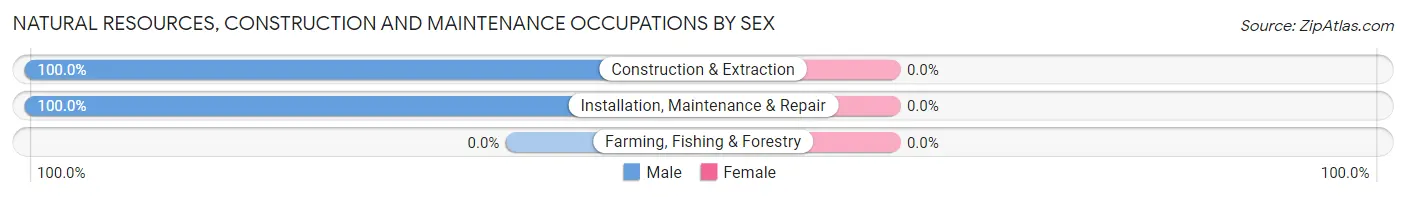
| Occupation | Male | Female |
| Farming, Fishing & Forestry | 0 (0.0%) | 0 (0.0%) |
| Construction & Extraction | 28 (100.0%) | 0 (0.0%) |
| Installation, Maintenance & Repair | 46 (100.0%) | 0 (0.0%) |
| Total (Category) | 74 (100.0%) | 0 (0.0%) |
| Total (Overall) | 413 (51.8%) | 384 (48.2%) |
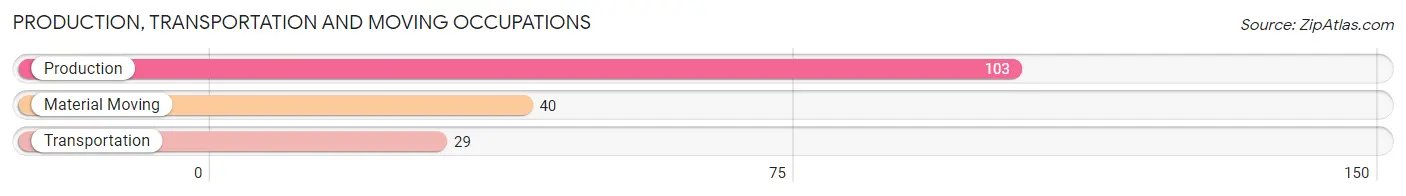
Production, Transportation and Moving Occupations
The most common Production, Transportation and Moving occupations in Olivet are Production (103 | 12.9%), Material Moving (40 | 5.0%), and Transportation (29 | 3.6%).
Production, Transportation and Moving Occupations by Sex
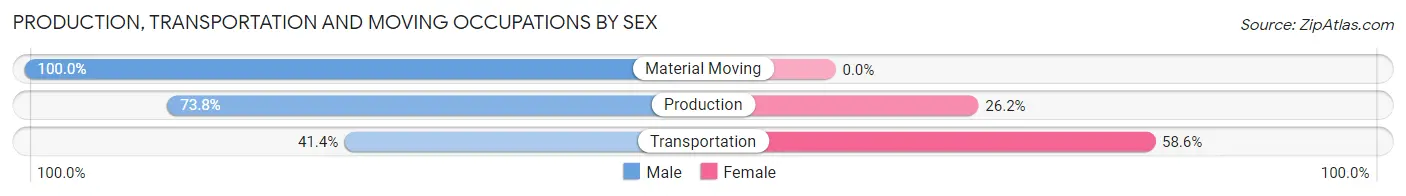
| Occupation | Male | Female |
| Production | 76 (73.8%) | 27 (26.2%) |
| Transportation | 12 (41.4%) | 17 (58.6%) |
| Material Moving | 40 (100.0%) | 0 (0.0%) |
| Total (Category) | 128 (74.4%) | 44 (25.6%) |
| Total (Overall) | 413 (51.8%) | 384 (48.2%) |
Employment Industries by Sex in Olivet
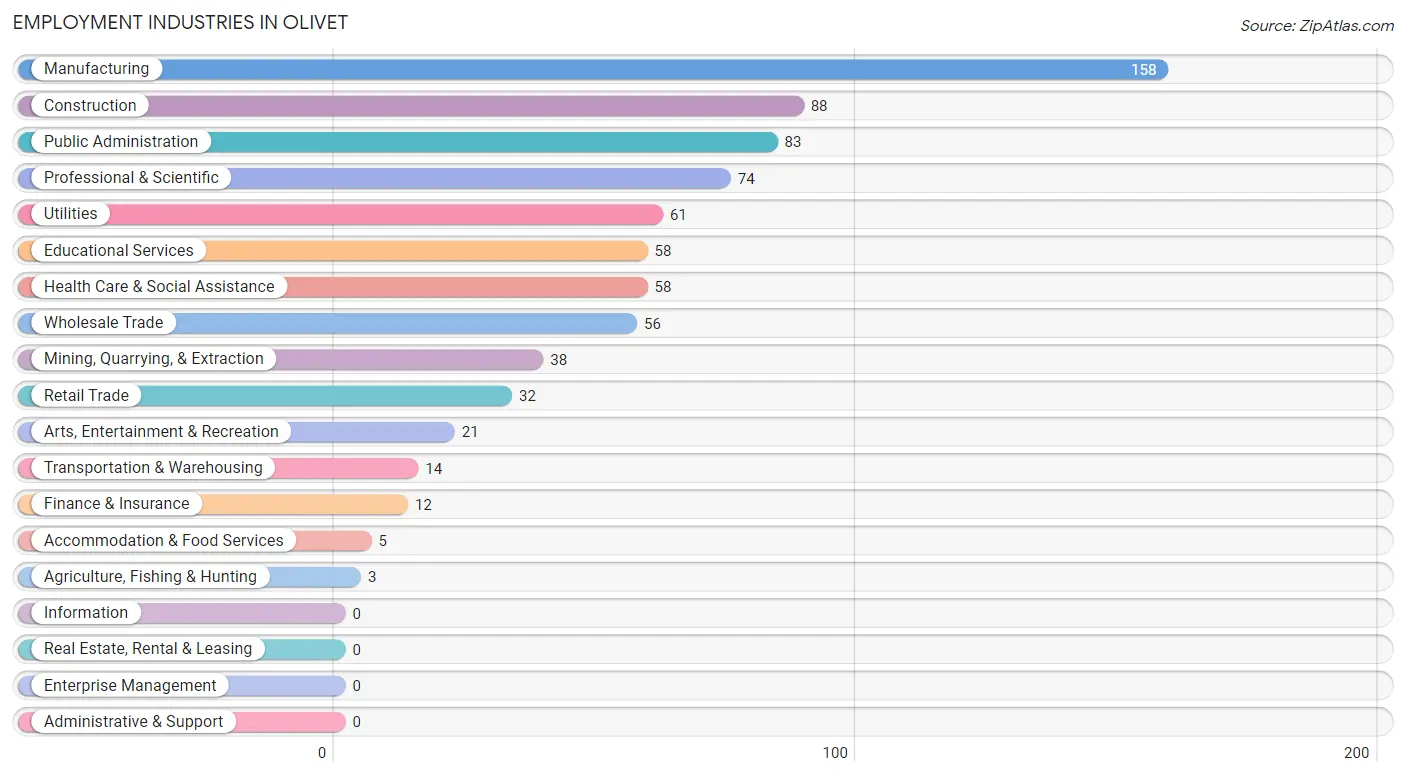
Employment Industries in Olivet
The major employment industries in Olivet include Manufacturing (158 | 19.8%), Construction (88 | 11.0%), Public Administration (83 | 10.4%), Professional & Scientific (74 | 9.3%), and Utilities (61 | 7.6%).
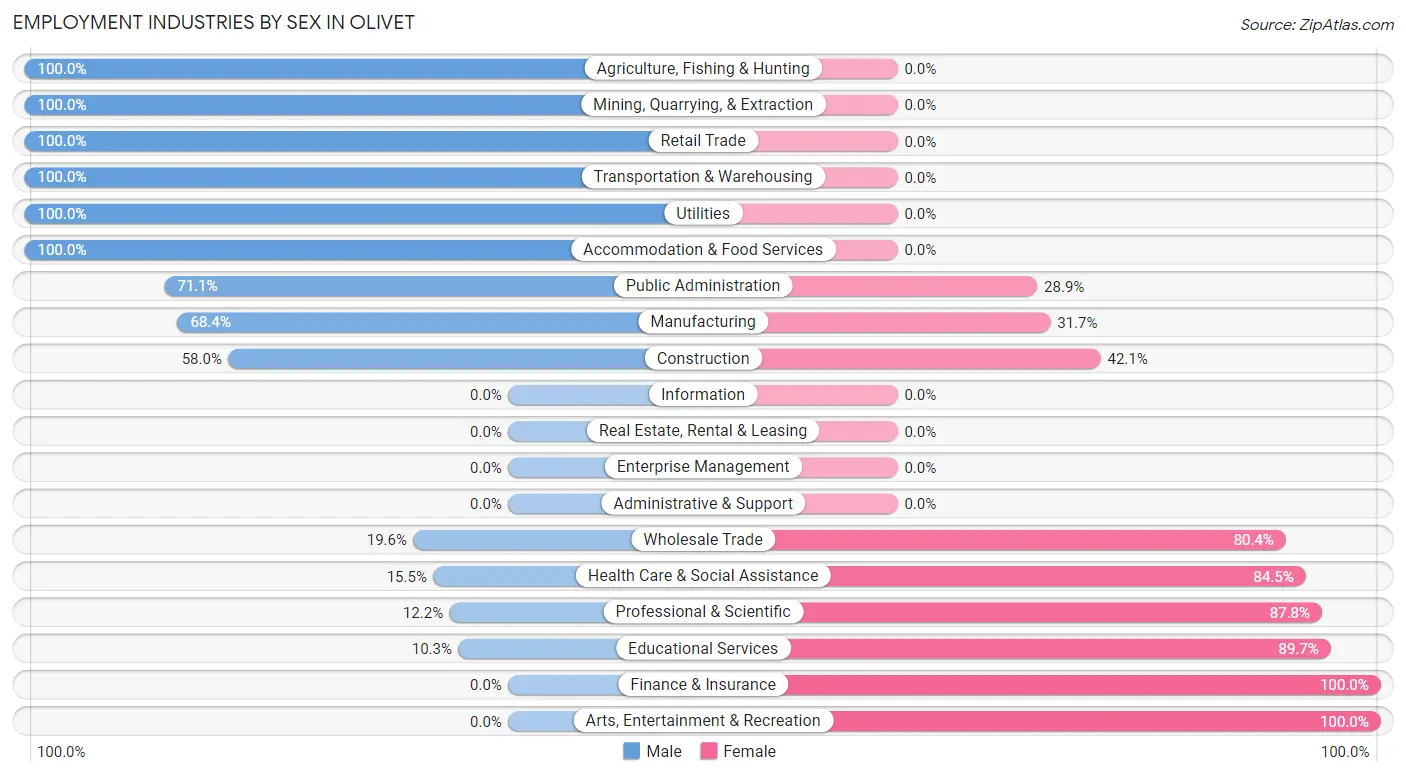
Employment Industries by Sex in Olivet
The Olivet industries that see more men than women are Agriculture, Fishing & Hunting (100.0%), Mining, Quarrying, & Extraction (100.0%), and Retail Trade (100.0%), whereas the industries that tend to have a higher number of women are Finance & Insurance (100.0%), Arts, Entertainment & Recreation (100.0%), and Educational Services (89.7%).
| Industry | Male | Female |
| Agriculture, Fishing & Hunting | 3 (100.0%) | 0 (0.0%) |
| Mining, Quarrying, & Extraction | 38 (100.0%) | 0 (0.0%) |
| Construction | 51 (58.0%) | 37 (42.0%) |
| Manufacturing | 108 (68.3%) | 50 (31.7%) |
| Wholesale Trade | 11 (19.6%) | 45 (80.4%) |
| Retail Trade | 32 (100.0%) | 0 (0.0%) |
| Transportation & Warehousing | 14 (100.0%) | 0 (0.0%) |
| Utilities | 61 (100.0%) | 0 (0.0%) |
| Information | 0 (0.0%) | 0 (0.0%) |
| Finance & Insurance | 0 (0.0%) | 12 (100.0%) |
| Real Estate, Rental & Leasing | 0 (0.0%) | 0 (0.0%) |
| Professional & Scientific | 9 (12.2%) | 65 (87.8%) |
| Enterprise Management | 0 (0.0%) | 0 (0.0%) |
| Administrative & Support | 0 (0.0%) | 0 (0.0%) |
| Educational Services | 6 (10.3%) | 52 (89.7%) |
| Health Care & Social Assistance | 9 (15.5%) | 49 (84.5%) |
| Arts, Entertainment & Recreation | 0 (0.0%) | 21 (100.0%) |
| Accommodation & Food Services | 5 (100.0%) | 0 (0.0%) |
| Public Administration | 59 (71.1%) | 24 (28.9%) |
| Total | 413 (51.8%) | 384 (48.2%) |
Education in Olivet
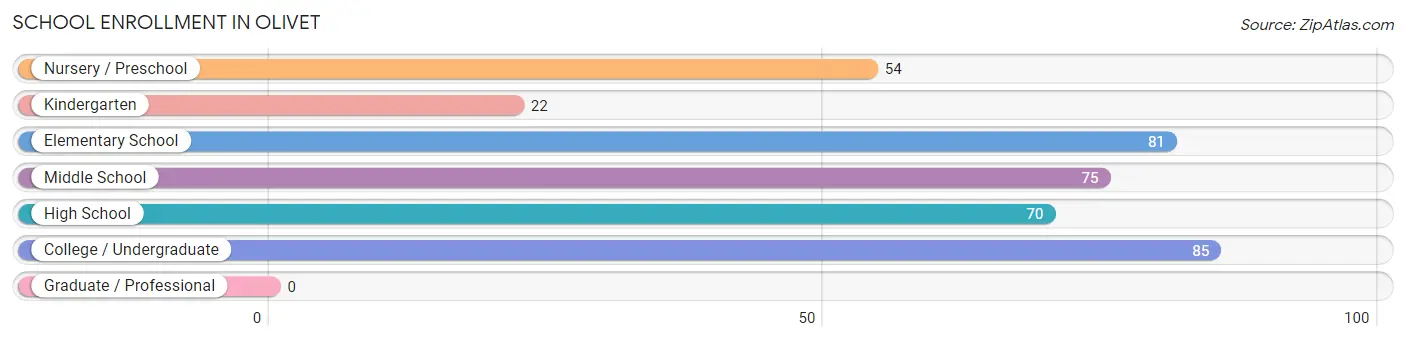
School Enrollment in Olivet
The most common levels of schooling among the 387 students in Olivet are college / undergraduate (85 | 22.0%), elementary school (81 | 20.9%), and middle school (75 | 19.4%).
| School Level | # Students | % Students |
| Nursery / Preschool | 54 | 14.0% |
| Kindergarten | 22 | 5.7% |
| Elementary School | 81 | 20.9% |
| Middle School | 75 | 19.4% |
| High School | 70 | 18.1% |
| College / Undergraduate | 85 | 22.0% |
| Graduate / Professional | 0 | 0.0% |
| Total | 387 | 100.0% |
School Enrollment by Age by Funding Source in Olivet
Out of a total of 387 students who are enrolled in schools in Olivet, 9 (2.3%) attend a private institution, while the remaining 378 (97.7%) are enrolled in public schools. The age group of 18 to 19 year olds has the highest likelihood of being enrolled in private schools, with 6 (50.0% in the age bracket) enrolled. Conversely, the age group of 3 to 4 year olds has the lowest likelihood of being enrolled in a private school, with 41 (100.0% in the age bracket) attending a public institution.
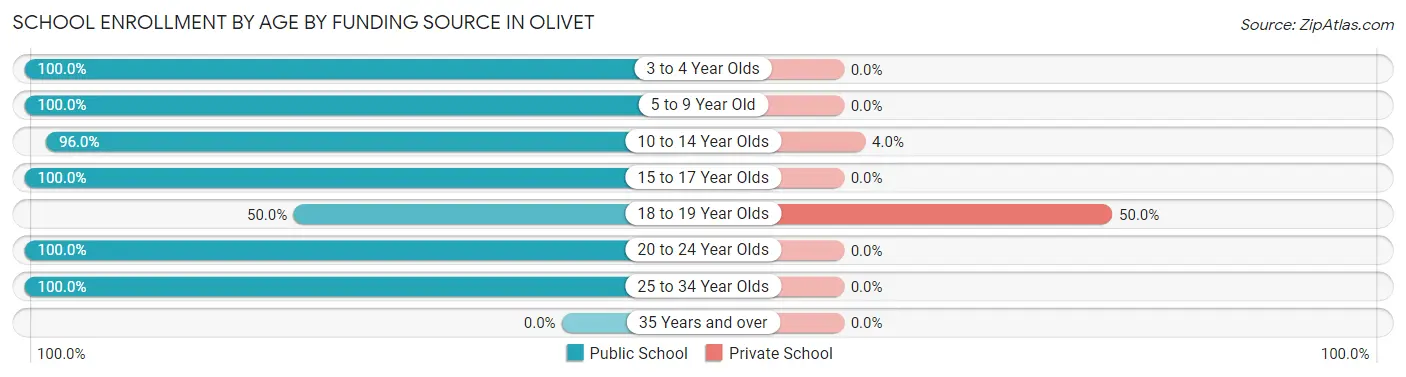
| Age Bracket | Public School | Private School |
| 3 to 4 Year Olds | 41 (100.0%) | 0 (0.0%) |
| 5 to 9 Year Old | 116 (100.0%) | 0 (0.0%) |
| 10 to 14 Year Olds | 72 (96.0%) | 3 (4.0%) |
| 15 to 17 Year Olds | 59 (100.0%) | 0 (0.0%) |
| 18 to 19 Year Olds | 6 (50.0%) | 6 (50.0%) |
| 20 to 24 Year Olds | 60 (100.0%) | 0 (0.0%) |
| 25 to 34 Year Olds | 24 (100.0%) | 0 (0.0%) |
| 35 Years and over | 0 (0.0%) | 0 (0.0%) |
| Total | 378 (97.7%) | 9 (2.3%) |
Educational Attainment by Field of Study in Olivet
Education (113 | 34.7%), business (73 | 22.4%), science & technology (50 | 15.3%), social sciences (26 | 8.0%), and literature & languages (21 | 6.4%) are the most common fields of study among 326 individuals in Olivet who have obtained a bachelor's degree or higher.
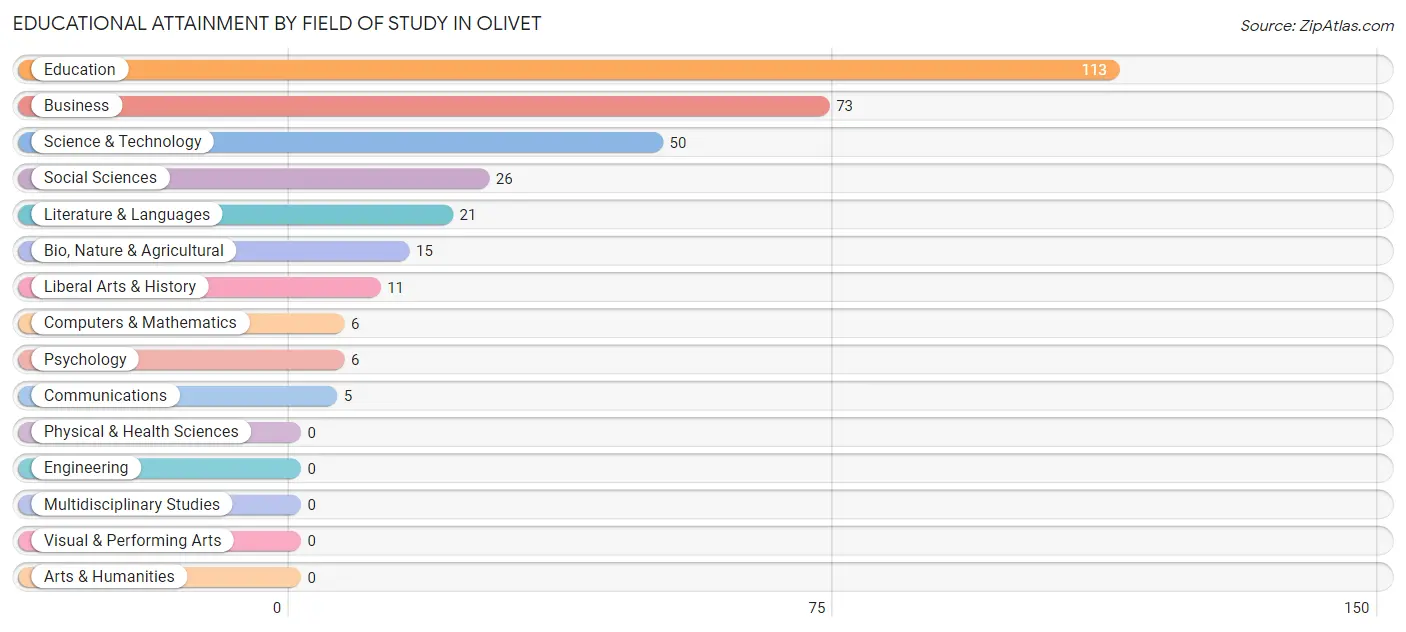
| Field of Study | # Graduates | % Graduates |
| Computers & Mathematics | 6 | 1.8% |
| Bio, Nature & Agricultural | 15 | 4.6% |
| Physical & Health Sciences | 0 | 0.0% |
| Psychology | 6 | 1.8% |
| Social Sciences | 26 | 8.0% |
| Engineering | 0 | 0.0% |
| Multidisciplinary Studies | 0 | 0.0% |
| Science & Technology | 50 | 15.3% |
| Business | 73 | 22.4% |
| Education | 113 | 34.7% |
| Literature & Languages | 21 | 6.4% |
| Liberal Arts & History | 11 | 3.4% |
| Visual & Performing Arts | 0 | 0.0% |
| Communications | 5 | 1.5% |
| Arts & Humanities | 0 | 0.0% |
| Total | 326 | 100.0% |
Transportation & Commute in Olivet
Vehicle Availability by Sex in Olivet
The most prevalent vehicle ownership categories in Olivet are males with 4 vehicles (132, accounting for 35.9%) and females with 4 vehicles (91, making up 46.0%).
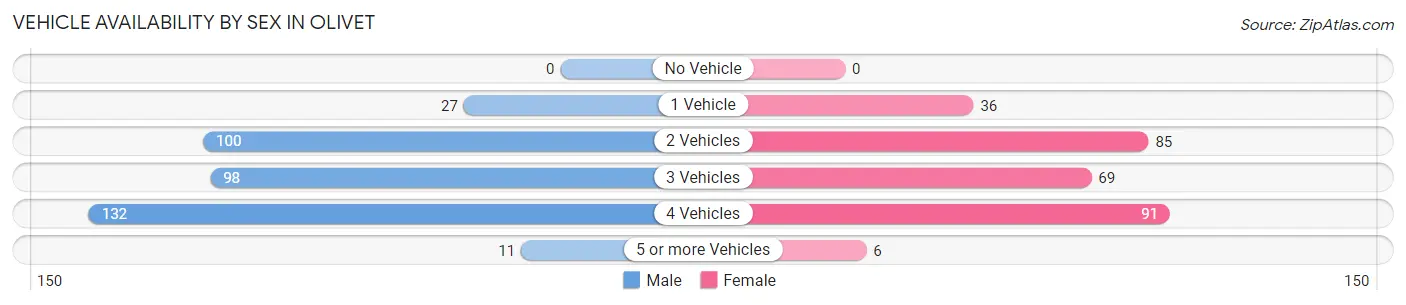
| Vehicles Available | Male | Female |
| No Vehicle | 0 (0.0%) | 0 (0.0%) |
| 1 Vehicle | 27 (7.3%) | 36 (12.5%) |
| 2 Vehicles | 100 (27.2%) | 85 (29.6%) |
| 3 Vehicles | 98 (26.6%) | 69 (24.0%) |
| 4 Vehicles | 132 (35.9%) | 91 (31.7%) |
| 5 or more Vehicles | 11 (3.0%) | 6 (2.1%) |
| Total | 368 (100.0%) | 287 (100.0%) |
Commute Time in Olivet
The most frequently occuring commute durations in Olivet are 30 to 34 minutes (151 commuters, 23.7%), 15 to 19 minutes (128 commuters, 20.1%), and 20 to 24 minutes (125 commuters, 19.7%).
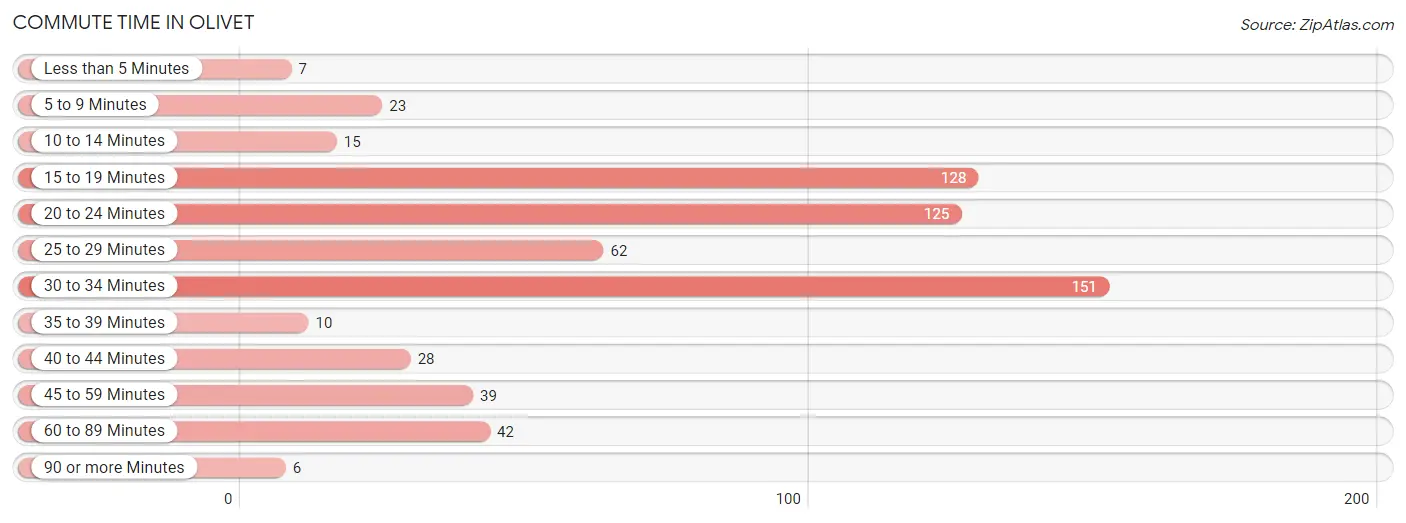
| Commute Time | # Commuters | % Commuters |
| Less than 5 Minutes | 7 | 1.1% |
| 5 to 9 Minutes | 23 | 3.6% |
| 10 to 14 Minutes | 15 | 2.4% |
| 15 to 19 Minutes | 128 | 20.1% |
| 20 to 24 Minutes | 125 | 19.7% |
| 25 to 29 Minutes | 62 | 9.8% |
| 30 to 34 Minutes | 151 | 23.7% |
| 35 to 39 Minutes | 10 | 1.6% |
| 40 to 44 Minutes | 28 | 4.4% |
| 45 to 59 Minutes | 39 | 6.1% |
| 60 to 89 Minutes | 42 | 6.6% |
| 90 or more Minutes | 6 | 0.9% |
Commute Time by Sex in Olivet
The most common commute times in Olivet are 30 to 34 minutes (91 commuters, 26.1%) for males and 20 to 24 minutes (87 commuters, 30.3%) for females.
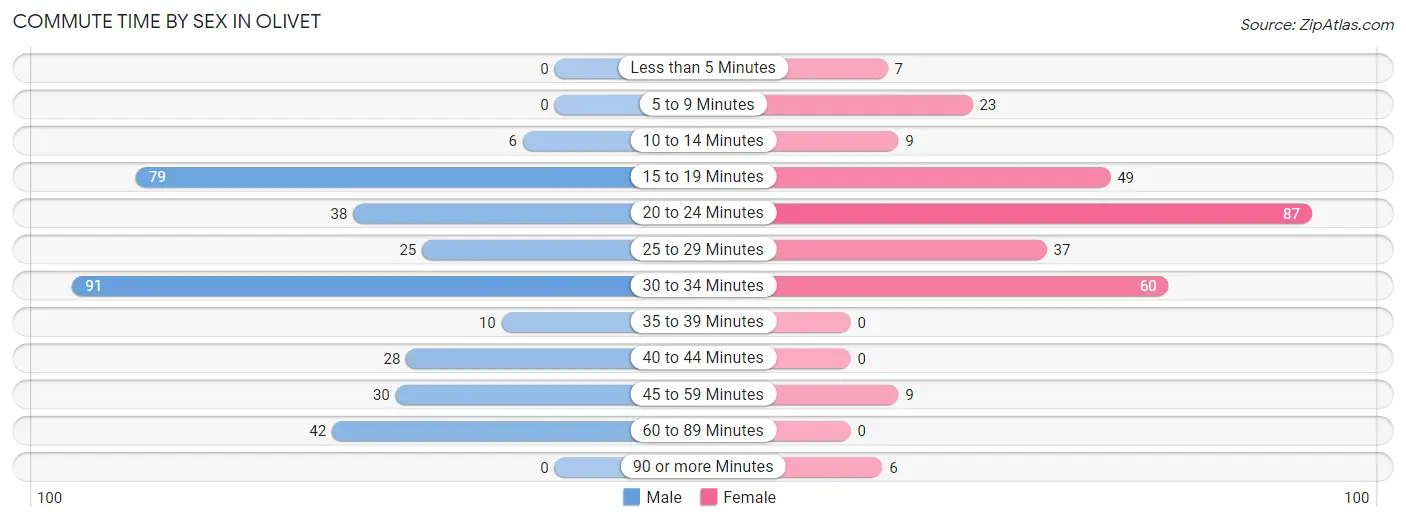
| Commute Time | Male | Female |
| Less than 5 Minutes | 0 (0.0%) | 7 (2.4%) |
| 5 to 9 Minutes | 0 (0.0%) | 23 (8.0%) |
| 10 to 14 Minutes | 6 (1.7%) | 9 (3.1%) |
| 15 to 19 Minutes | 79 (22.6%) | 49 (17.1%) |
| 20 to 24 Minutes | 38 (10.9%) | 87 (30.3%) |
| 25 to 29 Minutes | 25 (7.2%) | 37 (12.9%) |
| 30 to 34 Minutes | 91 (26.1%) | 60 (20.9%) |
| 35 to 39 Minutes | 10 (2.9%) | 0 (0.0%) |
| 40 to 44 Minutes | 28 (8.0%) | 0 (0.0%) |
| 45 to 59 Minutes | 30 (8.6%) | 9 (3.1%) |
| 60 to 89 Minutes | 42 (12.0%) | 0 (0.0%) |
| 90 or more Minutes | 0 (0.0%) | 6 (2.1%) |
Time of Departure to Work by Sex in Olivet
The most frequent times of departure to work in Olivet are 12:00 PM to 3:59 PM (59, 16.9%) for males and 7:30 AM to 7:59 AM (59, 20.6%) for females.
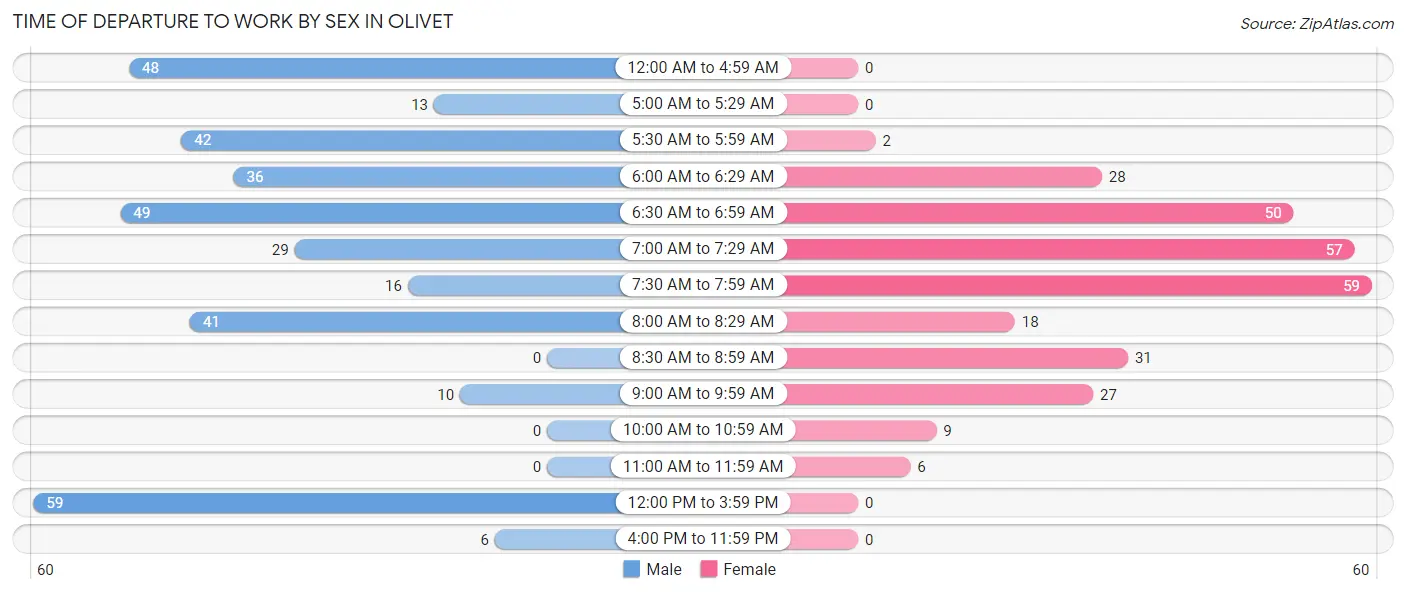
| Time of Departure | Male | Female |
| 12:00 AM to 4:59 AM | 48 (13.8%) | 0 (0.0%) |
| 5:00 AM to 5:29 AM | 13 (3.7%) | 0 (0.0%) |
| 5:30 AM to 5:59 AM | 42 (12.0%) | 2 (0.7%) |
| 6:00 AM to 6:29 AM | 36 (10.3%) | 28 (9.8%) |
| 6:30 AM to 6:59 AM | 49 (14.0%) | 50 (17.4%) |
| 7:00 AM to 7:29 AM | 29 (8.3%) | 57 (19.9%) |
| 7:30 AM to 7:59 AM | 16 (4.6%) | 59 (20.6%) |
| 8:00 AM to 8:29 AM | 41 (11.7%) | 18 (6.3%) |
| 8:30 AM to 8:59 AM | 0 (0.0%) | 31 (10.8%) |
| 9:00 AM to 9:59 AM | 10 (2.9%) | 27 (9.4%) |
| 10:00 AM to 10:59 AM | 0 (0.0%) | 9 (3.1%) |
| 11:00 AM to 11:59 AM | 0 (0.0%) | 6 (2.1%) |
| 12:00 PM to 3:59 PM | 59 (16.9%) | 0 (0.0%) |
| 4:00 PM to 11:59 PM | 6 (1.7%) | 0 (0.0%) |
| Total | 349 (100.0%) | 287 (100.0%) |
Housing Occupancy in Olivet
Occupancy by Ownership in Olivet
Of the total 501 dwellings in Olivet, owner-occupied units account for 491 (98.0%), while renter-occupied units make up 10 (2.0%).
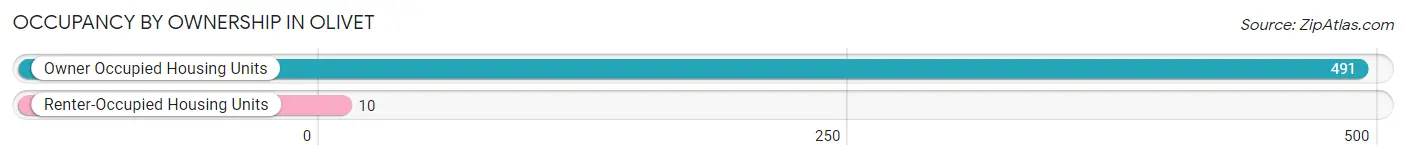
| Occupancy | # Housing Units | % Housing Units |
| Owner Occupied Housing Units | 491 | 98.0% |
| Renter-Occupied Housing Units | 10 | 2.0% |
| Total Occupied Housing Units | 501 | 100.0% |
Occupancy by Household Size in Olivet
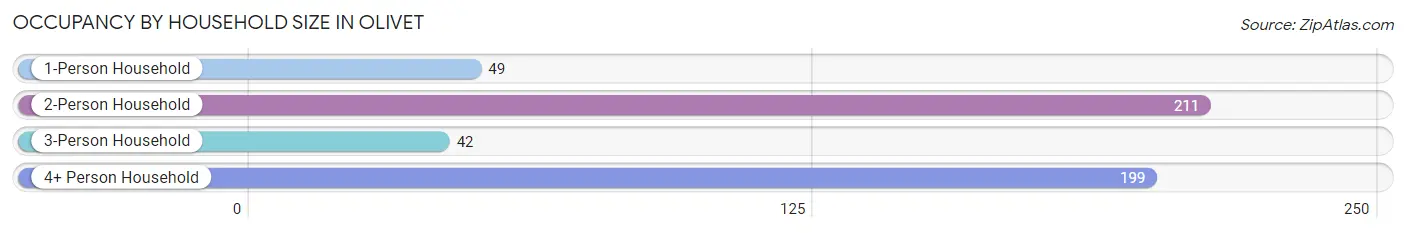
| Household Size | # Housing Units | % Housing Units |
| 1-Person Household | 49 | 9.8% |
| 2-Person Household | 211 | 42.1% |
| 3-Person Household | 42 | 8.4% |
| 4+ Person Household | 199 | 39.7% |
| Total Housing Units | 501 | 100.0% |
Occupancy by Ownership by Household Size in Olivet
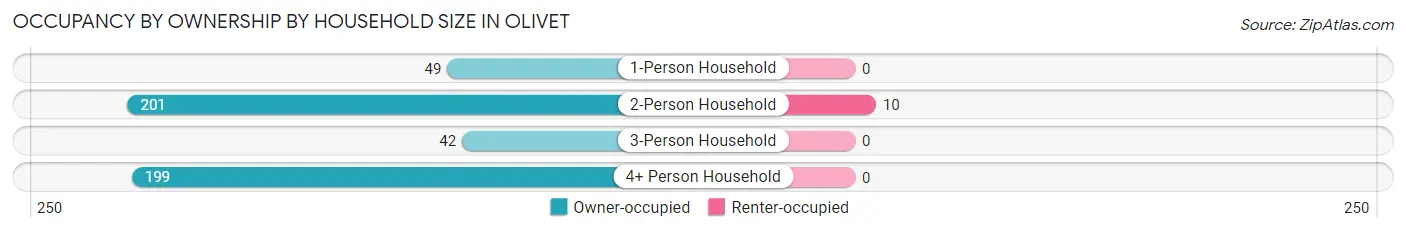
| Household Size | Owner-occupied | Renter-occupied |
| 1-Person Household | 49 (100.0%) | 0 (0.0%) |
| 2-Person Household | 201 (95.3%) | 10 (4.7%) |
| 3-Person Household | 42 (100.0%) | 0 (0.0%) |
| 4+ Person Household | 199 (100.0%) | 0 (0.0%) |
| Total Housing Units | 491 (98.0%) | 10 (2.0%) |
Occupancy by Educational Attainment in Olivet
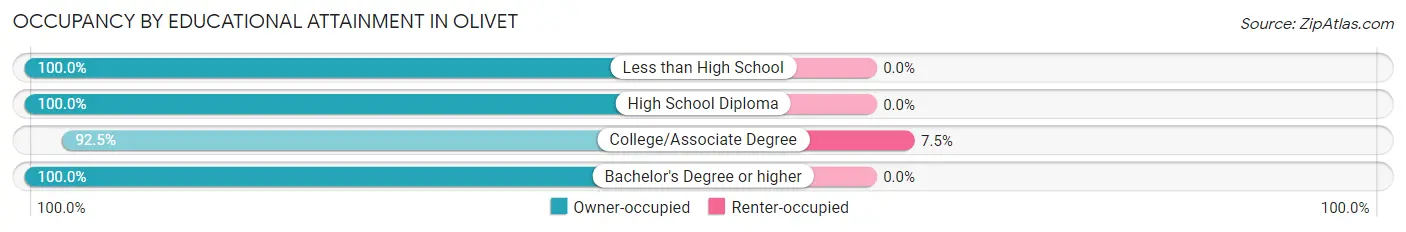
| Household Size | Owner-occupied | Renter-occupied |
| Less than High School | 8 (100.0%) | 0 (0.0%) |
| High School Diploma | 183 (100.0%) | 0 (0.0%) |
| College/Associate Degree | 123 (92.5%) | 10 (7.5%) |
| Bachelor's Degree or higher | 177 (100.0%) | 0 (0.0%) |
Occupancy by Age of Householder in Olivet
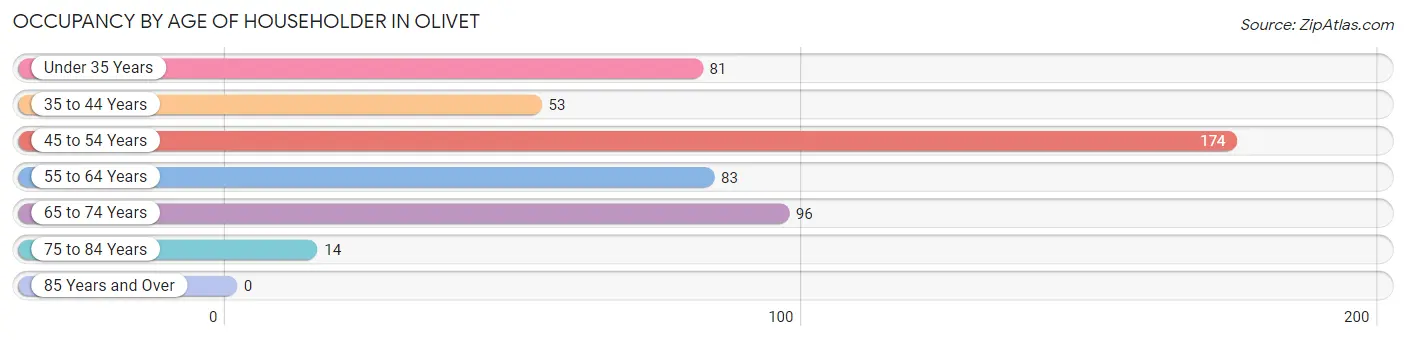
| Age Bracket | # Households | % Households |
| Under 35 Years | 81 | 16.2% |
| 35 to 44 Years | 53 | 10.6% |
| 45 to 54 Years | 174 | 34.7% |
| 55 to 64 Years | 83 | 16.6% |
| 65 to 74 Years | 96 | 19.2% |
| 75 to 84 Years | 14 | 2.8% |
| 85 Years and Over | 0 | 0.0% |
| Total | 501 | 100.0% |
Housing Finances in Olivet
Median Income by Occupancy in Olivet
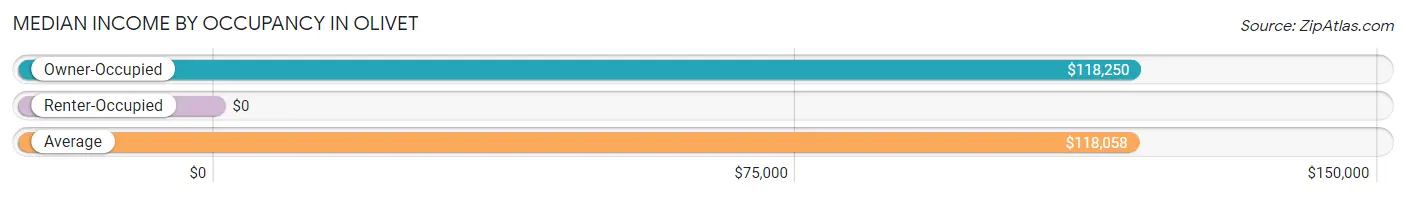
| Occupancy Type | # Households | Median Income |
| Owner-Occupied | 491 (98.0%) | $118,250 |
| Renter-Occupied | 10 (2.0%) | $0 |
| Average | 501 (100.0%) | $118,058 |
Occupancy by Householder Income Bracket in Olivet
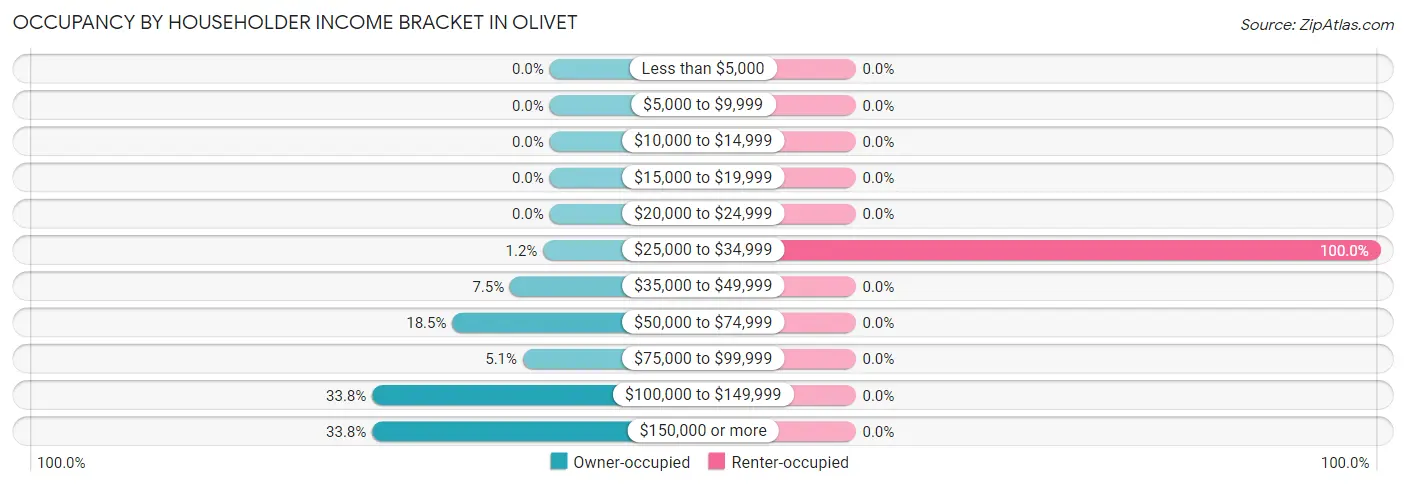
| Income Bracket | Owner-occupied | Renter-occupied |
| Less than $5,000 | 0 (0.0%) | 0 (0.0%) |
| $5,000 to $9,999 | 0 (0.0%) | 0 (0.0%) |
| $10,000 to $14,999 | 0 (0.0%) | 0 (0.0%) |
| $15,000 to $19,999 | 0 (0.0%) | 0 (0.0%) |
| $20,000 to $24,999 | 0 (0.0%) | 0 (0.0%) |
| $25,000 to $34,999 | 6 (1.2%) | 10 (100.0%) |
| $35,000 to $49,999 | 37 (7.5%) | 0 (0.0%) |
| $50,000 to $74,999 | 91 (18.5%) | 0 (0.0%) |
| $75,000 to $99,999 | 25 (5.1%) | 0 (0.0%) |
| $100,000 to $149,999 | 166 (33.8%) | 0 (0.0%) |
| $150,000 or more | 166 (33.8%) | 0 (0.0%) |
| Total | 491 (100.0%) | 10 (100.0%) |
Monthly Housing Cost Tiers in Olivet
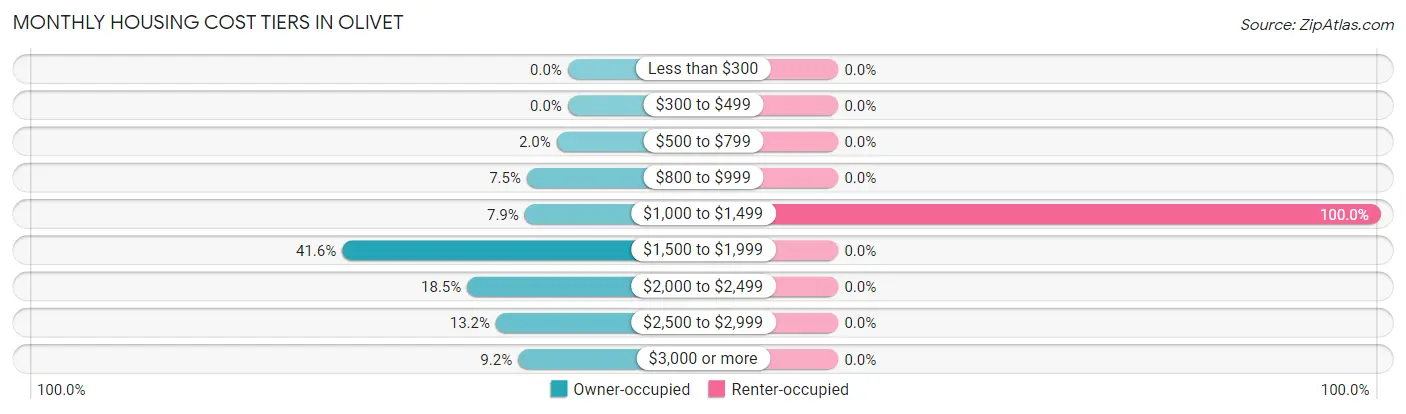
| Monthly Cost | Owner-occupied | Renter-occupied |
| Less than $300 | 0 (0.0%) | 0 (0.0%) |
| $300 to $499 | 0 (0.0%) | 0 (0.0%) |
| $500 to $799 | 10 (2.0%) | 0 (0.0%) |
| $800 to $999 | 37 (7.5%) | 0 (0.0%) |
| $1,000 to $1,499 | 39 (7.9%) | 10 (100.0%) |
| $1,500 to $1,999 | 204 (41.5%) | 0 (0.0%) |
| $2,000 to $2,499 | 91 (18.5%) | 0 (0.0%) |
| $2,500 to $2,999 | 65 (13.2%) | 0 (0.0%) |
| $3,000 or more | 45 (9.2%) | 0 (0.0%) |
| Total | 491 (100.0%) | 10 (100.0%) |
Physical Housing Characteristics in Olivet
Housing Structures in Olivet
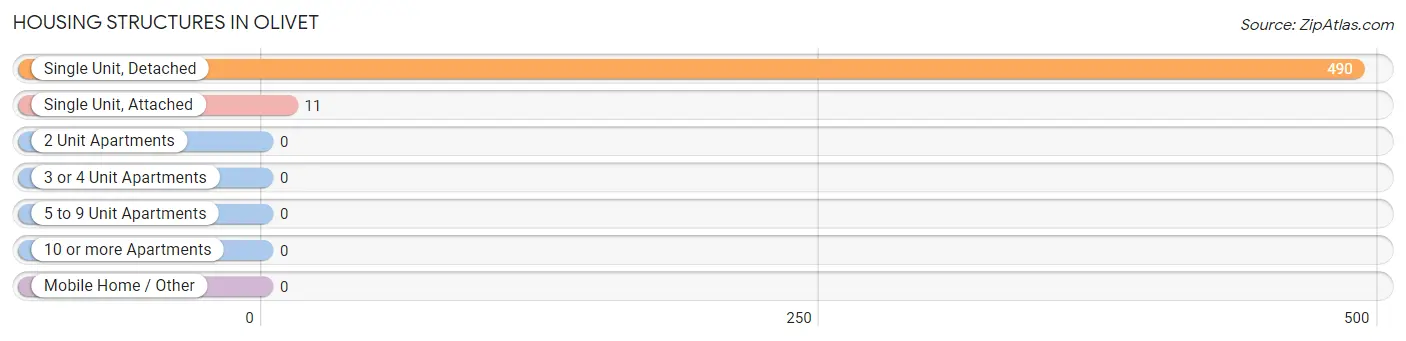
| Structure Type | # Housing Units | % Housing Units |
| Single Unit, Detached | 490 | 97.8% |
| Single Unit, Attached | 11 | 2.2% |
| 2 Unit Apartments | 0 | 0.0% |
| 3 or 4 Unit Apartments | 0 | 0.0% |
| 5 to 9 Unit Apartments | 0 | 0.0% |
| 10 or more Apartments | 0 | 0.0% |
| Mobile Home / Other | 0 | 0.0% |
| Total | 501 | 100.0% |
Housing Structures by Occupancy in Olivet
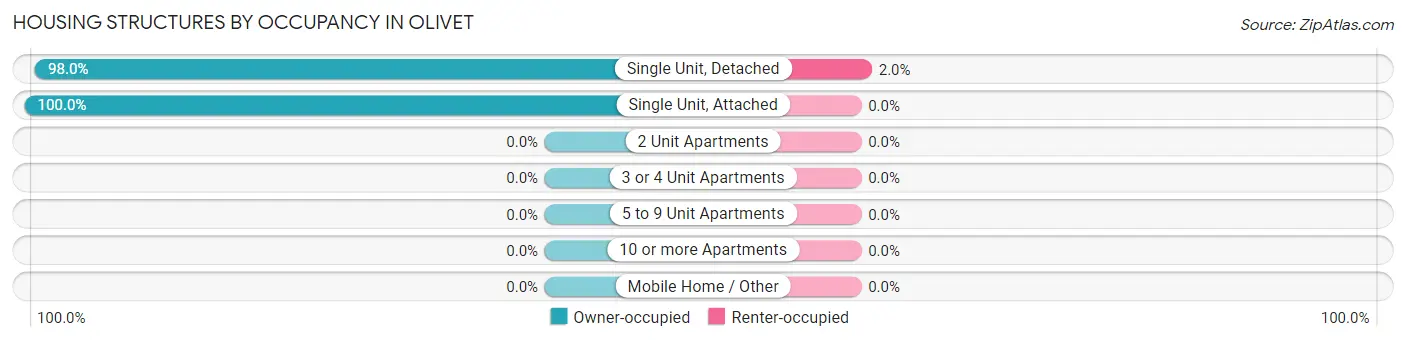
| Structure Type | Owner-occupied | Renter-occupied |
| Single Unit, Detached | 480 (98.0%) | 10 (2.0%) |
| Single Unit, Attached | 11 (100.0%) | 0 (0.0%) |
| 2 Unit Apartments | 0 (0.0%) | 0 (0.0%) |
| 3 or 4 Unit Apartments | 0 (0.0%) | 0 (0.0%) |
| 5 to 9 Unit Apartments | 0 (0.0%) | 0 (0.0%) |
| 10 or more Apartments | 0 (0.0%) | 0 (0.0%) |
| Mobile Home / Other | 0 (0.0%) | 0 (0.0%) |
| Total | 491 (98.0%) | 10 (2.0%) |
Housing Structures by Number of Rooms in Olivet
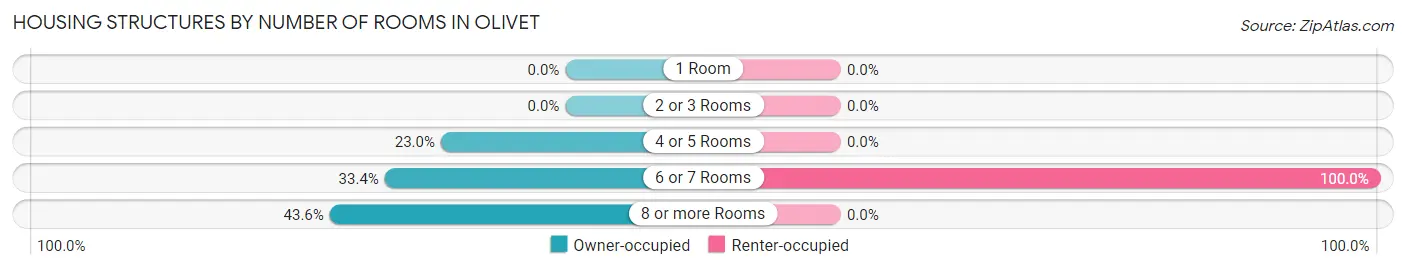
| Number of Rooms | Owner-occupied | Renter-occupied |
| 1 Room | 0 (0.0%) | 0 (0.0%) |
| 2 or 3 Rooms | 0 (0.0%) | 0 (0.0%) |
| 4 or 5 Rooms | 113 (23.0%) | 0 (0.0%) |
| 6 or 7 Rooms | 164 (33.4%) | 10 (100.0%) |
| 8 or more Rooms | 214 (43.6%) | 0 (0.0%) |
| Total | 491 (100.0%) | 10 (100.0%) |
Housing Structure by Heating Type in Olivet
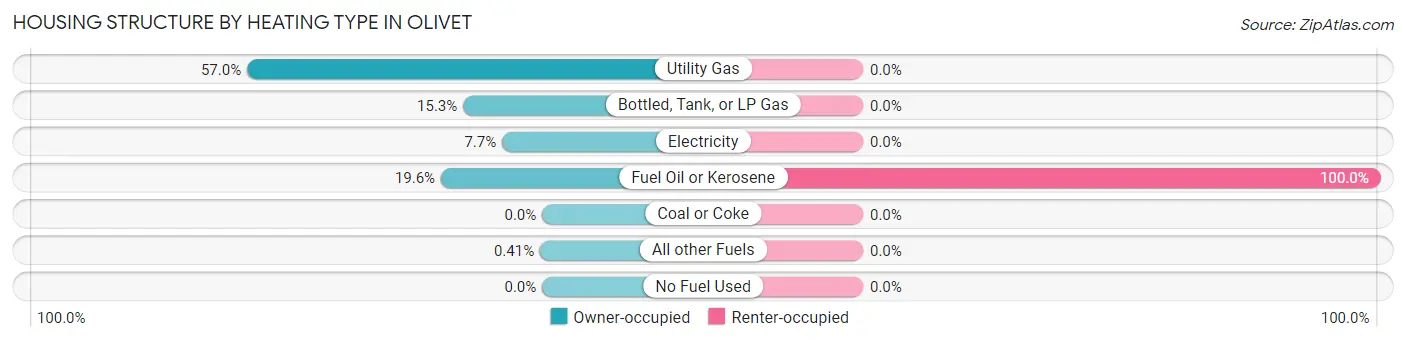
| Heating Type | Owner-occupied | Renter-occupied |
| Utility Gas | 280 (57.0%) | 0 (0.0%) |
| Bottled, Tank, or LP Gas | 75 (15.3%) | 0 (0.0%) |
| Electricity | 38 (7.7%) | 0 (0.0%) |
| Fuel Oil or Kerosene | 96 (19.6%) | 10 (100.0%) |
| Coal or Coke | 0 (0.0%) | 0 (0.0%) |
| All other Fuels | 2 (0.4%) | 0 (0.0%) |
| No Fuel Used | 0 (0.0%) | 0 (0.0%) |
| Total | 491 (100.0%) | 10 (100.0%) |
Household Vehicle Usage in Olivet
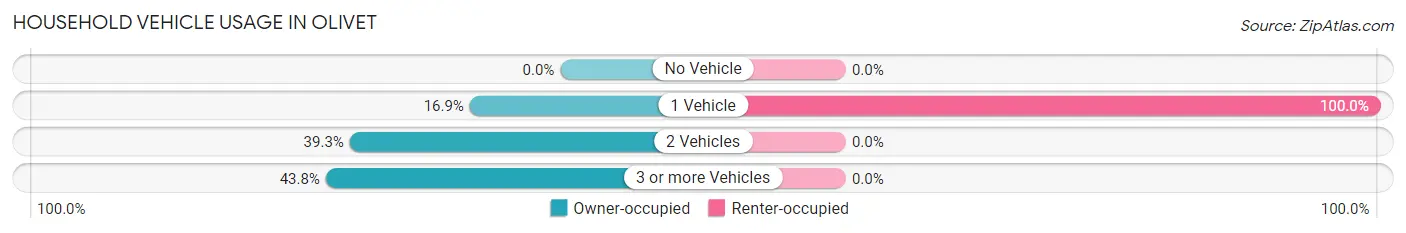
| Vehicles per Household | Owner-occupied | Renter-occupied |
| No Vehicle | 0 (0.0%) | 0 (0.0%) |
| 1 Vehicle | 83 (16.9%) | 10 (100.0%) |
| 2 Vehicles | 193 (39.3%) | 0 (0.0%) |
| 3 or more Vehicles | 215 (43.8%) | 0 (0.0%) |
| Total | 491 (100.0%) | 10 (100.0%) |
Real Estate & Mortgages in Olivet
Real Estate and Mortgage Overview in Olivet
| Characteristic | Without Mortgage | With Mortgage |
| Housing Units | 130 | 361 |
| Median Property Value | $300,000 | $261,500 |
| Median Household Income | $115,341 | $138 |
| Monthly Housing Costs | $1,440 | $45 |
| Real Estate Taxes | $10,001 | $0 |
Property Value by Mortgage Status in Olivet
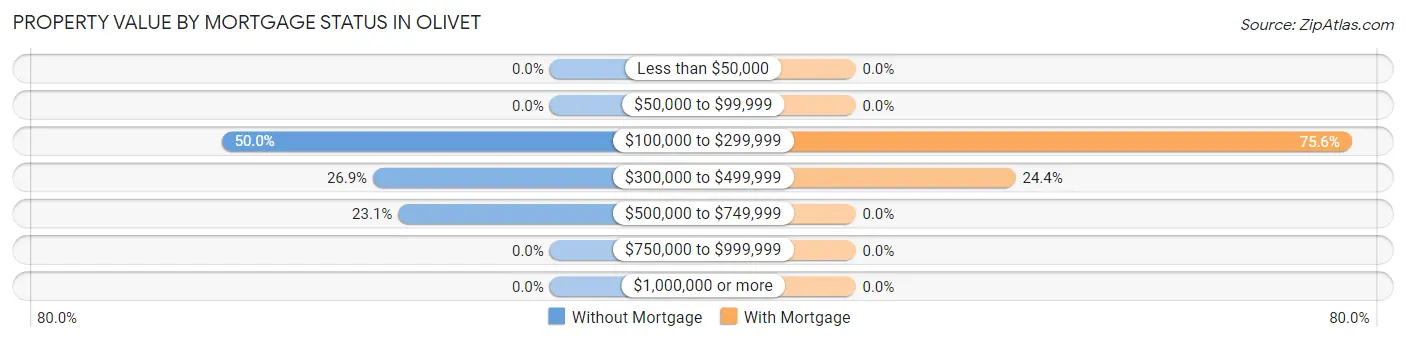
| Property Value | Without Mortgage | With Mortgage |
| Less than $50,000 | 0 (0.0%) | 0 (0.0%) |
| $50,000 to $99,999 | 0 (0.0%) | 0 (0.0%) |
| $100,000 to $299,999 | 65 (50.0%) | 273 (75.6%) |
| $300,000 to $499,999 | 35 (26.9%) | 88 (24.4%) |
| $500,000 to $749,999 | 30 (23.1%) | 0 (0.0%) |
| $750,000 to $999,999 | 0 (0.0%) | 0 (0.0%) |
| $1,000,000 or more | 0 (0.0%) | 0 (0.0%) |
| Total | 130 (100.0%) | 361 (100.0%) |
Household Income by Mortgage Status in Olivet
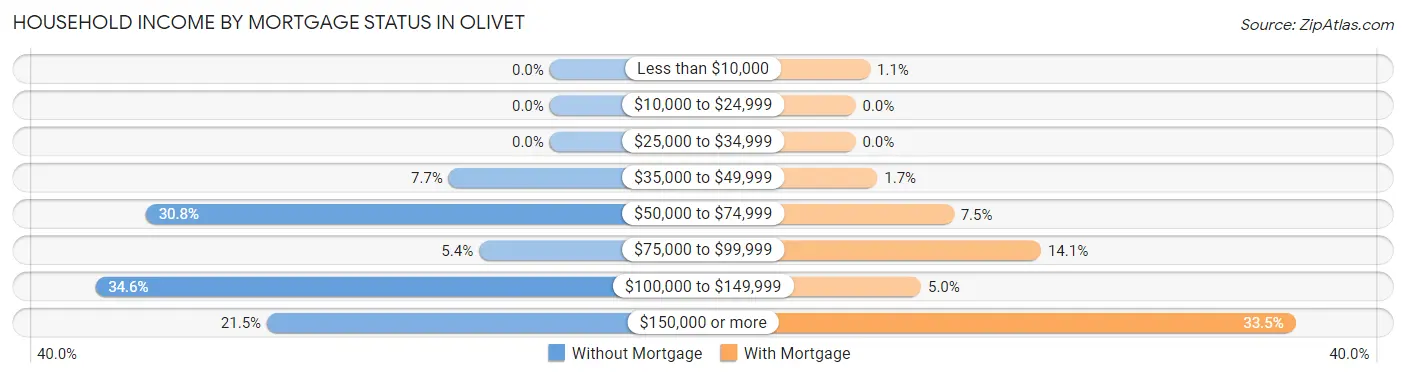
| Household Income | Without Mortgage | With Mortgage |
| Less than $10,000 | 0 (0.0%) | 4 (1.1%) |
| $10,000 to $24,999 | 0 (0.0%) | 0 (0.0%) |
| $25,000 to $34,999 | 0 (0.0%) | 0 (0.0%) |
| $35,000 to $49,999 | 10 (7.7%) | 6 (1.7%) |
| $50,000 to $74,999 | 40 (30.8%) | 27 (7.5%) |
| $75,000 to $99,999 | 7 (5.4%) | 51 (14.1%) |
| $100,000 to $149,999 | 45 (34.6%) | 18 (5.0%) |
| $150,000 or more | 28 (21.5%) | 121 (33.5%) |
| Total | 130 (100.0%) | 361 (100.0%) |
Property Value to Household Income Ratio in Olivet
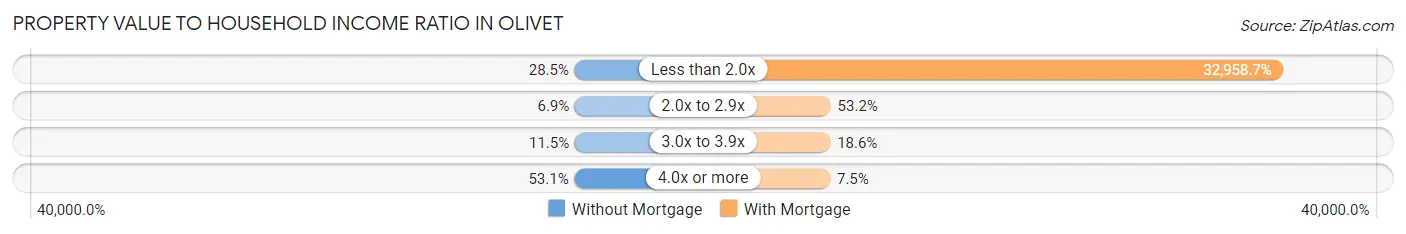
| Value-to-Income Ratio | Without Mortgage | With Mortgage |
| Less than 2.0x | 37 (28.5%) | 118,981 (32,958.7%) |
| 2.0x to 2.9x | 9 (6.9%) | 192 (53.2%) |
| 3.0x to 3.9x | 15 (11.5%) | 67 (18.6%) |
| 4.0x or more | 69 (53.1%) | 27 (7.5%) |
| Total | 130 (100.0%) | 361 (100.0%) |
Real Estate Taxes by Mortgage Status in Olivet
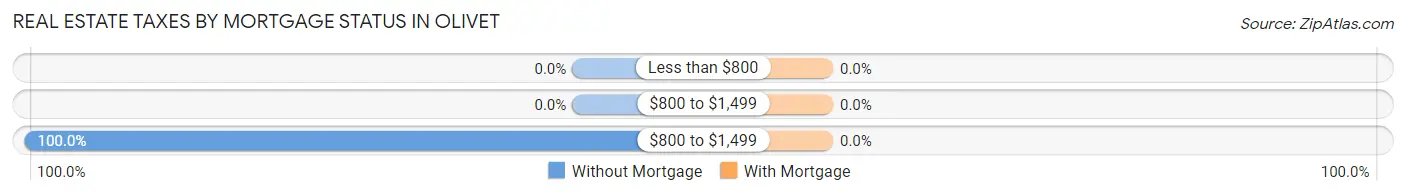
| Property Taxes | Without Mortgage | With Mortgage |
| Less than $800 | 0 (0.0%) | 0 (0.0%) |
| $800 to $1,499 | 0 (0.0%) | 0 (0.0%) |
| $800 to $1,499 | 130 (100.0%) | 0 (0.0%) |
| Total | 130 (100.0%) | 361 (100.0%) |
Health & Disability in Olivet
Health Insurance Coverage by Age in Olivet
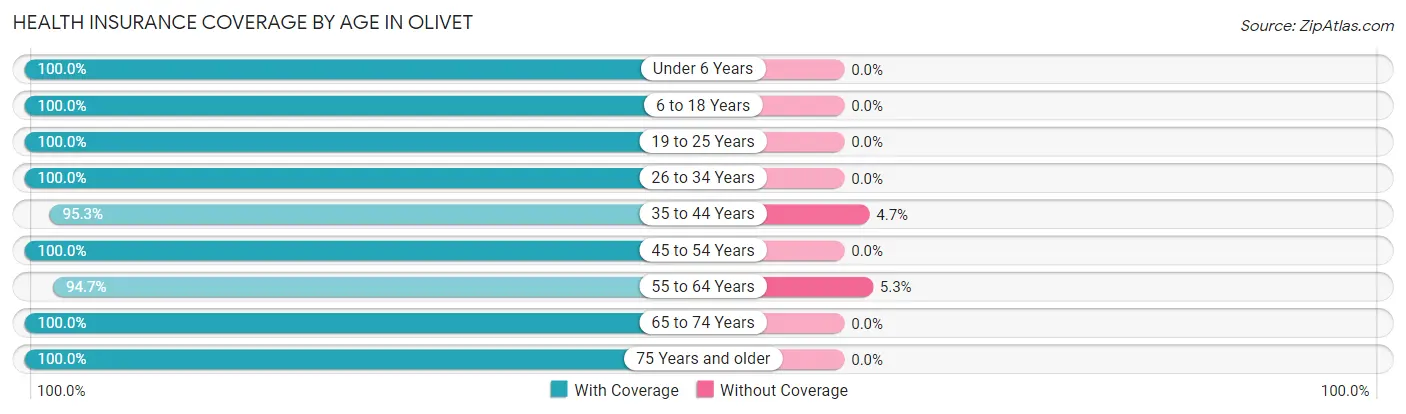
| Age Bracket | With Coverage | Without Coverage |
| Under 6 Years | 198 (100.0%) | 0 (0.0%) |
| 6 to 18 Years | 225 (100.0%) | 0 (0.0%) |
| 19 to 25 Years | 106 (100.0%) | 0 (0.0%) |
| 26 to 34 Years | 185 (100.0%) | 0 (0.0%) |
| 35 to 44 Years | 204 (95.3%) | 10 (4.7%) |
| 45 to 54 Years | 232 (100.0%) | 0 (0.0%) |
| 55 to 64 Years | 160 (94.7%) | 9 (5.3%) |
| 65 to 74 Years | 182 (100.0%) | 0 (0.0%) |
| 75 Years and older | 24 (100.0%) | 0 (0.0%) |
| Total | 1,516 (98.8%) | 19 (1.2%) |
Health Insurance Coverage by Citizenship Status in Olivet
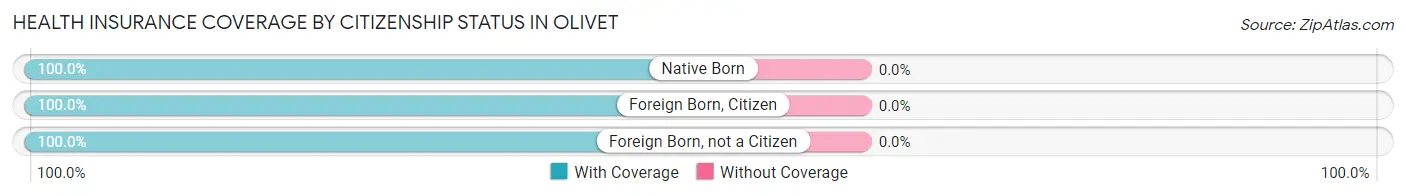
| Citizenship Status | With Coverage | Without Coverage |
| Native Born | 198 (100.0%) | 0 (0.0%) |
| Foreign Born, Citizen | 225 (100.0%) | 0 (0.0%) |
| Foreign Born, not a Citizen | 106 (100.0%) | 0 (0.0%) |
Health Insurance Coverage by Household Income in Olivet
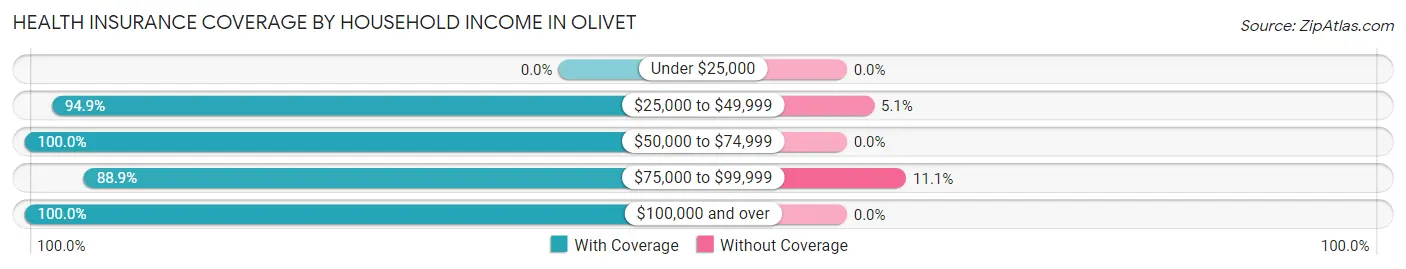
| Household Income | With Coverage | Without Coverage |
| Under $25,000 | 0 (0.0%) | 0 (0.0%) |
| $25,000 to $49,999 | 186 (94.9%) | 10 (5.1%) |
| $50,000 to $74,999 | 193 (100.0%) | 0 (0.0%) |
| $75,000 to $99,999 | 72 (88.9%) | 9 (11.1%) |
| $100,000 and over | 1,065 (100.0%) | 0 (0.0%) |
Public vs Private Health Insurance Coverage by Age in Olivet
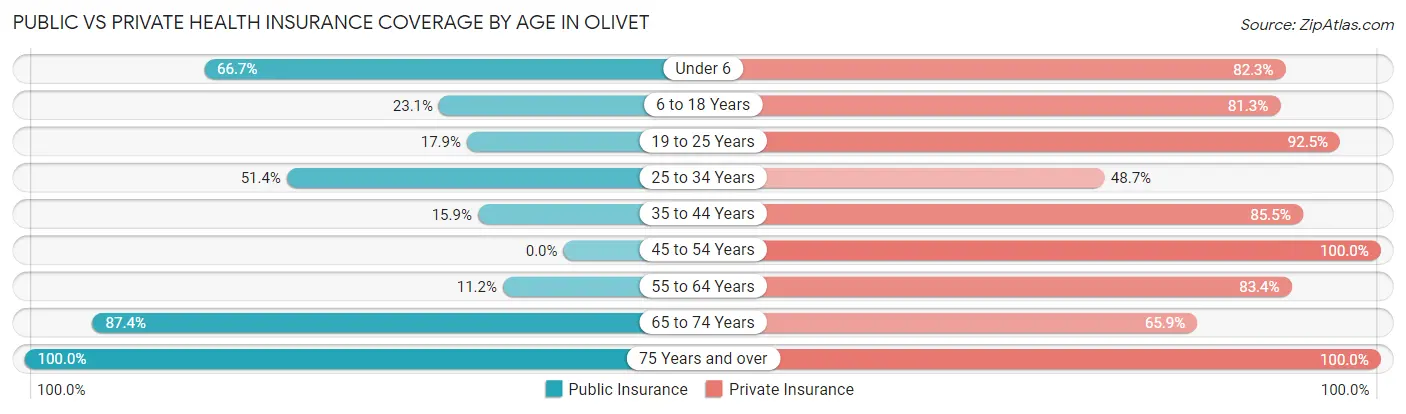
| Age Bracket | Public Insurance | Private Insurance |
| Under 6 | 132 (66.7%) | 163 (82.3%) |
| 6 to 18 Years | 52 (23.1%) | 183 (81.3%) |
| 19 to 25 Years | 19 (17.9%) | 98 (92.4%) |
| 25 to 34 Years | 95 (51.3%) | 90 (48.6%) |
| 35 to 44 Years | 34 (15.9%) | 183 (85.5%) |
| 45 to 54 Years | 0 (0.0%) | 232 (100.0%) |
| 55 to 64 Years | 19 (11.2%) | 141 (83.4%) |
| 65 to 74 Years | 159 (87.4%) | 120 (65.9%) |
| 75 Years and over | 24 (100.0%) | 24 (100.0%) |
| Total | 534 (34.8%) | 1,234 (80.4%) |
Disability Status by Sex by Age in Olivet
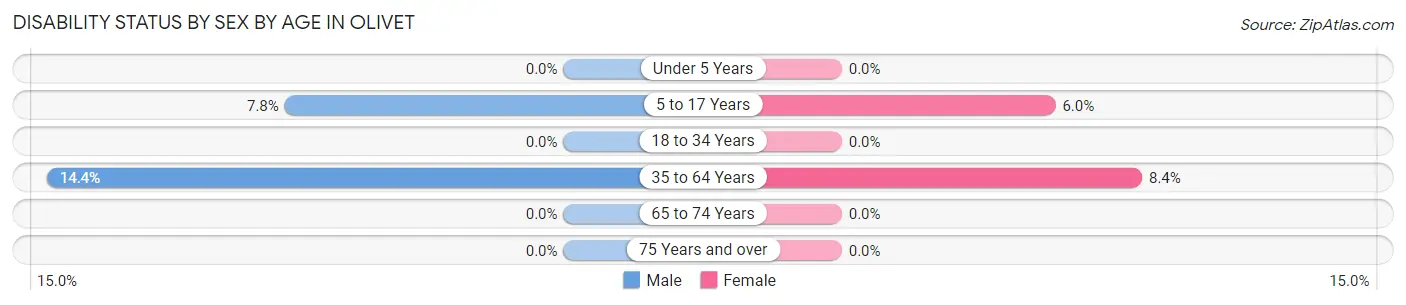
| Age Bracket | Male | Female |
| Under 5 Years | 0 (0.0%) | 0 (0.0%) |
| 5 to 17 Years | 9 (7.8%) | 10 (5.9%) |
| 18 to 34 Years | 0 (0.0%) | 0 (0.0%) |
| 35 to 64 Years | 42 (14.4%) | 27 (8.4%) |
| 65 to 74 Years | 0 (0.0%) | 0 (0.0%) |
| 75 Years and over | 0 (0.0%) | 0 (0.0%) |
Disability Class by Sex by Age in Olivet
Disability Class: Hearing Difficulty
| Age Bracket | Male | Female |
| Under 5 Years | 0 (0.0%) | 0 (0.0%) |
| 5 to 17 Years | 0 (0.0%) | 0 (0.0%) |
| 18 to 34 Years | 0 (0.0%) | 0 (0.0%) |
| 35 to 64 Years | 0 (0.0%) | 0 (0.0%) |
| 65 to 74 Years | 0 (0.0%) | 0 (0.0%) |
| 75 Years and over | 0 (0.0%) | 0 (0.0%) |
Disability Class: Vision Difficulty
| Age Bracket | Male | Female |
| Under 5 Years | 0 (0.0%) | 0 (0.0%) |
| 5 to 17 Years | 0 (0.0%) | 0 (0.0%) |
| 18 to 34 Years | 0 (0.0%) | 0 (0.0%) |
| 35 to 64 Years | 0 (0.0%) | 0 (0.0%) |
| 65 to 74 Years | 0 (0.0%) | 0 (0.0%) |
| 75 Years and over | 0 (0.0%) | 0 (0.0%) |
Disability Class: Cognitive Difficulty
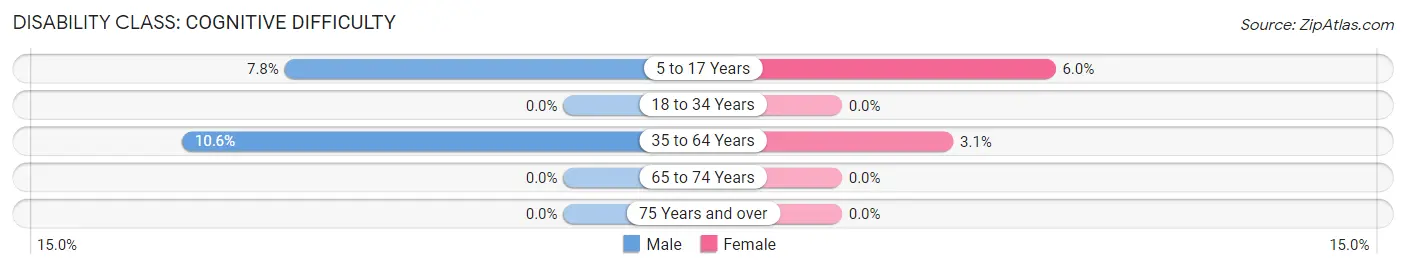
| Age Bracket | Male | Female |
| 5 to 17 Years | 9 (7.8%) | 10 (5.9%) |
| 18 to 34 Years | 0 (0.0%) | 0 (0.0%) |
| 35 to 64 Years | 31 (10.6%) | 10 (3.1%) |
| 65 to 74 Years | 0 (0.0%) | 0 (0.0%) |
| 75 Years and over | 0 (0.0%) | 0 (0.0%) |
Disability Class: Ambulatory Difficulty
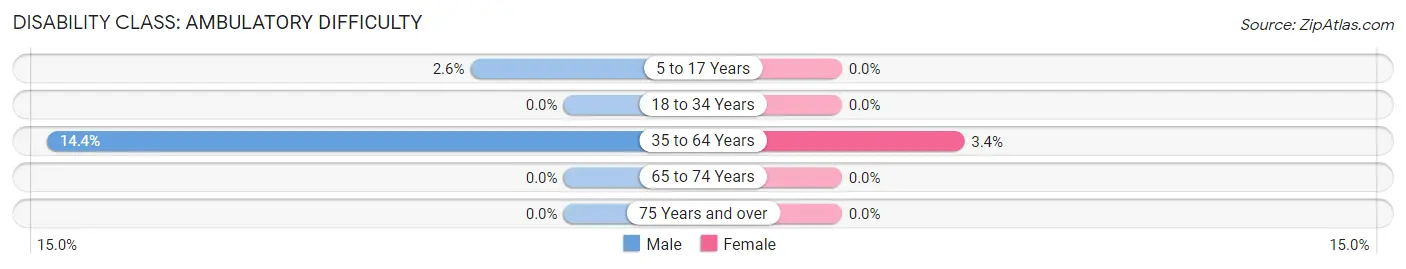
| Age Bracket | Male | Female |
| 5 to 17 Years | 3 (2.6%) | 0 (0.0%) |
| 18 to 34 Years | 0 (0.0%) | 0 (0.0%) |
| 35 to 64 Years | 42 (14.4%) | 11 (3.4%) |
| 65 to 74 Years | 0 (0.0%) | 0 (0.0%) |
| 75 Years and over | 0 (0.0%) | 0 (0.0%) |
Disability Class: Self-Care Difficulty
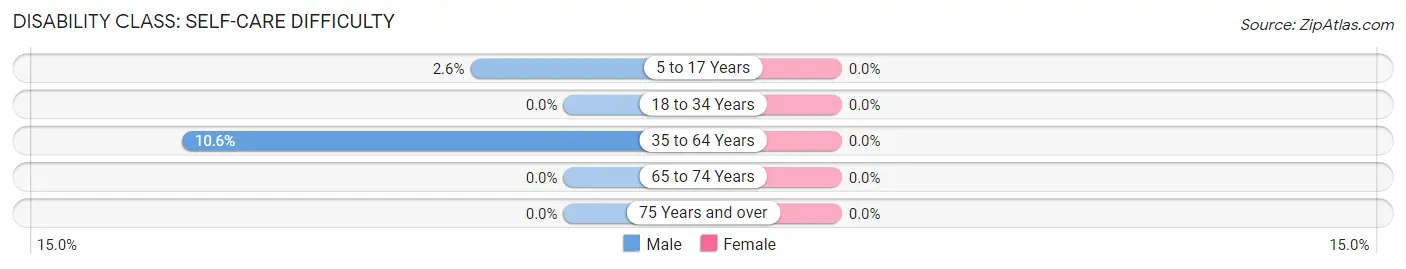
| Age Bracket | Male | Female |
| 5 to 17 Years | 3 (2.6%) | 0 (0.0%) |
| 18 to 34 Years | 0 (0.0%) | 0 (0.0%) |
| 35 to 64 Years | 31 (10.6%) | 0 (0.0%) |
| 65 to 74 Years | 0 (0.0%) | 0 (0.0%) |
| 75 Years and over | 0 (0.0%) | 0 (0.0%) |
Technology Access in Olivet
Computing Device Access in Olivet
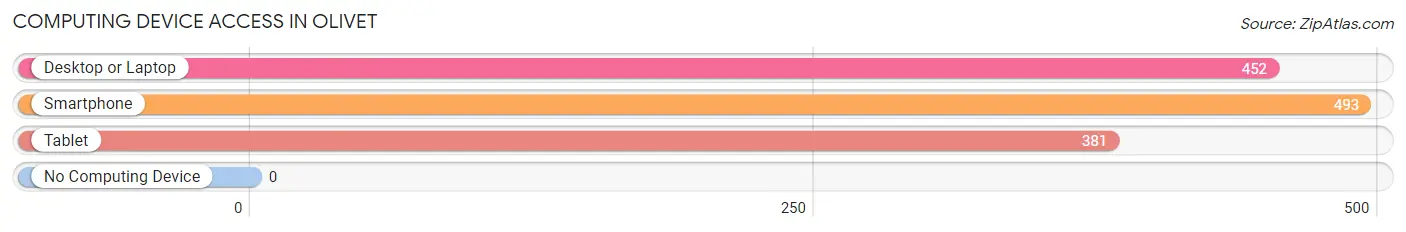
| Device Type | # Households | % Households |
| Desktop or Laptop | 452 | 90.2% |
| Smartphone | 493 | 98.4% |
| Tablet | 381 | 76.0% |
| No Computing Device | 0 | 0.0% |
| Total | 501 | 100.0% |
Internet Access in Olivet
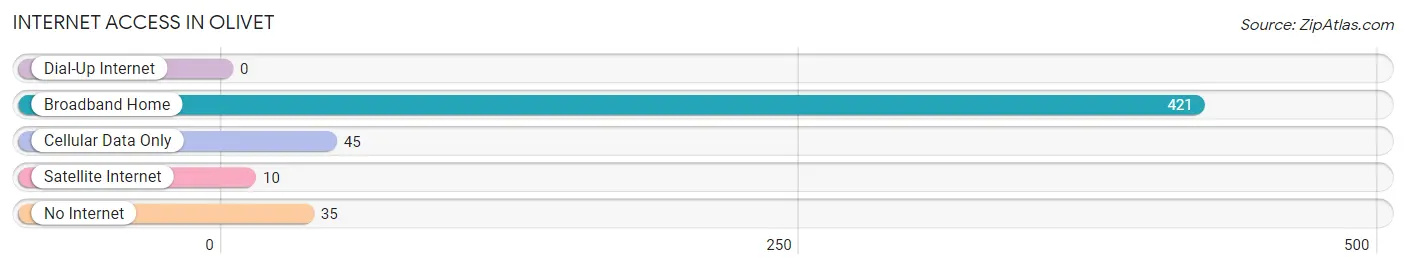
| Internet Type | # Households | % Households |
| Dial-Up Internet | 0 | 0.0% |
| Broadband Home | 421 | 84.0% |
| Cellular Data Only | 45 | 9.0% |
| Satellite Internet | 10 | 2.0% |
| No Internet | 35 | 7.0% |
| Total | 501 | 100.0% |
Olivet Summary
Olivet, NJ is a small borough located in Somerset County, New Jersey. It is situated in the Raritan Valley region of the state, and is bordered by the towns of Bridgewater, Bound Brook, and Manville. The population of Olivet, NJ was 2,845 as of the 2010 census, making it one of the smallest municipalities in the state.
Geography
Olivet, NJ is located at 40°35'17" North, 74°37'17" West (40.5879, -74.6214). It is situated in the Raritan Valley region of New Jersey, and is bordered by the towns of Bridgewater, Bound Brook, and Manville. The borough has a total area of 0.7 square miles, all of which is land.
The terrain of Olivet, NJ is mostly flat, with some rolling hills in the northern part of the borough. The Raritan River runs along the eastern border of the borough, and the Millstone River runs along the western border.
Demographics
As of the 2010 census, the population of Olivet, NJ was 2,845. The racial makeup of the borough was 79.2% White, 11.2% African American, 0.3% Native American, 4.2% Asian, 0.1% Pacific Islander, 2.2% from other races, and 2.9% from two or more races. Hispanic or Latino of any race were 8.2% of the population.
The median household income in Olivet, NJ was $68,958 in 2000, and the median family income was $76,917. The per capita income for the borough was $27,945. About 3.2% of families and 4.2% of the population were below the poverty line, including 4.7% of those under age 18 and 4.2% of those age 65 or over.
Economy
Olivet, NJ is a small borough with a limited economy. The primary industries in the borough are retail, manufacturing, and services. The largest employers in the borough are the Olivet Public School District, the Olivet Borough Hall, and the Olivet Fire Department.
The retail sector in Olivet, NJ is dominated by small, locally owned businesses. These businesses include grocery stores, restaurants, clothing stores, and other small shops.
The manufacturing sector in Olivet, NJ is dominated by small, locally owned businesses. These businesses include metal fabrication, printing, and woodworking.
The services sector in Olivet, NJ is dominated by small, locally owned businesses. These businesses include auto repair shops, hair salons, and other small businesses.
History
Olivet, NJ was first settled in the late 1700s by Dutch and English settlers. The borough was officially incorporated in 1891.
In the early 1900s, Olivet, NJ was a rural farming community. The borough was home to several small farms, and the main industry was agriculture.
In the mid-1900s, Olivet, NJ began to experience a period of growth and development. The borough was home to several small businesses, and the population began to grow.
In the late 1900s, Olivet, NJ continued to experience growth and development. The borough was home to several small businesses, and the population continued to grow.
Today, Olivet, NJ is a small borough with a limited economy. The primary industries in the borough are retail, manufacturing, and services. The population of the borough is stable, and the borough is home to several small businesses.
Common Questions
What is Per Capita Income in Olivet?
Per Capita income in Olivet is $44,203.
What is the Median Family Income in Olivet?
Median Family Income in Olivet is $118,365.
What is the Median Household income in Olivet?
Median Household Income in Olivet is $118,058.
What is Income or Wage Gap in Olivet?
Income or Wage Gap in Olivet is 46.9%.
Women in Olivet earn 53.1 cents for every dollar earned by a man.
What is Inequality or Gini Index in Olivet?
Inequality or Gini Index in Olivet is 0.32.
What is the Total Population of Olivet?
Total Population of Olivet is 1,535.
What is the Total Male Population of Olivet?
Total Male Population of Olivet is 714.
What is the Total Female Population of Olivet?
Total Female Population of Olivet is 821.
What is the Ratio of Males per 100 Females in Olivet?
There are 86.97 Males per 100 Females in Olivet.
What is the Ratio of Females per 100 Males in Olivet?
There are 114.99 Females per 100 Males in Olivet.
What is the Median Population Age in Olivet?
Median Population Age in Olivet is 37.2 Years.
What is the Average Family Size in Olivet
Average Family Size in Olivet is 3.3 People.
What is the Average Household Size in Olivet
Average Household Size in Olivet is 3.1 People.
How Large is the Labor Force in Olivet?
There are 855 People in the Labor Forcein in Olivet.
What is the Percentage of People in the Labor Force in Olivet?
74.0% of People are in the Labor Force in Olivet.
What is the Unemployment Rate in Olivet?
Unemployment Rate in Olivet is 6.8%.