Kingston Estates, NJ Map & Demographics
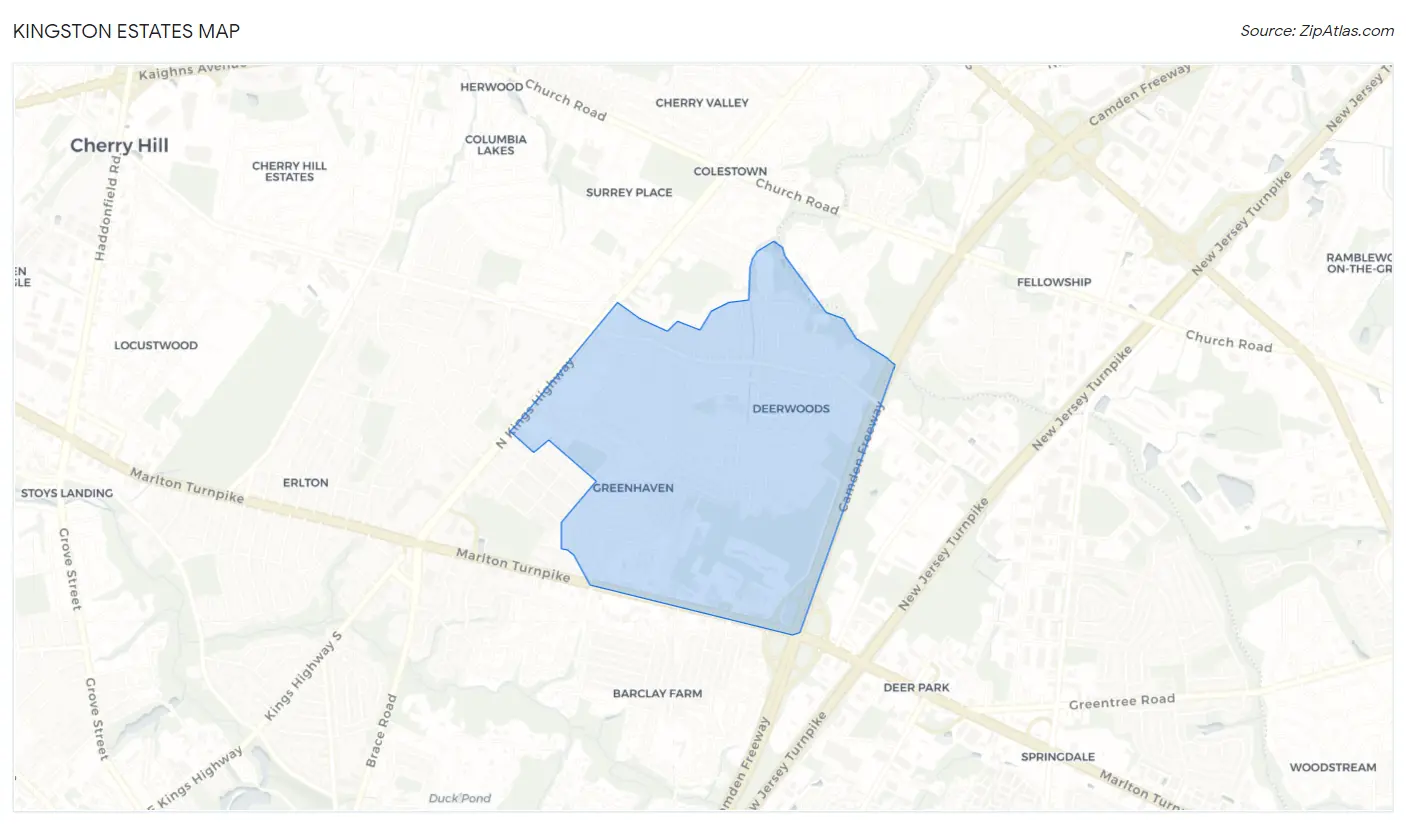
Kingston Estates Map
Kingston Estates Overview
$42,101
PER CAPITA INCOME
$108,906
AVG FAMILY INCOME
$100,212
AVG HOUSEHOLD INCOME
22.2%
WAGE / INCOME GAP [ % ]
77.8¢/ $1
WAGE / INCOME GAP [ $ ]
0.34
INEQUALITY / GINI INDEX
6,999
TOTAL POPULATION
3,490
MALE POPULATION
3,509
FEMALE POPULATION
99.46
MALES / 100 FEMALES
100.54
FEMALES / 100 MALES
36.3
MEDIAN AGE
3.2
AVG FAMILY SIZE
2.6
AVG HOUSEHOLD SIZE
3,781
LABOR FORCE [ PEOPLE ]
66.8%
PERCENT IN LABOR FORCE
3.8%
UNEMPLOYMENT RATE
Income in Kingston Estates
Income Overview in Kingston Estates
Per Capita Income in Kingston Estates is $42,101, while median incomes of families and households are $108,906 and $100,212 respectively.
| Characteristic | Number | Measure |
| Per Capita Income | 6,999 | $42,101 |
| Median Family Income | 1,727 | $108,906 |
| Mean Family Income | 1,727 | $120,333 |
| Median Household Income | 2,660 | $100,212 |
| Mean Household Income | 2,660 | $108,832 |
| Income Deficit | 1,727 | $0 |
| Wage / Income Gap (%) | 6,999 | 22.15% |
| Wage / Income Gap ($) | 6,999 | 77.85¢ per $1 |
| Gini / Inequality Index | 6,999 | 0.34 |
Earnings by Sex in Kingston Estates
Average Earnings in Kingston Estates are $48,934, $55,922 for men and $43,534 for women, a difference of 22.2%.
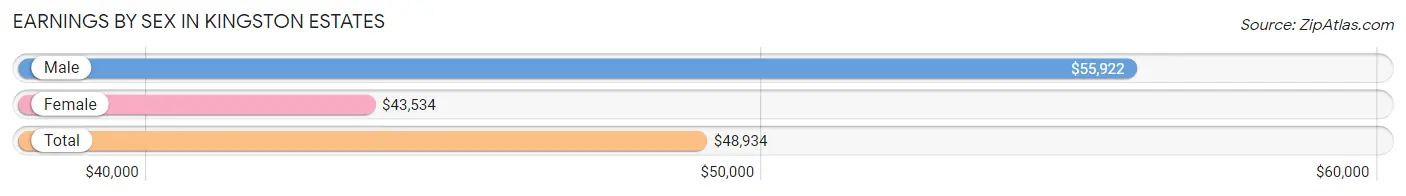
| Sex | Number | Average Earnings |
| Male | 2,075 (55.4%) | $55,922 |
| Female | 1,671 (44.6%) | $43,534 |
| Total | 3,746 (100.0%) | $48,934 |
Earnings by Sex by Income Bracket in Kingston Estates
The most common earnings brackets in Kingston Estates are $65,000 to $74,999 for men (322 | 15.5%) and $75,000 to $99,999 for women (253 | 15.1%).
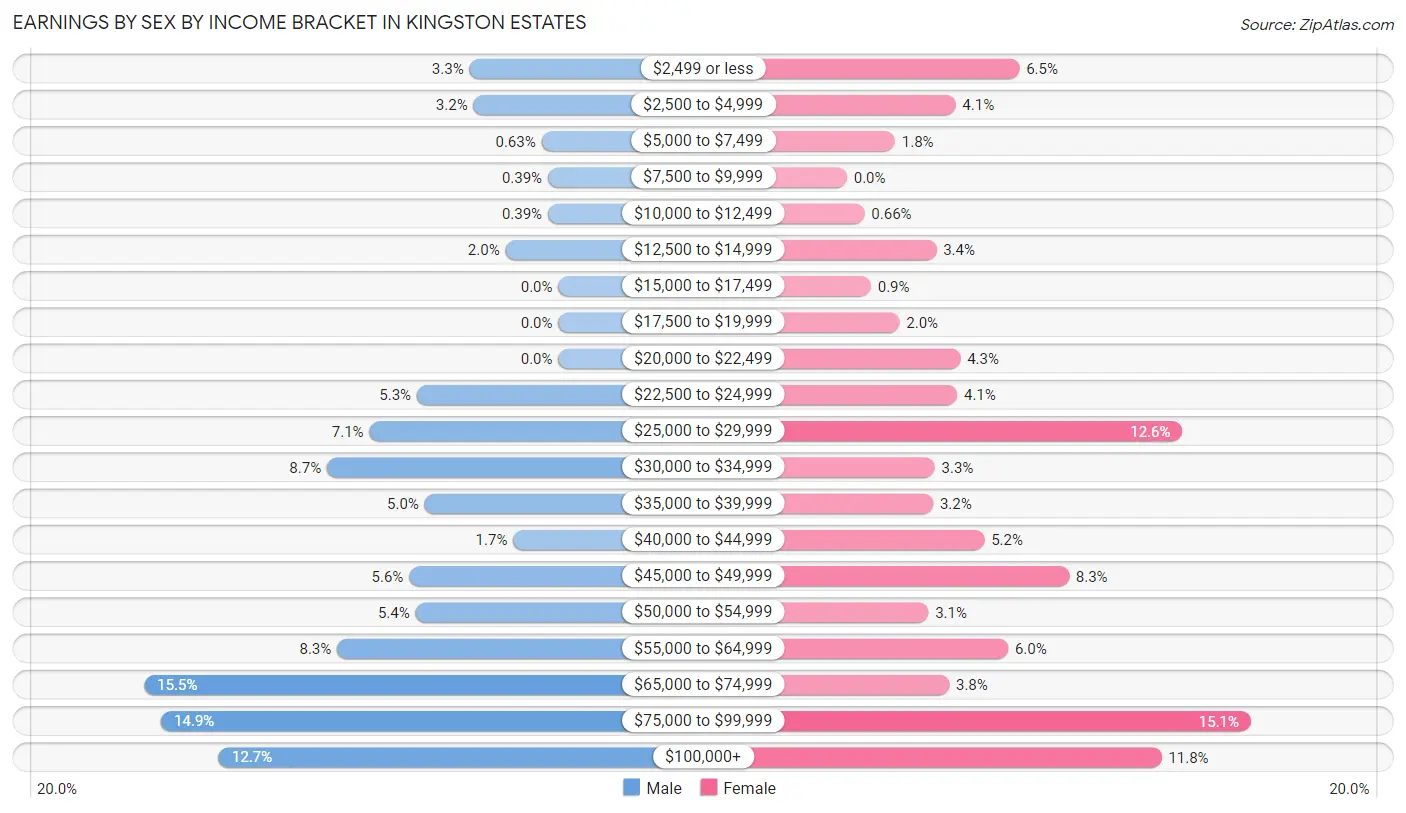
| Income | Male | Female |
| $2,499 or less | 69 (3.3%) | 108 (6.5%) |
| $2,500 to $4,999 | 66 (3.2%) | 68 (4.1%) |
| $5,000 to $7,499 | 13 (0.6%) | 30 (1.8%) |
| $7,500 to $9,999 | 8 (0.4%) | 0 (0.0%) |
| $10,000 to $12,499 | 8 (0.4%) | 11 (0.7%) |
| $12,500 to $14,999 | 41 (2.0%) | 56 (3.4%) |
| $15,000 to $17,499 | 0 (0.0%) | 15 (0.9%) |
| $17,500 to $19,999 | 0 (0.0%) | 33 (2.0%) |
| $20,000 to $22,499 | 0 (0.0%) | 71 (4.3%) |
| $22,500 to $24,999 | 110 (5.3%) | 69 (4.1%) |
| $25,000 to $29,999 | 147 (7.1%) | 210 (12.6%) |
| $30,000 to $34,999 | 180 (8.7%) | 55 (3.3%) |
| $35,000 to $39,999 | 104 (5.0%) | 54 (3.2%) |
| $40,000 to $44,999 | 35 (1.7%) | 86 (5.1%) |
| $45,000 to $49,999 | 116 (5.6%) | 139 (8.3%) |
| $50,000 to $54,999 | 111 (5.3%) | 51 (3.0%) |
| $55,000 to $64,999 | 172 (8.3%) | 101 (6.0%) |
| $65,000 to $74,999 | 322 (15.5%) | 64 (3.8%) |
| $75,000 to $99,999 | 309 (14.9%) | 253 (15.1%) |
| $100,000+ | 264 (12.7%) | 197 (11.8%) |
| Total | 2,075 (100.0%) | 1,671 (100.0%) |
Earnings by Sex by Educational Attainment in Kingston Estates
Average earnings in Kingston Estates are $65,977 for men and $43,245 for women, a difference of 34.4%. Men with an educational attainment of graduate degree enjoy the highest average annual earnings of $87,557, while those with high school diploma education earn the least with $31,529. Women with an educational attainment of graduate degree earn the most with the average annual earnings of $81,136, while those with high school diploma education have the smallest earnings of $29,891.
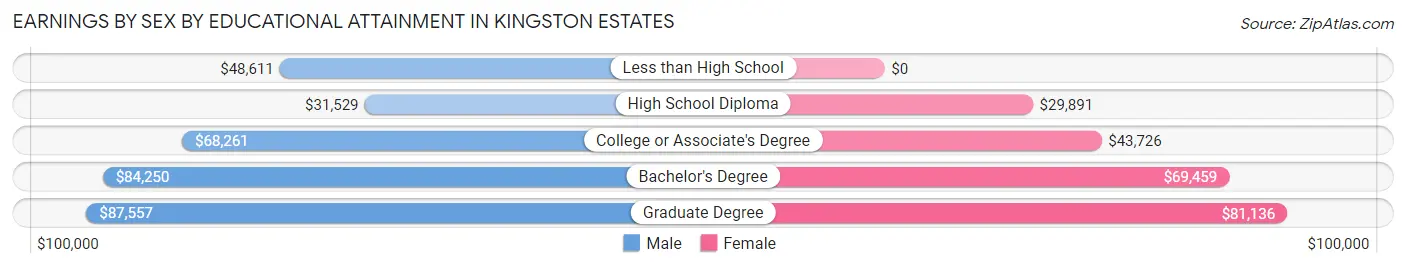
| Educational Attainment | Male Income | Female Income |
| Less than High School | $48,611 | $0 |
| High School Diploma | $31,529 | $29,891 |
| College or Associate's Degree | $68,261 | $43,726 |
| Bachelor's Degree | $84,250 | $69,459 |
| Graduate Degree | $87,557 | $81,136 |
| Total | $65,977 | $43,245 |
Family Income in Kingston Estates
Family Income Brackets in Kingston Estates
According to the Kingston Estates family income data, there are 629 families falling into the $100,000 to $149,999 income range, which is the most common income bracket and makes up 36.4% of all families.
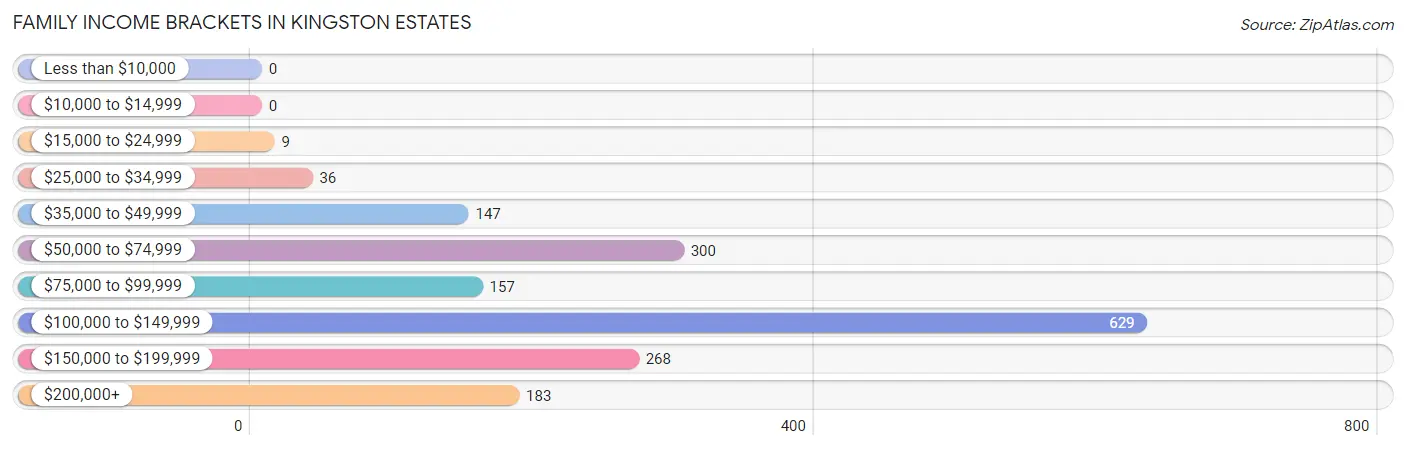
| Income Bracket | # Families | % Families |
| Less than $10,000 | 0 | 0.0% |
| $10,000 to $14,999 | 0 | 0.0% |
| $15,000 to $24,999 | 9 | 0.5% |
| $25,000 to $34,999 | 36 | 2.1% |
| $35,000 to $49,999 | 147 | 8.5% |
| $50,000 to $74,999 | 300 | 17.4% |
| $75,000 to $99,999 | 157 | 9.1% |
| $100,000 to $149,999 | 629 | 36.4% |
| $150,000 to $199,999 | 268 | 15.5% |
| $200,000+ | 183 | 10.6% |
Family Income by Famaliy Size in Kingston Estates
3-person families (393 | 22.8%) account for the highest median family income in Kingston Estates with $131,118 per family, while 2-person families (645 | 37.3%) have the highest median income of $58,125 per family member.
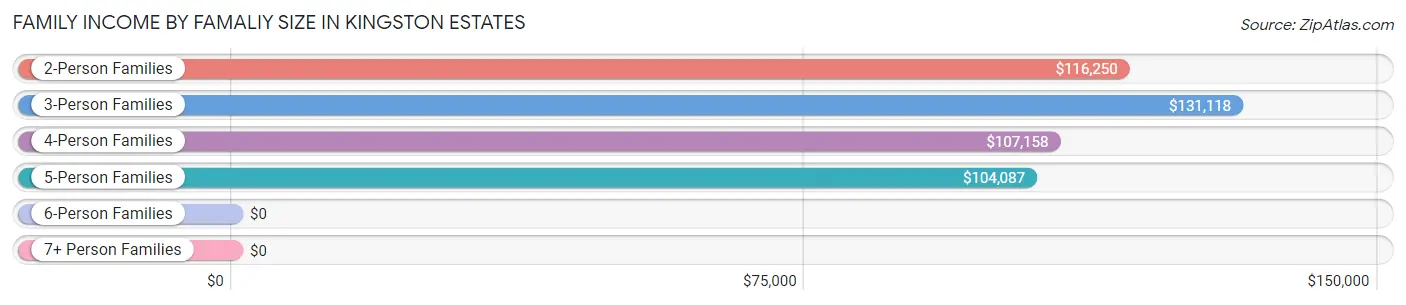
| Income Bracket | # Families | Median Income |
| 2-Person Families | 645 (37.3%) | $116,250 |
| 3-Person Families | 393 (22.8%) | $131,118 |
| 4-Person Families | 440 (25.5%) | $107,158 |
| 5-Person Families | 207 (12.0%) | $104,087 |
| 6-Person Families | 42 (2.4%) | $0 |
| 7+ Person Families | 0 (0.0%) | $0 |
| Total | 1,727 (100.0%) | $108,906 |
Family Income by Number of Earners in Kingston Estates
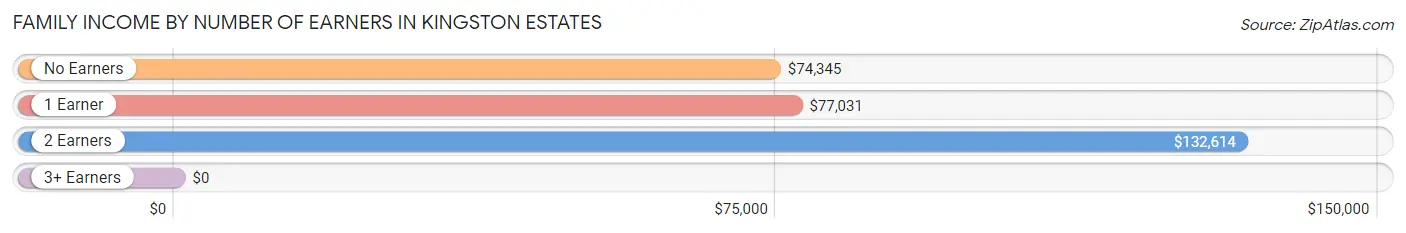
| Number of Earners | # Families | Median Income |
| No Earners | 239 (13.8%) | $74,345 |
| 1 Earner | 474 (27.5%) | $77,031 |
| 2 Earners | 771 (44.6%) | $132,614 |
| 3+ Earners | 243 (14.1%) | $0 |
| Total | 1,727 (100.0%) | $108,906 |
Household Income in Kingston Estates
Household Income Brackets in Kingston Estates
With 678 households falling in the category, the $100,000 to $149,999 income range is the most frequent in Kingston Estates, accounting for 25.5% of all households.
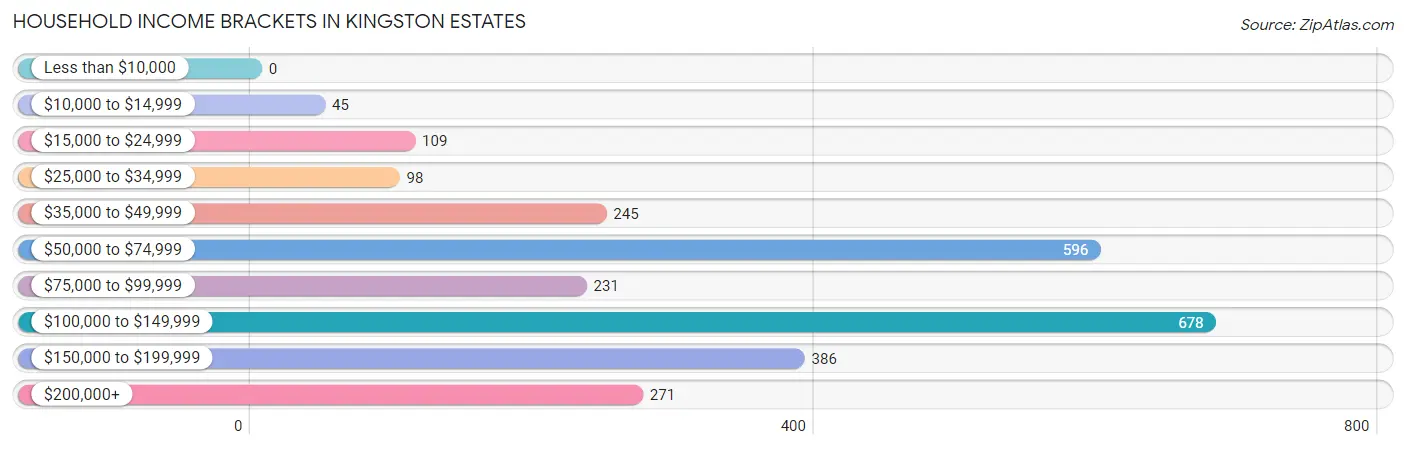
| Income Bracket | # Households | % Households |
| Less than $10,000 | 0 | 0.0% |
| $10,000 to $14,999 | 45 | 1.7% |
| $15,000 to $24,999 | 109 | 4.1% |
| $25,000 to $34,999 | 98 | 3.7% |
| $35,000 to $49,999 | 245 | 9.2% |
| $50,000 to $74,999 | 596 | 22.4% |
| $75,000 to $99,999 | 231 | 8.7% |
| $100,000 to $149,999 | 678 | 25.5% |
| $150,000 to $199,999 | 386 | 14.5% |
| $200,000+ | 271 | 10.2% |
Household Income by Householder Age in Kingston Estates
The median household income in Kingston Estates is $100,212, with the highest median household income of $110,546 found in the 25 to 44 years age bracket for the primary householder. A total of 1,069 households (40.2%) fall into this category.
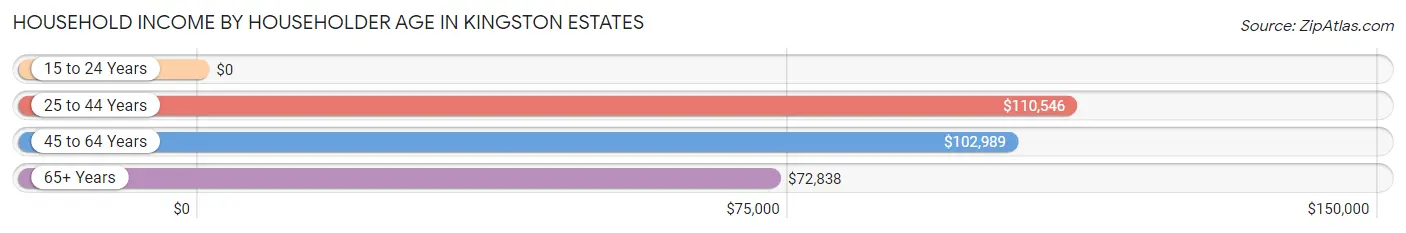
| Income Bracket | # Households | Median Income |
| 15 to 24 Years | 0 (0.0%) | $0 |
| 25 to 44 Years | 1,069 (40.2%) | $110,546 |
| 45 to 64 Years | 775 (29.1%) | $102,989 |
| 65+ Years | 816 (30.7%) | $72,838 |
| Total | 2,660 (100.0%) | $100,212 |
Poverty in Kingston Estates
Income Below Poverty by Sex and Age in Kingston Estates
With 2.1% poverty level for males and 3.4% for females among the residents of Kingston Estates, 35 to 44 year old males and 18 to 24 year old females are the most vulnerable to poverty, with 50 males (12.7%) and 29 females (20.1%) in their respective age groups living below the poverty level.
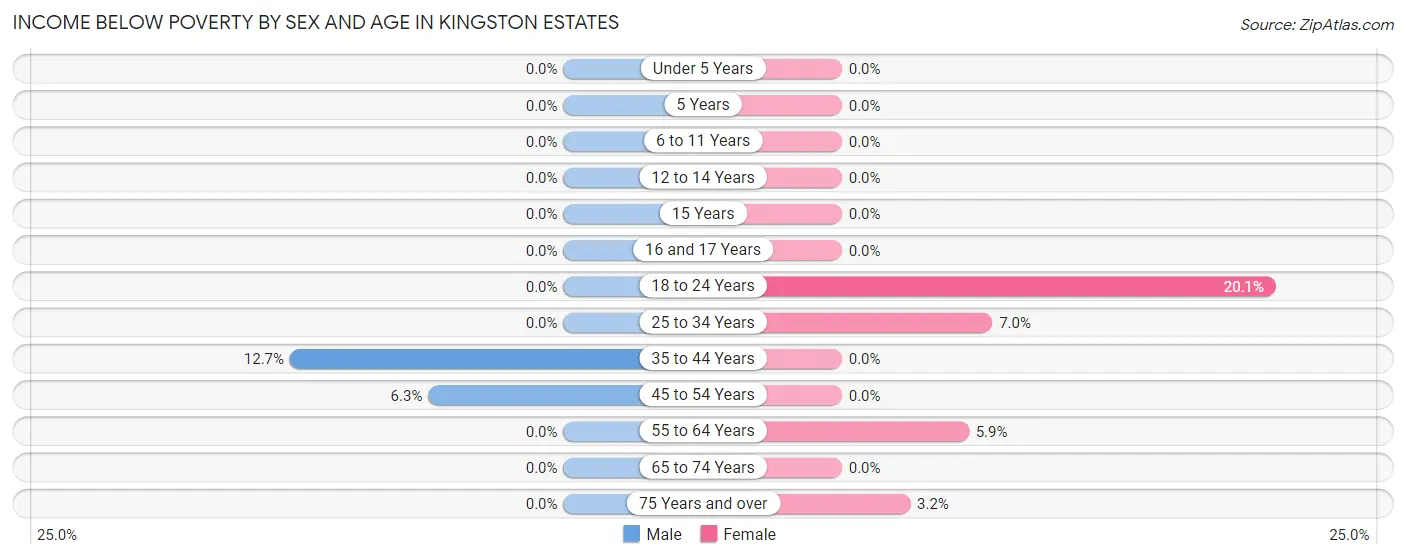
| Age Bracket | Male | Female |
| Under 5 Years | 0 (0.0%) | 0 (0.0%) |
| 5 Years | 0 (0.0%) | 0 (0.0%) |
| 6 to 11 Years | 0 (0.0%) | 0 (0.0%) |
| 12 to 14 Years | 0 (0.0%) | 0 (0.0%) |
| 15 Years | 0 (0.0%) | 0 (0.0%) |
| 16 and 17 Years | 0 (0.0%) | 0 (0.0%) |
| 18 to 24 Years | 0 (0.0%) | 29 (20.1%) |
| 25 to 34 Years | 0 (0.0%) | 44 (7.0%) |
| 35 to 44 Years | 50 (12.7%) | 0 (0.0%) |
| 45 to 54 Years | 23 (6.3%) | 0 (0.0%) |
| 55 to 64 Years | 0 (0.0%) | 30 (5.9%) |
| 65 to 74 Years | 0 (0.0%) | 0 (0.0%) |
| 75 Years and over | 0 (0.0%) | 15 (3.2%) |
| Total | 73 (2.1%) | 118 (3.4%) |
Income Above Poverty by Sex and Age in Kingston Estates
According to the poverty statistics in Kingston Estates, males aged under 5 years and females aged under 5 years are the age groups that are most secure financially, with 100.0% of males and 100.0% of females in these age groups living above the poverty line.
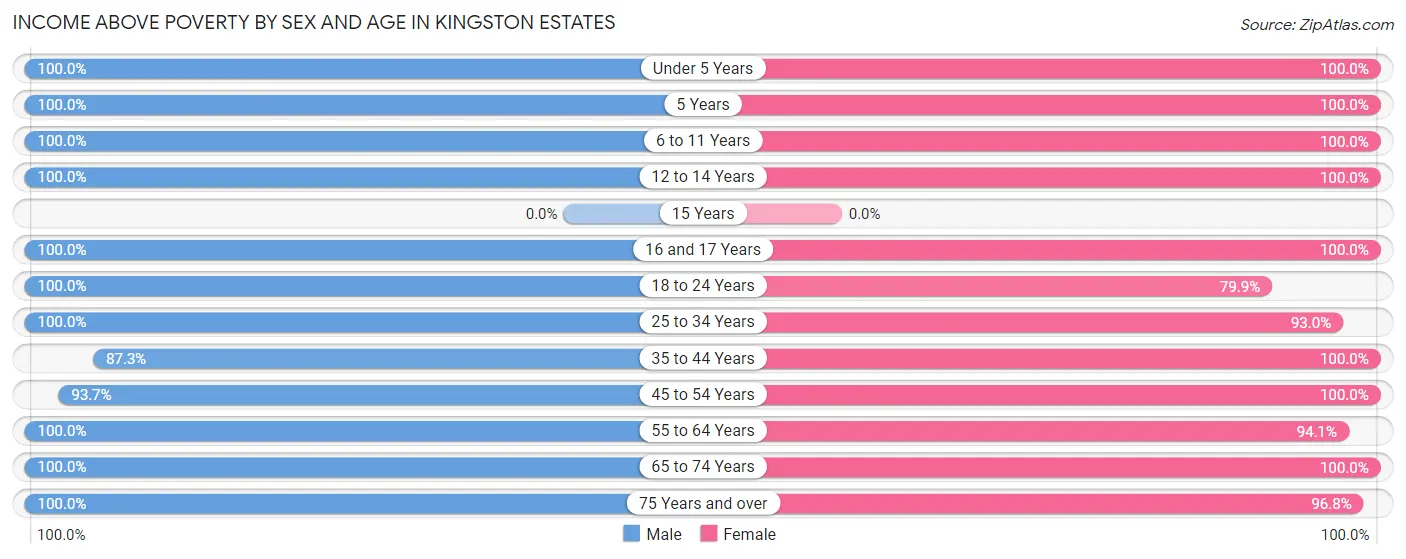
| Age Bracket | Male | Female |
| Under 5 Years | 64 (100.0%) | 220 (100.0%) |
| 5 Years | 64 (100.0%) | 22 (100.0%) |
| 6 to 11 Years | 500 (100.0%) | 309 (100.0%) |
| 12 to 14 Years | 75 (100.0%) | 85 (100.0%) |
| 15 Years | 0 (0.0%) | 0 (0.0%) |
| 16 and 17 Years | 39 (100.0%) | 34 (100.0%) |
| 18 to 24 Years | 349 (100.0%) | 115 (79.9%) |
| 25 to 34 Years | 804 (100.0%) | 586 (93.0%) |
| 35 to 44 Years | 344 (87.3%) | 329 (100.0%) |
| 45 to 54 Years | 344 (93.7%) | 296 (100.0%) |
| 55 to 64 Years | 322 (100.0%) | 479 (94.1%) |
| 65 to 74 Years | 176 (100.0%) | 388 (100.0%) |
| 75 Years and over | 308 (100.0%) | 458 (96.8%) |
| Total | 3,389 (97.9%) | 3,321 (96.6%) |
Income Below Poverty Among Married-Couple Families in Kingston Estates
The poverty statistics for married-couple families in Kingston Estates show that 0.6% or 8 of the total 1,307 families live below the poverty line. Families with no children have the highest poverty rate of 1.0%, comprising of 8 families. On the other hand, families with 1 or 2 children have the lowest poverty rate of 0.0%, which includes 0 families.
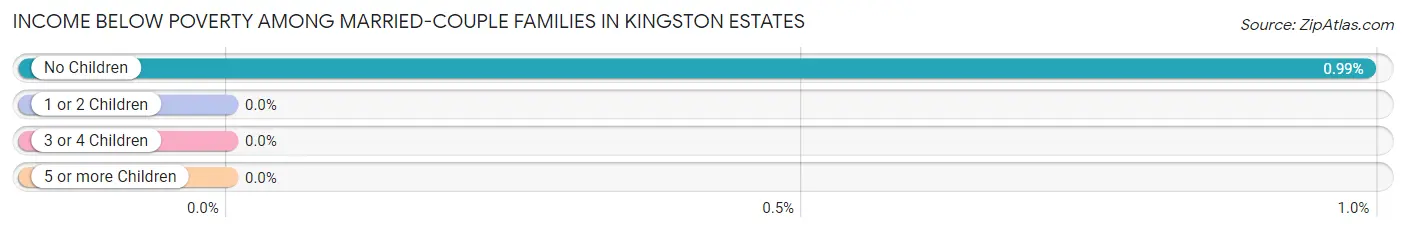
| Children | Above Poverty | Below Poverty |
| No Children | 803 (99.0%) | 8 (1.0%) |
| 1 or 2 Children | 406 (100.0%) | 0 (0.0%) |
| 3 or 4 Children | 90 (100.0%) | 0 (0.0%) |
| 5 or more Children | 0 (0.0%) | 0 (0.0%) |
| Total | 1,299 (99.4%) | 8 (0.6%) |
Income Below Poverty Among Single-Parent Households in Kingston Estates
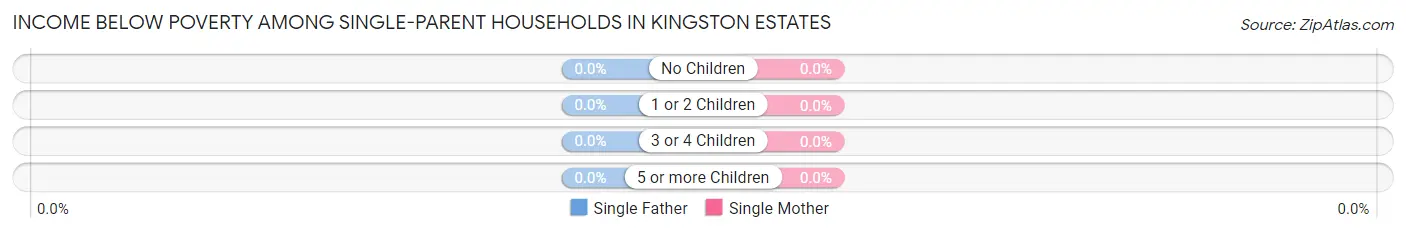
| Children | Single Father | Single Mother |
| No Children | 0 (0.0%) | 0 (0.0%) |
| 1 or 2 Children | 0 (0.0%) | 0 (0.0%) |
| 3 or 4 Children | 0 (0.0%) | 0 (0.0%) |
| 5 or more Children | 0 (0.0%) | 0 (0.0%) |
| Total | 0 (0.0%) | 0 (0.0%) |
Income Below Poverty Among Married-Couple vs Single-Parent Households in Kingston Estates
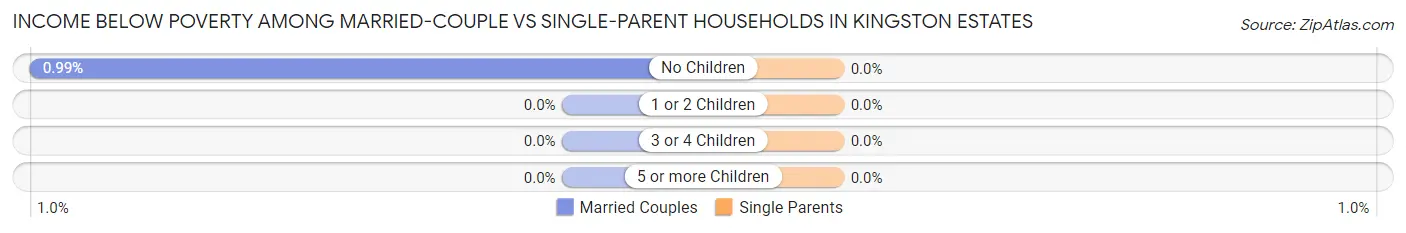
| Children | Married-Couple Families | Single-Parent Households |
| No Children | 8 (1.0%) | 0 (0.0%) |
| 1 or 2 Children | 0 (0.0%) | 0 (0.0%) |
| 3 or 4 Children | 0 (0.0%) | 0 (0.0%) |
| 5 or more Children | 0 (0.0%) | 0 (0.0%) |
| Total | 8 (0.6%) | 0 (0.0%) |
Race in Kingston Estates
The most populous races in Kingston Estates are White / Caucasian (3,515 | 50.2%), Asian (1,411 | 20.2%), and Hispanic or Latino (895 | 12.8%).
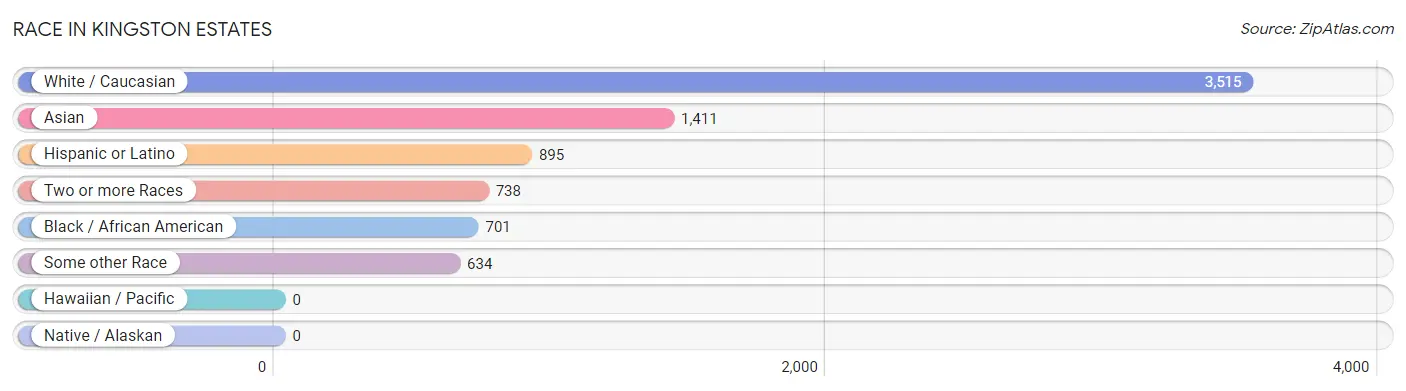
| Race | # Population | % Population |
| Asian | 1,411 | 20.2% |
| Black / African American | 701 | 10.0% |
| Hawaiian / Pacific | 0 | 0.0% |
| Hispanic or Latino | 895 | 12.8% |
| Native / Alaskan | 0 | 0.0% |
| White / Caucasian | 3,515 | 50.2% |
| Two or more Races | 738 | 10.5% |
| Some other Race | 634 | 9.1% |
| Total | 6,999 | 100.0% |
Ancestry in Kingston Estates
The most populous ancestries reported in Kingston Estates are Irish (1,324 | 18.9%), Italian (831 | 11.9%), Indian (Asian) (589 | 8.4%), South American (584 | 8.3%), and German (559 | 8.0%), together accounting for 55.5% of all Kingston Estates residents.
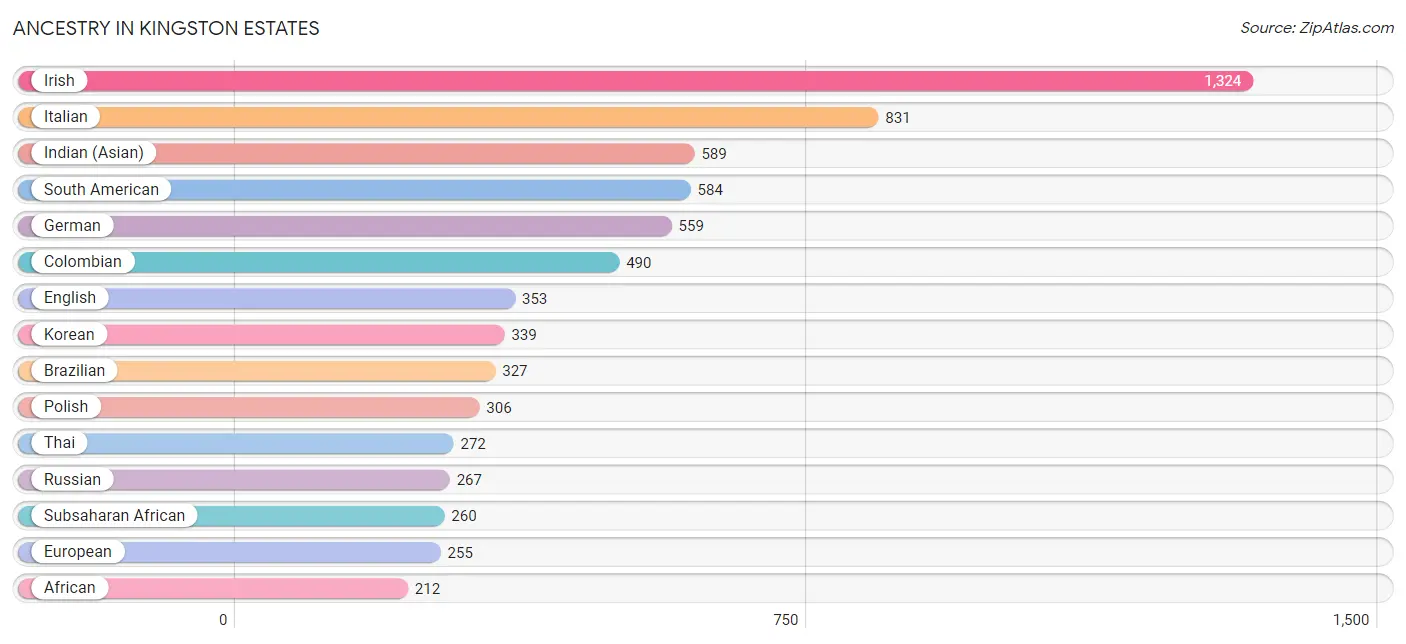
| Ancestry | # Population | % Population |
| African | 212 | 3.0% |
| American | 190 | 2.7% |
| Arab | 74 | 1.1% |
| Argentinean | 39 | 0.6% |
| Armenian | 32 | 0.5% |
| Belgian | 23 | 0.3% |
| Brazilian | 327 | 4.7% |
| British | 16 | 0.2% |
| Burmese | 129 | 1.8% |
| Canadian | 15 | 0.2% |
| Central American Indian | 18 | 0.3% |
| Colombian | 490 | 7.0% |
| Cuban | 21 | 0.3% |
| Czech | 20 | 0.3% |
| Dominican | 103 | 1.5% |
| Dutch | 39 | 0.6% |
| Eastern European | 42 | 0.6% |
| Ecuadorian | 55 | 0.8% |
| Egyptian | 17 | 0.2% |
| English | 353 | 5.0% |
| European | 255 | 3.6% |
| French | 43 | 0.6% |
| French Canadian | 26 | 0.4% |
| German | 559 | 8.0% |
| Greek | 96 | 1.4% |
| Hungarian | 59 | 0.8% |
| Indian (Asian) | 589 | 8.4% |
| Irish | 1,324 | 18.9% |
| Italian | 831 | 11.9% |
| Jamaican | 1 | 0.0% |
| Jordanian | 29 | 0.4% |
| Korean | 339 | 4.8% |
| Lebanese | 15 | 0.2% |
| Lithuanian | 97 | 1.4% |
| Mexican | 77 | 1.1% |
| Polish | 306 | 4.4% |
| Puerto Rican | 110 | 1.6% |
| Russian | 267 | 3.8% |
| Scotch-Irish | 13 | 0.2% |
| Scottish | 39 | 0.6% |
| South African | 48 | 0.7% |
| South American | 584 | 8.3% |
| Sri Lankan | 82 | 1.2% |
| Subsaharan African | 260 | 3.7% |
| Swedish | 29 | 0.4% |
| Swiss | 63 | 0.9% |
| Thai | 272 | 3.9% |
| Ukrainian | 119 | 1.7% |
| Welsh | 50 | 0.7% | View All 49 Rows |
Immigrants in Kingston Estates
The most numerous immigrant groups reported in Kingston Estates came from Asia (971 | 13.9%), Latin America (414 | 5.9%), South America (387 | 5.5%), South Eastern Asia (371 | 5.3%), and Eastern Asia (355 | 5.1%), together accounting for 35.7% of all Kingston Estates residents.
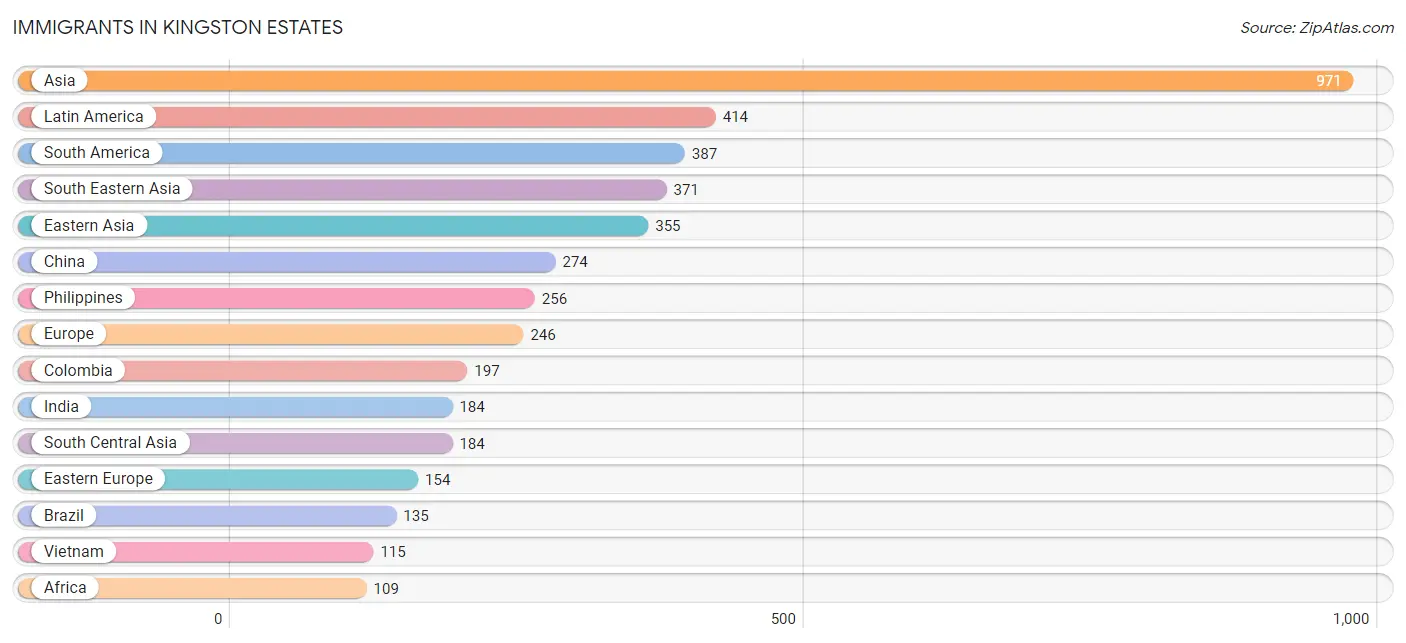
| Immigration Origin | # Population | % Population |
| Africa | 109 | 1.6% |
| Armenia | 11 | 0.2% |
| Asia | 971 | 13.9% |
| Brazil | 135 | 1.9% |
| Canada | 1 | 0.0% |
| Caribbean | 21 | 0.3% |
| Central America | 6 | 0.1% |
| China | 274 | 3.9% |
| Colombia | 197 | 2.8% |
| Cuba | 21 | 0.3% |
| Eastern Asia | 355 | 5.1% |
| Eastern Europe | 154 | 2.2% |
| Ecuador | 55 | 0.8% |
| Egypt | 17 | 0.2% |
| England | 15 | 0.2% |
| Europe | 246 | 3.5% |
| Germany | 21 | 0.3% |
| India | 184 | 2.6% |
| Jordan | 14 | 0.2% |
| Korea | 81 | 1.2% |
| Latin America | 414 | 5.9% |
| Lebanon | 15 | 0.2% |
| Mexico | 6 | 0.1% |
| Nigeria | 92 | 1.3% |
| Northern Africa | 17 | 0.2% |
| Northern Europe | 71 | 1.0% |
| Philippines | 256 | 3.7% |
| Poland | 42 | 0.6% |
| South America | 387 | 5.5% |
| South Central Asia | 184 | 2.6% |
| South Eastern Asia | 371 | 5.3% |
| Taiwan | 50 | 0.7% |
| Vietnam | 115 | 1.6% |
| Western Africa | 92 | 1.3% |
| Western Asia | 61 | 0.9% |
| Western Europe | 21 | 0.3% | View All 36 Rows |
Sex and Age in Kingston Estates
Sex and Age in Kingston Estates
The most populous age groups in Kingston Estates are 30 to 34 Years (645 | 18.5%) for men and 30 to 34 Years (380 | 10.8%) for women.
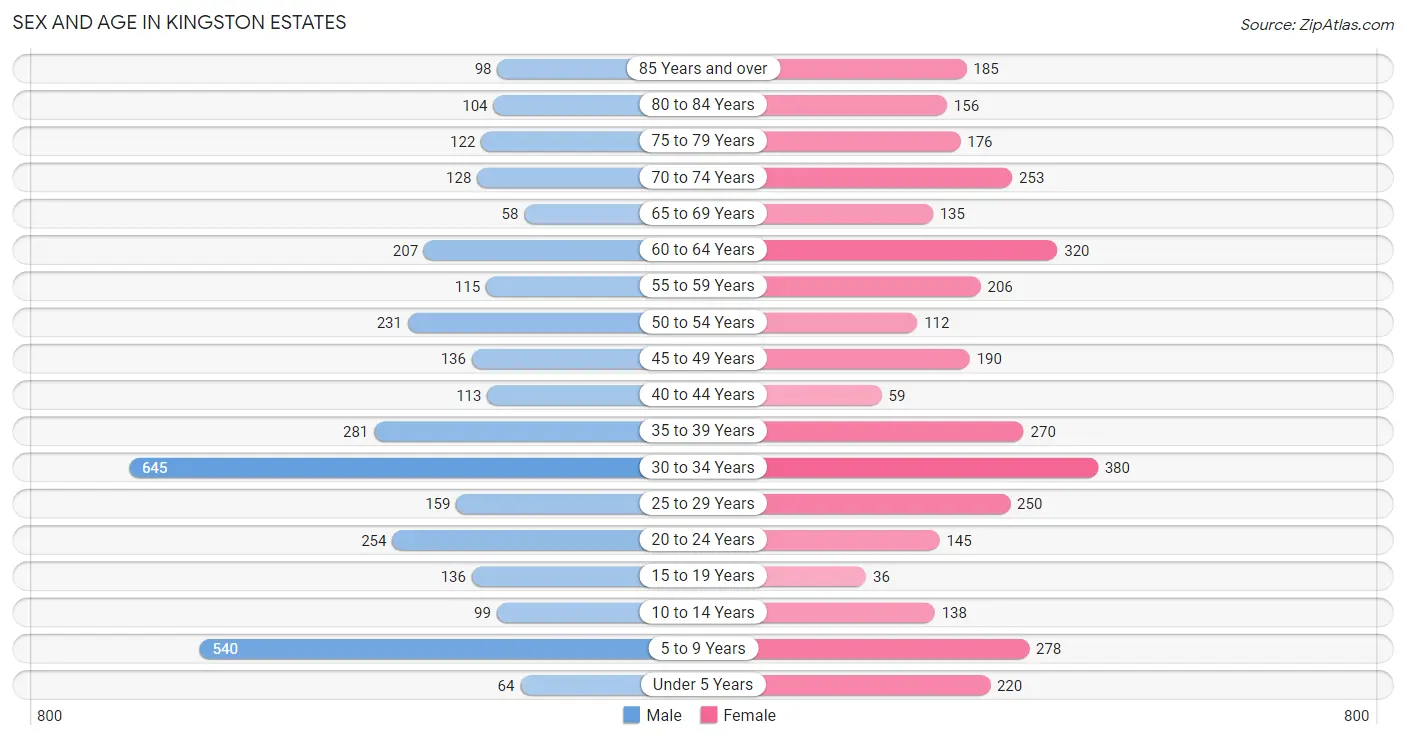
| Age Bracket | Male | Female |
| Under 5 Years | 64 (1.8%) | 220 (6.3%) |
| 5 to 9 Years | 540 (15.5%) | 278 (7.9%) |
| 10 to 14 Years | 99 (2.8%) | 138 (3.9%) |
| 15 to 19 Years | 136 (3.9%) | 36 (1.0%) |
| 20 to 24 Years | 254 (7.3%) | 145 (4.1%) |
| 25 to 29 Years | 159 (4.6%) | 250 (7.1%) |
| 30 to 34 Years | 645 (18.5%) | 380 (10.8%) |
| 35 to 39 Years | 281 (8.1%) | 270 (7.7%) |
| 40 to 44 Years | 113 (3.2%) | 59 (1.7%) |
| 45 to 49 Years | 136 (3.9%) | 190 (5.4%) |
| 50 to 54 Years | 231 (6.6%) | 112 (3.2%) |
| 55 to 59 Years | 115 (3.3%) | 206 (5.9%) |
| 60 to 64 Years | 207 (5.9%) | 320 (9.1%) |
| 65 to 69 Years | 58 (1.7%) | 135 (3.8%) |
| 70 to 74 Years | 128 (3.7%) | 253 (7.2%) |
| 75 to 79 Years | 122 (3.5%) | 176 (5.0%) |
| 80 to 84 Years | 104 (3.0%) | 156 (4.4%) |
| 85 Years and over | 98 (2.8%) | 185 (5.3%) |
| Total | 3,490 (100.0%) | 3,509 (100.0%) |
Families and Households in Kingston Estates
Median Family Size in Kingston Estates
The median family size in Kingston Estates is 3.20 persons per family, with single male/father families (105 | 6.1%) accounting for the largest median family size of 3.38 persons per family. On the other hand, married-couple families (1,307 | 75.7%) represent the smallest median family size with 3.18 persons per family.
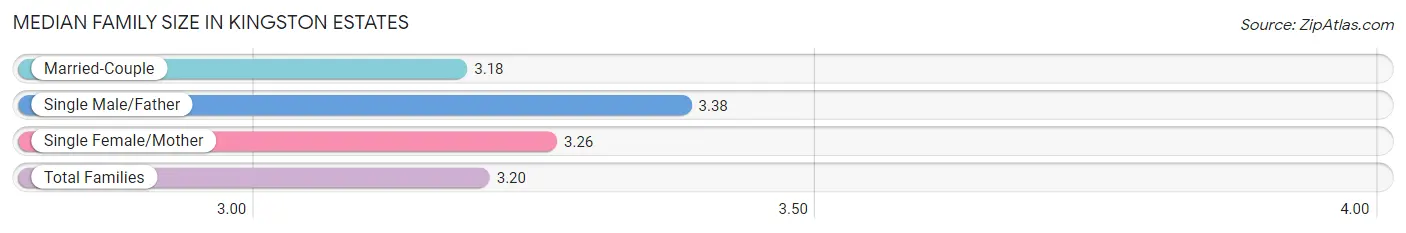
| Family Type | # Families | Family Size |
| Married-Couple | 1,307 (75.7%) | 3.18 |
| Single Male/Father | 105 (6.1%) | 3.38 |
| Single Female/Mother | 315 (18.2%) | 3.26 |
| Total Families | 1,727 (100.0%) | 3.20 |
Median Household Size in Kingston Estates
The median household size in Kingston Estates is 2.59 persons per household, with single male/father households (105 | 4.0%) accounting for the largest median household size of 3.71 persons per household. non-family households (933 | 35.1%) represent the smallest median household size with 1.35 persons per household.
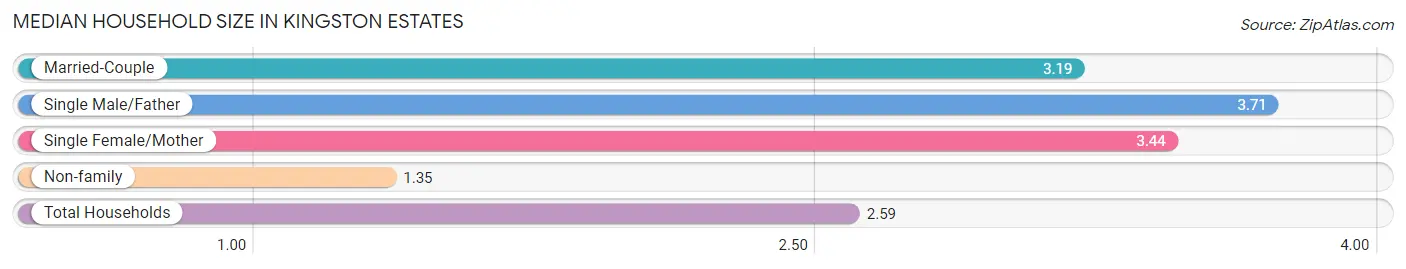
| Household Type | # Households | Household Size |
| Married-Couple | 1,307 (49.1%) | 3.19 |
| Single Male/Father | 105 (4.0%) | 3.71 |
| Single Female/Mother | 315 (11.8%) | 3.44 |
| Non-family | 933 (35.1%) | 1.35 |
| Total Households | 2,660 (100.0%) | 2.59 |
Household Size by Marriage Status in Kingston Estates
Out of a total of 2,660 households in Kingston Estates, 1,727 (64.9%) are family households, while 933 (35.1%) are nonfamily households. The most numerous type of family households are 2-person households, comprising 621, and the most common type of nonfamily households are 1-person households, comprising 710.
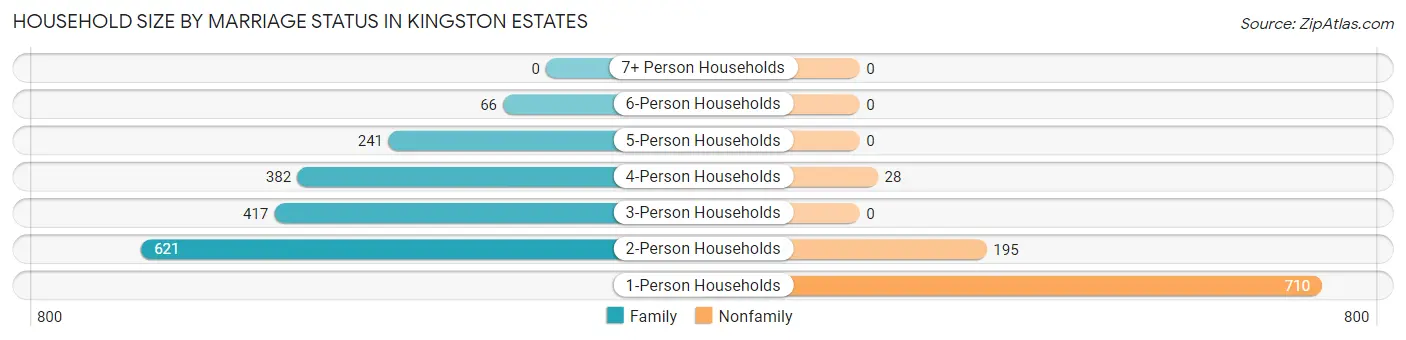
| Household Size | Family Households | Nonfamily Households |
| 1-Person Households | - | 710 (26.7%) |
| 2-Person Households | 621 (23.4%) | 195 (7.3%) |
| 3-Person Households | 417 (15.7%) | 0 (0.0%) |
| 4-Person Households | 382 (14.4%) | 28 (1.1%) |
| 5-Person Households | 241 (9.1%) | 0 (0.0%) |
| 6-Person Households | 66 (2.5%) | 0 (0.0%) |
| 7+ Person Households | 0 (0.0%) | 0 (0.0%) |
| Total | 1,727 (64.9%) | 933 (35.1%) |
Female Fertility in Kingston Estates
Fertility by Age in Kingston Estates
Average fertility rate in Kingston Estates is 23.0 births per 1,000 women. Women in the age bracket of 20 to 34 years have the highest fertility rate with 39.0 births per 1,000 women. Women in the age bracket of 20 to 34 years acount for 100.0% of all women with births.
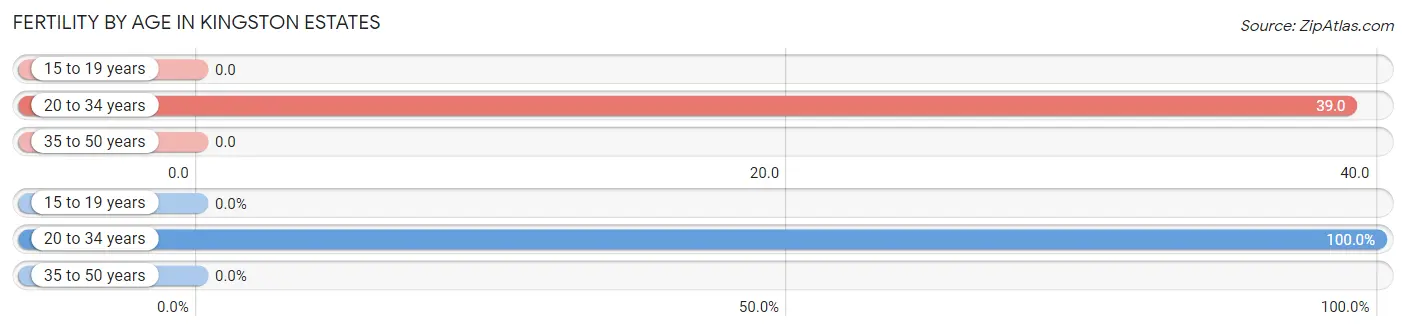
| Age Bracket | Women with Births | Births / 1,000 Women |
| 15 to 19 years | 0 (0.0%) | 0.0 |
| 20 to 34 years | 30 (100.0%) | 39.0 |
| 35 to 50 years | 0 (0.0%) | 0.0 |
| Total | 30 (100.0%) | 23.0 |
Fertility by Age by Marriage Status in Kingston Estates
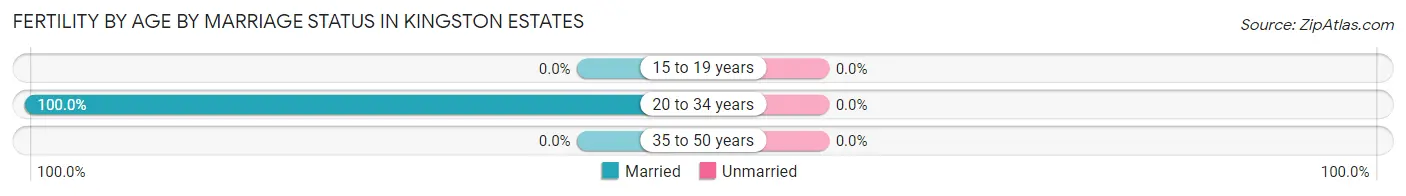
| Age Bracket | Married | Unmarried |
| 15 to 19 years | 0 (0.0%) | 0 (0.0%) |
| 20 to 34 years | 30 (100.0%) | 0 (0.0%) |
| 35 to 50 years | 0 (0.0%) | 0 (0.0%) |
| Total | 30 (100.0%) | 0 (0.0%) |
Fertility by Education in Kingston Estates
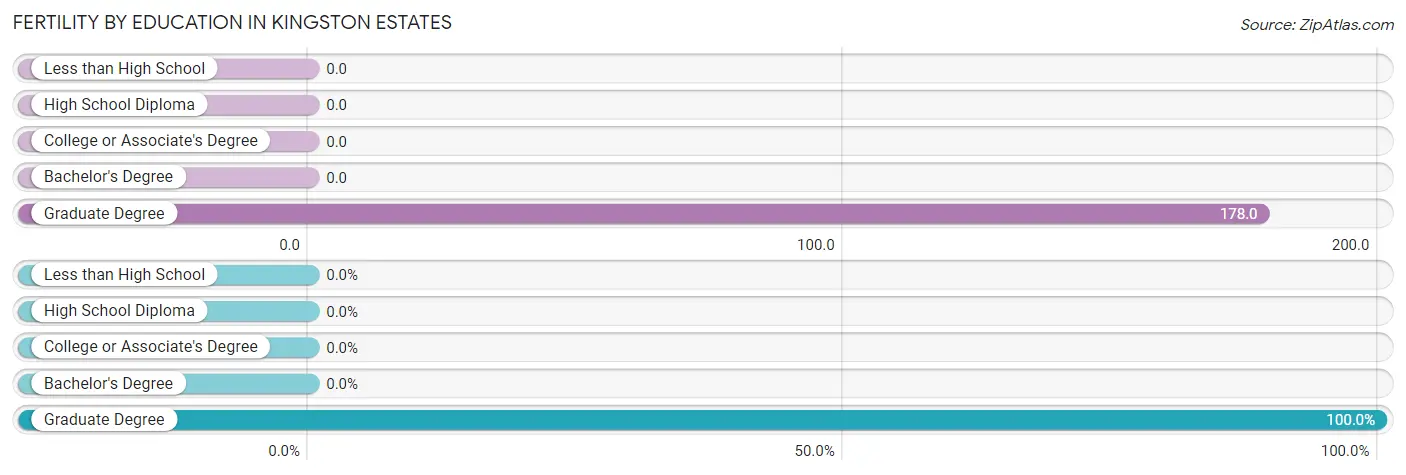
| Educational Attainment | Women with Births | Births / 1,000 Women |
| Less than High School | 0 (0.0%) | 0.0 |
| High School Diploma | 0 (0.0%) | 0.0 |
| College or Associate's Degree | 0 (0.0%) | 0.0 |
| Bachelor's Degree | 0 (0.0%) | 0.0 |
| Graduate Degree | 30 (100.0%) | 178.0 |
| Total | 30 (100.0%) | 23.0 |
Fertility by Education by Marriage Status in Kingston Estates
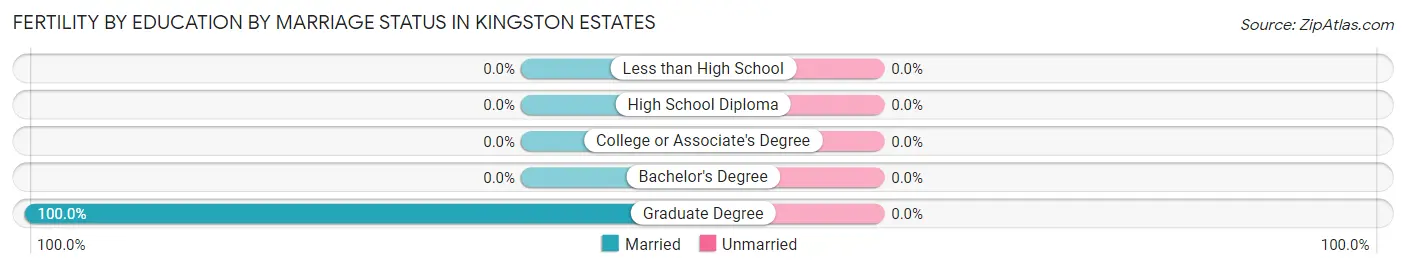
| Educational Attainment | Married | Unmarried |
| Less than High School | 0 (0.0%) | 0 (0.0%) |
| High School Diploma | 0 (0.0%) | 0 (0.0%) |
| College or Associate's Degree | 0 (0.0%) | 0 (0.0%) |
| Bachelor's Degree | 0 (0.0%) | 0 (0.0%) |
| Graduate Degree | 30 (100.0%) | 0 (0.0%) |
| Total | 30 (100.0%) | 0 (0.0%) |
Employment Characteristics in Kingston Estates
Employment by Class of Employer in Kingston Estates
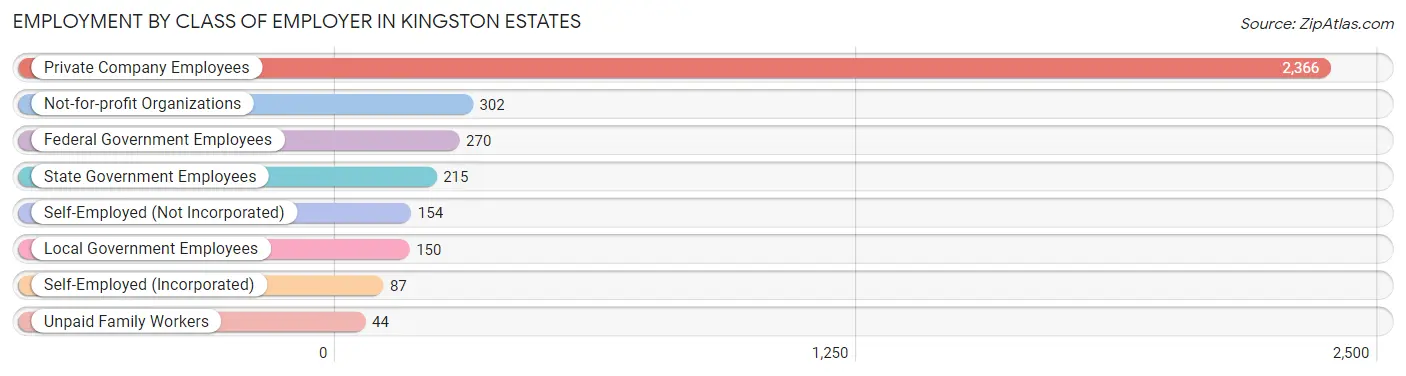
Among the 3,588 employed individuals in Kingston Estates, private company employees (2,366 | 65.9%), not-for-profit organizations (302 | 8.4%), and federal government employees (270 | 7.5%) make up the most common classes of employment.
| Employer Class | # Employees | % Employees |
| Private Company Employees | 2,366 | 65.9% |
| Self-Employed (Incorporated) | 87 | 2.4% |
| Self-Employed (Not Incorporated) | 154 | 4.3% |
| Not-for-profit Organizations | 302 | 8.4% |
| Local Government Employees | 150 | 4.2% |
| State Government Employees | 215 | 6.0% |
| Federal Government Employees | 270 | 7.5% |
| Unpaid Family Workers | 44 | 1.2% |
| Total | 3,588 | 100.0% |
Employment Status by Age in Kingston Estates
According to the labor force statistics for Kingston Estates, out of the total population over 16 years of age (5,660), 66.8% or 3,781 individuals are in the labor force, with 3.8% or 144 of them unemployed. The age group with the highest labor force participation rate is 25 to 29 years, with 96.3% or 394 individuals in the labor force. Within the labor force, the 75 years and over age range has the highest percentage of unemployed individuals, with 21.0% or 25 of them being unemployed.
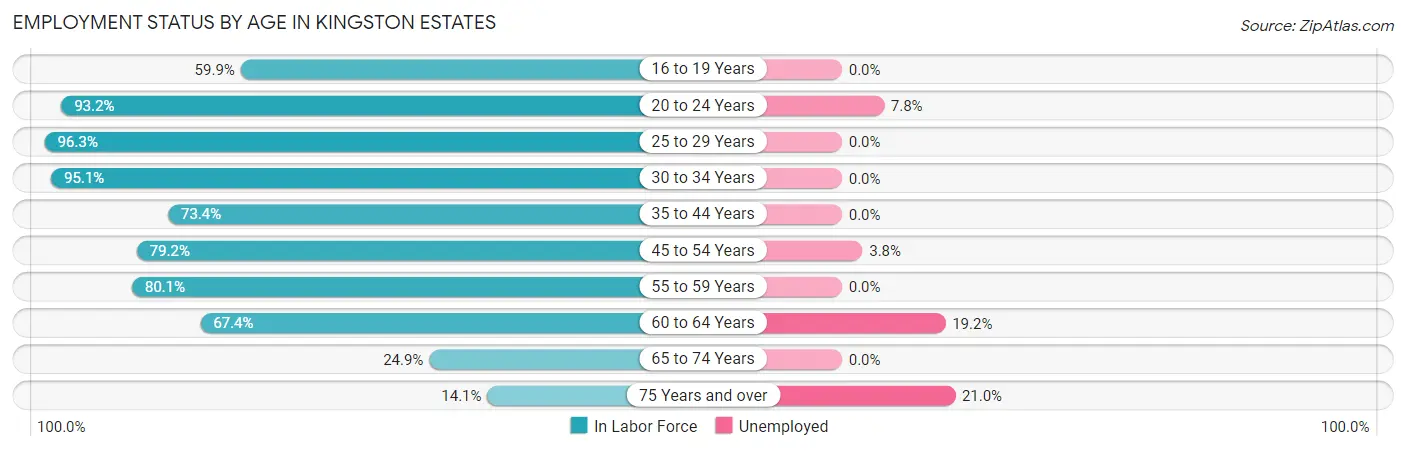
| Age Bracket | In Labor Force | Unemployed |
| 16 to 19 Years | 103 (59.9%) | 0 (0.0%) |
| 20 to 24 Years | 372 (93.2%) | 29 (7.8%) |
| 25 to 29 Years | 394 (96.3%) | 0 (0.0%) |
| 30 to 34 Years | 975 (95.1%) | 0 (0.0%) |
| 35 to 44 Years | 531 (73.4%) | 0 (0.0%) |
| 45 to 54 Years | 530 (79.2%) | 20 (3.8%) |
| 55 to 59 Years | 257 (80.1%) | 0 (0.0%) |
| 60 to 64 Years | 355 (67.4%) | 68 (19.2%) |
| 65 to 74 Years | 143 (24.9%) | 0 (0.0%) |
| 75 Years and over | 119 (14.1%) | 25 (21.0%) |
| Total | 3,781 (66.8%) | 144 (3.8%) |
Employment Status by Educational Attainment in Kingston Estates
According to labor force statistics for Kingston Estates, 82.8% of individuals (3,042) out of the total population between 25 and 64 years of age (3,674) are in the labor force, with 2.9% or 88 of them being unemployed. The group with the highest labor force participation rate are those with the educational attainment of college / associate degree, with 85.4% or 898 individuals in the labor force. Within the labor force, individuals with high school diploma education have the highest percentage of unemployment, with 9.5% or 75 of them being unemployed.
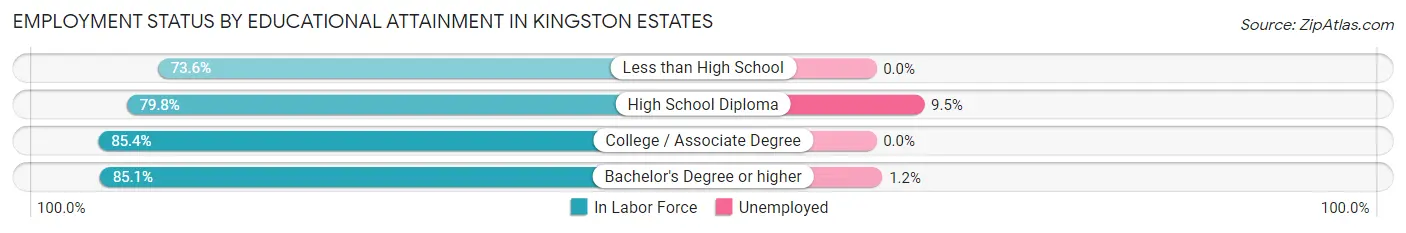
| Educational Attainment | In Labor Force | Unemployed |
| Less than High School | 226 (73.6%) | 0 (0.0%) |
| High School Diploma | 789 (79.8%) | 94 (9.5%) |
| College / Associate Degree | 898 (85.4%) | 0 (0.0%) |
| Bachelor's Degree or higher | 1,129 (85.1%) | 16 (1.2%) |
| Total | 3,042 (82.8%) | 107 (2.9%) |
Employment Occupations by Sex in Kingston Estates
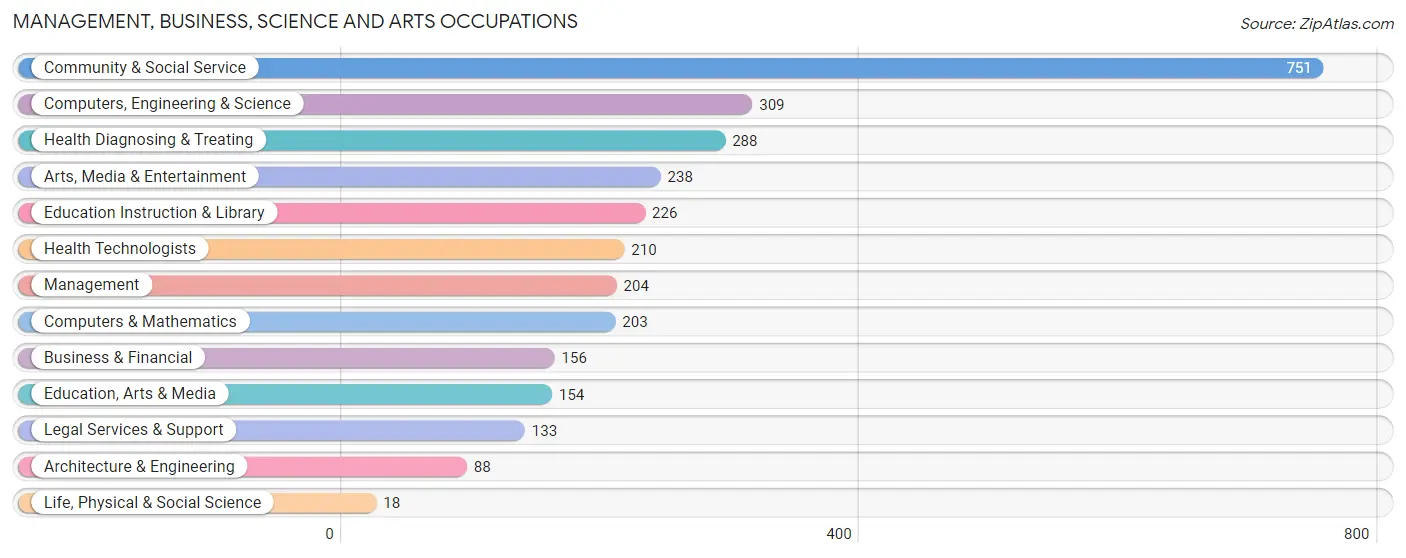
Management, Business, Science and Arts Occupations
The most common Management, Business, Science and Arts occupations in Kingston Estates are Community & Social Service (751 | 20.6%), Computers, Engineering & Science (309 | 8.5%), Health Diagnosing & Treating (288 | 7.9%), Arts, Media & Entertainment (238 | 6.5%), and Education Instruction & Library (226 | 6.2%).
Management, Business, Science and Arts Occupations by Sex
Within the Management, Business, Science and Arts occupations in Kingston Estates, the most male-oriented occupations are Architecture & Engineering (100.0%), Life, Physical & Social Science (100.0%), and Arts, Media & Entertainment (89.1%), while the most female-oriented occupations are Legal Services & Support (100.0%), Health Diagnosing & Treating (82.6%), and Health Technologists (76.2%).
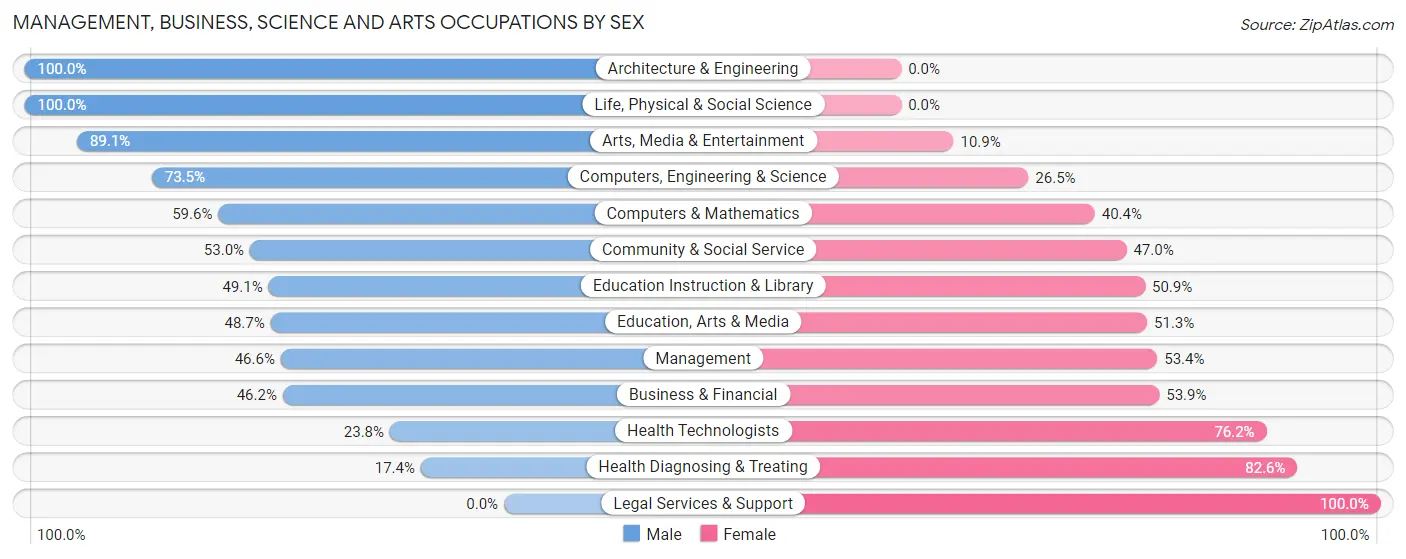
| Occupation | Male | Female |
| Management | 95 (46.6%) | 109 (53.4%) |
| Business & Financial | 72 (46.2%) | 84 (53.8%) |
| Computers, Engineering & Science | 227 (73.5%) | 82 (26.5%) |
| Computers & Mathematics | 121 (59.6%) | 82 (40.4%) |
| Architecture & Engineering | 88 (100.0%) | 0 (0.0%) |
| Life, Physical & Social Science | 18 (100.0%) | 0 (0.0%) |
| Community & Social Service | 398 (53.0%) | 353 (47.0%) |
| Education, Arts & Media | 75 (48.7%) | 79 (51.3%) |
| Legal Services & Support | 0 (0.0%) | 133 (100.0%) |
| Education Instruction & Library | 111 (49.1%) | 115 (50.9%) |
| Arts, Media & Entertainment | 212 (89.1%) | 26 (10.9%) |
| Health Diagnosing & Treating | 50 (17.4%) | 238 (82.6%) |
| Health Technologists | 50 (23.8%) | 160 (76.2%) |
| Total (Category) | 842 (49.3%) | 866 (50.7%) |
| Total (Overall) | 2,046 (56.3%) | 1,591 (43.7%) |
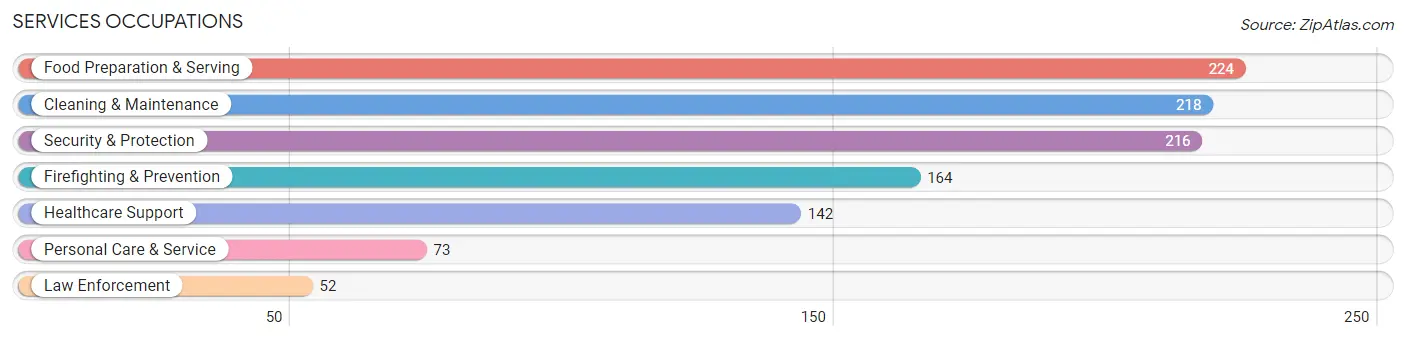
Services Occupations
The most common Services occupations in Kingston Estates are Food Preparation & Serving (224 | 6.2%), Cleaning & Maintenance (218 | 6.0%), Security & Protection (216 | 5.9%), Firefighting & Prevention (164 | 4.5%), and Healthcare Support (142 | 3.9%).
Services Occupations by Sex
Within the Services occupations in Kingston Estates, the most male-oriented occupations are Law Enforcement (100.0%), Security & Protection (95.4%), and Firefighting & Prevention (93.9%), while the most female-oriented occupations are Personal Care & Service (61.6%), Food Preparation & Serving (56.7%), and Healthcare Support (52.8%).
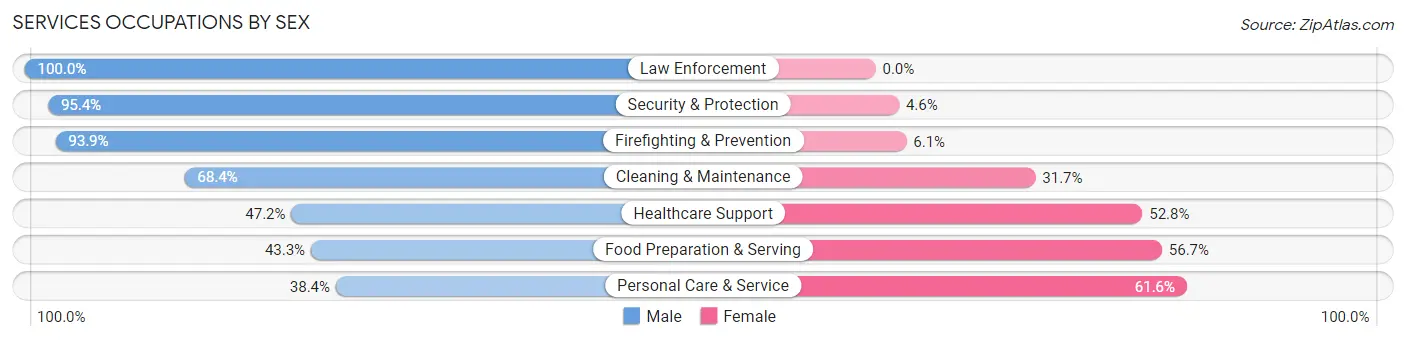
| Occupation | Male | Female |
| Healthcare Support | 67 (47.2%) | 75 (52.8%) |
| Security & Protection | 206 (95.4%) | 10 (4.6%) |
| Firefighting & Prevention | 154 (93.9%) | 10 (6.1%) |
| Law Enforcement | 52 (100.0%) | 0 (0.0%) |
| Food Preparation & Serving | 97 (43.3%) | 127 (56.7%) |
| Cleaning & Maintenance | 149 (68.3%) | 69 (31.7%) |
| Personal Care & Service | 28 (38.4%) | 45 (61.6%) |
| Total (Category) | 547 (62.7%) | 326 (37.3%) |
| Total (Overall) | 2,046 (56.3%) | 1,591 (43.7%) |
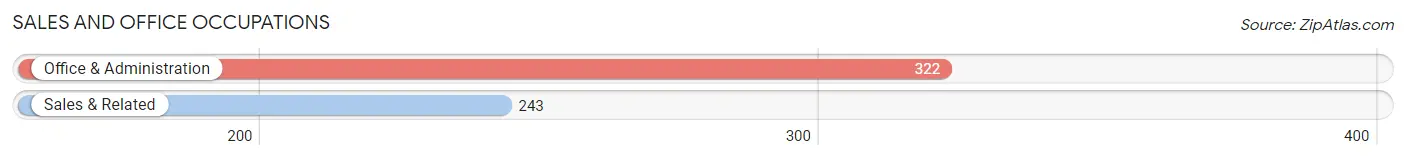
Sales and Office Occupations
The most common Sales and Office occupations in Kingston Estates are Office & Administration (322 | 8.8%), and Sales & Related (243 | 6.7%).
Sales and Office Occupations by Sex
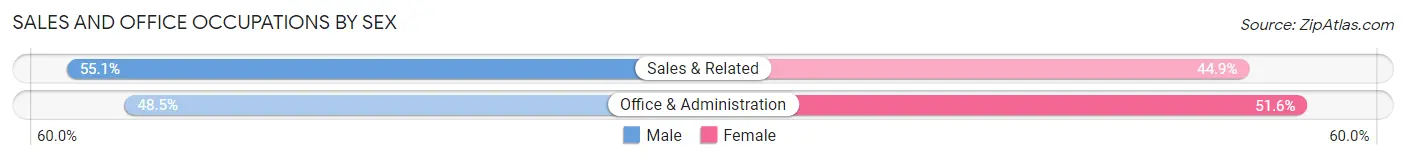
| Occupation | Male | Female |
| Sales & Related | 134 (55.1%) | 109 (44.9%) |
| Office & Administration | 156 (48.4%) | 166 (51.5%) |
| Total (Category) | 290 (51.3%) | 275 (48.7%) |
| Total (Overall) | 2,046 (56.3%) | 1,591 (43.7%) |
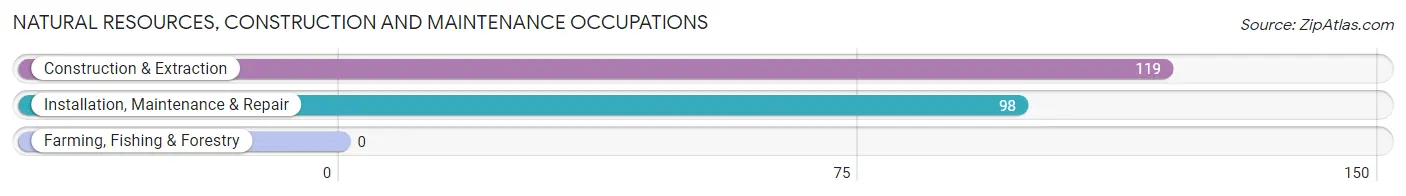
Natural Resources, Construction and Maintenance Occupations
The most common Natural Resources, Construction and Maintenance occupations in Kingston Estates are Construction & Extraction (119 | 3.3%), and Installation, Maintenance & Repair (98 | 2.7%).
Natural Resources, Construction and Maintenance Occupations by Sex
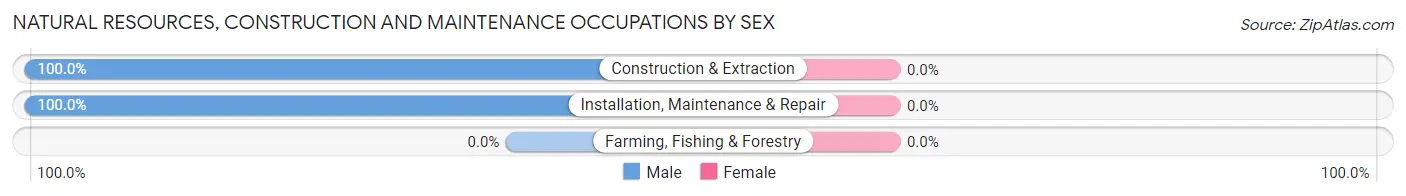
| Occupation | Male | Female |
| Farming, Fishing & Forestry | 0 (0.0%) | 0 (0.0%) |
| Construction & Extraction | 119 (100.0%) | 0 (0.0%) |
| Installation, Maintenance & Repair | 98 (100.0%) | 0 (0.0%) |
| Total (Category) | 217 (100.0%) | 0 (0.0%) |
| Total (Overall) | 2,046 (56.3%) | 1,591 (43.7%) |
Production, Transportation and Moving Occupations
The most common Production, Transportation and Moving occupations in Kingston Estates are Production (145 | 4.0%), Material Moving (90 | 2.5%), and Transportation (39 | 1.1%).
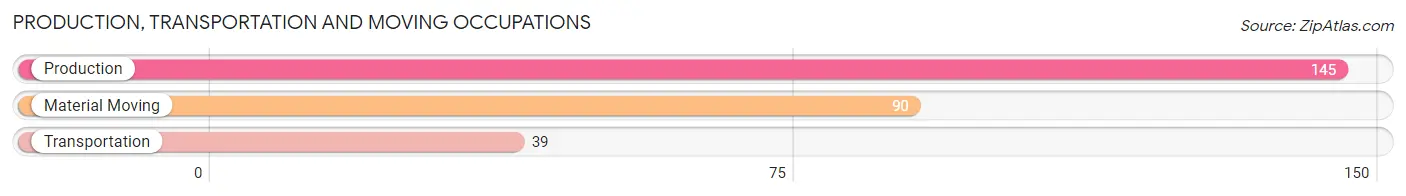
Production, Transportation and Moving Occupations by Sex
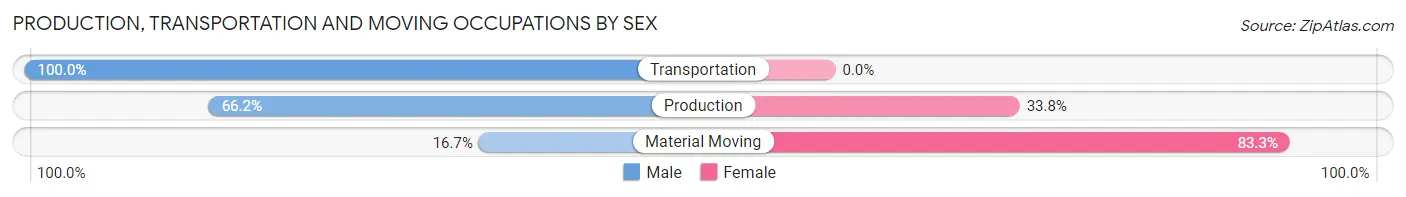
| Occupation | Male | Female |
| Production | 96 (66.2%) | 49 (33.8%) |
| Transportation | 39 (100.0%) | 0 (0.0%) |
| Material Moving | 15 (16.7%) | 75 (83.3%) |
| Total (Category) | 150 (54.7%) | 124 (45.3%) |
| Total (Overall) | 2,046 (56.3%) | 1,591 (43.7%) |
Employment Industries by Sex in Kingston Estates
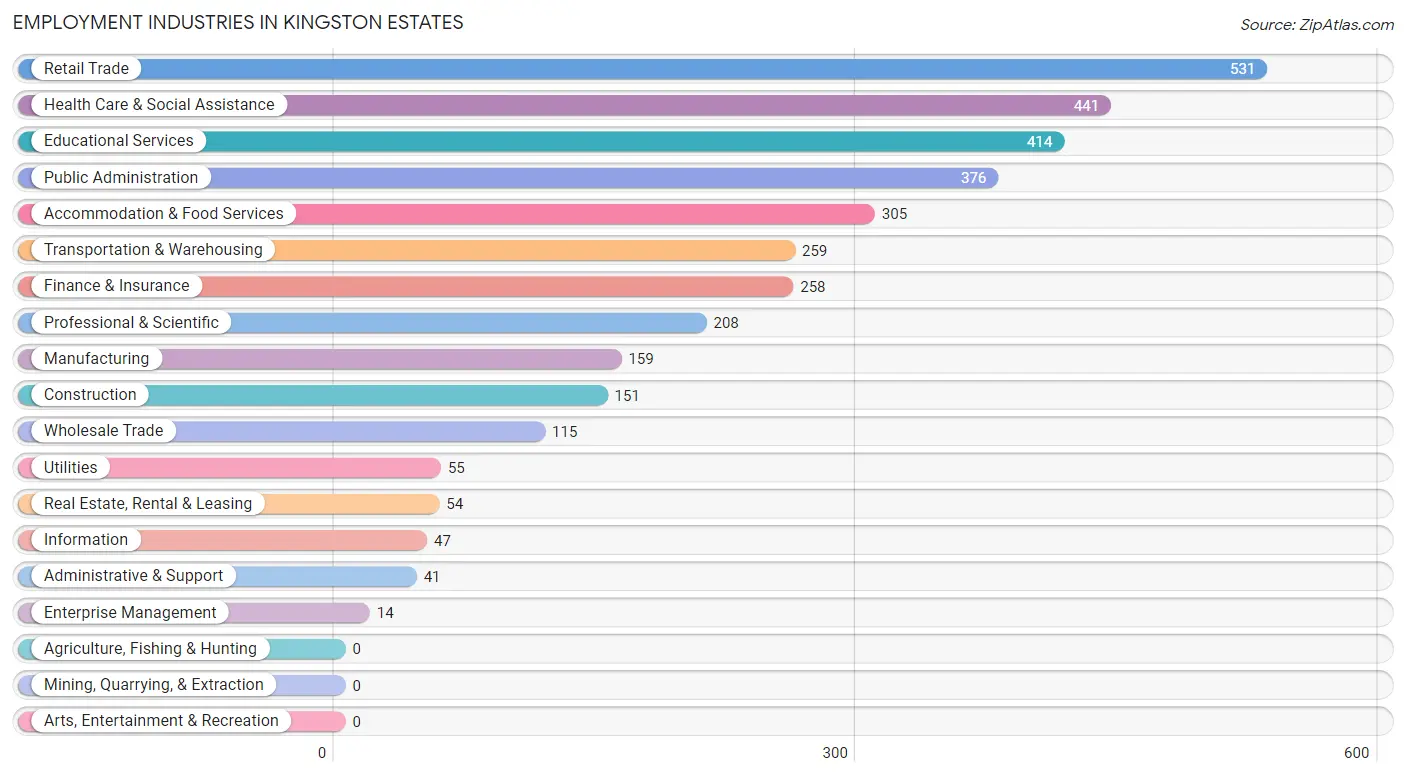
Employment Industries in Kingston Estates
The major employment industries in Kingston Estates include Retail Trade (531 | 14.6%), Health Care & Social Assistance (441 | 12.1%), Educational Services (414 | 11.4%), Public Administration (376 | 10.3%), and Accommodation & Food Services (305 | 8.4%).
Employment Industries by Sex in Kingston Estates
The Kingston Estates industries that see more men than women are Utilities (100.0%), Real Estate, Rental & Leasing (100.0%), and Enterprise Management (100.0%), whereas the industries that tend to have a higher number of women are Finance & Insurance (78.7%), Health Care & Social Assistance (75.1%), and Accommodation & Food Services (68.2%).
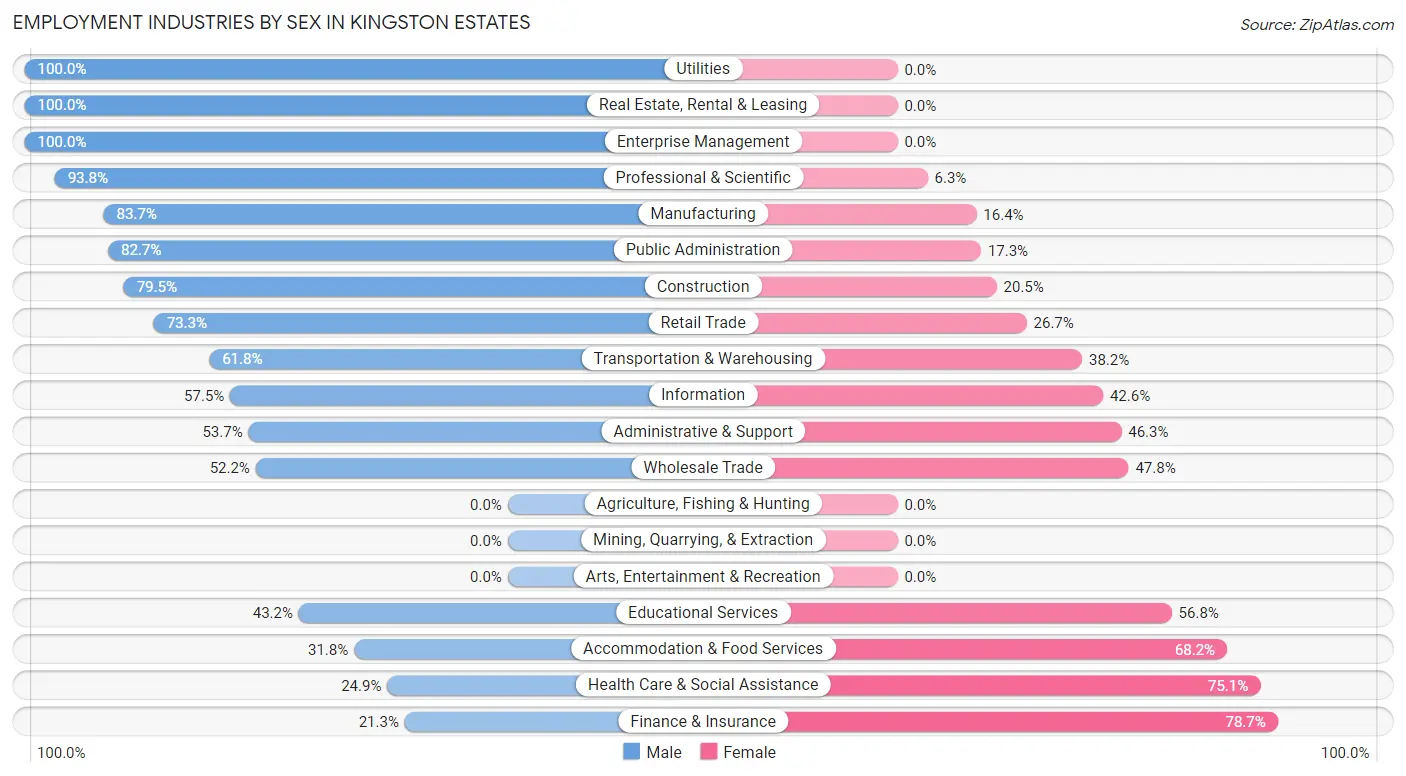
| Industry | Male | Female |
| Agriculture, Fishing & Hunting | 0 (0.0%) | 0 (0.0%) |
| Mining, Quarrying, & Extraction | 0 (0.0%) | 0 (0.0%) |
| Construction | 120 (79.5%) | 31 (20.5%) |
| Manufacturing | 133 (83.7%) | 26 (16.4%) |
| Wholesale Trade | 60 (52.2%) | 55 (47.8%) |
| Retail Trade | 389 (73.3%) | 142 (26.7%) |
| Transportation & Warehousing | 160 (61.8%) | 99 (38.2%) |
| Utilities | 55 (100.0%) | 0 (0.0%) |
| Information | 27 (57.5%) | 20 (42.5%) |
| Finance & Insurance | 55 (21.3%) | 203 (78.7%) |
| Real Estate, Rental & Leasing | 54 (100.0%) | 0 (0.0%) |
| Professional & Scientific | 195 (93.8%) | 13 (6.2%) |
| Enterprise Management | 14 (100.0%) | 0 (0.0%) |
| Administrative & Support | 22 (53.7%) | 19 (46.3%) |
| Educational Services | 179 (43.2%) | 235 (56.8%) |
| Health Care & Social Assistance | 110 (24.9%) | 331 (75.1%) |
| Arts, Entertainment & Recreation | 0 (0.0%) | 0 (0.0%) |
| Accommodation & Food Services | 97 (31.8%) | 208 (68.2%) |
| Public Administration | 311 (82.7%) | 65 (17.3%) |
| Total | 2,046 (56.3%) | 1,591 (43.7%) |
Education in Kingston Estates
School Enrollment in Kingston Estates
The most common levels of schooling among the 1,717 students in Kingston Estates are elementary school (587 | 34.2%), college / undergraduate (344 | 20.0%), and middle school (252 | 14.7%).
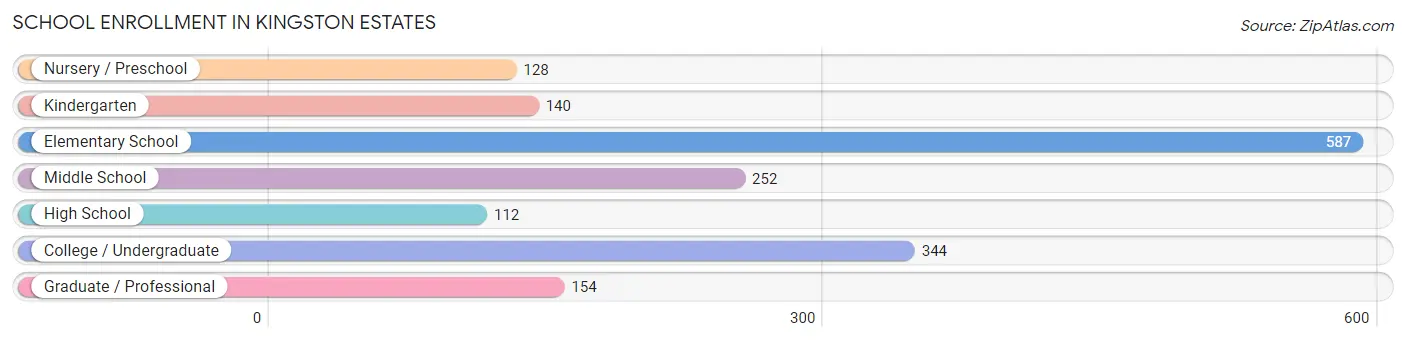
| School Level | # Students | % Students |
| Nursery / Preschool | 128 | 7.4% |
| Kindergarten | 140 | 8.2% |
| Elementary School | 587 | 34.2% |
| Middle School | 252 | 14.7% |
| High School | 112 | 6.5% |
| College / Undergraduate | 344 | 20.0% |
| Graduate / Professional | 154 | 9.0% |
| Total | 1,717 | 100.0% |
School Enrollment by Age by Funding Source in Kingston Estates
Out of a total of 1,717 students who are enrolled in schools in Kingston Estates, 271 (15.8%) attend a private institution, while the remaining 1,446 (84.2%) are enrolled in public schools. The age group of 3 to 4 year olds has the highest likelihood of being enrolled in private schools, with 42 (65.6% in the age bracket) enrolled. Conversely, the age group of 10 to 14 year olds has the lowest likelihood of being enrolled in a private school, with 237 (100.0% in the age bracket) attending a public institution.
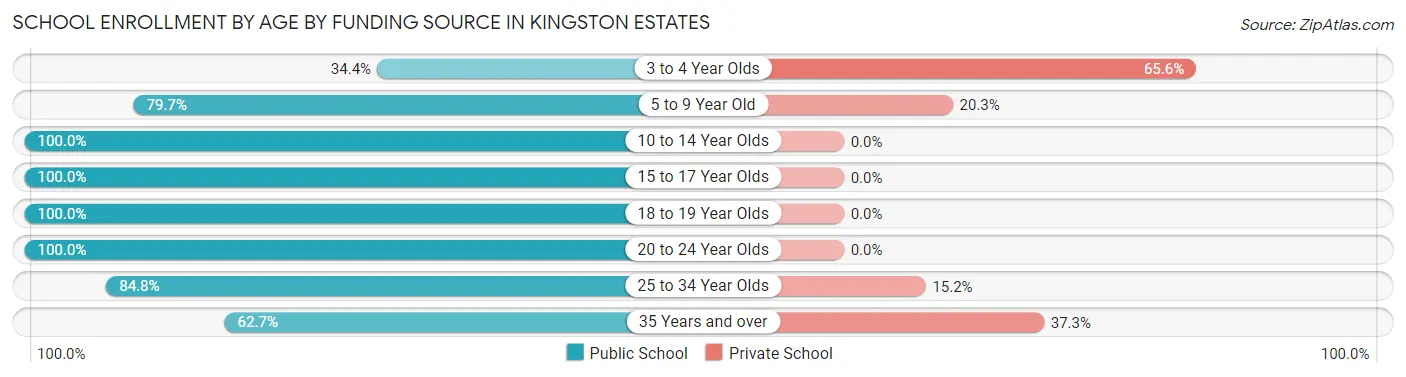
| Age Bracket | Public School | Private School |
| 3 to 4 Year Olds | 22 (34.4%) | 42 (65.6%) |
| 5 to 9 Year Old | 652 (79.7%) | 166 (20.3%) |
| 10 to 14 Year Olds | 237 (100.0%) | 0 (0.0%) |
| 15 to 17 Year Olds | 73 (100.0%) | 0 (0.0%) |
| 18 to 19 Year Olds | 72 (100.0%) | 0 (0.0%) |
| 20 to 24 Year Olds | 192 (100.0%) | 0 (0.0%) |
| 25 to 34 Year Olds | 128 (84.8%) | 23 (15.2%) |
| 35 Years and over | 69 (62.7%) | 41 (37.3%) |
| Total | 1,446 (84.2%) | 271 (15.8%) |
Educational Attainment by Field of Study in Kingston Estates
Business (292 | 15.4%), engineering (225 | 11.9%), education (202 | 10.6%), bio, nature & agricultural (200 | 10.5%), and literature & languages (182 | 9.6%) are the most common fields of study among 1,897 individuals in Kingston Estates who have obtained a bachelor's degree or higher.
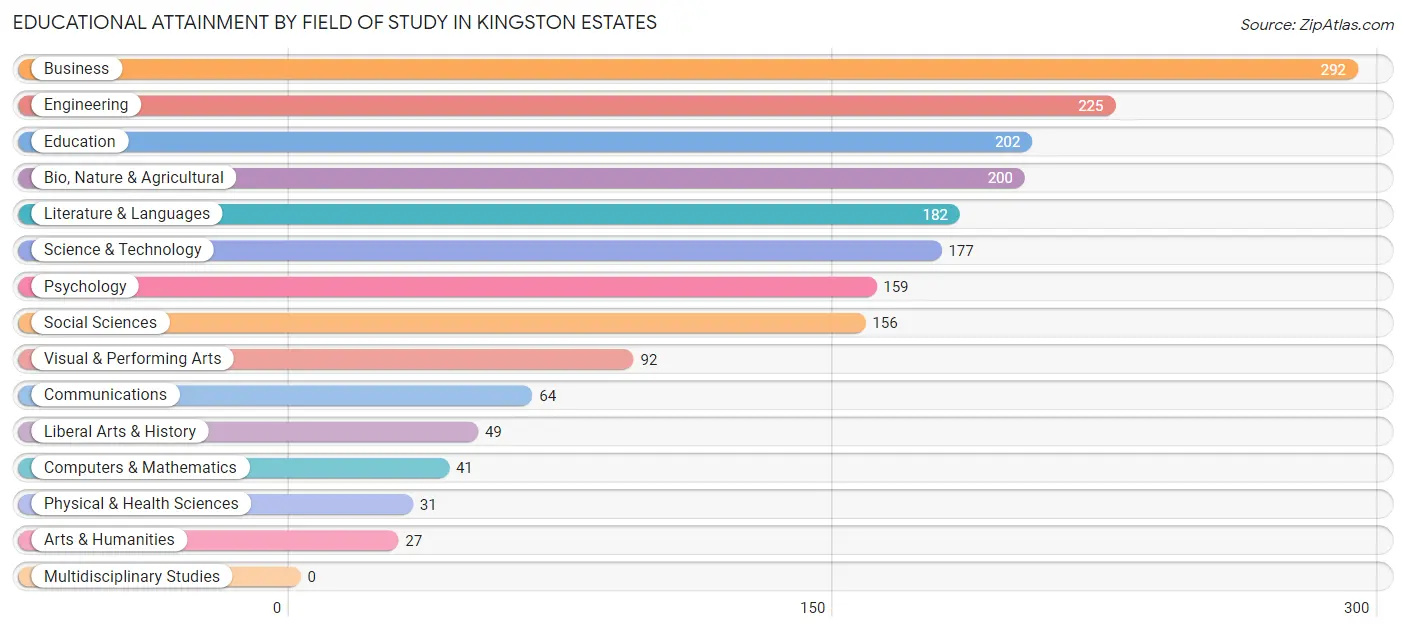
| Field of Study | # Graduates | % Graduates |
| Computers & Mathematics | 41 | 2.2% |
| Bio, Nature & Agricultural | 200 | 10.5% |
| Physical & Health Sciences | 31 | 1.6% |
| Psychology | 159 | 8.4% |
| Social Sciences | 156 | 8.2% |
| Engineering | 225 | 11.9% |
| Multidisciplinary Studies | 0 | 0.0% |
| Science & Technology | 177 | 9.3% |
| Business | 292 | 15.4% |
| Education | 202 | 10.6% |
| Literature & Languages | 182 | 9.6% |
| Liberal Arts & History | 49 | 2.6% |
| Visual & Performing Arts | 92 | 4.9% |
| Communications | 64 | 3.4% |
| Arts & Humanities | 27 | 1.4% |
| Total | 1,897 | 100.0% |
Transportation & Commute in Kingston Estates
Vehicle Availability by Sex in Kingston Estates
The most prevalent vehicle ownership categories in Kingston Estates are males with 2 vehicles (895, accounting for 43.7%) and females with 2 vehicles (836, making up 58.0%).
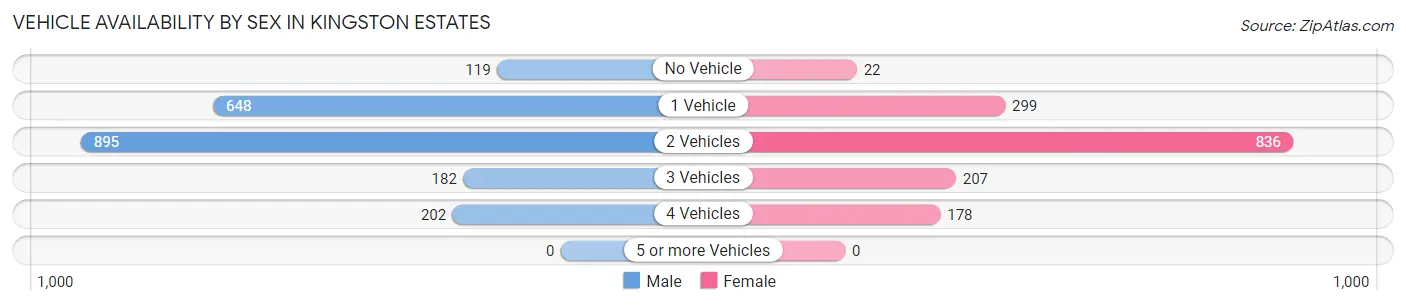
| Vehicles Available | Male | Female |
| No Vehicle | 119 (5.8%) | 22 (1.4%) |
| 1 Vehicle | 648 (31.7%) | 299 (19.4%) |
| 2 Vehicles | 895 (43.7%) | 836 (54.2%) |
| 3 Vehicles | 182 (8.9%) | 207 (13.4%) |
| 4 Vehicles | 202 (9.9%) | 178 (11.5%) |
| 5 or more Vehicles | 0 (0.0%) | 0 (0.0%) |
| Total | 2,046 (100.0%) | 1,542 (100.0%) |
Commute Time in Kingston Estates
The most frequently occuring commute durations in Kingston Estates are 25 to 29 minutes (649 commuters, 19.6%), 15 to 19 minutes (590 commuters, 17.8%), and 20 to 24 minutes (535 commuters, 16.2%).
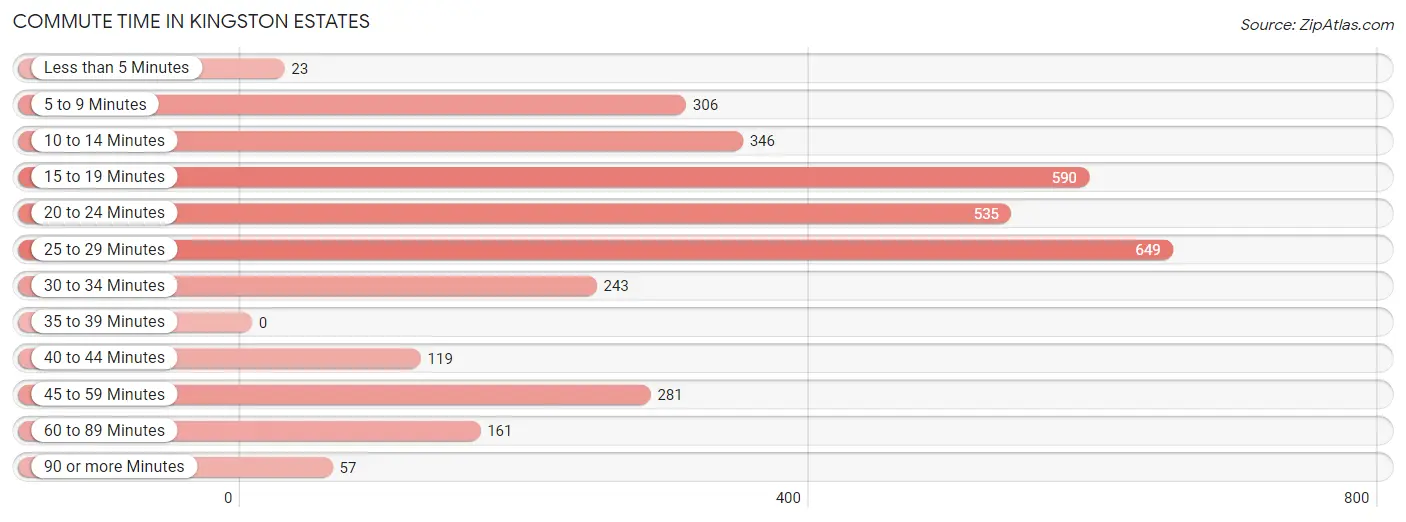
| Commute Time | # Commuters | % Commuters |
| Less than 5 Minutes | 23 | 0.7% |
| 5 to 9 Minutes | 306 | 9.2% |
| 10 to 14 Minutes | 346 | 10.4% |
| 15 to 19 Minutes | 590 | 17.8% |
| 20 to 24 Minutes | 535 | 16.2% |
| 25 to 29 Minutes | 649 | 19.6% |
| 30 to 34 Minutes | 243 | 7.3% |
| 35 to 39 Minutes | 0 | 0.0% |
| 40 to 44 Minutes | 119 | 3.6% |
| 45 to 59 Minutes | 281 | 8.5% |
| 60 to 89 Minutes | 161 | 4.9% |
| 90 or more Minutes | 57 | 1.7% |
Commute Time by Sex in Kingston Estates
The most common commute times in Kingston Estates are 25 to 29 minutes (440 commuters, 23.3%) for males and 20 to 24 minutes (253 commuters, 17.8%) for females.
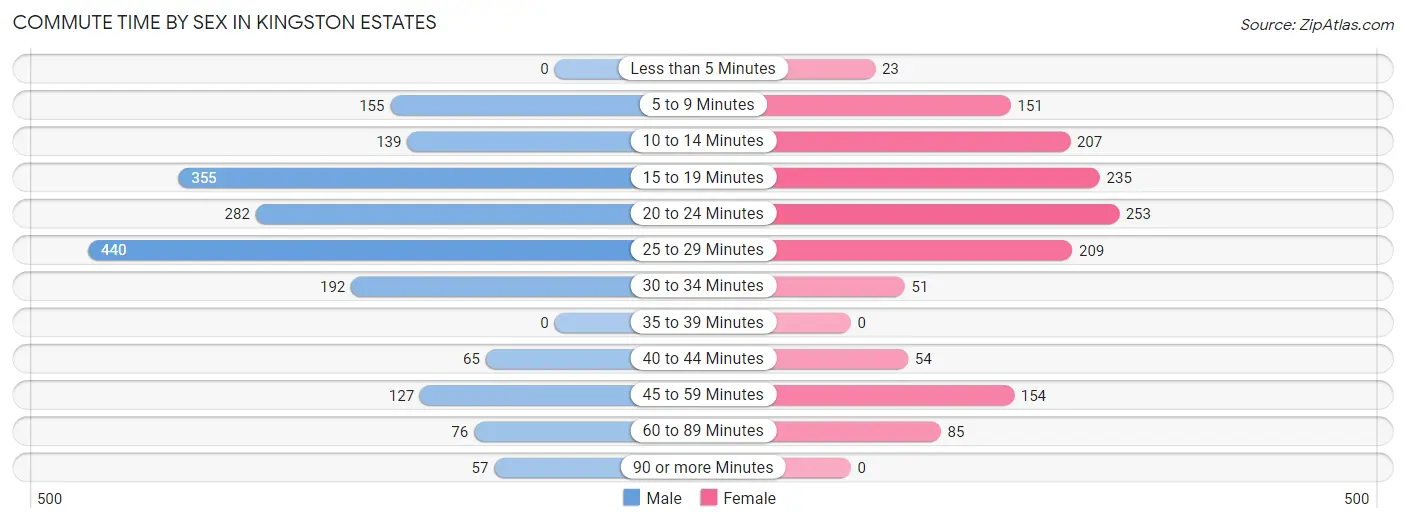
| Commute Time | Male | Female |
| Less than 5 Minutes | 0 (0.0%) | 23 (1.6%) |
| 5 to 9 Minutes | 155 (8.2%) | 151 (10.6%) |
| 10 to 14 Minutes | 139 (7.4%) | 207 (14.6%) |
| 15 to 19 Minutes | 355 (18.8%) | 235 (16.5%) |
| 20 to 24 Minutes | 282 (14.9%) | 253 (17.8%) |
| 25 to 29 Minutes | 440 (23.3%) | 209 (14.7%) |
| 30 to 34 Minutes | 192 (10.2%) | 51 (3.6%) |
| 35 to 39 Minutes | 0 (0.0%) | 0 (0.0%) |
| 40 to 44 Minutes | 65 (3.4%) | 54 (3.8%) |
| 45 to 59 Minutes | 127 (6.7%) | 154 (10.8%) |
| 60 to 89 Minutes | 76 (4.0%) | 85 (6.0%) |
| 90 or more Minutes | 57 (3.0%) | 0 (0.0%) |
Time of Departure to Work by Sex in Kingston Estates
The most frequent times of departure to work in Kingston Estates are 7:00 AM to 7:29 AM (607, 32.2%) for males and 11:00 AM to 11:59 AM (242, 17.0%) for females.
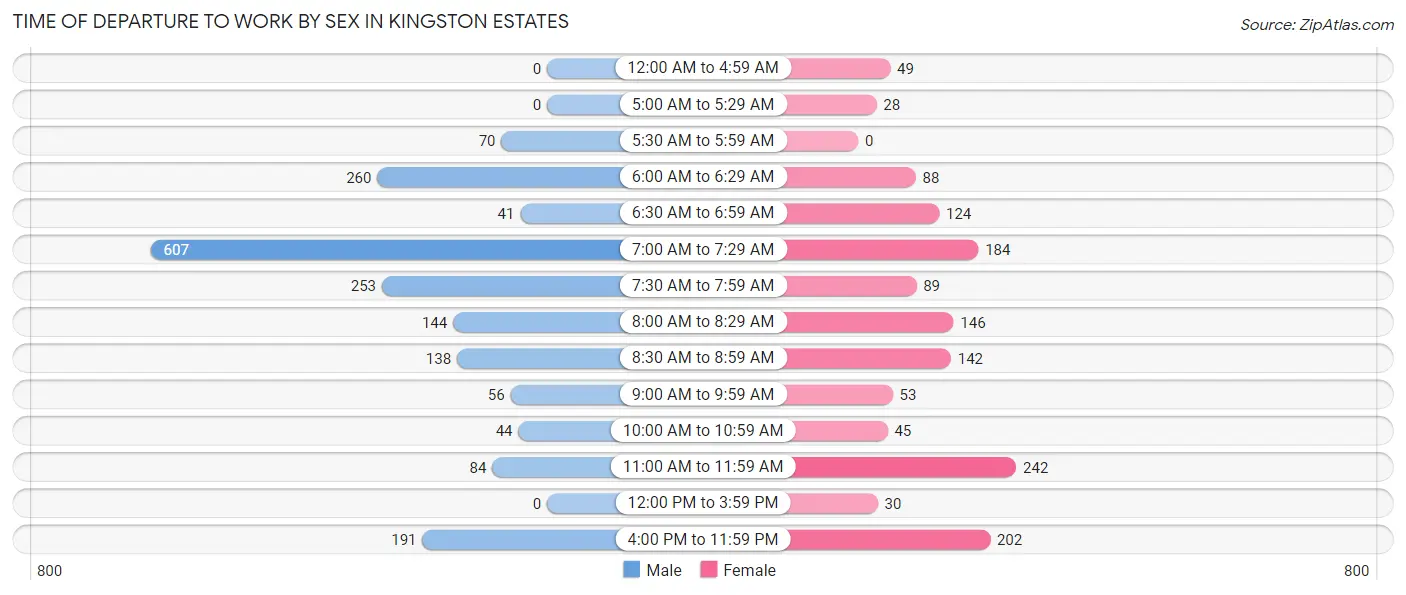
| Time of Departure | Male | Female |
| 12:00 AM to 4:59 AM | 0 (0.0%) | 49 (3.5%) |
| 5:00 AM to 5:29 AM | 0 (0.0%) | 28 (2.0%) |
| 5:30 AM to 5:59 AM | 70 (3.7%) | 0 (0.0%) |
| 6:00 AM to 6:29 AM | 260 (13.8%) | 88 (6.2%) |
| 6:30 AM to 6:59 AM | 41 (2.2%) | 124 (8.7%) |
| 7:00 AM to 7:29 AM | 607 (32.2%) | 184 (12.9%) |
| 7:30 AM to 7:59 AM | 253 (13.4%) | 89 (6.3%) |
| 8:00 AM to 8:29 AM | 144 (7.6%) | 146 (10.3%) |
| 8:30 AM to 8:59 AM | 138 (7.3%) | 142 (10.0%) |
| 9:00 AM to 9:59 AM | 56 (3.0%) | 53 (3.7%) |
| 10:00 AM to 10:59 AM | 44 (2.3%) | 45 (3.2%) |
| 11:00 AM to 11:59 AM | 84 (4.4%) | 242 (17.0%) |
| 12:00 PM to 3:59 PM | 0 (0.0%) | 30 (2.1%) |
| 4:00 PM to 11:59 PM | 191 (10.1%) | 202 (14.2%) |
| Total | 1,888 (100.0%) | 1,422 (100.0%) |
Housing Occupancy in Kingston Estates
Occupancy by Ownership in Kingston Estates
Of the total 2,660 dwellings in Kingston Estates, owner-occupied units account for 1,742 (65.5%), while renter-occupied units make up 918 (34.5%).
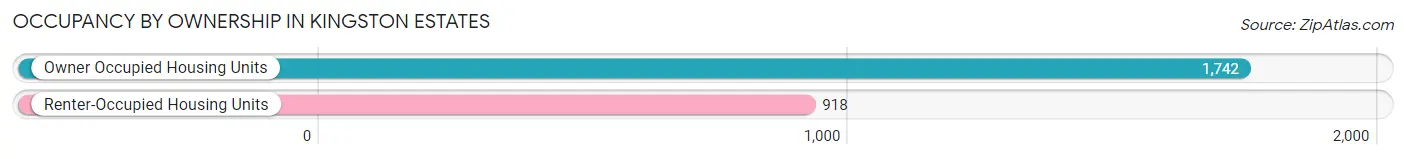
| Occupancy | # Housing Units | % Housing Units |
| Owner Occupied Housing Units | 1,742 | 65.5% |
| Renter-Occupied Housing Units | 918 | 34.5% |
| Total Occupied Housing Units | 2,660 | 100.0% |
Occupancy by Household Size in Kingston Estates
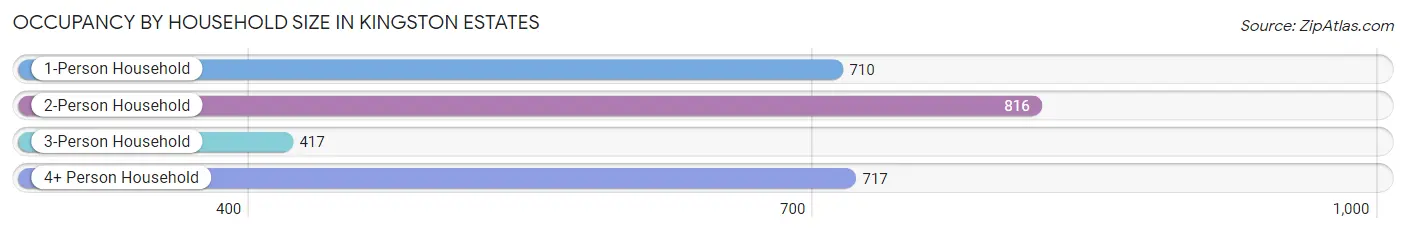
| Household Size | # Housing Units | % Housing Units |
| 1-Person Household | 710 | 26.7% |
| 2-Person Household | 816 | 30.7% |
| 3-Person Household | 417 | 15.7% |
| 4+ Person Household | 717 | 27.0% |
| Total Housing Units | 2,660 | 100.0% |
Occupancy by Ownership by Household Size in Kingston Estates
| Household Size | Owner-occupied | Renter-occupied |
| 1-Person Household | 311 (43.8%) | 399 (56.2%) |
| 2-Person Household | 597 (73.2%) | 219 (26.8%) |
| 3-Person Household | 372 (89.2%) | 45 (10.8%) |
| 4+ Person Household | 462 (64.4%) | 255 (35.6%) |
| Total Housing Units | 1,742 (65.5%) | 918 (34.5%) |
Occupancy by Educational Attainment in Kingston Estates
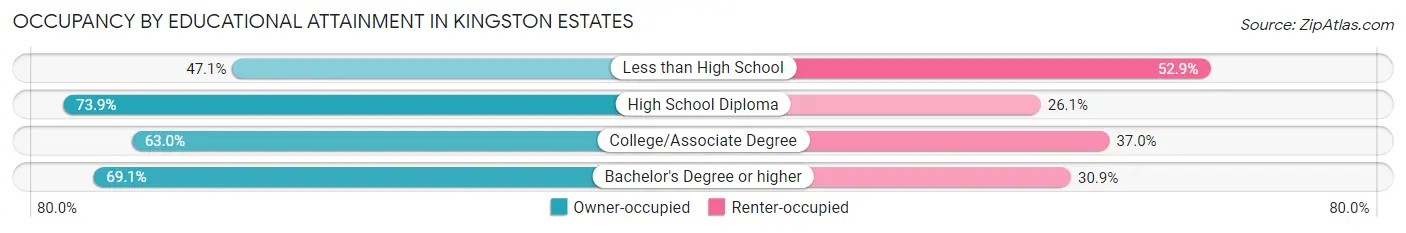
| Household Size | Owner-occupied | Renter-occupied |
| Less than High School | 128 (47.1%) | 144 (52.9%) |
| High School Diploma | 334 (73.9%) | 118 (26.1%) |
| College/Associate Degree | 596 (63.0%) | 350 (37.0%) |
| Bachelor's Degree or higher | 684 (69.1%) | 306 (30.9%) |
Occupancy by Age of Householder in Kingston Estates
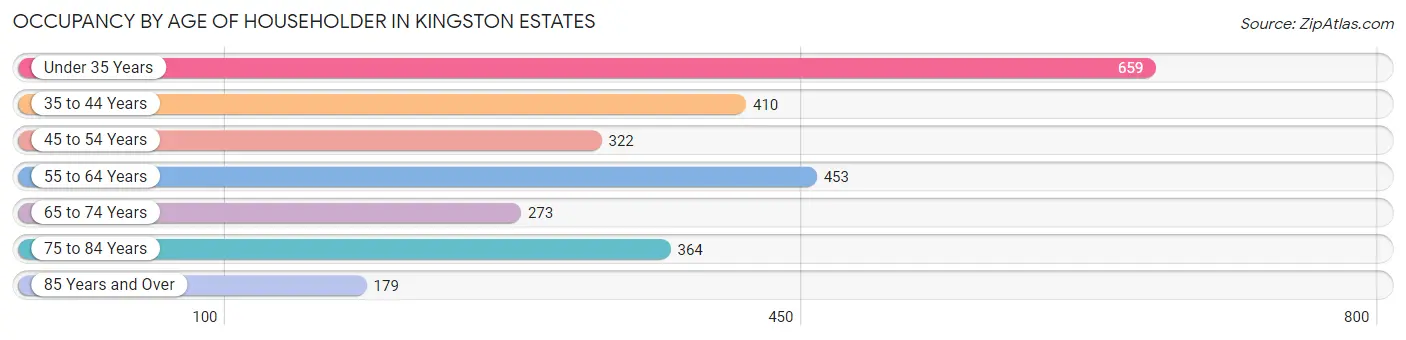
| Age Bracket | # Households | % Households |
| Under 35 Years | 659 | 24.8% |
| 35 to 44 Years | 410 | 15.4% |
| 45 to 54 Years | 322 | 12.1% |
| 55 to 64 Years | 453 | 17.0% |
| 65 to 74 Years | 273 | 10.3% |
| 75 to 84 Years | 364 | 13.7% |
| 85 Years and Over | 179 | 6.7% |
| Total | 2,660 | 100.0% |
Housing Finances in Kingston Estates
Median Income by Occupancy in Kingston Estates
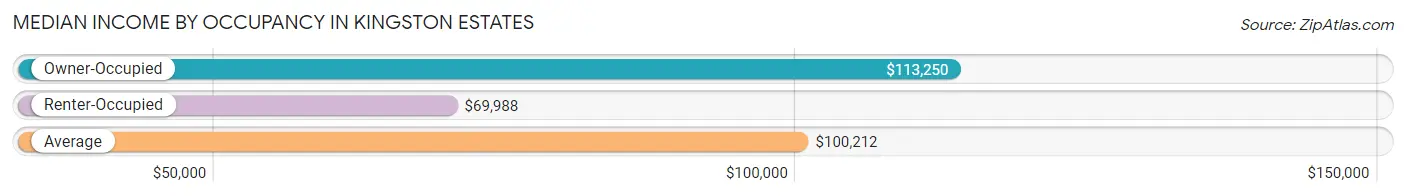
| Occupancy Type | # Households | Median Income |
| Owner-Occupied | 1,742 (65.5%) | $113,250 |
| Renter-Occupied | 918 (34.5%) | $69,988 |
| Average | 2,660 (100.0%) | $100,212 |
Occupancy by Householder Income Bracket in Kingston Estates
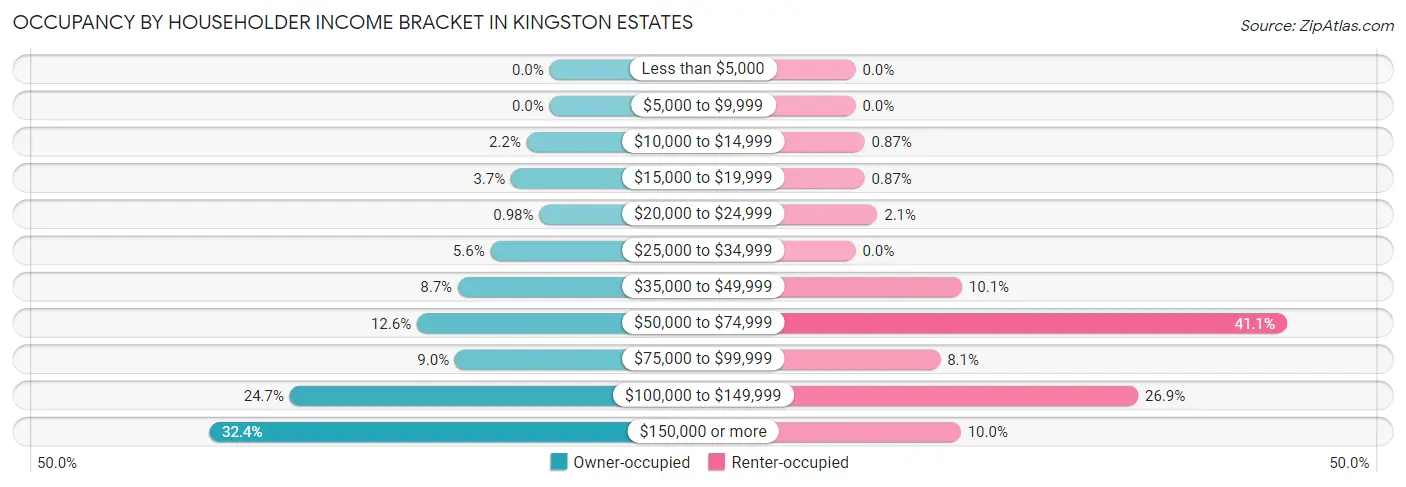
| Income Bracket | Owner-occupied | Renter-occupied |
| Less than $5,000 | 0 (0.0%) | 0 (0.0%) |
| $5,000 to $9,999 | 0 (0.0%) | 0 (0.0%) |
| $10,000 to $14,999 | 38 (2.2%) | 8 (0.9%) |
| $15,000 to $19,999 | 64 (3.7%) | 8 (0.9%) |
| $20,000 to $24,999 | 17 (1.0%) | 19 (2.1%) |
| $25,000 to $34,999 | 98 (5.6%) | 0 (0.0%) |
| $35,000 to $49,999 | 152 (8.7%) | 93 (10.1%) |
| $50,000 to $74,999 | 220 (12.6%) | 377 (41.1%) |
| $75,000 to $99,999 | 157 (9.0%) | 74 (8.1%) |
| $100,000 to $149,999 | 431 (24.7%) | 247 (26.9%) |
| $150,000 or more | 565 (32.4%) | 92 (10.0%) |
| Total | 1,742 (100.0%) | 918 (100.0%) |
Monthly Housing Cost Tiers in Kingston Estates
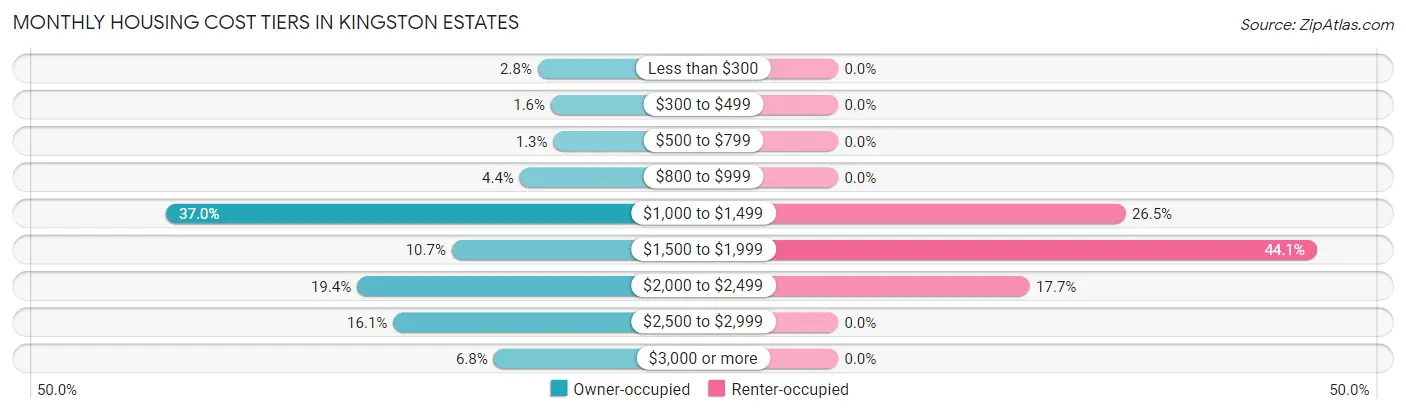
| Monthly Cost | Owner-occupied | Renter-occupied |
| Less than $300 | 48 (2.8%) | 0 (0.0%) |
| $300 to $499 | 27 (1.5%) | 0 (0.0%) |
| $500 to $799 | 23 (1.3%) | 0 (0.0%) |
| $800 to $999 | 77 (4.4%) | 0 (0.0%) |
| $1,000 to $1,499 | 644 (37.0%) | 243 (26.5%) |
| $1,500 to $1,999 | 186 (10.7%) | 405 (44.1%) |
| $2,000 to $2,499 | 338 (19.4%) | 162 (17.6%) |
| $2,500 to $2,999 | 280 (16.1%) | 0 (0.0%) |
| $3,000 or more | 119 (6.8%) | 0 (0.0%) |
| Total | 1,742 (100.0%) | 918 (100.0%) |
Physical Housing Characteristics in Kingston Estates
Housing Structures in Kingston Estates
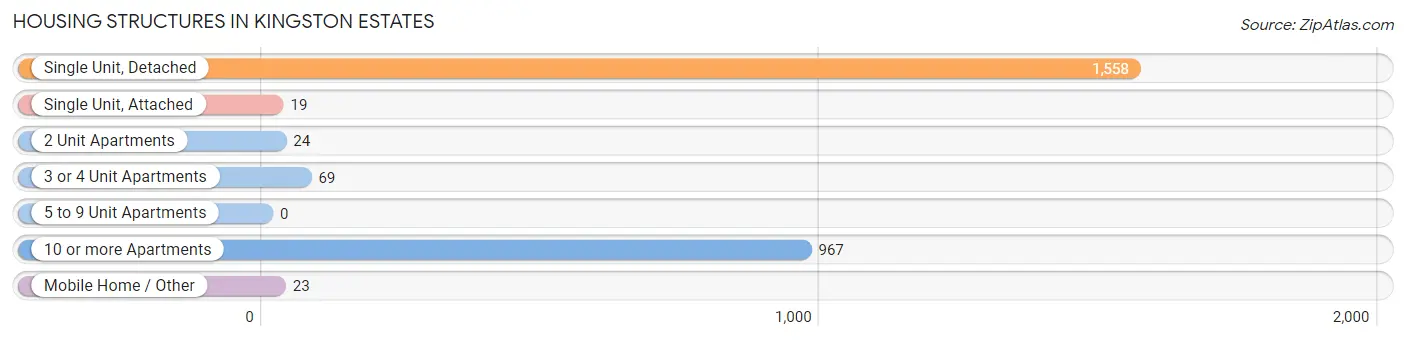
| Structure Type | # Housing Units | % Housing Units |
| Single Unit, Detached | 1,558 | 58.6% |
| Single Unit, Attached | 19 | 0.7% |
| 2 Unit Apartments | 24 | 0.9% |
| 3 or 4 Unit Apartments | 69 | 2.6% |
| 5 to 9 Unit Apartments | 0 | 0.0% |
| 10 or more Apartments | 967 | 36.3% |
| Mobile Home / Other | 23 | 0.9% |
| Total | 2,660 | 100.0% |
Housing Structures by Occupancy in Kingston Estates
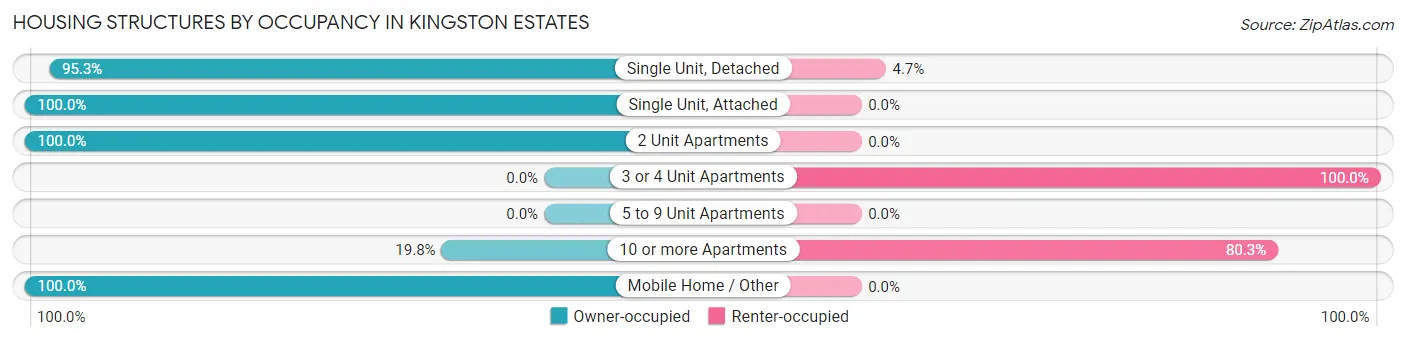
| Structure Type | Owner-occupied | Renter-occupied |
| Single Unit, Detached | 1,485 (95.3%) | 73 (4.7%) |
| Single Unit, Attached | 19 (100.0%) | 0 (0.0%) |
| 2 Unit Apartments | 24 (100.0%) | 0 (0.0%) |
| 3 or 4 Unit Apartments | 0 (0.0%) | 69 (100.0%) |
| 5 to 9 Unit Apartments | 0 (0.0%) | 0 (0.0%) |
| 10 or more Apartments | 191 (19.8%) | 776 (80.2%) |
| Mobile Home / Other | 23 (100.0%) | 0 (0.0%) |
| Total | 1,742 (65.5%) | 918 (34.5%) |
Housing Structures by Number of Rooms in Kingston Estates
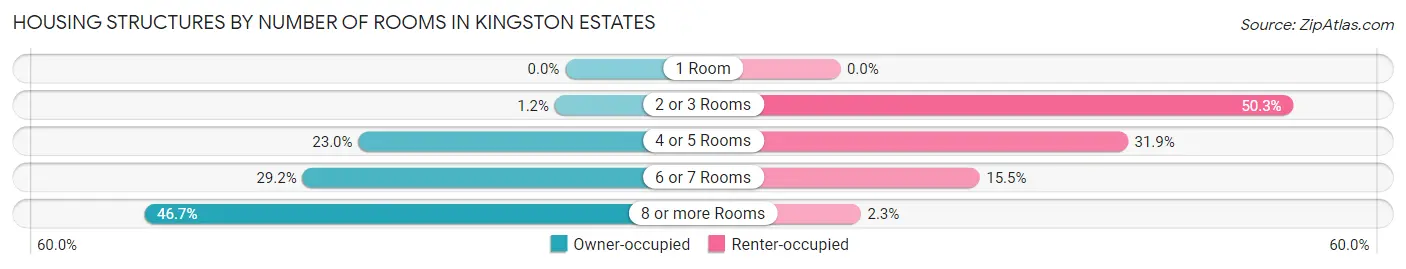
| Number of Rooms | Owner-occupied | Renter-occupied |
| 1 Room | 0 (0.0%) | 0 (0.0%) |
| 2 or 3 Rooms | 20 (1.1%) | 462 (50.3%) |
| 4 or 5 Rooms | 400 (23.0%) | 293 (31.9%) |
| 6 or 7 Rooms | 508 (29.2%) | 142 (15.5%) |
| 8 or more Rooms | 814 (46.7%) | 21 (2.3%) |
| Total | 1,742 (100.0%) | 918 (100.0%) |
Housing Structure by Heating Type in Kingston Estates
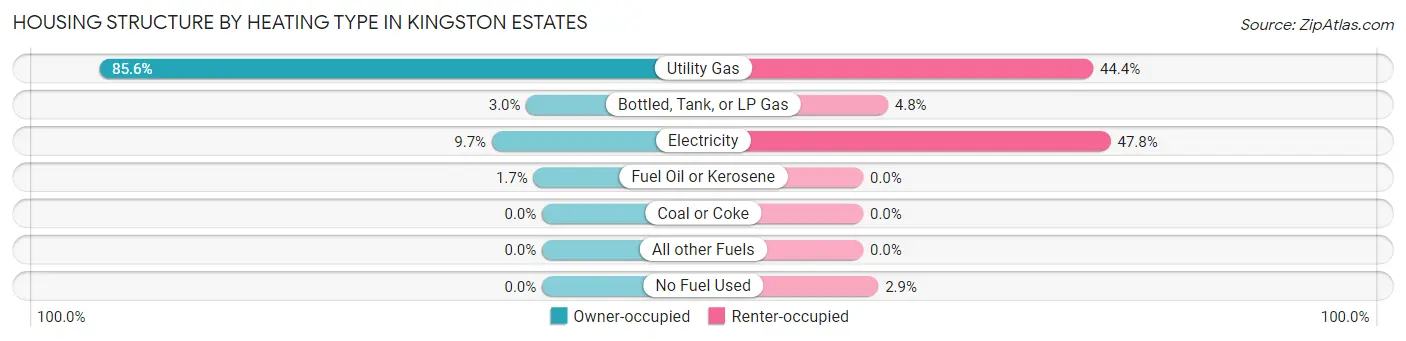
| Heating Type | Owner-occupied | Renter-occupied |
| Utility Gas | 1,491 (85.6%) | 408 (44.4%) |
| Bottled, Tank, or LP Gas | 53 (3.0%) | 44 (4.8%) |
| Electricity | 169 (9.7%) | 439 (47.8%) |
| Fuel Oil or Kerosene | 29 (1.7%) | 0 (0.0%) |
| Coal or Coke | 0 (0.0%) | 0 (0.0%) |
| All other Fuels | 0 (0.0%) | 0 (0.0%) |
| No Fuel Used | 0 (0.0%) | 27 (2.9%) |
| Total | 1,742 (100.0%) | 918 (100.0%) |
Household Vehicle Usage in Kingston Estates
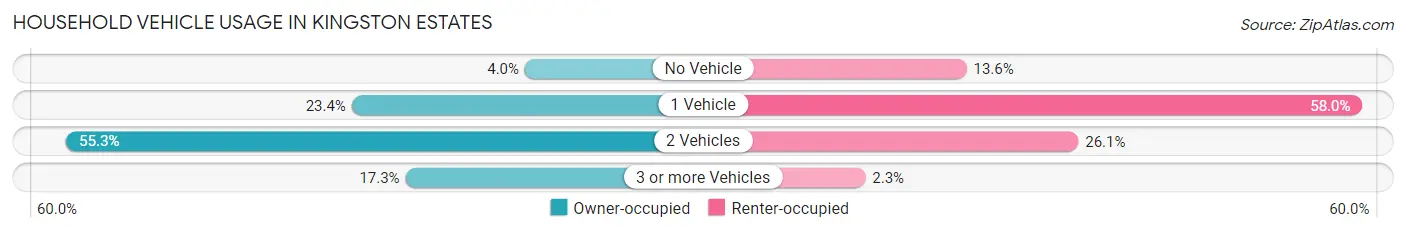
| Vehicles per Household | Owner-occupied | Renter-occupied |
| No Vehicle | 69 (4.0%) | 125 (13.6%) |
| 1 Vehicle | 407 (23.4%) | 532 (58.0%) |
| 2 Vehicles | 964 (55.3%) | 240 (26.1%) |
| 3 or more Vehicles | 302 (17.3%) | 21 (2.3%) |
| Total | 1,742 (100.0%) | 918 (100.0%) |
Real Estate & Mortgages in Kingston Estates
Real Estate and Mortgage Overview in Kingston Estates
| Characteristic | Without Mortgage | With Mortgage |
| Housing Units | 723 | 1,019 |
| Median Property Value | $248,300 | $287,900 |
| Median Household Income | $94,886 | $390 |
| Monthly Housing Costs | $1,156 | $119 |
| Real Estate Taxes | $8,451 | $0 |
Property Value by Mortgage Status in Kingston Estates
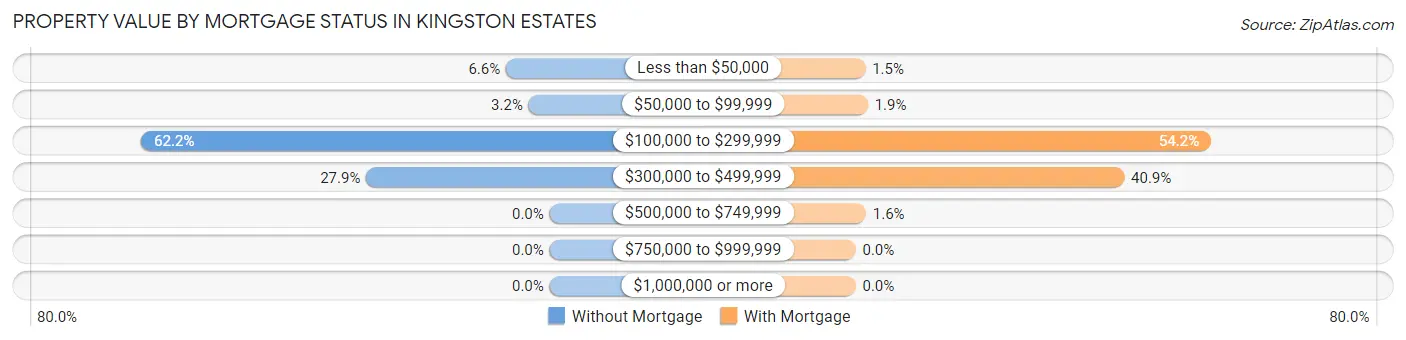
| Property Value | Without Mortgage | With Mortgage |
| Less than $50,000 | 48 (6.6%) | 15 (1.5%) |
| $50,000 to $99,999 | 23 (3.2%) | 19 (1.9%) |
| $100,000 to $299,999 | 450 (62.2%) | 552 (54.2%) |
| $300,000 to $499,999 | 202 (27.9%) | 417 (40.9%) |
| $500,000 to $749,999 | 0 (0.0%) | 16 (1.6%) |
| $750,000 to $999,999 | 0 (0.0%) | 0 (0.0%) |
| $1,000,000 or more | 0 (0.0%) | 0 (0.0%) |
| Total | 723 (100.0%) | 1,019 (100.0%) |
Household Income by Mortgage Status in Kingston Estates
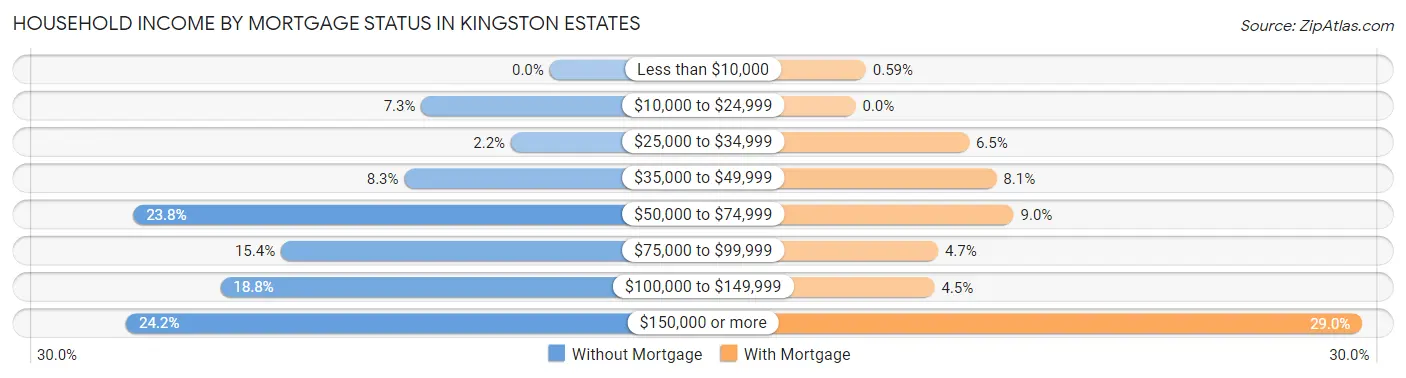
| Household Income | Without Mortgage | With Mortgage |
| Less than $10,000 | 0 (0.0%) | 6 (0.6%) |
| $10,000 to $24,999 | 53 (7.3%) | 0 (0.0%) |
| $25,000 to $34,999 | 16 (2.2%) | 66 (6.5%) |
| $35,000 to $49,999 | 60 (8.3%) | 82 (8.1%) |
| $50,000 to $74,999 | 172 (23.8%) | 92 (9.0%) |
| $75,000 to $99,999 | 111 (15.3%) | 48 (4.7%) |
| $100,000 to $149,999 | 136 (18.8%) | 46 (4.5%) |
| $150,000 or more | 175 (24.2%) | 295 (28.9%) |
| Total | 723 (100.0%) | 1,019 (100.0%) |
Property Value to Household Income Ratio in Kingston Estates
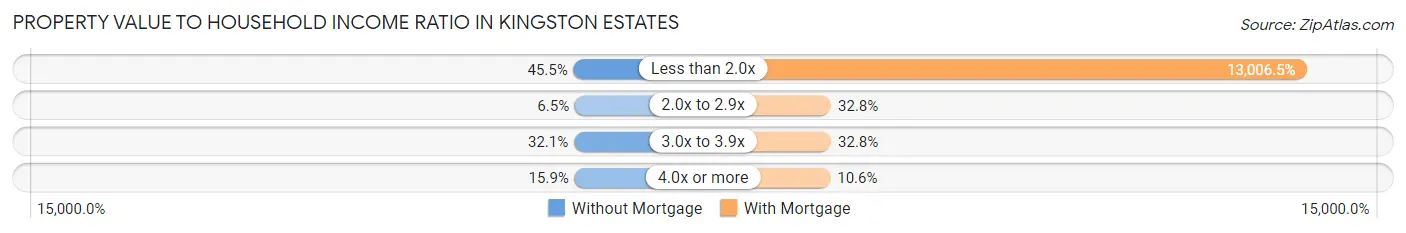
| Value-to-Income Ratio | Without Mortgage | With Mortgage |
| Less than 2.0x | 329 (45.5%) | 132,536 (13,006.5%) |
| 2.0x to 2.9x | 47 (6.5%) | 334 (32.8%) |
| 3.0x to 3.9x | 232 (32.1%) | 334 (32.8%) |
| 4.0x or more | 115 (15.9%) | 108 (10.6%) |
| Total | 723 (100.0%) | 1,019 (100.0%) |
Real Estate Taxes by Mortgage Status in Kingston Estates
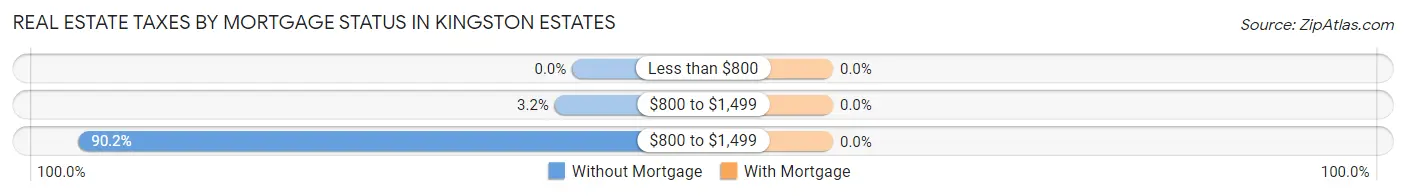
| Property Taxes | Without Mortgage | With Mortgage |
| Less than $800 | 0 (0.0%) | 0 (0.0%) |
| $800 to $1,499 | 23 (3.2%) | 0 (0.0%) |
| $800 to $1,499 | 652 (90.2%) | 0 (0.0%) |
| Total | 723 (100.0%) | 1,019 (100.0%) |
Health & Disability in Kingston Estates
Health Insurance Coverage by Age in Kingston Estates
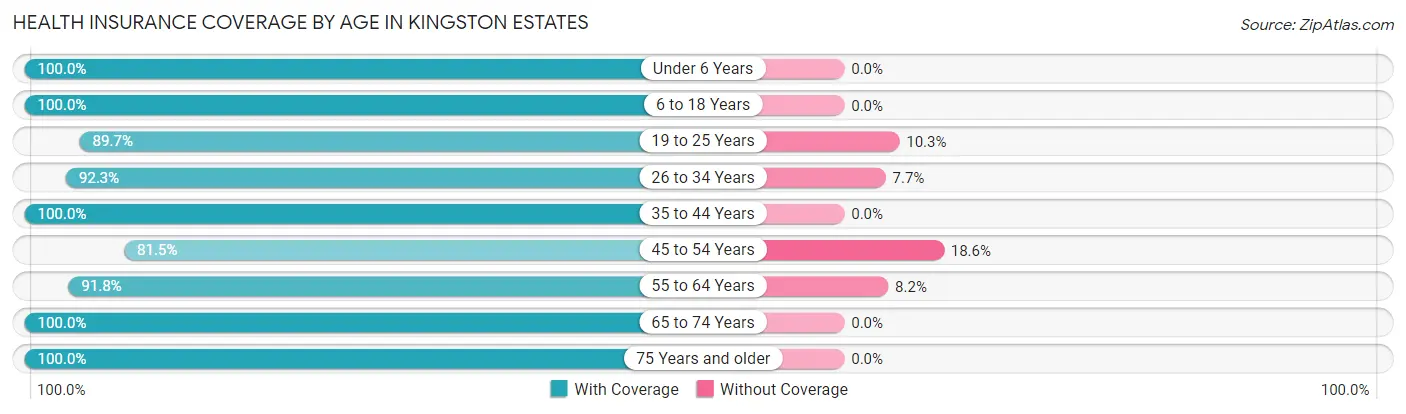
| Age Bracket | With Coverage | Without Coverage |
| Under 6 Years | 370 (100.0%) | 0 (0.0%) |
| 6 to 18 Years | 1,138 (100.0%) | 0 (0.0%) |
| 19 to 25 Years | 455 (89.7%) | 52 (10.3%) |
| 26 to 34 Years | 1,222 (92.3%) | 102 (7.7%) |
| 35 to 44 Years | 723 (100.0%) | 0 (0.0%) |
| 45 to 54 Years | 540 (81.5%) | 123 (18.5%) |
| 55 to 64 Years | 763 (91.8%) | 68 (8.2%) |
| 65 to 74 Years | 564 (100.0%) | 0 (0.0%) |
| 75 Years and older | 781 (100.0%) | 0 (0.0%) |
| Total | 6,556 (95.0%) | 345 (5.0%) |
Health Insurance Coverage by Citizenship Status in Kingston Estates
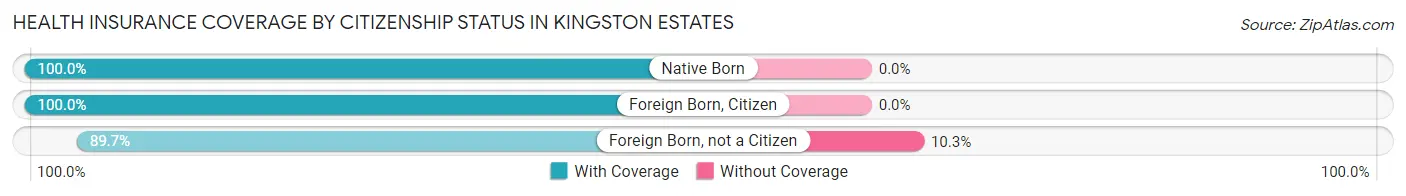
| Citizenship Status | With Coverage | Without Coverage |
| Native Born | 370 (100.0%) | 0 (0.0%) |
| Foreign Born, Citizen | 1,138 (100.0%) | 0 (0.0%) |
| Foreign Born, not a Citizen | 455 (89.7%) | 52 (10.3%) |
Health Insurance Coverage by Household Income in Kingston Estates
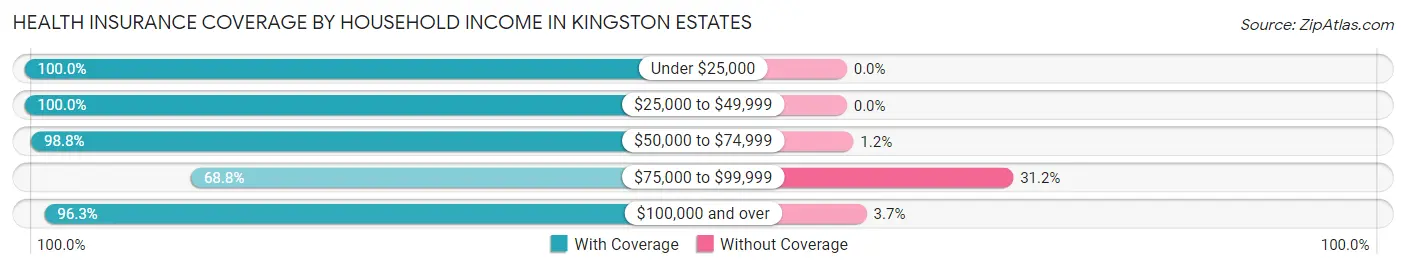
| Household Income | With Coverage | Without Coverage |
| Under $25,000 | 163 (100.0%) | 0 (0.0%) |
| $25,000 to $49,999 | 784 (100.0%) | 0 (0.0%) |
| $50,000 to $74,999 | 1,191 (98.8%) | 15 (1.2%) |
| $75,000 to $99,999 | 384 (68.8%) | 174 (31.2%) |
| $100,000 and over | 4,034 (96.3%) | 156 (3.7%) |
Public vs Private Health Insurance Coverage by Age in Kingston Estates
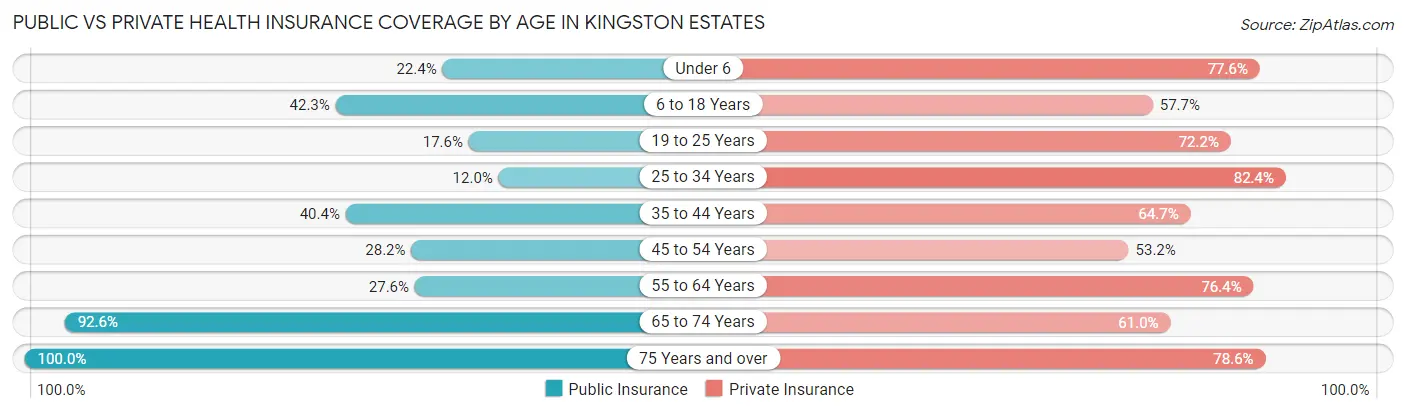
| Age Bracket | Public Insurance | Private Insurance |
| Under 6 | 83 (22.4%) | 287 (77.6%) |
| 6 to 18 Years | 481 (42.3%) | 657 (57.7%) |
| 19 to 25 Years | 89 (17.5%) | 366 (72.2%) |
| 25 to 34 Years | 159 (12.0%) | 1,091 (82.4%) |
| 35 to 44 Years | 292 (40.4%) | 468 (64.7%) |
| 45 to 54 Years | 187 (28.2%) | 353 (53.2%) |
| 55 to 64 Years | 229 (27.6%) | 635 (76.4%) |
| 65 to 74 Years | 522 (92.5%) | 344 (61.0%) |
| 75 Years and over | 781 (100.0%) | 614 (78.6%) |
| Total | 2,823 (40.9%) | 4,815 (69.8%) |
Disability Status by Sex by Age in Kingston Estates
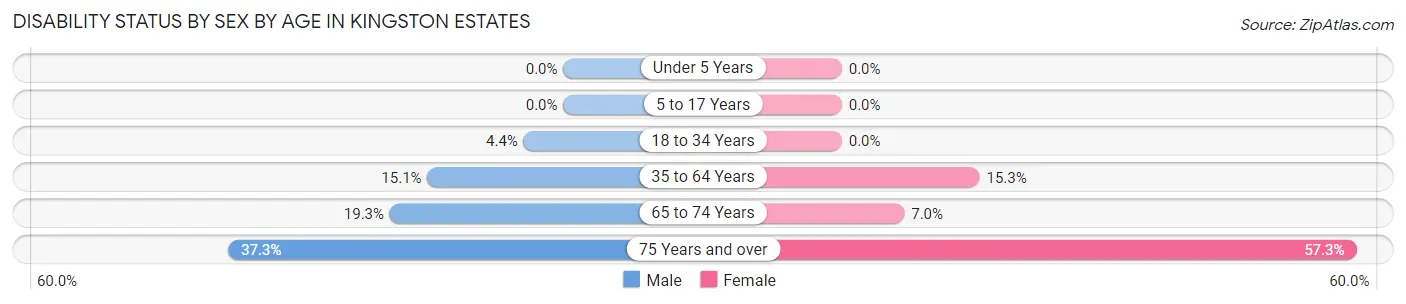
| Age Bracket | Male | Female |
| Under 5 Years | 0 (0.0%) | 0 (0.0%) |
| 5 to 17 Years | 0 (0.0%) | 0 (0.0%) |
| 18 to 34 Years | 51 (4.4%) | 0 (0.0%) |
| 35 to 64 Years | 164 (15.1%) | 174 (15.3%) |
| 65 to 74 Years | 34 (19.3%) | 27 (7.0%) |
| 75 Years and over | 115 (37.3%) | 271 (57.3%) |
Disability Class by Sex by Age in Kingston Estates
Disability Class: Hearing Difficulty
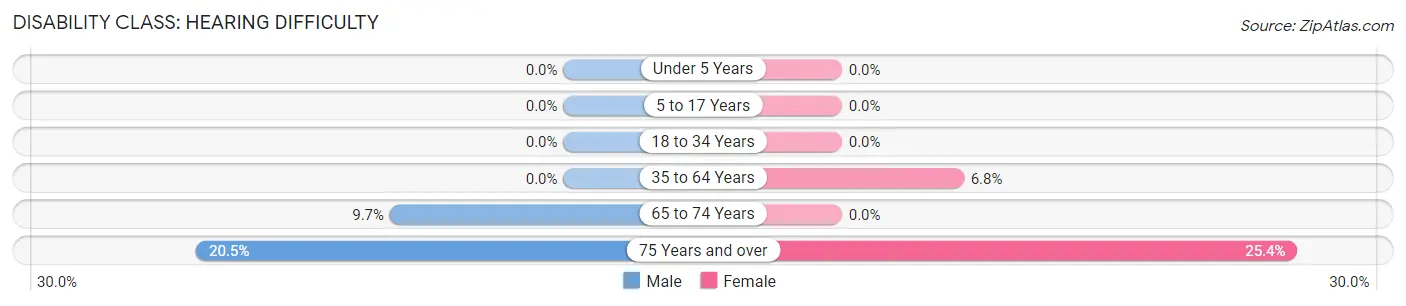
| Age Bracket | Male | Female |
| Under 5 Years | 0 (0.0%) | 0 (0.0%) |
| 5 to 17 Years | 0 (0.0%) | 0 (0.0%) |
| 18 to 34 Years | 0 (0.0%) | 0 (0.0%) |
| 35 to 64 Years | 0 (0.0%) | 77 (6.8%) |
| 65 to 74 Years | 17 (9.7%) | 0 (0.0%) |
| 75 Years and over | 63 (20.4%) | 120 (25.4%) |
Disability Class: Vision Difficulty
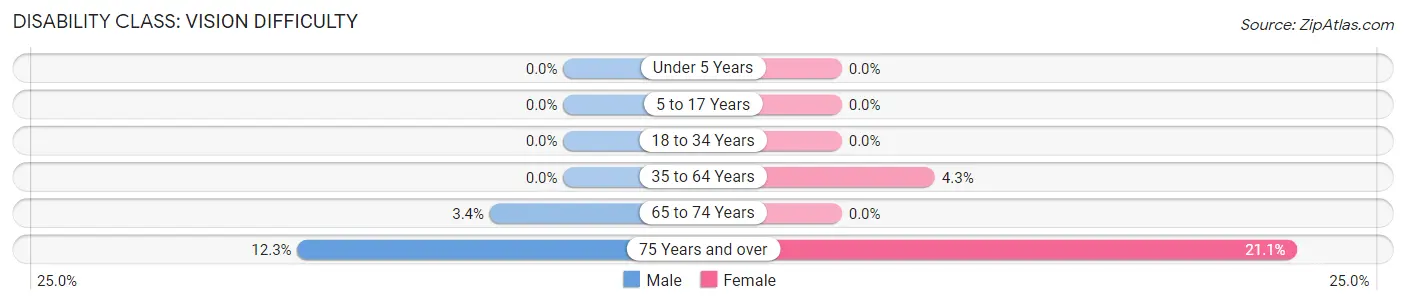
| Age Bracket | Male | Female |
| Under 5 Years | 0 (0.0%) | 0 (0.0%) |
| 5 to 17 Years | 0 (0.0%) | 0 (0.0%) |
| 18 to 34 Years | 0 (0.0%) | 0 (0.0%) |
| 35 to 64 Years | 0 (0.0%) | 49 (4.3%) |
| 65 to 74 Years | 6 (3.4%) | 0 (0.0%) |
| 75 Years and over | 38 (12.3%) | 100 (21.1%) |
Disability Class: Cognitive Difficulty
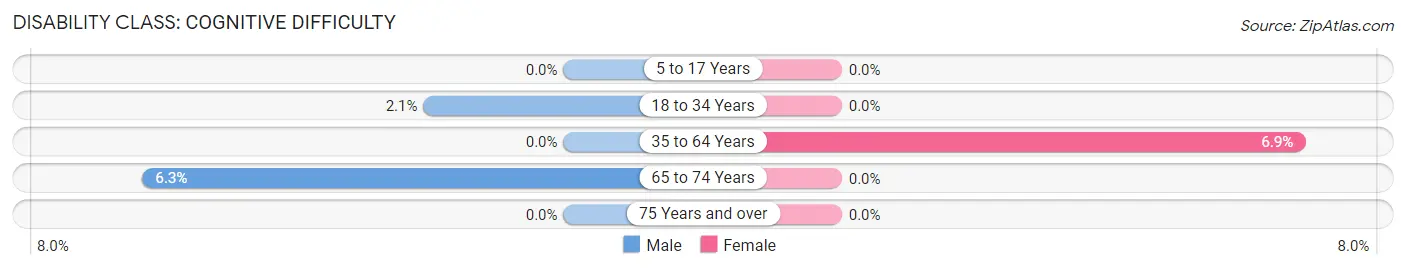
| Age Bracket | Male | Female |
| 5 to 17 Years | 0 (0.0%) | 0 (0.0%) |
| 18 to 34 Years | 24 (2.1%) | 0 (0.0%) |
| 35 to 64 Years | 0 (0.0%) | 78 (6.9%) |
| 65 to 74 Years | 11 (6.2%) | 0 (0.0%) |
| 75 Years and over | 0 (0.0%) | 0 (0.0%) |
Disability Class: Ambulatory Difficulty
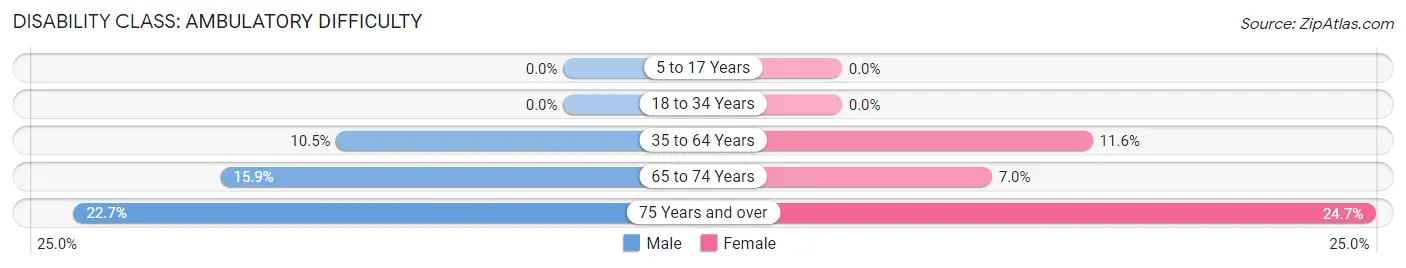
| Age Bracket | Male | Female |
| 5 to 17 Years | 0 (0.0%) | 0 (0.0%) |
| 18 to 34 Years | 0 (0.0%) | 0 (0.0%) |
| 35 to 64 Years | 114 (10.5%) | 132 (11.6%) |
| 65 to 74 Years | 28 (15.9%) | 27 (7.0%) |
| 75 Years and over | 70 (22.7%) | 117 (24.7%) |
Disability Class: Self-Care Difficulty
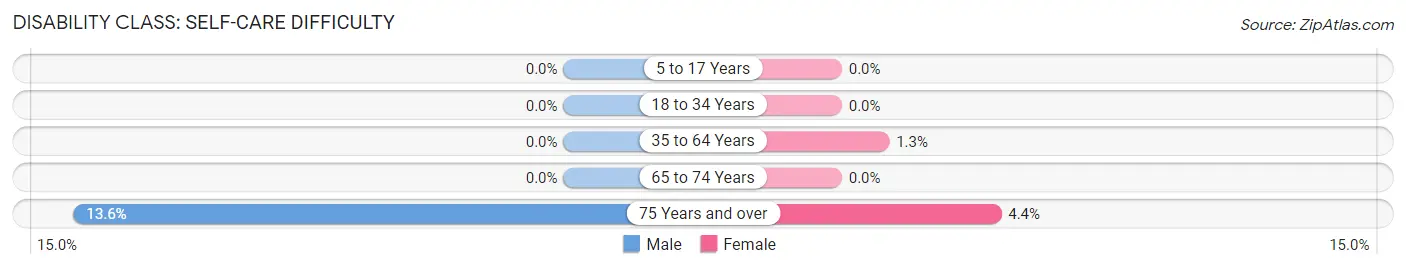
| Age Bracket | Male | Female |
| 5 to 17 Years | 0 (0.0%) | 0 (0.0%) |
| 18 to 34 Years | 0 (0.0%) | 0 (0.0%) |
| 35 to 64 Years | 0 (0.0%) | 15 (1.3%) |
| 65 to 74 Years | 0 (0.0%) | 0 (0.0%) |
| 75 Years and over | 42 (13.6%) | 21 (4.4%) |
Technology Access in Kingston Estates
Computing Device Access in Kingston Estates
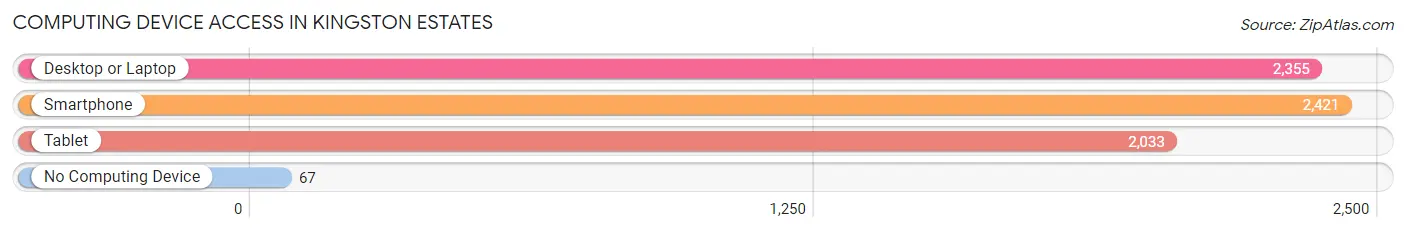
| Device Type | # Households | % Households |
| Desktop or Laptop | 2,355 | 88.5% |
| Smartphone | 2,421 | 91.0% |
| Tablet | 2,033 | 76.4% |
| No Computing Device | 67 | 2.5% |
| Total | 2,660 | 100.0% |
Internet Access in Kingston Estates
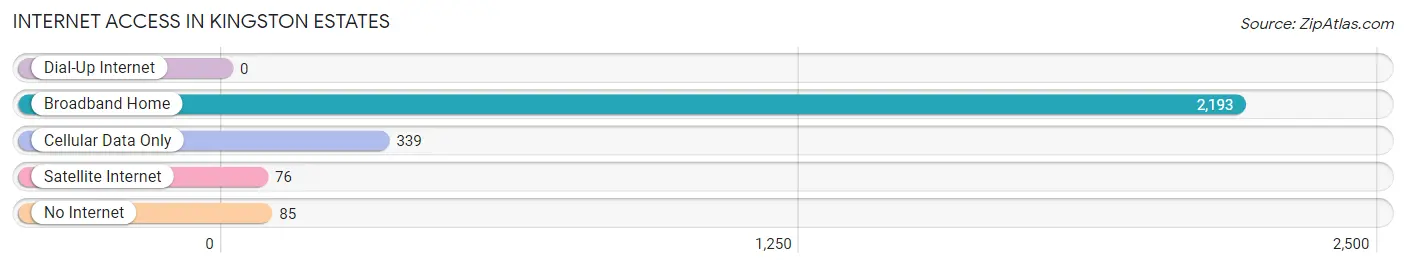
| Internet Type | # Households | % Households |
| Dial-Up Internet | 0 | 0.0% |
| Broadband Home | 2,193 | 82.4% |
| Cellular Data Only | 339 | 12.7% |
| Satellite Internet | 76 | 2.9% |
| No Internet | 85 | 3.2% |
| Total | 2,660 | 100.0% |
Kingston Estates Summary
Kingston Estates is a small, unincorporated community located in Monmouth County, New Jersey. It is situated in the northern part of the county, just south of the borough of Freehold. The community is bordered by the townships of Manalapan and Millstone, and is located approximately 25 miles south of New York City.
History
The area that is now Kingston Estates was originally inhabited by the Lenape Native Americans. The first European settlers arrived in the area in the late 17th century, and the community was officially established in 1790. The community was named after the Kingston family, who were among the first settlers in the area.
In the 19th century, Kingston Estates was a rural farming community. The area was known for its production of apples, peaches, and other fruits. The community also had a number of small businesses, including a general store, a blacksmith, and a post office.
Geography
Kingston Estates is located in northern Monmouth County, just south of the borough of Freehold. The community is bordered by the townships of Manalapan and Millstone. The area is mostly flat, with some rolling hills in the northern part of the community. The area is mostly wooded, with some open fields and meadows.
The climate in Kingston Estates is typical of the northeastern United States, with cold winters and hot, humid summers. The average annual temperature is around 50 degrees Fahrenheit. The average annual precipitation is around 45 inches.
Economy
The economy of Kingston Estates is largely based on agriculture. The area is known for its production of apples, peaches, and other fruits. The community also has a number of small businesses, including a general store, a blacksmith, and a post office.
Demographics
As of the 2010 census, the population of Kingston Estates was 1,845. The racial makeup of the community was 94.3% White, 2.2% African American, 0.7% Asian, and 2.8% from other races. The median household income was $76,250, and the median family income was $86,250.
Conclusion
Kingston Estates is a small, unincorporated community located in Monmouth County, New Jersey. It is situated in the northern part of the county, just south of the borough of Freehold. The community was established in 1790 and is known for its production of apples, peaches, and other fruits. The economy of Kingston Estates is largely based on agriculture, and the population of the community was 1,845 as of the 2010 census.
Common Questions
What is Per Capita Income in Kingston Estates?
Per Capita income in Kingston Estates is $42,101.
What is the Median Family Income in Kingston Estates?
Median Family Income in Kingston Estates is $108,906.
What is the Median Household income in Kingston Estates?
Median Household Income in Kingston Estates is $100,212.
What is Income or Wage Gap in Kingston Estates?
Income or Wage Gap in Kingston Estates is 22.2%.
Women in Kingston Estates earn 77.8 cents for every dollar earned by a man.
What is Inequality or Gini Index in Kingston Estates?
Inequality or Gini Index in Kingston Estates is 0.34.
What is the Total Population of Kingston Estates?
Total Population of Kingston Estates is 6,999.
What is the Total Male Population of Kingston Estates?
Total Male Population of Kingston Estates is 3,490.
What is the Total Female Population of Kingston Estates?
Total Female Population of Kingston Estates is 3,509.
What is the Ratio of Males per 100 Females in Kingston Estates?
There are 99.46 Males per 100 Females in Kingston Estates.
What is the Ratio of Females per 100 Males in Kingston Estates?
There are 100.54 Females per 100 Males in Kingston Estates.
What is the Median Population Age in Kingston Estates?
Median Population Age in Kingston Estates is 36.3 Years.
What is the Average Family Size in Kingston Estates
Average Family Size in Kingston Estates is 3.2 People.
What is the Average Household Size in Kingston Estates
Average Household Size in Kingston Estates is 2.6 People.
How Large is the Labor Force in Kingston Estates?
There are 3,781 People in the Labor Forcein in Kingston Estates.
What is the Percentage of People in the Labor Force in Kingston Estates?
66.8% of People are in the Labor Force in Kingston Estates.
What is the Unemployment Rate in Kingston Estates?
Unemployment Rate in Kingston Estates is 3.8%.