Pine Beach borough, NJ Map & Demographics
Pine Beach borough Overview
$56,096
PER CAPITA INCOME
$133,036
AVG FAMILY INCOME
$116,518
AVG HOUSEHOLD INCOME
23.4%
WAGE / INCOME GAP [ % ]
76.6¢/ $1
WAGE / INCOME GAP [ $ ]
0.40
INEQUALITY / GINI INDEX
2,402
TOTAL POPULATION
1,188
MALE POPULATION
1,214
FEMALE POPULATION
97.86
MALES / 100 FEMALES
102.19
FEMALES / 100 MALES
52.5
MEDIAN AGE
2.9
AVG FAMILY SIZE
2.6
AVG HOUSEHOLD SIZE
1,316
LABOR FORCE [ PEOPLE ]
64.3%
PERCENT IN LABOR FORCE
3.2%
UNEMPLOYMENT RATE
Income in Pine Beach borough
Income Overview in Pine Beach borough
Per Capita Income in Pine Beach borough is $56,096, while median incomes of families and households are $133,036 and $116,518 respectively.
| Characteristic | Number | Measure |
| Per Capita Income | 2,402 | $56,096 |
| Median Family Income | 746 | $133,036 |
| Mean Family Income | 746 | $155,383 |
| Median Household Income | 919 | $116,518 |
| Mean Household Income | 919 | $142,375 |
| Income Deficit | 746 | $0 |
| Wage / Income Gap (%) | 2,402 | 23.37% |
| Wage / Income Gap ($) | 2,402 | 76.63¢ per $1 |
| Gini / Inequality Index | 2,402 | 0.40 |
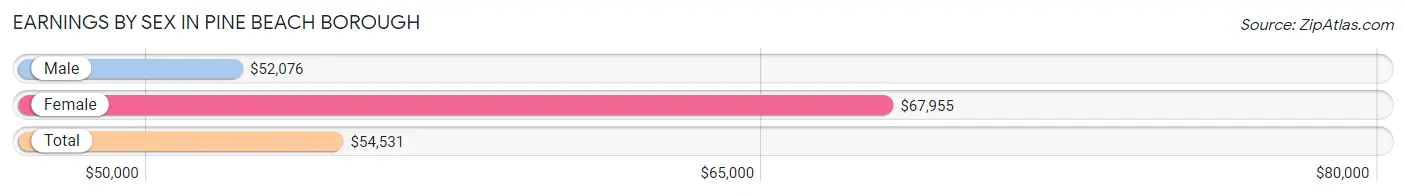
Earnings by Sex in Pine Beach borough
Average Earnings in Pine Beach borough are $54,531, $52,076 for men and $67,955 for women, a difference of 23.4%.
| Sex | Number | Average Earnings |
| Male | 681 (50.6%) | $52,076 |
| Female | 664 (49.4%) | $67,955 |
| Total | 1,345 (100.0%) | $54,531 |
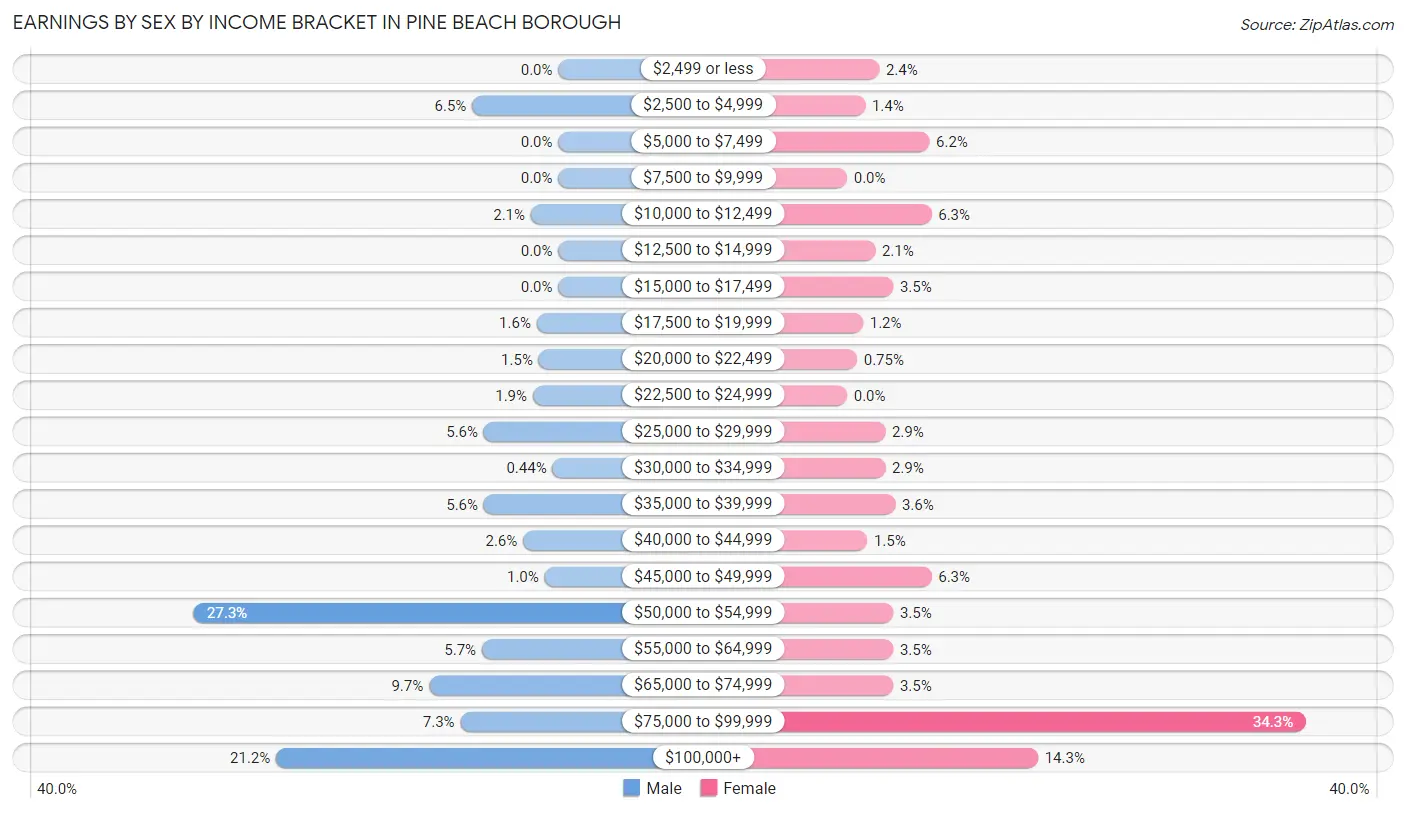
Earnings by Sex by Income Bracket in Pine Beach borough
The most common earnings brackets in Pine Beach borough are $50,000 to $54,999 for men (186 | 27.3%) and $75,000 to $99,999 for women (228 | 34.3%).
| Income | Male | Female |
| $2,499 or less | 0 (0.0%) | 16 (2.4%) |
| $2,500 to $4,999 | 44 (6.5%) | 9 (1.4%) |
| $5,000 to $7,499 | 0 (0.0%) | 41 (6.2%) |
| $7,500 to $9,999 | 0 (0.0%) | 0 (0.0%) |
| $10,000 to $12,499 | 14 (2.1%) | 42 (6.3%) |
| $12,500 to $14,999 | 0 (0.0%) | 14 (2.1%) |
| $15,000 to $17,499 | 0 (0.0%) | 23 (3.5%) |
| $17,500 to $19,999 | 11 (1.6%) | 8 (1.2%) |
| $20,000 to $22,499 | 10 (1.5%) | 5 (0.7%) |
| $22,500 to $24,999 | 13 (1.9%) | 0 (0.0%) |
| $25,000 to $29,999 | 38 (5.6%) | 19 (2.9%) |
| $30,000 to $34,999 | 3 (0.4%) | 19 (2.9%) |
| $35,000 to $39,999 | 38 (5.6%) | 24 (3.6%) |
| $40,000 to $44,999 | 18 (2.6%) | 10 (1.5%) |
| $45,000 to $49,999 | 7 (1.0%) | 42 (6.3%) |
| $50,000 to $54,999 | 186 (27.3%) | 23 (3.5%) |
| $55,000 to $64,999 | 39 (5.7%) | 23 (3.5%) |
| $65,000 to $74,999 | 66 (9.7%) | 23 (3.5%) |
| $75,000 to $99,999 | 50 (7.3%) | 228 (34.3%) |
| $100,000+ | 144 (21.1%) | 95 (14.3%) |
| Total | 681 (100.0%) | 664 (100.0%) |
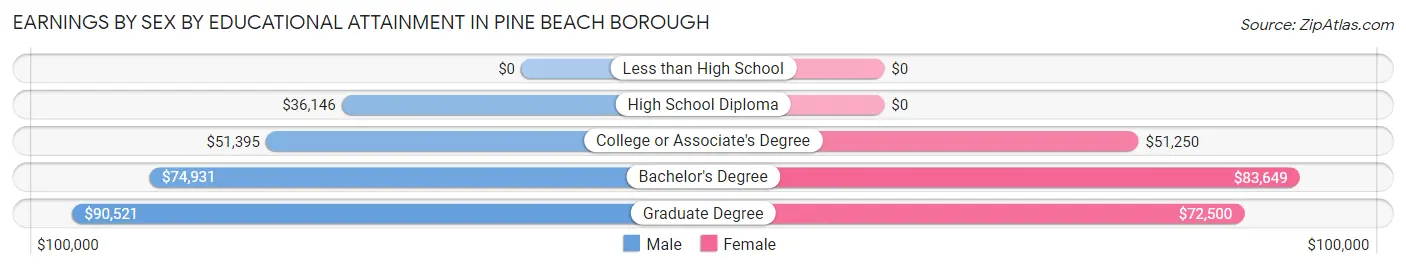
Earnings by Sex by Educational Attainment in Pine Beach borough
Average earnings in Pine Beach borough are $52,355 for men and $82,528 for women, a difference of 36.6%. Men with an educational attainment of graduate degree enjoy the highest average annual earnings of $90,521, while those with high school diploma education earn the least with $36,146. Women with an educational attainment of bachelor's degree earn the most with the average annual earnings of $83,649, while those with college or associate's degree education have the smallest earnings of $51,250.
| Educational Attainment | Male Income | Female Income |
| Less than High School | - | - |
| High School Diploma | $36,146 | $0 |
| College or Associate's Degree | $51,395 | $51,250 |
| Bachelor's Degree | $74,931 | $83,649 |
| Graduate Degree | $90,521 | $72,500 |
| Total | $52,355 | $82,528 |
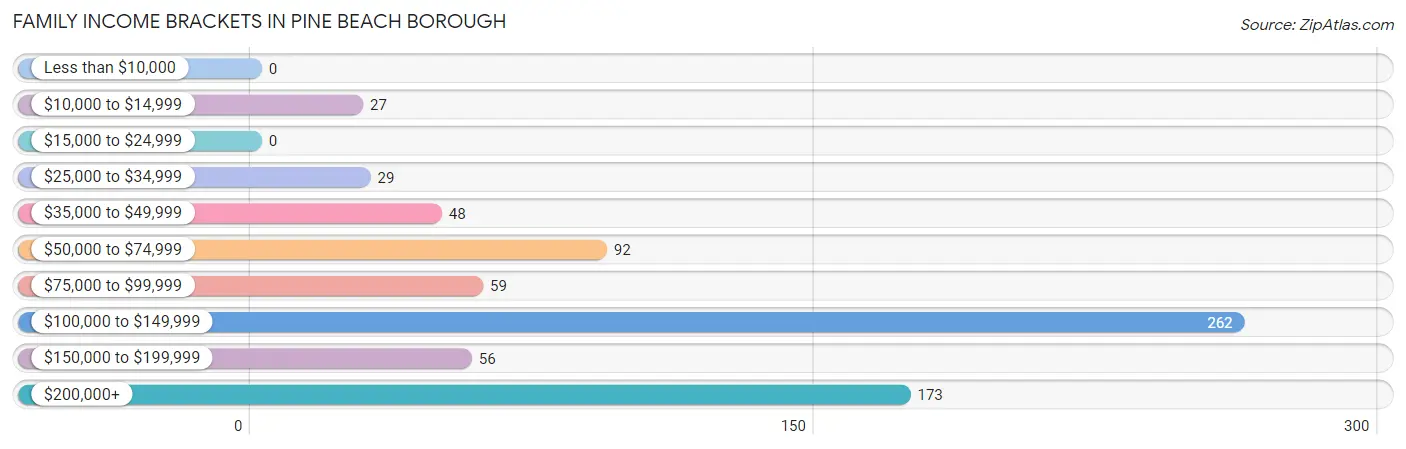
Family Income in Pine Beach borough
Family Income Brackets in Pine Beach borough
According to the Pine Beach borough family income data, there are 262 families falling into the $100,000 to $149,999 income range, which is the most common income bracket and makes up 35.1% of all families.
| Income Bracket | # Families | % Families |
| Less than $10,000 | 0 | 0.0% |
| $10,000 to $14,999 | 27 | 3.6% |
| $15,000 to $24,999 | 0 | 0.0% |
| $25,000 to $34,999 | 29 | 3.9% |
| $35,000 to $49,999 | 48 | 6.4% |
| $50,000 to $74,999 | 92 | 12.3% |
| $75,000 to $99,999 | 59 | 7.9% |
| $100,000 to $149,999 | 262 | 35.1% |
| $150,000 to $199,999 | 56 | 7.5% |
| $200,000+ | 173 | 23.2% |
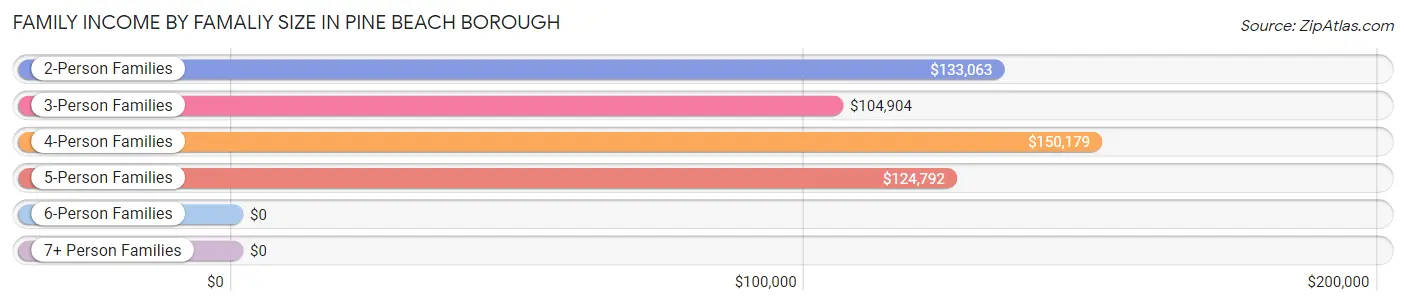
Family Income by Famaliy Size in Pine Beach borough
4-person families (143 | 19.2%) account for the highest median family income in Pine Beach borough with $150,179 per family, while 2-person families (433 | 58.0%) have the highest median income of $66,532 per family member.
| Income Bracket | # Families | Median Income |
| 2-Person Families | 433 (58.0%) | $133,063 |
| 3-Person Families | 100 (13.4%) | $104,904 |
| 4-Person Families | 143 (19.2%) | $150,179 |
| 5-Person Families | 54 (7.2%) | $124,792 |
| 6-Person Families | 16 (2.1%) | $0 |
| 7+ Person Families | 0 (0.0%) | $0 |
| Total | 746 (100.0%) | $133,036 |
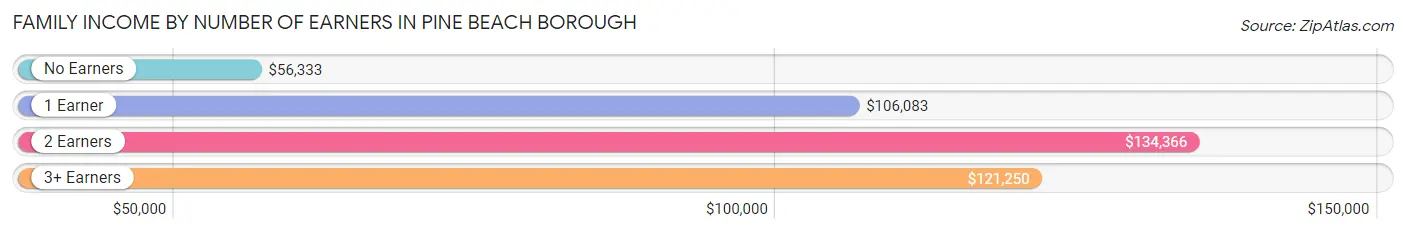
Family Income by Number of Earners in Pine Beach borough
The median family income in Pine Beach borough is $133,036, with families comprising 2 earners (369) having the highest median family income of $134,366, while families with no earners (130) have the lowest median family income of $56,333, accounting for 49.5% and 17.4% of families, respectively.
| Number of Earners | # Families | Median Income |
| No Earners | 130 (17.4%) | $56,333 |
| 1 Earner | 165 (22.1%) | $106,083 |
| 2 Earners | 369 (49.5%) | $134,366 |
| 3+ Earners | 82 (11.0%) | $121,250 |
| Total | 746 (100.0%) | $133,036 |
Household Income in Pine Beach borough
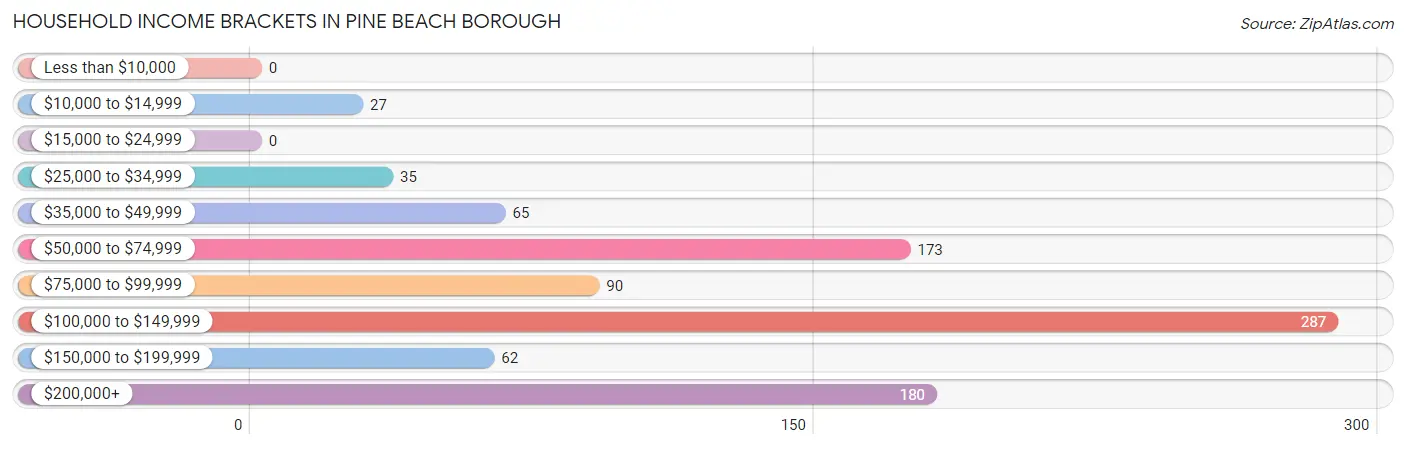
Household Income Brackets in Pine Beach borough
With 287 households falling in the category, the $100,000 to $149,999 income range is the most frequent in Pine Beach borough, accounting for 31.2% of all households.
| Income Bracket | # Households | % Households |
| Less than $10,000 | 0 | 0.0% |
| $10,000 to $14,999 | 27 | 2.9% |
| $15,000 to $24,999 | 0 | 0.0% |
| $25,000 to $34,999 | 35 | 3.8% |
| $35,000 to $49,999 | 65 | 7.1% |
| $50,000 to $74,999 | 173 | 18.8% |
| $75,000 to $99,999 | 90 | 9.8% |
| $100,000 to $149,999 | 287 | 31.2% |
| $150,000 to $199,999 | 62 | 6.7% |
| $200,000+ | 180 | 19.6% |
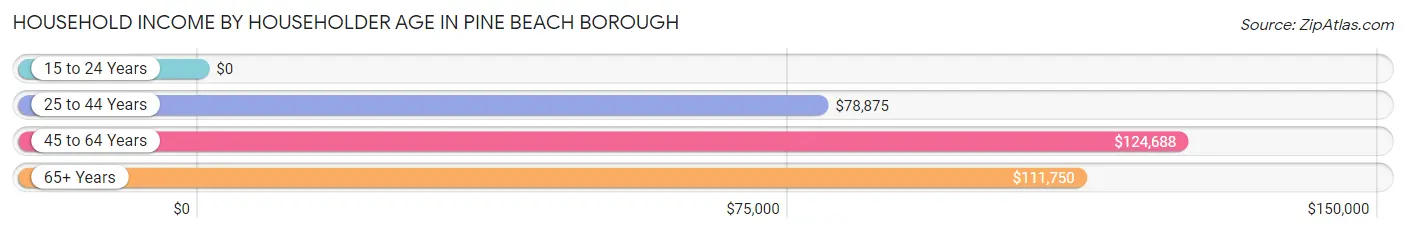
Household Income by Householder Age in Pine Beach borough
The median household income in Pine Beach borough is $116,518, with the highest median household income of $124,688 found in the 45 to 64 years age bracket for the primary householder. A total of 309 households (33.6%) fall into this category.
| Income Bracket | # Households | Median Income |
| 15 to 24 Years | 0 (0.0%) | $0 |
| 25 to 44 Years | 181 (19.7%) | $78,875 |
| 45 to 64 Years | 309 (33.6%) | $124,688 |
| 65+ Years | 429 (46.7%) | $111,750 |
| Total | 919 (100.0%) | $116,518 |
Poverty in Pine Beach borough
Income Below Poverty by Sex and Age in Pine Beach borough
With 4.1% poverty level for males and 1.3% for females among the residents of Pine Beach borough, 45 to 54 year old males and 25 to 34 year old females are the most vulnerable to poverty, with 15 males (12.4%) and 3 females (4.5%) in their respective age groups living below the poverty level.
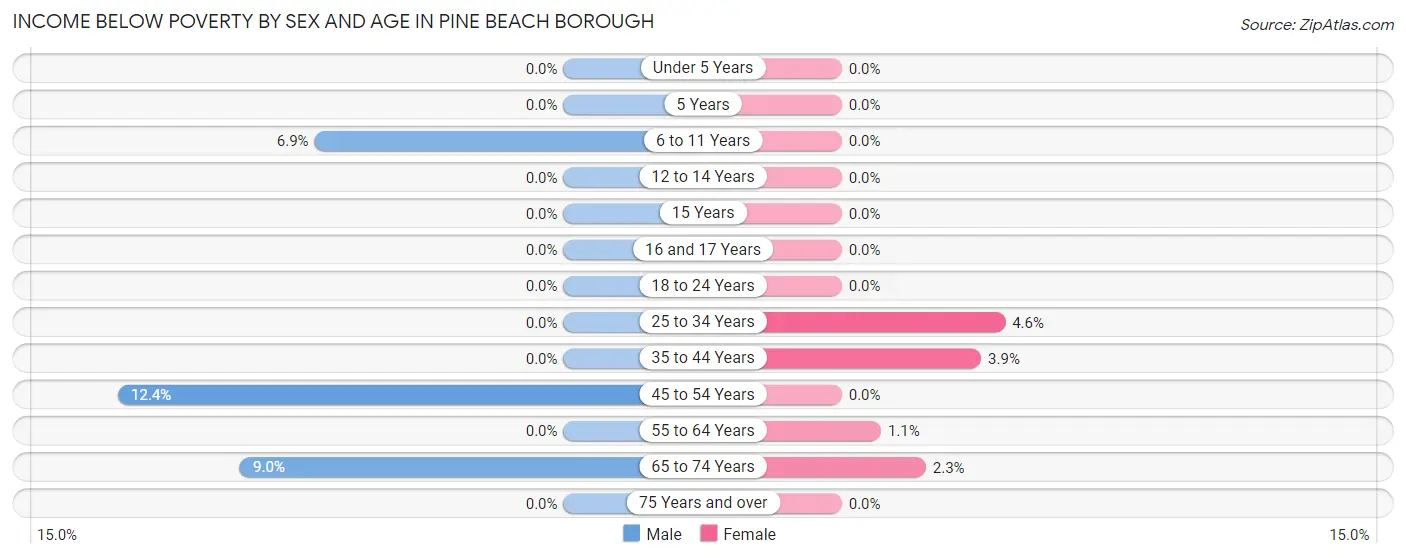
| Age Bracket | Male | Female |
| Under 5 Years | 0 (0.0%) | 0 (0.0%) |
| 5 Years | 0 (0.0%) | 0 (0.0%) |
| 6 to 11 Years | 7 (6.9%) | 0 (0.0%) |
| 12 to 14 Years | 0 (0.0%) | 0 (0.0%) |
| 15 Years | 0 (0.0%) | 0 (0.0%) |
| 16 and 17 Years | 0 (0.0%) | 0 (0.0%) |
| 18 to 24 Years | 0 (0.0%) | 0 (0.0%) |
| 25 to 34 Years | 0 (0.0%) | 3 (4.5%) |
| 35 to 44 Years | 0 (0.0%) | 5 (3.9%) |
| 45 to 54 Years | 15 (12.4%) | 0 (0.0%) |
| 55 to 64 Years | 0 (0.0%) | 4 (1.1%) |
| 65 to 74 Years | 27 (9.0%) | 4 (2.3%) |
| 75 Years and over | 0 (0.0%) | 0 (0.0%) |
| Total | 49 (4.1%) | 16 (1.3%) |
Income Above Poverty by Sex and Age in Pine Beach borough
According to the poverty statistics in Pine Beach borough, males aged under 5 years and females aged under 5 years are the age groups that are most secure financially, with 100.0% of males and 100.0% of females in these age groups living above the poverty line.
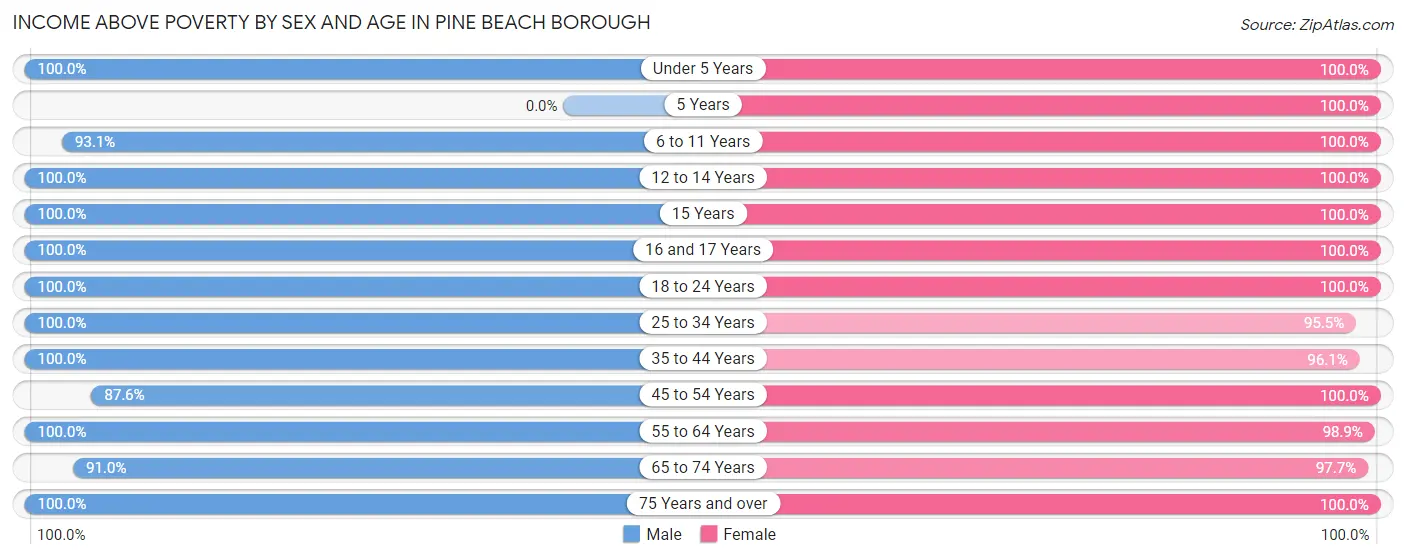
| Age Bracket | Male | Female |
| Under 5 Years | 79 (100.0%) | 26 (100.0%) |
| 5 Years | 0 (0.0%) | 15 (100.0%) |
| 6 to 11 Years | 94 (93.1%) | 33 (100.0%) |
| 12 to 14 Years | 18 (100.0%) | 57 (100.0%) |
| 15 Years | 8 (100.0%) | 15 (100.0%) |
| 16 and 17 Years | 30 (100.0%) | 37 (100.0%) |
| 18 to 24 Years | 110 (100.0%) | 56 (100.0%) |
| 25 to 34 Years | 60 (100.0%) | 63 (95.5%) |
| 35 to 44 Years | 159 (100.0%) | 124 (96.1%) |
| 45 to 54 Years | 106 (87.6%) | 138 (100.0%) |
| 55 to 64 Years | 157 (100.0%) | 362 (98.9%) |
| 65 to 74 Years | 273 (91.0%) | 167 (97.7%) |
| 75 Years and over | 45 (100.0%) | 101 (100.0%) |
| Total | 1,139 (95.9%) | 1,194 (98.7%) |
Income Below Poverty Among Married-Couple Families in Pine Beach borough
The poverty statistics for married-couple families in Pine Beach borough show that 1.4% or 9 of the total 650 families live below the poverty line. Families with no children have the highest poverty rate of 1.9%, comprising of 9 families. On the other hand, families with 1 or 2 children have the lowest poverty rate of 0.0%, which includes 0 families.
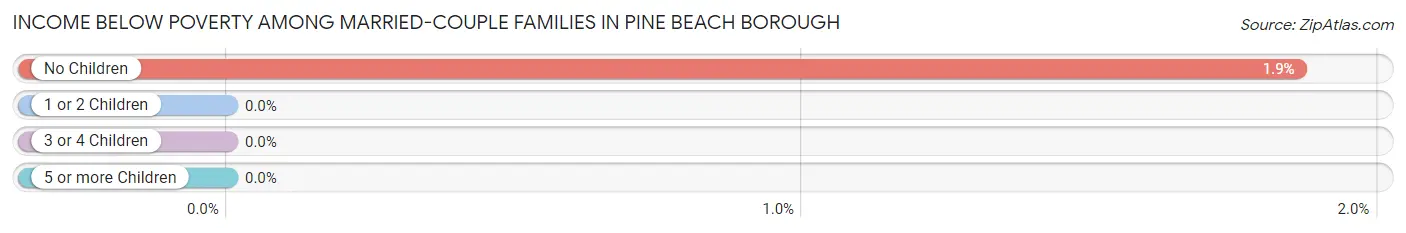
| Children | Above Poverty | Below Poverty |
| No Children | 475 (98.1%) | 9 (1.9%) |
| 1 or 2 Children | 130 (100.0%) | 0 (0.0%) |
| 3 or 4 Children | 36 (100.0%) | 0 (0.0%) |
| 5 or more Children | 0 (0.0%) | 0 (0.0%) |
| Total | 641 (98.6%) | 9 (1.4%) |
Income Below Poverty Among Single-Parent Households in Pine Beach borough
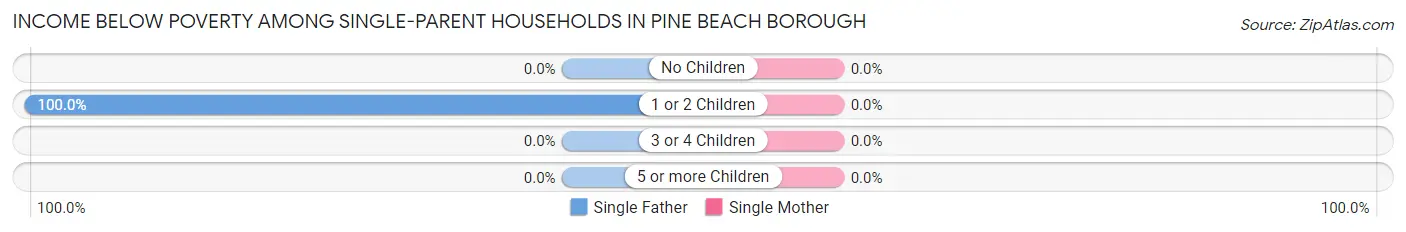
| Children | Single Father | Single Mother |
| No Children | 0 (0.0%) | 0 (0.0%) |
| 1 or 2 Children | 18 (100.0%) | 0 (0.0%) |
| 3 or 4 Children | 0 (0.0%) | 0 (0.0%) |
| 5 or more Children | 0 (0.0%) | 0 (0.0%) |
| Total | 18 (50.0%) | 0 (0.0%) |
Income Below Poverty Among Married-Couple vs Single-Parent Households in Pine Beach borough
The poverty data for Pine Beach borough shows that 9 of the married-couple family households (1.4%) and 18 of the single-parent households (18.8%) are living below the poverty level. Within the married-couple family households, those with no children have the highest poverty rate, with 9 households (1.9%) falling below the poverty line. Among the single-parent households, those with 1 or 2 children have the highest poverty rate, with 18 household (47.4%) living below poverty.
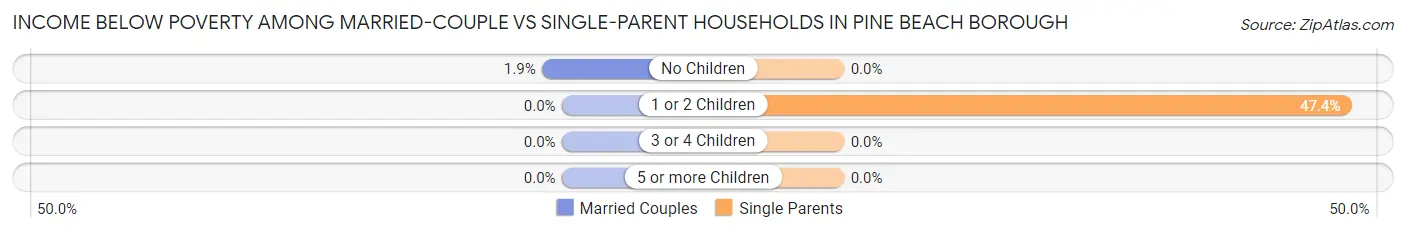
| Children | Married-Couple Families | Single-Parent Households |
| No Children | 9 (1.9%) | 0 (0.0%) |
| 1 or 2 Children | 0 (0.0%) | 18 (47.4%) |
| 3 or 4 Children | 0 (0.0%) | 0 (0.0%) |
| 5 or more Children | 0 (0.0%) | 0 (0.0%) |
| Total | 9 (1.4%) | 18 (18.8%) |
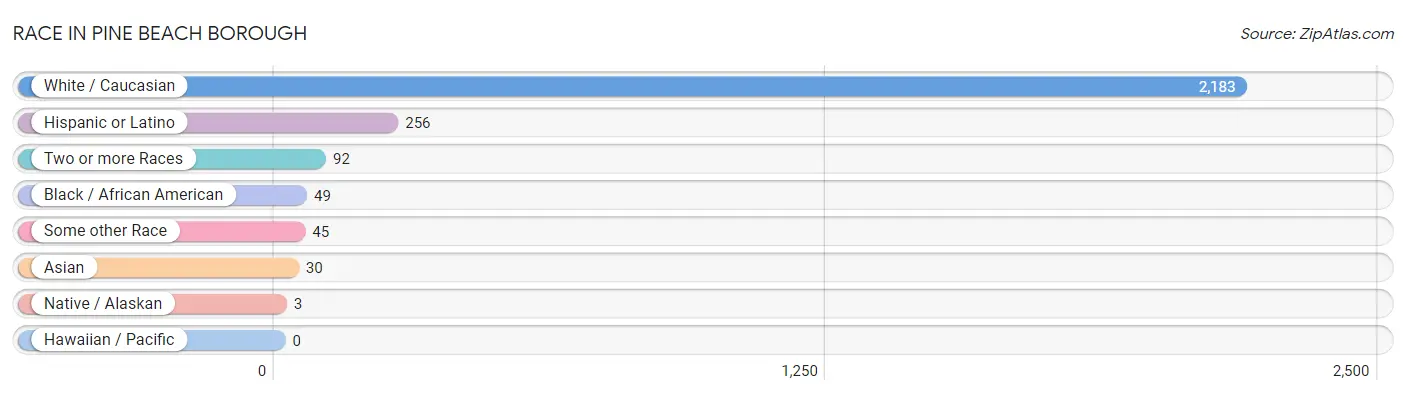
Race in Pine Beach borough
The most populous races in Pine Beach borough are White / Caucasian (2,183 | 90.9%), Hispanic or Latino (256 | 10.7%), and Two or more Races (92 | 3.8%).
| Race | # Population | % Population |
| Asian | 30 | 1.3% |
| Black / African American | 49 | 2.0% |
| Hawaiian / Pacific | 0 | 0.0% |
| Hispanic or Latino | 256 | 10.7% |
| Native / Alaskan | 3 | 0.1% |
| White / Caucasian | 2,183 | 90.9% |
| Two or more Races | 92 | 3.8% |
| Some other Race | 45 | 1.9% |
| Total | 2,402 | 100.0% |
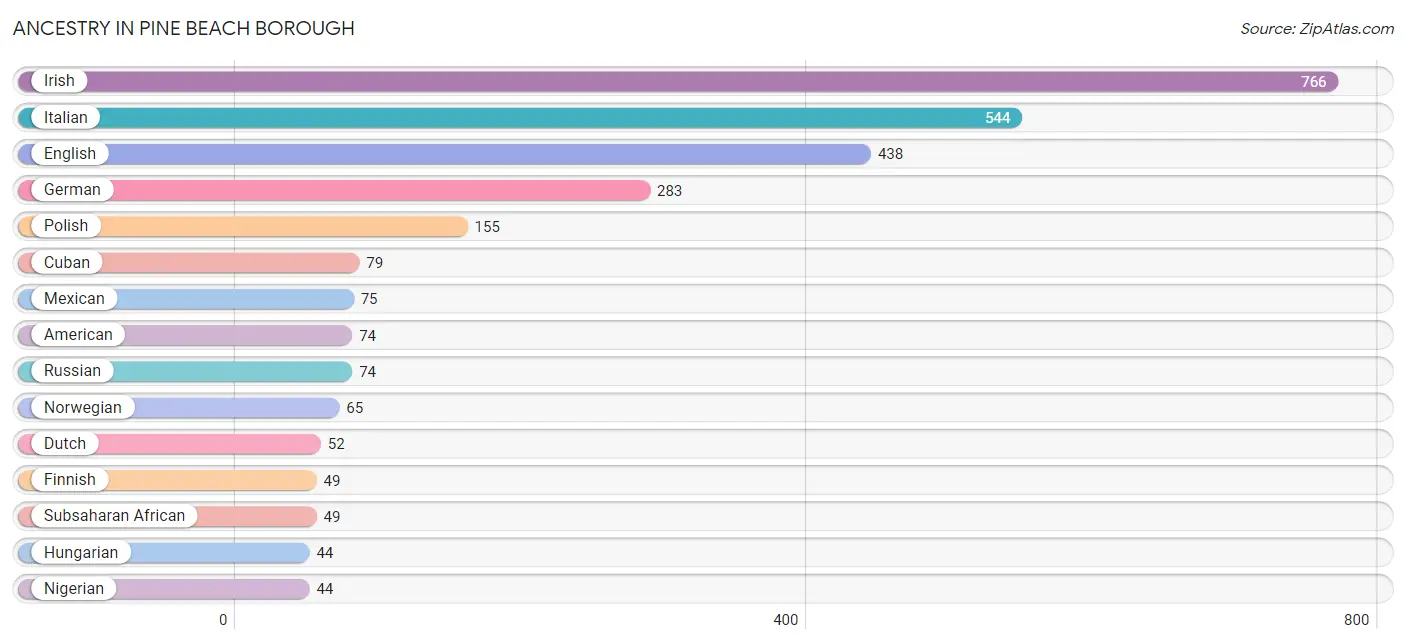
Ancestry in Pine Beach borough
The most populous ancestries reported in Pine Beach borough are Irish (766 | 31.9%), Italian (544 | 22.7%), English (438 | 18.2%), German (283 | 11.8%), and Polish (155 | 6.5%), together accounting for 91.0% of all Pine Beach borough residents.
| Ancestry | # Population | % Population |
| African | 5 | 0.2% |
| American | 74 | 3.1% |
| Arab | 26 | 1.1% |
| Belgian | 2 | 0.1% |
| British | 20 | 0.8% |
| Canadian | 3 | 0.1% |
| Colombian | 4 | 0.2% |
| Comanche | 3 | 0.1% |
| Croatian | 4 | 0.2% |
| Cuban | 79 | 3.3% |
| Czech | 7 | 0.3% |
| Danish | 20 | 0.8% |
| Dutch | 52 | 2.2% |
| Eastern European | 7 | 0.3% |
| Ecuadorian | 18 | 0.7% |
| Egyptian | 26 | 1.1% |
| English | 438 | 18.2% |
| European | 13 | 0.5% |
| Finnish | 49 | 2.0% |
| French | 21 | 0.9% |
| French Canadian | 11 | 0.5% |
| German | 283 | 11.8% |
| Greek | 2 | 0.1% |
| Haitian | 4 | 0.2% |
| Hungarian | 44 | 1.8% |
| Indian (Asian) | 30 | 1.3% |
| Irish | 766 | 31.9% |
| Italian | 544 | 22.7% |
| Mexican | 75 | 3.1% |
| Nigerian | 44 | 1.8% |
| Norwegian | 65 | 2.7% |
| Osage | 3 | 0.1% |
| Pennsylvania German | 3 | 0.1% |
| Polish | 155 | 6.5% |
| Portuguese | 34 | 1.4% |
| Puerto Rican | 37 | 1.5% |
| Romanian | 5 | 0.2% |
| Russian | 74 | 3.1% |
| Scandinavian | 21 | 0.9% |
| Scotch-Irish | 35 | 1.5% |
| Scottish | 41 | 1.7% |
| South American | 22 | 0.9% |
| Spaniard | 43 | 1.8% |
| Subsaharan African | 49 | 2.0% |
| Swiss | 11 | 0.5% |
| Ukrainian | 10 | 0.4% |
| Welsh | 13 | 0.5% | View All 47 Rows |
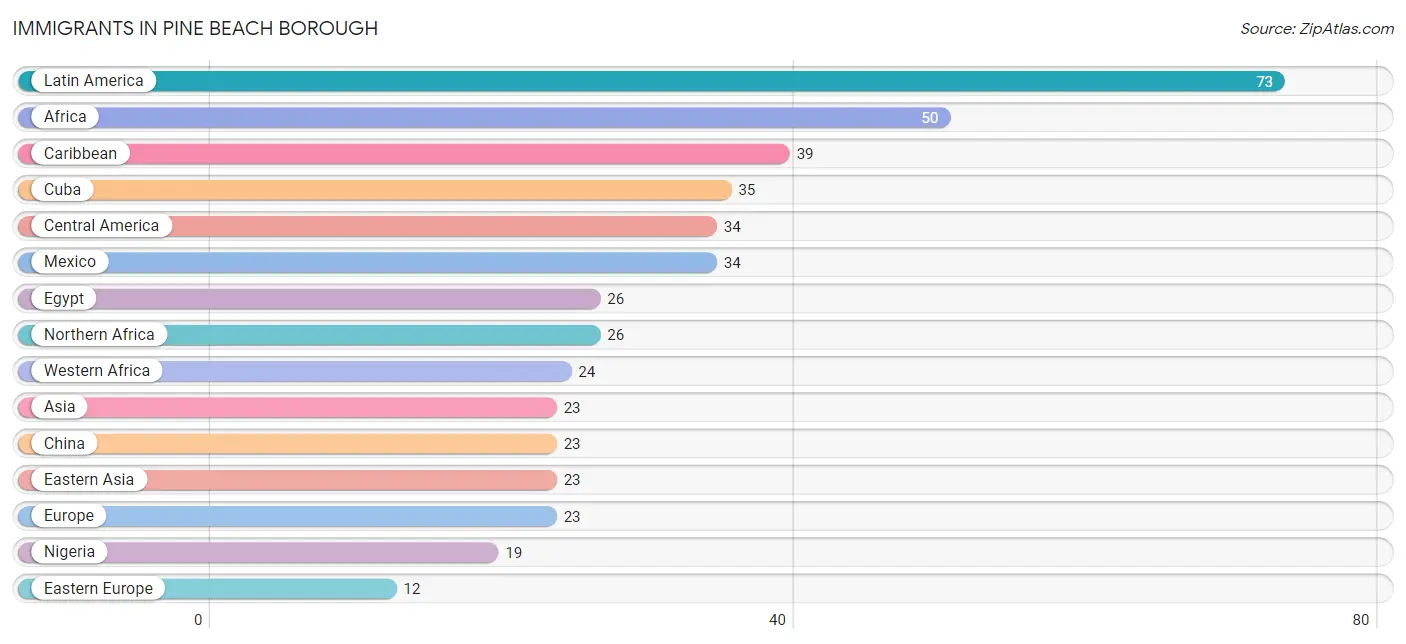
Immigrants in Pine Beach borough
The most numerous immigrant groups reported in Pine Beach borough came from Latin America (73 | 3.0%), Africa (50 | 2.1%), Caribbean (39 | 1.6%), Cuba (35 | 1.5%), and Central America (34 | 1.4%), together accounting for 9.6% of all Pine Beach borough residents.
| Immigration Origin | # Population | % Population |
| Africa | 50 | 2.1% |
| Asia | 23 | 1.0% |
| Australia | 6 | 0.3% |
| Caribbean | 39 | 1.6% |
| Central America | 34 | 1.4% |
| China | 23 | 1.0% |
| Cuba | 35 | 1.5% |
| Eastern Asia | 23 | 1.0% |
| Eastern Europe | 12 | 0.5% |
| Egypt | 26 | 1.1% |
| Europe | 23 | 1.0% |
| Ghana | 5 | 0.2% |
| Haiti | 4 | 0.2% |
| Latin America | 73 | 3.0% |
| Mexico | 34 | 1.4% |
| Nigeria | 19 | 0.8% |
| Northern Africa | 26 | 1.1% |
| Northern Europe | 7 | 0.3% |
| Oceania | 6 | 0.3% |
| Portugal | 4 | 0.2% |
| Russia | 12 | 0.5% |
| Southern Europe | 4 | 0.2% |
| Western Africa | 24 | 1.0% | View All 23 Rows |
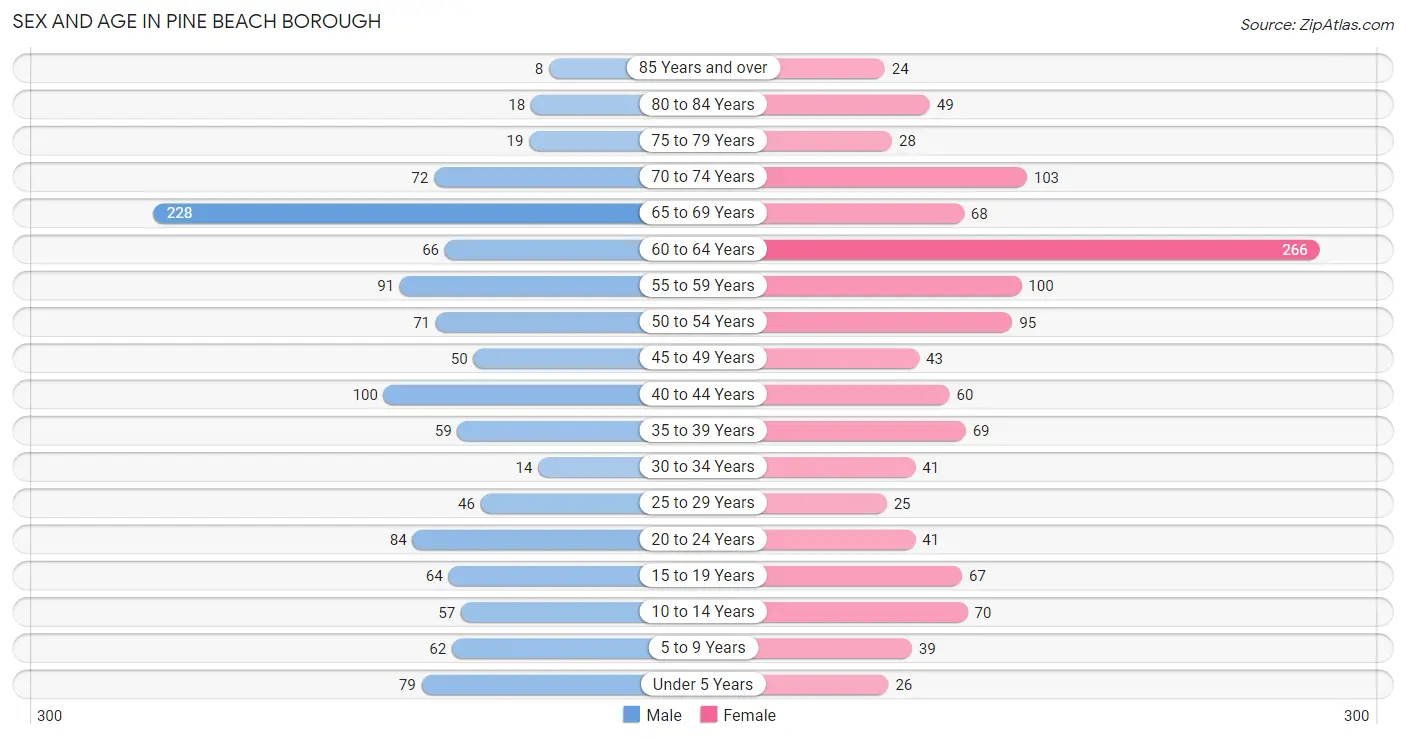
Sex and Age in Pine Beach borough
Sex and Age in Pine Beach borough
The most populous age groups in Pine Beach borough are 65 to 69 Years (228 | 19.2%) for men and 60 to 64 Years (266 | 21.9%) for women.
| Age Bracket | Male | Female |
| Under 5 Years | 79 (6.7%) | 26 (2.1%) |
| 5 to 9 Years | 62 (5.2%) | 39 (3.2%) |
| 10 to 14 Years | 57 (4.8%) | 70 (5.8%) |
| 15 to 19 Years | 64 (5.4%) | 67 (5.5%) |
| 20 to 24 Years | 84 (7.1%) | 41 (3.4%) |
| 25 to 29 Years | 46 (3.9%) | 25 (2.1%) |
| 30 to 34 Years | 14 (1.2%) | 41 (3.4%) |
| 35 to 39 Years | 59 (5.0%) | 69 (5.7%) |
| 40 to 44 Years | 100 (8.4%) | 60 (4.9%) |
| 45 to 49 Years | 50 (4.2%) | 43 (3.5%) |
| 50 to 54 Years | 71 (6.0%) | 95 (7.8%) |
| 55 to 59 Years | 91 (7.7%) | 100 (8.2%) |
| 60 to 64 Years | 66 (5.6%) | 266 (21.9%) |
| 65 to 69 Years | 228 (19.2%) | 68 (5.6%) |
| 70 to 74 Years | 72 (6.1%) | 103 (8.5%) |
| 75 to 79 Years | 19 (1.6%) | 28 (2.3%) |
| 80 to 84 Years | 18 (1.5%) | 49 (4.0%) |
| 85 Years and over | 8 (0.7%) | 24 (2.0%) |
| Total | 1,188 (100.0%) | 1,214 (100.0%) |
Families and Households in Pine Beach borough
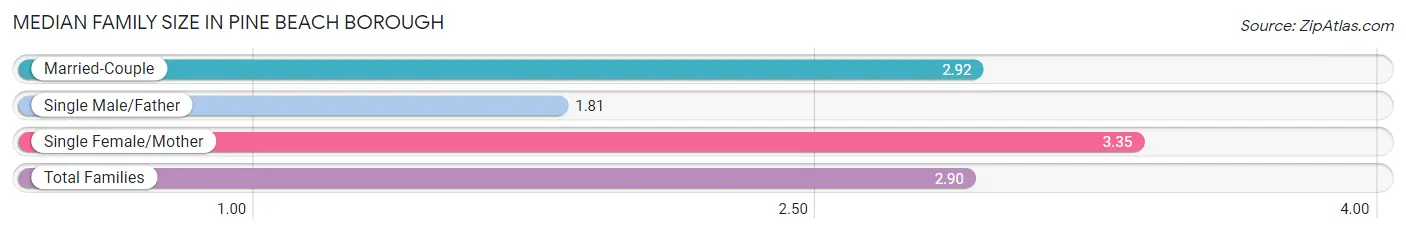
Median Family Size in Pine Beach borough
The median family size in Pine Beach borough is 2.90 persons per family, with single female/mother families (60 | 8.0%) accounting for the largest median family size of 3.35 persons per family. On the other hand, single male/father families (36 | 4.8%) represent the smallest median family size with 1.81 persons per family.
| Family Type | # Families | Family Size |
| Married-Couple | 650 (87.1%) | 2.92 |
| Single Male/Father | 36 (4.8%) | 1.81 |
| Single Female/Mother | 60 (8.0%) | 3.35 |
| Total Families | 746 (100.0%) | 2.90 |
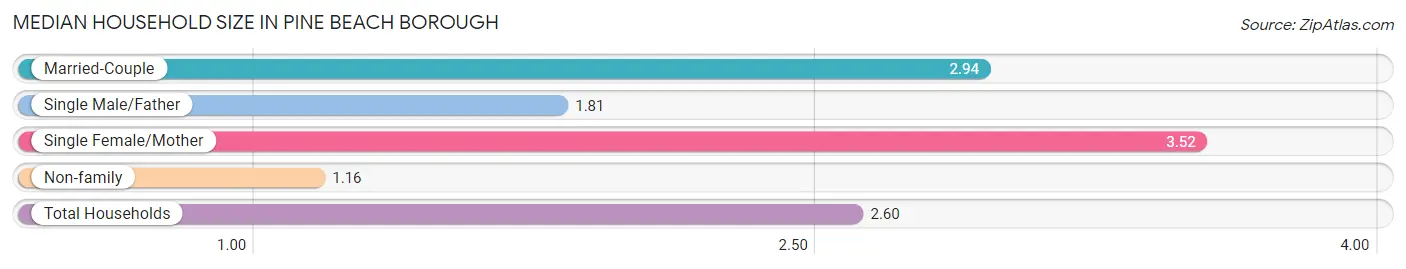
Median Household Size in Pine Beach borough
The median household size in Pine Beach borough is 2.60 persons per household, with single female/mother households (60 | 6.5%) accounting for the largest median household size of 3.52 persons per household. non-family households (173 | 18.8%) represent the smallest median household size with 1.16 persons per household.
| Household Type | # Households | Household Size |
| Married-Couple | 650 (70.7%) | 2.94 |
| Single Male/Father | 36 (3.9%) | 1.81 |
| Single Female/Mother | 60 (6.5%) | 3.52 |
| Non-family | 173 (18.8%) | 1.16 |
| Total Households | 919 (100.0%) | 2.60 |
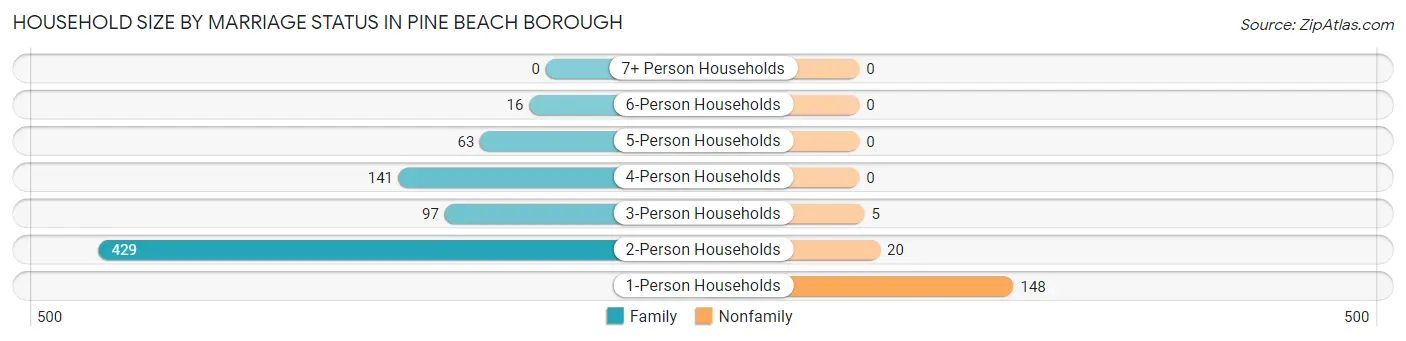
Household Size by Marriage Status in Pine Beach borough
Out of a total of 919 households in Pine Beach borough, 746 (81.2%) are family households, while 173 (18.8%) are nonfamily households. The most numerous type of family households are 2-person households, comprising 429, and the most common type of nonfamily households are 1-person households, comprising 148.
| Household Size | Family Households | Nonfamily Households |
| 1-Person Households | - | 148 (16.1%) |
| 2-Person Households | 429 (46.7%) | 20 (2.2%) |
| 3-Person Households | 97 (10.5%) | 5 (0.5%) |
| 4-Person Households | 141 (15.3%) | 0 (0.0%) |
| 5-Person Households | 63 (6.9%) | 0 (0.0%) |
| 6-Person Households | 16 (1.7%) | 0 (0.0%) |
| 7+ Person Households | 0 (0.0%) | 0 (0.0%) |
| Total | 746 (81.2%) | 173 (18.8%) |
Female Fertility in Pine Beach borough
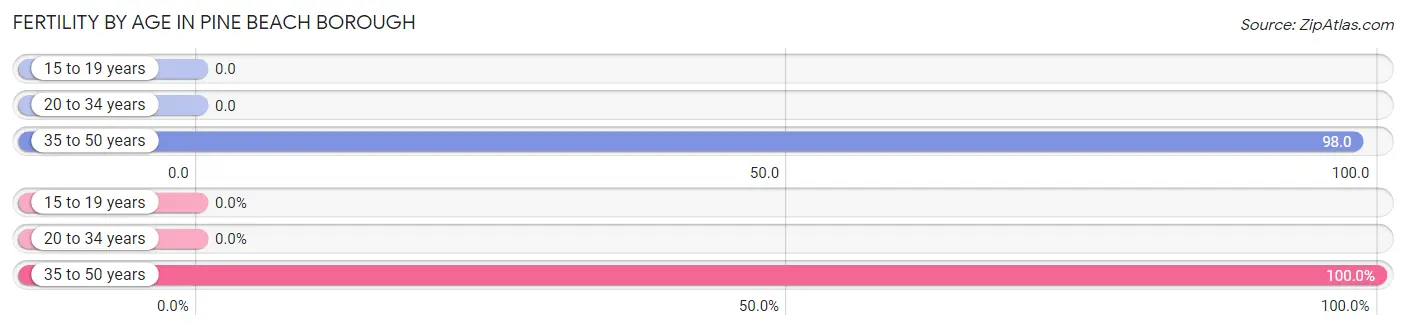
Fertility by Age in Pine Beach borough
Average fertility rate in Pine Beach borough is 50.0 births per 1,000 women. Women in the age bracket of 35 to 50 years have the highest fertility rate with 98.0 births per 1,000 women. Women in the age bracket of 35 to 50 years acount for 100.0% of all women with births.
| Age Bracket | Women with Births | Births / 1,000 Women |
| 15 to 19 years | 0 (0.0%) | 0.0 |
| 20 to 34 years | 0 (0.0%) | 0.0 |
| 35 to 50 years | 18 (100.0%) | 98.0 |
| Total | 18 (100.0%) | 50.0 |
Fertility by Age by Marriage Status in Pine Beach borough
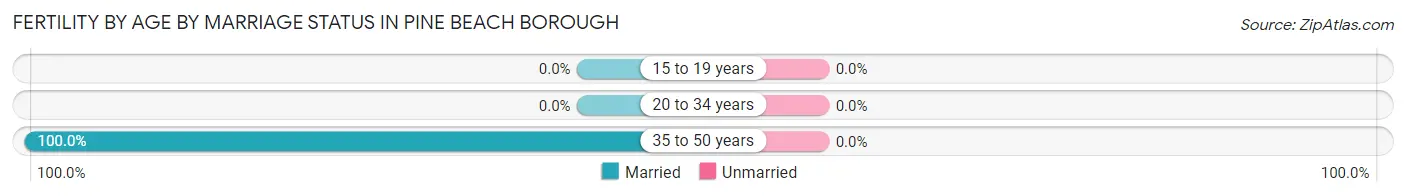
| Age Bracket | Married | Unmarried |
| 15 to 19 years | 0 (0.0%) | 0 (0.0%) |
| 20 to 34 years | 0 (0.0%) | 0 (0.0%) |
| 35 to 50 years | 18 (100.0%) | 0 (0.0%) |
| Total | 18 (100.0%) | 0 (0.0%) |
Fertility by Education in Pine Beach borough
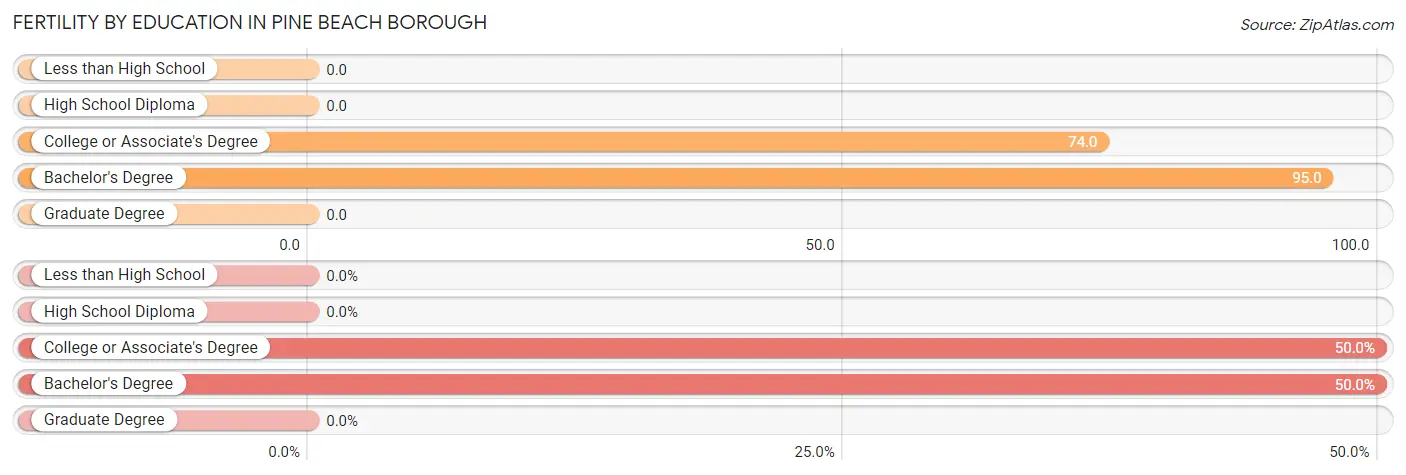
| Educational Attainment | Women with Births | Births / 1,000 Women |
| Less than High School | 0 (0.0%) | 0.0 |
| High School Diploma | 0 (0.0%) | 0.0 |
| College or Associate's Degree | 9 (50.0%) | 74.0 |
| Bachelor's Degree | 9 (50.0%) | 95.0 |
| Graduate Degree | 0 (0.0%) | 0.0 |
| Total | 18 (100.0%) | 50.0 |
Fertility by Education by Marriage Status in Pine Beach borough
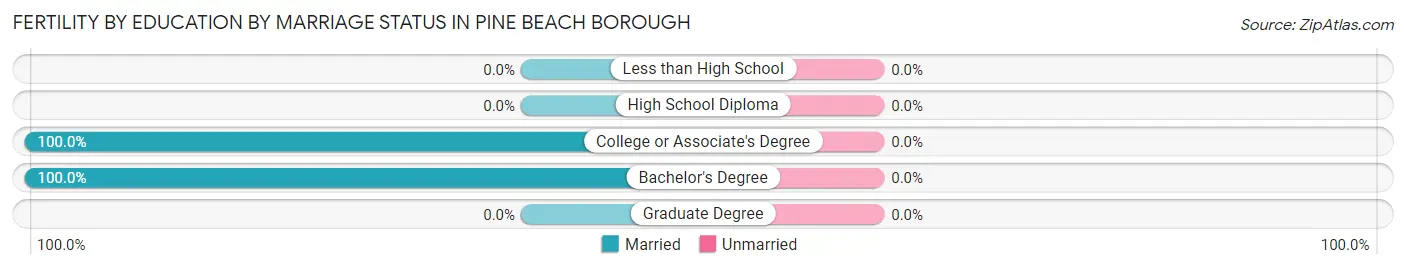
| Educational Attainment | Married | Unmarried |
| Less than High School | 0 (0.0%) | 0 (0.0%) |
| High School Diploma | 0 (0.0%) | 0 (0.0%) |
| College or Associate's Degree | 9 (100.0%) | 0 (0.0%) |
| Bachelor's Degree | 9 (100.0%) | 0 (0.0%) |
| Graduate Degree | 0 (0.0%) | 0 (0.0%) |
| Total | 18 (100.0%) | 0 (0.0%) |
Employment Characteristics in Pine Beach borough
Employment by Class of Employer in Pine Beach borough
Among the 1,259 employed individuals in Pine Beach borough, private company employees (588 | 46.7%), local government employees (463 | 36.8%), and self-employed (incorporated) (85 | 6.8%) make up the most common classes of employment.
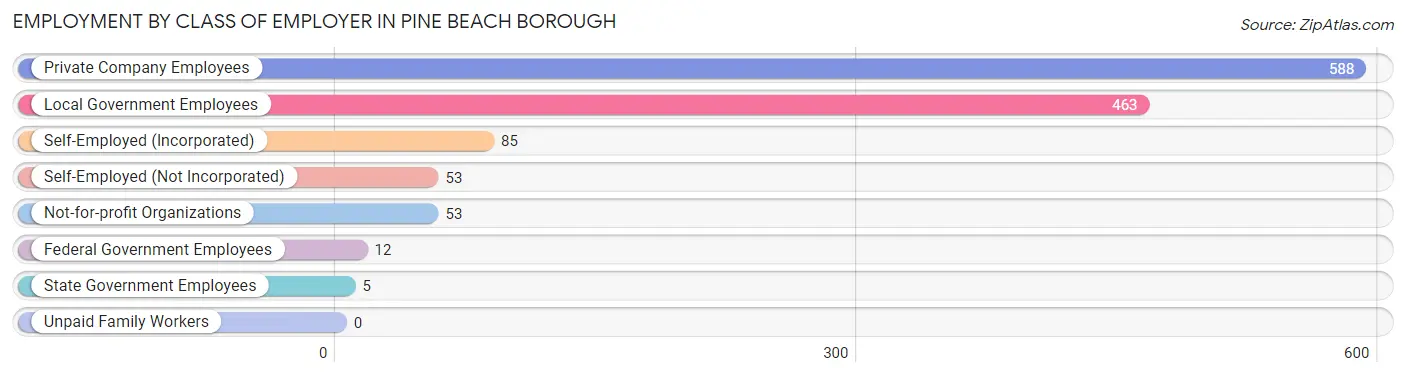
| Employer Class | # Employees | % Employees |
| Private Company Employees | 588 | 46.7% |
| Self-Employed (Incorporated) | 85 | 6.8% |
| Self-Employed (Not Incorporated) | 53 | 4.2% |
| Not-for-profit Organizations | 53 | 4.2% |
| Local Government Employees | 463 | 36.8% |
| State Government Employees | 5 | 0.4% |
| Federal Government Employees | 12 | 0.9% |
| Unpaid Family Workers | 0 | 0.0% |
| Total | 1,259 | 100.0% |
Employment Status by Age in Pine Beach borough
According to the labor force statistics for Pine Beach borough, out of the total population over 16 years of age (2,046), 64.3% or 1,316 individuals are in the labor force, with 3.2% or 42 of them unemployed. The age group with the highest labor force participation rate is 25 to 29 years, with 100.0% or 71 individuals in the labor force. Within the labor force, the 30 to 34 years age range has the highest percentage of unemployed individuals, with 21.2% or 11 of them being unemployed.
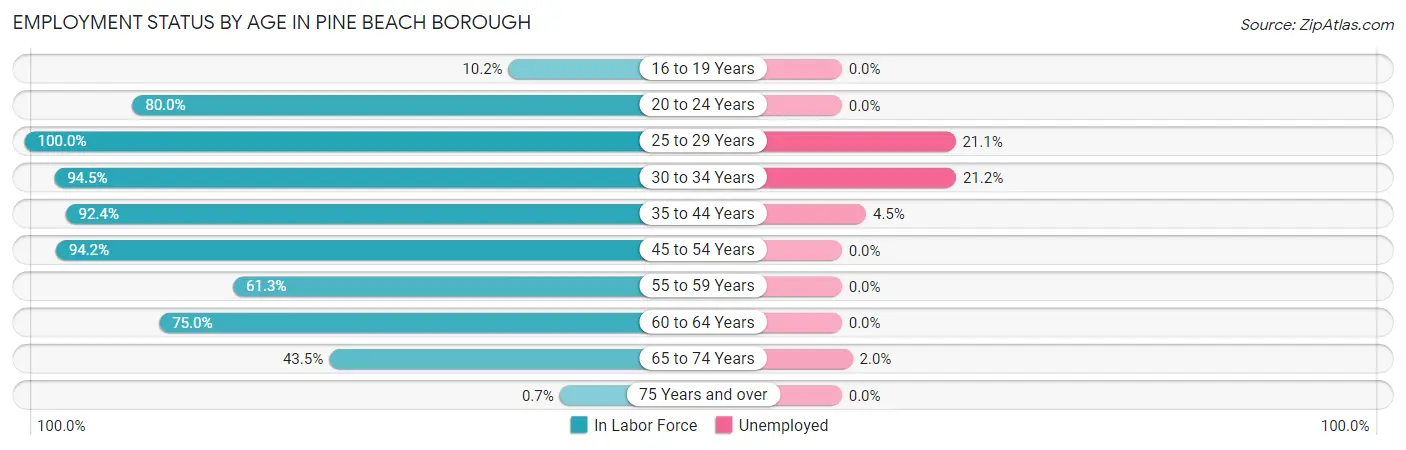
| Age Bracket | In Labor Force | Unemployed |
| 16 to 19 Years | 11 (10.2%) | 0 (0.0%) |
| 20 to 24 Years | 100 (80.0%) | 0 (0.0%) |
| 25 to 29 Years | 71 (100.0%) | 15 (21.1%) |
| 30 to 34 Years | 52 (94.5%) | 11 (21.2%) |
| 35 to 44 Years | 266 (92.4%) | 12 (4.5%) |
| 45 to 54 Years | 244 (94.2%) | 0 (0.0%) |
| 55 to 59 Years | 117 (61.3%) | 0 (0.0%) |
| 60 to 64 Years | 249 (75.0%) | 0 (0.0%) |
| 65 to 74 Years | 205 (43.5%) | 4 (2.0%) |
| 75 Years and over | 1 (0.7%) | 0 (0.0%) |
| Total | 1,316 (64.3%) | 42 (3.2%) |
Employment Status by Educational Attainment in Pine Beach borough
According to labor force statistics for Pine Beach borough, 83.5% of individuals (999) out of the total population between 25 and 64 years of age (1,196) are in the labor force, with 3.8% or 38 of them being unemployed. The group with the highest labor force participation rate are those with the educational attainment of bachelor's degree or higher, with 88.7% or 571 individuals in the labor force. Within the labor force, individuals with high school diploma education have the highest percentage of unemployment, with 6.6% or 10 of them being unemployed.
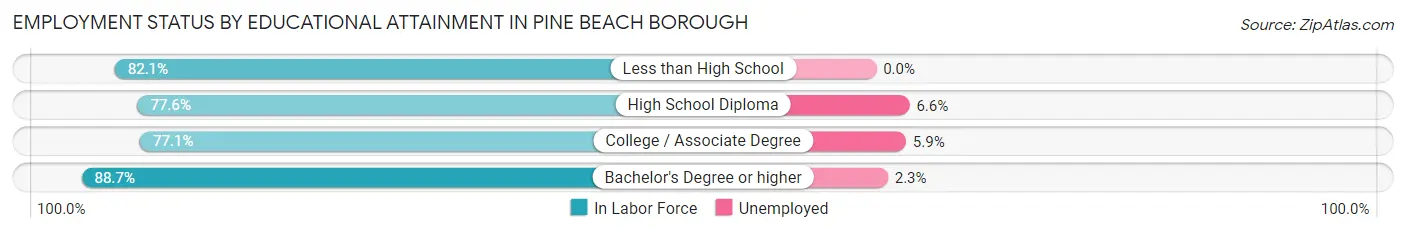
| Educational Attainment | In Labor Force | Unemployed |
| Less than High School | 23 (82.1%) | 0 (0.0%) |
| High School Diploma | 152 (77.6%) | 13 (6.6%) |
| College / Associate Degree | 253 (77.1%) | 19 (5.9%) |
| Bachelor's Degree or higher | 571 (88.7%) | 15 (2.3%) |
| Total | 999 (83.5%) | 45 (3.8%) |
Employment Occupations by Sex in Pine Beach borough
Management, Business, Science and Arts Occupations
The most common Management, Business, Science and Arts occupations in Pine Beach borough are Community & Social Service (251 | 19.7%), Education, Arts & Media (164 | 12.9%), Management (142 | 11.2%), Health Diagnosing & Treating (103 | 8.1%), and Education Instruction & Library (78 | 6.1%).
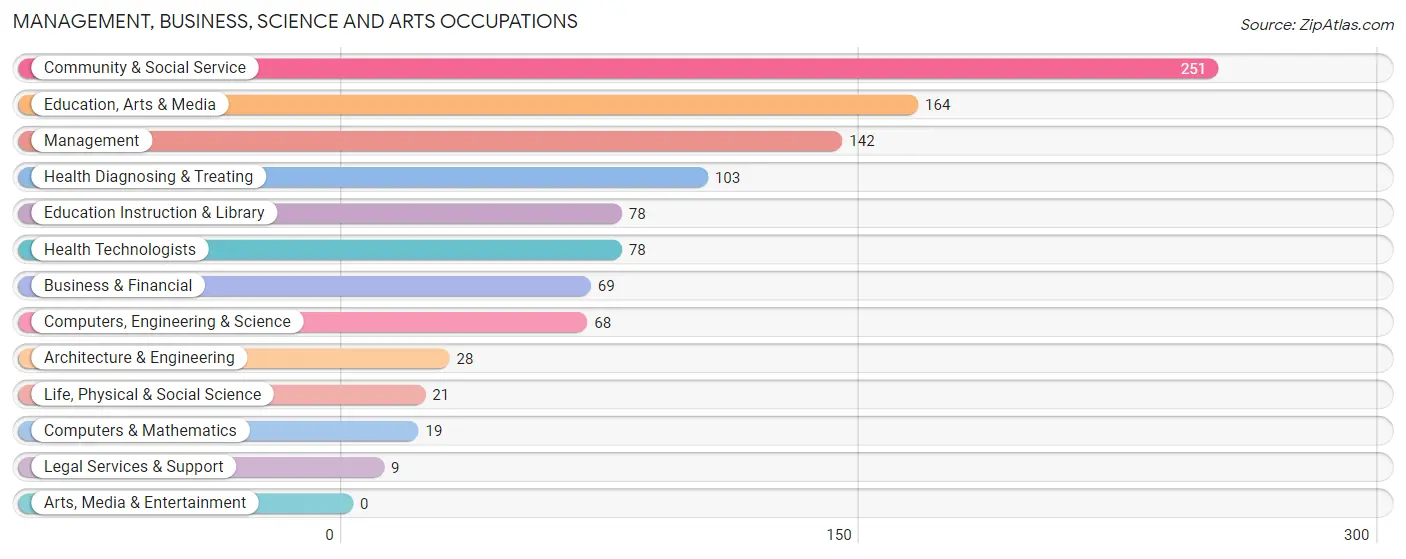
Management, Business, Science and Arts Occupations by Sex
Within the Management, Business, Science and Arts occupations in Pine Beach borough, the most male-oriented occupations are Computers & Mathematics (100.0%), Architecture & Engineering (100.0%), and Legal Services & Support (100.0%), while the most female-oriented occupations are Education, Arts & Media (98.2%), Community & Social Service (88.8%), and Education Instruction & Library (79.5%).
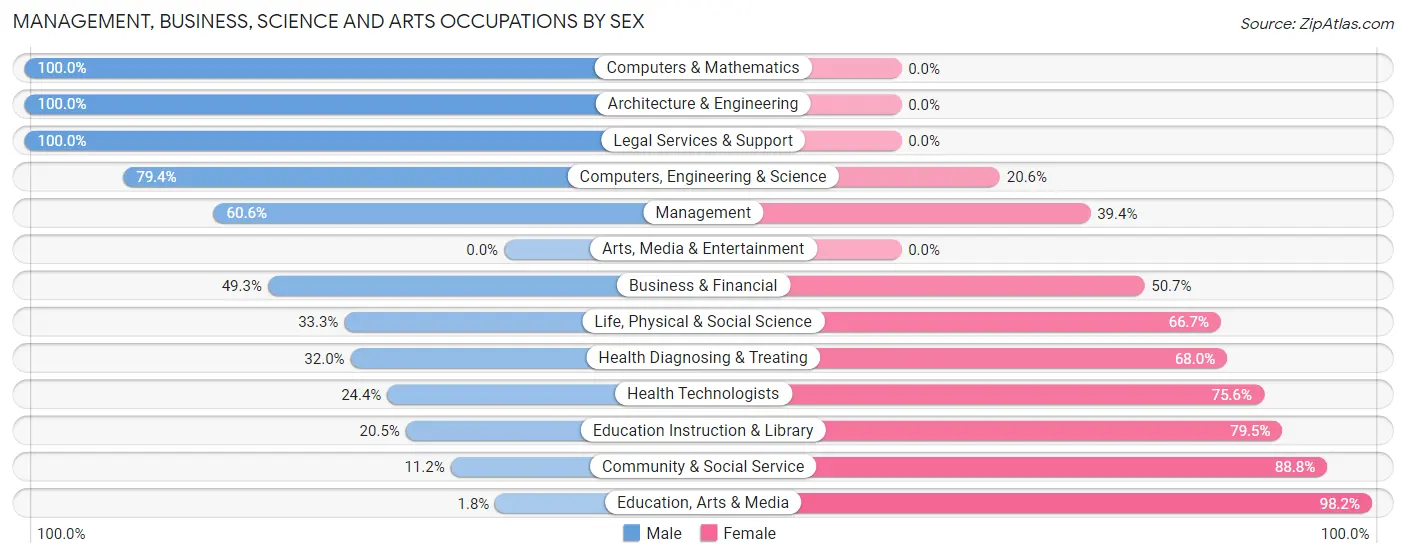
| Occupation | Male | Female |
| Management | 86 (60.6%) | 56 (39.4%) |
| Business & Financial | 34 (49.3%) | 35 (50.7%) |
| Computers, Engineering & Science | 54 (79.4%) | 14 (20.6%) |
| Computers & Mathematics | 19 (100.0%) | 0 (0.0%) |
| Architecture & Engineering | 28 (100.0%) | 0 (0.0%) |
| Life, Physical & Social Science | 7 (33.3%) | 14 (66.7%) |
| Community & Social Service | 28 (11.2%) | 223 (88.8%) |
| Education, Arts & Media | 3 (1.8%) | 161 (98.2%) |
| Legal Services & Support | 9 (100.0%) | 0 (0.0%) |
| Education Instruction & Library | 16 (20.5%) | 62 (79.5%) |
| Arts, Media & Entertainment | 0 (0.0%) | 0 (0.0%) |
| Health Diagnosing & Treating | 33 (32.0%) | 70 (68.0%) |
| Health Technologists | 19 (24.4%) | 59 (75.6%) |
| Total (Category) | 235 (37.1%) | 398 (62.9%) |
| Total (Overall) | 652 (51.2%) | 622 (48.8%) |
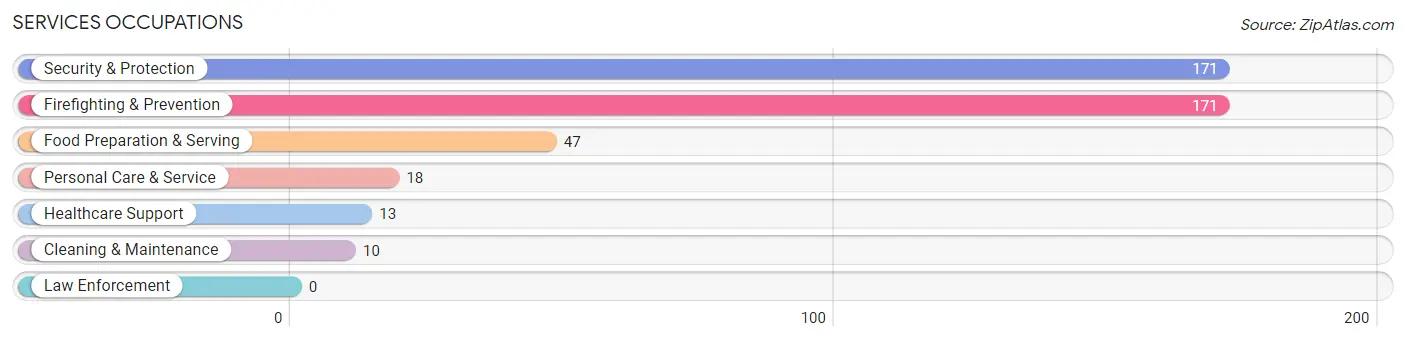
Services Occupations
The most common Services occupations in Pine Beach borough are Security & Protection (171 | 13.4%), Firefighting & Prevention (171 | 13.4%), Food Preparation & Serving (47 | 3.7%), Personal Care & Service (18 | 1.4%), and Healthcare Support (13 | 1.0%).
Services Occupations by Sex
Within the Services occupations in Pine Beach borough, the most male-oriented occupations are Cleaning & Maintenance (100.0%), Security & Protection (91.8%), and Firefighting & Prevention (91.8%), while the most female-oriented occupations are Personal Care & Service (100.0%), Food Preparation & Serving (44.7%), and Healthcare Support (38.5%).
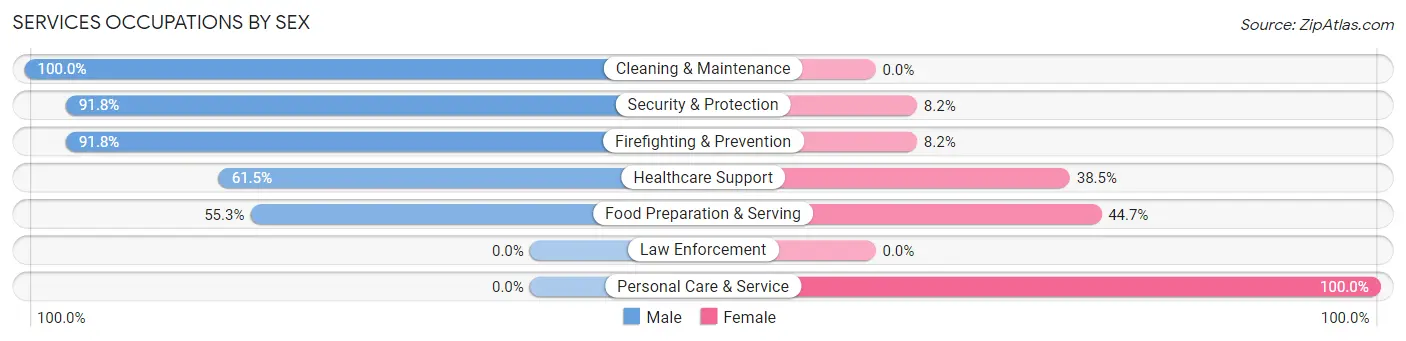
| Occupation | Male | Female |
| Healthcare Support | 8 (61.5%) | 5 (38.5%) |
| Security & Protection | 157 (91.8%) | 14 (8.2%) |
| Firefighting & Prevention | 157 (91.8%) | 14 (8.2%) |
| Law Enforcement | 0 (0.0%) | 0 (0.0%) |
| Food Preparation & Serving | 26 (55.3%) | 21 (44.7%) |
| Cleaning & Maintenance | 10 (100.0%) | 0 (0.0%) |
| Personal Care & Service | 0 (0.0%) | 18 (100.0%) |
| Total (Category) | 201 (77.6%) | 58 (22.4%) |
| Total (Overall) | 652 (51.2%) | 622 (48.8%) |
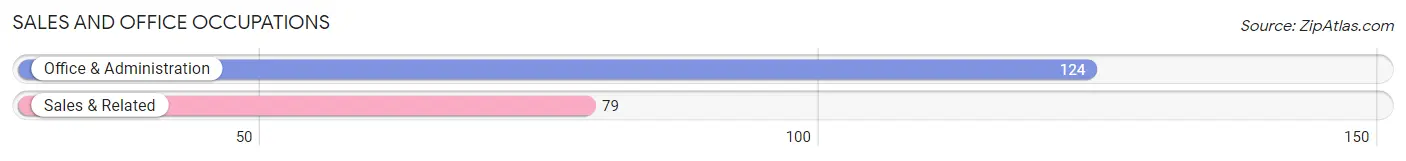
Sales and Office Occupations
The most common Sales and Office occupations in Pine Beach borough are Office & Administration (124 | 9.7%), and Sales & Related (79 | 6.2%).
Sales and Office Occupations by Sex
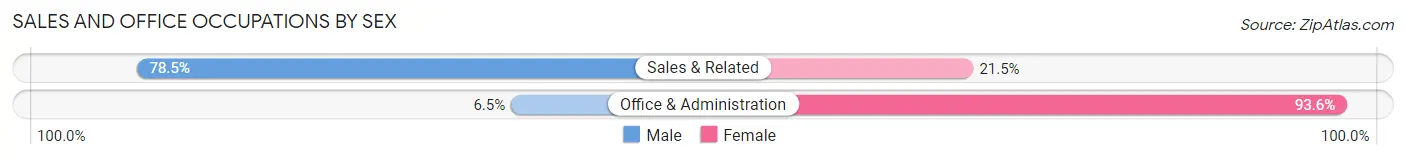
| Occupation | Male | Female |
| Sales & Related | 62 (78.5%) | 17 (21.5%) |
| Office & Administration | 8 (6.5%) | 116 (93.5%) |
| Total (Category) | 70 (34.5%) | 133 (65.5%) |
| Total (Overall) | 652 (51.2%) | 622 (48.8%) |
Natural Resources, Construction and Maintenance Occupations
The most common Natural Resources, Construction and Maintenance occupations in Pine Beach borough are Installation, Maintenance & Repair (58 | 4.5%), and Construction & Extraction (30 | 2.4%).
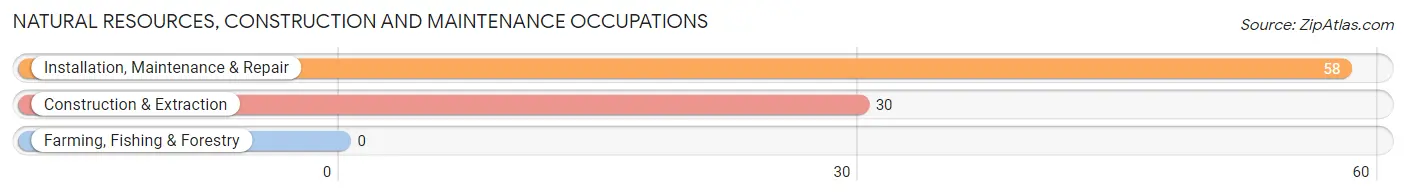
Natural Resources, Construction and Maintenance Occupations by Sex
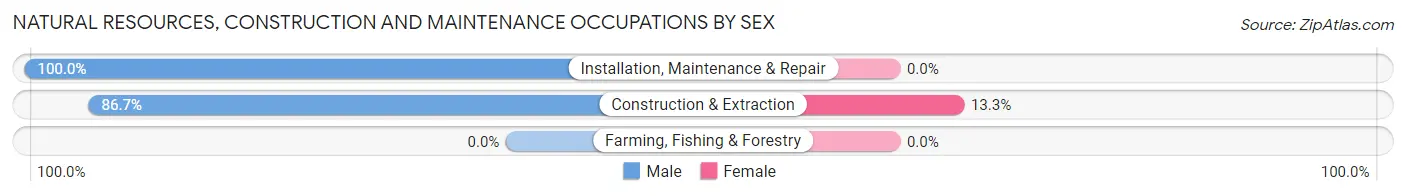
| Occupation | Male | Female |
| Farming, Fishing & Forestry | 0 (0.0%) | 0 (0.0%) |
| Construction & Extraction | 26 (86.7%) | 4 (13.3%) |
| Installation, Maintenance & Repair | 58 (100.0%) | 0 (0.0%) |
| Total (Category) | 84 (95.5%) | 4 (4.5%) |
| Total (Overall) | 652 (51.2%) | 622 (48.8%) |
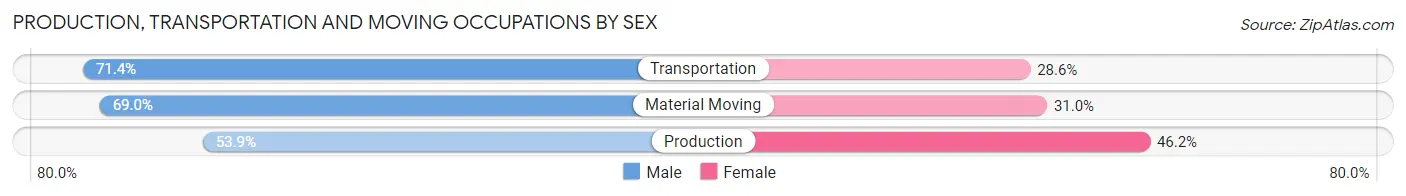
Production, Transportation and Moving Occupations
The most common Production, Transportation and Moving occupations in Pine Beach borough are Transportation (49 | 3.8%), Material Moving (29 | 2.3%), and Production (13 | 1.0%).
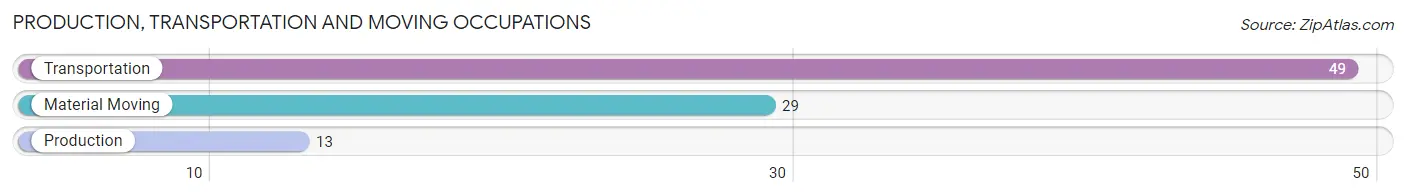
Production, Transportation and Moving Occupations by Sex
| Occupation | Male | Female |
| Production | 7 (53.8%) | 6 (46.2%) |
| Transportation | 35 (71.4%) | 14 (28.6%) |
| Material Moving | 20 (69.0%) | 9 (31.0%) |
| Total (Category) | 62 (68.1%) | 29 (31.9%) |
| Total (Overall) | 652 (51.2%) | 622 (48.8%) |
Employment Industries by Sex in Pine Beach borough
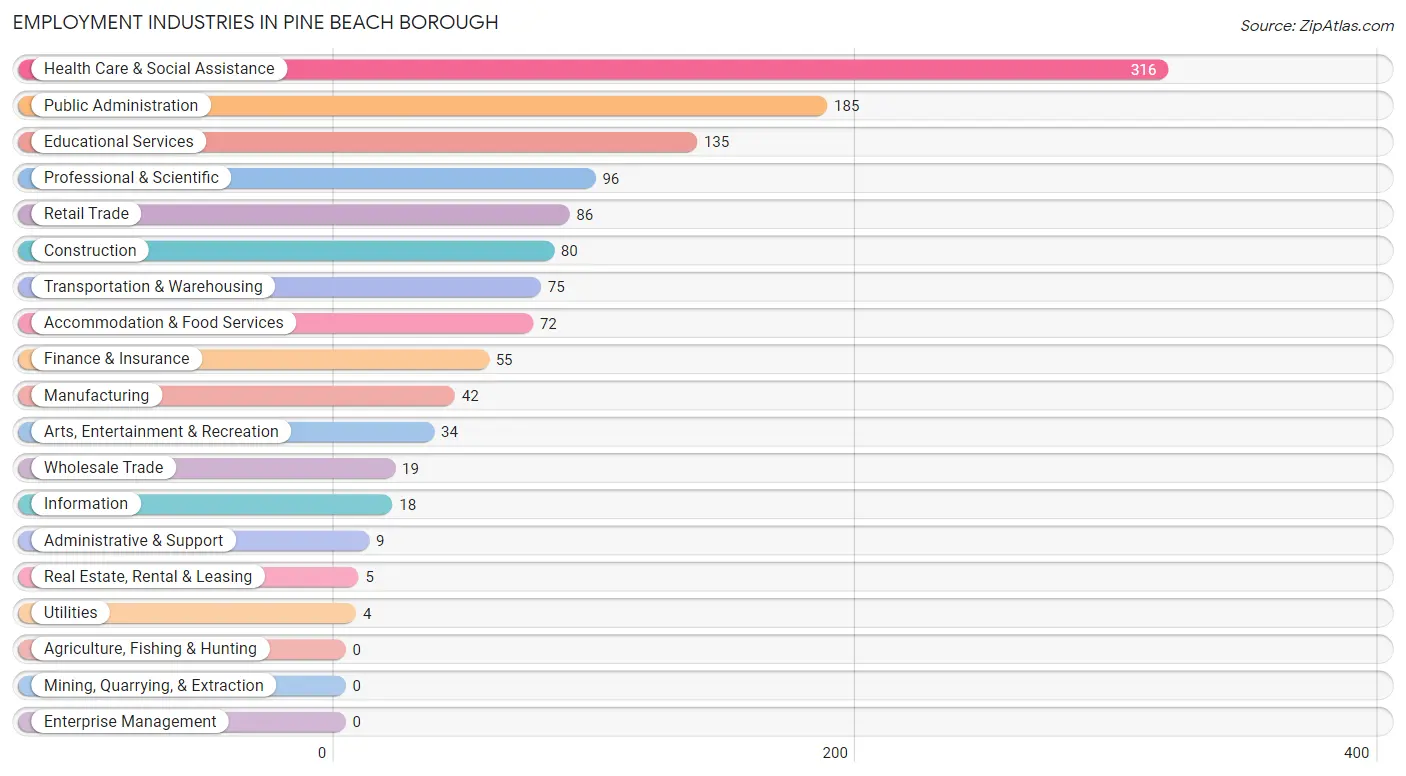
Employment Industries in Pine Beach borough
The major employment industries in Pine Beach borough include Health Care & Social Assistance (316 | 24.8%), Public Administration (185 | 14.5%), Educational Services (135 | 10.6%), Professional & Scientific (96 | 7.5%), and Retail Trade (86 | 6.8%).
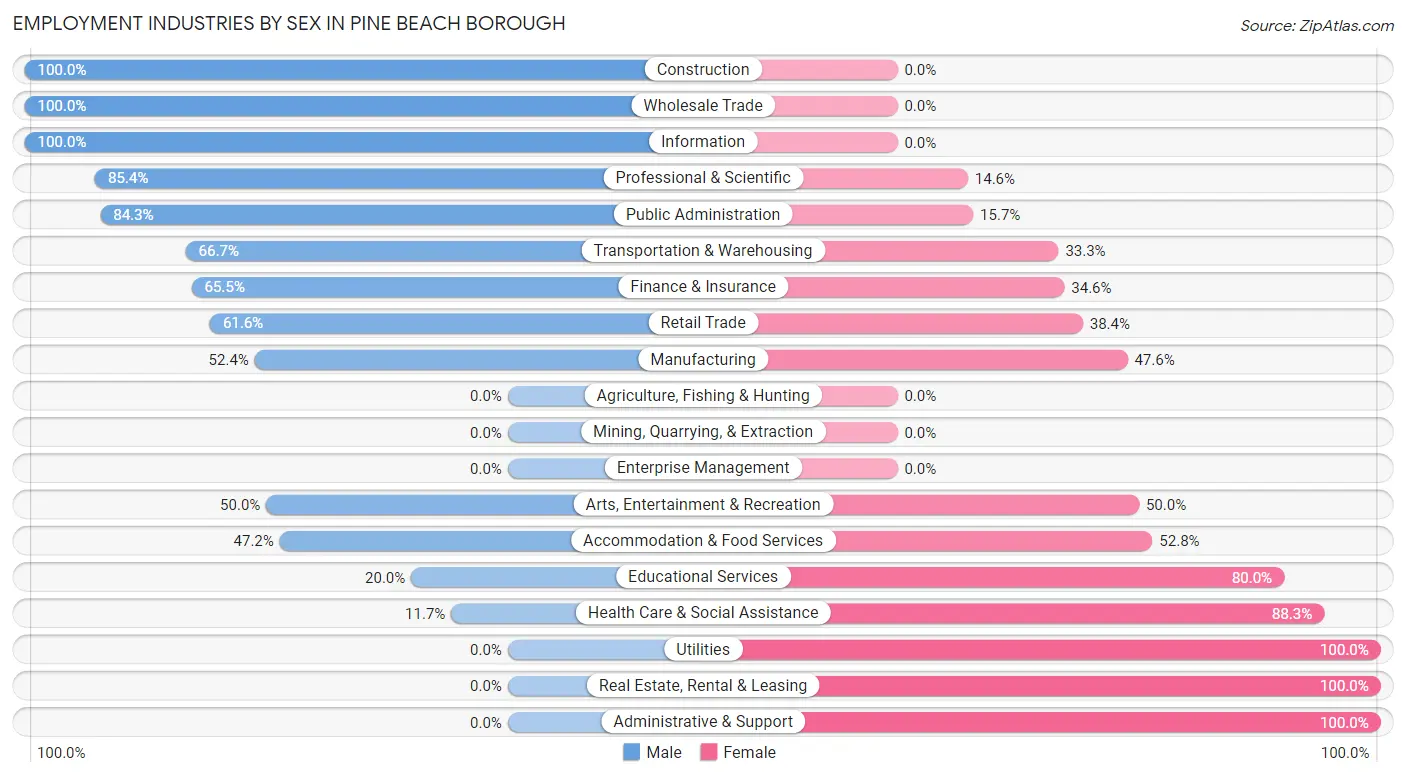
Employment Industries by Sex in Pine Beach borough
The Pine Beach borough industries that see more men than women are Construction (100.0%), Wholesale Trade (100.0%), and Information (100.0%), whereas the industries that tend to have a higher number of women are Utilities (100.0%), Real Estate, Rental & Leasing (100.0%), and Administrative & Support (100.0%).
| Industry | Male | Female |
| Agriculture, Fishing & Hunting | 0 (0.0%) | 0 (0.0%) |
| Mining, Quarrying, & Extraction | 0 (0.0%) | 0 (0.0%) |
| Construction | 80 (100.0%) | 0 (0.0%) |
| Manufacturing | 22 (52.4%) | 20 (47.6%) |
| Wholesale Trade | 19 (100.0%) | 0 (0.0%) |
| Retail Trade | 53 (61.6%) | 33 (38.4%) |
| Transportation & Warehousing | 50 (66.7%) | 25 (33.3%) |
| Utilities | 0 (0.0%) | 4 (100.0%) |
| Information | 18 (100.0%) | 0 (0.0%) |
| Finance & Insurance | 36 (65.4%) | 19 (34.5%) |
| Real Estate, Rental & Leasing | 0 (0.0%) | 5 (100.0%) |
| Professional & Scientific | 82 (85.4%) | 14 (14.6%) |
| Enterprise Management | 0 (0.0%) | 0 (0.0%) |
| Administrative & Support | 0 (0.0%) | 9 (100.0%) |
| Educational Services | 27 (20.0%) | 108 (80.0%) |
| Health Care & Social Assistance | 37 (11.7%) | 279 (88.3%) |
| Arts, Entertainment & Recreation | 17 (50.0%) | 17 (50.0%) |
| Accommodation & Food Services | 34 (47.2%) | 38 (52.8%) |
| Public Administration | 156 (84.3%) | 29 (15.7%) |
| Total | 652 (51.2%) | 622 (48.8%) |
Education in Pine Beach borough
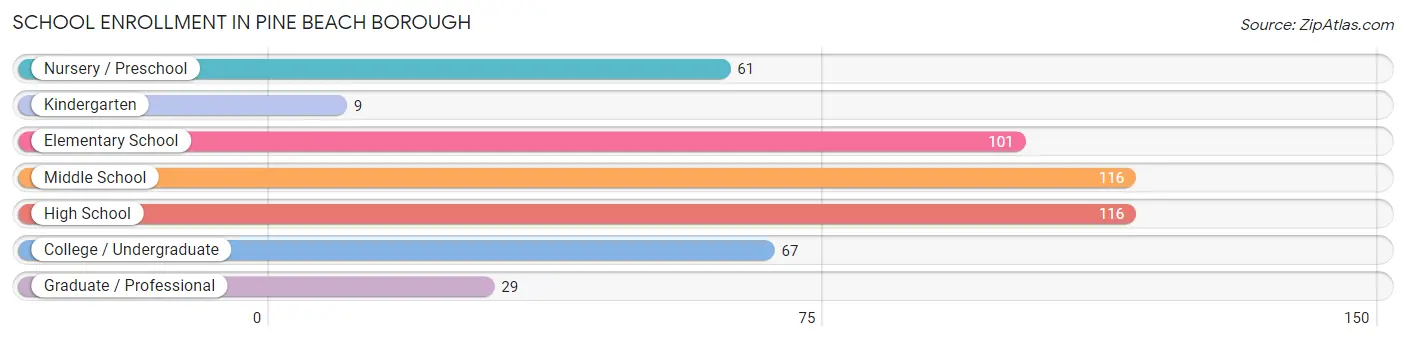
School Enrollment in Pine Beach borough
The most common levels of schooling among the 499 students in Pine Beach borough are middle school (116 | 23.3%), high school (116 | 23.3%), and elementary school (101 | 20.2%).
| School Level | # Students | % Students |
| Nursery / Preschool | 61 | 12.2% |
| Kindergarten | 9 | 1.8% |
| Elementary School | 101 | 20.2% |
| Middle School | 116 | 23.3% |
| High School | 116 | 23.3% |
| College / Undergraduate | 67 | 13.4% |
| Graduate / Professional | 29 | 5.8% |
| Total | 499 | 100.0% |
School Enrollment by Age by Funding Source in Pine Beach borough
Out of a total of 499 students who are enrolled in schools in Pine Beach borough, 89 (17.8%) attend a private institution, while the remaining 410 (82.2%) are enrolled in public schools. The age group of 18 to 19 year olds has the highest likelihood of being enrolled in private schools, with 23 (56.1% in the age bracket) enrolled. Conversely, the age group of 5 to 9 year old has the lowest likelihood of being enrolled in a private school, with 101 (100.0% in the age bracket) attending a public institution.
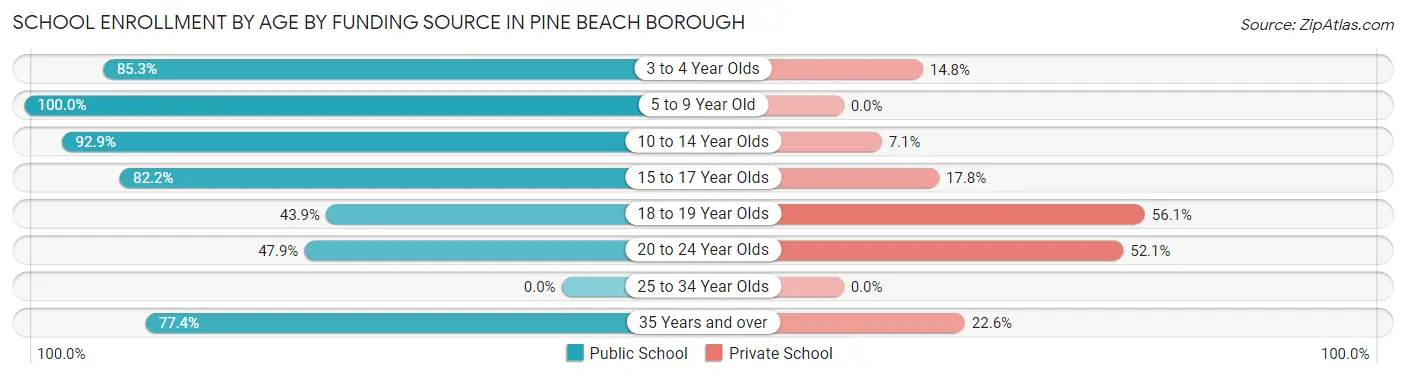
| Age Bracket | Public School | Private School |
| 3 to 4 Year Olds | 52 (85.3%) | 9 (14.7%) |
| 5 to 9 Year Old | 101 (100.0%) | 0 (0.0%) |
| 10 to 14 Year Olds | 118 (92.9%) | 9 (7.1%) |
| 15 to 17 Year Olds | 74 (82.2%) | 16 (17.8%) |
| 18 to 19 Year Olds | 18 (43.9%) | 23 (56.1%) |
| 20 to 24 Year Olds | 23 (47.9%) | 25 (52.1%) |
| 25 to 34 Year Olds | 0 (0.0%) | 0 (0.0%) |
| 35 Years and over | 24 (77.4%) | 7 (22.6%) |
| Total | 410 (82.2%) | 89 (17.8%) |
Educational Attainment by Field of Study in Pine Beach borough
Science & technology (194 | 20.8%), education (152 | 16.3%), business (139 | 14.9%), engineering (86 | 9.2%), and liberal arts & history (62 | 6.7%) are the most common fields of study among 931 individuals in Pine Beach borough who have obtained a bachelor's degree or higher.
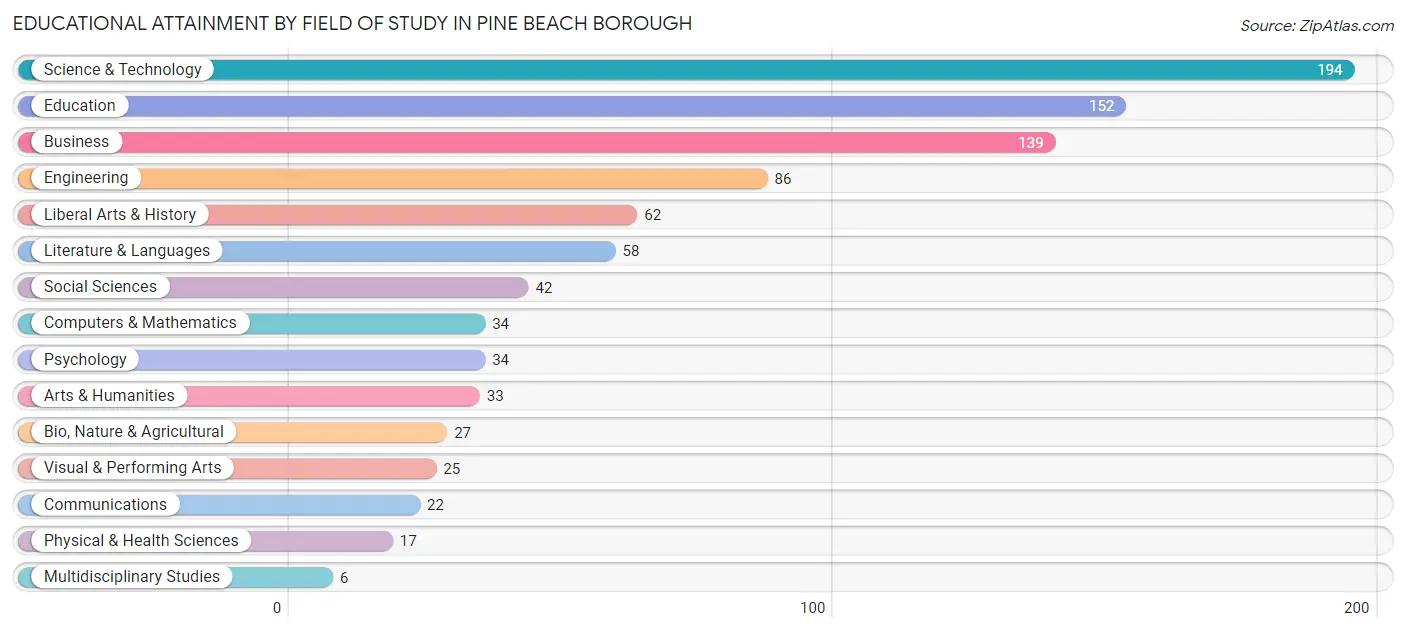
| Field of Study | # Graduates | % Graduates |
| Computers & Mathematics | 34 | 3.6% |
| Bio, Nature & Agricultural | 27 | 2.9% |
| Physical & Health Sciences | 17 | 1.8% |
| Psychology | 34 | 3.6% |
| Social Sciences | 42 | 4.5% |
| Engineering | 86 | 9.2% |
| Multidisciplinary Studies | 6 | 0.6% |
| Science & Technology | 194 | 20.8% |
| Business | 139 | 14.9% |
| Education | 152 | 16.3% |
| Literature & Languages | 58 | 6.2% |
| Liberal Arts & History | 62 | 6.7% |
| Visual & Performing Arts | 25 | 2.7% |
| Communications | 22 | 2.4% |
| Arts & Humanities | 33 | 3.5% |
| Total | 931 | 100.0% |
Transportation & Commute in Pine Beach borough
Vehicle Availability by Sex in Pine Beach borough
The most prevalent vehicle ownership categories in Pine Beach borough are males with 2 vehicles (330, accounting for 50.6%) and females with 2 vehicles (337, making up 54.4%).
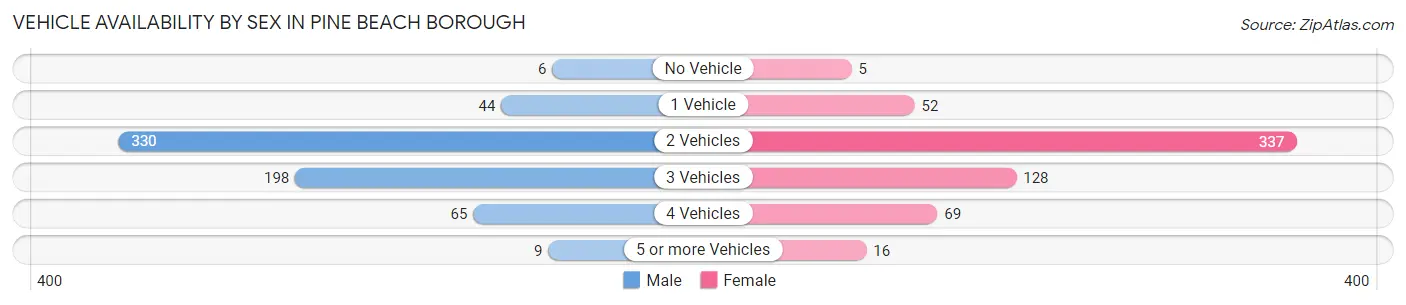
| Vehicles Available | Male | Female |
| No Vehicle | 6 (0.9%) | 5 (0.8%) |
| 1 Vehicle | 44 (6.8%) | 52 (8.6%) |
| 2 Vehicles | 330 (50.6%) | 337 (55.5%) |
| 3 Vehicles | 198 (30.4%) | 128 (21.1%) |
| 4 Vehicles | 65 (10.0%) | 69 (11.4%) |
| 5 or more Vehicles | 9 (1.4%) | 16 (2.6%) |
| Total | 652 (100.0%) | 607 (100.0%) |
Commute Time in Pine Beach borough
The most frequently occuring commute durations in Pine Beach borough are 15 to 19 minutes (422 commuters, 36.5%), 20 to 24 minutes (161 commuters, 13.9%), and 30 to 34 minutes (150 commuters, 13.0%).
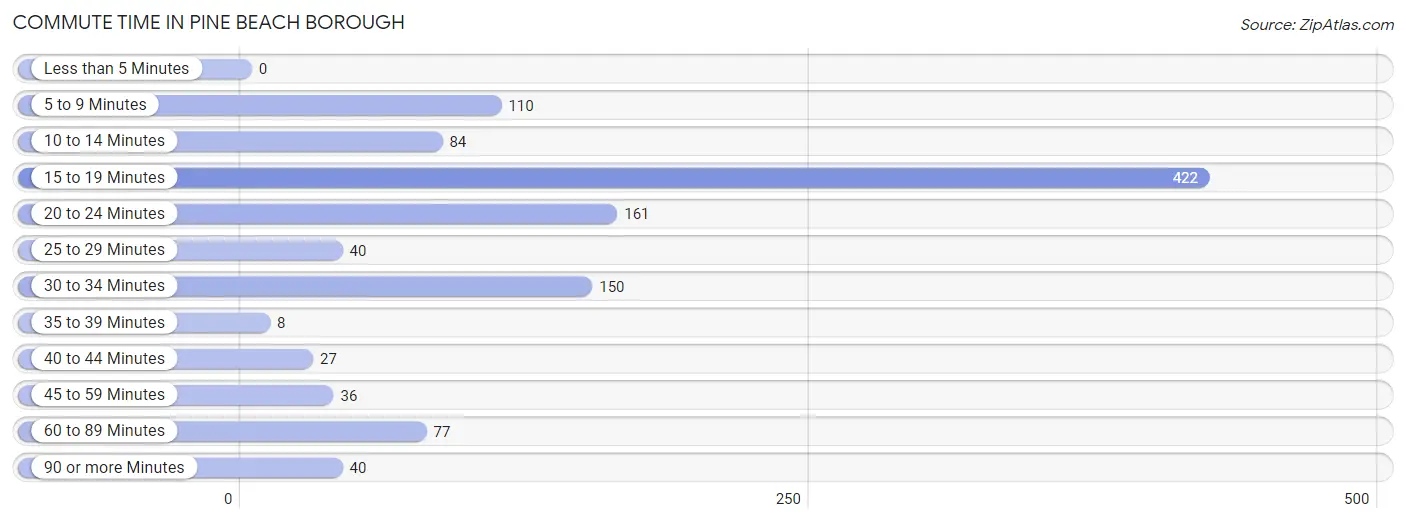
| Commute Time | # Commuters | % Commuters |
| Less than 5 Minutes | 0 | 0.0% |
| 5 to 9 Minutes | 110 | 9.5% |
| 10 to 14 Minutes | 84 | 7.3% |
| 15 to 19 Minutes | 422 | 36.5% |
| 20 to 24 Minutes | 161 | 13.9% |
| 25 to 29 Minutes | 40 | 3.5% |
| 30 to 34 Minutes | 150 | 13.0% |
| 35 to 39 Minutes | 8 | 0.7% |
| 40 to 44 Minutes | 27 | 2.3% |
| 45 to 59 Minutes | 36 | 3.1% |
| 60 to 89 Minutes | 77 | 6.7% |
| 90 or more Minutes | 40 | 3.5% |
Commute Time by Sex in Pine Beach borough
The most common commute times in Pine Beach borough are 15 to 19 minutes (214 commuters, 36.0%) for males and 15 to 19 minutes (208 commuters, 37.1%) for females.
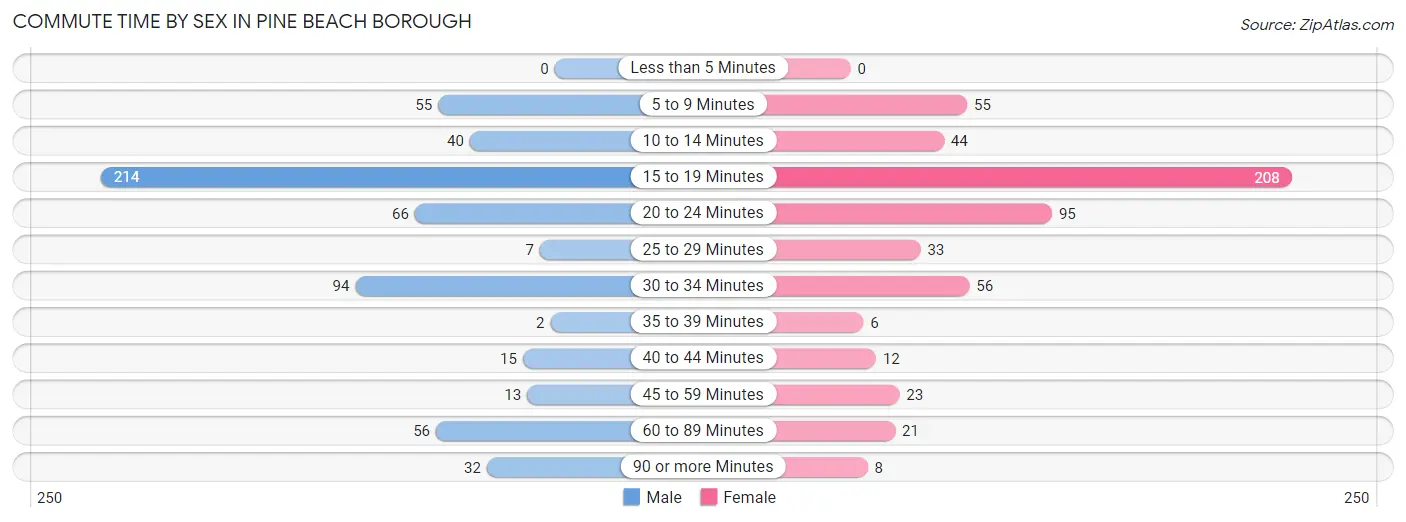
| Commute Time | Male | Female |
| Less than 5 Minutes | 0 (0.0%) | 0 (0.0%) |
| 5 to 9 Minutes | 55 (9.3%) | 55 (9.8%) |
| 10 to 14 Minutes | 40 (6.7%) | 44 (7.8%) |
| 15 to 19 Minutes | 214 (36.0%) | 208 (37.1%) |
| 20 to 24 Minutes | 66 (11.1%) | 95 (16.9%) |
| 25 to 29 Minutes | 7 (1.2%) | 33 (5.9%) |
| 30 to 34 Minutes | 94 (15.8%) | 56 (10.0%) |
| 35 to 39 Minutes | 2 (0.3%) | 6 (1.1%) |
| 40 to 44 Minutes | 15 (2.5%) | 12 (2.1%) |
| 45 to 59 Minutes | 13 (2.2%) | 23 (4.1%) |
| 60 to 89 Minutes | 56 (9.4%) | 21 (3.7%) |
| 90 or more Minutes | 32 (5.4%) | 8 (1.4%) |
Time of Departure to Work by Sex in Pine Beach borough
The most frequent times of departure to work in Pine Beach borough are 7:00 AM to 7:29 AM (287, 48.3%) for males and 7:00 AM to 7:29 AM (217, 38.7%) for females.
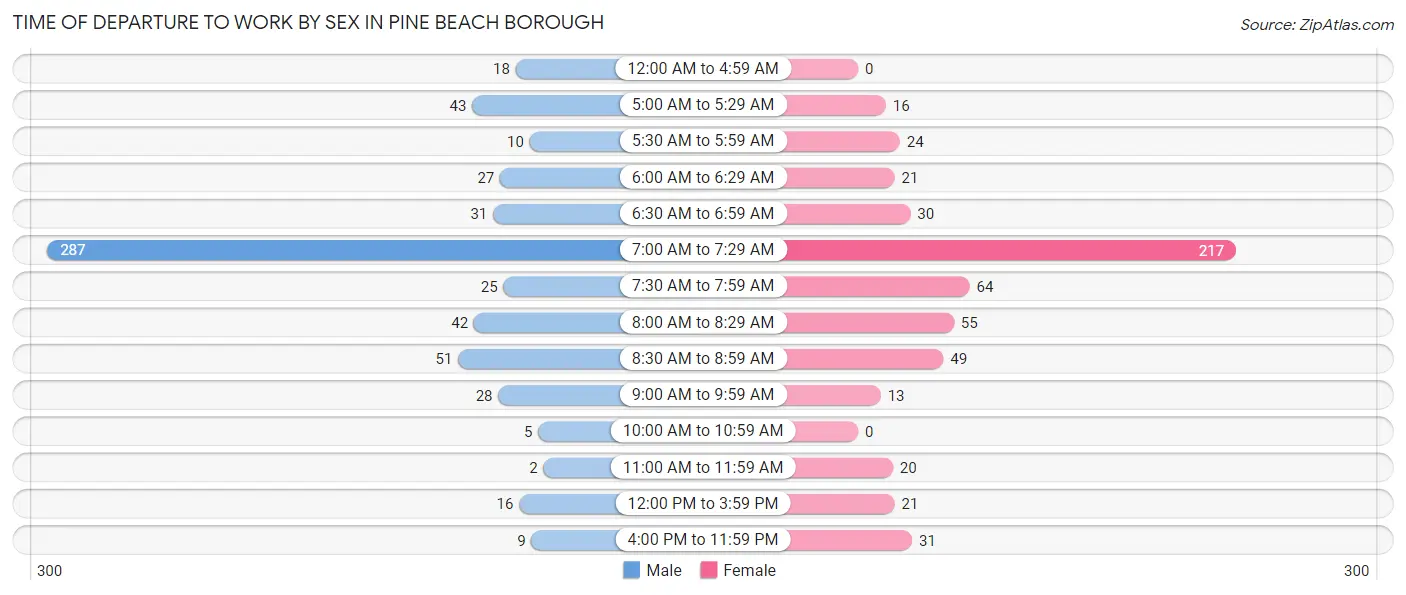
| Time of Departure | Male | Female |
| 12:00 AM to 4:59 AM | 18 (3.0%) | 0 (0.0%) |
| 5:00 AM to 5:29 AM | 43 (7.2%) | 16 (2.9%) |
| 5:30 AM to 5:59 AM | 10 (1.7%) | 24 (4.3%) |
| 6:00 AM to 6:29 AM | 27 (4.5%) | 21 (3.7%) |
| 6:30 AM to 6:59 AM | 31 (5.2%) | 30 (5.3%) |
| 7:00 AM to 7:29 AM | 287 (48.3%) | 217 (38.7%) |
| 7:30 AM to 7:59 AM | 25 (4.2%) | 64 (11.4%) |
| 8:00 AM to 8:29 AM | 42 (7.1%) | 55 (9.8%) |
| 8:30 AM to 8:59 AM | 51 (8.6%) | 49 (8.7%) |
| 9:00 AM to 9:59 AM | 28 (4.7%) | 13 (2.3%) |
| 10:00 AM to 10:59 AM | 5 (0.8%) | 0 (0.0%) |
| 11:00 AM to 11:59 AM | 2 (0.3%) | 20 (3.6%) |
| 12:00 PM to 3:59 PM | 16 (2.7%) | 21 (3.7%) |
| 4:00 PM to 11:59 PM | 9 (1.5%) | 31 (5.5%) |
| Total | 594 (100.0%) | 561 (100.0%) |
Housing Occupancy in Pine Beach borough
Occupancy by Ownership in Pine Beach borough
Of the total 919 dwellings in Pine Beach borough, owner-occupied units account for 879 (95.7%), while renter-occupied units make up 40 (4.3%).
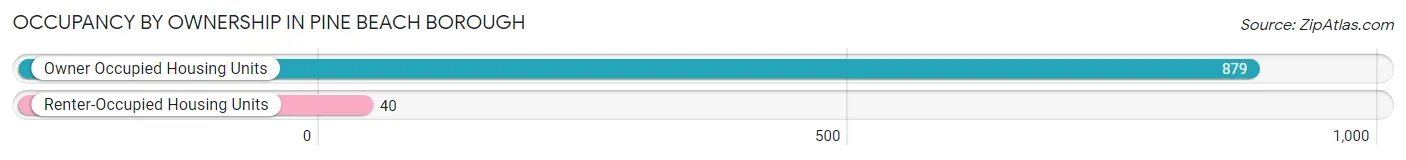
| Occupancy | # Housing Units | % Housing Units |
| Owner Occupied Housing Units | 879 | 95.7% |
| Renter-Occupied Housing Units | 40 | 4.3% |
| Total Occupied Housing Units | 919 | 100.0% |
Occupancy by Household Size in Pine Beach borough
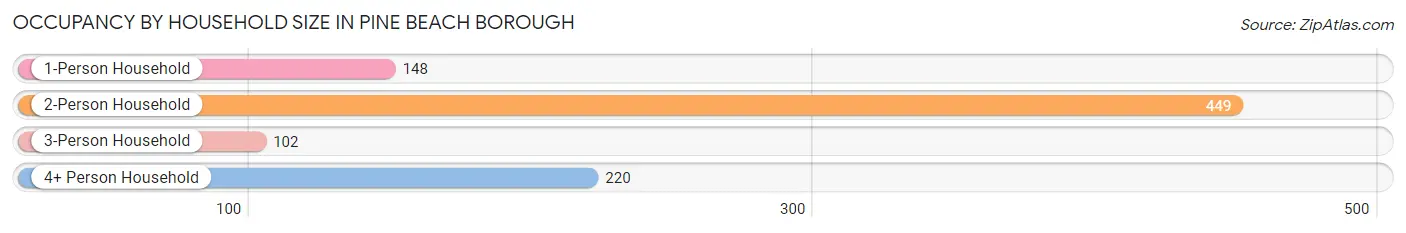
| Household Size | # Housing Units | % Housing Units |
| 1-Person Household | 148 | 16.1% |
| 2-Person Household | 449 | 48.9% |
| 3-Person Household | 102 | 11.1% |
| 4+ Person Household | 220 | 23.9% |
| Total Housing Units | 919 | 100.0% |
Occupancy by Ownership by Household Size in Pine Beach borough
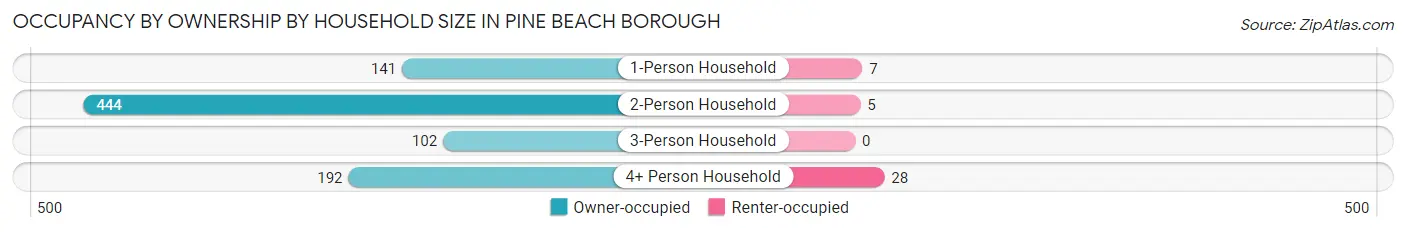
| Household Size | Owner-occupied | Renter-occupied |
| 1-Person Household | 141 (95.3%) | 7 (4.7%) |
| 2-Person Household | 444 (98.9%) | 5 (1.1%) |
| 3-Person Household | 102 (100.0%) | 0 (0.0%) |
| 4+ Person Household | 192 (87.3%) | 28 (12.7%) |
| Total Housing Units | 879 (95.7%) | 40 (4.3%) |
Occupancy by Educational Attainment in Pine Beach borough
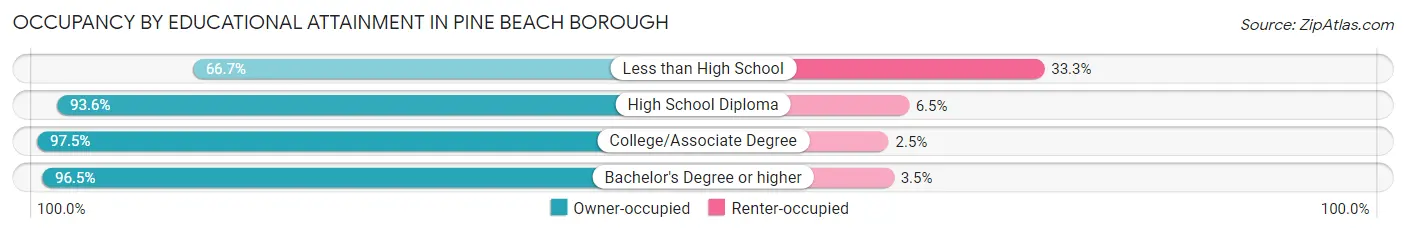
| Household Size | Owner-occupied | Renter-occupied |
| Less than High School | 16 (66.7%) | 8 (33.3%) |
| High School Diploma | 145 (93.5%) | 10 (6.5%) |
| College/Associate Degree | 356 (97.5%) | 9 (2.5%) |
| Bachelor's Degree or higher | 362 (96.5%) | 13 (3.5%) |
Occupancy by Age of Householder in Pine Beach borough
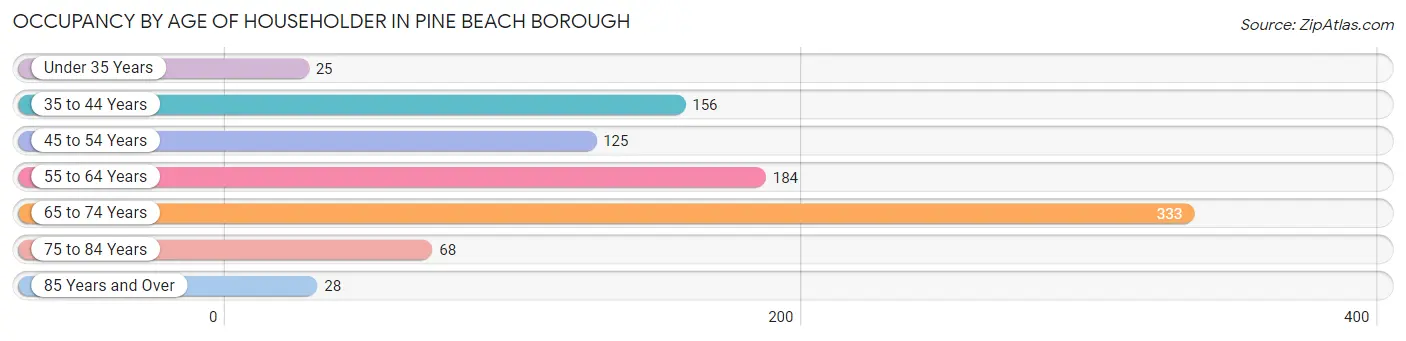
| Age Bracket | # Households | % Households |
| Under 35 Years | 25 | 2.7% |
| 35 to 44 Years | 156 | 17.0% |
| 45 to 54 Years | 125 | 13.6% |
| 55 to 64 Years | 184 | 20.0% |
| 65 to 74 Years | 333 | 36.2% |
| 75 to 84 Years | 68 | 7.4% |
| 85 Years and Over | 28 | 3.0% |
| Total | 919 | 100.0% |
Housing Finances in Pine Beach borough
Median Income by Occupancy in Pine Beach borough
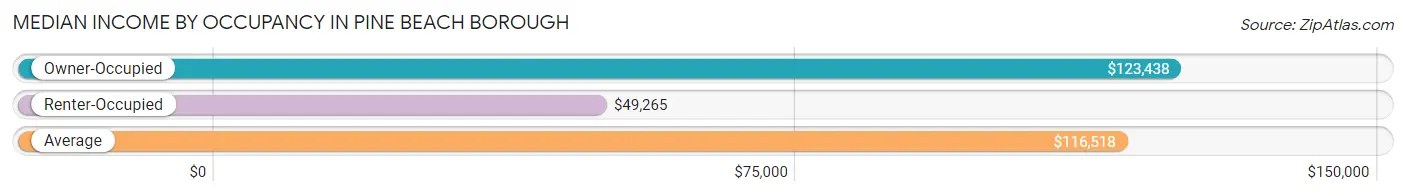
| Occupancy Type | # Households | Median Income |
| Owner-Occupied | 879 (95.7%) | $123,438 |
| Renter-Occupied | 40 (4.3%) | $49,265 |
| Average | 919 (100.0%) | $116,518 |
Occupancy by Householder Income Bracket in Pine Beach borough
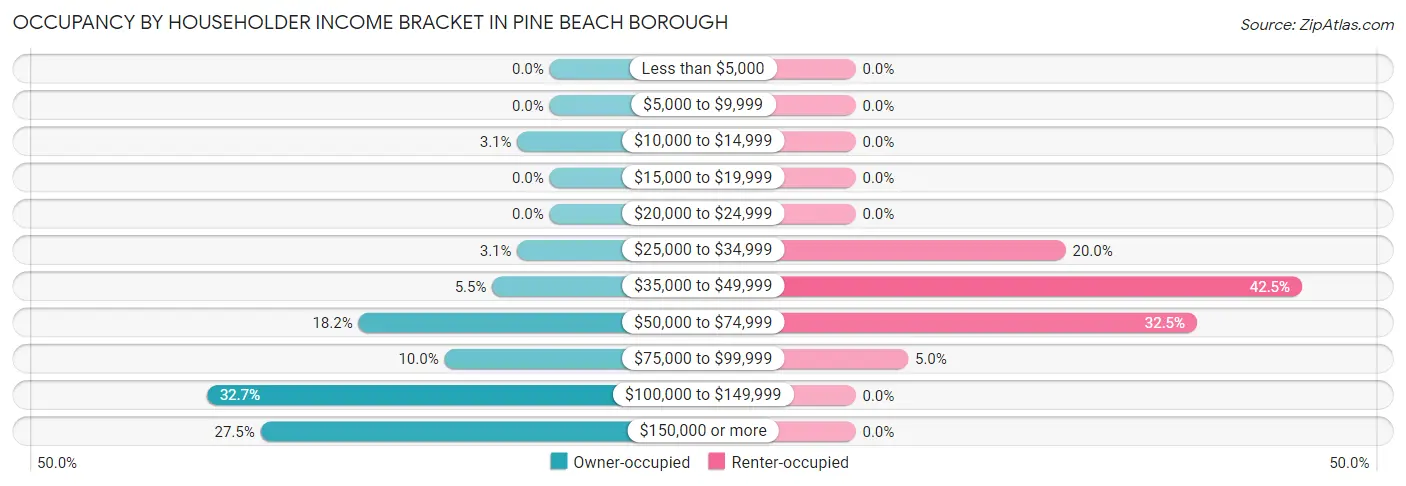
| Income Bracket | Owner-occupied | Renter-occupied |
| Less than $5,000 | 0 (0.0%) | 0 (0.0%) |
| $5,000 to $9,999 | 0 (0.0%) | 0 (0.0%) |
| $10,000 to $14,999 | 27 (3.1%) | 0 (0.0%) |
| $15,000 to $19,999 | 0 (0.0%) | 0 (0.0%) |
| $20,000 to $24,999 | 0 (0.0%) | 0 (0.0%) |
| $25,000 to $34,999 | 27 (3.1%) | 8 (20.0%) |
| $35,000 to $49,999 | 48 (5.5%) | 17 (42.5%) |
| $50,000 to $74,999 | 160 (18.2%) | 13 (32.5%) |
| $75,000 to $99,999 | 88 (10.0%) | 2 (5.0%) |
| $100,000 to $149,999 | 287 (32.7%) | 0 (0.0%) |
| $150,000 or more | 242 (27.5%) | 0 (0.0%) |
| Total | 879 (100.0%) | 40 (100.0%) |
Monthly Housing Cost Tiers in Pine Beach borough
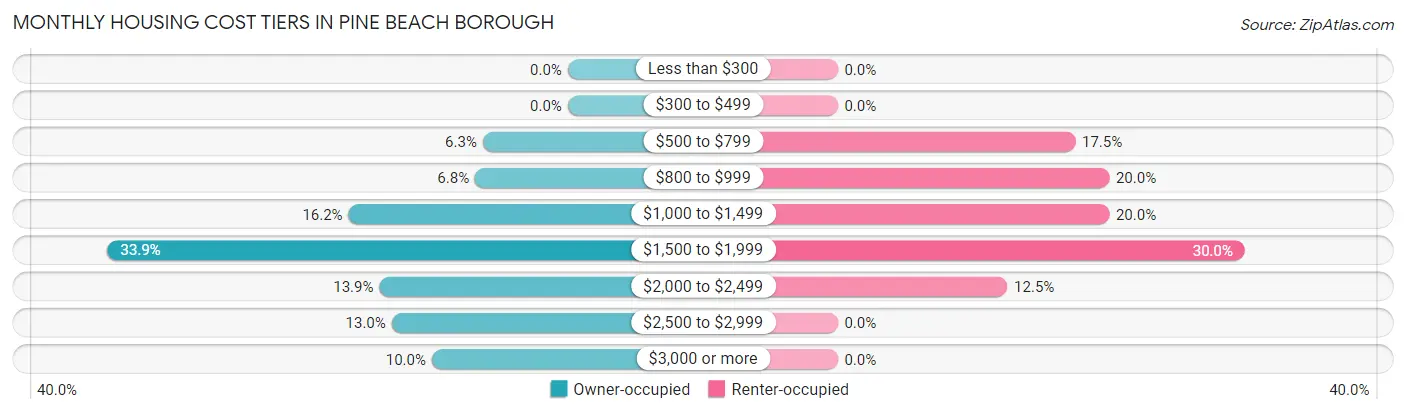
| Monthly Cost | Owner-occupied | Renter-occupied |
| Less than $300 | 0 (0.0%) | 0 (0.0%) |
| $300 to $499 | 0 (0.0%) | 0 (0.0%) |
| $500 to $799 | 55 (6.3%) | 7 (17.5%) |
| $800 to $999 | 60 (6.8%) | 8 (20.0%) |
| $1,000 to $1,499 | 142 (16.2%) | 8 (20.0%) |
| $1,500 to $1,999 | 298 (33.9%) | 12 (30.0%) |
| $2,000 to $2,499 | 122 (13.9%) | 5 (12.5%) |
| $2,500 to $2,999 | 114 (13.0%) | 0 (0.0%) |
| $3,000 or more | 88 (10.0%) | 0 (0.0%) |
| Total | 879 (100.0%) | 40 (100.0%) |
Physical Housing Characteristics in Pine Beach borough
Housing Structures in Pine Beach borough
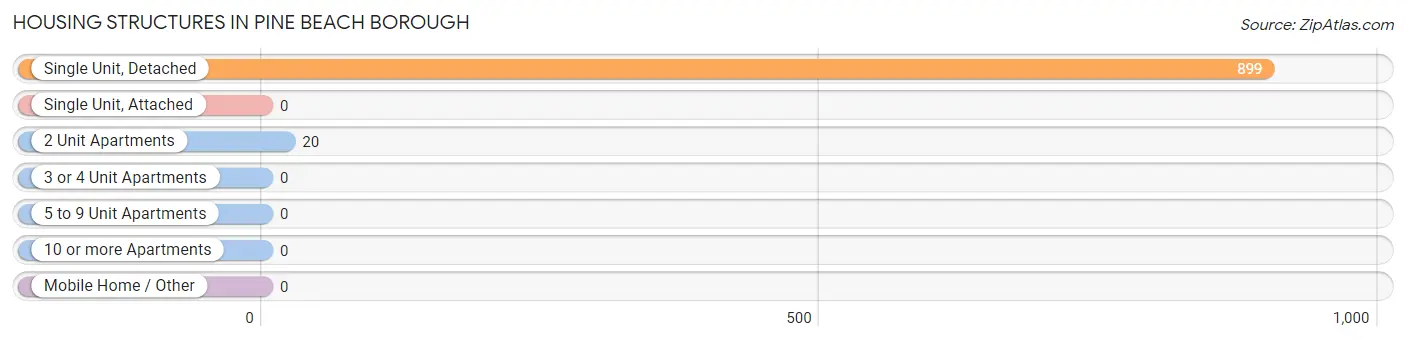
| Structure Type | # Housing Units | % Housing Units |
| Single Unit, Detached | 899 | 97.8% |
| Single Unit, Attached | 0 | 0.0% |
| 2 Unit Apartments | 20 | 2.2% |
| 3 or 4 Unit Apartments | 0 | 0.0% |
| 5 to 9 Unit Apartments | 0 | 0.0% |
| 10 or more Apartments | 0 | 0.0% |
| Mobile Home / Other | 0 | 0.0% |
| Total | 919 | 100.0% |
Housing Structures by Occupancy in Pine Beach borough
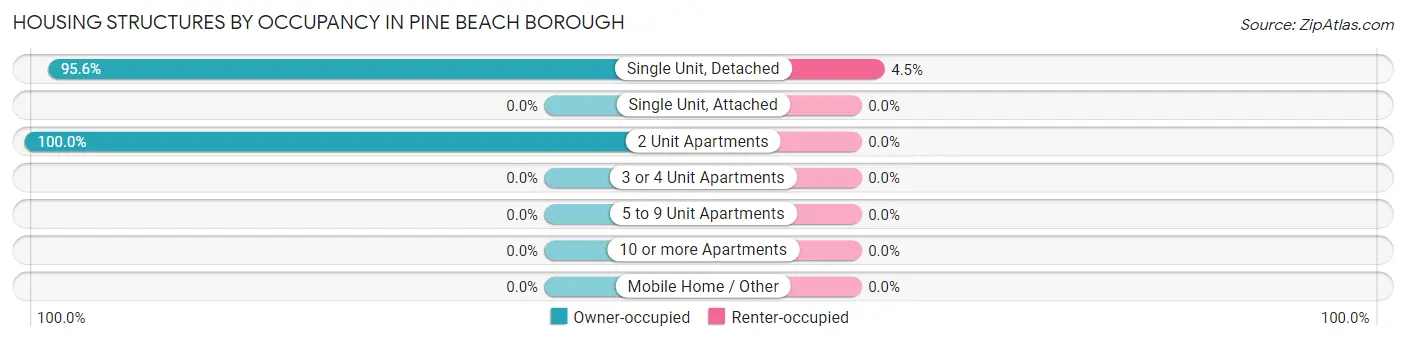
| Structure Type | Owner-occupied | Renter-occupied |
| Single Unit, Detached | 859 (95.6%) | 40 (4.4%) |
| Single Unit, Attached | 0 (0.0%) | 0 (0.0%) |
| 2 Unit Apartments | 20 (100.0%) | 0 (0.0%) |
| 3 or 4 Unit Apartments | 0 (0.0%) | 0 (0.0%) |
| 5 to 9 Unit Apartments | 0 (0.0%) | 0 (0.0%) |
| 10 or more Apartments | 0 (0.0%) | 0 (0.0%) |
| Mobile Home / Other | 0 (0.0%) | 0 (0.0%) |
| Total | 879 (95.7%) | 40 (4.3%) |
Housing Structures by Number of Rooms in Pine Beach borough
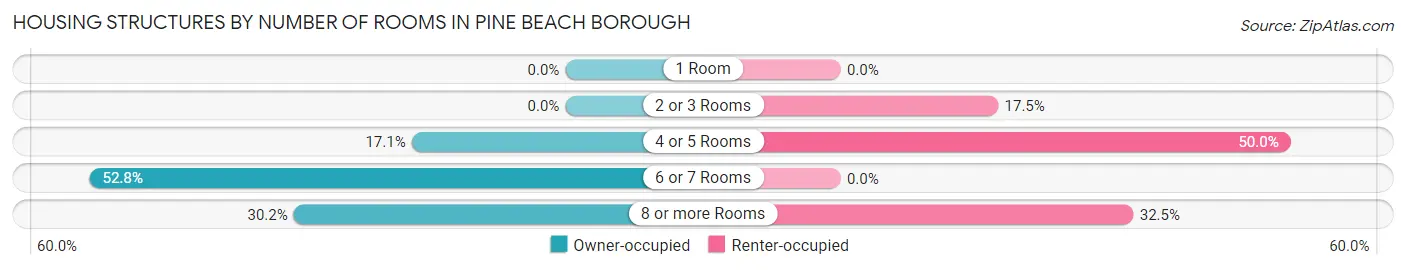
| Number of Rooms | Owner-occupied | Renter-occupied |
| 1 Room | 0 (0.0%) | 0 (0.0%) |
| 2 or 3 Rooms | 0 (0.0%) | 7 (17.5%) |
| 4 or 5 Rooms | 150 (17.1%) | 20 (50.0%) |
| 6 or 7 Rooms | 464 (52.8%) | 0 (0.0%) |
| 8 or more Rooms | 265 (30.1%) | 13 (32.5%) |
| Total | 879 (100.0%) | 40 (100.0%) |
Housing Structure by Heating Type in Pine Beach borough
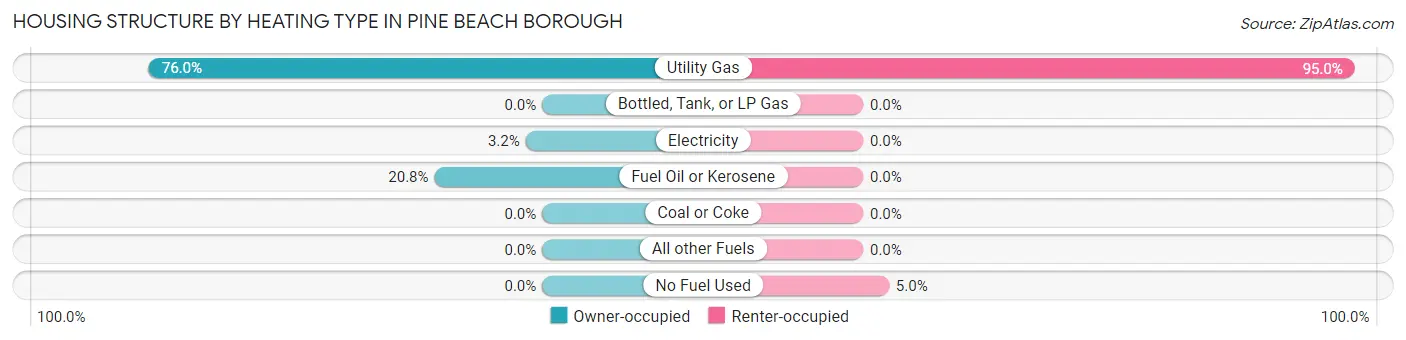
| Heating Type | Owner-occupied | Renter-occupied |
| Utility Gas | 668 (76.0%) | 38 (95.0%) |
| Bottled, Tank, or LP Gas | 0 (0.0%) | 0 (0.0%) |
| Electricity | 28 (3.2%) | 0 (0.0%) |
| Fuel Oil or Kerosene | 183 (20.8%) | 0 (0.0%) |
| Coal or Coke | 0 (0.0%) | 0 (0.0%) |
| All other Fuels | 0 (0.0%) | 0 (0.0%) |
| No Fuel Used | 0 (0.0%) | 2 (5.0%) |
| Total | 879 (100.0%) | 40 (100.0%) |
Household Vehicle Usage in Pine Beach borough
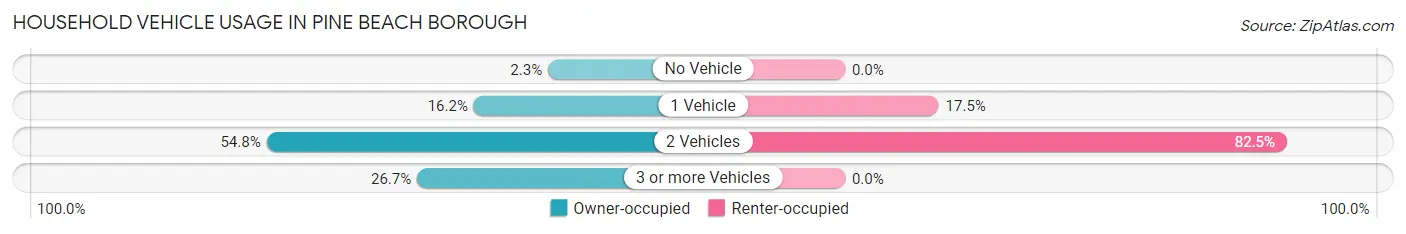
| Vehicles per Household | Owner-occupied | Renter-occupied |
| No Vehicle | 20 (2.3%) | 0 (0.0%) |
| 1 Vehicle | 142 (16.2%) | 7 (17.5%) |
| 2 Vehicles | 482 (54.8%) | 33 (82.5%) |
| 3 or more Vehicles | 235 (26.7%) | 0 (0.0%) |
| Total | 879 (100.0%) | 40 (100.0%) |
Real Estate & Mortgages in Pine Beach borough
Real Estate and Mortgage Overview in Pine Beach borough
| Characteristic | Without Mortgage | With Mortgage |
| Housing Units | 247 | 632 |
| Median Property Value | $367,800 | $369,500 |
| Median Household Income | $66,917 | $182 |
| Monthly Housing Costs | $1,107 | $88 |
| Real Estate Taxes | $7,816 | $5 |
Property Value by Mortgage Status in Pine Beach borough
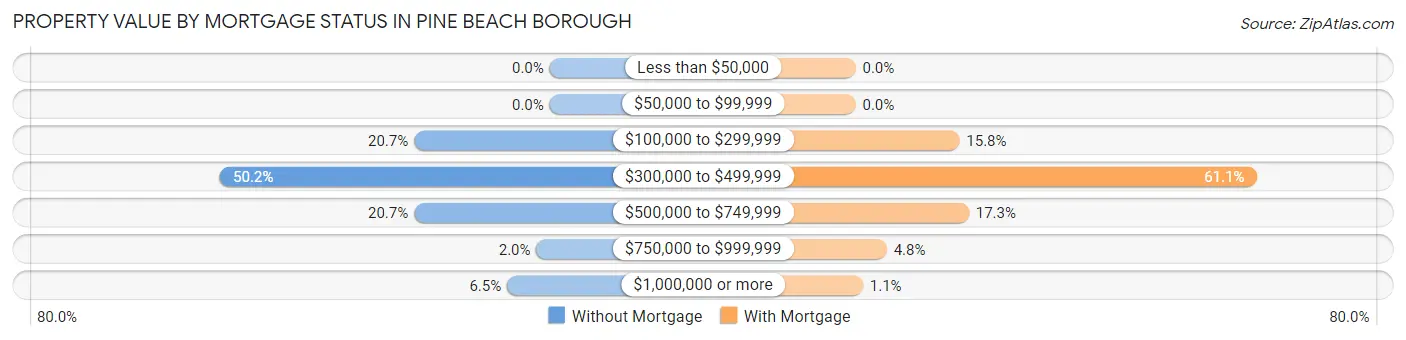
| Property Value | Without Mortgage | With Mortgage |
| Less than $50,000 | 0 (0.0%) | 0 (0.0%) |
| $50,000 to $99,999 | 0 (0.0%) | 0 (0.0%) |
| $100,000 to $299,999 | 51 (20.6%) | 100 (15.8%) |
| $300,000 to $499,999 | 124 (50.2%) | 386 (61.1%) |
| $500,000 to $749,999 | 51 (20.6%) | 109 (17.2%) |
| $750,000 to $999,999 | 5 (2.0%) | 30 (4.8%) |
| $1,000,000 or more | 16 (6.5%) | 7 (1.1%) |
| Total | 247 (100.0%) | 632 (100.0%) |
Household Income by Mortgage Status in Pine Beach borough
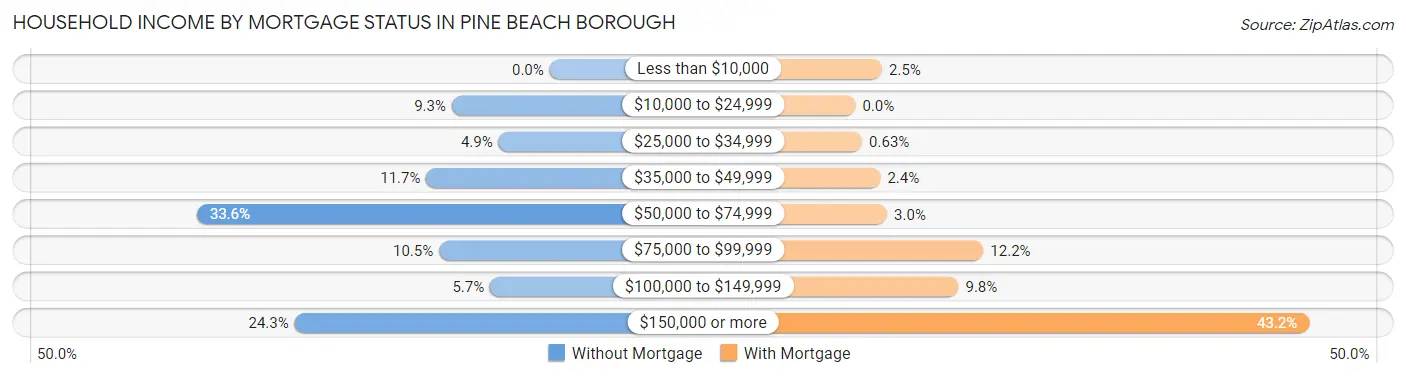
| Household Income | Without Mortgage | With Mortgage |
| Less than $10,000 | 0 (0.0%) | 16 (2.5%) |
| $10,000 to $24,999 | 23 (9.3%) | 0 (0.0%) |
| $25,000 to $34,999 | 12 (4.9%) | 4 (0.6%) |
| $35,000 to $49,999 | 29 (11.7%) | 15 (2.4%) |
| $50,000 to $74,999 | 83 (33.6%) | 19 (3.0%) |
| $75,000 to $99,999 | 26 (10.5%) | 77 (12.2%) |
| $100,000 to $149,999 | 14 (5.7%) | 62 (9.8%) |
| $150,000 or more | 60 (24.3%) | 273 (43.2%) |
| Total | 247 (100.0%) | 632 (100.0%) |
Property Value to Household Income Ratio in Pine Beach borough
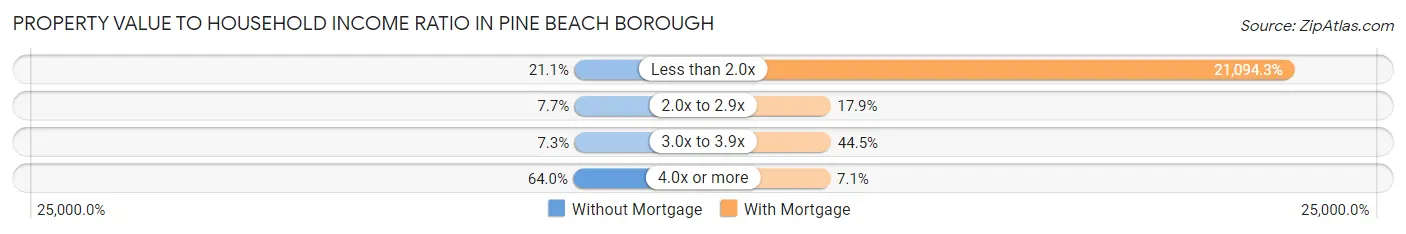
| Value-to-Income Ratio | Without Mortgage | With Mortgage |
| Less than 2.0x | 52 (21.0%) | 133,316 (21,094.3%) |
| 2.0x to 2.9x | 19 (7.7%) | 113 (17.9%) |
| 3.0x to 3.9x | 18 (7.3%) | 281 (44.5%) |
| 4.0x or more | 158 (64.0%) | 45 (7.1%) |
| Total | 247 (100.0%) | 632 (100.0%) |
Real Estate Taxes by Mortgage Status in Pine Beach borough
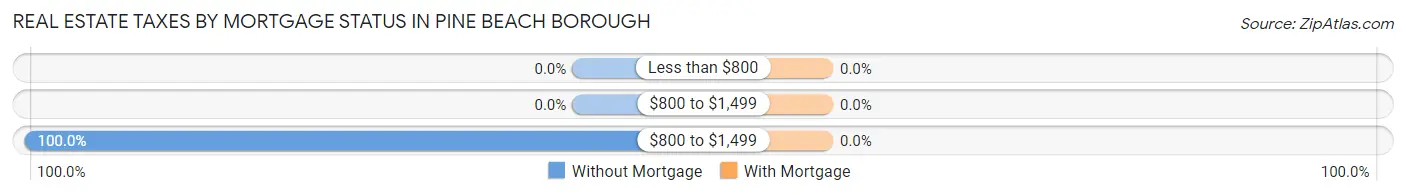
| Property Taxes | Without Mortgage | With Mortgage |
| Less than $800 | 0 (0.0%) | 0 (0.0%) |
| $800 to $1,499 | 0 (0.0%) | 0 (0.0%) |
| $800 to $1,499 | 247 (100.0%) | 0 (0.0%) |
| Total | 247 (100.0%) | 632 (100.0%) |
Health & Disability in Pine Beach borough
Health Insurance Coverage by Age in Pine Beach borough
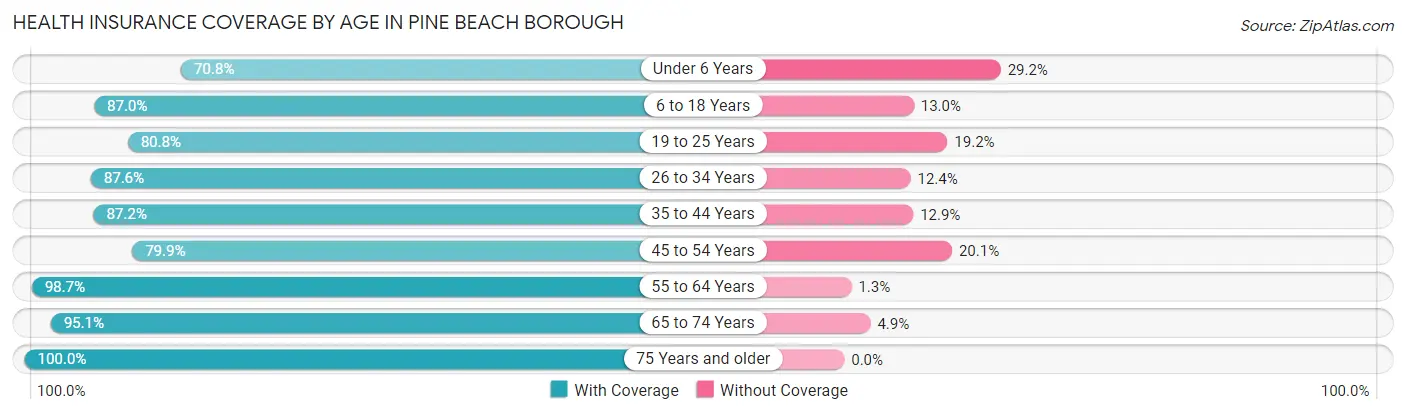
| Age Bracket | With Coverage | Without Coverage |
| Under 6 Years | 85 (70.8%) | 35 (29.2%) |
| 6 to 18 Years | 282 (87.0%) | 42 (13.0%) |
| 19 to 25 Years | 147 (80.8%) | 35 (19.2%) |
| 26 to 34 Years | 78 (87.6%) | 11 (12.4%) |
| 35 to 44 Years | 251 (87.2%) | 37 (12.9%) |
| 45 to 54 Years | 207 (79.9%) | 52 (20.1%) |
| 55 to 64 Years | 516 (98.7%) | 7 (1.3%) |
| 65 to 74 Years | 448 (95.1%) | 23 (4.9%) |
| 75 Years and older | 146 (100.0%) | 0 (0.0%) |
| Total | 2,160 (89.9%) | 242 (10.1%) |
Health Insurance Coverage by Citizenship Status in Pine Beach borough
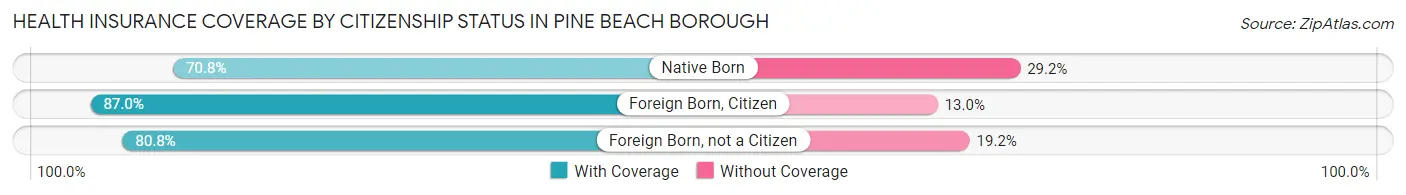
| Citizenship Status | With Coverage | Without Coverage |
| Native Born | 85 (70.8%) | 35 (29.2%) |
| Foreign Born, Citizen | 282 (87.0%) | 42 (13.0%) |
| Foreign Born, not a Citizen | 147 (80.8%) | 35 (19.2%) |
Health Insurance Coverage by Household Income in Pine Beach borough
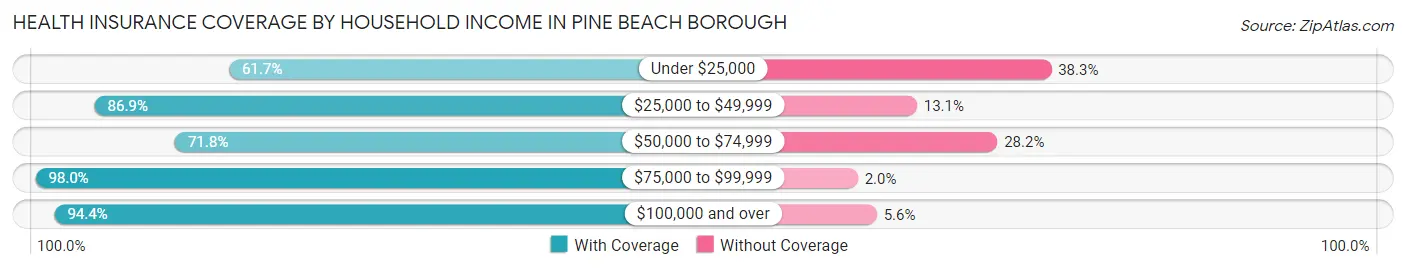
| Household Income | With Coverage | Without Coverage |
| Under $25,000 | 29 (61.7%) | 18 (38.3%) |
| $25,000 to $49,999 | 192 (86.9%) | 29 (13.1%) |
| $50,000 to $74,999 | 265 (71.8%) | 104 (28.2%) |
| $75,000 to $99,999 | 192 (98.0%) | 4 (2.0%) |
| $100,000 and over | 1,467 (94.4%) | 87 (5.6%) |
Public vs Private Health Insurance Coverage by Age in Pine Beach borough
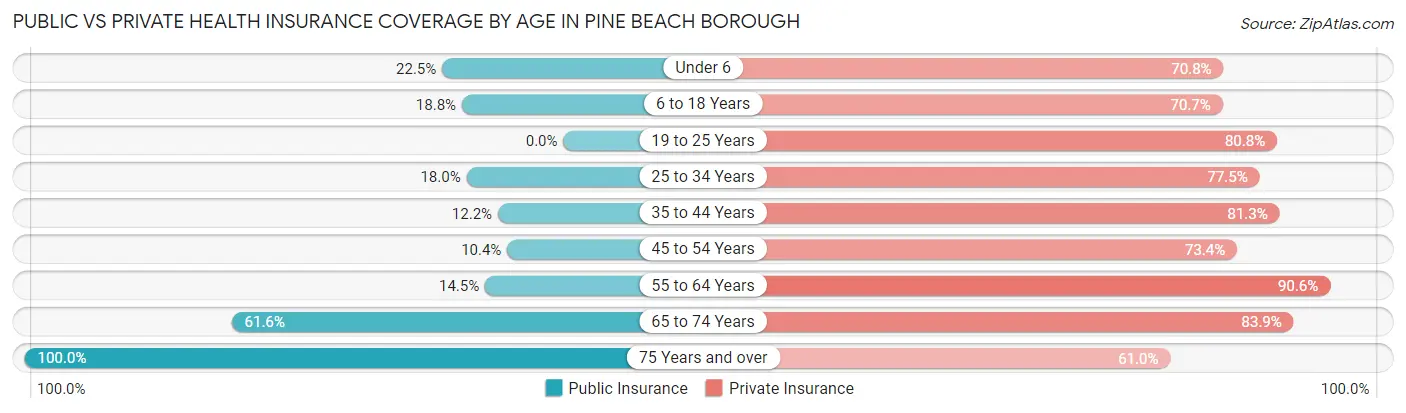
| Age Bracket | Public Insurance | Private Insurance |
| Under 6 | 27 (22.5%) | 85 (70.8%) |
| 6 to 18 Years | 61 (18.8%) | 229 (70.7%) |
| 19 to 25 Years | 0 (0.0%) | 147 (80.8%) |
| 25 to 34 Years | 16 (18.0%) | 69 (77.5%) |
| 35 to 44 Years | 35 (12.1%) | 234 (81.2%) |
| 45 to 54 Years | 27 (10.4%) | 190 (73.4%) |
| 55 to 64 Years | 76 (14.5%) | 474 (90.6%) |
| 65 to 74 Years | 290 (61.6%) | 395 (83.9%) |
| 75 Years and over | 146 (100.0%) | 89 (61.0%) |
| Total | 678 (28.2%) | 1,912 (79.6%) |
Disability Status by Sex by Age in Pine Beach borough
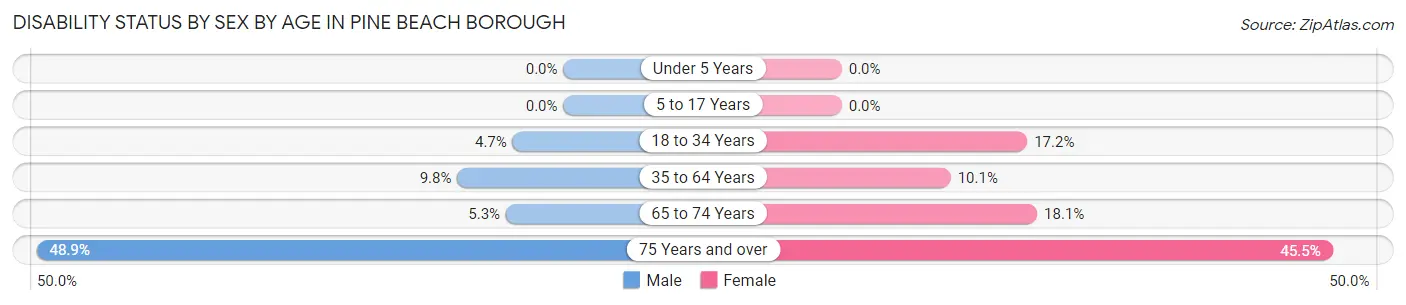
| Age Bracket | Male | Female |
| Under 5 Years | 0 (0.0%) | 0 (0.0%) |
| 5 to 17 Years | 0 (0.0%) | 0 (0.0%) |
| 18 to 34 Years | 8 (4.7%) | 21 (17.2%) |
| 35 to 64 Years | 43 (9.8%) | 64 (10.1%) |
| 65 to 74 Years | 16 (5.3%) | 31 (18.1%) |
| 75 Years and over | 22 (48.9%) | 46 (45.5%) |
Disability Class by Sex by Age in Pine Beach borough
Disability Class: Hearing Difficulty
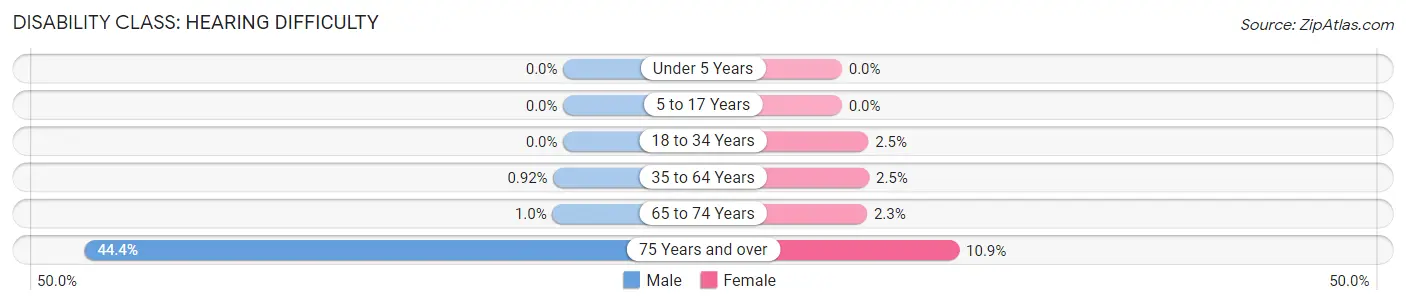
| Age Bracket | Male | Female |
| Under 5 Years | 0 (0.0%) | 0 (0.0%) |
| 5 to 17 Years | 0 (0.0%) | 0 (0.0%) |
| 18 to 34 Years | 0 (0.0%) | 3 (2.5%) |
| 35 to 64 Years | 4 (0.9%) | 16 (2.5%) |
| 65 to 74 Years | 3 (1.0%) | 4 (2.3%) |
| 75 Years and over | 20 (44.4%) | 11 (10.9%) |
Disability Class: Vision Difficulty
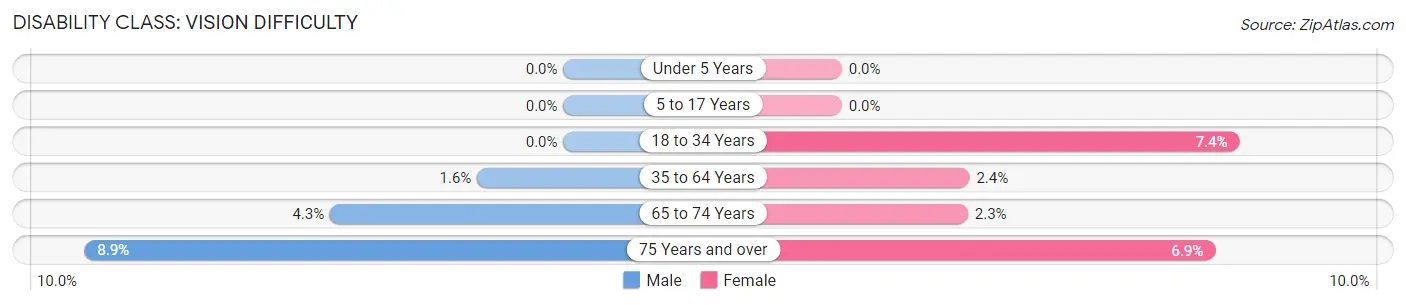
| Age Bracket | Male | Female |
| Under 5 Years | 0 (0.0%) | 0 (0.0%) |
| 5 to 17 Years | 0 (0.0%) | 0 (0.0%) |
| 18 to 34 Years | 0 (0.0%) | 9 (7.4%) |
| 35 to 64 Years | 7 (1.6%) | 15 (2.4%) |
| 65 to 74 Years | 13 (4.3%) | 4 (2.3%) |
| 75 Years and over | 4 (8.9%) | 7 (6.9%) |
Disability Class: Cognitive Difficulty
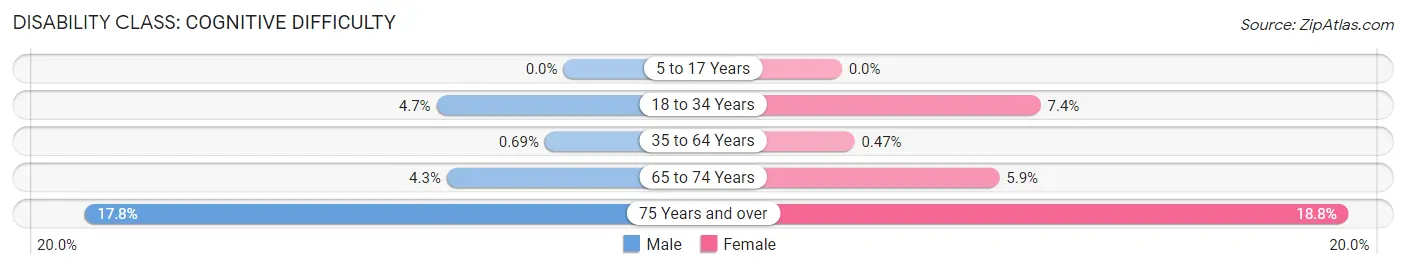
| Age Bracket | Male | Female |
| 5 to 17 Years | 0 (0.0%) | 0 (0.0%) |
| 18 to 34 Years | 8 (4.7%) | 9 (7.4%) |
| 35 to 64 Years | 3 (0.7%) | 3 (0.5%) |
| 65 to 74 Years | 13 (4.3%) | 10 (5.9%) |
| 75 Years and over | 8 (17.8%) | 19 (18.8%) |
Disability Class: Ambulatory Difficulty
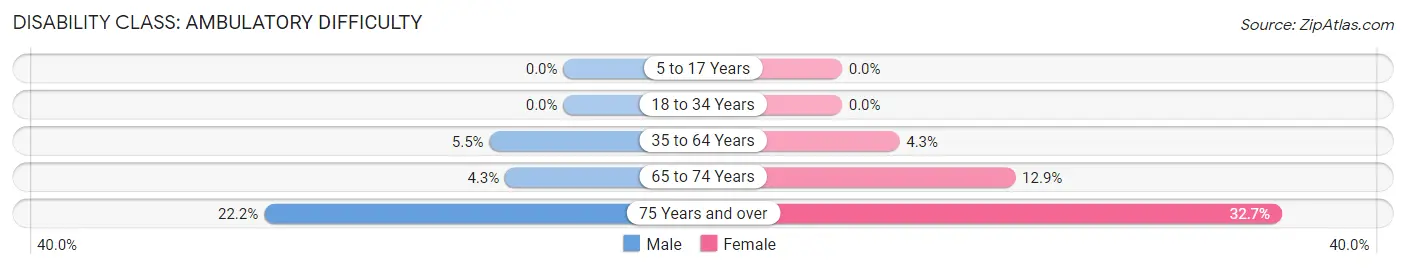
| Age Bracket | Male | Female |
| 5 to 17 Years | 0 (0.0%) | 0 (0.0%) |
| 18 to 34 Years | 0 (0.0%) | 0 (0.0%) |
| 35 to 64 Years | 24 (5.5%) | 27 (4.3%) |
| 65 to 74 Years | 13 (4.3%) | 22 (12.9%) |
| 75 Years and over | 10 (22.2%) | 33 (32.7%) |
Disability Class: Self-Care Difficulty
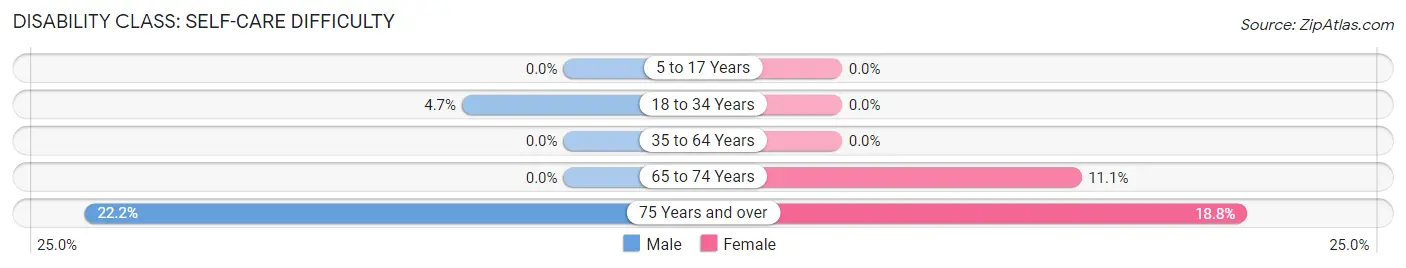
| Age Bracket | Male | Female |
| 5 to 17 Years | 0 (0.0%) | 0 (0.0%) |
| 18 to 34 Years | 8 (4.7%) | 0 (0.0%) |
| 35 to 64 Years | 0 (0.0%) | 0 (0.0%) |
| 65 to 74 Years | 0 (0.0%) | 19 (11.1%) |
| 75 Years and over | 10 (22.2%) | 19 (18.8%) |
Technology Access in Pine Beach borough
Computing Device Access in Pine Beach borough
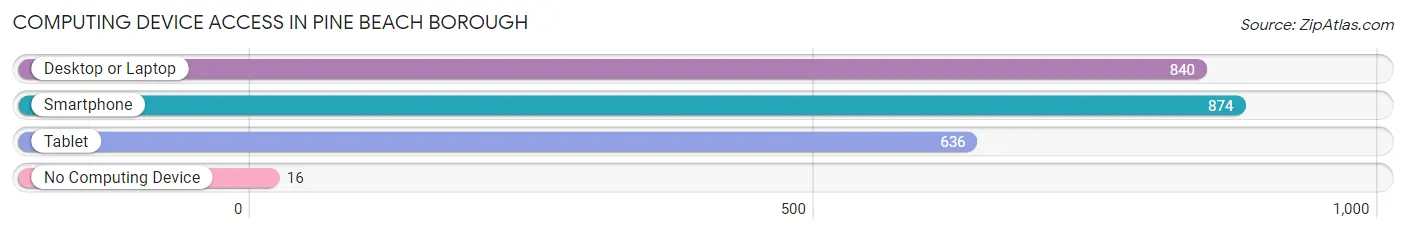
| Device Type | # Households | % Households |
| Desktop or Laptop | 840 | 91.4% |
| Smartphone | 874 | 95.1% |
| Tablet | 636 | 69.2% |
| No Computing Device | 16 | 1.7% |
| Total | 919 | 100.0% |
Internet Access in Pine Beach borough
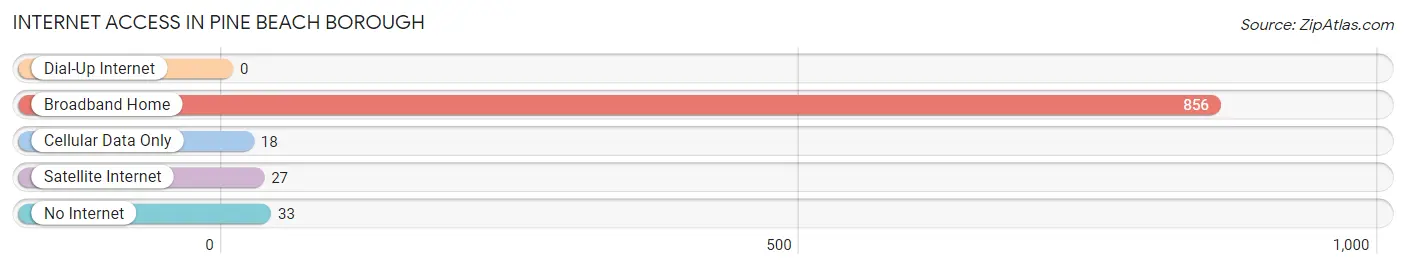
| Internet Type | # Households | % Households |
| Dial-Up Internet | 0 | 0.0% |
| Broadband Home | 856 | 93.1% |
| Cellular Data Only | 18 | 2.0% |
| Satellite Internet | 27 | 2.9% |
| No Internet | 33 | 3.6% |
| Total | 919 | 100.0% |
Pine Beach borough Summary
Pine Beach Borough is a small borough located in Ocean County, New Jersey. It is situated on the Barnegat Bay, and is part of the larger Toms River Township. The borough was incorporated in 1925, and is home to approximately 2,500 people.
Geography
Pine Beach Borough is located in Ocean County, New Jersey, and is situated on the Barnegat Bay. The borough is bordered by Toms River Township to the north, Berkeley Township to the east, and Island Heights to the south. The borough is approximately 2.5 square miles in size, and is home to several small neighborhoods, including Pine Beach, Ocean Beach, and Silverton. The borough is located approximately 50 miles south of New York City, and is accessible via the Garden State Parkway.
Climate
Pine Beach Borough has a humid subtropical climate, with hot, humid summers and mild winters. The average high temperature in the summer is around 85 degrees Fahrenheit, and the average low temperature in the winter is around 30 degrees Fahrenheit. The borough receives an average of 45 inches of precipitation per year, with most of it falling in the summer months.
Demographics
As of the 2010 census, Pine Beach Borough had a population of 2,521 people. The racial makeup of the borough was 94.3% White, 1.2% African American, 0.3% Native American, 1.2% Asian, 0.1% Pacific Islander, 1.2% from other races, and 1.9% from two or more races. Hispanic or Latino of any race were 4.2% of the population.
Economy
Pine Beach Borough is primarily a residential community, and the majority of its residents are employed in the nearby cities of Toms River and Ocean County. The borough is home to several small businesses, including restaurants, retail stores, and professional services. The borough also has a marina, which provides access to the Barnegat Bay.
History
Pine Beach Borough was originally inhabited by the Lenape Native Americans. The area was first settled by Europeans in the late 17th century, and was part of Shrewsbury Township until it was incorporated as a borough in 1925. The borough was named for the abundance of pine trees in the area.
In the early 20th century, the borough was a popular summer destination for vacationers from New York City and Philadelphia. The borough was home to several large hotels, and was known for its beaches and fishing. In the 1950s, the borough began to transition from a summer resort to a residential community.
Today, Pine Beach Borough is a small residential community, and is home to approximately 2,500 people. The borough is known for its quiet neighborhoods, and is a popular destination for boaters and fishermen.
Common Questions
What is Per Capita Income in Pine Beach borough?
Per Capita income in Pine Beach borough is $56,096.
What is the Median Family Income in Pine Beach borough?
Median Family Income in Pine Beach borough is $133,036.
What is the Median Household income in Pine Beach borough?
Median Household Income in Pine Beach borough is $116,518.
What is Income or Wage Gap in Pine Beach borough?
Income or Wage Gap in Pine Beach borough is 23.4%.
Women in Pine Beach borough earn 76.6 cents for every dollar earned by a man.
What is Inequality or Gini Index in Pine Beach borough?
Inequality or Gini Index in Pine Beach borough is 0.40.
What is the Total Population of Pine Beach borough?
Total Population of Pine Beach borough is 2,402.
What is the Total Male Population of Pine Beach borough?
Total Male Population of Pine Beach borough is 1,188.
What is the Total Female Population of Pine Beach borough?
Total Female Population of Pine Beach borough is 1,214.
What is the Ratio of Males per 100 Females in Pine Beach borough?
There are 97.86 Males per 100 Females in Pine Beach borough.
What is the Ratio of Females per 100 Males in Pine Beach borough?
There are 102.19 Females per 100 Males in Pine Beach borough.
What is the Median Population Age in Pine Beach borough?
Median Population Age in Pine Beach borough is 52.5 Years.
What is the Average Family Size in Pine Beach borough
Average Family Size in Pine Beach borough is 2.9 People.
What is the Average Household Size in Pine Beach borough
Average Household Size in Pine Beach borough is 2.6 People.
How Large is the Labor Force in Pine Beach borough?
There are 1,316 People in the Labor Forcein in Pine Beach borough.
What is the Percentage of People in the Labor Force in Pine Beach borough?
64.3% of People are in the Labor Force in Pine Beach borough.
What is the Unemployment Rate in Pine Beach borough?
Unemployment Rate in Pine Beach borough is 3.2%.