Spring Lake Heights borough, NJ Map & Demographics
Spring Lake Heights borough Overview
$67,332
PER CAPITA INCOME
$154,625
AVG FAMILY INCOME
$104,143
AVG HOUSEHOLD INCOME
48.4%
WAGE / INCOME GAP [ % ]
51.6¢/ $1
WAGE / INCOME GAP [ $ ]
0.43
INEQUALITY / GINI INDEX
4,864
TOTAL POPULATION
2,205
MALE POPULATION
2,659
FEMALE POPULATION
82.93
MALES / 100 FEMALES
120.59
FEMALES / 100 MALES
45.2
MEDIAN AGE
3.0
AVG FAMILY SIZE
2.0
AVG HOUSEHOLD SIZE
2,808
LABOR FORCE [ PEOPLE ]
68.0%
PERCENT IN LABOR FORCE
6.3%
UNEMPLOYMENT RATE
Income in Spring Lake Heights borough
Income Overview in Spring Lake Heights borough
Per Capita Income in Spring Lake Heights borough is $67,332, while median incomes of families and households are $154,625 and $104,143 respectively.
| Characteristic | Number | Measure |
| Per Capita Income | 4,864 | $67,332 |
| Median Family Income | 1,127 | $154,625 |
| Mean Family Income | 1,127 | $199,083 |
| Median Household Income | 2,414 | $104,143 |
| Mean Household Income | 2,414 | $134,590 |
| Income Deficit | 1,127 | $0 |
| Wage / Income Gap (%) | 4,864 | 48.39% |
| Wage / Income Gap ($) | 4,864 | 51.61¢ per $1 |
| Gini / Inequality Index | 4,864 | 0.43 |
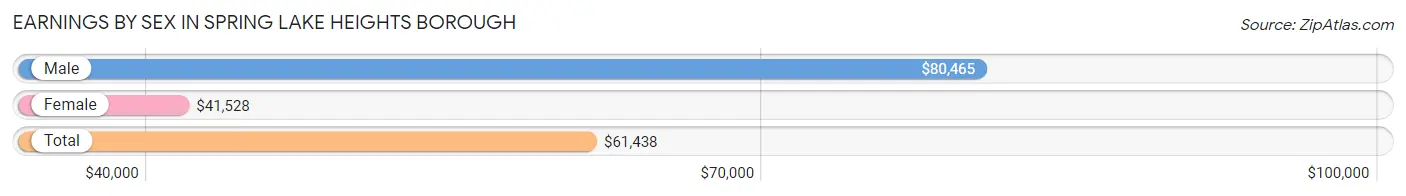
Earnings by Sex in Spring Lake Heights borough
Average Earnings in Spring Lake Heights borough are $61,438, $80,465 for men and $41,528 for women, a difference of 48.4%.
| Sex | Number | Average Earnings |
| Male | 1,396 (48.0%) | $80,465 |
| Female | 1,512 (52.0%) | $41,528 |
| Total | 2,908 (100.0%) | $61,438 |
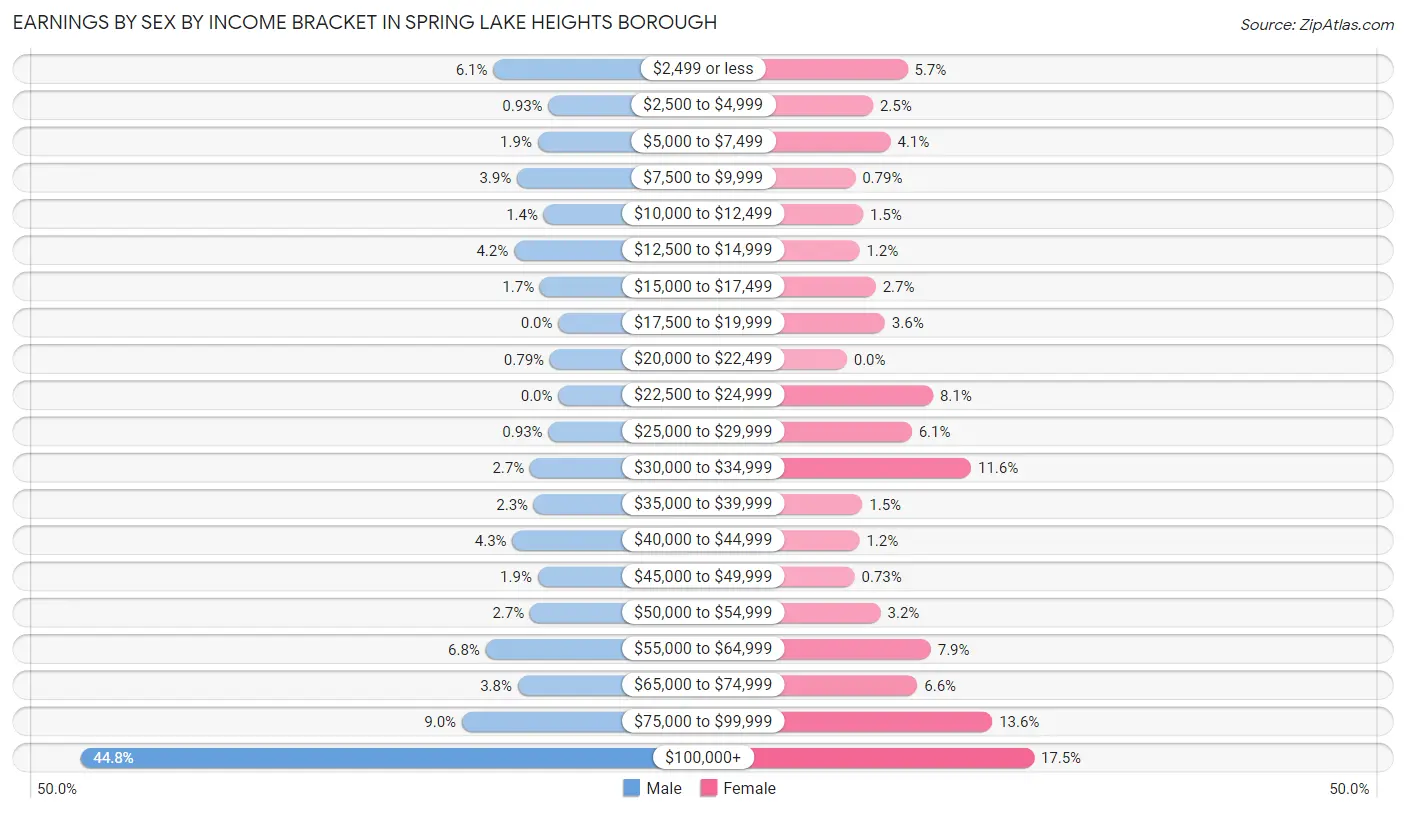
Earnings by Sex by Income Bracket in Spring Lake Heights borough
The most common earnings brackets in Spring Lake Heights borough are $100,000+ for men (625 | 44.8%) and $100,000+ for women (265 | 17.5%).
| Income | Male | Female |
| $2,499 or less | 85 (6.1%) | 86 (5.7%) |
| $2,500 to $4,999 | 13 (0.9%) | 37 (2.5%) |
| $5,000 to $7,499 | 27 (1.9%) | 62 (4.1%) |
| $7,500 to $9,999 | 54 (3.9%) | 12 (0.8%) |
| $10,000 to $12,499 | 19 (1.4%) | 23 (1.5%) |
| $12,500 to $14,999 | 58 (4.2%) | 18 (1.2%) |
| $15,000 to $17,499 | 24 (1.7%) | 41 (2.7%) |
| $17,500 to $19,999 | 0 (0.0%) | 54 (3.6%) |
| $20,000 to $22,499 | 11 (0.8%) | 0 (0.0%) |
| $22,500 to $24,999 | 0 (0.0%) | 122 (8.1%) |
| $25,000 to $29,999 | 13 (0.9%) | 92 (6.1%) |
| $30,000 to $34,999 | 37 (2.6%) | 176 (11.6%) |
| $35,000 to $39,999 | 32 (2.3%) | 22 (1.5%) |
| $40,000 to $44,999 | 60 (4.3%) | 18 (1.2%) |
| $45,000 to $49,999 | 27 (1.9%) | 11 (0.7%) |
| $50,000 to $54,999 | 37 (2.6%) | 48 (3.2%) |
| $55,000 to $64,999 | 95 (6.8%) | 119 (7.9%) |
| $65,000 to $74,999 | 53 (3.8%) | 100 (6.6%) |
| $75,000 to $99,999 | 126 (9.0%) | 206 (13.6%) |
| $100,000+ | 625 (44.8%) | 265 (17.5%) |
| Total | 1,396 (100.0%) | 1,512 (100.0%) |
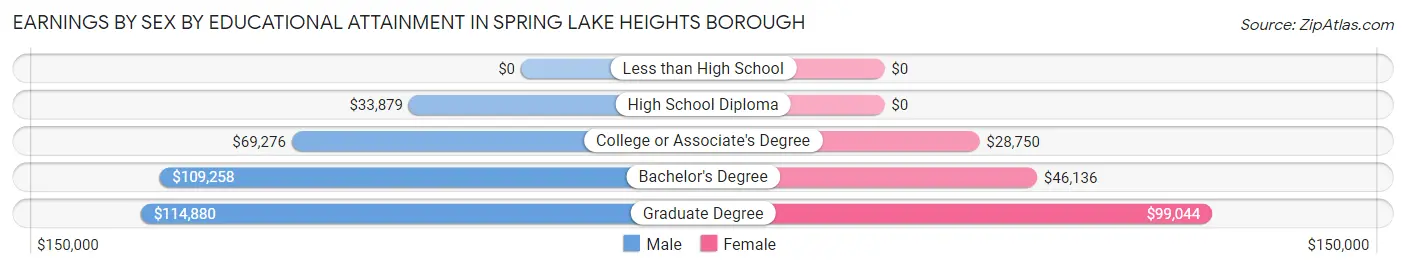
Earnings by Sex by Educational Attainment in Spring Lake Heights borough
Average earnings in Spring Lake Heights borough are $98,958 for men and $57,892 for women, a difference of 41.5%. Men with an educational attainment of graduate degree enjoy the highest average annual earnings of $114,880, while those with high school diploma education earn the least with $33,879. Women with an educational attainment of graduate degree earn the most with the average annual earnings of $99,044, while those with college or associate's degree education have the smallest earnings of $28,750.
| Educational Attainment | Male Income | Female Income |
| Less than High School | - | - |
| High School Diploma | $33,879 | $0 |
| College or Associate's Degree | $69,276 | $28,750 |
| Bachelor's Degree | $109,258 | $46,136 |
| Graduate Degree | $114,880 | $99,044 |
| Total | $98,958 | $57,892 |
Family Income in Spring Lake Heights borough
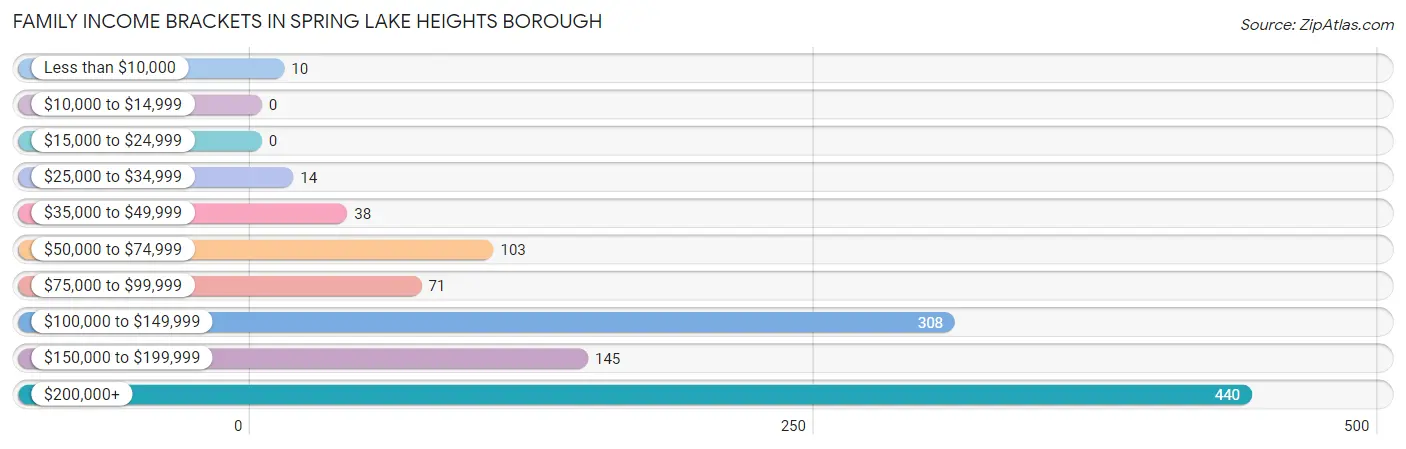
Family Income Brackets in Spring Lake Heights borough
According to the Spring Lake Heights borough family income data, there are 440 families falling into the $200,000+ income range, which is the most common income bracket and makes up 39.0% of all families.
| Income Bracket | # Families | % Families |
| Less than $10,000 | 10 | 0.9% |
| $10,000 to $14,999 | 0 | 0.0% |
| $15,000 to $24,999 | 0 | 0.0% |
| $25,000 to $34,999 | 14 | 1.2% |
| $35,000 to $49,999 | 38 | 3.4% |
| $50,000 to $74,999 | 103 | 9.1% |
| $75,000 to $99,999 | 71 | 6.3% |
| $100,000 to $149,999 | 308 | 27.3% |
| $150,000 to $199,999 | 145 | 12.9% |
| $200,000+ | 440 | 39.0% |
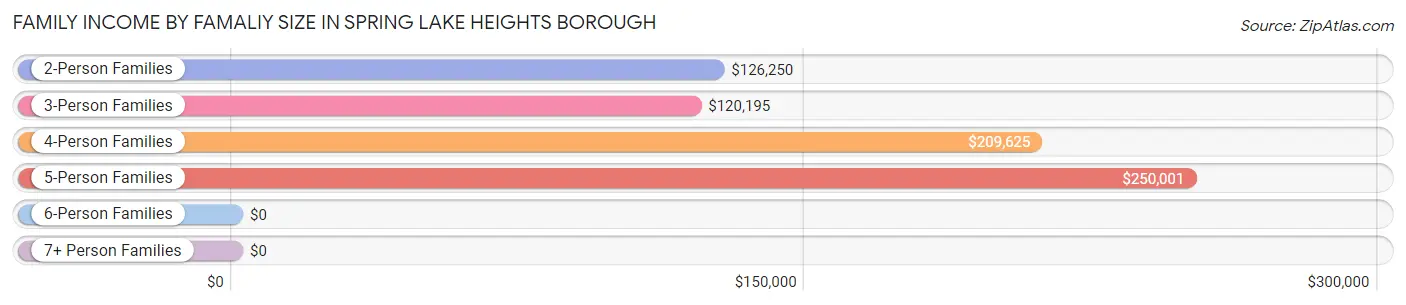
Family Income by Famaliy Size in Spring Lake Heights borough
5-person families (148 | 13.1%) account for the highest median family income in Spring Lake Heights borough with $250,001 per family, while 2-person families (531 | 47.1%) have the highest median income of $63,125 per family member.
| Income Bracket | # Families | Median Income |
| 2-Person Families | 531 (47.1%) | $126,250 |
| 3-Person Families | 289 (25.6%) | $120,195 |
| 4-Person Families | 145 (12.9%) | $209,625 |
| 5-Person Families | 148 (13.1%) | $250,001 |
| 6-Person Families | 14 (1.2%) | $0 |
| 7+ Person Families | 0 (0.0%) | $0 |
| Total | 1,127 (100.0%) | $154,625 |
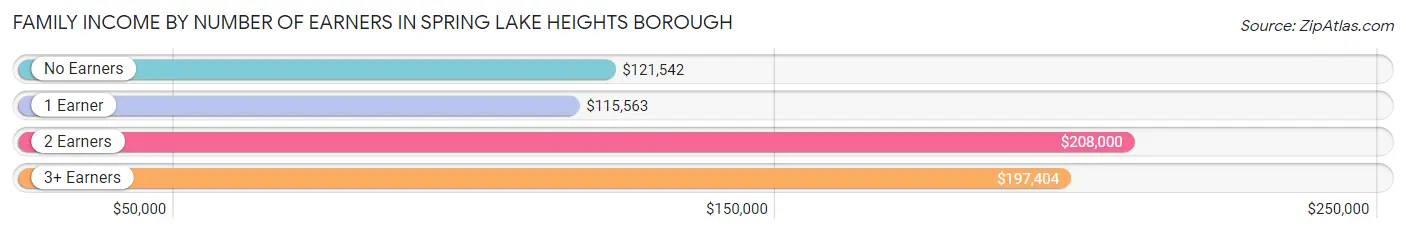
Family Income by Number of Earners in Spring Lake Heights borough
The median family income in Spring Lake Heights borough is $154,625, with families comprising 2 earners (420) having the highest median family income of $208,000, while families with 1 earner (297) have the lowest median family income of $115,563, accounting for 37.3% and 26.4% of families, respectively.
| Number of Earners | # Families | Median Income |
| No Earners | 197 (17.5%) | $121,542 |
| 1 Earner | 297 (26.4%) | $115,563 |
| 2 Earners | 420 (37.3%) | $208,000 |
| 3+ Earners | 213 (18.9%) | $197,404 |
| Total | 1,127 (100.0%) | $154,625 |
Household Income in Spring Lake Heights borough
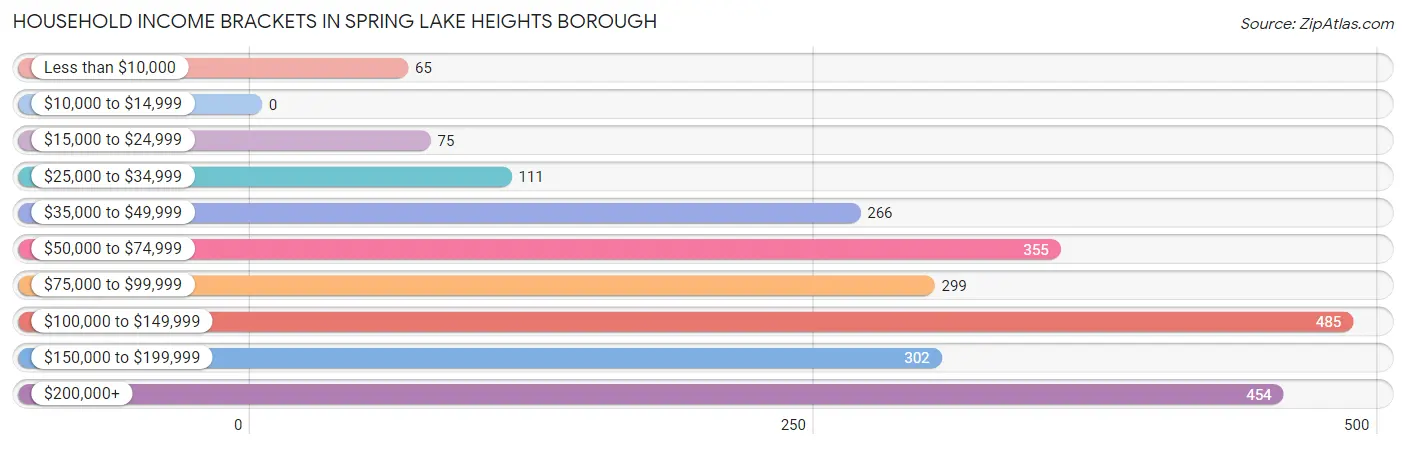
Household Income Brackets in Spring Lake Heights borough
With 485 households falling in the category, the $100,000 to $149,999 income range is the most frequent in Spring Lake Heights borough, accounting for 20.1% of all households.
| Income Bracket | # Households | % Households |
| Less than $10,000 | 65 | 2.7% |
| $10,000 to $14,999 | 0 | 0.0% |
| $15,000 to $24,999 | 75 | 3.1% |
| $25,000 to $34,999 | 111 | 4.6% |
| $35,000 to $49,999 | 266 | 11.0% |
| $50,000 to $74,999 | 355 | 14.7% |
| $75,000 to $99,999 | 299 | 12.4% |
| $100,000 to $149,999 | 485 | 20.1% |
| $150,000 to $199,999 | 302 | 12.5% |
| $200,000+ | 454 | 18.8% |
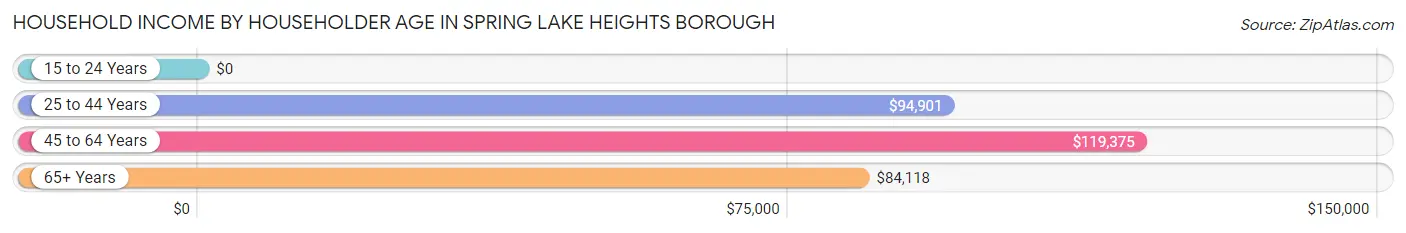
Household Income by Householder Age in Spring Lake Heights borough
The median household income in Spring Lake Heights borough is $104,143, with the highest median household income of $119,375 found in the 45 to 64 years age bracket for the primary householder. A total of 762 households (31.6%) fall into this category. Meanwhile, the 15 to 24 years age bracket for the primary householder has the lowest median household income of $0, with 29 households (1.2%) in this group.
| Income Bracket | # Households | Median Income |
| 15 to 24 Years | 29 (1.2%) | $0 |
| 25 to 44 Years | 755 (31.3%) | $94,901 |
| 45 to 64 Years | 762 (31.6%) | $119,375 |
| 65+ Years | 868 (36.0%) | $84,118 |
| Total | 2,414 (100.0%) | $104,143 |
Poverty in Spring Lake Heights borough
Income Below Poverty by Sex and Age in Spring Lake Heights borough
With 2.9% poverty level for males and 4.4% for females among the residents of Spring Lake Heights borough, 18 to 24 year old males and 15 year old females are the most vulnerable to poverty, with 42 males (29.0%) and 12 females (41.4%) in their respective age groups living below the poverty level.
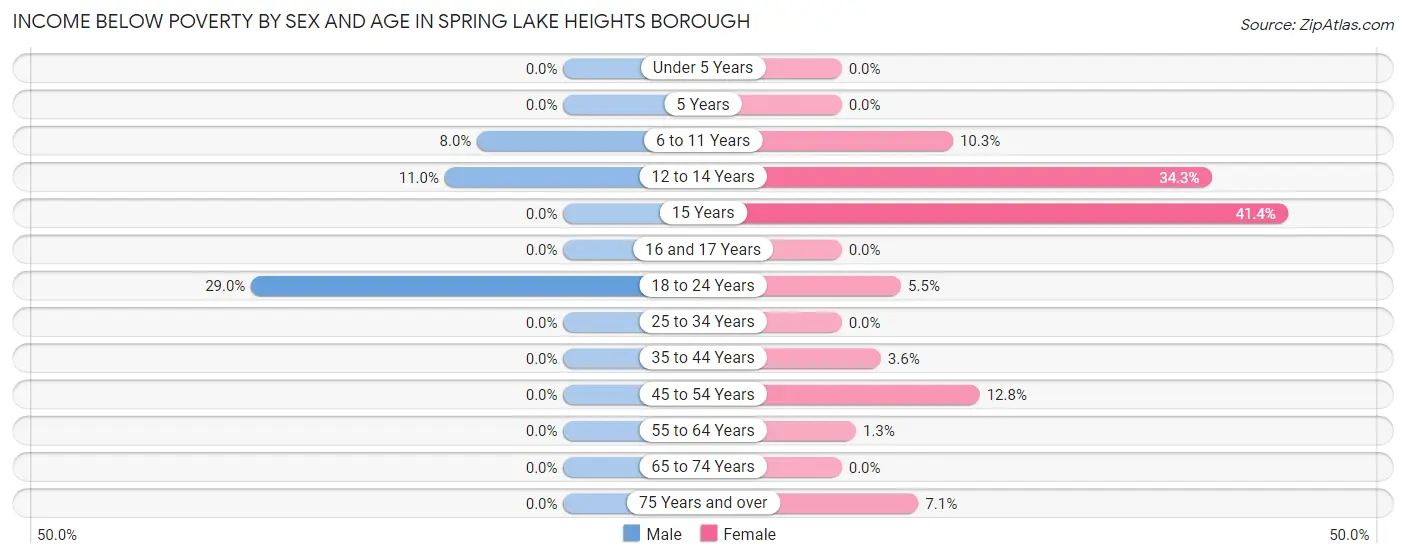
| Age Bracket | Male | Female |
| Under 5 Years | 0 (0.0%) | 0 (0.0%) |
| 5 Years | 0 (0.0%) | 0 (0.0%) |
| 6 to 11 Years | 10 (8.0%) | 13 (10.3%) |
| 12 to 14 Years | 11 (11.0%) | 12 (34.3%) |
| 15 Years | 0 (0.0%) | 12 (41.4%) |
| 16 and 17 Years | 0 (0.0%) | 0 (0.0%) |
| 18 to 24 Years | 42 (29.0%) | 13 (5.5%) |
| 25 to 34 Years | 0 (0.0%) | 0 (0.0%) |
| 35 to 44 Years | 0 (0.0%) | 13 (3.6%) |
| 45 to 54 Years | 0 (0.0%) | 21 (12.8%) |
| 55 to 64 Years | 0 (0.0%) | 7 (1.3%) |
| 65 to 74 Years | 0 (0.0%) | 0 (0.0%) |
| 75 Years and over | 0 (0.0%) | 27 (7.1%) |
| Total | 63 (2.9%) | 118 (4.4%) |
Income Above Poverty by Sex and Age in Spring Lake Heights borough
According to the poverty statistics in Spring Lake Heights borough, males aged under 5 years and females aged under 5 years are the age groups that are most secure financially, with 100.0% of males and 100.0% of females in these age groups living above the poverty line.
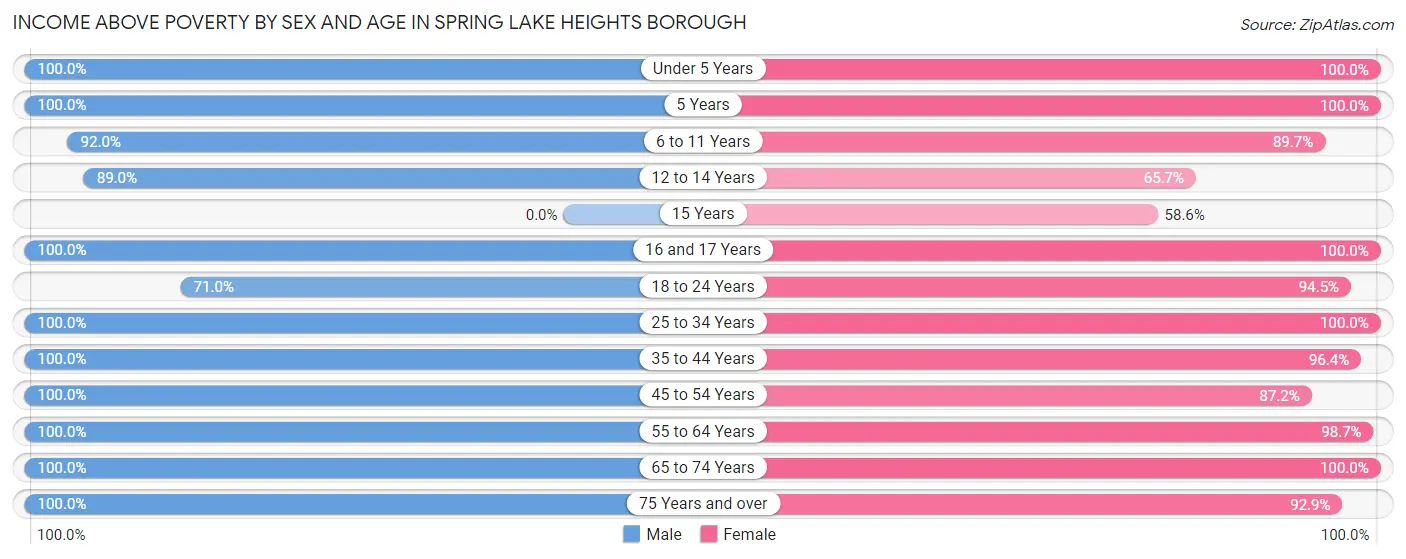
| Age Bracket | Male | Female |
| Under 5 Years | 69 (100.0%) | 189 (100.0%) |
| 5 Years | 14 (100.0%) | 48 (100.0%) |
| 6 to 11 Years | 115 (92.0%) | 113 (89.7%) |
| 12 to 14 Years | 89 (89.0%) | 23 (65.7%) |
| 15 Years | 0 (0.0%) | 17 (58.6%) |
| 16 and 17 Years | 19 (100.0%) | 8 (100.0%) |
| 18 to 24 Years | 103 (71.0%) | 223 (94.5%) |
| 25 to 34 Years | 201 (100.0%) | 354 (100.0%) |
| 35 to 44 Years | 373 (100.0%) | 345 (96.4%) |
| 45 to 54 Years | 230 (100.0%) | 143 (87.2%) |
| 55 to 64 Years | 357 (100.0%) | 522 (98.7%) |
| 65 to 74 Years | 399 (100.0%) | 203 (100.0%) |
| 75 Years and over | 173 (100.0%) | 353 (92.9%) |
| Total | 2,142 (97.1%) | 2,541 (95.6%) |
Income Below Poverty Among Married-Couple Families in Spring Lake Heights borough
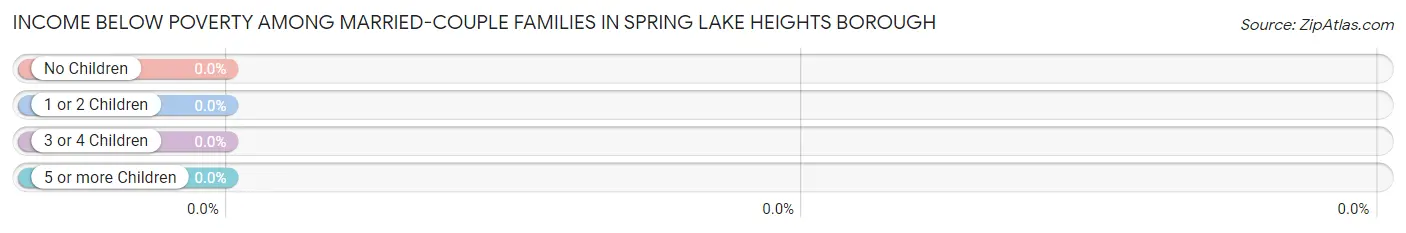
| Children | Above Poverty | Below Poverty |
| No Children | 713 (100.0%) | 0 (0.0%) |
| 1 or 2 Children | 141 (100.0%) | 0 (0.0%) |
| 3 or 4 Children | 112 (100.0%) | 0 (0.0%) |
| 5 or more Children | 0 (0.0%) | 0 (0.0%) |
| Total | 966 (100.0%) | 0 (0.0%) |
Income Below Poverty Among Single-Parent Households in Spring Lake Heights borough
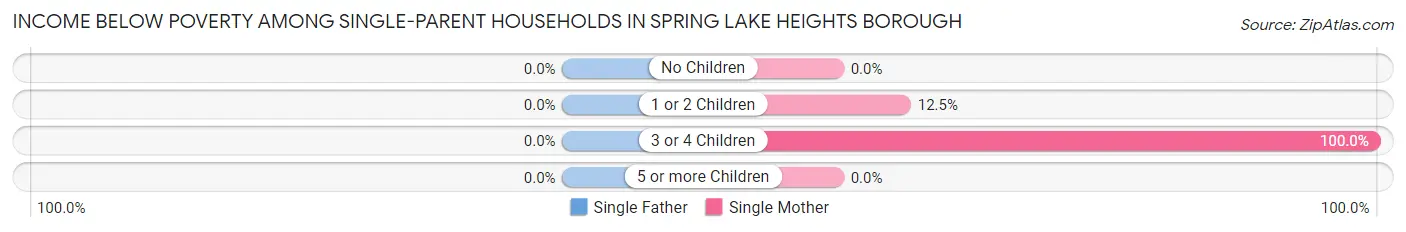
| Children | Single Father | Single Mother |
| No Children | 0 (0.0%) | 0 (0.0%) |
| 1 or 2 Children | 0 (0.0%) | 10 (12.5%) |
| 3 or 4 Children | 0 (0.0%) | 13 (100.0%) |
| 5 or more Children | 0 (0.0%) | 0 (0.0%) |
| Total | 0 (0.0%) | 23 (16.4%) |
Income Below Poverty Among Married-Couple vs Single-Parent Households in Spring Lake Heights borough
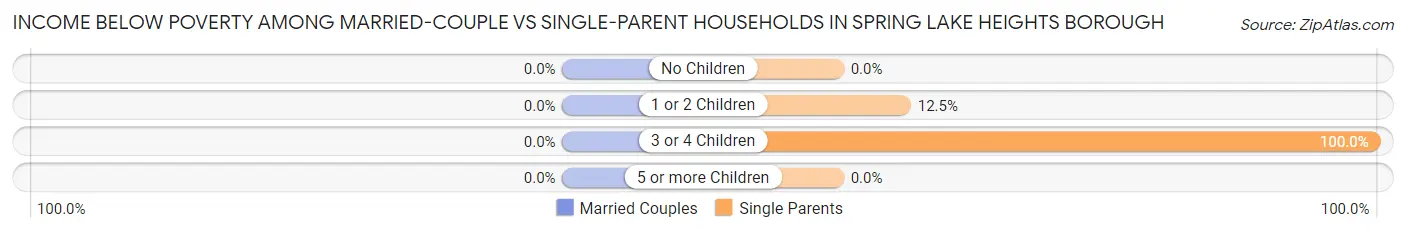
| Children | Married-Couple Families | Single-Parent Households |
| No Children | 0 (0.0%) | 0 (0.0%) |
| 1 or 2 Children | 0 (0.0%) | 10 (12.5%) |
| 3 or 4 Children | 0 (0.0%) | 13 (100.0%) |
| 5 or more Children | 0 (0.0%) | 0 (0.0%) |
| Total | 0 (0.0%) | 23 (14.3%) |
Race in Spring Lake Heights borough
The most populous races in Spring Lake Heights borough are White / Caucasian (4,501 | 92.5%), Hispanic or Latino (283 | 5.8%), and Two or more Races (275 | 5.7%).
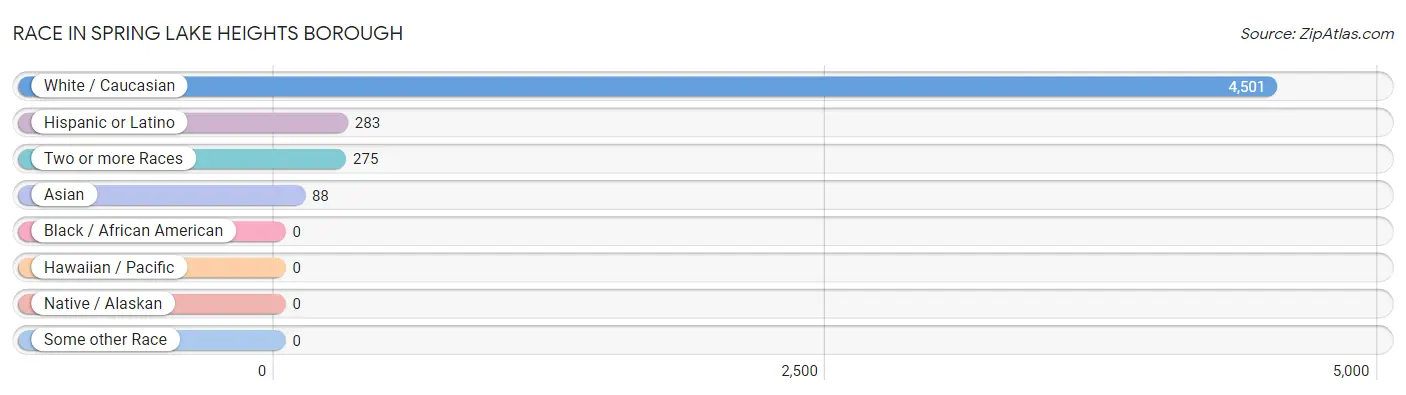
| Race | # Population | % Population |
| Asian | 88 | 1.8% |
| Black / African American | 0 | 0.0% |
| Hawaiian / Pacific | 0 | 0.0% |
| Hispanic or Latino | 283 | 5.8% |
| Native / Alaskan | 0 | 0.0% |
| White / Caucasian | 4,501 | 92.5% |
| Two or more Races | 275 | 5.7% |
| Some other Race | 0 | 0.0% |
| Total | 4,864 | 100.0% |
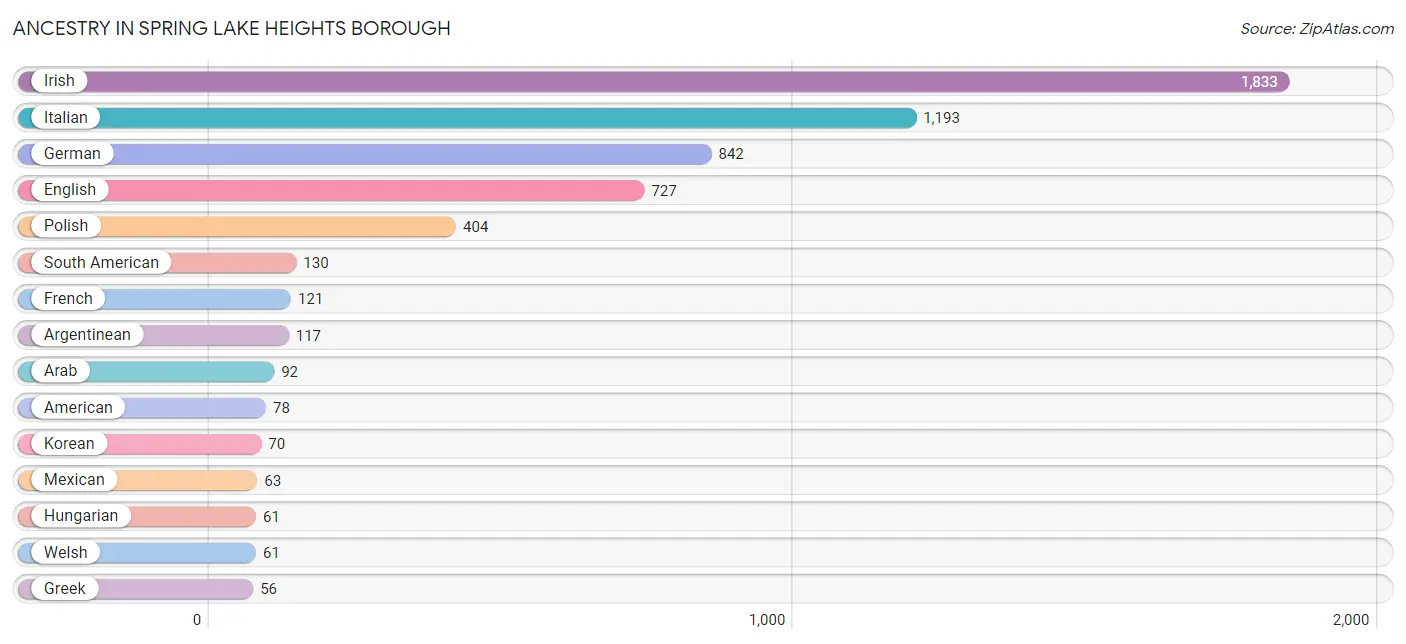
Ancestry in Spring Lake Heights borough
The most populous ancestries reported in Spring Lake Heights borough are Irish (1,833 | 37.7%), Italian (1,193 | 24.5%), German (842 | 17.3%), English (727 | 14.9%), and Polish (404 | 8.3%), together accounting for 102.8% of all Spring Lake Heights borough residents.
| Ancestry | # Population | % Population |
| American | 78 | 1.6% |
| Arab | 92 | 1.9% |
| Argentinean | 117 | 2.4% |
| Austrian | 27 | 0.6% |
| Belgian | 22 | 0.4% |
| British | 10 | 0.2% |
| Central American | 43 | 0.9% |
| Czech | 22 | 0.4% |
| Czechoslovakian | 22 | 0.4% |
| Danish | 34 | 0.7% |
| Dutch | 38 | 0.8% |
| Ecuadorian | 13 | 0.3% |
| English | 727 | 14.9% |
| European | 15 | 0.3% |
| French | 121 | 2.5% |
| German | 842 | 17.3% |
| Greek | 56 | 1.1% |
| Hungarian | 61 | 1.3% |
| Indian (Asian) | 38 | 0.8% |
| Irish | 1,833 | 37.7% |
| Italian | 1,193 | 24.5% |
| Korean | 70 | 1.4% |
| Lebanese | 47 | 1.0% |
| Lithuanian | 18 | 0.4% |
| Mexican | 63 | 1.3% |
| Moroccan | 25 | 0.5% |
| New Zealander | 32 | 0.7% |
| Northern European | 19 | 0.4% |
| Norwegian | 11 | 0.2% |
| Pennsylvania German | 28 | 0.6% |
| Polish | 404 | 8.3% |
| Puerto Rican | 47 | 1.0% |
| Russian | 11 | 0.2% |
| Salvadoran | 43 | 0.9% |
| Scottish | 35 | 0.7% |
| Slovak | 21 | 0.4% |
| South American | 130 | 2.7% |
| Swedish | 19 | 0.4% |
| Syrian | 20 | 0.4% |
| Thai | 19 | 0.4% |
| Ukrainian | 9 | 0.2% |
| Welsh | 61 | 1.3% | View All 42 Rows |
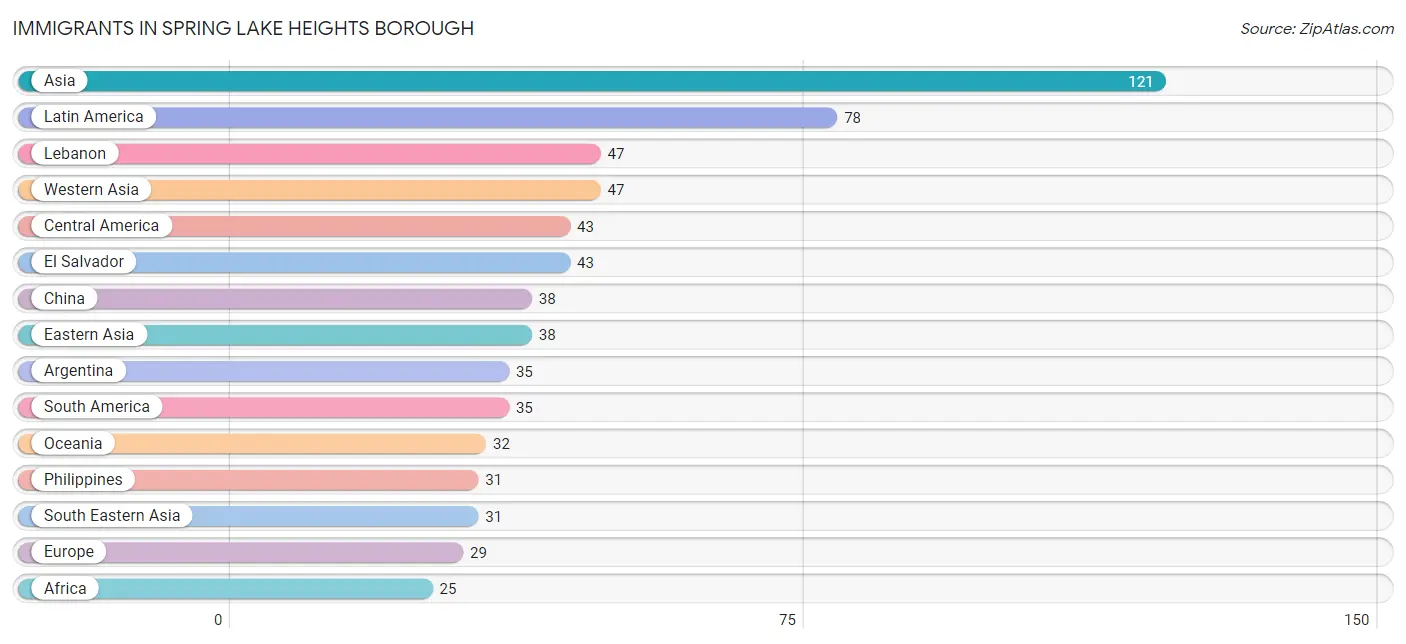
Immigrants in Spring Lake Heights borough
The most numerous immigrant groups reported in Spring Lake Heights borough came from Asia (121 | 2.5%), Latin America (78 | 1.6%), Lebanon (47 | 1.0%), Western Asia (47 | 1.0%), and Central America (43 | 0.9%), together accounting for 6.9% of all Spring Lake Heights borough residents.
| Immigration Origin | # Population | % Population |
| Africa | 25 | 0.5% |
| Argentina | 35 | 0.7% |
| Asia | 121 | 2.5% |
| Central America | 43 | 0.9% |
| China | 38 | 0.8% |
| Eastern Asia | 38 | 0.8% |
| El Salvador | 43 | 0.9% |
| Europe | 29 | 0.6% |
| Hong Kong | 16 | 0.3% |
| India | 5 | 0.1% |
| Ireland | 11 | 0.2% |
| Italy | 7 | 0.1% |
| Latin America | 78 | 1.6% |
| Lebanon | 47 | 1.0% |
| Morocco | 25 | 0.5% |
| Northern Africa | 25 | 0.5% |
| Northern Europe | 22 | 0.4% |
| Norway | 11 | 0.2% |
| Oceania | 32 | 0.7% |
| Philippines | 31 | 0.6% |
| South America | 35 | 0.7% |
| South Central Asia | 5 | 0.1% |
| South Eastern Asia | 31 | 0.6% |
| Southern Europe | 7 | 0.1% |
| Western Asia | 47 | 1.0% | View All 25 Rows |
Sex and Age in Spring Lake Heights borough
Sex and Age in Spring Lake Heights borough
The most populous age groups in Spring Lake Heights borough are 35 to 39 Years (264 | 12.0%) for men and 60 to 64 Years (282 | 10.6%) for women.
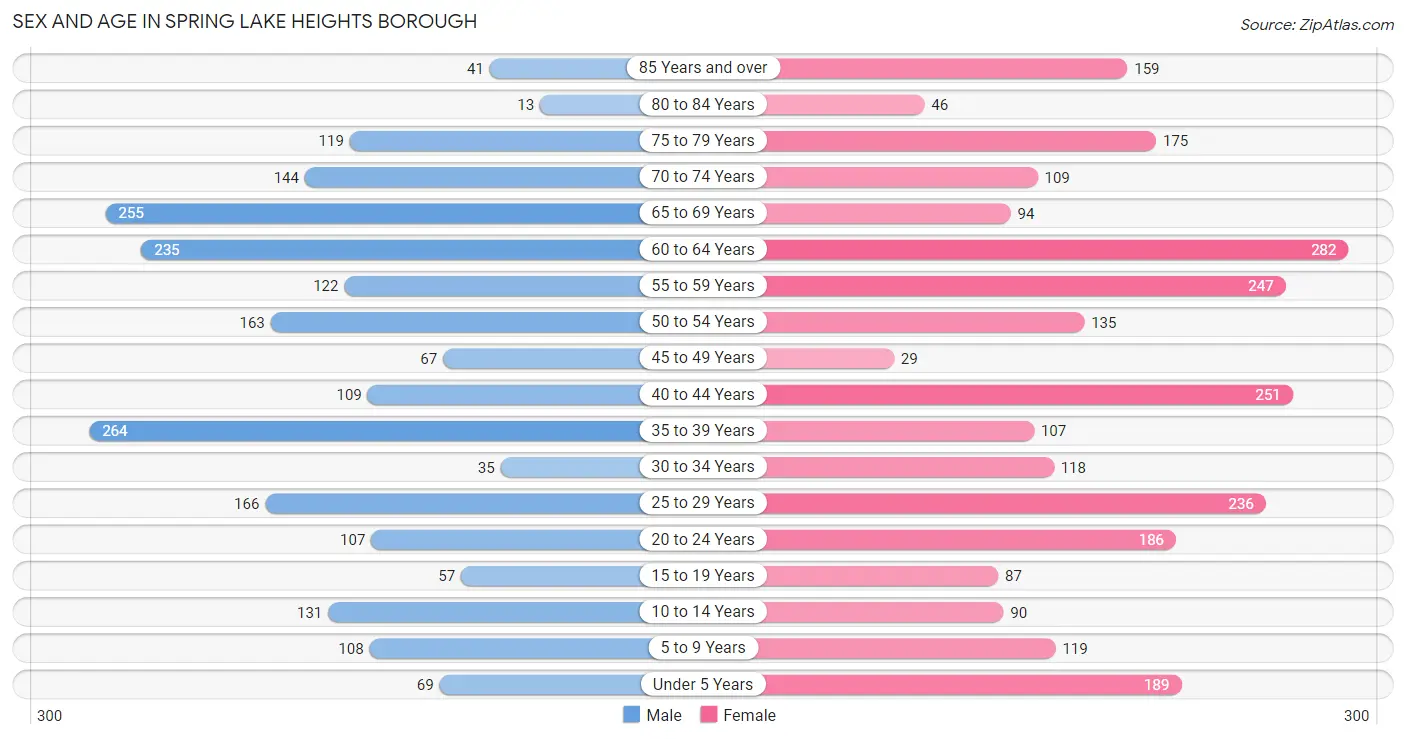
| Age Bracket | Male | Female |
| Under 5 Years | 69 (3.1%) | 189 (7.1%) |
| 5 to 9 Years | 108 (4.9%) | 119 (4.5%) |
| 10 to 14 Years | 131 (5.9%) | 90 (3.4%) |
| 15 to 19 Years | 57 (2.6%) | 87 (3.3%) |
| 20 to 24 Years | 107 (4.9%) | 186 (7.0%) |
| 25 to 29 Years | 166 (7.5%) | 236 (8.9%) |
| 30 to 34 Years | 35 (1.6%) | 118 (4.4%) |
| 35 to 39 Years | 264 (12.0%) | 107 (4.0%) |
| 40 to 44 Years | 109 (4.9%) | 251 (9.4%) |
| 45 to 49 Years | 67 (3.0%) | 29 (1.1%) |
| 50 to 54 Years | 163 (7.4%) | 135 (5.1%) |
| 55 to 59 Years | 122 (5.5%) | 247 (9.3%) |
| 60 to 64 Years | 235 (10.7%) | 282 (10.6%) |
| 65 to 69 Years | 255 (11.6%) | 94 (3.5%) |
| 70 to 74 Years | 144 (6.5%) | 109 (4.1%) |
| 75 to 79 Years | 119 (5.4%) | 175 (6.6%) |
| 80 to 84 Years | 13 (0.6%) | 46 (1.7%) |
| 85 Years and over | 41 (1.9%) | 159 (6.0%) |
| Total | 2,205 (100.0%) | 2,659 (100.0%) |
Families and Households in Spring Lake Heights borough
Median Family Size in Spring Lake Heights borough
The median family size in Spring Lake Heights borough is 3.03 persons per family, with single female/mother families (140 | 12.4%) accounting for the largest median family size of 3.15 persons per family. On the other hand, single male/father families (21 | 1.9%) represent the smallest median family size with 1.95 persons per family.
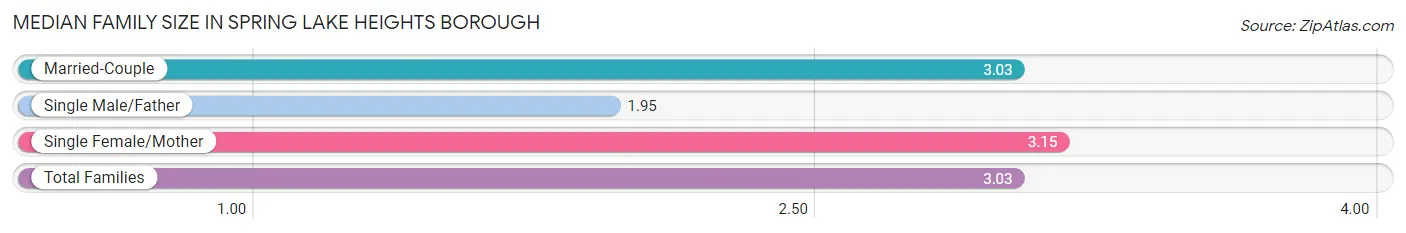
| Family Type | # Families | Family Size |
| Married-Couple | 966 (85.7%) | 3.03 |
| Single Male/Father | 21 (1.9%) | 1.95 |
| Single Female/Mother | 140 (12.4%) | 3.15 |
| Total Families | 1,127 (100.0%) | 3.03 |
Median Household Size in Spring Lake Heights borough
The median household size in Spring Lake Heights borough is 2.01 persons per household, with single female/mother households (140 | 5.8%) accounting for the largest median household size of 3.46 persons per household. non-family households (1,287 | 53.3%) represent the smallest median household size with 1.08 persons per household.
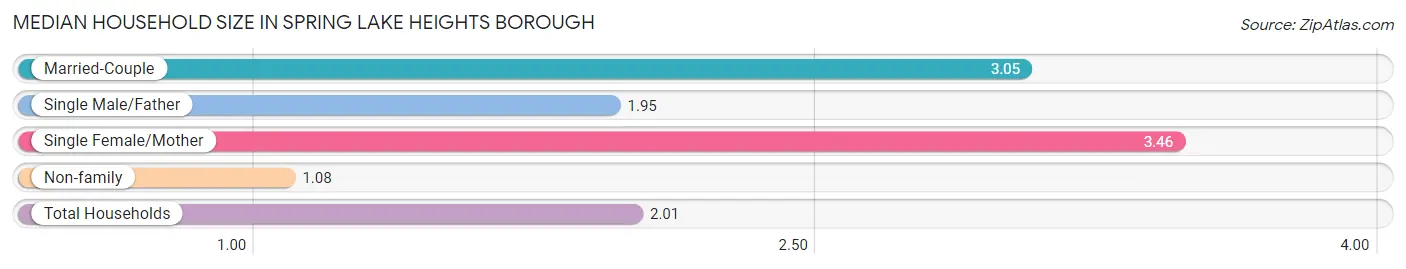
| Household Type | # Households | Household Size |
| Married-Couple | 966 (40.0%) | 3.05 |
| Single Male/Father | 21 (0.9%) | 1.95 |
| Single Female/Mother | 140 (5.8%) | 3.46 |
| Non-family | 1,287 (53.3%) | 1.08 |
| Total Households | 2,414 (100.0%) | 2.01 |
Household Size by Marriage Status in Spring Lake Heights borough
Out of a total of 2,414 households in Spring Lake Heights borough, 1,127 (46.7%) are family households, while 1,287 (53.3%) are nonfamily households. The most numerous type of family households are 2-person households, comprising 531, and the most common type of nonfamily households are 1-person households, comprising 1,217.
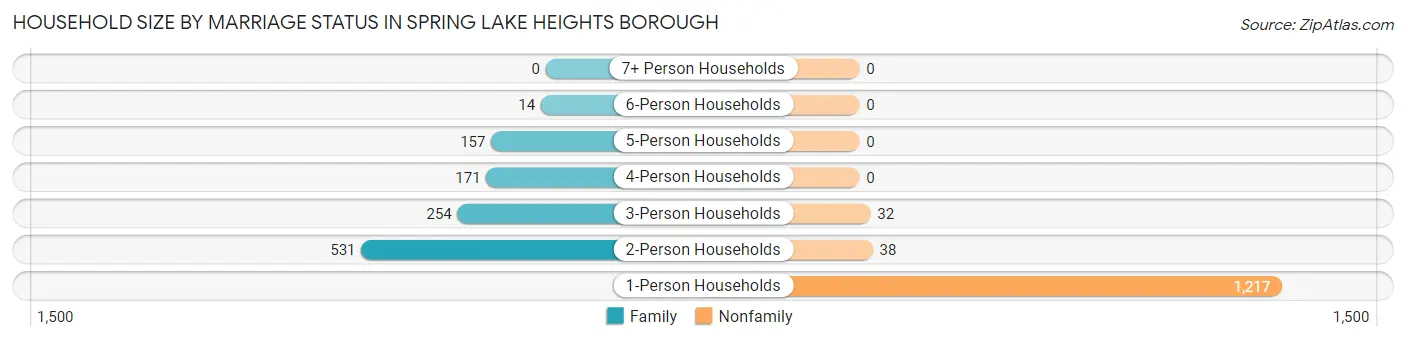
| Household Size | Family Households | Nonfamily Households |
| 1-Person Households | - | 1,217 (50.4%) |
| 2-Person Households | 531 (22.0%) | 38 (1.6%) |
| 3-Person Households | 254 (10.5%) | 32 (1.3%) |
| 4-Person Households | 171 (7.1%) | 0 (0.0%) |
| 5-Person Households | 157 (6.5%) | 0 (0.0%) |
| 6-Person Households | 14 (0.6%) | 0 (0.0%) |
| 7+ Person Households | 0 (0.0%) | 0 (0.0%) |
| Total | 1,127 (46.7%) | 1,287 (53.3%) |
Female Fertility in Spring Lake Heights borough
Fertility by Age in Spring Lake Heights borough
Average fertility rate in Spring Lake Heights borough is 17.0 births per 1,000 women. Women in the age bracket of 20 to 34 years have the highest fertility rate with 33.0 births per 1,000 women. Women in the age bracket of 20 to 34 years acount for 100.0% of all women with births.
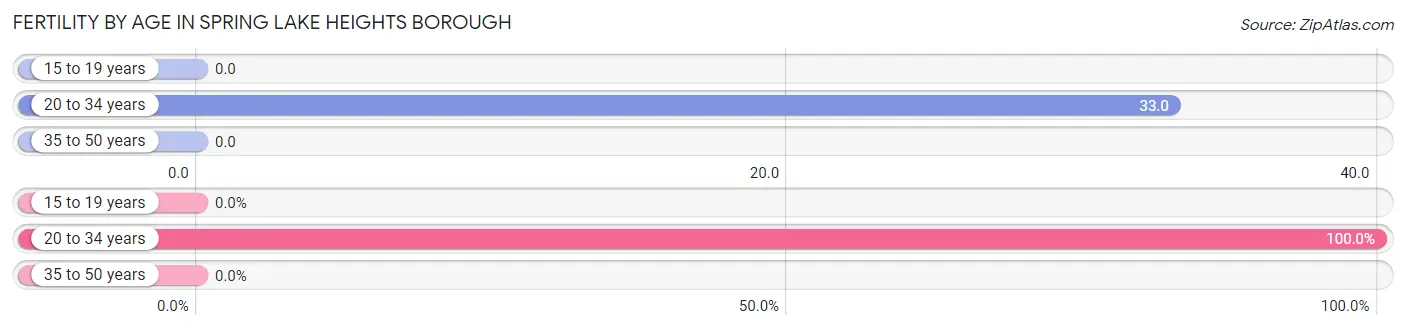
| Age Bracket | Women with Births | Births / 1,000 Women |
| 15 to 19 years | 0 (0.0%) | 0.0 |
| 20 to 34 years | 18 (100.0%) | 33.0 |
| 35 to 50 years | 0 (0.0%) | 0.0 |
| Total | 18 (100.0%) | 17.0 |
Fertility by Age by Marriage Status in Spring Lake Heights borough
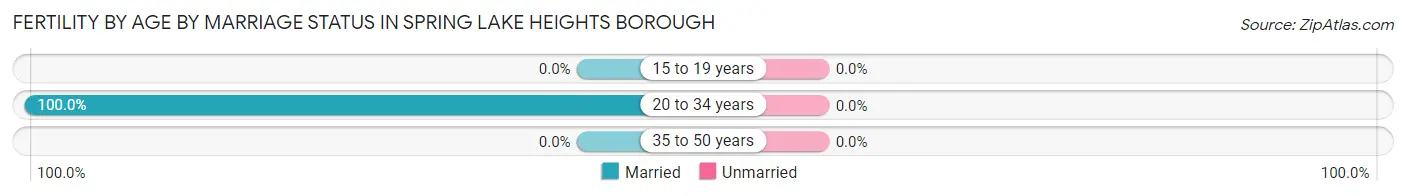
| Age Bracket | Married | Unmarried |
| 15 to 19 years | 0 (0.0%) | 0 (0.0%) |
| 20 to 34 years | 18 (100.0%) | 0 (0.0%) |
| 35 to 50 years | 0 (0.0%) | 0 (0.0%) |
| Total | 18 (100.0%) | 0 (0.0%) |
Fertility by Education in Spring Lake Heights borough
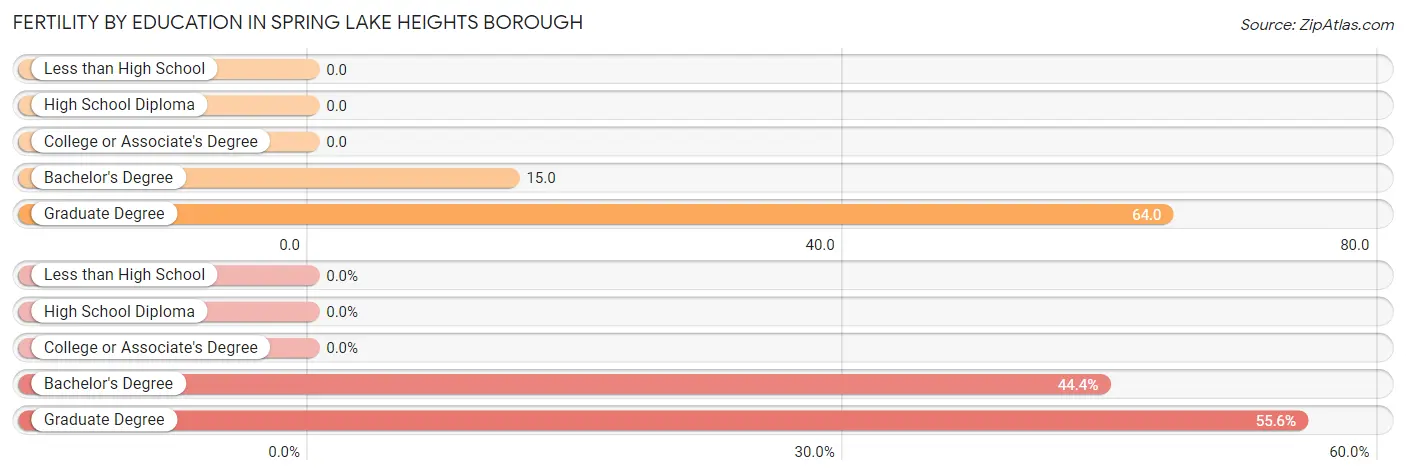
| Educational Attainment | Women with Births | Births / 1,000 Women |
| Less than High School | 0 (0.0%) | 0.0 |
| High School Diploma | 0 (0.0%) | 0.0 |
| College or Associate's Degree | 0 (0.0%) | 0.0 |
| Bachelor's Degree | 8 (44.4%) | 15.0 |
| Graduate Degree | 10 (55.6%) | 64.0 |
| Total | 18 (100.0%) | 17.0 |
Fertility by Education by Marriage Status in Spring Lake Heights borough
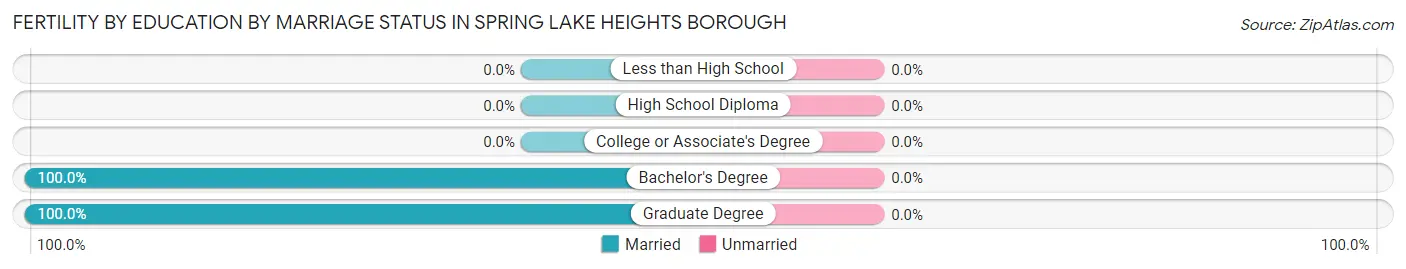
| Educational Attainment | Married | Unmarried |
| Less than High School | 0 (0.0%) | 0 (0.0%) |
| High School Diploma | 0 (0.0%) | 0 (0.0%) |
| College or Associate's Degree | 0 (0.0%) | 0 (0.0%) |
| Bachelor's Degree | 8 (100.0%) | 0 (0.0%) |
| Graduate Degree | 10 (100.0%) | 0 (0.0%) |
| Total | 18 (100.0%) | 0 (0.0%) |
Employment Characteristics in Spring Lake Heights borough
Employment by Class of Employer in Spring Lake Heights borough
Among the 2,631 employed individuals in Spring Lake Heights borough, private company employees (1,992 | 75.7%), local government employees (246 | 9.3%), and not-for-profit organizations (102 | 3.9%) make up the most common classes of employment.
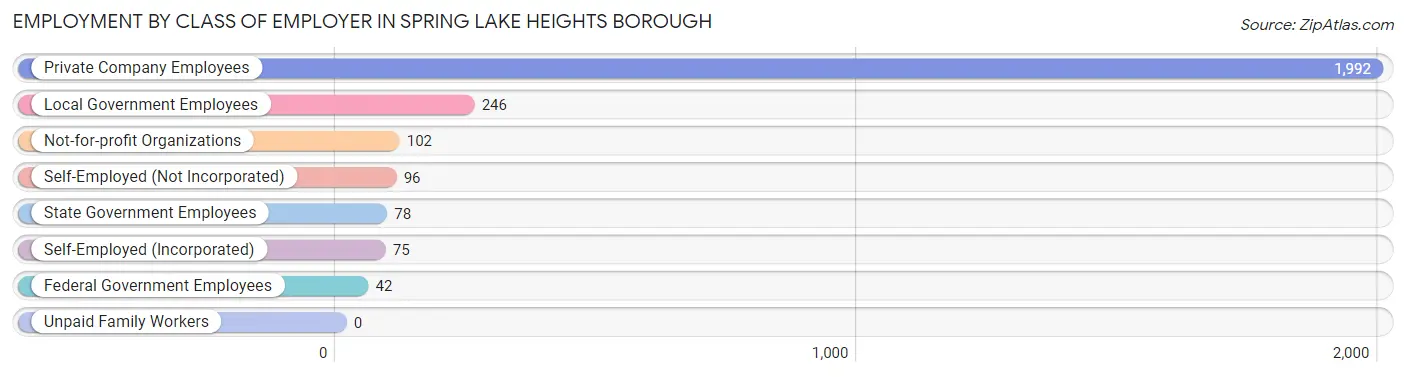
| Employer Class | # Employees | % Employees |
| Private Company Employees | 1,992 | 75.7% |
| Self-Employed (Incorporated) | 75 | 2.9% |
| Self-Employed (Not Incorporated) | 96 | 3.6% |
| Not-for-profit Organizations | 102 | 3.9% |
| Local Government Employees | 246 | 9.3% |
| State Government Employees | 78 | 3.0% |
| Federal Government Employees | 42 | 1.6% |
| Unpaid Family Workers | 0 | 0.0% |
| Total | 2,631 | 100.0% |
Employment Status by Age in Spring Lake Heights borough
According to the labor force statistics for Spring Lake Heights borough, out of the total population over 16 years of age (4,129), 68.0% or 2,808 individuals are in the labor force, with 6.3% or 177 of them unemployed. The age group with the highest labor force participation rate is 25 to 29 years, with 97.8% or 393 individuals in the labor force. Within the labor force, the 16 to 19 years age range has the highest percentage of unemployed individuals, with 23.8% or 15 of them being unemployed.
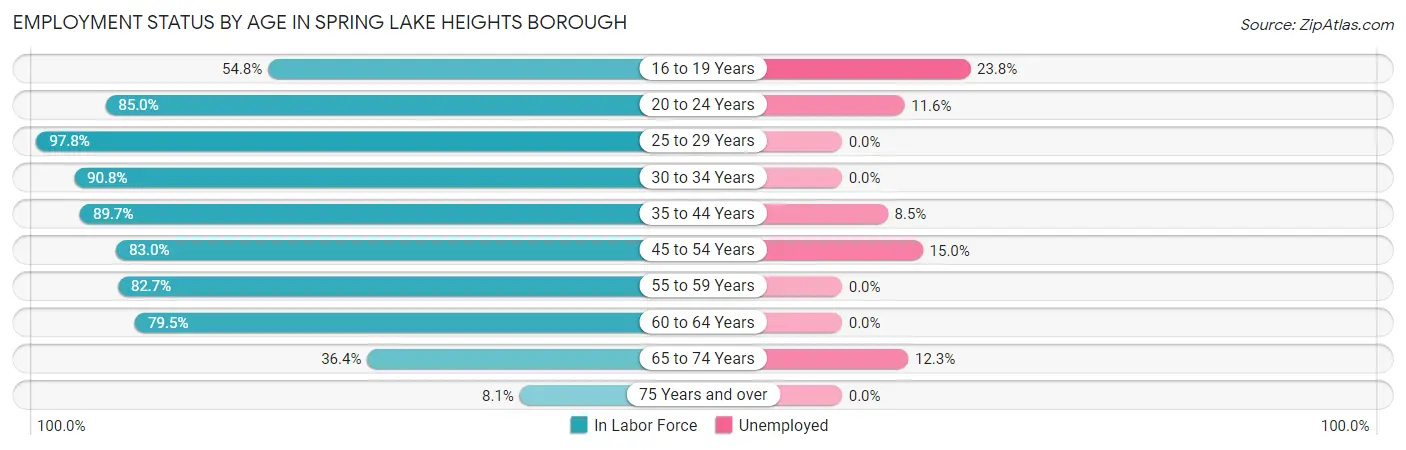
| Age Bracket | In Labor Force | Unemployed |
| 16 to 19 Years | 63 (54.8%) | 15 (23.8%) |
| 20 to 24 Years | 249 (85.0%) | 29 (11.6%) |
| 25 to 29 Years | 393 (97.8%) | 0 (0.0%) |
| 30 to 34 Years | 139 (90.8%) | 0 (0.0%) |
| 35 to 44 Years | 656 (89.7%) | 56 (8.5%) |
| 45 to 54 Years | 327 (83.0%) | 49 (15.0%) |
| 55 to 59 Years | 305 (82.7%) | 0 (0.0%) |
| 60 to 64 Years | 411 (79.5%) | 0 (0.0%) |
| 65 to 74 Years | 219 (36.4%) | 27 (12.3%) |
| 75 Years and over | 45 (8.1%) | 0 (0.0%) |
| Total | 2,808 (68.0%) | 177 (6.3%) |
Employment Status by Educational Attainment in Spring Lake Heights borough
According to labor force statistics for Spring Lake Heights borough, 86.9% of individuals (2,230) out of the total population between 25 and 64 years of age (2,566) are in the labor force, with 4.7% or 105 of them being unemployed. The group with the highest labor force participation rate are those with the educational attainment of less than high school, with 100.0% or 106 individuals in the labor force. Within the labor force, individuals with high school diploma education have the highest percentage of unemployment, with 6.9% or 17 of them being unemployed.
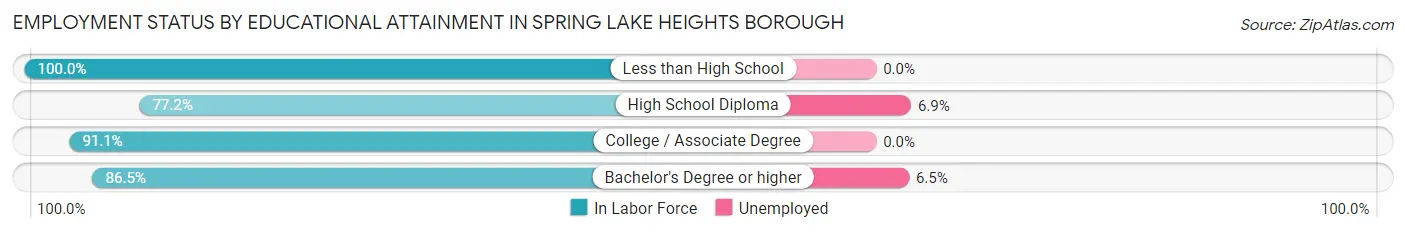
| Educational Attainment | In Labor Force | Unemployed |
| Less than High School | 106 (100.0%) | 0 (0.0%) |
| High School Diploma | 247 (77.2%) | 22 (6.9%) |
| College / Associate Degree | 532 (91.1%) | 0 (0.0%) |
| Bachelor's Degree or higher | 1,346 (86.5%) | 101 (6.5%) |
| Total | 2,230 (86.9%) | 121 (4.7%) |
Employment Occupations by Sex in Spring Lake Heights borough
Management, Business, Science and Arts Occupations
The most common Management, Business, Science and Arts occupations in Spring Lake Heights borough are Community & Social Service (383 | 14.6%), Management (308 | 11.7%), Education Instruction & Library (278 | 10.6%), Computers, Engineering & Science (158 | 6.0%), and Health Diagnosing & Treating (150 | 5.7%).
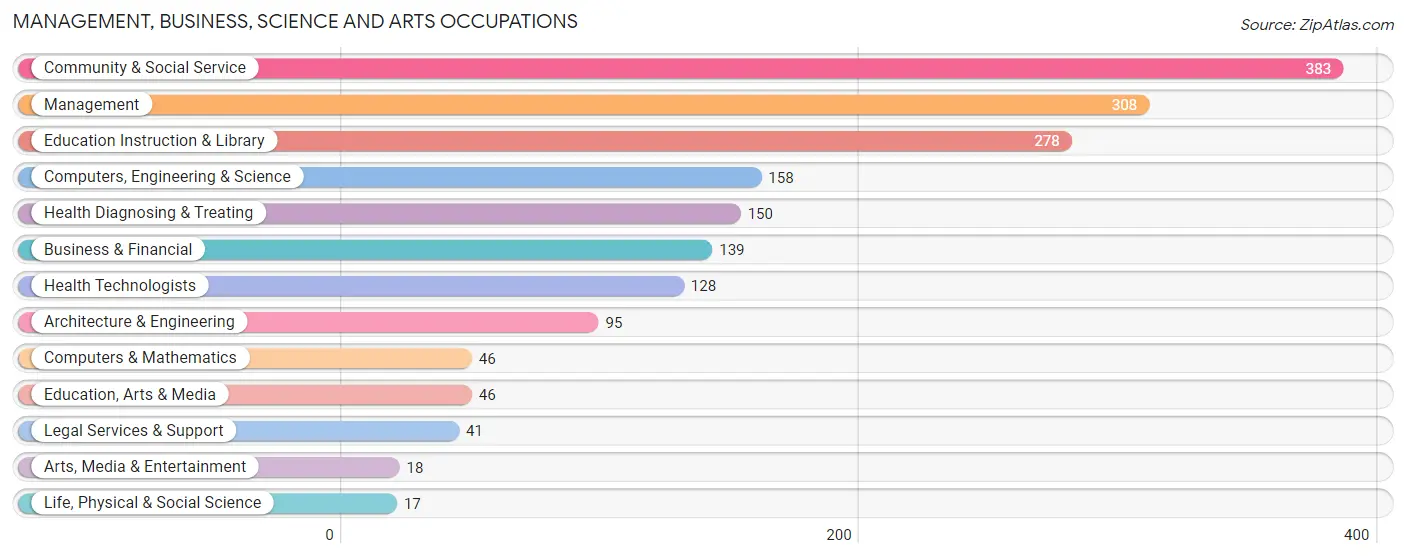
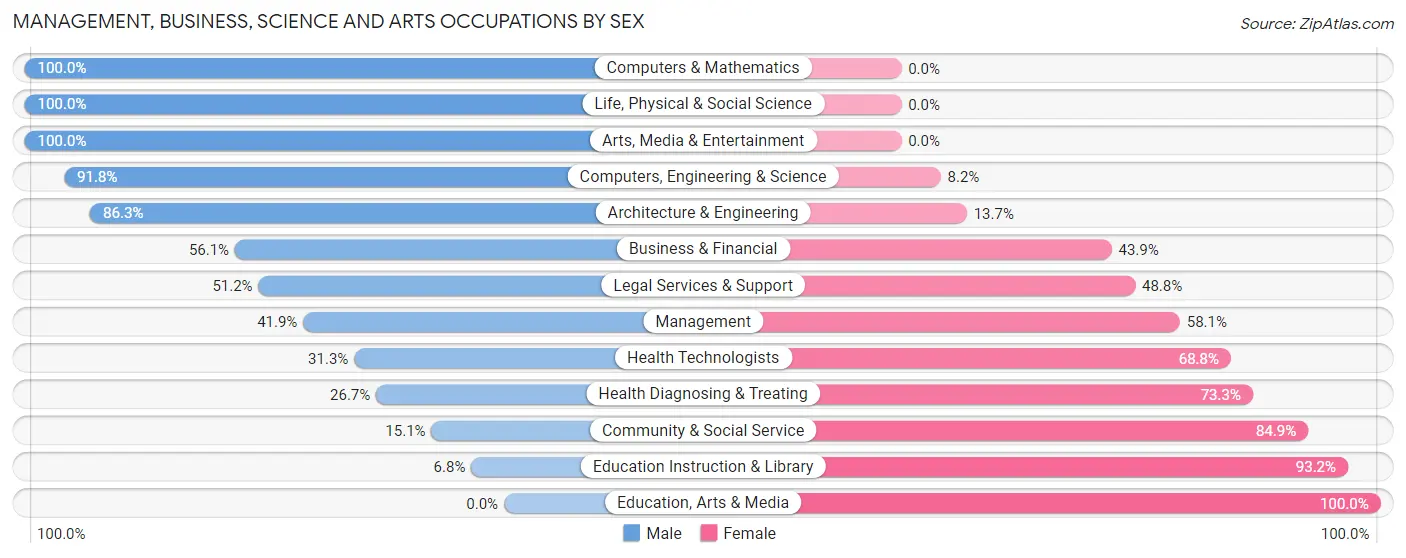
Management, Business, Science and Arts Occupations by Sex
Within the Management, Business, Science and Arts occupations in Spring Lake Heights borough, the most male-oriented occupations are Computers & Mathematics (100.0%), Life, Physical & Social Science (100.0%), and Arts, Media & Entertainment (100.0%), while the most female-oriented occupations are Education, Arts & Media (100.0%), Education Instruction & Library (93.2%), and Community & Social Service (84.9%).
| Occupation | Male | Female |
| Management | 129 (41.9%) | 179 (58.1%) |
| Business & Financial | 78 (56.1%) | 61 (43.9%) |
| Computers, Engineering & Science | 145 (91.8%) | 13 (8.2%) |
| Computers & Mathematics | 46 (100.0%) | 0 (0.0%) |
| Architecture & Engineering | 82 (86.3%) | 13 (13.7%) |
| Life, Physical & Social Science | 17 (100.0%) | 0 (0.0%) |
| Community & Social Service | 58 (15.1%) | 325 (84.9%) |
| Education, Arts & Media | 0 (0.0%) | 46 (100.0%) |
| Legal Services & Support | 21 (51.2%) | 20 (48.8%) |
| Education Instruction & Library | 19 (6.8%) | 259 (93.2%) |
| Arts, Media & Entertainment | 18 (100.0%) | 0 (0.0%) |
| Health Diagnosing & Treating | 40 (26.7%) | 110 (73.3%) |
| Health Technologists | 40 (31.2%) | 88 (68.8%) |
| Total (Category) | 450 (39.5%) | 688 (60.5%) |
| Total (Overall) | 1,202 (45.7%) | 1,429 (54.3%) |
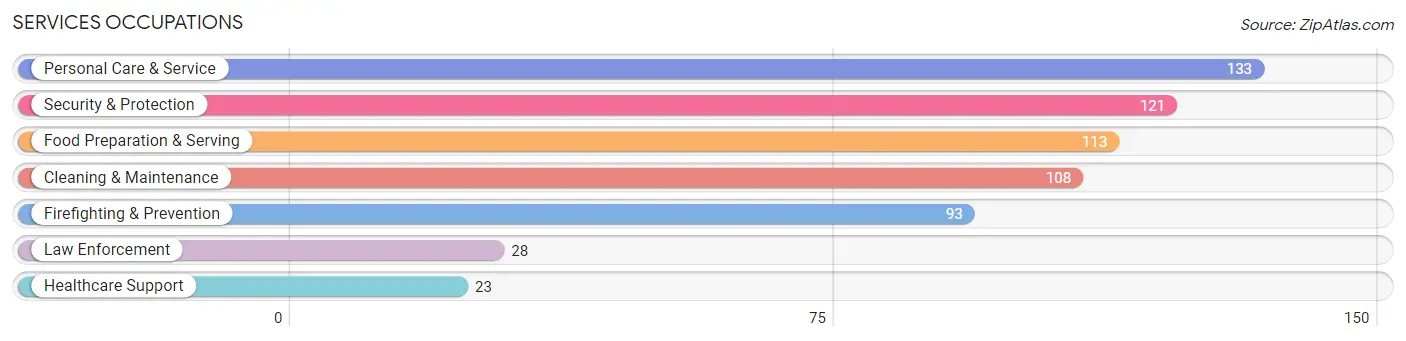
Services Occupations
The most common Services occupations in Spring Lake Heights borough are Personal Care & Service (133 | 5.1%), Security & Protection (121 | 4.6%), Food Preparation & Serving (113 | 4.3%), Cleaning & Maintenance (108 | 4.1%), and Firefighting & Prevention (93 | 3.5%).
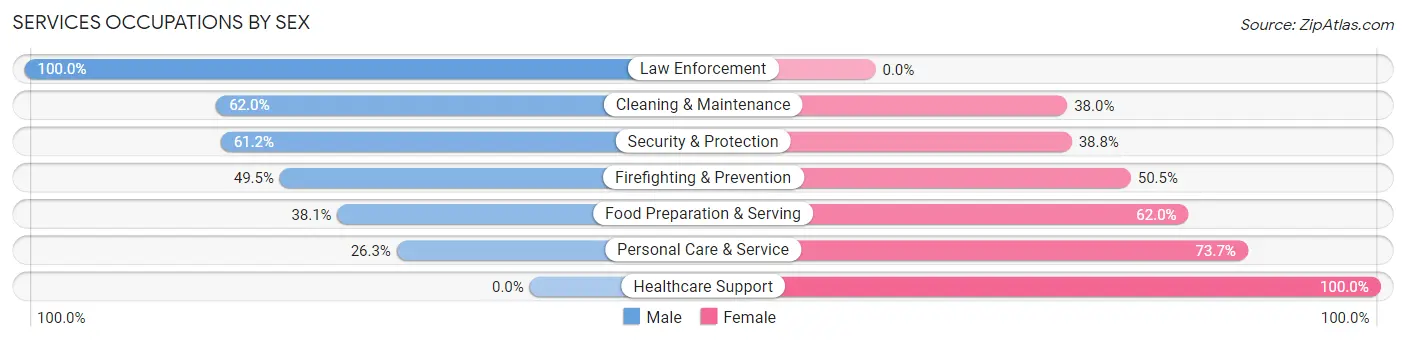
Services Occupations by Sex
Within the Services occupations in Spring Lake Heights borough, the most male-oriented occupations are Law Enforcement (100.0%), Cleaning & Maintenance (62.0%), and Security & Protection (61.2%), while the most female-oriented occupations are Healthcare Support (100.0%), Personal Care & Service (73.7%), and Food Preparation & Serving (62.0%).
| Occupation | Male | Female |
| Healthcare Support | 0 (0.0%) | 23 (100.0%) |
| Security & Protection | 74 (61.2%) | 47 (38.8%) |
| Firefighting & Prevention | 46 (49.5%) | 47 (50.5%) |
| Law Enforcement | 28 (100.0%) | 0 (0.0%) |
| Food Preparation & Serving | 43 (38.1%) | 70 (62.0%) |
| Cleaning & Maintenance | 67 (62.0%) | 41 (38.0%) |
| Personal Care & Service | 35 (26.3%) | 98 (73.7%) |
| Total (Category) | 219 (44.0%) | 279 (56.0%) |
| Total (Overall) | 1,202 (45.7%) | 1,429 (54.3%) |
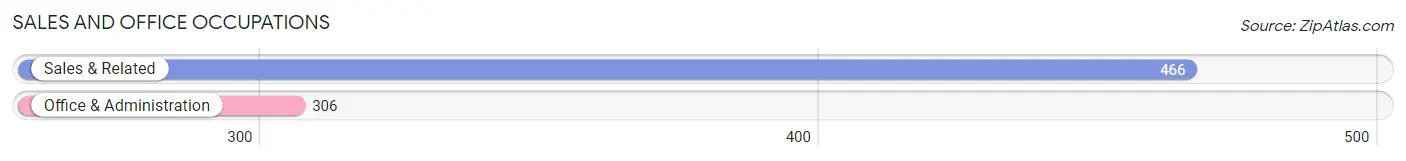
Sales and Office Occupations
The most common Sales and Office occupations in Spring Lake Heights borough are Sales & Related (466 | 17.7%), and Office & Administration (306 | 11.6%).
Sales and Office Occupations by Sex
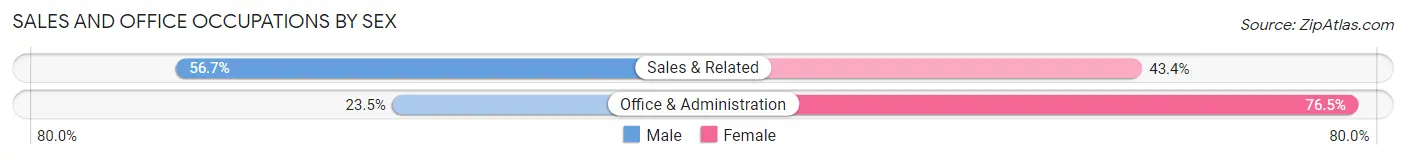
| Occupation | Male | Female |
| Sales & Related | 264 (56.7%) | 202 (43.3%) |
| Office & Administration | 72 (23.5%) | 234 (76.5%) |
| Total (Category) | 336 (43.5%) | 436 (56.5%) |
| Total (Overall) | 1,202 (45.7%) | 1,429 (54.3%) |
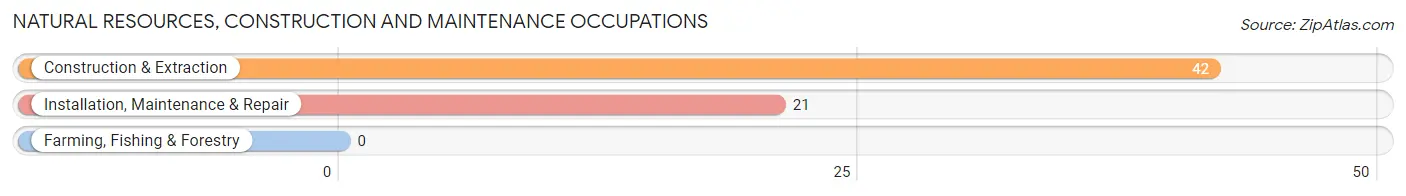
Natural Resources, Construction and Maintenance Occupations
The most common Natural Resources, Construction and Maintenance occupations in Spring Lake Heights borough are Construction & Extraction (42 | 1.6%), and Installation, Maintenance & Repair (21 | 0.8%).
Natural Resources, Construction and Maintenance Occupations by Sex
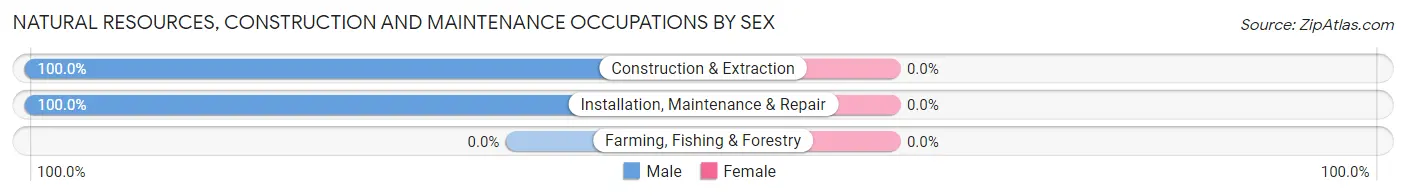
| Occupation | Male | Female |
| Farming, Fishing & Forestry | 0 (0.0%) | 0 (0.0%) |
| Construction & Extraction | 42 (100.0%) | 0 (0.0%) |
| Installation, Maintenance & Repair | 21 (100.0%) | 0 (0.0%) |
| Total (Category) | 63 (100.0%) | 0 (0.0%) |
| Total (Overall) | 1,202 (45.7%) | 1,429 (54.3%) |
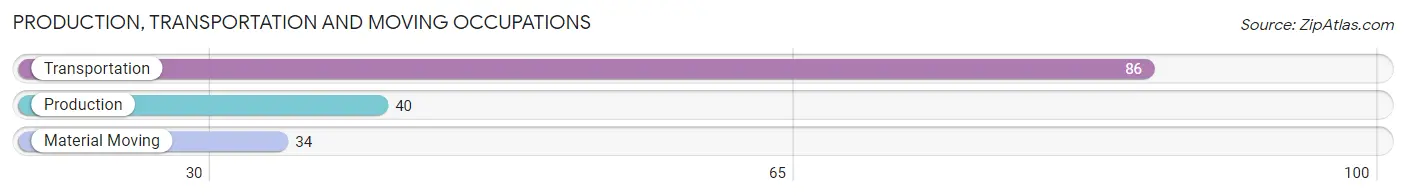
Production, Transportation and Moving Occupations
The most common Production, Transportation and Moving occupations in Spring Lake Heights borough are Transportation (86 | 3.3%), Production (40 | 1.5%), and Material Moving (34 | 1.3%).
Production, Transportation and Moving Occupations by Sex
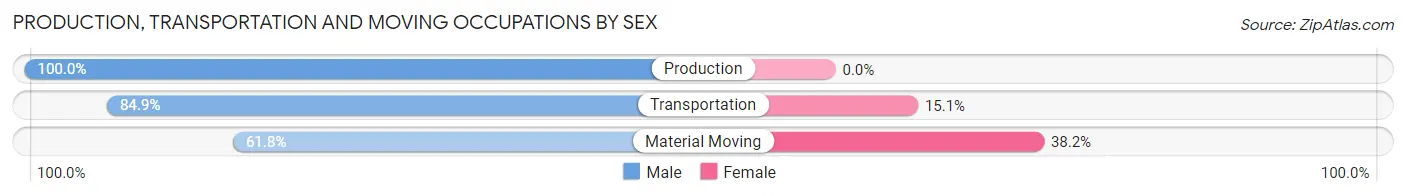
| Occupation | Male | Female |
| Production | 40 (100.0%) | 0 (0.0%) |
| Transportation | 73 (84.9%) | 13 (15.1%) |
| Material Moving | 21 (61.8%) | 13 (38.2%) |
| Total (Category) | 134 (83.8%) | 26 (16.3%) |
| Total (Overall) | 1,202 (45.7%) | 1,429 (54.3%) |
Employment Industries by Sex in Spring Lake Heights borough
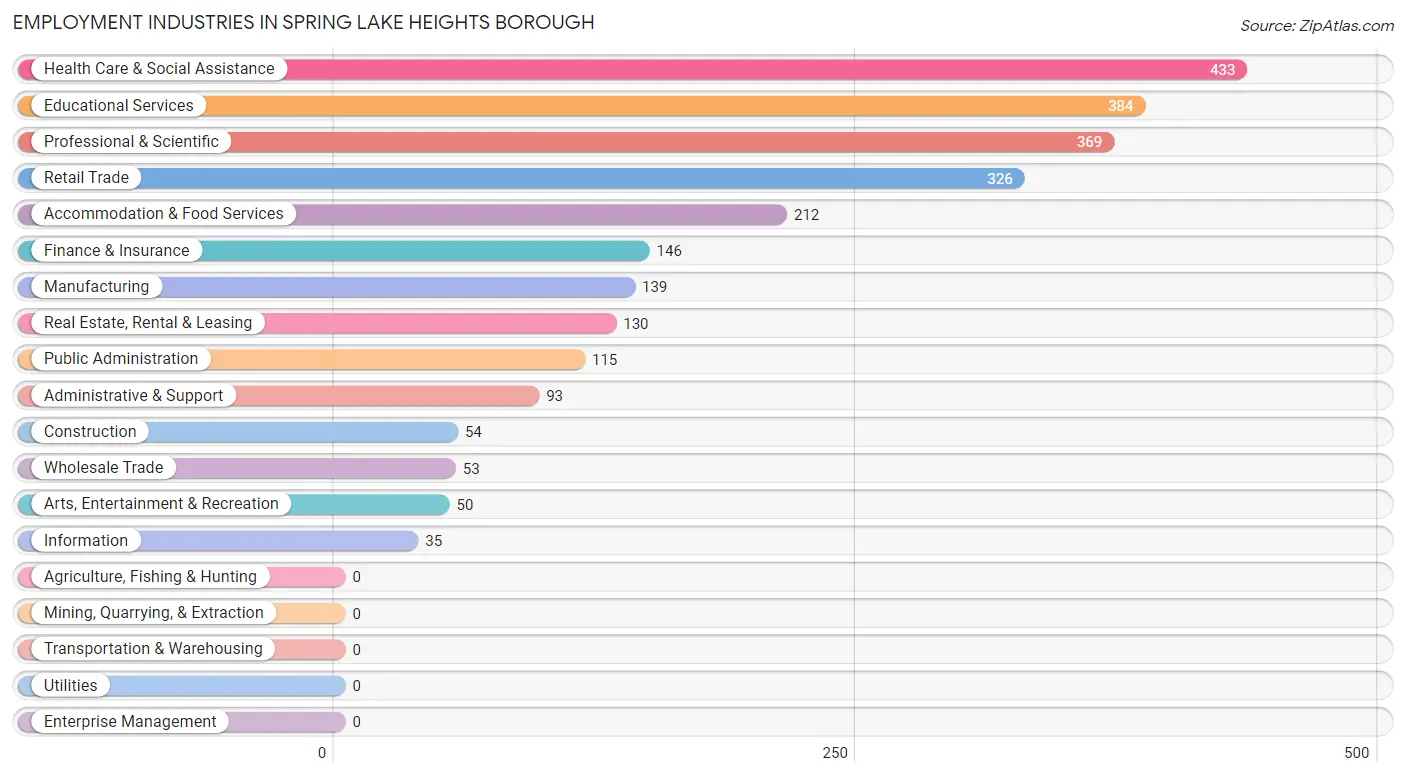
Employment Industries in Spring Lake Heights borough
The major employment industries in Spring Lake Heights borough include Health Care & Social Assistance (433 | 16.5%), Educational Services (384 | 14.6%), Professional & Scientific (369 | 14.0%), Retail Trade (326 | 12.4%), and Accommodation & Food Services (212 | 8.1%).
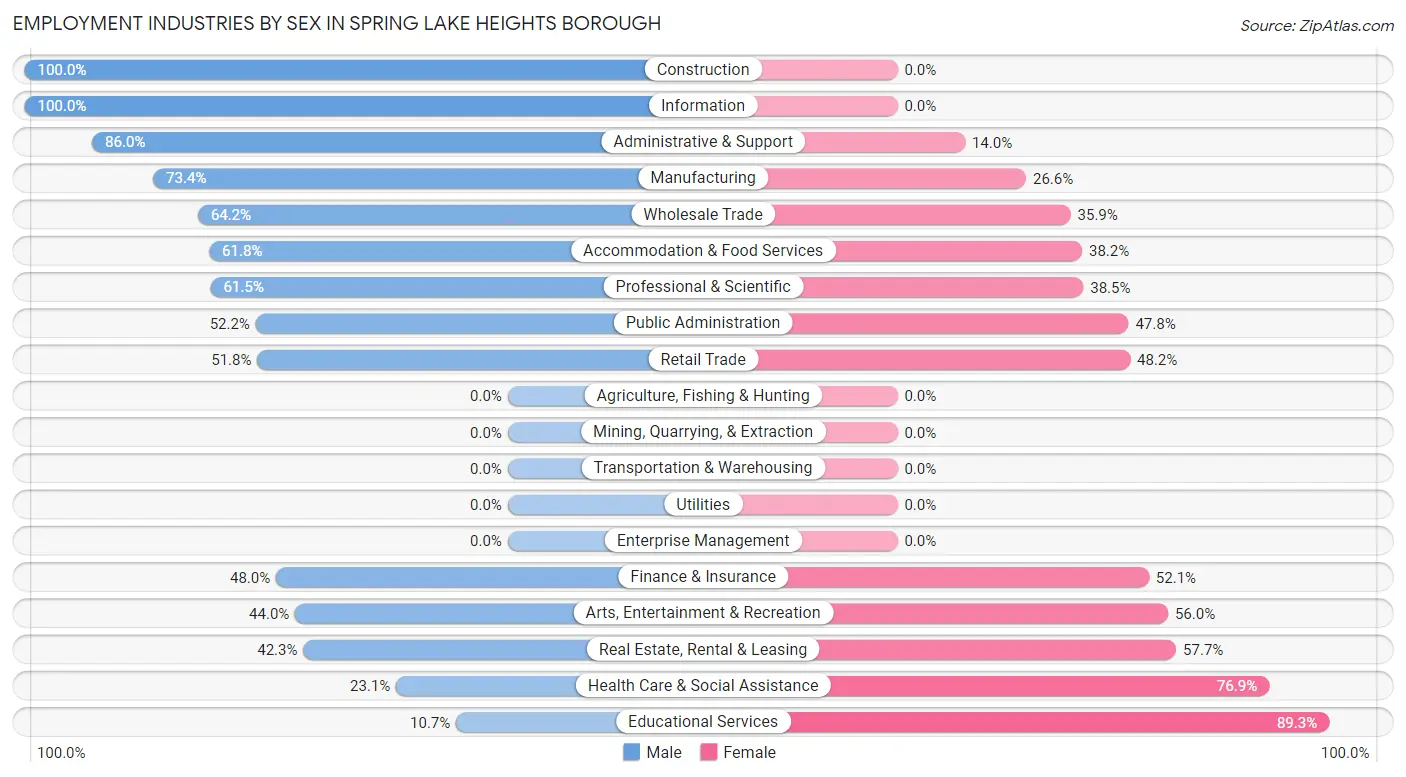
Employment Industries by Sex in Spring Lake Heights borough
The Spring Lake Heights borough industries that see more men than women are Construction (100.0%), Information (100.0%), and Administrative & Support (86.0%), whereas the industries that tend to have a higher number of women are Educational Services (89.3%), Health Care & Social Assistance (76.9%), and Real Estate, Rental & Leasing (57.7%).
| Industry | Male | Female |
| Agriculture, Fishing & Hunting | 0 (0.0%) | 0 (0.0%) |
| Mining, Quarrying, & Extraction | 0 (0.0%) | 0 (0.0%) |
| Construction | 54 (100.0%) | 0 (0.0%) |
| Manufacturing | 102 (73.4%) | 37 (26.6%) |
| Wholesale Trade | 34 (64.1%) | 19 (35.8%) |
| Retail Trade | 169 (51.8%) | 157 (48.2%) |
| Transportation & Warehousing | 0 (0.0%) | 0 (0.0%) |
| Utilities | 0 (0.0%) | 0 (0.0%) |
| Information | 35 (100.0%) | 0 (0.0%) |
| Finance & Insurance | 70 (47.9%) | 76 (52.0%) |
| Real Estate, Rental & Leasing | 55 (42.3%) | 75 (57.7%) |
| Professional & Scientific | 227 (61.5%) | 142 (38.5%) |
| Enterprise Management | 0 (0.0%) | 0 (0.0%) |
| Administrative & Support | 80 (86.0%) | 13 (14.0%) |
| Educational Services | 41 (10.7%) | 343 (89.3%) |
| Health Care & Social Assistance | 100 (23.1%) | 333 (76.9%) |
| Arts, Entertainment & Recreation | 22 (44.0%) | 28 (56.0%) |
| Accommodation & Food Services | 131 (61.8%) | 81 (38.2%) |
| Public Administration | 60 (52.2%) | 55 (47.8%) |
| Total | 1,202 (45.7%) | 1,429 (54.3%) |
Education in Spring Lake Heights borough
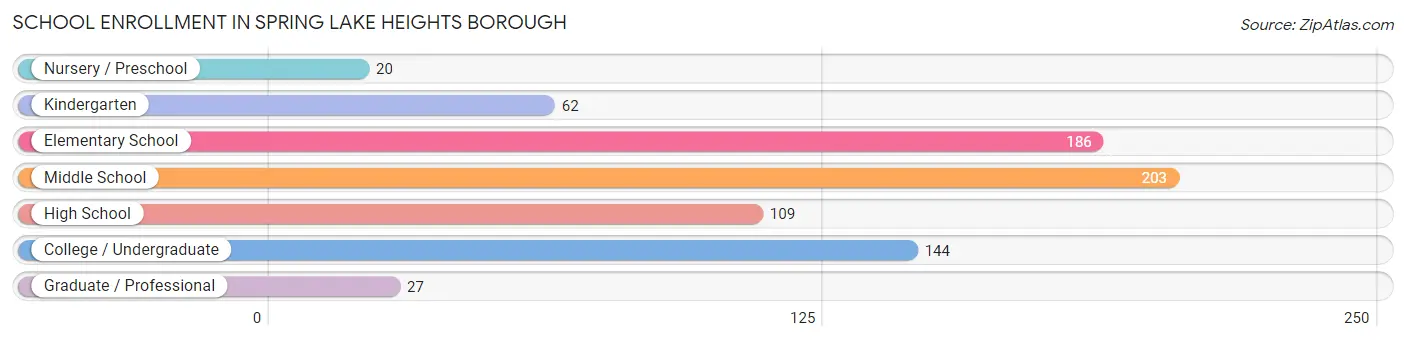
School Enrollment in Spring Lake Heights borough
The most common levels of schooling among the 751 students in Spring Lake Heights borough are middle school (203 | 27.0%), elementary school (186 | 24.8%), and college / undergraduate (144 | 19.2%).
| School Level | # Students | % Students |
| Nursery / Preschool | 20 | 2.7% |
| Kindergarten | 62 | 8.3% |
| Elementary School | 186 | 24.8% |
| Middle School | 203 | 27.0% |
| High School | 109 | 14.5% |
| College / Undergraduate | 144 | 19.2% |
| Graduate / Professional | 27 | 3.6% |
| Total | 751 | 100.0% |
School Enrollment by Age by Funding Source in Spring Lake Heights borough
Out of a total of 751 students who are enrolled in schools in Spring Lake Heights borough, 127 (16.9%) attend a private institution, while the remaining 624 (83.1%) are enrolled in public schools. The age group of 25 to 34 year olds has the highest likelihood of being enrolled in private schools, with 27 (84.4% in the age bracket) enrolled. Conversely, the age group of 3 to 4 year olds has the lowest likelihood of being enrolled in a private school, with 20 (100.0% in the age bracket) attending a public institution.
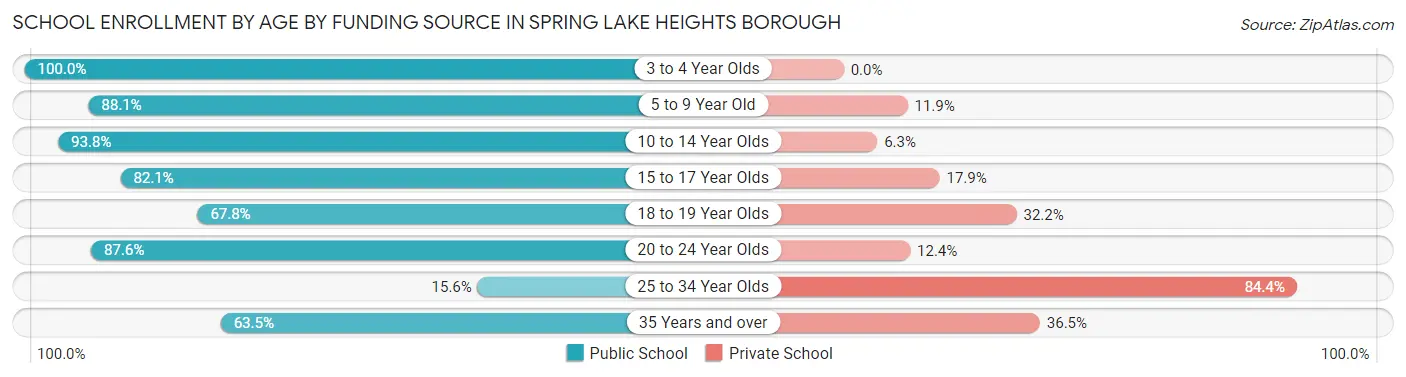
| Age Bracket | Public School | Private School |
| 3 to 4 Year Olds | 20 (100.0%) | 0 (0.0%) |
| 5 to 9 Year Old | 200 (88.1%) | 27 (11.9%) |
| 10 to 14 Year Olds | 195 (93.8%) | 13 (6.2%) |
| 15 to 17 Year Olds | 46 (82.1%) | 10 (17.9%) |
| 18 to 19 Year Olds | 40 (67.8%) | 19 (32.2%) |
| 20 to 24 Year Olds | 85 (87.6%) | 12 (12.4%) |
| 25 to 34 Year Olds | 5 (15.6%) | 27 (84.4%) |
| 35 Years and over | 33 (63.5%) | 19 (36.5%) |
| Total | 624 (83.1%) | 127 (16.9%) |
Educational Attainment by Field of Study in Spring Lake Heights borough
Business (539 | 22.5%), literature & languages (308 | 12.9%), education (219 | 9.1%), liberal arts & history (201 | 8.4%), and engineering (190 | 7.9%) are the most common fields of study among 2,395 individuals in Spring Lake Heights borough who have obtained a bachelor's degree or higher.
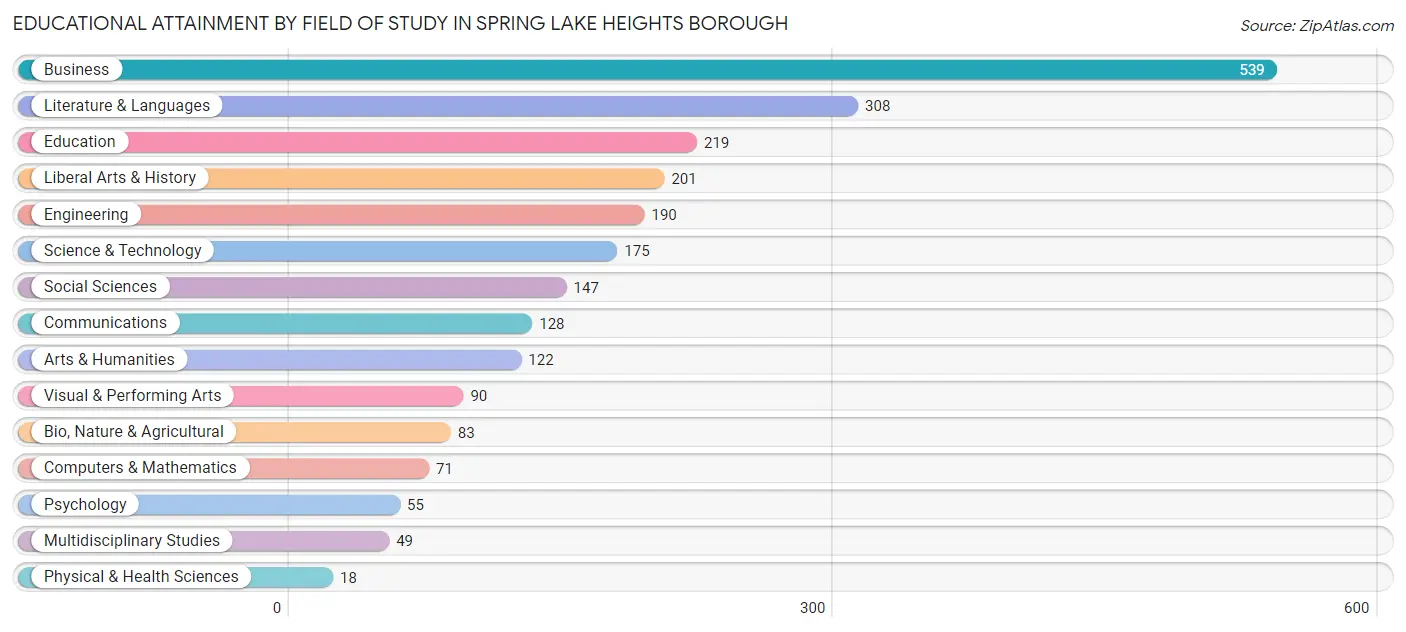
| Field of Study | # Graduates | % Graduates |
| Computers & Mathematics | 71 | 3.0% |
| Bio, Nature & Agricultural | 83 | 3.5% |
| Physical & Health Sciences | 18 | 0.7% |
| Psychology | 55 | 2.3% |
| Social Sciences | 147 | 6.1% |
| Engineering | 190 | 7.9% |
| Multidisciplinary Studies | 49 | 2.1% |
| Science & Technology | 175 | 7.3% |
| Business | 539 | 22.5% |
| Education | 219 | 9.1% |
| Literature & Languages | 308 | 12.9% |
| Liberal Arts & History | 201 | 8.4% |
| Visual & Performing Arts | 90 | 3.8% |
| Communications | 128 | 5.3% |
| Arts & Humanities | 122 | 5.1% |
| Total | 2,395 | 100.0% |
Transportation & Commute in Spring Lake Heights borough
Vehicle Availability by Sex in Spring Lake Heights borough
The most prevalent vehicle ownership categories in Spring Lake Heights borough are males with 2 vehicles (445, accounting for 37.0%) and females with 2 vehicles (448, making up 31.1%).
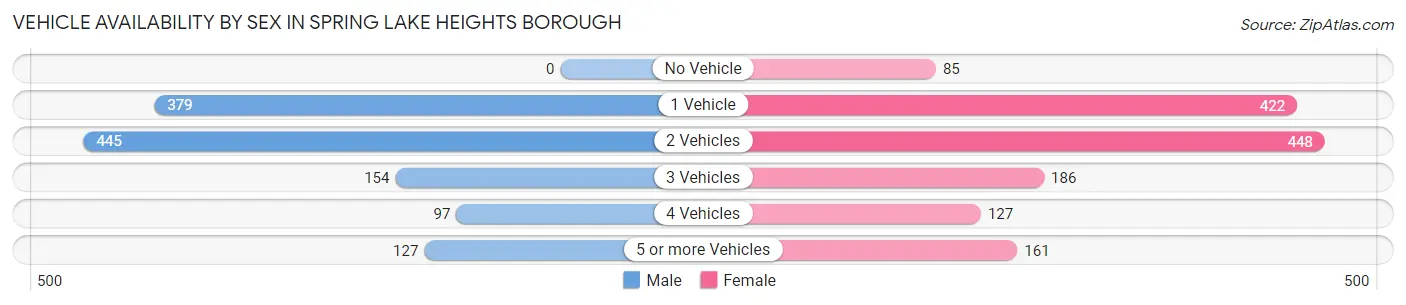
| Vehicles Available | Male | Female |
| No Vehicle | 0 (0.0%) | 85 (5.9%) |
| 1 Vehicle | 379 (31.5%) | 422 (29.5%) |
| 2 Vehicles | 445 (37.0%) | 448 (31.4%) |
| 3 Vehicles | 154 (12.8%) | 186 (13.0%) |
| 4 Vehicles | 97 (8.1%) | 127 (8.9%) |
| 5 or more Vehicles | 127 (10.6%) | 161 (11.3%) |
| Total | 1,202 (100.0%) | 1,429 (100.0%) |
Commute Time in Spring Lake Heights borough
The most frequently occuring commute durations in Spring Lake Heights borough are 5 to 9 minutes (366 commuters, 17.0%), 10 to 14 minutes (265 commuters, 12.3%), and 30 to 34 minutes (262 commuters, 12.2%).
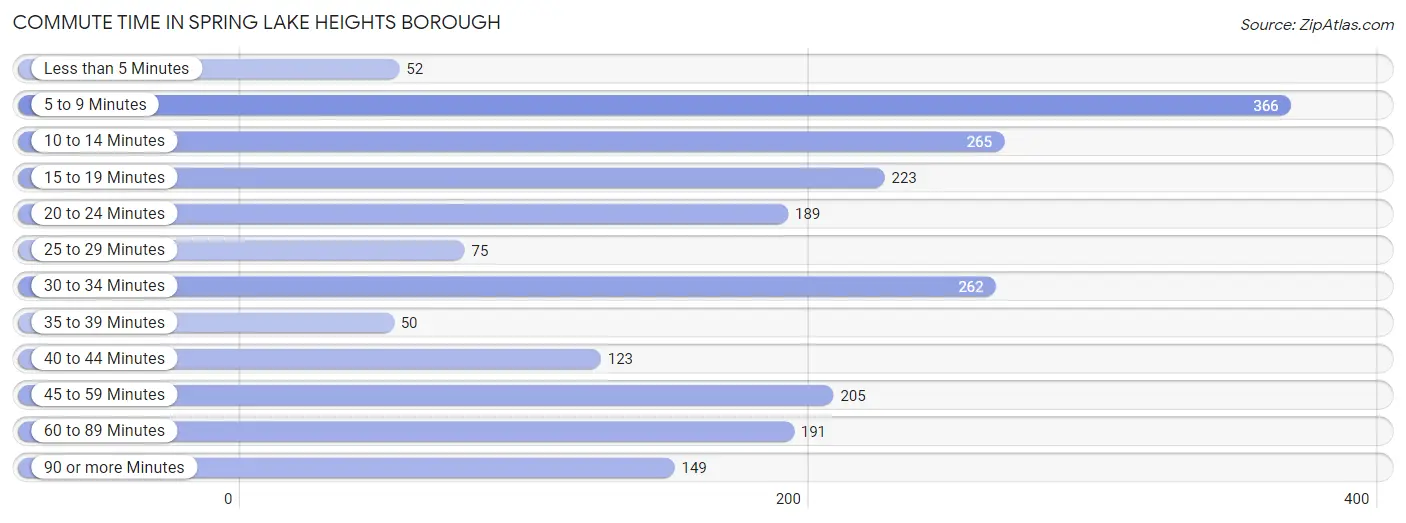
| Commute Time | # Commuters | % Commuters |
| Less than 5 Minutes | 52 | 2.4% |
| 5 to 9 Minutes | 366 | 17.0% |
| 10 to 14 Minutes | 265 | 12.3% |
| 15 to 19 Minutes | 223 | 10.4% |
| 20 to 24 Minutes | 189 | 8.8% |
| 25 to 29 Minutes | 75 | 3.5% |
| 30 to 34 Minutes | 262 | 12.2% |
| 35 to 39 Minutes | 50 | 2.3% |
| 40 to 44 Minutes | 123 | 5.7% |
| 45 to 59 Minutes | 205 | 9.5% |
| 60 to 89 Minutes | 191 | 8.9% |
| 90 or more Minutes | 149 | 6.9% |
Commute Time by Sex in Spring Lake Heights borough
The most common commute times in Spring Lake Heights borough are 5 to 9 minutes (147 commuters, 14.9%) for males and 5 to 9 minutes (219 commuters, 18.8%) for females.
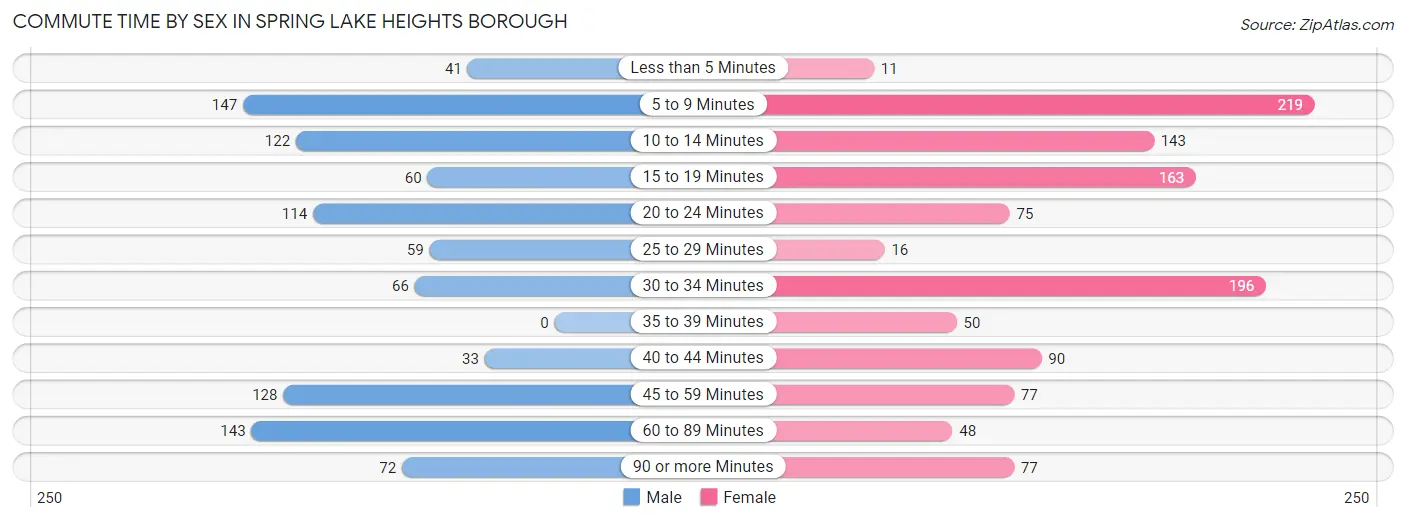
| Commute Time | Male | Female |
| Less than 5 Minutes | 41 (4.2%) | 11 (0.9%) |
| 5 to 9 Minutes | 147 (14.9%) | 219 (18.8%) |
| 10 to 14 Minutes | 122 (12.4%) | 143 (12.3%) |
| 15 to 19 Minutes | 60 (6.1%) | 163 (14.0%) |
| 20 to 24 Minutes | 114 (11.6%) | 75 (6.4%) |
| 25 to 29 Minutes | 59 (6.0%) | 16 (1.4%) |
| 30 to 34 Minutes | 66 (6.7%) | 196 (16.8%) |
| 35 to 39 Minutes | 0 (0.0%) | 50 (4.3%) |
| 40 to 44 Minutes | 33 (3.4%) | 90 (7.7%) |
| 45 to 59 Minutes | 128 (13.0%) | 77 (6.6%) |
| 60 to 89 Minutes | 143 (14.5%) | 48 (4.1%) |
| 90 or more Minutes | 72 (7.3%) | 77 (6.6%) |
Time of Departure to Work by Sex in Spring Lake Heights borough
The most frequent times of departure to work in Spring Lake Heights borough are 7:30 AM to 7:59 AM (170, 17.3%) for males and 8:00 AM to 8:29 AM (191, 16.4%) for females.
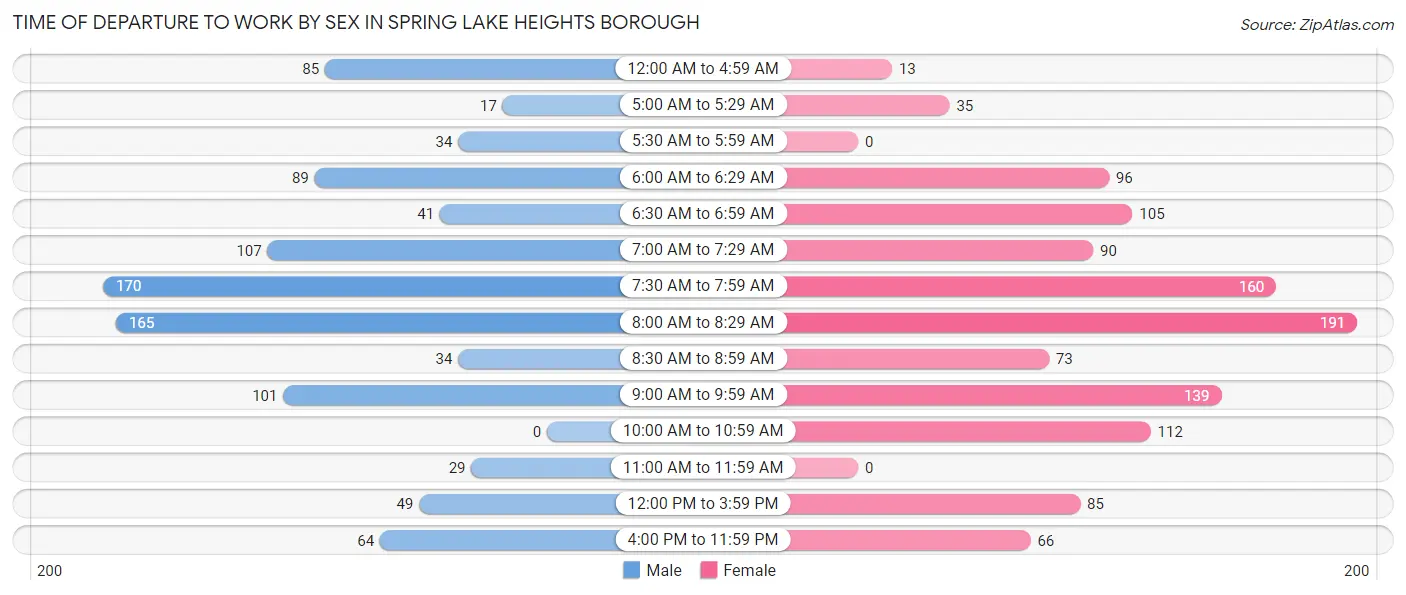
| Time of Departure | Male | Female |
| 12:00 AM to 4:59 AM | 85 (8.6%) | 13 (1.1%) |
| 5:00 AM to 5:29 AM | 17 (1.7%) | 35 (3.0%) |
| 5:30 AM to 5:59 AM | 34 (3.5%) | 0 (0.0%) |
| 6:00 AM to 6:29 AM | 89 (9.0%) | 96 (8.2%) |
| 6:30 AM to 6:59 AM | 41 (4.2%) | 105 (9.0%) |
| 7:00 AM to 7:29 AM | 107 (10.9%) | 90 (7.7%) |
| 7:30 AM to 7:59 AM | 170 (17.3%) | 160 (13.7%) |
| 8:00 AM to 8:29 AM | 165 (16.8%) | 191 (16.4%) |
| 8:30 AM to 8:59 AM | 34 (3.5%) | 73 (6.3%) |
| 9:00 AM to 9:59 AM | 101 (10.2%) | 139 (11.9%) |
| 10:00 AM to 10:59 AM | 0 (0.0%) | 112 (9.6%) |
| 11:00 AM to 11:59 AM | 29 (2.9%) | 0 (0.0%) |
| 12:00 PM to 3:59 PM | 49 (5.0%) | 85 (7.3%) |
| 4:00 PM to 11:59 PM | 64 (6.5%) | 66 (5.7%) |
| Total | 985 (100.0%) | 1,165 (100.0%) |
Housing Occupancy in Spring Lake Heights borough
Occupancy by Ownership in Spring Lake Heights borough
Of the total 2,414 dwellings in Spring Lake Heights borough, owner-occupied units account for 1,503 (62.3%), while renter-occupied units make up 911 (37.7%).
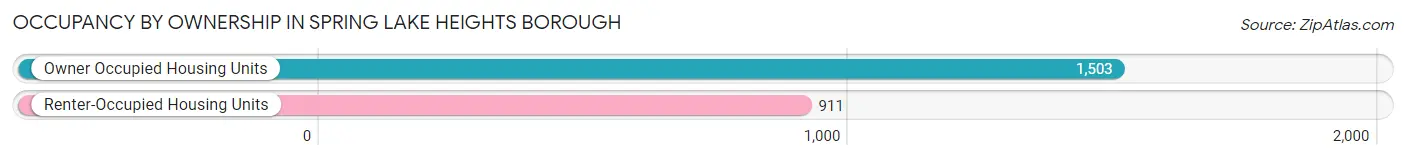
| Occupancy | # Housing Units | % Housing Units |
| Owner Occupied Housing Units | 1,503 | 62.3% |
| Renter-Occupied Housing Units | 911 | 37.7% |
| Total Occupied Housing Units | 2,414 | 100.0% |
Occupancy by Household Size in Spring Lake Heights borough
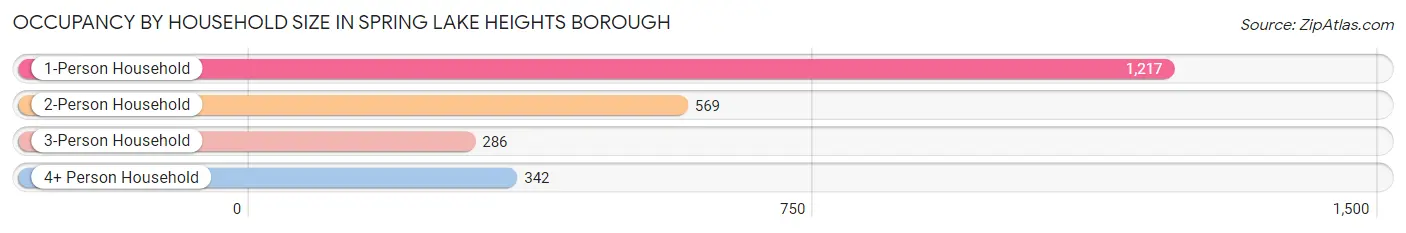
| Household Size | # Housing Units | % Housing Units |
| 1-Person Household | 1,217 | 50.4% |
| 2-Person Household | 569 | 23.6% |
| 3-Person Household | 286 | 11.8% |
| 4+ Person Household | 342 | 14.2% |
| Total Housing Units | 2,414 | 100.0% |
Occupancy by Ownership by Household Size in Spring Lake Heights borough
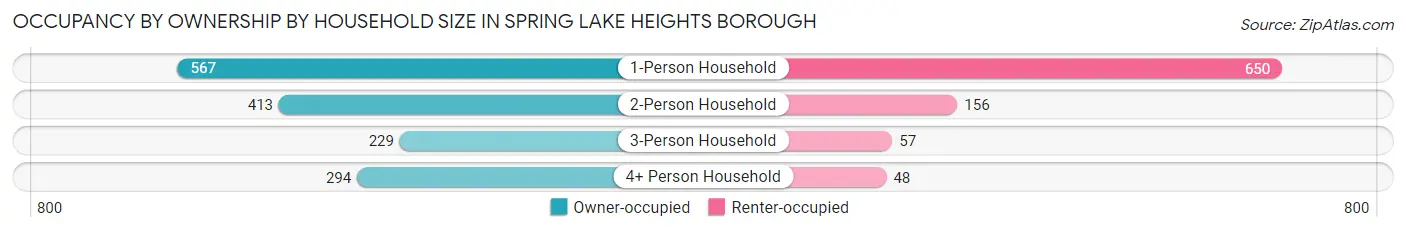
| Household Size | Owner-occupied | Renter-occupied |
| 1-Person Household | 567 (46.6%) | 650 (53.4%) |
| 2-Person Household | 413 (72.6%) | 156 (27.4%) |
| 3-Person Household | 229 (80.1%) | 57 (19.9%) |
| 4+ Person Household | 294 (86.0%) | 48 (14.0%) |
| Total Housing Units | 1,503 (62.3%) | 911 (37.7%) |
Occupancy by Educational Attainment in Spring Lake Heights borough
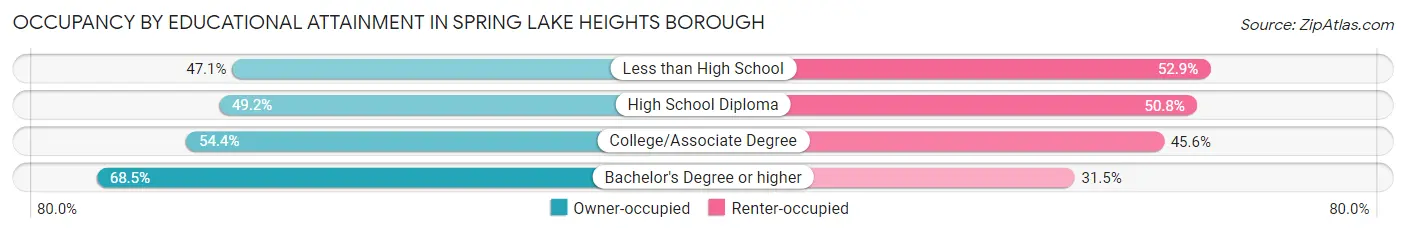
| Household Size | Owner-occupied | Renter-occupied |
| Less than High School | 16 (47.1%) | 18 (52.9%) |
| High School Diploma | 178 (49.2%) | 184 (50.8%) |
| College/Associate Degree | 285 (54.4%) | 239 (45.6%) |
| Bachelor's Degree or higher | 1,024 (68.5%) | 470 (31.5%) |
Occupancy by Age of Householder in Spring Lake Heights borough
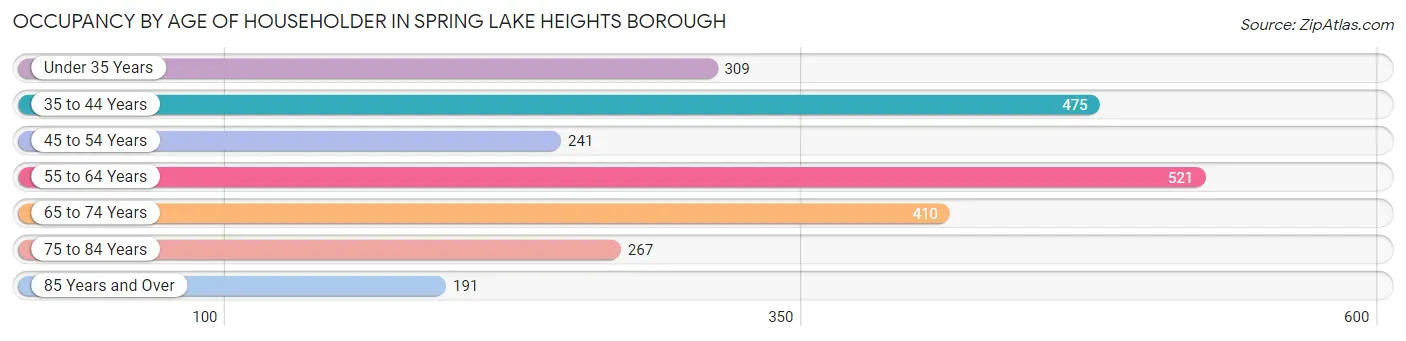
| Age Bracket | # Households | % Households |
| Under 35 Years | 309 | 12.8% |
| 35 to 44 Years | 475 | 19.7% |
| 45 to 54 Years | 241 | 10.0% |
| 55 to 64 Years | 521 | 21.6% |
| 65 to 74 Years | 410 | 17.0% |
| 75 to 84 Years | 267 | 11.1% |
| 85 Years and Over | 191 | 7.9% |
| Total | 2,414 | 100.0% |
Housing Finances in Spring Lake Heights borough
Median Income by Occupancy in Spring Lake Heights borough
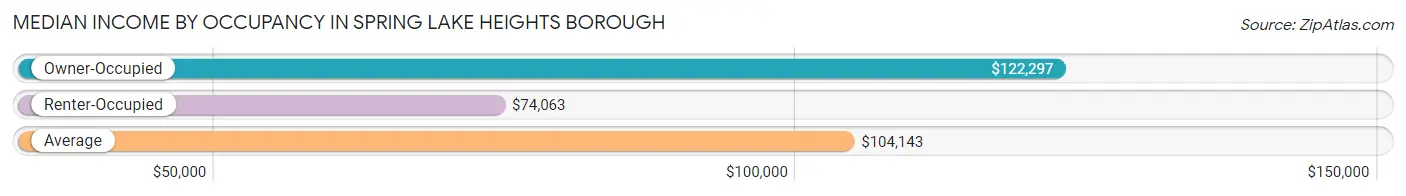
| Occupancy Type | # Households | Median Income |
| Owner-Occupied | 1,503 (62.3%) | $122,297 |
| Renter-Occupied | 911 (37.7%) | $74,063 |
| Average | 2,414 (100.0%) | $104,143 |
Occupancy by Householder Income Bracket in Spring Lake Heights borough
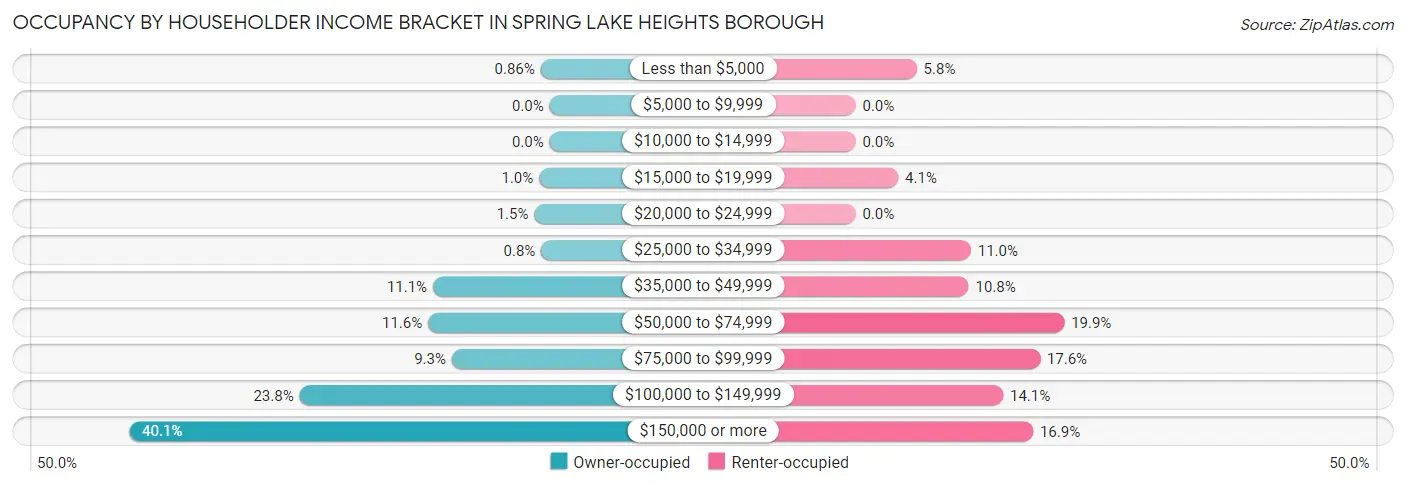
| Income Bracket | Owner-occupied | Renter-occupied |
| Less than $5,000 | 13 (0.9%) | 53 (5.8%) |
| $5,000 to $9,999 | 0 (0.0%) | 0 (0.0%) |
| $10,000 to $14,999 | 0 (0.0%) | 0 (0.0%) |
| $15,000 to $19,999 | 15 (1.0%) | 37 (4.1%) |
| $20,000 to $24,999 | 22 (1.5%) | 0 (0.0%) |
| $25,000 to $34,999 | 12 (0.8%) | 100 (11.0%) |
| $35,000 to $49,999 | 167 (11.1%) | 98 (10.8%) |
| $50,000 to $74,999 | 174 (11.6%) | 181 (19.9%) |
| $75,000 to $99,999 | 140 (9.3%) | 160 (17.6%) |
| $100,000 to $149,999 | 358 (23.8%) | 128 (14.1%) |
| $150,000 or more | 602 (40.1%) | 154 (16.9%) |
| Total | 1,503 (100.0%) | 911 (100.0%) |
Monthly Housing Cost Tiers in Spring Lake Heights borough
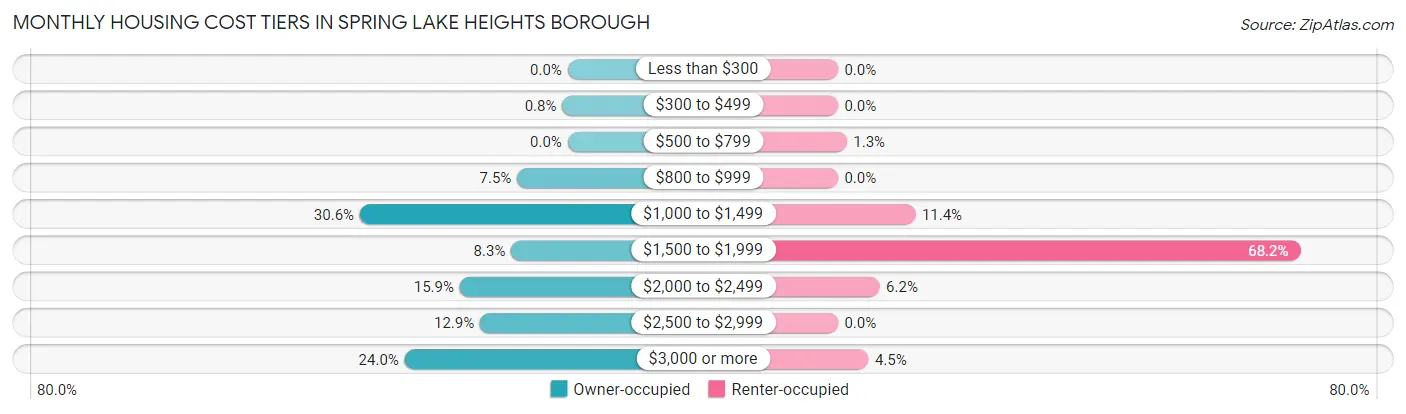
| Monthly Cost | Owner-occupied | Renter-occupied |
| Less than $300 | 0 (0.0%) | 0 (0.0%) |
| $300 to $499 | 12 (0.8%) | 0 (0.0%) |
| $500 to $799 | 0 (0.0%) | 12 (1.3%) |
| $800 to $999 | 112 (7.4%) | 0 (0.0%) |
| $1,000 to $1,499 | 460 (30.6%) | 104 (11.4%) |
| $1,500 to $1,999 | 125 (8.3%) | 621 (68.2%) |
| $2,000 to $2,499 | 239 (15.9%) | 56 (6.1%) |
| $2,500 to $2,999 | 194 (12.9%) | 0 (0.0%) |
| $3,000 or more | 361 (24.0%) | 41 (4.5%) |
| Total | 1,503 (100.0%) | 911 (100.0%) |
Physical Housing Characteristics in Spring Lake Heights borough
Housing Structures in Spring Lake Heights borough
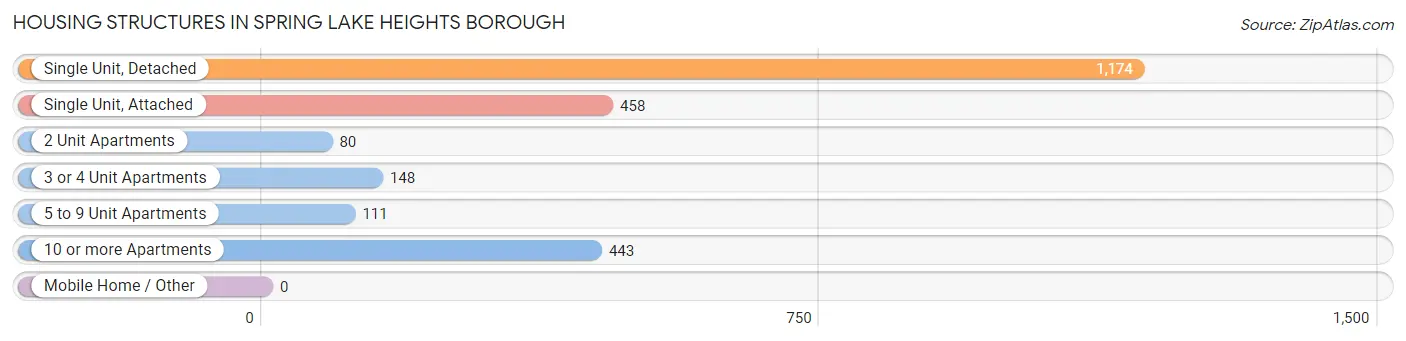
| Structure Type | # Housing Units | % Housing Units |
| Single Unit, Detached | 1,174 | 48.6% |
| Single Unit, Attached | 458 | 19.0% |
| 2 Unit Apartments | 80 | 3.3% |
| 3 or 4 Unit Apartments | 148 | 6.1% |
| 5 to 9 Unit Apartments | 111 | 4.6% |
| 10 or more Apartments | 443 | 18.3% |
| Mobile Home / Other | 0 | 0.0% |
| Total | 2,414 | 100.0% |
Housing Structures by Occupancy in Spring Lake Heights borough
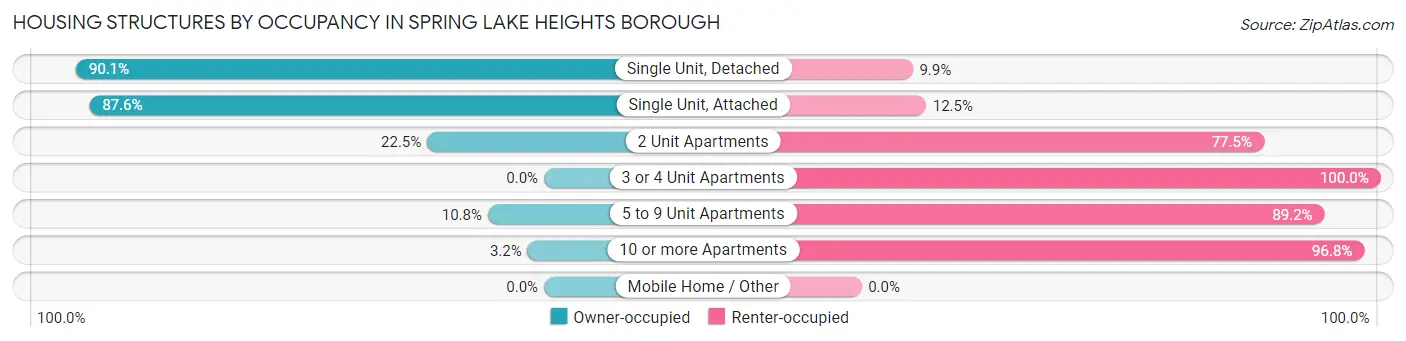
| Structure Type | Owner-occupied | Renter-occupied |
| Single Unit, Detached | 1,058 (90.1%) | 116 (9.9%) |
| Single Unit, Attached | 401 (87.5%) | 57 (12.4%) |
| 2 Unit Apartments | 18 (22.5%) | 62 (77.5%) |
| 3 or 4 Unit Apartments | 0 (0.0%) | 148 (100.0%) |
| 5 to 9 Unit Apartments | 12 (10.8%) | 99 (89.2%) |
| 10 or more Apartments | 14 (3.2%) | 429 (96.8%) |
| Mobile Home / Other | 0 (0.0%) | 0 (0.0%) |
| Total | 1,503 (62.3%) | 911 (37.7%) |
Housing Structures by Number of Rooms in Spring Lake Heights borough
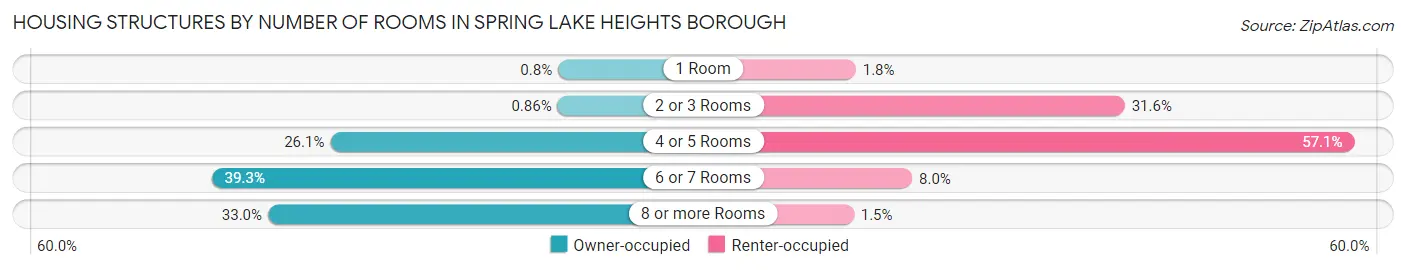
| Number of Rooms | Owner-occupied | Renter-occupied |
| 1 Room | 12 (0.8%) | 16 (1.8%) |
| 2 or 3 Rooms | 13 (0.9%) | 288 (31.6%) |
| 4 or 5 Rooms | 392 (26.1%) | 520 (57.1%) |
| 6 or 7 Rooms | 590 (39.3%) | 73 (8.0%) |
| 8 or more Rooms | 496 (33.0%) | 14 (1.5%) |
| Total | 1,503 (100.0%) | 911 (100.0%) |
Housing Structure by Heating Type in Spring Lake Heights borough
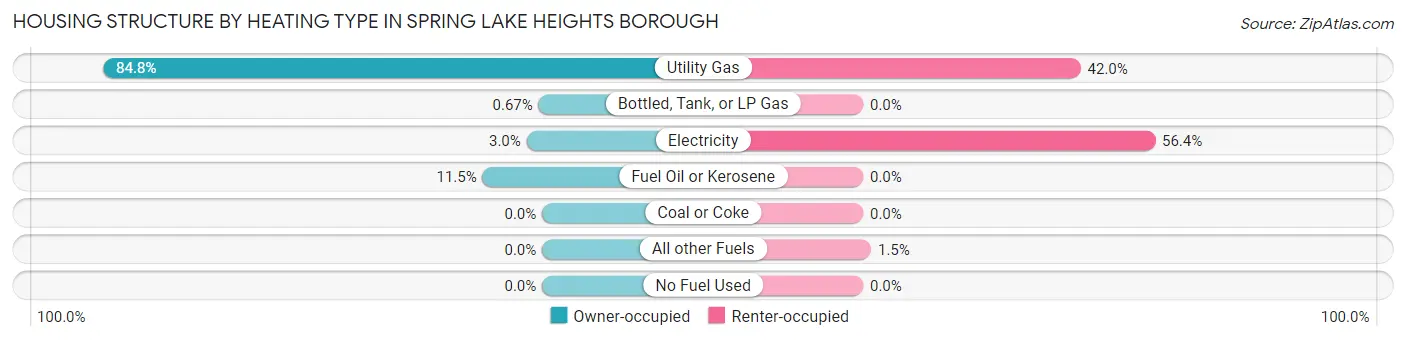
| Heating Type | Owner-occupied | Renter-occupied |
| Utility Gas | 1,275 (84.8%) | 383 (42.0%) |
| Bottled, Tank, or LP Gas | 10 (0.7%) | 0 (0.0%) |
| Electricity | 45 (3.0%) | 514 (56.4%) |
| Fuel Oil or Kerosene | 173 (11.5%) | 0 (0.0%) |
| Coal or Coke | 0 (0.0%) | 0 (0.0%) |
| All other Fuels | 0 (0.0%) | 14 (1.5%) |
| No Fuel Used | 0 (0.0%) | 0 (0.0%) |
| Total | 1,503 (100.0%) | 911 (100.0%) |
Household Vehicle Usage in Spring Lake Heights borough
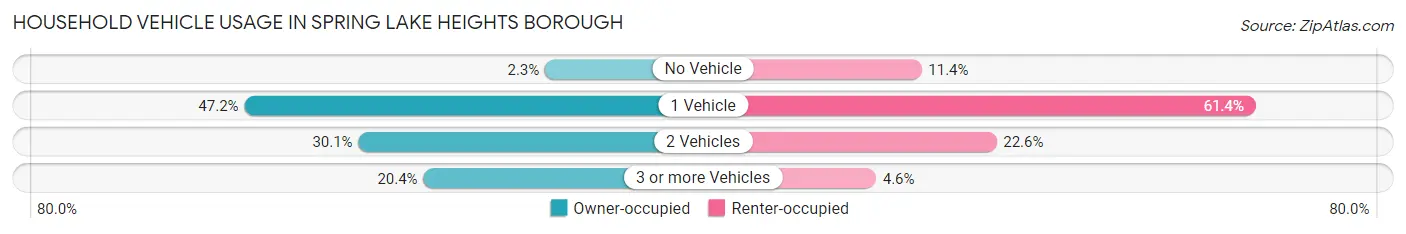
| Vehicles per Household | Owner-occupied | Renter-occupied |
| No Vehicle | 34 (2.3%) | 104 (11.4%) |
| 1 Vehicle | 709 (47.2%) | 559 (61.4%) |
| 2 Vehicles | 453 (30.1%) | 206 (22.6%) |
| 3 or more Vehicles | 307 (20.4%) | 42 (4.6%) |
| Total | 1,503 (100.0%) | 911 (100.0%) |
Real Estate & Mortgages in Spring Lake Heights borough
Real Estate and Mortgage Overview in Spring Lake Heights borough
| Characteristic | Without Mortgage | With Mortgage |
| Housing Units | 618 | 885 |
| Median Property Value | $607,300 | $620,400 |
| Median Household Income | $111,065 | $432 |
| Monthly Housing Costs | $1,213 | $361 |
| Real Estate Taxes | $8,142 | $0 |
Property Value by Mortgage Status in Spring Lake Heights borough
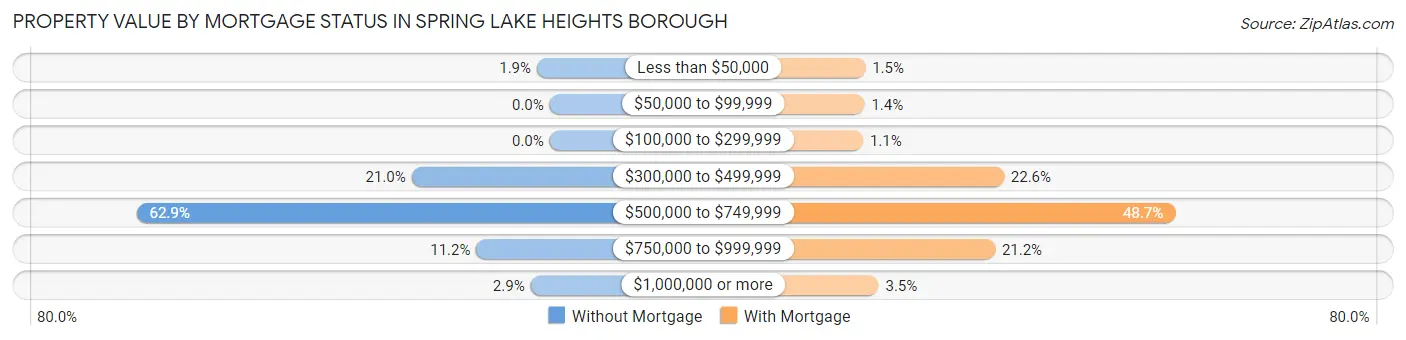
| Property Value | Without Mortgage | With Mortgage |
| Less than $50,000 | 12 (1.9%) | 13 (1.5%) |
| $50,000 to $99,999 | 0 (0.0%) | 12 (1.4%) |
| $100,000 to $299,999 | 0 (0.0%) | 10 (1.1%) |
| $300,000 to $499,999 | 130 (21.0%) | 200 (22.6%) |
| $500,000 to $749,999 | 389 (62.9%) | 431 (48.7%) |
| $750,000 to $999,999 | 69 (11.2%) | 188 (21.2%) |
| $1,000,000 or more | 18 (2.9%) | 31 (3.5%) |
| Total | 618 (100.0%) | 885 (100.0%) |
Household Income by Mortgage Status in Spring Lake Heights borough
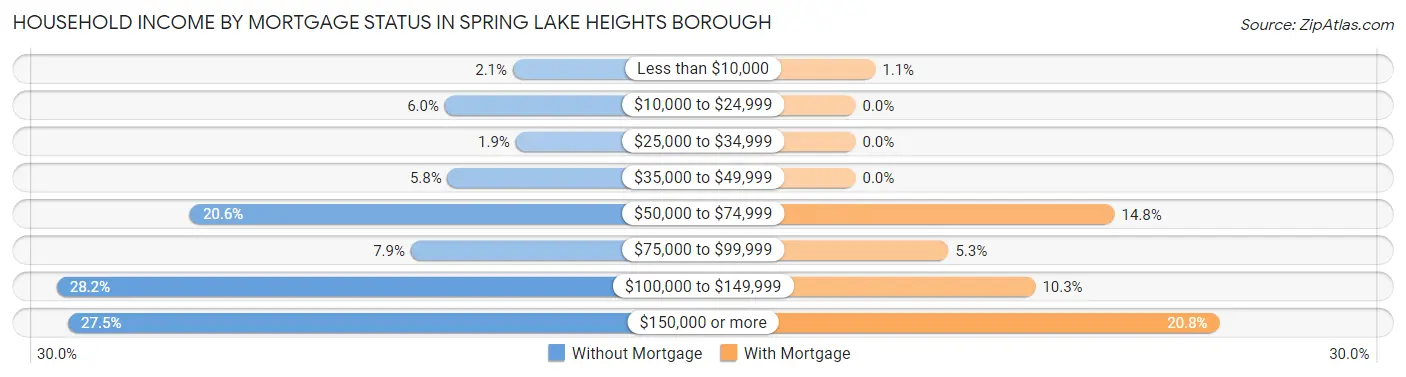
| Household Income | Without Mortgage | With Mortgage |
| Less than $10,000 | 13 (2.1%) | 10 (1.1%) |
| $10,000 to $24,999 | 37 (6.0%) | 0 (0.0%) |
| $25,000 to $34,999 | 12 (1.9%) | 0 (0.0%) |
| $35,000 to $49,999 | 36 (5.8%) | 0 (0.0%) |
| $50,000 to $74,999 | 127 (20.5%) | 131 (14.8%) |
| $75,000 to $99,999 | 49 (7.9%) | 47 (5.3%) |
| $100,000 to $149,999 | 174 (28.2%) | 91 (10.3%) |
| $150,000 or more | 170 (27.5%) | 184 (20.8%) |
| Total | 618 (100.0%) | 885 (100.0%) |
Property Value to Household Income Ratio in Spring Lake Heights borough
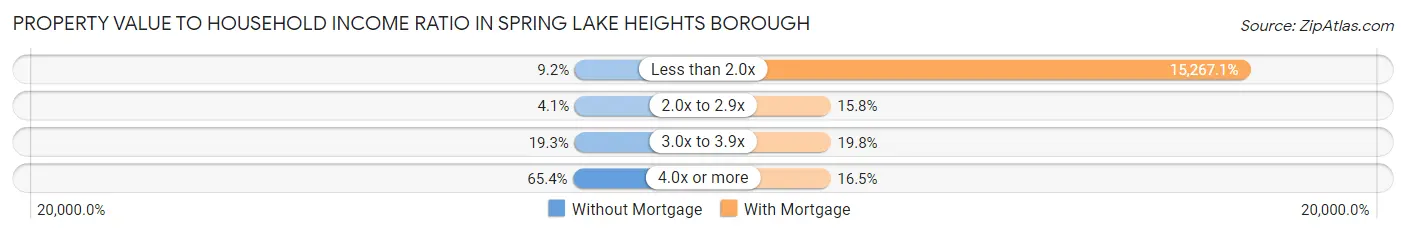
| Value-to-Income Ratio | Without Mortgage | With Mortgage |
| Less than 2.0x | 57 (9.2%) | 135,114 (15,267.1%) |
| 2.0x to 2.9x | 25 (4.1%) | 140 (15.8%) |
| 3.0x to 3.9x | 119 (19.3%) | 175 (19.8%) |
| 4.0x or more | 404 (65.4%) | 146 (16.5%) |
| Total | 618 (100.0%) | 885 (100.0%) |
Real Estate Taxes by Mortgage Status in Spring Lake Heights borough
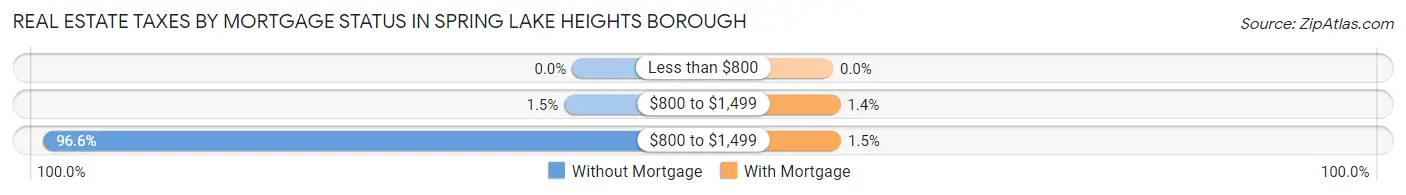
| Property Taxes | Without Mortgage | With Mortgage |
| Less than $800 | 0 (0.0%) | 0 (0.0%) |
| $800 to $1,499 | 9 (1.5%) | 12 (1.4%) |
| $800 to $1,499 | 597 (96.6%) | 13 (1.5%) |
| Total | 618 (100.0%) | 885 (100.0%) |
Health & Disability in Spring Lake Heights borough
Health Insurance Coverage by Age in Spring Lake Heights borough
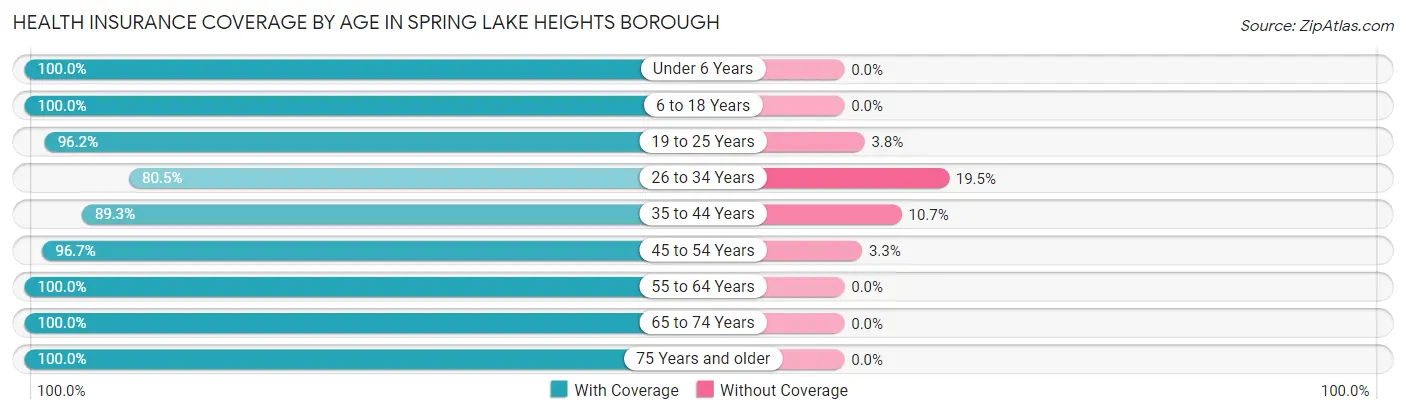
| Age Bracket | With Coverage | Without Coverage |
| Under 6 Years | 320 (100.0%) | 0 (0.0%) |
| 6 to 18 Years | 491 (100.0%) | 0 (0.0%) |
| 19 to 25 Years | 409 (96.2%) | 16 (3.8%) |
| 26 to 34 Years | 372 (80.5%) | 90 (19.5%) |
| 35 to 44 Years | 653 (89.3%) | 78 (10.7%) |
| 45 to 54 Years | 381 (96.7%) | 13 (3.3%) |
| 55 to 64 Years | 886 (100.0%) | 0 (0.0%) |
| 65 to 74 Years | 602 (100.0%) | 0 (0.0%) |
| 75 Years and older | 553 (100.0%) | 0 (0.0%) |
| Total | 4,667 (96.0%) | 197 (4.1%) |
Health Insurance Coverage by Citizenship Status in Spring Lake Heights borough
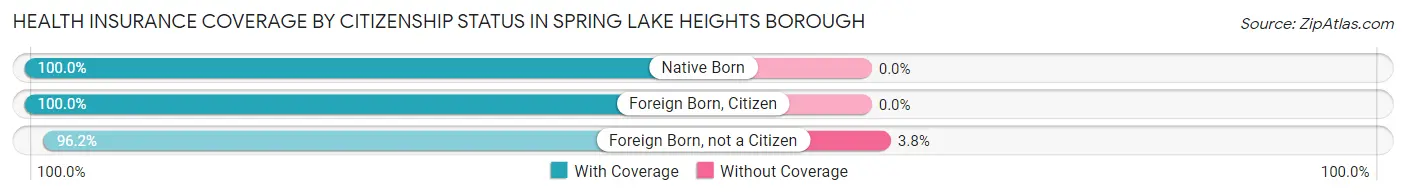
| Citizenship Status | With Coverage | Without Coverage |
| Native Born | 320 (100.0%) | 0 (0.0%) |
| Foreign Born, Citizen | 491 (100.0%) | 0 (0.0%) |
| Foreign Born, not a Citizen | 409 (96.2%) | 16 (3.8%) |
Health Insurance Coverage by Household Income in Spring Lake Heights borough
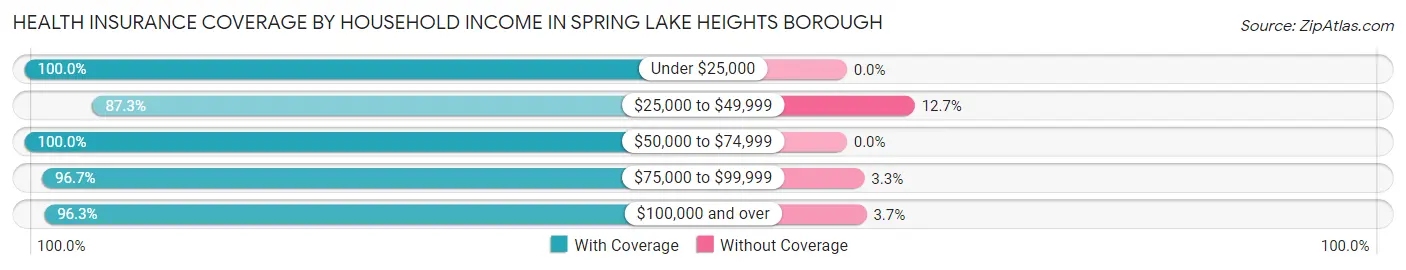
| Household Income | With Coverage | Without Coverage |
| Under $25,000 | 161 (100.0%) | 0 (0.0%) |
| $25,000 to $49,999 | 405 (87.3%) | 59 (12.7%) |
| $50,000 to $74,999 | 447 (100.0%) | 0 (0.0%) |
| $75,000 to $99,999 | 381 (96.7%) | 13 (3.3%) |
| $100,000 and over | 3,273 (96.3%) | 125 (3.7%) |
Public vs Private Health Insurance Coverage by Age in Spring Lake Heights borough
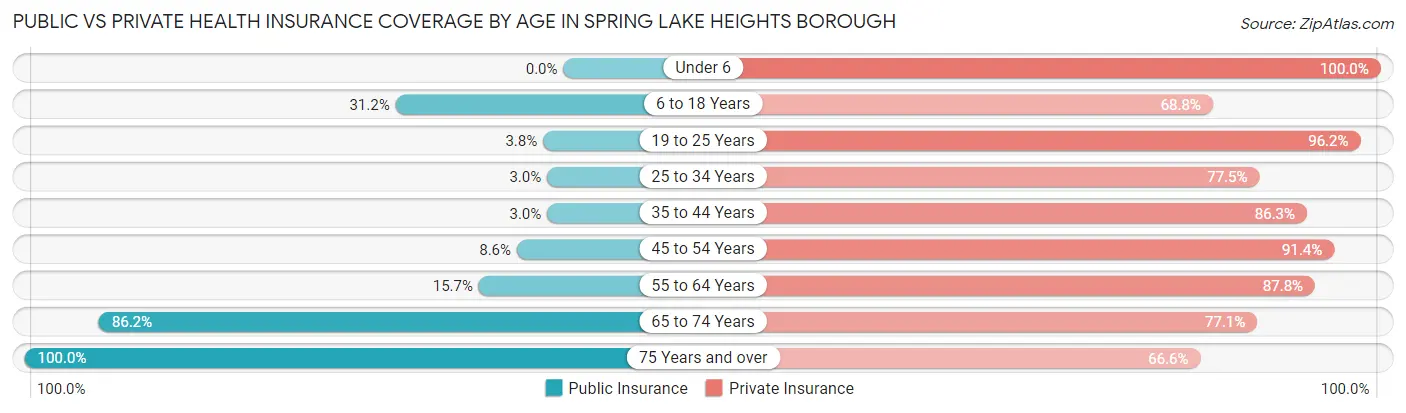
| Age Bracket | Public Insurance | Private Insurance |
| Under 6 | 0 (0.0%) | 320 (100.0%) |
| 6 to 18 Years | 153 (31.2%) | 338 (68.8%) |
| 19 to 25 Years | 16 (3.8%) | 409 (96.2%) |
| 25 to 34 Years | 14 (3.0%) | 358 (77.5%) |
| 35 to 44 Years | 22 (3.0%) | 631 (86.3%) |
| 45 to 54 Years | 34 (8.6%) | 360 (91.4%) |
| 55 to 64 Years | 139 (15.7%) | 778 (87.8%) |
| 65 to 74 Years | 519 (86.2%) | 464 (77.1%) |
| 75 Years and over | 553 (100.0%) | 368 (66.5%) |
| Total | 1,450 (29.8%) | 4,026 (82.8%) |
Disability Status by Sex by Age in Spring Lake Heights borough
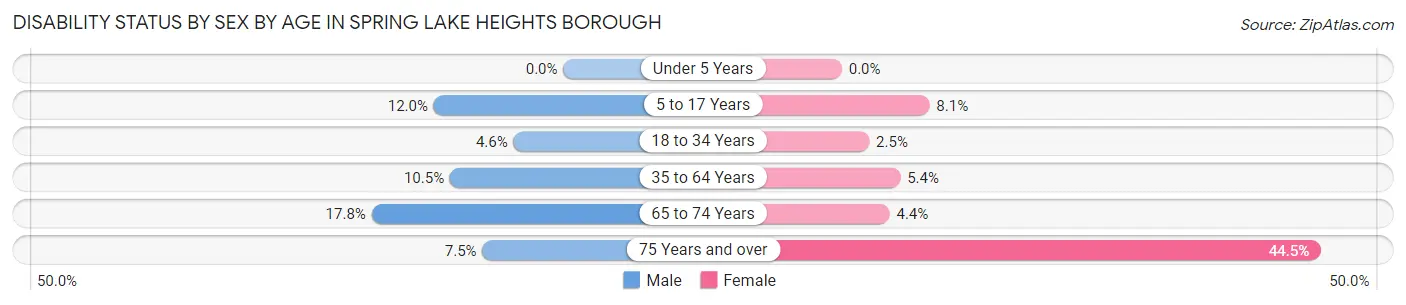
| Age Bracket | Male | Female |
| Under 5 Years | 0 (0.0%) | 0 (0.0%) |
| 5 to 17 Years | 31 (12.0%) | 20 (8.1%) |
| 18 to 34 Years | 16 (4.6%) | 15 (2.5%) |
| 35 to 64 Years | 101 (10.5%) | 57 (5.4%) |
| 65 to 74 Years | 71 (17.8%) | 9 (4.4%) |
| 75 Years and over | 13 (7.5%) | 169 (44.5%) |
Disability Class by Sex by Age in Spring Lake Heights borough
Disability Class: Hearing Difficulty
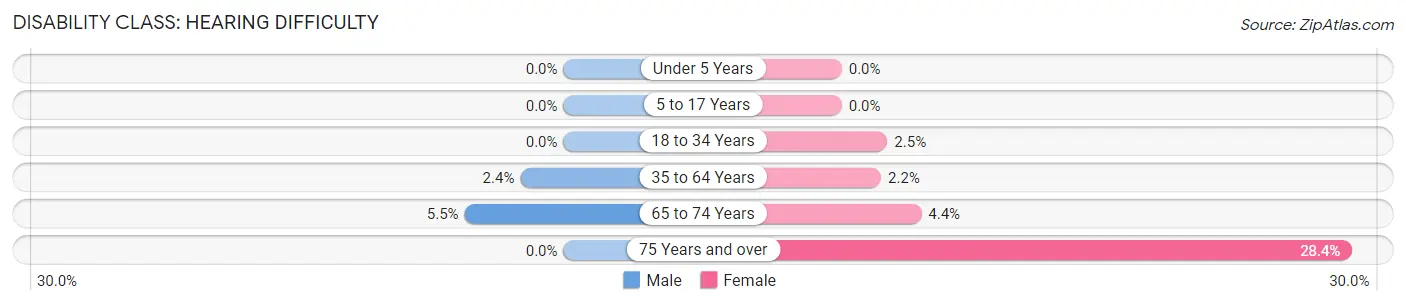
| Age Bracket | Male | Female |
| Under 5 Years | 0 (0.0%) | 0 (0.0%) |
| 5 to 17 Years | 0 (0.0%) | 0 (0.0%) |
| 18 to 34 Years | 0 (0.0%) | 15 (2.5%) |
| 35 to 64 Years | 23 (2.4%) | 23 (2.2%) |
| 65 to 74 Years | 22 (5.5%) | 9 (4.4%) |
| 75 Years and over | 0 (0.0%) | 108 (28.4%) |
Disability Class: Vision Difficulty
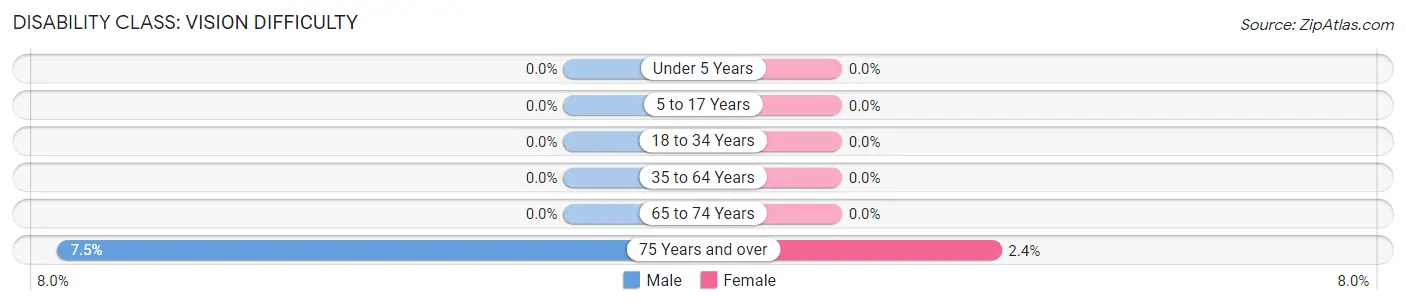
| Age Bracket | Male | Female |
| Under 5 Years | 0 (0.0%) | 0 (0.0%) |
| 5 to 17 Years | 0 (0.0%) | 0 (0.0%) |
| 18 to 34 Years | 0 (0.0%) | 0 (0.0%) |
| 35 to 64 Years | 0 (0.0%) | 0 (0.0%) |
| 65 to 74 Years | 0 (0.0%) | 0 (0.0%) |
| 75 Years and over | 13 (7.5%) | 9 (2.4%) |
Disability Class: Cognitive Difficulty
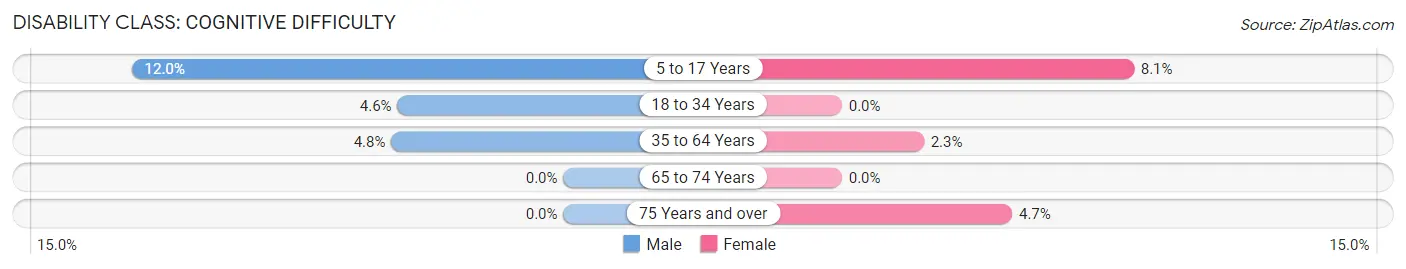
| Age Bracket | Male | Female |
| 5 to 17 Years | 31 (12.0%) | 20 (8.1%) |
| 18 to 34 Years | 16 (4.6%) | 0 (0.0%) |
| 35 to 64 Years | 46 (4.8%) | 24 (2.3%) |
| 65 to 74 Years | 0 (0.0%) | 0 (0.0%) |
| 75 Years and over | 0 (0.0%) | 18 (4.7%) |
Disability Class: Ambulatory Difficulty
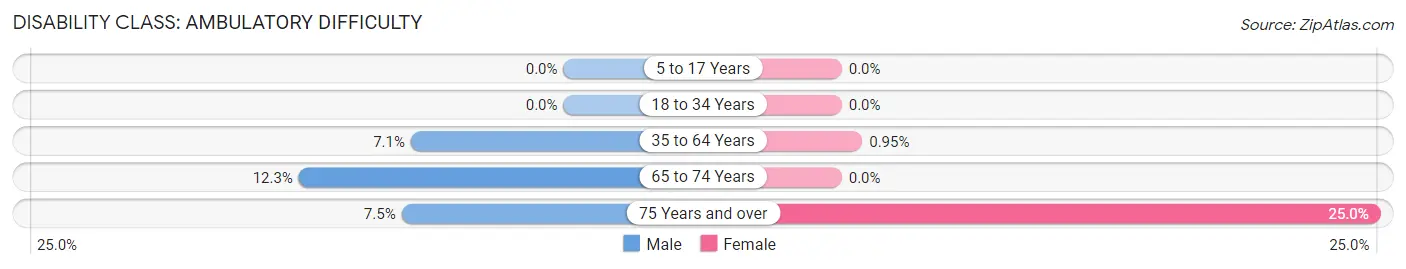
| Age Bracket | Male | Female |
| 5 to 17 Years | 0 (0.0%) | 0 (0.0%) |
| 18 to 34 Years | 0 (0.0%) | 0 (0.0%) |
| 35 to 64 Years | 68 (7.1%) | 10 (0.9%) |
| 65 to 74 Years | 49 (12.3%) | 0 (0.0%) |
| 75 Years and over | 13 (7.5%) | 95 (25.0%) |
Disability Class: Self-Care Difficulty
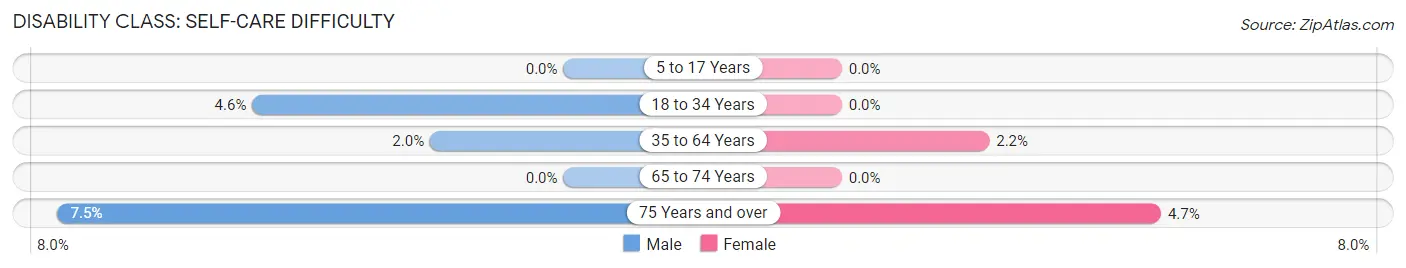
| Age Bracket | Male | Female |
| 5 to 17 Years | 0 (0.0%) | 0 (0.0%) |
| 18 to 34 Years | 16 (4.6%) | 0 (0.0%) |
| 35 to 64 Years | 19 (2.0%) | 23 (2.2%) |
| 65 to 74 Years | 0 (0.0%) | 0 (0.0%) |
| 75 Years and over | 13 (7.5%) | 18 (4.7%) |
Technology Access in Spring Lake Heights borough
Computing Device Access in Spring Lake Heights borough
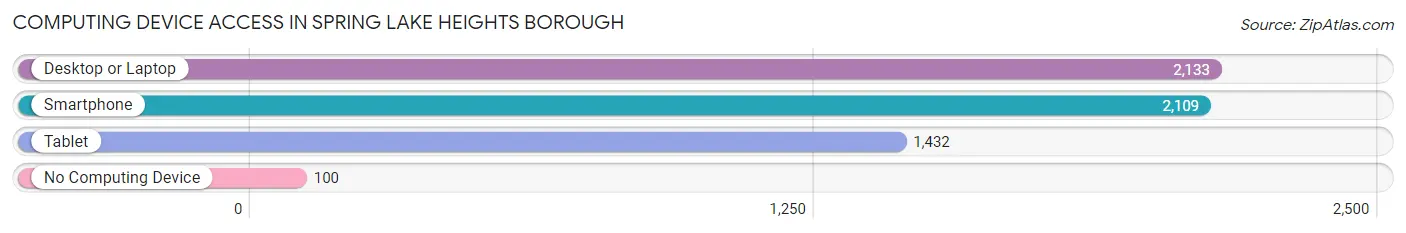
| Device Type | # Households | % Households |
| Desktop or Laptop | 2,133 | 88.4% |
| Smartphone | 2,109 | 87.4% |
| Tablet | 1,432 | 59.3% |
| No Computing Device | 100 | 4.1% |
| Total | 2,414 | 100.0% |
Internet Access in Spring Lake Heights borough
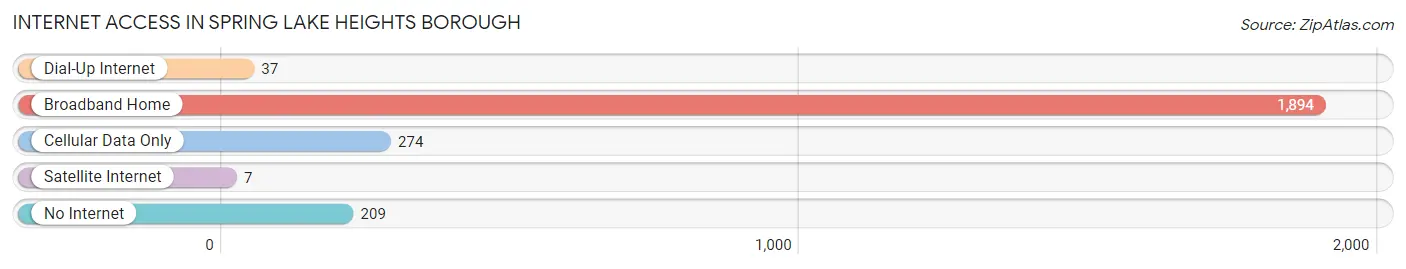
| Internet Type | # Households | % Households |
| Dial-Up Internet | 37 | 1.5% |
| Broadband Home | 1,894 | 78.5% |
| Cellular Data Only | 274 | 11.4% |
| Satellite Internet | 7 | 0.3% |
| No Internet | 209 | 8.7% |
| Total | 2,414 | 100.0% |
Spring Lake Heights borough Summary
Introduction
Spring Lake Heights Borough is a small borough located in Monmouth County, New Jersey. It is situated on the Atlantic Ocean, just south of the borough of Spring Lake. The borough is a popular summer destination for tourists and locals alike, and is known for its beautiful beaches and quaint downtown area.
History
The area that is now Spring Lake Heights Borough was originally inhabited by the Lenape Native Americans. The first European settlers arrived in the area in the late 1700s, and the area was officially incorporated as a borough in 1925.
The borough was originally known as the “Heights” due to its location on a hill overlooking the ocean. The name was changed to Spring Lake Heights in 1927, when the borough was annexed to the borough of Spring Lake.
The borough experienced a period of growth in the 1950s and 1960s, as many people moved to the area to take advantage of the area’s beaches and other attractions. The borough has since become a popular summer destination for tourists and locals alike.
Geography
Spring Lake Heights Borough is located in Monmouth County, New Jersey. It is situated on the Atlantic Ocean, just south of the borough of Spring Lake. The borough is bordered by the boroughs of Belmar, Lake Como, and Sea Girt.
The borough has a total area of 1.3 square miles, all of which is land. The borough is located at an elevation of approximately 30 feet above sea level.
The borough is home to several parks and recreational areas, including the Spring Lake Heights Beach, the Spring Lake Heights Recreation Center, and the Spring Lake Heights Nature Preserve.
Economy
The economy of Spring Lake Heights Borough is largely based on tourism. The borough is a popular summer destination for tourists and locals alike, and is known for its beautiful beaches and quaint downtown area.
The borough is also home to several businesses, including restaurants, retail stores, and professional services. The borough is also home to several manufacturing companies, including a plastics manufacturer and a metal fabrication company.
Demographics
As of the 2010 census, the population of Spring Lake Heights Borough was 3,993. The racial makeup of the borough was 94.3% White, 2.2% African American, 0.3% Native American, 1.2% Asian, 0.1% Pacific Islander, 0.7% from other races, and 1.3% from two or more races. Hispanic or Latino of any race were 3.2% of the population.
The median household income in the borough was $76,944, and the median family income was $90,917. The per capita income for the borough was $37,945. About 4.2% of families and 5.3% of the population were below the poverty line, including 6.2% of those under age 18 and 4.2% of those age 65 or over.
Conclusion
Spring Lake Heights Borough is a small borough located in Monmouth County, New Jersey. It is situated on the Atlantic Ocean, just south of the borough of Spring Lake. The borough is a popular summer destination for tourists and locals alike, and is known for its beautiful beaches and quaint downtown area. The economy of the borough is largely based on tourism, and the population of the borough was 3,993 as of the 2010 census.
Common Questions
What is Per Capita Income in Spring Lake Heights borough?
Per Capita income in Spring Lake Heights borough is $67,332.
What is the Median Family Income in Spring Lake Heights borough?
Median Family Income in Spring Lake Heights borough is $154,625.
What is the Median Household income in Spring Lake Heights borough?
Median Household Income in Spring Lake Heights borough is $104,143.
What is Income or Wage Gap in Spring Lake Heights borough?
Income or Wage Gap in Spring Lake Heights borough is 48.4%.
Women in Spring Lake Heights borough earn 51.6 cents for every dollar earned by a man.
What is Inequality or Gini Index in Spring Lake Heights borough?
Inequality or Gini Index in Spring Lake Heights borough is 0.43.
What is the Total Population of Spring Lake Heights borough?
Total Population of Spring Lake Heights borough is 4,864.
What is the Total Male Population of Spring Lake Heights borough?
Total Male Population of Spring Lake Heights borough is 2,205.
What is the Total Female Population of Spring Lake Heights borough?
Total Female Population of Spring Lake Heights borough is 2,659.
What is the Ratio of Males per 100 Females in Spring Lake Heights borough?
There are 82.93 Males per 100 Females in Spring Lake Heights borough.
What is the Ratio of Females per 100 Males in Spring Lake Heights borough?
There are 120.59 Females per 100 Males in Spring Lake Heights borough.
What is the Median Population Age in Spring Lake Heights borough?
Median Population Age in Spring Lake Heights borough is 45.2 Years.
What is the Average Family Size in Spring Lake Heights borough
Average Family Size in Spring Lake Heights borough is 3.0 People.
What is the Average Household Size in Spring Lake Heights borough
Average Household Size in Spring Lake Heights borough is 2.0 People.
How Large is the Labor Force in Spring Lake Heights borough?
There are 2,808 People in the Labor Forcein in Spring Lake Heights borough.
What is the Percentage of People in the Labor Force in Spring Lake Heights borough?
68.0% of People are in the Labor Force in Spring Lake Heights borough.
What is the Unemployment Rate in Spring Lake Heights borough?
Unemployment Rate in Spring Lake Heights borough is 6.3%.