New Village, NJ Map & Demographics
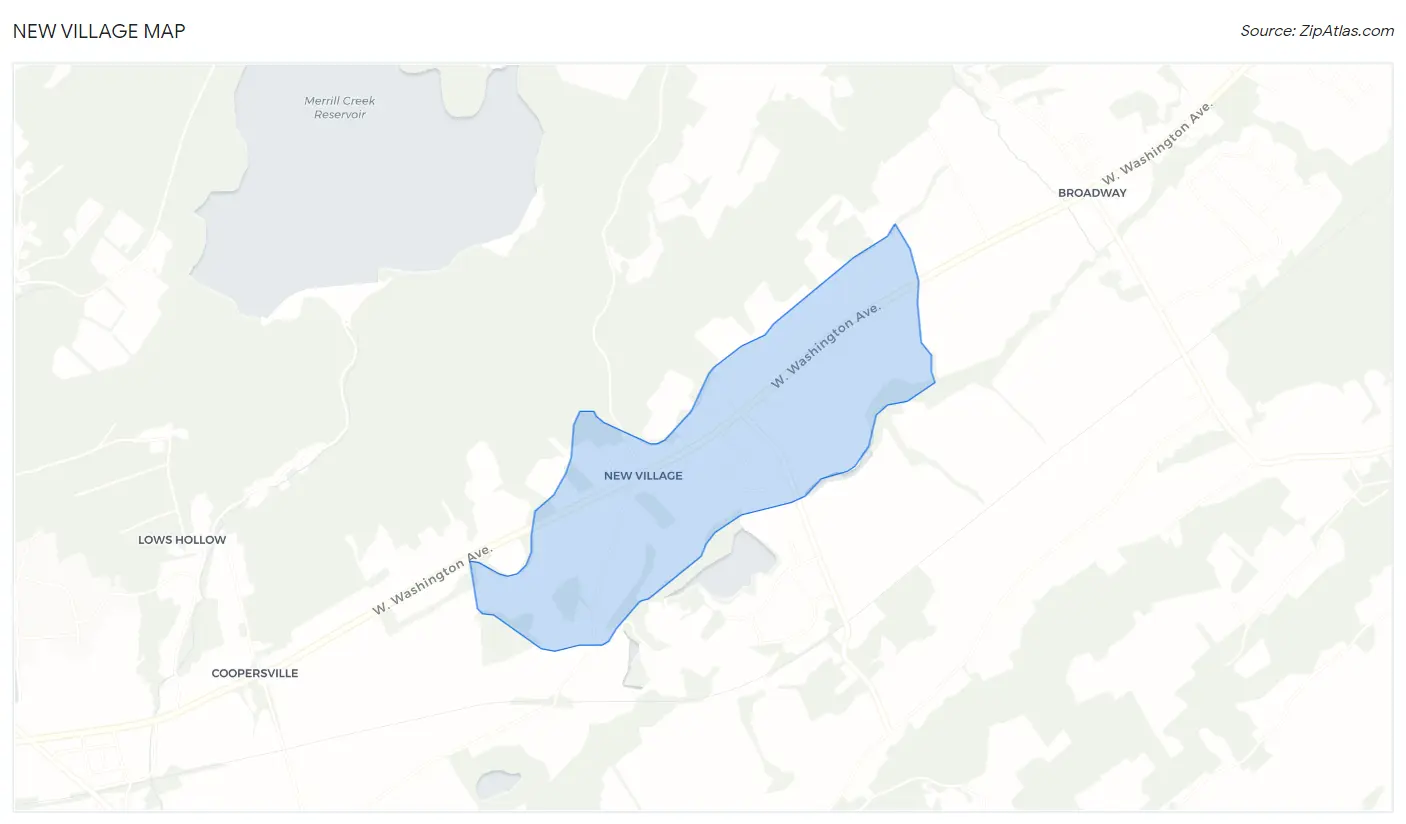
New Village Map
New Village Overview
$45,765
PER CAPITA INCOME
$112,721
AVG FAMILY INCOME
$98,393
AVG HOUSEHOLD INCOME
0.39
INEQUALITY / GINI INDEX
474
TOTAL POPULATION
230
MALE POPULATION
244
FEMALE POPULATION
94.26
MALES / 100 FEMALES
106.09
FEMALES / 100 MALES
51.6
MEDIAN AGE
2.3
AVG FAMILY SIZE
2.1
AVG HOUSEHOLD SIZE
243
LABOR FORCE [ PEOPLE ]
57.4%
PERCENT IN LABOR FORCE
7.8%
UNEMPLOYMENT RATE
Income in New Village
Income Overview in New Village
Per Capita Income in New Village is $45,765, while median incomes of families and households are $112,721 and $98,393 respectively.
| Characteristic | Number | Measure |
| Per Capita Income | 474 | $45,765 |
| Median Family Income | 169 | $112,721 |
| Mean Family Income | 169 | $109,971 |
| Median Household Income | 229 | $98,393 |
| Mean Household Income | 229 | $97,423 |
| Income Deficit | 169 | $0 |
| Wage / Income Gap (%) | 474 | 0.00% |
| Wage / Income Gap ($) | 474 | 100.00¢ per $1 |
| Gini / Inequality Index | 474 | 0.39 |
Earnings by Sex in New Village
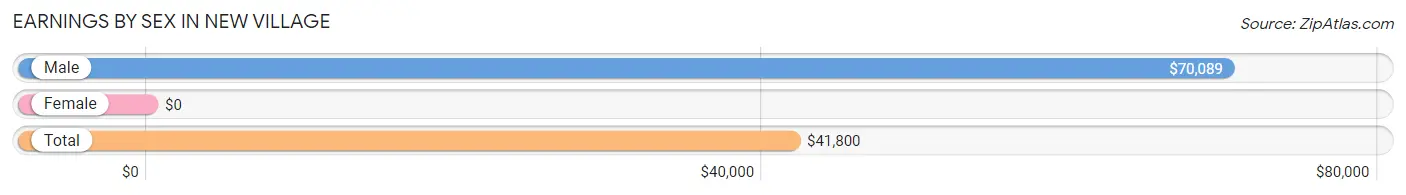
| Sex | Number | Average Earnings |
| Male | 163 (62.7%) | $70,089 |
| Female | 97 (37.3%) | $0 |
| Total | 260 (100.0%) | $41,800 |
Earnings by Sex by Income Bracket in New Village
The most common earnings brackets in New Village are $100,000+ for men (38 | 23.3%) and $2,499 or less for women (21 | 21.6%).
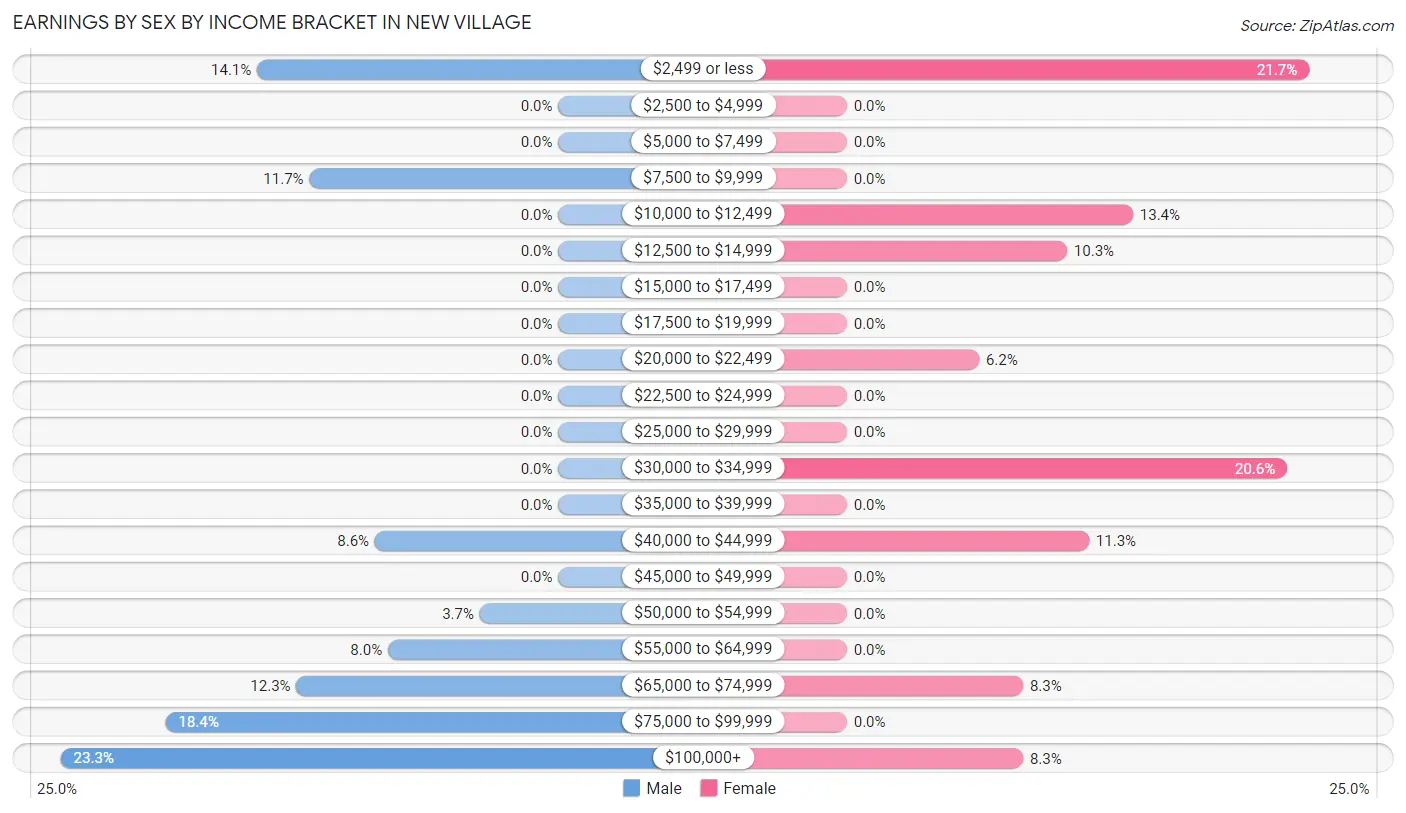
| Income | Male | Female |
| $2,499 or less | 23 (14.1%) | 21 (21.6%) |
| $2,500 to $4,999 | 0 (0.0%) | 0 (0.0%) |
| $5,000 to $7,499 | 0 (0.0%) | 0 (0.0%) |
| $7,500 to $9,999 | 19 (11.7%) | 0 (0.0%) |
| $10,000 to $12,499 | 0 (0.0%) | 13 (13.4%) |
| $12,500 to $14,999 | 0 (0.0%) | 10 (10.3%) |
| $15,000 to $17,499 | 0 (0.0%) | 0 (0.0%) |
| $17,500 to $19,999 | 0 (0.0%) | 0 (0.0%) |
| $20,000 to $22,499 | 0 (0.0%) | 6 (6.2%) |
| $22,500 to $24,999 | 0 (0.0%) | 0 (0.0%) |
| $25,000 to $29,999 | 0 (0.0%) | 0 (0.0%) |
| $30,000 to $34,999 | 0 (0.0%) | 20 (20.6%) |
| $35,000 to $39,999 | 0 (0.0%) | 0 (0.0%) |
| $40,000 to $44,999 | 14 (8.6%) | 11 (11.3%) |
| $45,000 to $49,999 | 0 (0.0%) | 0 (0.0%) |
| $50,000 to $54,999 | 6 (3.7%) | 0 (0.0%) |
| $55,000 to $64,999 | 13 (8.0%) | 0 (0.0%) |
| $65,000 to $74,999 | 20 (12.3%) | 8 (8.3%) |
| $75,000 to $99,999 | 30 (18.4%) | 0 (0.0%) |
| $100,000+ | 38 (23.3%) | 8 (8.3%) |
| Total | 163 (100.0%) | 97 (100.0%) |
Earnings by Sex by Educational Attainment in New Village
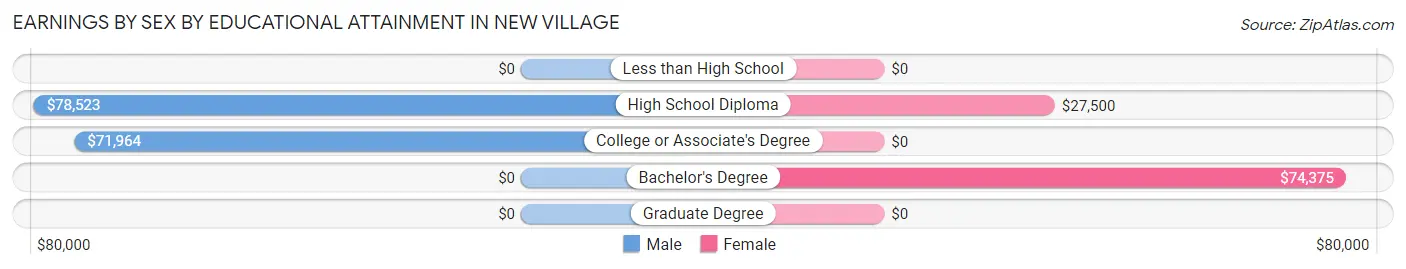
| Educational Attainment | Male Income | Female Income |
| Less than High School | - | - |
| High School Diploma | $78,523 | $27,500 |
| College or Associate's Degree | $71,964 | $0 |
| Bachelor's Degree | - | - |
| Graduate Degree | - | - |
| Total | $72,143 | $0 |
Family Income in New Village
Family Income Brackets in New Village
According to the New Village family income data, there are 45 families falling into the $100,000 to $149,999 income range, which is the most common income bracket and makes up 26.6% of all families.
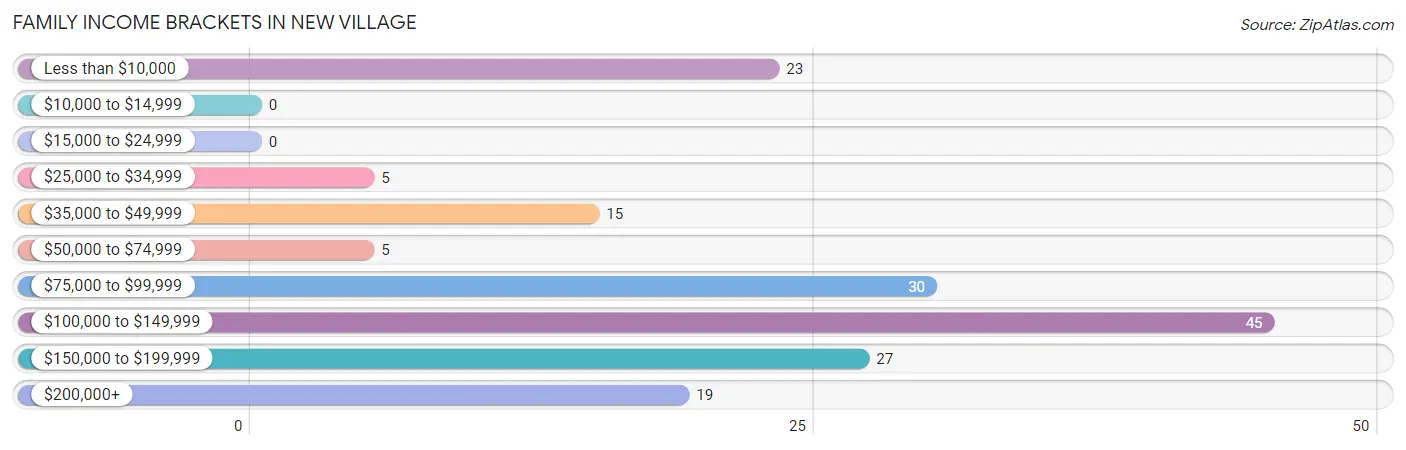
| Income Bracket | # Families | % Families |
| Less than $10,000 | 23 | 13.6% |
| $10,000 to $14,999 | 0 | 0.0% |
| $15,000 to $24,999 | 0 | 0.0% |
| $25,000 to $34,999 | 5 | 3.0% |
| $35,000 to $49,999 | 15 | 8.9% |
| $50,000 to $74,999 | 5 | 3.0% |
| $75,000 to $99,999 | 30 | 17.8% |
| $100,000 to $149,999 | 45 | 26.6% |
| $150,000 to $199,999 | 27 | 16.0% |
| $200,000+ | 19 | 11.2% |
Family Income by Famaliy Size in New Village
2-person families (92 | 54.4%) account for the highest median family income in New Village with $112,647 per family, while 2-person families (92 | 54.4%) have the highest median income of $56,324 per family member.
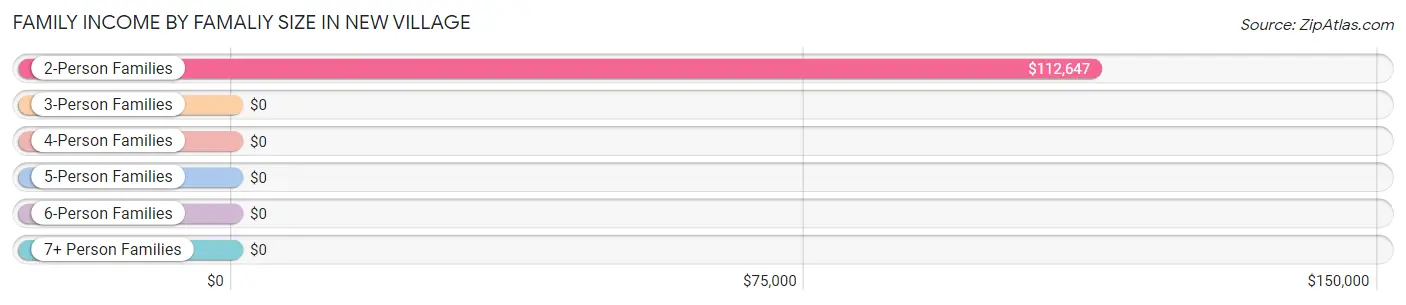
| Income Bracket | # Families | Median Income |
| 2-Person Families | 92 (54.4%) | $112,647 |
| 3-Person Families | 62 (36.7%) | $0 |
| 4-Person Families | 15 (8.9%) | $0 |
| 5-Person Families | 0 (0.0%) | $0 |
| 6-Person Families | 0 (0.0%) | $0 |
| 7+ Person Families | 0 (0.0%) | $0 |
| Total | 169 (100.0%) | $112,721 |
Family Income by Number of Earners in New Village
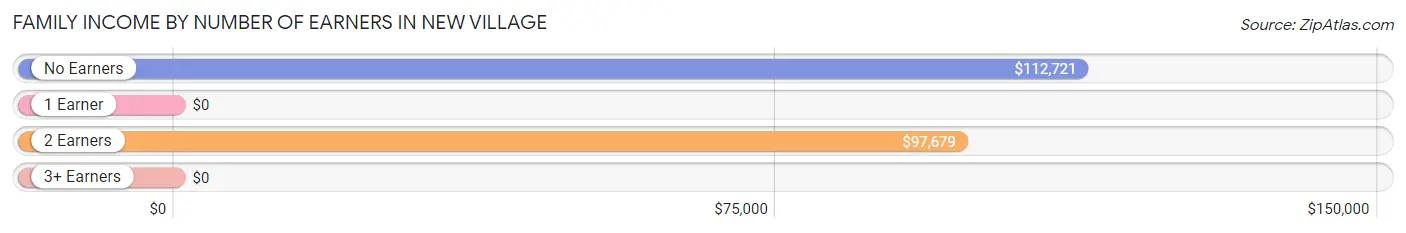
| Number of Earners | # Families | Median Income |
| No Earners | 41 (24.3%) | $112,721 |
| 1 Earner | 57 (33.7%) | $0 |
| 2 Earners | 59 (34.9%) | $97,679 |
| 3+ Earners | 12 (7.1%) | $0 |
| Total | 169 (100.0%) | $112,721 |
Household Income in New Village
Household Income Brackets in New Village
With 64 households falling in the category, the $100,000 to $149,999 income range is the most frequent in New Village, accounting for 28.0% of all households. In contrast, only 6 households (2.6%) fall into the $15,000 to $24,999 income bracket, making it the least populous group.
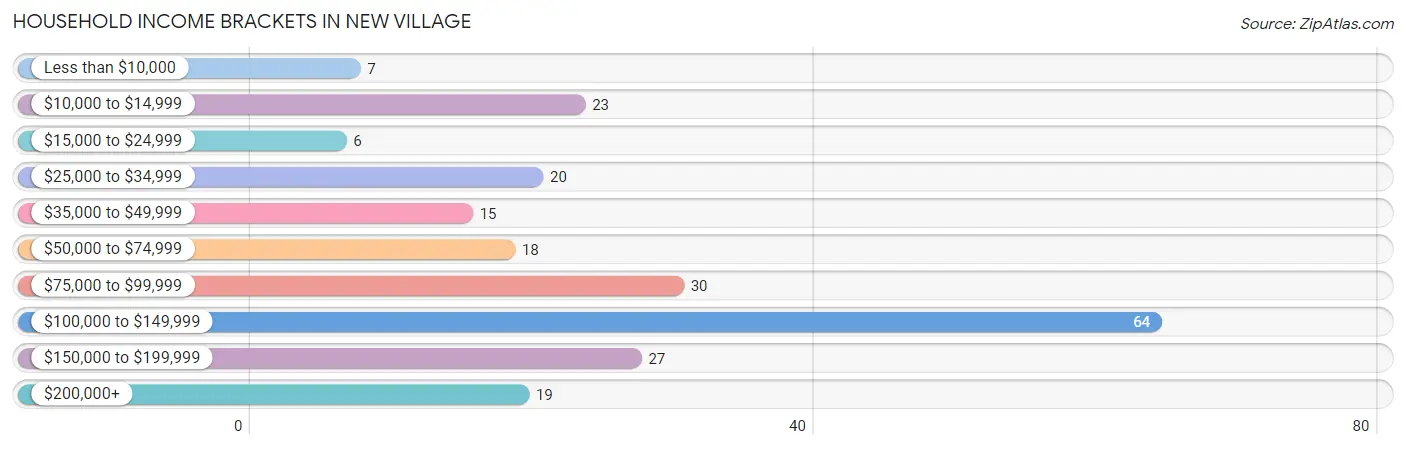
| Income Bracket | # Households | % Households |
| Less than $10,000 | 7 | 3.1% |
| $10,000 to $14,999 | 23 | 10.0% |
| $15,000 to $24,999 | 6 | 2.6% |
| $25,000 to $34,999 | 20 | 8.7% |
| $35,000 to $49,999 | 15 | 6.6% |
| $50,000 to $74,999 | 18 | 7.9% |
| $75,000 to $99,999 | 30 | 13.1% |
| $100,000 to $149,999 | 64 | 27.9% |
| $150,000 to $199,999 | 27 | 11.8% |
| $200,000+ | 19 | 8.3% |
Household Income by Householder Age in New Village
The median household income in New Village is $98,393, with the highest median household income of $126,917 found in the 45 to 64 years age bracket for the primary householder. A total of 71 households (31.0%) fall into this category. Meanwhile, the 15 to 24 years age bracket for the primary householder has the lowest median household income of $0, with 23 households (10.0%) in this group.
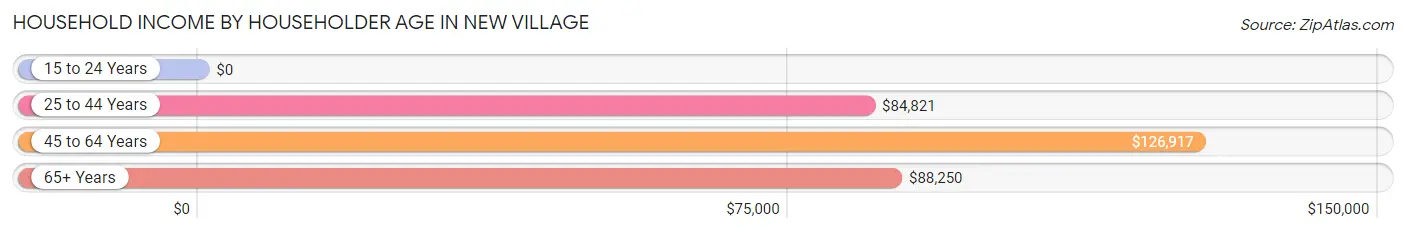
| Income Bracket | # Households | Median Income |
| 15 to 24 Years | 23 (10.0%) | $0 |
| 25 to 44 Years | 40 (17.5%) | $84,821 |
| 45 to 64 Years | 71 (31.0%) | $126,917 |
| 65+ Years | 95 (41.5%) | $88,250 |
| Total | 229 (100.0%) | $98,393 |
Poverty in New Village
Income Below Poverty by Sex and Age in New Village
With 18.3% poverty level for males and 20.1% for females among the residents of New Village, 18 to 24 year old males and 6 to 11 year old females are the most vulnerable to poverty, with 23 males (100.0%) and 12 females (100.0%) in their respective age groups living below the poverty level.
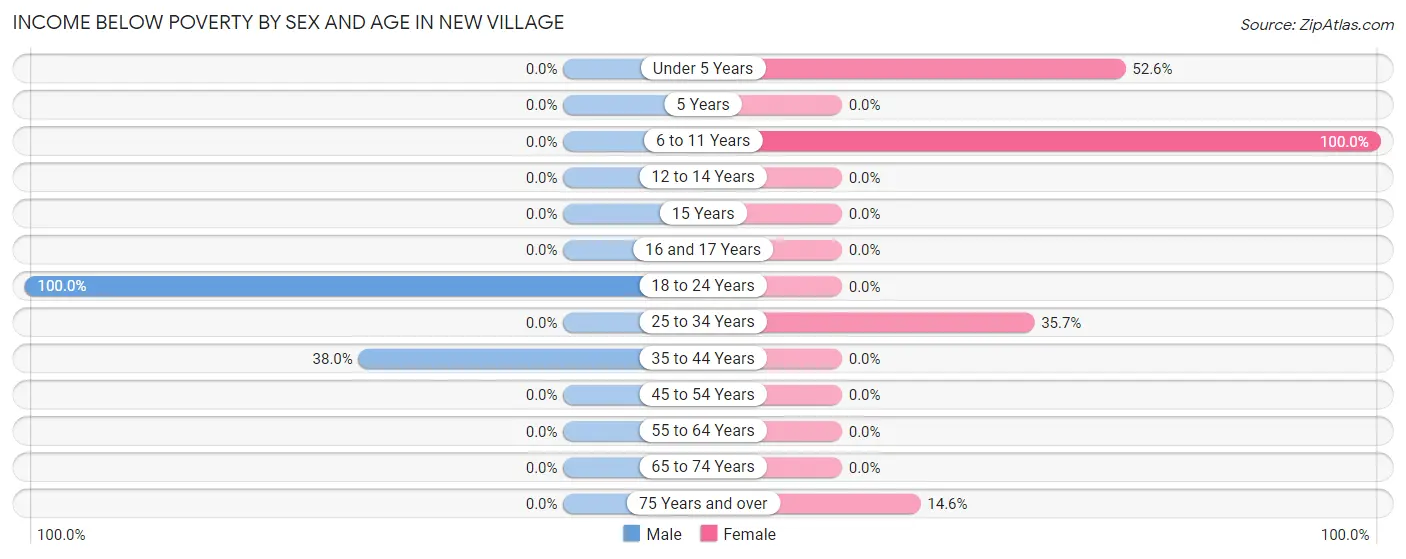
| Age Bracket | Male | Female |
| Under 5 Years | 0 (0.0%) | 20 (52.6%) |
| 5 Years | 0 (0.0%) | 0 (0.0%) |
| 6 to 11 Years | 0 (0.0%) | 12 (100.0%) |
| 12 to 14 Years | 0 (0.0%) | 0 (0.0%) |
| 15 Years | 0 (0.0%) | 0 (0.0%) |
| 16 and 17 Years | 0 (0.0%) | 0 (0.0%) |
| 18 to 24 Years | 23 (100.0%) | 0 (0.0%) |
| 25 to 34 Years | 0 (0.0%) | 10 (35.7%) |
| 35 to 44 Years | 19 (38.0%) | 0 (0.0%) |
| 45 to 54 Years | 0 (0.0%) | 0 (0.0%) |
| 55 to 64 Years | 0 (0.0%) | 0 (0.0%) |
| 65 to 74 Years | 0 (0.0%) | 0 (0.0%) |
| 75 Years and over | 0 (0.0%) | 7 (14.6%) |
| Total | 42 (18.3%) | 49 (20.1%) |
Income Above Poverty by Sex and Age in New Village
According to the poverty statistics in New Village, males aged 6 to 11 years and females aged 16 and 17 years are the age groups that are most secure financially, with 100.0% of males and 100.0% of females in these age groups living above the poverty line.
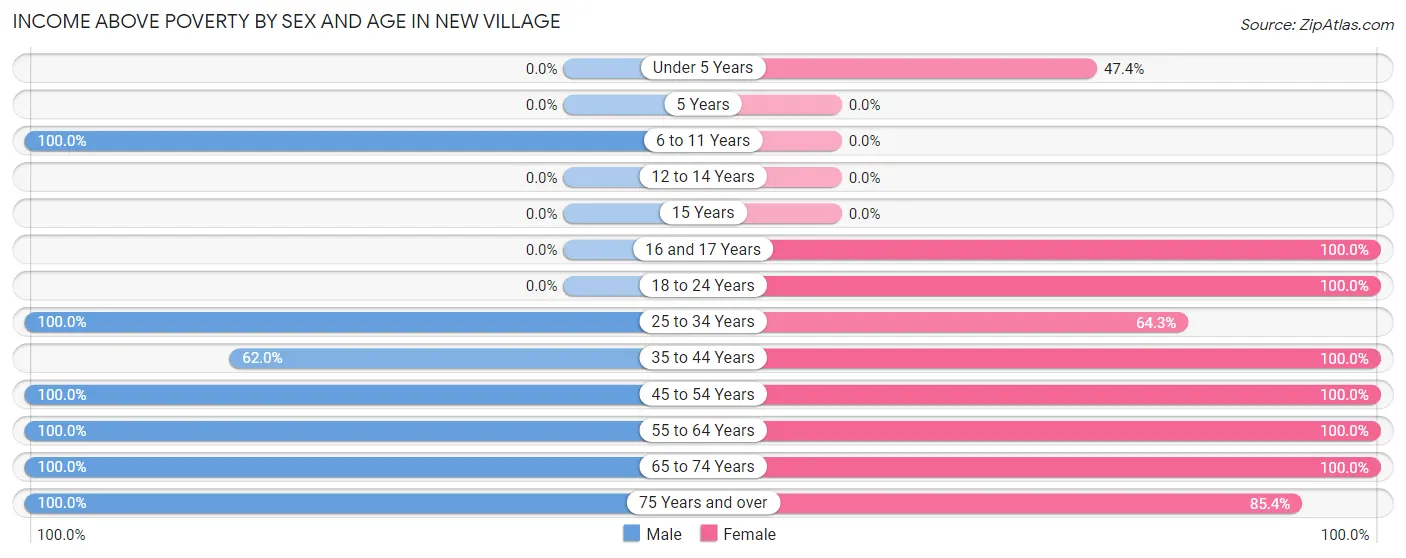
| Age Bracket | Male | Female |
| Under 5 Years | 0 (0.0%) | 18 (47.4%) |
| 5 Years | 0 (0.0%) | 0 (0.0%) |
| 6 to 11 Years | 1 (100.0%) | 0 (0.0%) |
| 12 to 14 Years | 0 (0.0%) | 0 (0.0%) |
| 15 Years | 0 (0.0%) | 0 (0.0%) |
| 16 and 17 Years | 0 (0.0%) | 7 (100.0%) |
| 18 to 24 Years | 0 (0.0%) | 6 (100.0%) |
| 25 to 34 Years | 28 (100.0%) | 18 (64.3%) |
| 35 to 44 Years | 31 (62.0%) | 15 (100.0%) |
| 45 to 54 Years | 27 (100.0%) | 27 (100.0%) |
| 55 to 64 Years | 43 (100.0%) | 27 (100.0%) |
| 65 to 74 Years | 30 (100.0%) | 36 (100.0%) |
| 75 Years and over | 28 (100.0%) | 41 (85.4%) |
| Total | 188 (81.7%) | 195 (79.9%) |
Income Below Poverty Among Married-Couple Families in New Village
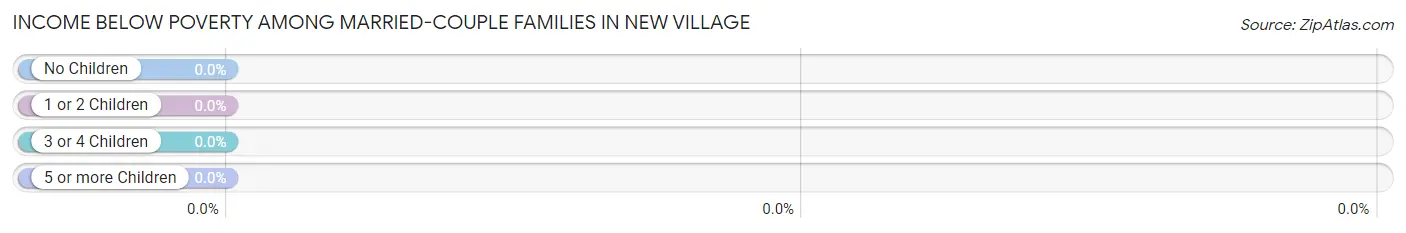
| Children | Above Poverty | Below Poverty |
| No Children | 83 (100.0%) | 0 (0.0%) |
| 1 or 2 Children | 29 (100.0%) | 0 (0.0%) |
| 3 or 4 Children | 0 (0.0%) | 0 (0.0%) |
| 5 or more Children | 0 (0.0%) | 0 (0.0%) |
| Total | 112 (100.0%) | 0 (0.0%) |
Income Below Poverty Among Single-Parent Households in New Village
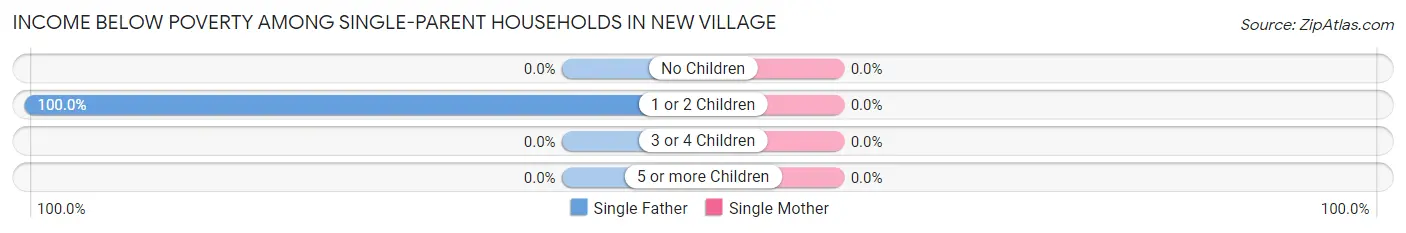
| Children | Single Father | Single Mother |
| No Children | 0 (0.0%) | 0 (0.0%) |
| 1 or 2 Children | 23 (100.0%) | 0 (0.0%) |
| 3 or 4 Children | 0 (0.0%) | 0 (0.0%) |
| 5 or more Children | 0 (0.0%) | 0 (0.0%) |
| Total | 23 (56.1%) | 0 (0.0%) |
Income Below Poverty Among Married-Couple vs Single-Parent Households in New Village
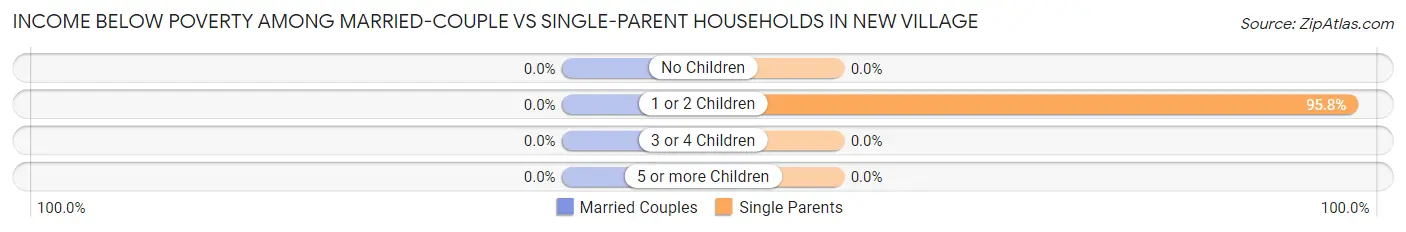
| Children | Married-Couple Families | Single-Parent Households |
| No Children | 0 (0.0%) | 0 (0.0%) |
| 1 or 2 Children | 0 (0.0%) | 23 (95.8%) |
| 3 or 4 Children | 0 (0.0%) | 0 (0.0%) |
| 5 or more Children | 0 (0.0%) | 0 (0.0%) |
| Total | 0 (0.0%) | 23 (40.4%) |
Race in New Village
The most populous races in New Village are White / Caucasian (407 | 85.9%), Hispanic or Latino (65 | 13.7%), and Some other Race (53 | 11.2%).
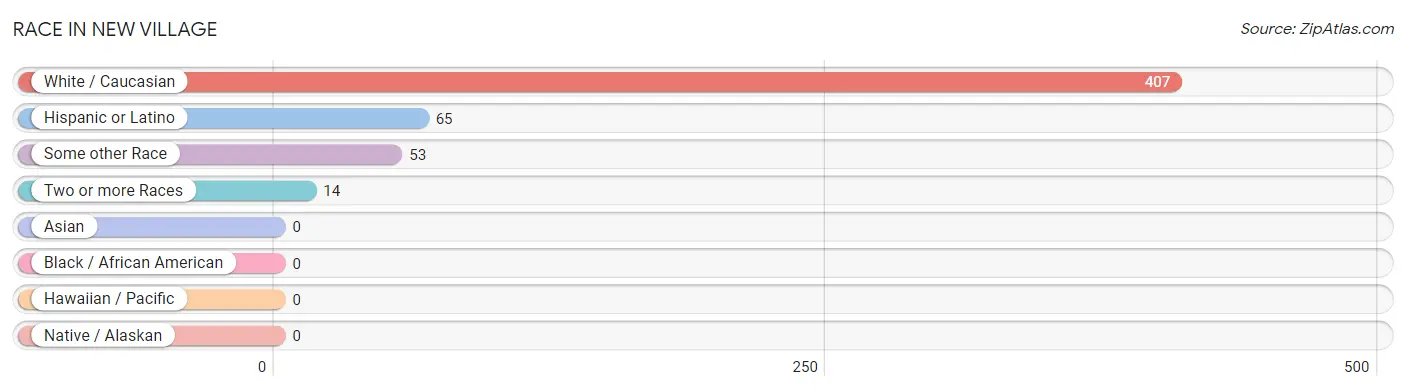
| Race | # Population | % Population |
| Asian | 0 | 0.0% |
| Black / African American | 0 | 0.0% |
| Hawaiian / Pacific | 0 | 0.0% |
| Hispanic or Latino | 65 | 13.7% |
| Native / Alaskan | 0 | 0.0% |
| White / Caucasian | 407 | 85.9% |
| Two or more Races | 14 | 2.9% |
| Some other Race | 53 | 11.2% |
| Total | 474 | 100.0% |
Ancestry in New Village
The most populous ancestries reported in New Village are German (138 | 29.1%), Italian (128 | 27.0%), Irish (84 | 17.7%), Dominican (65 | 13.7%), and English (56 | 11.8%), together accounting for 99.4% of all New Village residents.
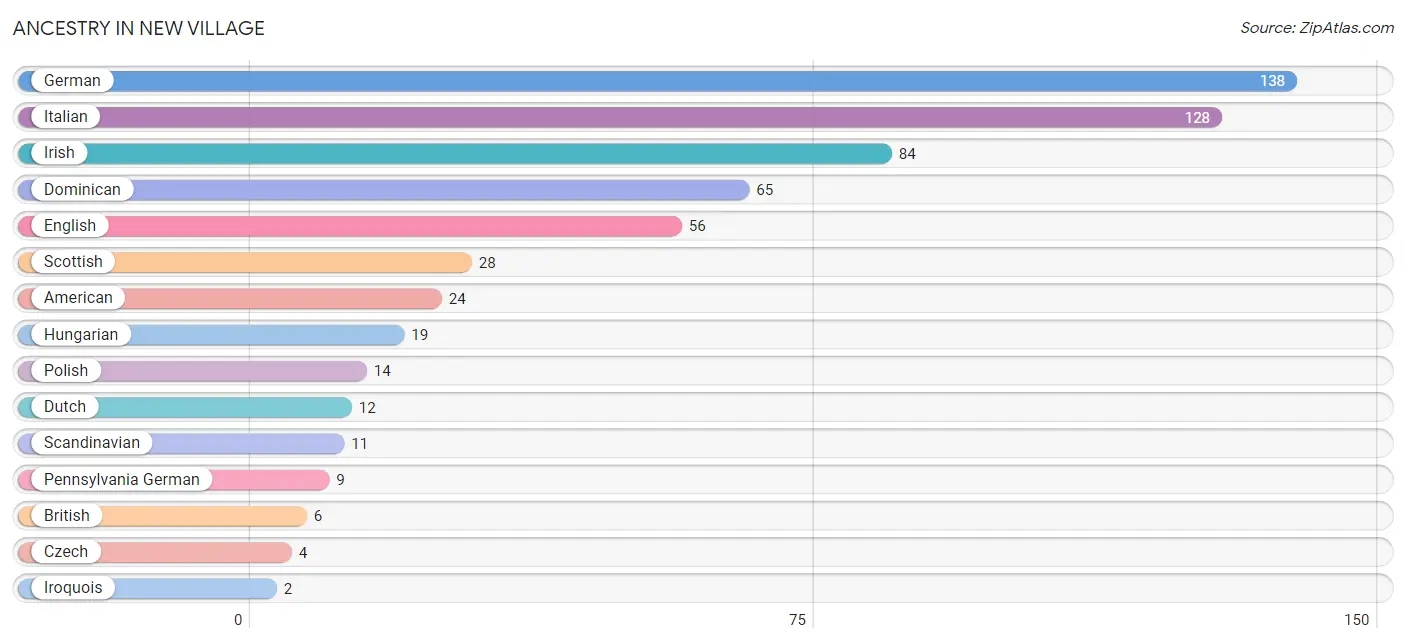
| Ancestry | # Population | % Population |
| American | 24 | 5.1% |
| British | 6 | 1.3% |
| Czech | 4 | 0.8% |
| Dominican | 65 | 13.7% |
| Dutch | 12 | 2.5% |
| English | 56 | 11.8% |
| German | 138 | 29.1% |
| Hungarian | 19 | 4.0% |
| Irish | 84 | 17.7% |
| Iroquois | 2 | 0.4% |
| Italian | 128 | 27.0% |
| Pennsylvania German | 9 | 1.9% |
| Polish | 14 | 2.9% |
| Scandinavian | 11 | 2.3% |
| Scottish | 28 | 5.9% | View All 15 Rows |
Immigrants in New Village
The most numerous immigrant groups reported in New Village came from Caribbean (33 | 7.0%), Dominican Republic (33 | 7.0%), Latin America (33 | 7.0%), Europe (9 | 1.9%), and Asia (5 | 1.1%), together accounting for 23.8% of all New Village residents.
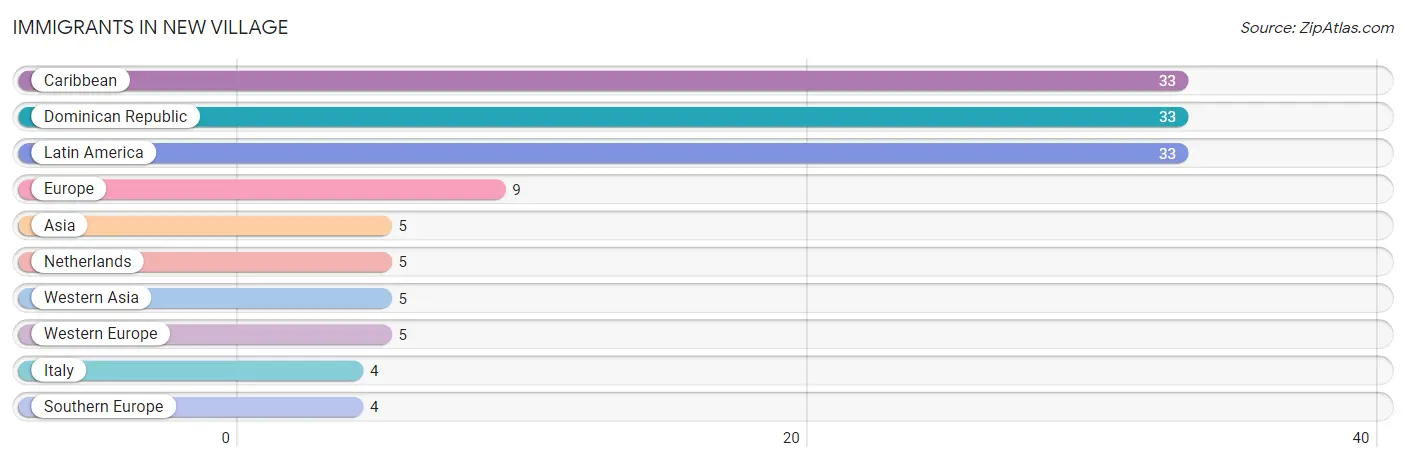
| Immigration Origin | # Population | % Population |
| Asia | 5 | 1.1% |
| Caribbean | 33 | 7.0% |
| Dominican Republic | 33 | 7.0% |
| Europe | 9 | 1.9% |
| Italy | 4 | 0.8% |
| Latin America | 33 | 7.0% |
| Netherlands | 5 | 1.1% |
| Southern Europe | 4 | 0.8% |
| Western Asia | 5 | 1.1% |
| Western Europe | 5 | 1.1% | View All 10 Rows |
Sex and Age in New Village
Sex and Age in New Village
The most populous age groups in New Village are 60 to 64 Years (33 | 14.3%) for men and Under 5 Years (38 | 15.6%) for women.
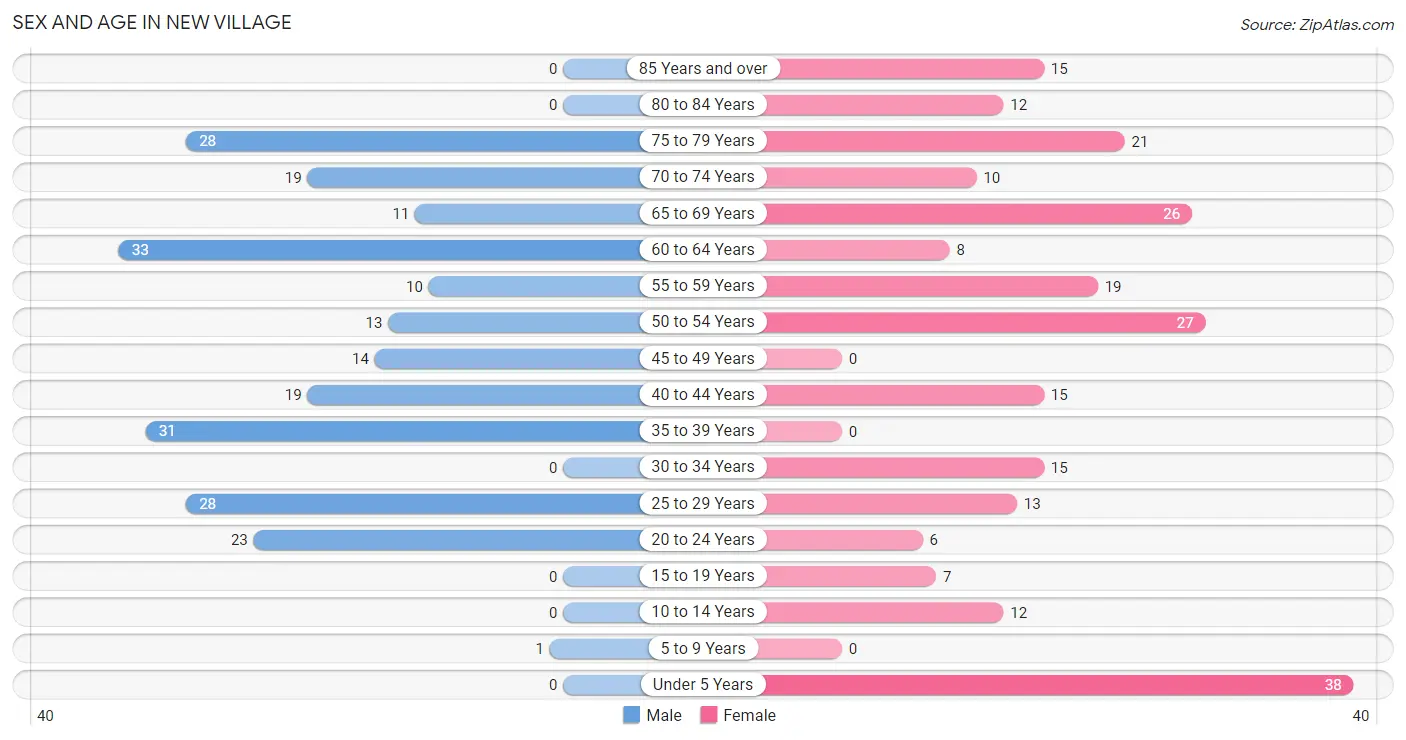
| Age Bracket | Male | Female |
| Under 5 Years | 0 (0.0%) | 38 (15.6%) |
| 5 to 9 Years | 1 (0.4%) | 0 (0.0%) |
| 10 to 14 Years | 0 (0.0%) | 12 (4.9%) |
| 15 to 19 Years | 0 (0.0%) | 7 (2.9%) |
| 20 to 24 Years | 23 (10.0%) | 6 (2.5%) |
| 25 to 29 Years | 28 (12.2%) | 13 (5.3%) |
| 30 to 34 Years | 0 (0.0%) | 15 (6.1%) |
| 35 to 39 Years | 31 (13.5%) | 0 (0.0%) |
| 40 to 44 Years | 19 (8.3%) | 15 (6.1%) |
| 45 to 49 Years | 14 (6.1%) | 0 (0.0%) |
| 50 to 54 Years | 13 (5.7%) | 27 (11.1%) |
| 55 to 59 Years | 10 (4.3%) | 19 (7.8%) |
| 60 to 64 Years | 33 (14.3%) | 8 (3.3%) |
| 65 to 69 Years | 11 (4.8%) | 26 (10.7%) |
| 70 to 74 Years | 19 (8.3%) | 10 (4.1%) |
| 75 to 79 Years | 28 (12.2%) | 21 (8.6%) |
| 80 to 84 Years | 0 (0.0%) | 12 (4.9%) |
| 85 Years and over | 0 (0.0%) | 15 (6.1%) |
| Total | 230 (100.0%) | 244 (100.0%) |
Families and Households in New Village
Median Family Size in New Village
The median family size in New Village is 2.28 persons per family, with married-couple families (112 | 66.3%) accounting for the largest median family size of 2.34 persons per family. On the other hand, single female/mother families (16 | 9.5%) represent the smallest median family size with 2.13 persons per family.
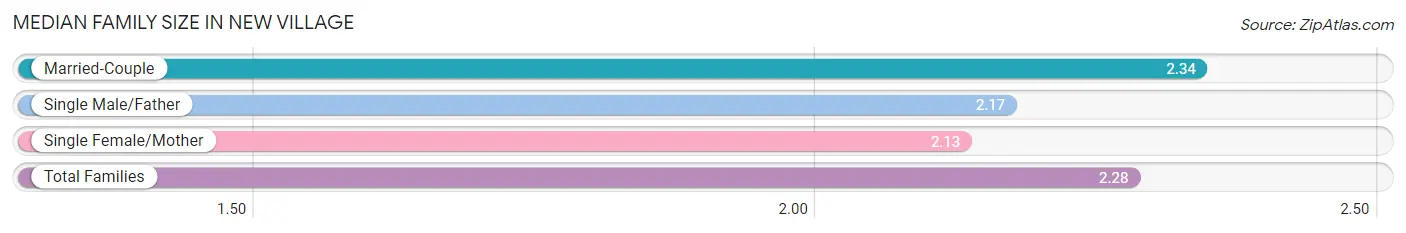
| Family Type | # Families | Family Size |
| Married-Couple | 112 (66.3%) | 2.34 |
| Single Male/Father | 41 (24.3%) | 2.17 |
| Single Female/Mother | 16 (9.5%) | 2.13 |
| Total Families | 169 (100.0%) | 2.28 |
Median Household Size in New Village
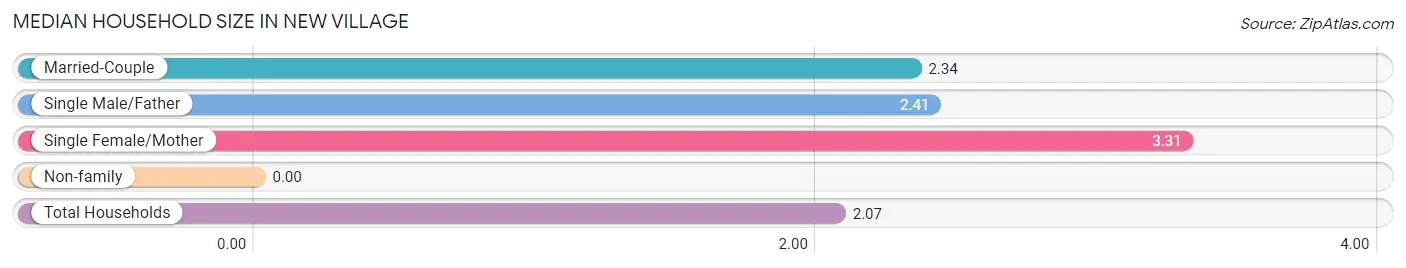
| Household Type | # Households | Household Size |
| Married-Couple | 112 (48.9%) | 2.34 |
| Single Male/Father | 41 (17.9%) | 2.41 |
| Single Female/Mother | 16 (7.0%) | 3.31 |
| Non-family | 60 (26.2%) | - |
| Total Households | 229 (100.0%) | 2.07 |
Household Size by Marriage Status in New Village
Out of a total of 229 households in New Village, 169 (73.8%) are family households, while 60 (26.2%) are nonfamily households. The most numerous type of family households are 2-person households, comprising 92, and the most common type of nonfamily households are 1-person households, comprising 60.
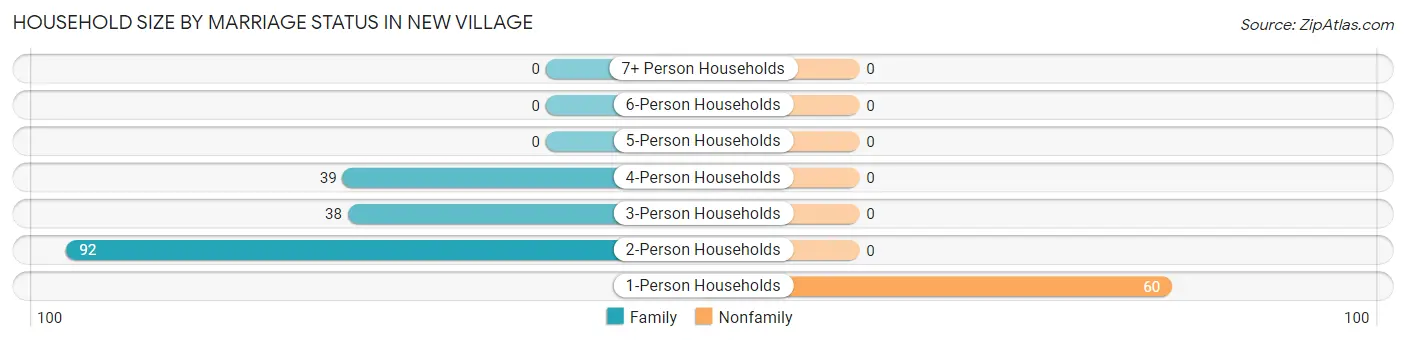
| Household Size | Family Households | Nonfamily Households |
| 1-Person Households | - | 60 (26.2%) |
| 2-Person Households | 92 (40.2%) | 0 (0.0%) |
| 3-Person Households | 38 (16.6%) | 0 (0.0%) |
| 4-Person Households | 39 (17.0%) | 0 (0.0%) |
| 5-Person Households | 0 (0.0%) | 0 (0.0%) |
| 6-Person Households | 0 (0.0%) | 0 (0.0%) |
| 7+ Person Households | 0 (0.0%) | 0 (0.0%) |
| Total | 169 (73.8%) | 60 (26.2%) |
Female Fertility in New Village
Fertility by Age in New Village
| Age Bracket | Women with Births | Births / 1,000 Women |
| 15 to 19 years | 0 (0.0%) | 0.0 |
| 20 to 34 years | 0 (0.0%) | 0.0 |
| 35 to 50 years | 0 (0.0%) | 0.0 |
| Total | 0 (0.0%) | 0.0 |
Fertility by Age by Marriage Status in New Village
| Age Bracket | Married | Unmarried |
| 15 to 19 years | 0 (0.0%) | 0 (0.0%) |
| 20 to 34 years | 0 (0.0%) | 0 (0.0%) |
| 35 to 50 years | 0 (0.0%) | 0 (0.0%) |
| Total | 0 (0.0%) | 0 (0.0%) |
Fertility by Education in New Village
| Educational Attainment | Women with Births | Births / 1,000 Women |
| Less than High School | 0 (0.0%) | 0.0 |
| High School Diploma | 0 (0.0%) | 0.0 |
| College or Associate's Degree | 0 (0.0%) | 0.0 |
| Bachelor's Degree | 0 (0.0%) | 0.0 |
| Graduate Degree | 0 (0.0%) | 0.0 |
| Total | 0 (0.0%) | 0.0 |
Fertility by Education by Marriage Status in New Village
| Educational Attainment | Married | Unmarried |
| Less than High School | 0 (0.0%) | 0 (0.0%) |
| High School Diploma | 0 (0.0%) | 0 (0.0%) |
| College or Associate's Degree | 0 (0.0%) | 0 (0.0%) |
| Bachelor's Degree | 0 (0.0%) | 0 (0.0%) |
| Graduate Degree | 0 (0.0%) | 0 (0.0%) |
| Total | 0 (0.0%) | 0 (0.0%) |
Employment Characteristics in New Village
Employment by Class of Employer in New Village
Among the 211 employed individuals in New Village, private company employees (158 | 74.9%), local government employees (21 | 10.0%), and self-employed (incorporated) (15 | 7.1%) make up the most common classes of employment.
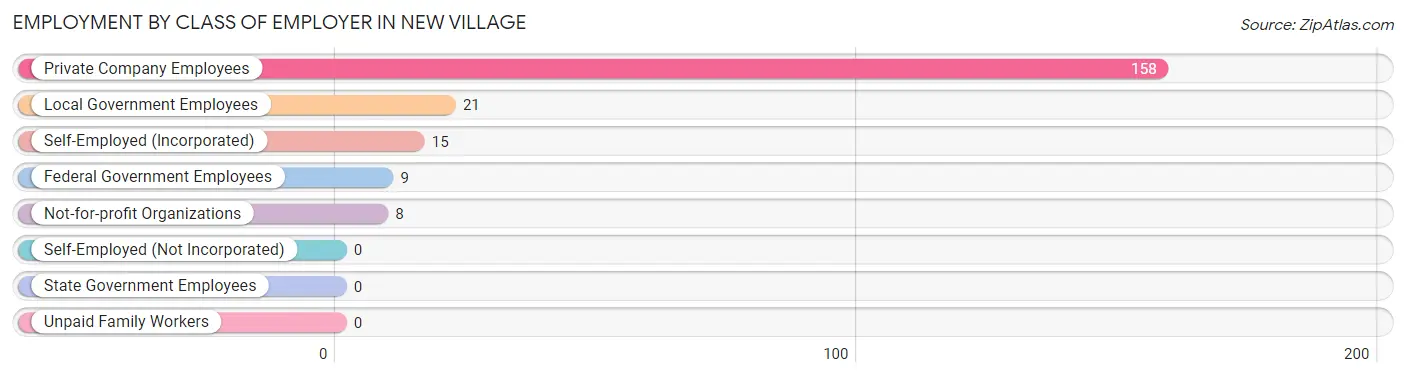
| Employer Class | # Employees | % Employees |
| Private Company Employees | 158 | 74.9% |
| Self-Employed (Incorporated) | 15 | 7.1% |
| Self-Employed (Not Incorporated) | 0 | 0.0% |
| Not-for-profit Organizations | 8 | 3.8% |
| Local Government Employees | 21 | 10.0% |
| State Government Employees | 0 | 0.0% |
| Federal Government Employees | 9 | 4.3% |
| Unpaid Family Workers | 0 | 0.0% |
| Total | 211 | 100.0% |
Employment Status by Age in New Village
According to the labor force statistics for New Village, out of the total population over 16 years of age (423), 57.4% or 243 individuals are in the labor force, with 7.8% or 19 of them unemployed. The age group with the highest labor force participation rate is 20 to 24 years, with 100.0% or 29 individuals in the labor force. Within the labor force, the 35 to 44 years age range has the highest percentage of unemployed individuals, with 21.5% or 14 of them being unemployed.
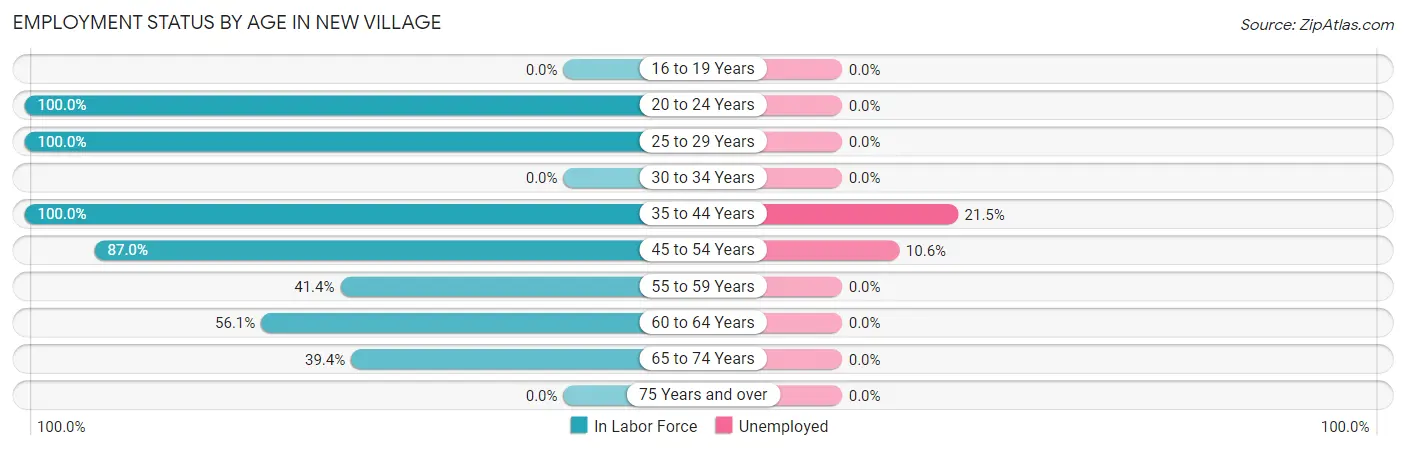
| Age Bracket | In Labor Force | Unemployed |
| 16 to 19 Years | 0 (0.0%) | 0 (0.0%) |
| 20 to 24 Years | 29 (100.0%) | 0 (0.0%) |
| 25 to 29 Years | 41 (100.0%) | 0 (0.0%) |
| 30 to 34 Years | 0 (0.0%) | 0 (0.0%) |
| 35 to 44 Years | 65 (100.0%) | 14 (21.5%) |
| 45 to 54 Years | 47 (87.0%) | 5 (10.6%) |
| 55 to 59 Years | 12 (41.4%) | 0 (0.0%) |
| 60 to 64 Years | 23 (56.1%) | 0 (0.0%) |
| 65 to 74 Years | 26 (39.4%) | 0 (0.0%) |
| 75 Years and over | 0 (0.0%) | 0 (0.0%) |
| Total | 243 (57.4%) | 19 (7.8%) |
Employment Status by Educational Attainment in New Village
According to labor force statistics for New Village, 76.7% of individuals (188) out of the total population between 25 and 64 years of age (245) are in the labor force, with 10.1% or 19 of them being unemployed. The group with the highest labor force participation rate are those with the educational attainment of college / associate degree, with 91.4% or 74 individuals in the labor force. Within the labor force, individuals with high school diploma education have the highest percentage of unemployment, with 25.0% or 19 of them being unemployed.
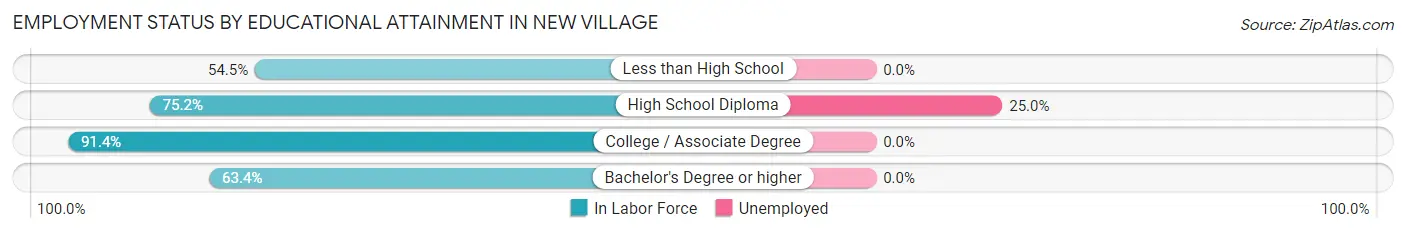
| Educational Attainment | In Labor Force | Unemployed |
| Less than High School | 12 (54.5%) | 0 (0.0%) |
| High School Diploma | 76 (75.2%) | 25 (25.0%) |
| College / Associate Degree | 74 (91.4%) | 0 (0.0%) |
| Bachelor's Degree or higher | 26 (63.4%) | 0 (0.0%) |
| Total | 188 (76.7%) | 25 (10.1%) |
Employment Occupations by Sex in New Village
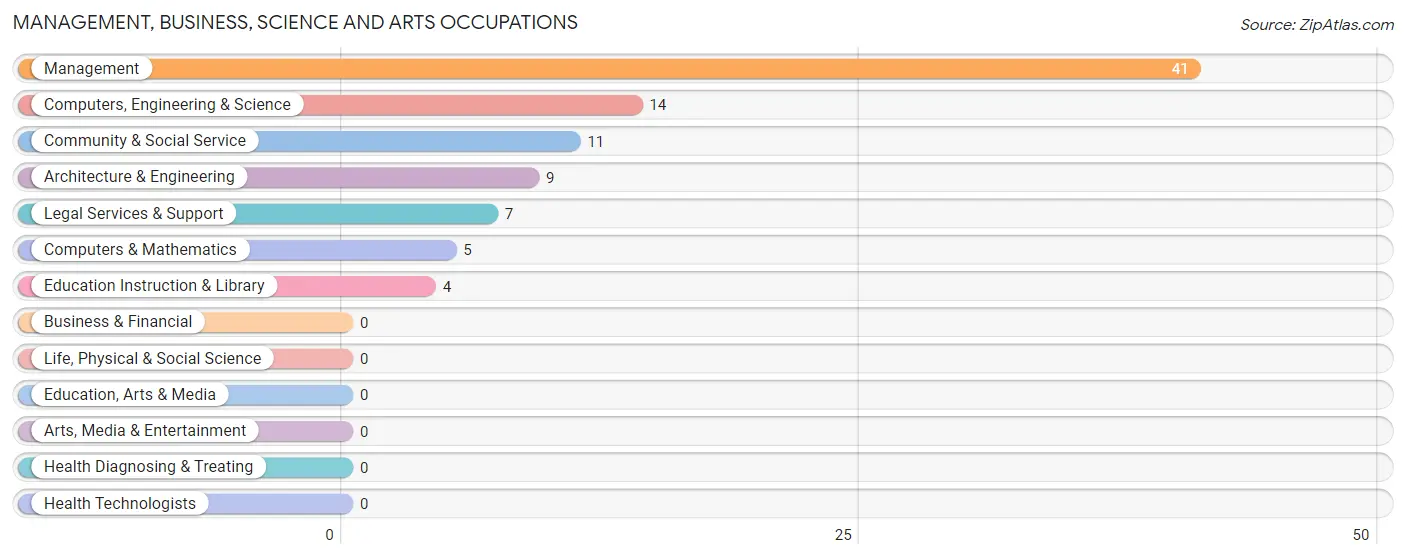
Management, Business, Science and Arts Occupations
The most common Management, Business, Science and Arts occupations in New Village are Management (41 | 18.3%), Computers, Engineering & Science (14 | 6.2%), Community & Social Service (11 | 4.9%), Architecture & Engineering (9 | 4.0%), and Legal Services & Support (7 | 3.1%).
Management, Business, Science and Arts Occupations by Sex
Within the Management, Business, Science and Arts occupations in New Village, the most male-oriented occupations are Architecture & Engineering (100.0%), Computers, Engineering & Science (64.3%), and Management (63.4%), while the most female-oriented occupations are Computers & Mathematics (100.0%), Community & Social Service (100.0%), and Legal Services & Support (100.0%).
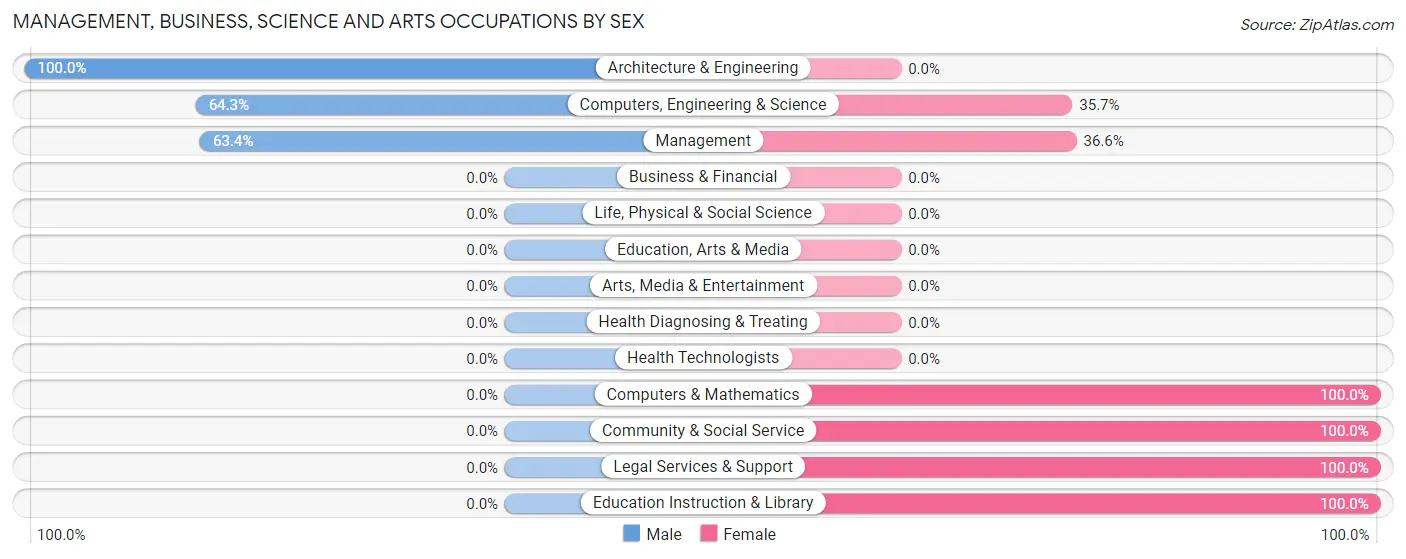
| Occupation | Male | Female |
| Management | 26 (63.4%) | 15 (36.6%) |
| Business & Financial | 0 (0.0%) | 0 (0.0%) |
| Computers, Engineering & Science | 9 (64.3%) | 5 (35.7%) |
| Computers & Mathematics | 0 (0.0%) | 5 (100.0%) |
| Architecture & Engineering | 9 (100.0%) | 0 (0.0%) |
| Life, Physical & Social Science | 0 (0.0%) | 0 (0.0%) |
| Community & Social Service | 0 (0.0%) | 11 (100.0%) |
| Education, Arts & Media | 0 (0.0%) | 0 (0.0%) |
| Legal Services & Support | 0 (0.0%) | 7 (100.0%) |
| Education Instruction & Library | 0 (0.0%) | 4 (100.0%) |
| Arts, Media & Entertainment | 0 (0.0%) | 0 (0.0%) |
| Health Diagnosing & Treating | 0 (0.0%) | 0 (0.0%) |
| Health Technologists | 0 (0.0%) | 0 (0.0%) |
| Total (Category) | 35 (53.0%) | 31 (47.0%) |
| Total (Overall) | 163 (72.8%) | 61 (27.2%) |
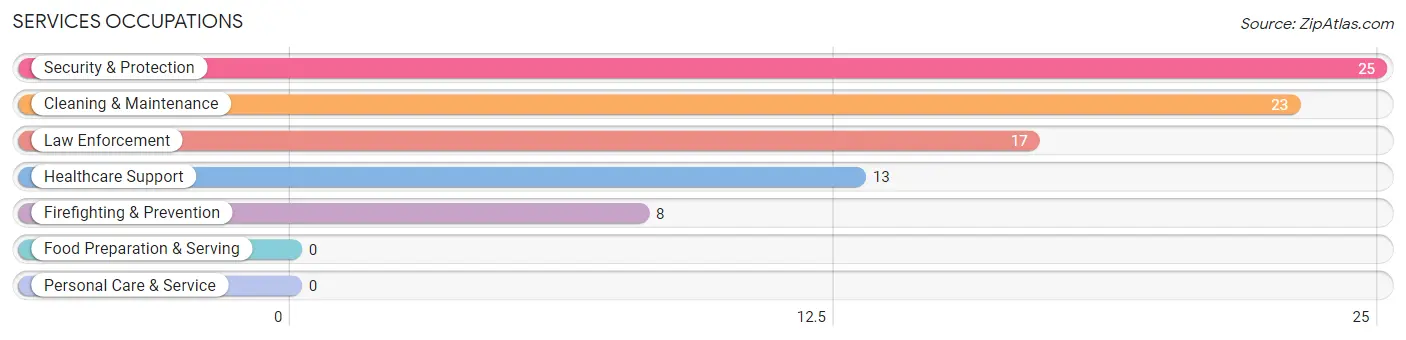
Services Occupations
The most common Services occupations in New Village are Security & Protection (25 | 11.2%), Cleaning & Maintenance (23 | 10.3%), Law Enforcement (17 | 7.6%), Healthcare Support (13 | 5.8%), and Firefighting & Prevention (8 | 3.6%).
Services Occupations by Sex
Within the Services occupations in New Village, the most male-oriented occupations are Firefighting & Prevention (100.0%), Cleaning & Maintenance (100.0%), and Security & Protection (88.0%), while the most female-oriented occupations are Healthcare Support (100.0%), Law Enforcement (17.6%), and Security & Protection (12.0%).
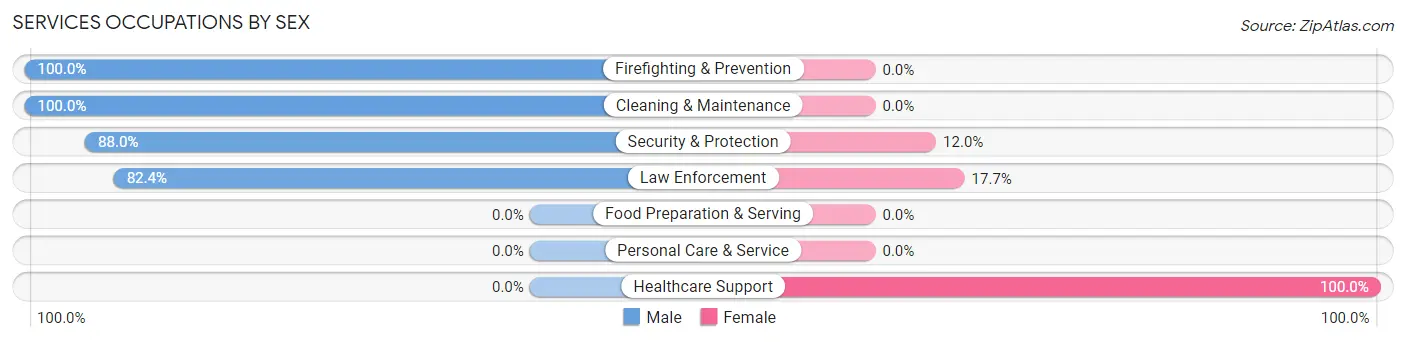
| Occupation | Male | Female |
| Healthcare Support | 0 (0.0%) | 13 (100.0%) |
| Security & Protection | 22 (88.0%) | 3 (12.0%) |
| Firefighting & Prevention | 8 (100.0%) | 0 (0.0%) |
| Law Enforcement | 14 (82.4%) | 3 (17.6%) |
| Food Preparation & Serving | 0 (0.0%) | 0 (0.0%) |
| Cleaning & Maintenance | 23 (100.0%) | 0 (0.0%) |
| Personal Care & Service | 0 (0.0%) | 0 (0.0%) |
| Total (Category) | 45 (73.8%) | 16 (26.2%) |
| Total (Overall) | 163 (72.8%) | 61 (27.2%) |
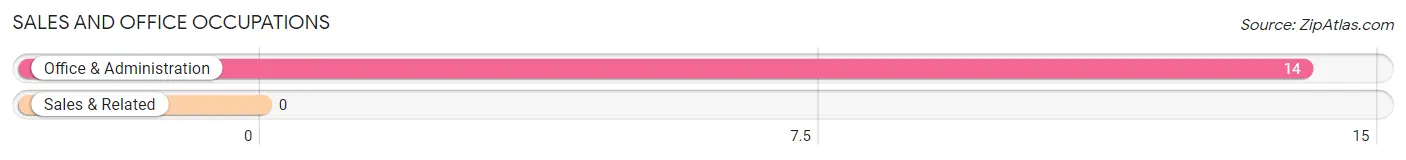
Sales and Office Occupations
The most common Sales and Office occupations in New Village are , and Office & Administration (14 | 6.2%).
Sales and Office Occupations by Sex
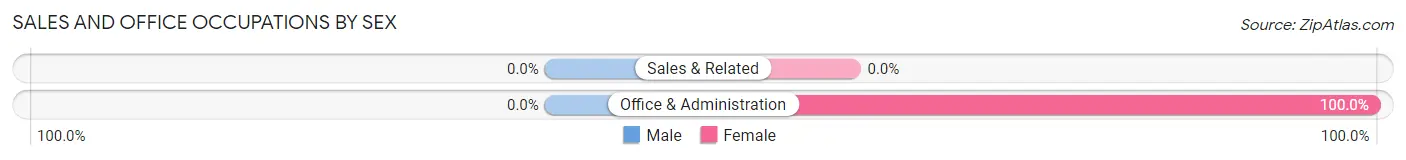
| Occupation | Male | Female |
| Sales & Related | 0 (0.0%) | 0 (0.0%) |
| Office & Administration | 0 (0.0%) | 14 (100.0%) |
| Total (Category) | 0 (0.0%) | 14 (100.0%) |
| Total (Overall) | 163 (72.8%) | 61 (27.2%) |
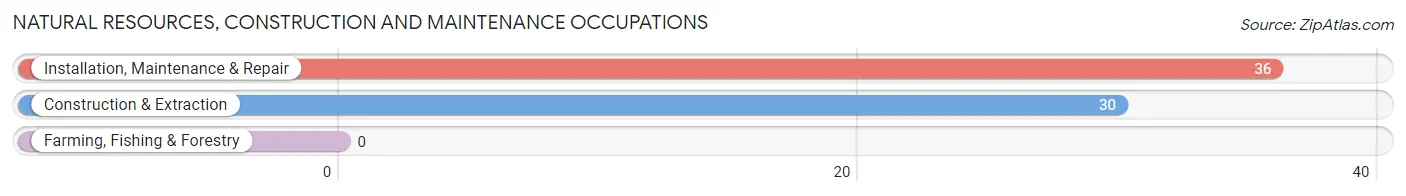
Natural Resources, Construction and Maintenance Occupations
The most common Natural Resources, Construction and Maintenance occupations in New Village are Installation, Maintenance & Repair (36 | 16.1%), and Construction & Extraction (30 | 13.4%).
Natural Resources, Construction and Maintenance Occupations by Sex
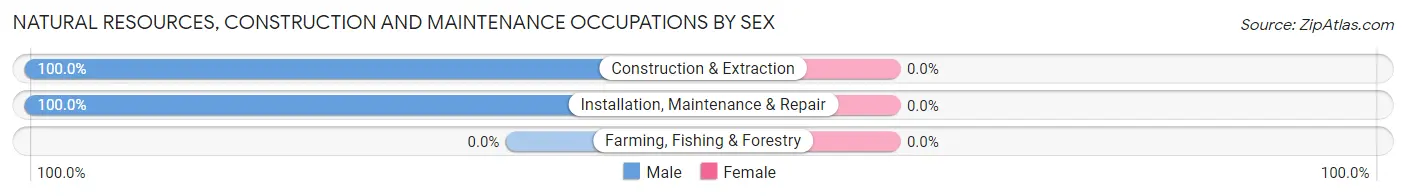
| Occupation | Male | Female |
| Farming, Fishing & Forestry | 0 (0.0%) | 0 (0.0%) |
| Construction & Extraction | 30 (100.0%) | 0 (0.0%) |
| Installation, Maintenance & Repair | 36 (100.0%) | 0 (0.0%) |
| Total (Category) | 66 (100.0%) | 0 (0.0%) |
| Total (Overall) | 163 (72.8%) | 61 (27.2%) |
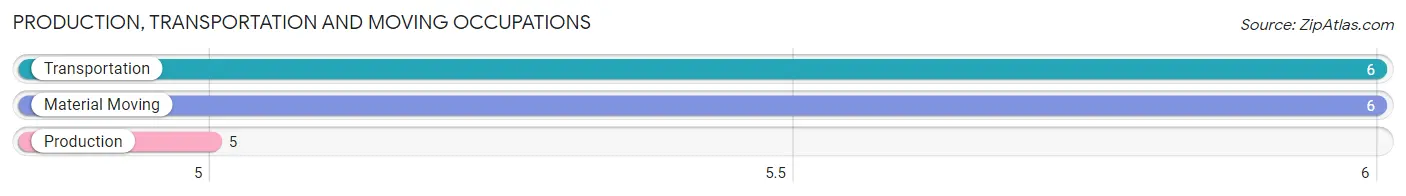
Production, Transportation and Moving Occupations
The most common Production, Transportation and Moving occupations in New Village are Transportation (6 | 2.7%), Material Moving (6 | 2.7%), and Production (5 | 2.2%).
Production, Transportation and Moving Occupations by Sex
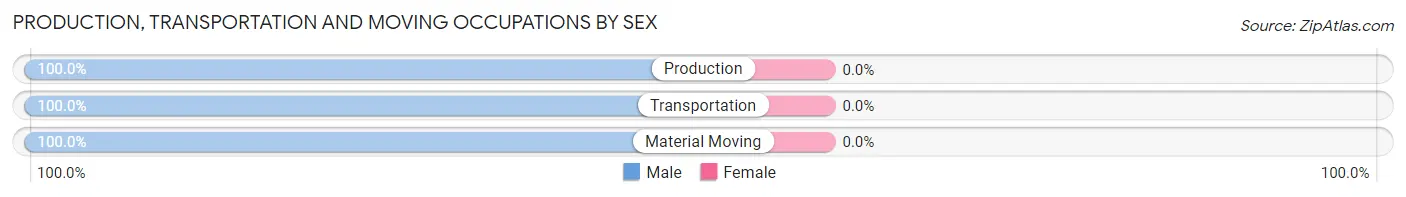
| Occupation | Male | Female |
| Production | 5 (100.0%) | 0 (0.0%) |
| Transportation | 6 (100.0%) | 0 (0.0%) |
| Material Moving | 6 (100.0%) | 0 (0.0%) |
| Total (Category) | 17 (100.0%) | 0 (0.0%) |
| Total (Overall) | 163 (72.8%) | 61 (27.2%) |
Employment Industries by Sex in New Village
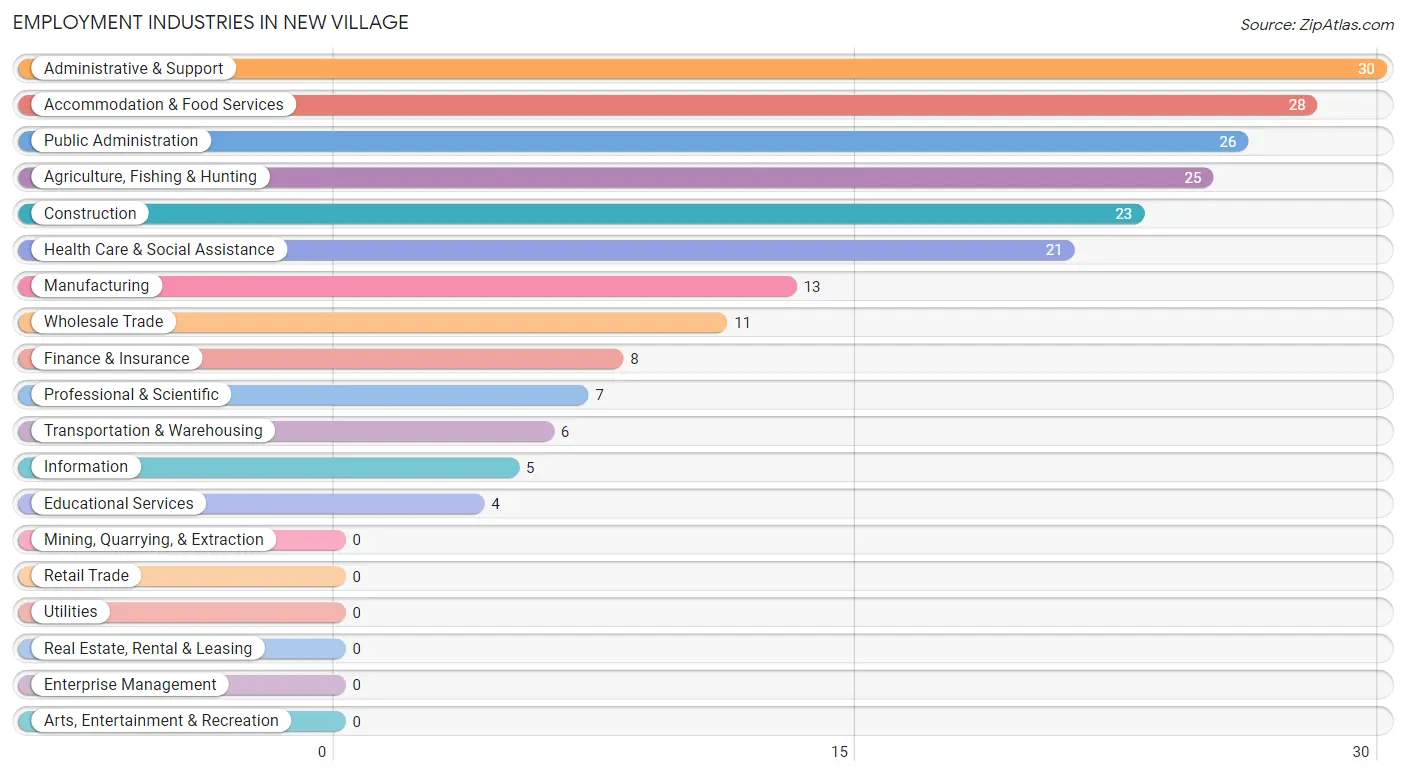
Employment Industries in New Village
The major employment industries in New Village include Administrative & Support (30 | 13.4%), Accommodation & Food Services (28 | 12.5%), Public Administration (26 | 11.6%), Agriculture, Fishing & Hunting (25 | 11.2%), and Construction (23 | 10.3%).
Employment Industries by Sex in New Village
The New Village industries that see more men than women are Agriculture, Fishing & Hunting (100.0%), Construction (100.0%), and Manufacturing (100.0%), whereas the industries that tend to have a higher number of women are Information (100.0%), Finance & Insurance (100.0%), and Professional & Scientific (100.0%).
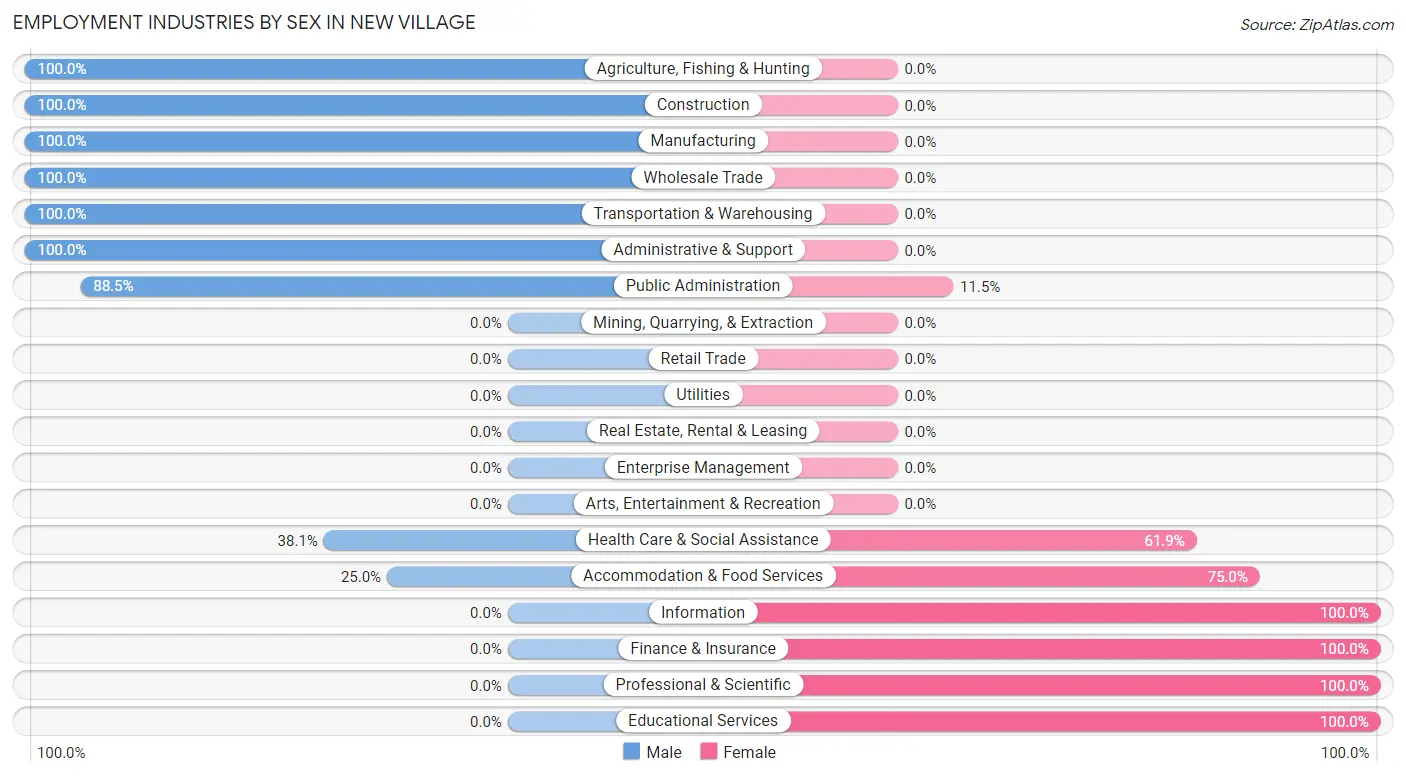
| Industry | Male | Female |
| Agriculture, Fishing & Hunting | 25 (100.0%) | 0 (0.0%) |
| Mining, Quarrying, & Extraction | 0 (0.0%) | 0 (0.0%) |
| Construction | 23 (100.0%) | 0 (0.0%) |
| Manufacturing | 13 (100.0%) | 0 (0.0%) |
| Wholesale Trade | 11 (100.0%) | 0 (0.0%) |
| Retail Trade | 0 (0.0%) | 0 (0.0%) |
| Transportation & Warehousing | 6 (100.0%) | 0 (0.0%) |
| Utilities | 0 (0.0%) | 0 (0.0%) |
| Information | 0 (0.0%) | 5 (100.0%) |
| Finance & Insurance | 0 (0.0%) | 8 (100.0%) |
| Real Estate, Rental & Leasing | 0 (0.0%) | 0 (0.0%) |
| Professional & Scientific | 0 (0.0%) | 7 (100.0%) |
| Enterprise Management | 0 (0.0%) | 0 (0.0%) |
| Administrative & Support | 30 (100.0%) | 0 (0.0%) |
| Educational Services | 0 (0.0%) | 4 (100.0%) |
| Health Care & Social Assistance | 8 (38.1%) | 13 (61.9%) |
| Arts, Entertainment & Recreation | 0 (0.0%) | 0 (0.0%) |
| Accommodation & Food Services | 7 (25.0%) | 21 (75.0%) |
| Public Administration | 23 (88.5%) | 3 (11.5%) |
| Total | 163 (72.8%) | 61 (27.2%) |
Education in New Village
School Enrollment in New Village
The most common levels of schooling among the 25 students in New Village are middle school (12 | 48.0%), high school (7 | 28.0%), and nursery / preschool (5 | 20.0%).
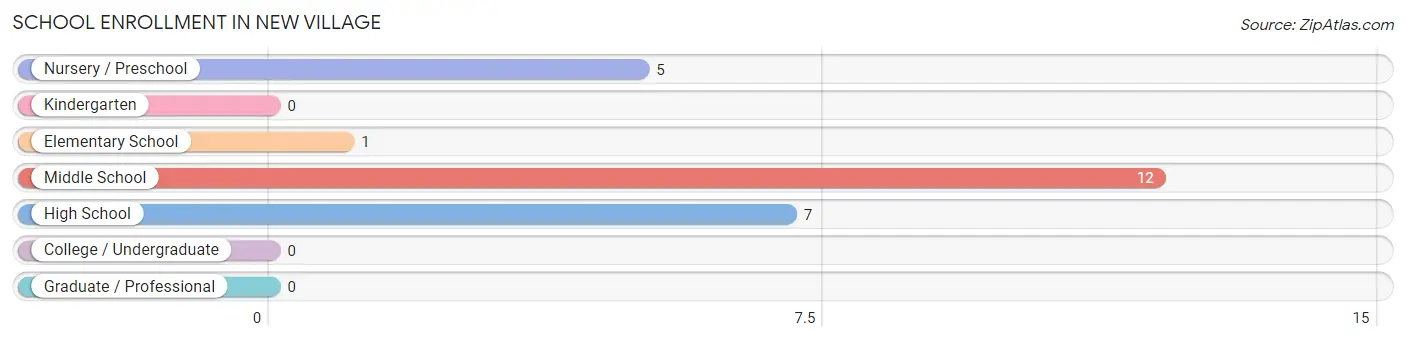
| School Level | # Students | % Students |
| Nursery / Preschool | 5 | 20.0% |
| Kindergarten | 0 | 0.0% |
| Elementary School | 1 | 4.0% |
| Middle School | 12 | 48.0% |
| High School | 7 | 28.0% |
| College / Undergraduate | 0 | 0.0% |
| Graduate / Professional | 0 | 0.0% |
| Total | 25 | 100.0% |
School Enrollment by Age by Funding Source in New Village
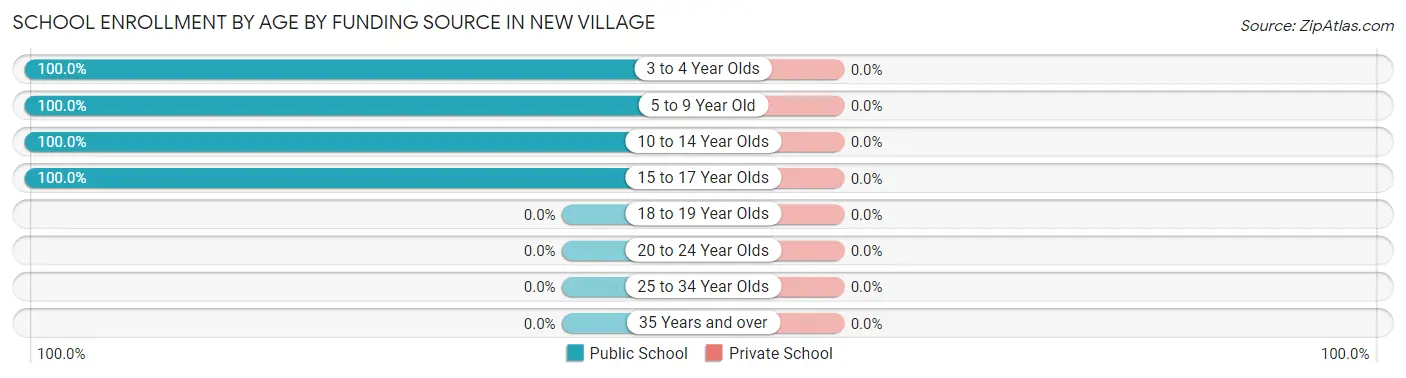
| Age Bracket | Public School | Private School |
| 3 to 4 Year Olds | 5 (100.0%) | 0 (0.0%) |
| 5 to 9 Year Old | 1 (100.0%) | 0 (0.0%) |
| 10 to 14 Year Olds | 12 (100.0%) | 0 (0.0%) |
| 15 to 17 Year Olds | 7 (100.0%) | 0 (0.0%) |
| 18 to 19 Year Olds | 0 (0.0%) | 0 (0.0%) |
| 20 to 24 Year Olds | 0 (0.0%) | 0 (0.0%) |
| 25 to 34 Year Olds | 0 (0.0%) | 0 (0.0%) |
| 35 Years and over | 0 (0.0%) | 0 (0.0%) |
| Total | 25 (100.0%) | 0 (0.0%) |
Educational Attainment by Field of Study in New Village
Business (44 | 50.6%), science & technology (14 | 16.1%), education (10 | 11.5%), social sciences (8 | 9.2%), and communications (6 | 6.9%) are the most common fields of study among 87 individuals in New Village who have obtained a bachelor's degree or higher.
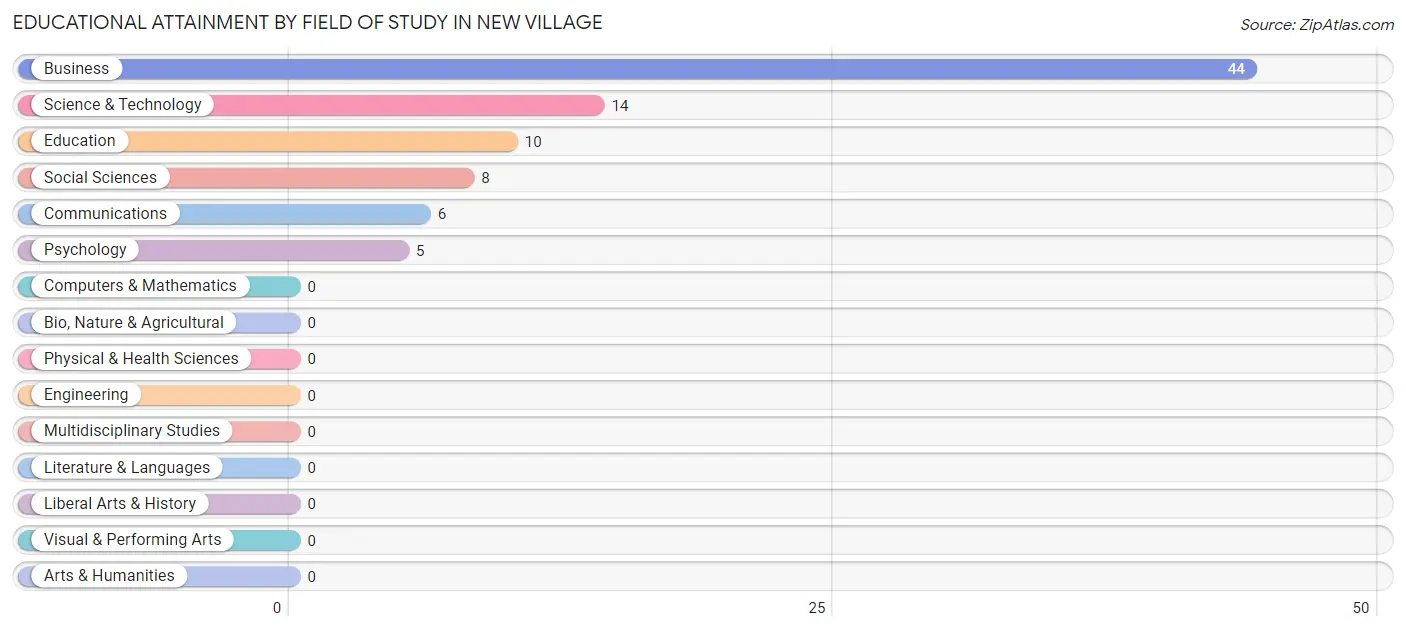
| Field of Study | # Graduates | % Graduates |
| Computers & Mathematics | 0 | 0.0% |
| Bio, Nature & Agricultural | 0 | 0.0% |
| Physical & Health Sciences | 0 | 0.0% |
| Psychology | 5 | 5.8% |
| Social Sciences | 8 | 9.2% |
| Engineering | 0 | 0.0% |
| Multidisciplinary Studies | 0 | 0.0% |
| Science & Technology | 14 | 16.1% |
| Business | 44 | 50.6% |
| Education | 10 | 11.5% |
| Literature & Languages | 0 | 0.0% |
| Liberal Arts & History | 0 | 0.0% |
| Visual & Performing Arts | 0 | 0.0% |
| Communications | 6 | 6.9% |
| Arts & Humanities | 0 | 0.0% |
| Total | 87 | 100.0% |
Transportation & Commute in New Village
Vehicle Availability by Sex in New Village
The most prevalent vehicle ownership categories in New Village are males with 3 vehicles (72, accounting for 44.2%) and females with 3 vehicles (24, making up 150.0%).
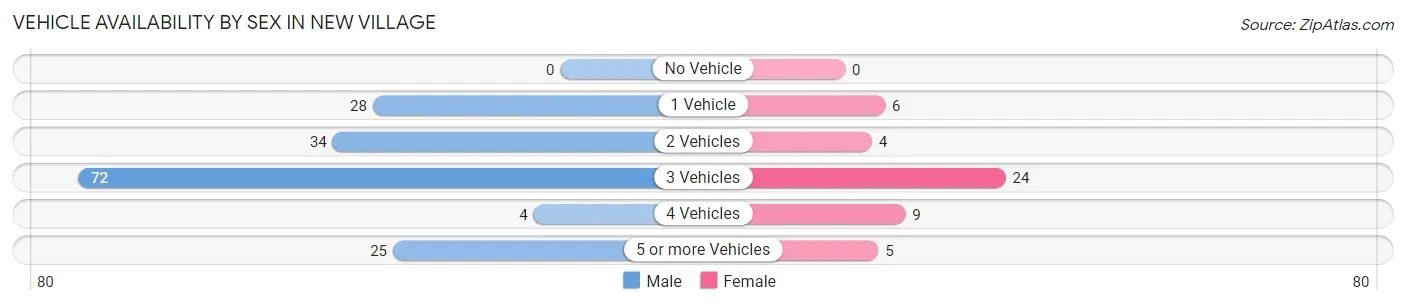
| Vehicles Available | Male | Female |
| No Vehicle | 0 (0.0%) | 0 (0.0%) |
| 1 Vehicle | 28 (17.2%) | 6 (12.5%) |
| 2 Vehicles | 34 (20.9%) | 4 (8.3%) |
| 3 Vehicles | 72 (44.2%) | 24 (50.0%) |
| 4 Vehicles | 4 (2.5%) | 9 (18.8%) |
| 5 or more Vehicles | 25 (15.3%) | 5 (10.4%) |
| Total | 163 (100.0%) | 48 (100.0%) |
Commute Time in New Village
The most frequently occuring commute durations in New Village are 60 to 89 minutes (63 commuters, 33.2%), 10 to 14 minutes (25 commuters, 13.2%), and 40 to 44 minutes (22 commuters, 11.6%).
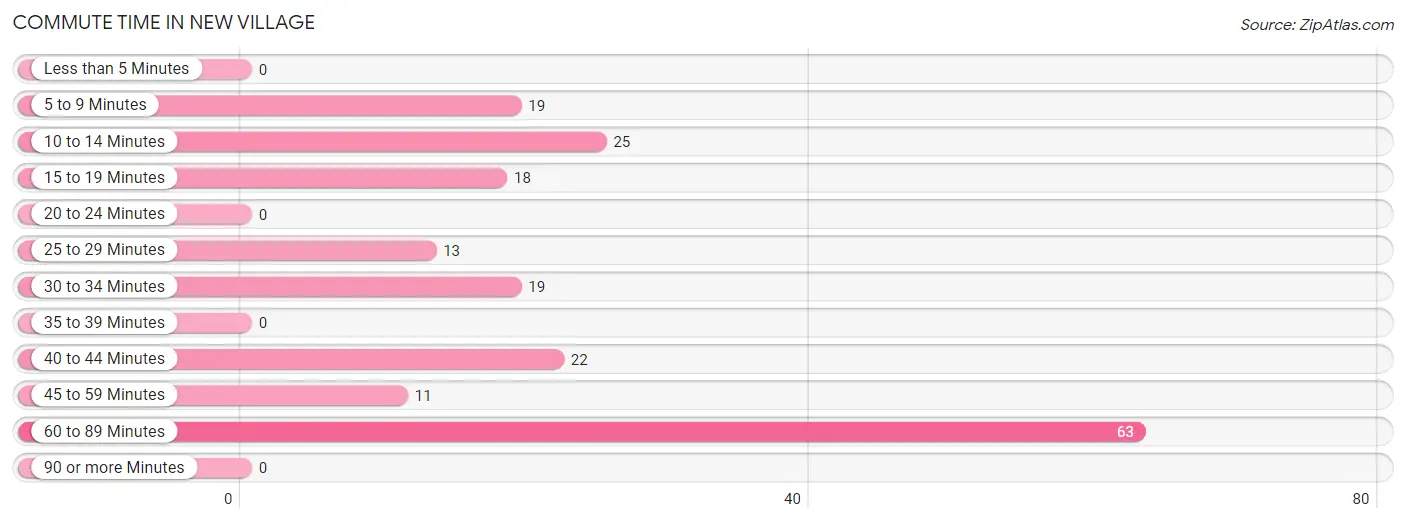
| Commute Time | # Commuters | % Commuters |
| Less than 5 Minutes | 0 | 0.0% |
| 5 to 9 Minutes | 19 | 10.0% |
| 10 to 14 Minutes | 25 | 13.2% |
| 15 to 19 Minutes | 18 | 9.5% |
| 20 to 24 Minutes | 0 | 0.0% |
| 25 to 29 Minutes | 13 | 6.8% |
| 30 to 34 Minutes | 19 | 10.0% |
| 35 to 39 Minutes | 0 | 0.0% |
| 40 to 44 Minutes | 22 | 11.6% |
| 45 to 59 Minutes | 11 | 5.8% |
| 60 to 89 Minutes | 63 | 33.2% |
| 90 or more Minutes | 0 | 0.0% |
Commute Time by Sex in New Village
The most common commute times in New Village are 60 to 89 minutes (63 commuters, 40.1%) for males and 10 to 14 minutes (14 commuters, 42.4%) for females.
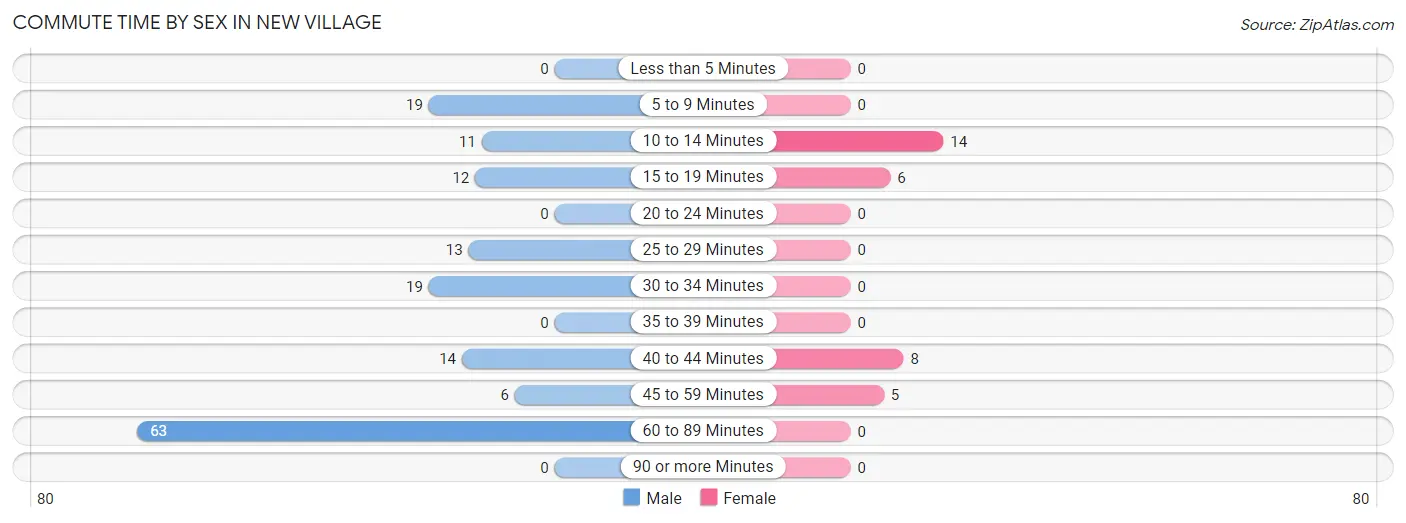
| Commute Time | Male | Female |
| Less than 5 Minutes | 0 (0.0%) | 0 (0.0%) |
| 5 to 9 Minutes | 19 (12.1%) | 0 (0.0%) |
| 10 to 14 Minutes | 11 (7.0%) | 14 (42.4%) |
| 15 to 19 Minutes | 12 (7.6%) | 6 (18.2%) |
| 20 to 24 Minutes | 0 (0.0%) | 0 (0.0%) |
| 25 to 29 Minutes | 13 (8.3%) | 0 (0.0%) |
| 30 to 34 Minutes | 19 (12.1%) | 0 (0.0%) |
| 35 to 39 Minutes | 0 (0.0%) | 0 (0.0%) |
| 40 to 44 Minutes | 14 (8.9%) | 8 (24.2%) |
| 45 to 59 Minutes | 6 (3.8%) | 5 (15.1%) |
| 60 to 89 Minutes | 63 (40.1%) | 0 (0.0%) |
| 90 or more Minutes | 0 (0.0%) | 0 (0.0%) |
Time of Departure to Work by Sex in New Village
The most frequent times of departure to work in New Village are 6:30 AM to 6:59 AM (62, 39.5%) for males and 7:00 AM to 7:29 AM (15, 45.5%) for females.
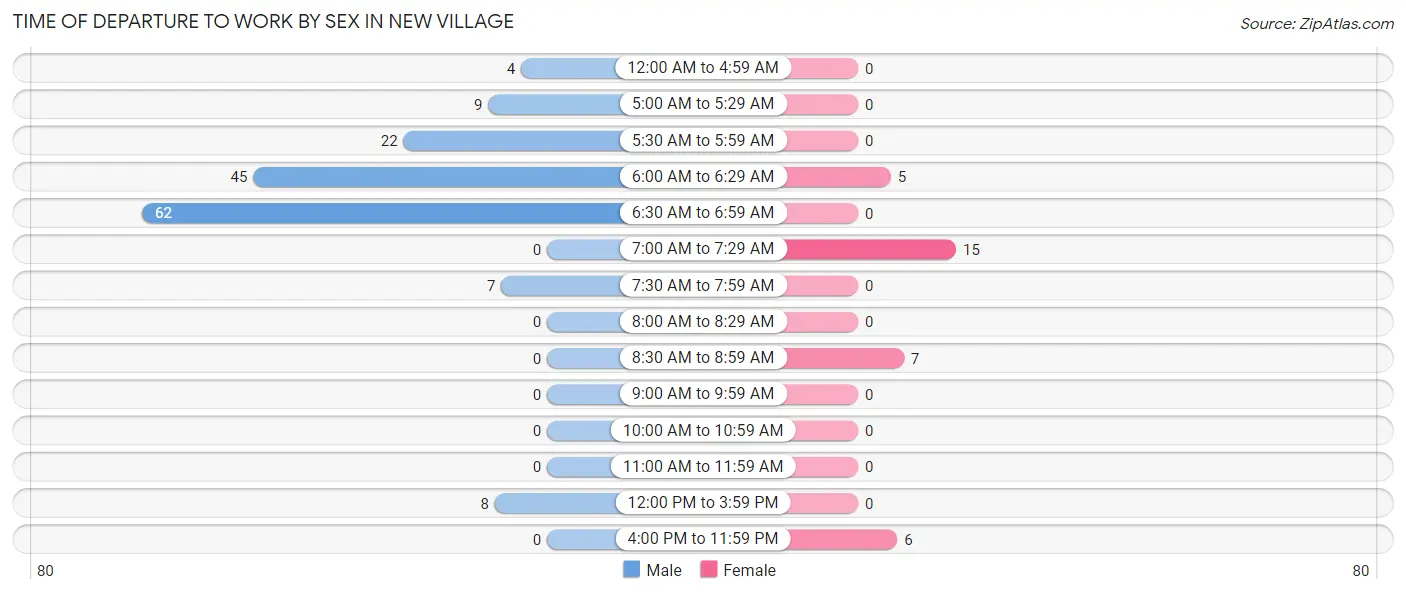
| Time of Departure | Male | Female |
| 12:00 AM to 4:59 AM | 4 (2.5%) | 0 (0.0%) |
| 5:00 AM to 5:29 AM | 9 (5.7%) | 0 (0.0%) |
| 5:30 AM to 5:59 AM | 22 (14.0%) | 0 (0.0%) |
| 6:00 AM to 6:29 AM | 45 (28.7%) | 5 (15.1%) |
| 6:30 AM to 6:59 AM | 62 (39.5%) | 0 (0.0%) |
| 7:00 AM to 7:29 AM | 0 (0.0%) | 15 (45.5%) |
| 7:30 AM to 7:59 AM | 7 (4.5%) | 0 (0.0%) |
| 8:00 AM to 8:29 AM | 0 (0.0%) | 0 (0.0%) |
| 8:30 AM to 8:59 AM | 0 (0.0%) | 7 (21.2%) |
| 9:00 AM to 9:59 AM | 0 (0.0%) | 0 (0.0%) |
| 10:00 AM to 10:59 AM | 0 (0.0%) | 0 (0.0%) |
| 11:00 AM to 11:59 AM | 0 (0.0%) | 0 (0.0%) |
| 12:00 PM to 3:59 PM | 8 (5.1%) | 0 (0.0%) |
| 4:00 PM to 11:59 PM | 0 (0.0%) | 6 (18.2%) |
| Total | 157 (100.0%) | 33 (100.0%) |
Housing Occupancy in New Village
Occupancy by Ownership in New Village
Of the total 229 dwellings in New Village, owner-occupied units account for 205 (89.5%), while renter-occupied units make up 24 (10.5%).
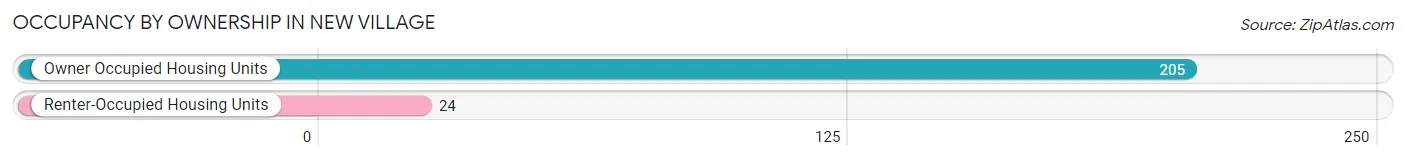
| Occupancy | # Housing Units | % Housing Units |
| Owner Occupied Housing Units | 205 | 89.5% |
| Renter-Occupied Housing Units | 24 | 10.5% |
| Total Occupied Housing Units | 229 | 100.0% |
Occupancy by Household Size in New Village
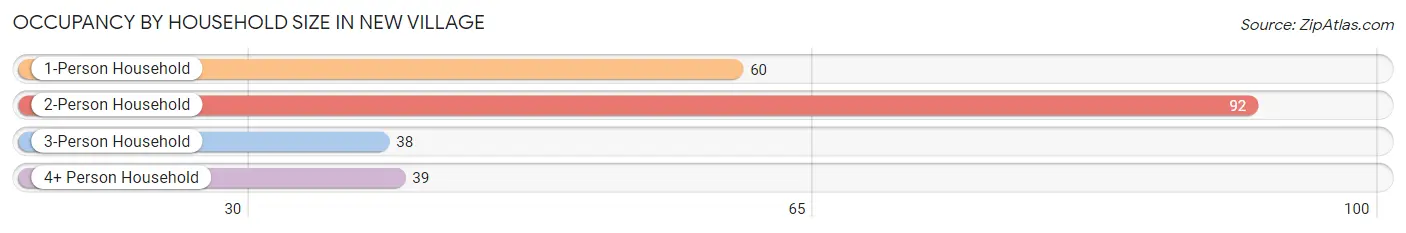
| Household Size | # Housing Units | % Housing Units |
| 1-Person Household | 60 | 26.2% |
| 2-Person Household | 92 | 40.2% |
| 3-Person Household | 38 | 16.6% |
| 4+ Person Household | 39 | 17.0% |
| Total Housing Units | 229 | 100.0% |
Occupancy by Ownership by Household Size in New Village
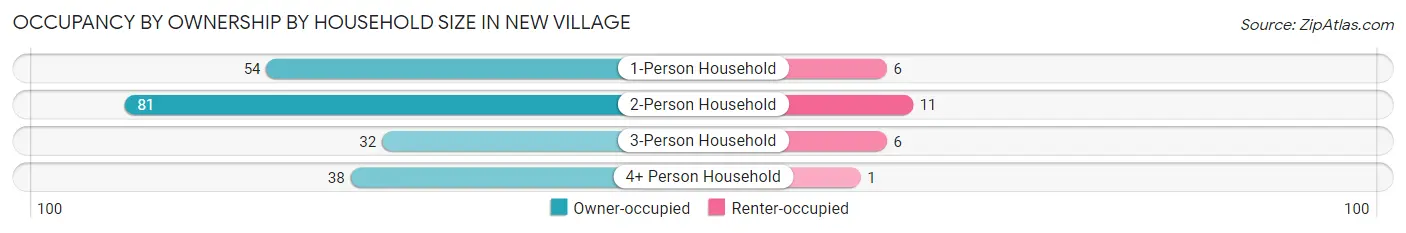
| Household Size | Owner-occupied | Renter-occupied |
| 1-Person Household | 54 (90.0%) | 6 (10.0%) |
| 2-Person Household | 81 (88.0%) | 11 (12.0%) |
| 3-Person Household | 32 (84.2%) | 6 (15.8%) |
| 4+ Person Household | 38 (97.4%) | 1 (2.6%) |
| Total Housing Units | 205 (89.5%) | 24 (10.5%) |
Occupancy by Educational Attainment in New Village
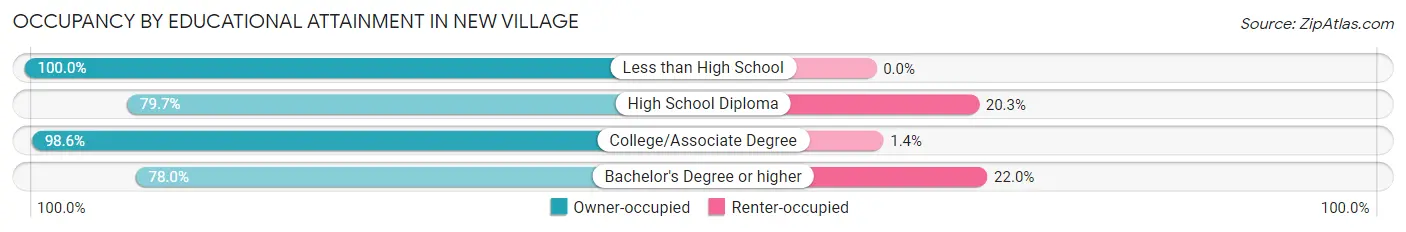
| Household Size | Owner-occupied | Renter-occupied |
| Less than High School | 49 (100.0%) | 0 (0.0%) |
| High School Diploma | 47 (79.7%) | 12 (20.3%) |
| College/Associate Degree | 70 (98.6%) | 1 (1.4%) |
| Bachelor's Degree or higher | 39 (78.0%) | 11 (22.0%) |
Occupancy by Age of Householder in New Village
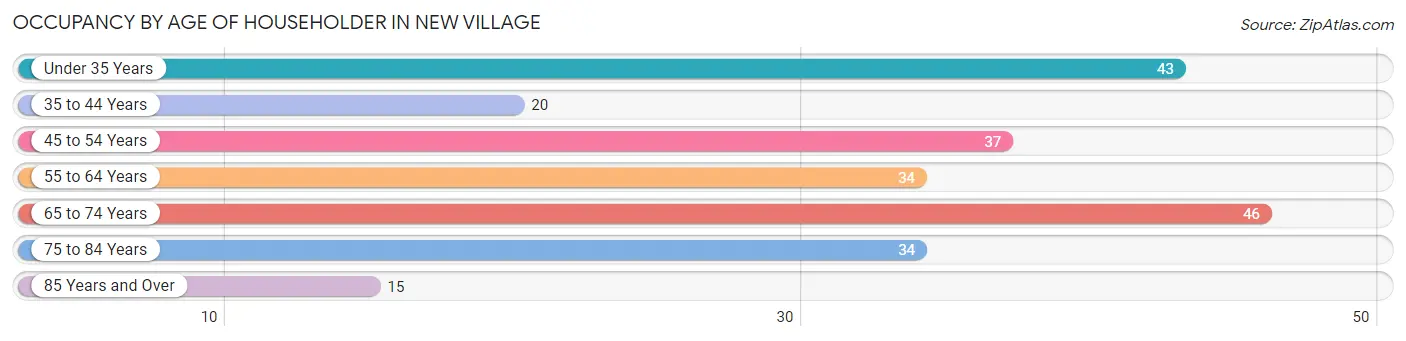
| Age Bracket | # Households | % Households |
| Under 35 Years | 43 | 18.8% |
| 35 to 44 Years | 20 | 8.7% |
| 45 to 54 Years | 37 | 16.2% |
| 55 to 64 Years | 34 | 14.8% |
| 65 to 74 Years | 46 | 20.1% |
| 75 to 84 Years | 34 | 14.8% |
| 85 Years and Over | 15 | 6.6% |
| Total | 229 | 100.0% |
Housing Finances in New Village
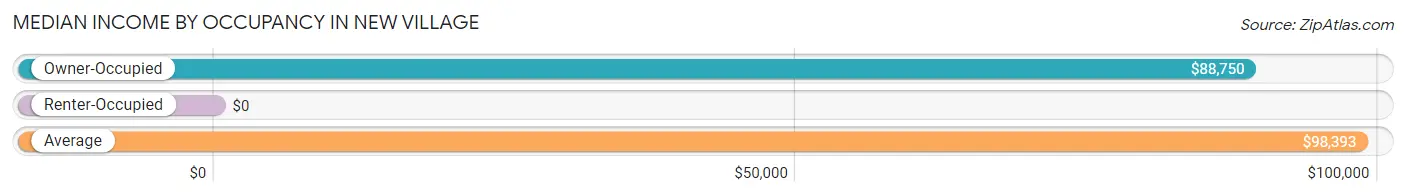
Median Income by Occupancy in New Village
| Occupancy Type | # Households | Median Income |
| Owner-Occupied | 205 (89.5%) | $88,750 |
| Renter-Occupied | 24 (10.5%) | $0 |
| Average | 229 (100.0%) | $98,393 |
Occupancy by Householder Income Bracket in New Village
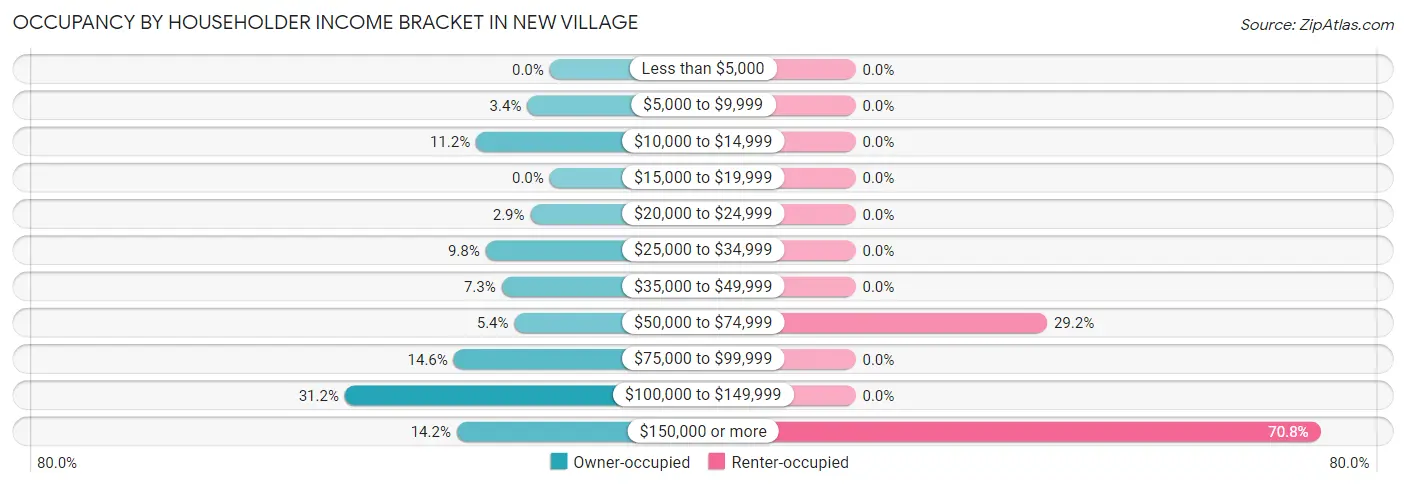
| Income Bracket | Owner-occupied | Renter-occupied |
| Less than $5,000 | 0 (0.0%) | 0 (0.0%) |
| $5,000 to $9,999 | 7 (3.4%) | 0 (0.0%) |
| $10,000 to $14,999 | 23 (11.2%) | 0 (0.0%) |
| $15,000 to $19,999 | 0 (0.0%) | 0 (0.0%) |
| $20,000 to $24,999 | 6 (2.9%) | 0 (0.0%) |
| $25,000 to $34,999 | 20 (9.8%) | 0 (0.0%) |
| $35,000 to $49,999 | 15 (7.3%) | 0 (0.0%) |
| $50,000 to $74,999 | 11 (5.4%) | 7 (29.2%) |
| $75,000 to $99,999 | 30 (14.6%) | 0 (0.0%) |
| $100,000 to $149,999 | 64 (31.2%) | 0 (0.0%) |
| $150,000 or more | 29 (14.1%) | 17 (70.8%) |
| Total | 205 (100.0%) | 24 (100.0%) |
Monthly Housing Cost Tiers in New Village
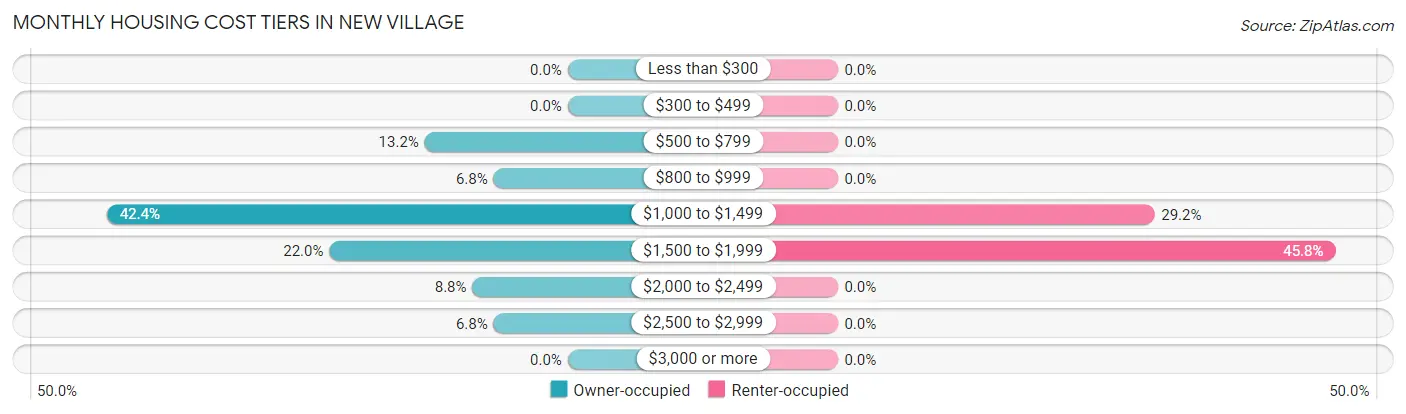
| Monthly Cost | Owner-occupied | Renter-occupied |
| Less than $300 | 0 (0.0%) | 0 (0.0%) |
| $300 to $499 | 0 (0.0%) | 0 (0.0%) |
| $500 to $799 | 27 (13.2%) | 0 (0.0%) |
| $800 to $999 | 14 (6.8%) | 0 (0.0%) |
| $1,000 to $1,499 | 87 (42.4%) | 7 (29.2%) |
| $1,500 to $1,999 | 45 (22.0%) | 11 (45.8%) |
| $2,000 to $2,499 | 18 (8.8%) | 0 (0.0%) |
| $2,500 to $2,999 | 14 (6.8%) | 0 (0.0%) |
| $3,000 or more | 0 (0.0%) | 0 (0.0%) |
| Total | 205 (100.0%) | 24 (100.0%) |
Physical Housing Characteristics in New Village
Housing Structures in New Village
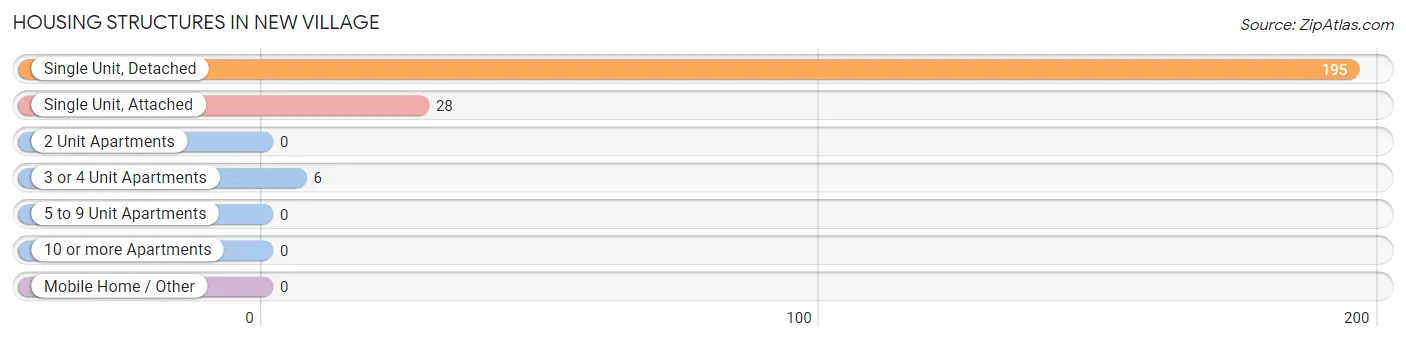
| Structure Type | # Housing Units | % Housing Units |
| Single Unit, Detached | 195 | 85.2% |
| Single Unit, Attached | 28 | 12.2% |
| 2 Unit Apartments | 0 | 0.0% |
| 3 or 4 Unit Apartments | 6 | 2.6% |
| 5 to 9 Unit Apartments | 0 | 0.0% |
| 10 or more Apartments | 0 | 0.0% |
| Mobile Home / Other | 0 | 0.0% |
| Total | 229 | 100.0% |
Housing Structures by Occupancy in New Village
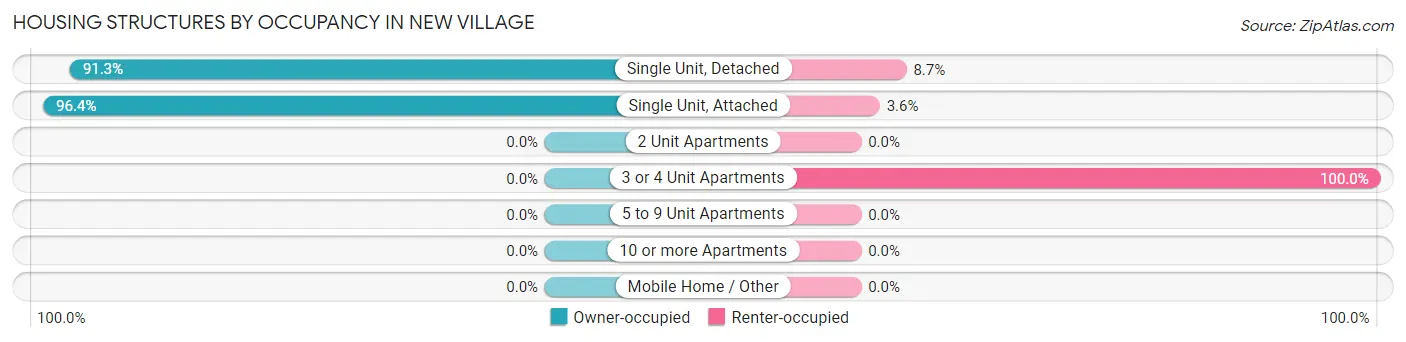
| Structure Type | Owner-occupied | Renter-occupied |
| Single Unit, Detached | 178 (91.3%) | 17 (8.7%) |
| Single Unit, Attached | 27 (96.4%) | 1 (3.6%) |
| 2 Unit Apartments | 0 (0.0%) | 0 (0.0%) |
| 3 or 4 Unit Apartments | 0 (0.0%) | 6 (100.0%) |
| 5 to 9 Unit Apartments | 0 (0.0%) | 0 (0.0%) |
| 10 or more Apartments | 0 (0.0%) | 0 (0.0%) |
| Mobile Home / Other | 0 (0.0%) | 0 (0.0%) |
| Total | 205 (89.5%) | 24 (10.5%) |
Housing Structures by Number of Rooms in New Village
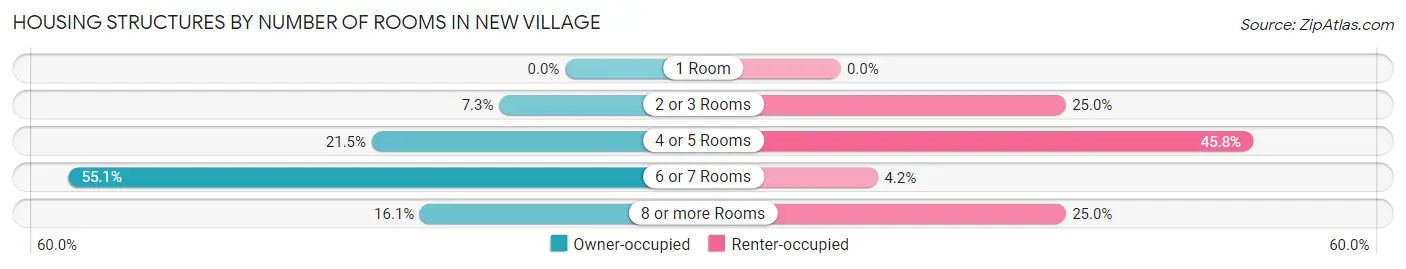
| Number of Rooms | Owner-occupied | Renter-occupied |
| 1 Room | 0 (0.0%) | 0 (0.0%) |
| 2 or 3 Rooms | 15 (7.3%) | 6 (25.0%) |
| 4 or 5 Rooms | 44 (21.5%) | 11 (45.8%) |
| 6 or 7 Rooms | 113 (55.1%) | 1 (4.2%) |
| 8 or more Rooms | 33 (16.1%) | 6 (25.0%) |
| Total | 205 (100.0%) | 24 (100.0%) |
Housing Structure by Heating Type in New Village
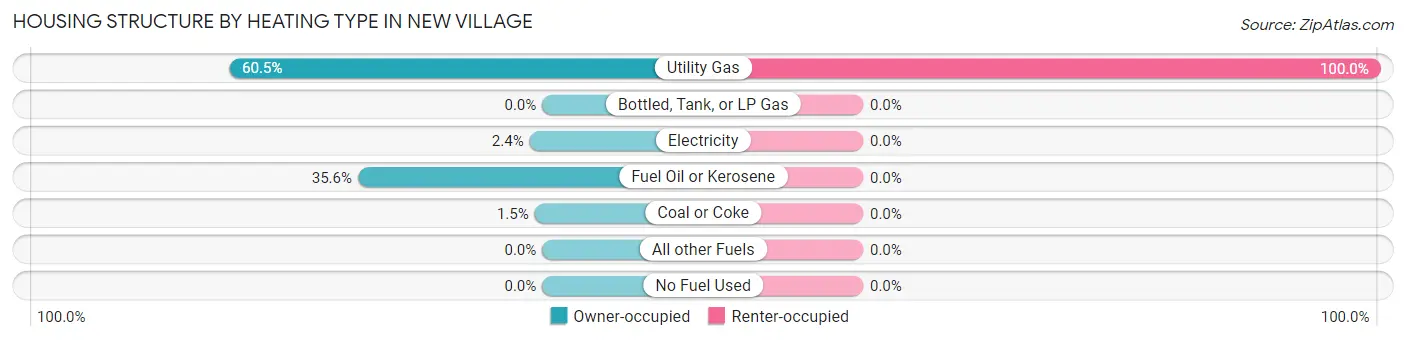
| Heating Type | Owner-occupied | Renter-occupied |
| Utility Gas | 124 (60.5%) | 24 (100.0%) |
| Bottled, Tank, or LP Gas | 0 (0.0%) | 0 (0.0%) |
| Electricity | 5 (2.4%) | 0 (0.0%) |
| Fuel Oil or Kerosene | 73 (35.6%) | 0 (0.0%) |
| Coal or Coke | 3 (1.5%) | 0 (0.0%) |
| All other Fuels | 0 (0.0%) | 0 (0.0%) |
| No Fuel Used | 0 (0.0%) | 0 (0.0%) |
| Total | 205 (100.0%) | 24 (100.0%) |
Household Vehicle Usage in New Village
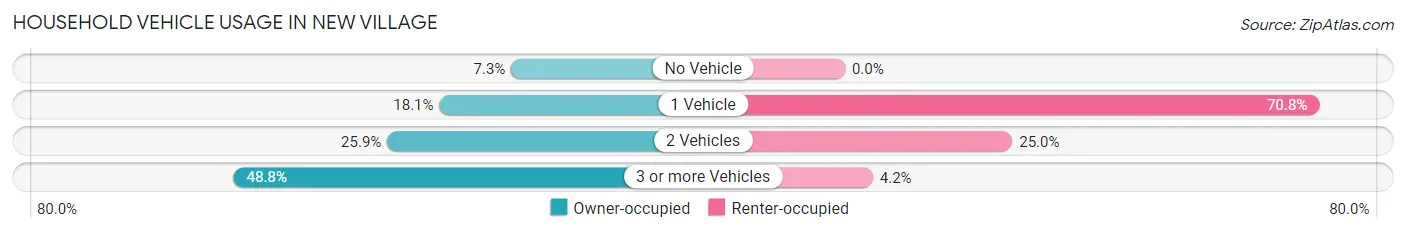
| Vehicles per Household | Owner-occupied | Renter-occupied |
| No Vehicle | 15 (7.3%) | 0 (0.0%) |
| 1 Vehicle | 37 (18.0%) | 17 (70.8%) |
| 2 Vehicles | 53 (25.9%) | 6 (25.0%) |
| 3 or more Vehicles | 100 (48.8%) | 1 (4.2%) |
| Total | 205 (100.0%) | 24 (100.0%) |
Real Estate & Mortgages in New Village
Real Estate and Mortgage Overview in New Village
| Characteristic | Without Mortgage | With Mortgage |
| Housing Units | 102 | 103 |
| Median Property Value | $313,600 | $221,800 |
| Median Household Income | $82,679 | $17 |
| Monthly Housing Costs | $1,042 | $0 |
| Real Estate Taxes | $8,500 | $0 |
Property Value by Mortgage Status in New Village
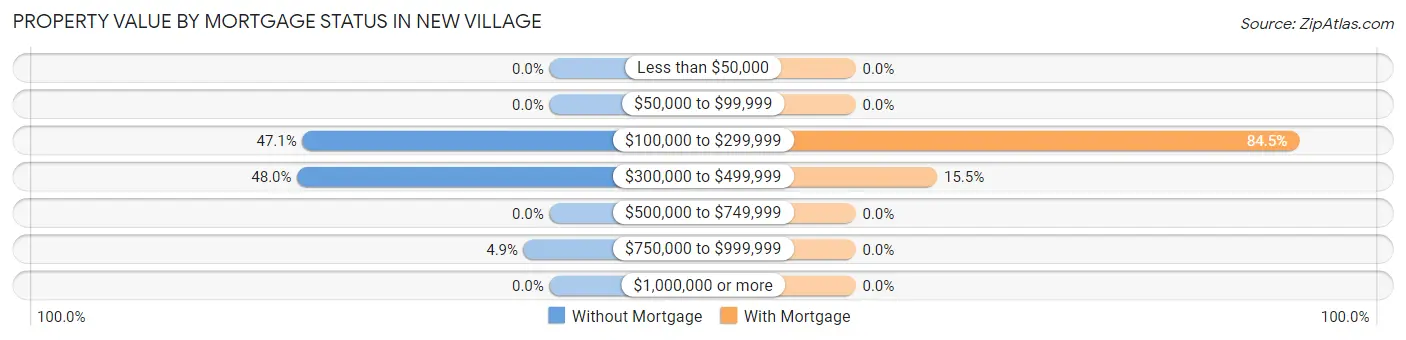
| Property Value | Without Mortgage | With Mortgage |
| Less than $50,000 | 0 (0.0%) | 0 (0.0%) |
| $50,000 to $99,999 | 0 (0.0%) | 0 (0.0%) |
| $100,000 to $299,999 | 48 (47.1%) | 87 (84.5%) |
| $300,000 to $499,999 | 49 (48.0%) | 16 (15.5%) |
| $500,000 to $749,999 | 0 (0.0%) | 0 (0.0%) |
| $750,000 to $999,999 | 5 (4.9%) | 0 (0.0%) |
| $1,000,000 or more | 0 (0.0%) | 0 (0.0%) |
| Total | 102 (100.0%) | 103 (100.0%) |
Household Income by Mortgage Status in New Village
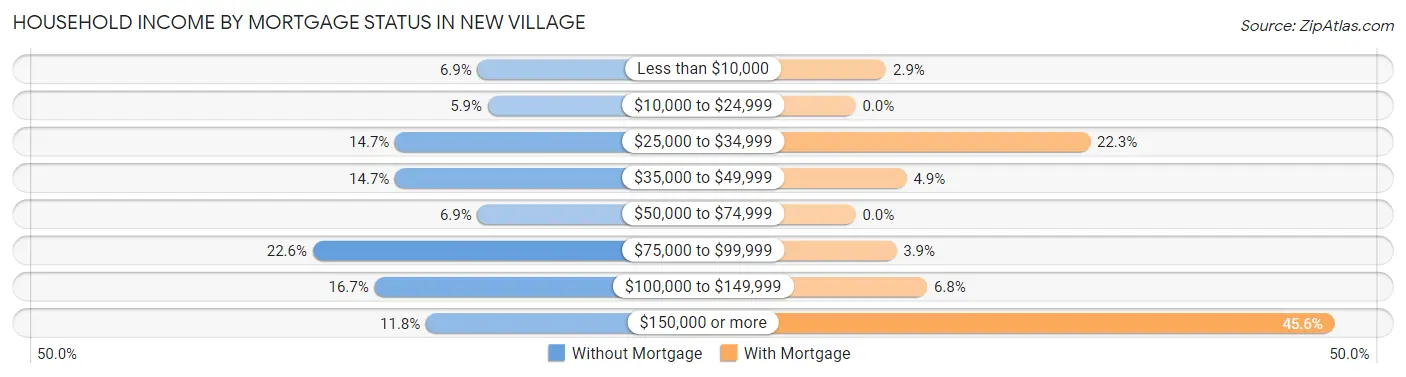
| Household Income | Without Mortgage | With Mortgage |
| Less than $10,000 | 7 (6.9%) | 3 (2.9%) |
| $10,000 to $24,999 | 6 (5.9%) | 0 (0.0%) |
| $25,000 to $34,999 | 15 (14.7%) | 23 (22.3%) |
| $35,000 to $49,999 | 15 (14.7%) | 5 (4.9%) |
| $50,000 to $74,999 | 7 (6.9%) | 0 (0.0%) |
| $75,000 to $99,999 | 23 (22.6%) | 4 (3.9%) |
| $100,000 to $149,999 | 17 (16.7%) | 7 (6.8%) |
| $150,000 or more | 12 (11.8%) | 47 (45.6%) |
| Total | 102 (100.0%) | 103 (100.0%) |
Property Value to Household Income Ratio in New Village
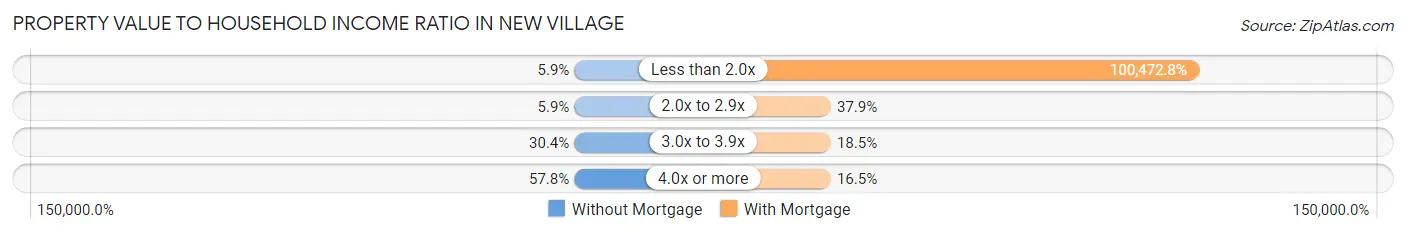
| Value-to-Income Ratio | Without Mortgage | With Mortgage |
| Less than 2.0x | 6 (5.9%) | 103,487 (100,472.8%) |
| 2.0x to 2.9x | 6 (5.9%) | 39 (37.9%) |
| 3.0x to 3.9x | 31 (30.4%) | 19 (18.4%) |
| 4.0x or more | 59 (57.8%) | 17 (16.5%) |
| Total | 102 (100.0%) | 103 (100.0%) |
Real Estate Taxes by Mortgage Status in New Village
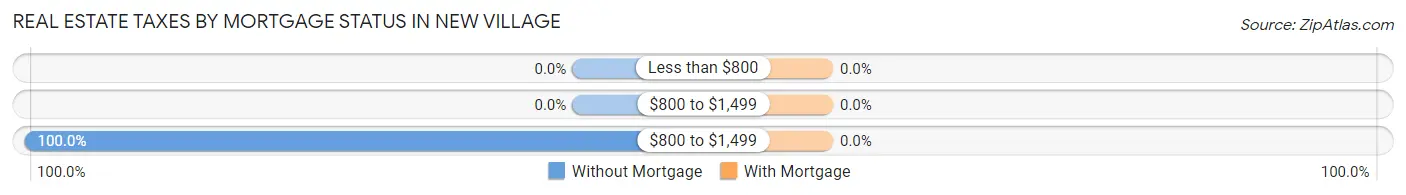
| Property Taxes | Without Mortgage | With Mortgage |
| Less than $800 | 0 (0.0%) | 0 (0.0%) |
| $800 to $1,499 | 0 (0.0%) | 0 (0.0%) |
| $800 to $1,499 | 102 (100.0%) | 0 (0.0%) |
| Total | 102 (100.0%) | 103 (100.0%) |
Health & Disability in New Village
Health Insurance Coverage by Age in New Village
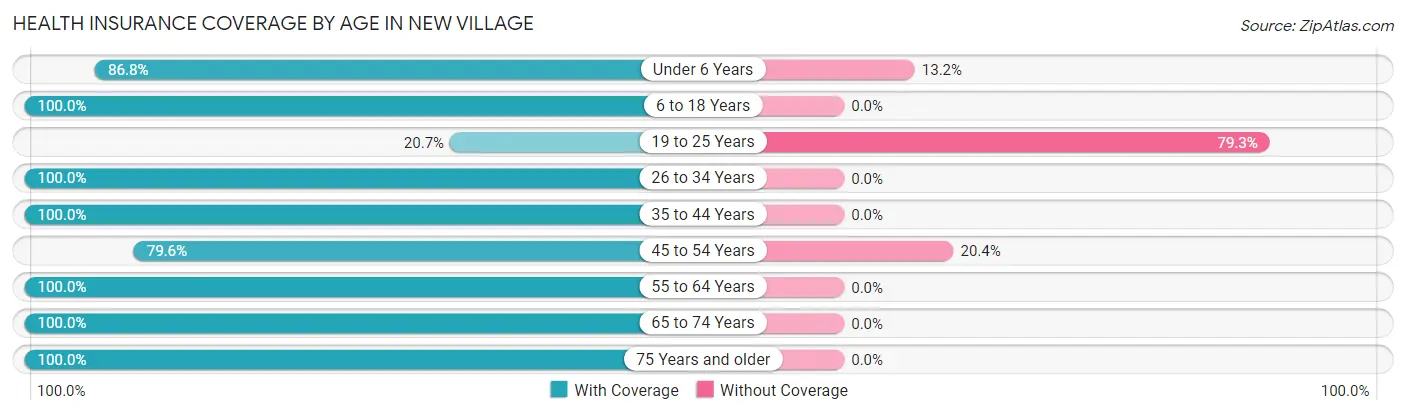
| Age Bracket | With Coverage | Without Coverage |
| Under 6 Years | 33 (86.8%) | 5 (13.2%) |
| 6 to 18 Years | 20 (100.0%) | 0 (0.0%) |
| 19 to 25 Years | 6 (20.7%) | 23 (79.3%) |
| 26 to 34 Years | 56 (100.0%) | 0 (0.0%) |
| 35 to 44 Years | 65 (100.0%) | 0 (0.0%) |
| 45 to 54 Years | 43 (79.6%) | 11 (20.4%) |
| 55 to 64 Years | 70 (100.0%) | 0 (0.0%) |
| 65 to 74 Years | 66 (100.0%) | 0 (0.0%) |
| 75 Years and older | 76 (100.0%) | 0 (0.0%) |
| Total | 435 (91.8%) | 39 (8.2%) |
Health Insurance Coverage by Citizenship Status in New Village
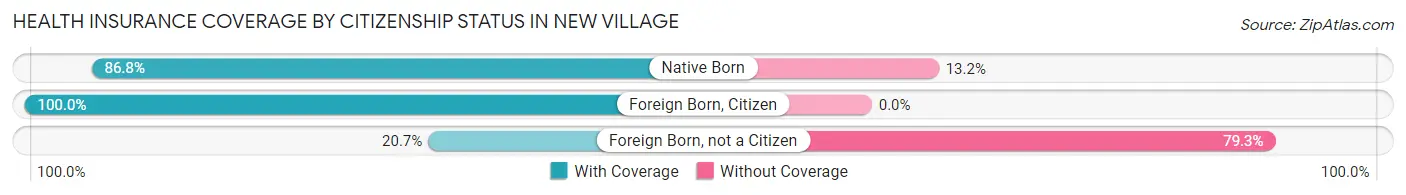
| Citizenship Status | With Coverage | Without Coverage |
| Native Born | 33 (86.8%) | 5 (13.2%) |
| Foreign Born, Citizen | 20 (100.0%) | 0 (0.0%) |
| Foreign Born, not a Citizen | 6 (20.7%) | 23 (79.3%) |
Health Insurance Coverage by Household Income in New Village
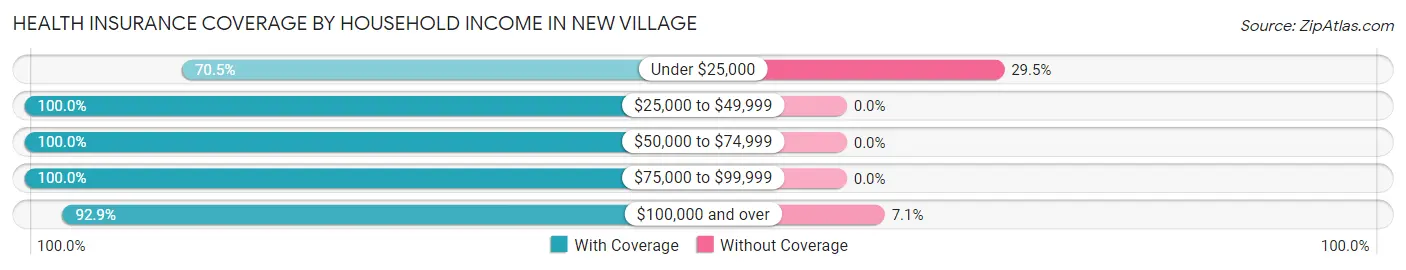
| Household Income | With Coverage | Without Coverage |
| Under $25,000 | 55 (70.5%) | 23 (29.5%) |
| $25,000 to $49,999 | 54 (100.0%) | 0 (0.0%) |
| $50,000 to $74,999 | 45 (100.0%) | 0 (0.0%) |
| $75,000 to $99,999 | 72 (100.0%) | 0 (0.0%) |
| $100,000 and over | 209 (92.9%) | 16 (7.1%) |
Public vs Private Health Insurance Coverage by Age in New Village
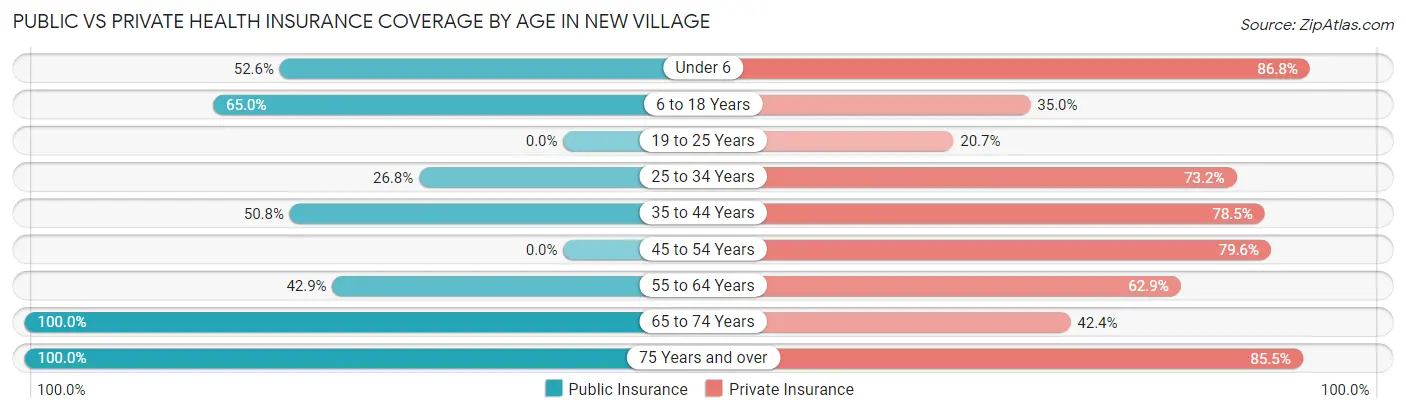
| Age Bracket | Public Insurance | Private Insurance |
| Under 6 | 20 (52.6%) | 33 (86.8%) |
| 6 to 18 Years | 13 (65.0%) | 7 (35.0%) |
| 19 to 25 Years | 0 (0.0%) | 6 (20.7%) |
| 25 to 34 Years | 15 (26.8%) | 41 (73.2%) |
| 35 to 44 Years | 33 (50.8%) | 51 (78.5%) |
| 45 to 54 Years | 0 (0.0%) | 43 (79.6%) |
| 55 to 64 Years | 30 (42.9%) | 44 (62.9%) |
| 65 to 74 Years | 66 (100.0%) | 28 (42.4%) |
| 75 Years and over | 76 (100.0%) | 65 (85.5%) |
| Total | 253 (53.4%) | 318 (67.1%) |
Disability Status by Sex by Age in New Village
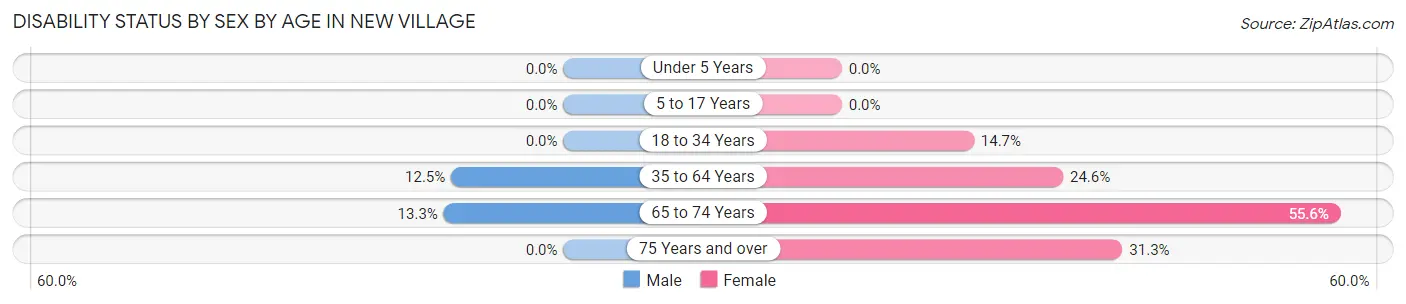
| Age Bracket | Male | Female |
| Under 5 Years | 0 (0.0%) | 0 (0.0%) |
| 5 to 17 Years | 0 (0.0%) | 0 (0.0%) |
| 18 to 34 Years | 0 (0.0%) | 5 (14.7%) |
| 35 to 64 Years | 15 (12.5%) | 17 (24.6%) |
| 65 to 74 Years | 4 (13.3%) | 20 (55.6%) |
| 75 Years and over | 0 (0.0%) | 15 (31.2%) |
Disability Class by Sex by Age in New Village
Disability Class: Hearing Difficulty
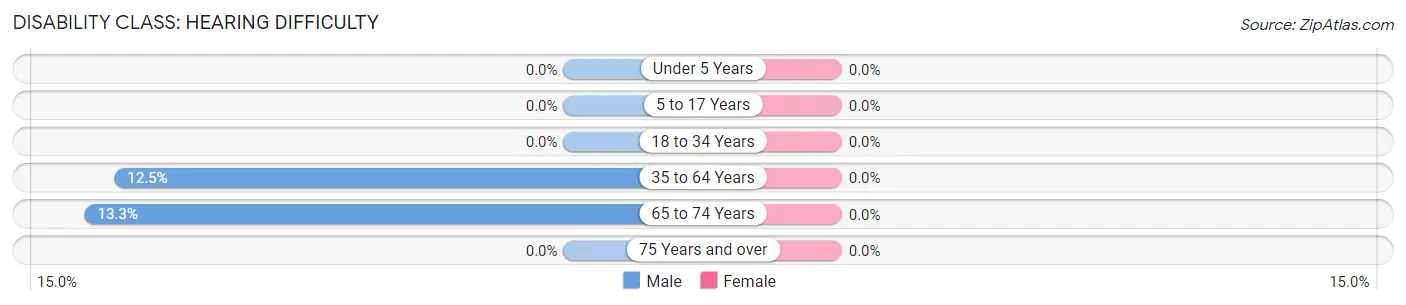
| Age Bracket | Male | Female |
| Under 5 Years | 0 (0.0%) | 0 (0.0%) |
| 5 to 17 Years | 0 (0.0%) | 0 (0.0%) |
| 18 to 34 Years | 0 (0.0%) | 0 (0.0%) |
| 35 to 64 Years | 15 (12.5%) | 0 (0.0%) |
| 65 to 74 Years | 4 (13.3%) | 0 (0.0%) |
| 75 Years and over | 0 (0.0%) | 0 (0.0%) |
Disability Class: Vision Difficulty
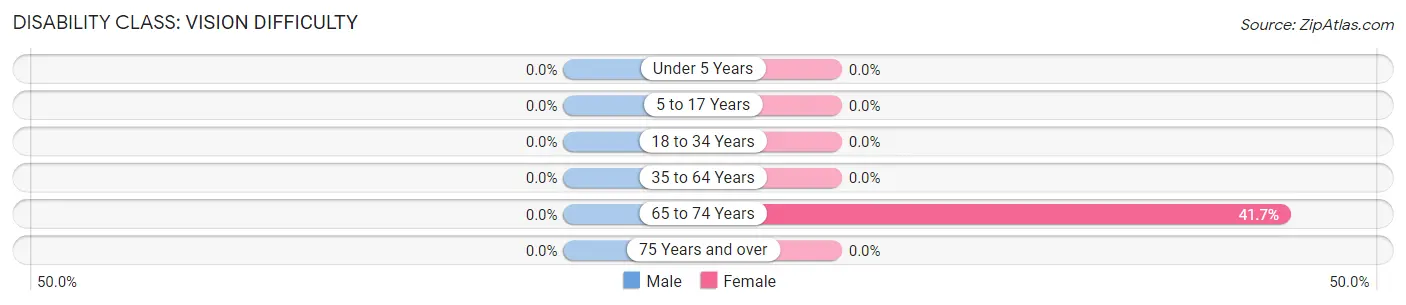
| Age Bracket | Male | Female |
| Under 5 Years | 0 (0.0%) | 0 (0.0%) |
| 5 to 17 Years | 0 (0.0%) | 0 (0.0%) |
| 18 to 34 Years | 0 (0.0%) | 0 (0.0%) |
| 35 to 64 Years | 0 (0.0%) | 0 (0.0%) |
| 65 to 74 Years | 0 (0.0%) | 15 (41.7%) |
| 75 Years and over | 0 (0.0%) | 0 (0.0%) |
Disability Class: Cognitive Difficulty
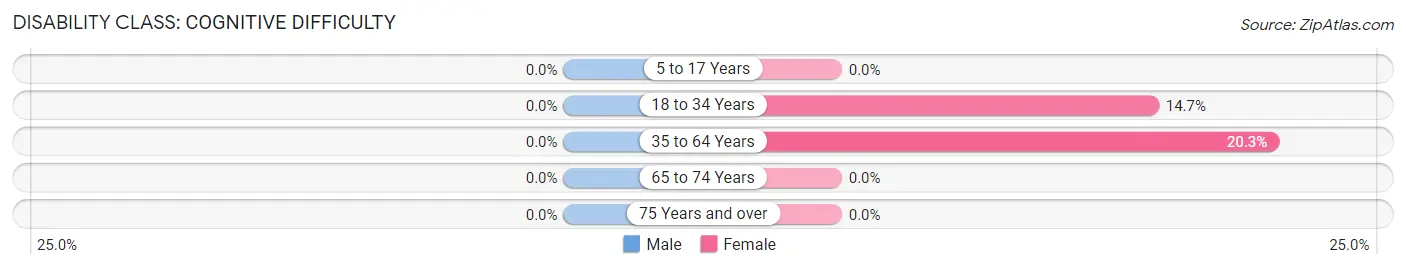
| Age Bracket | Male | Female |
| 5 to 17 Years | 0 (0.0%) | 0 (0.0%) |
| 18 to 34 Years | 0 (0.0%) | 5 (14.7%) |
| 35 to 64 Years | 0 (0.0%) | 14 (20.3%) |
| 65 to 74 Years | 0 (0.0%) | 0 (0.0%) |
| 75 Years and over | 0 (0.0%) | 0 (0.0%) |
Disability Class: Ambulatory Difficulty
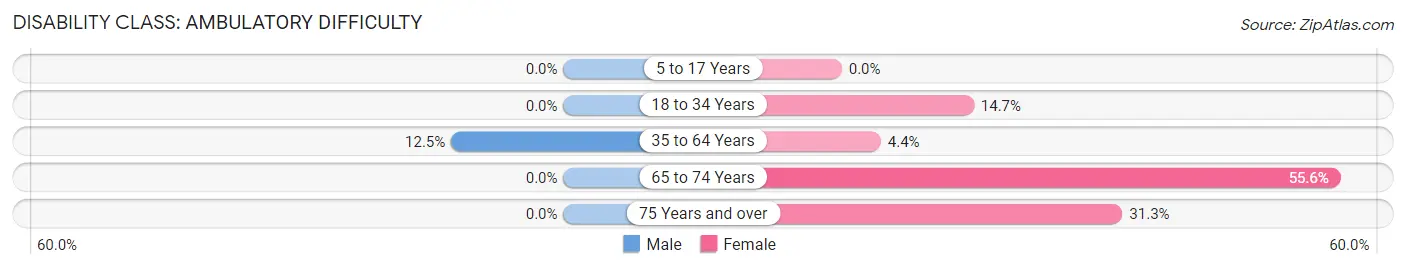
| Age Bracket | Male | Female |
| 5 to 17 Years | 0 (0.0%) | 0 (0.0%) |
| 18 to 34 Years | 0 (0.0%) | 5 (14.7%) |
| 35 to 64 Years | 15 (12.5%) | 3 (4.3%) |
| 65 to 74 Years | 0 (0.0%) | 20 (55.6%) |
| 75 Years and over | 0 (0.0%) | 15 (31.2%) |
Disability Class: Self-Care Difficulty
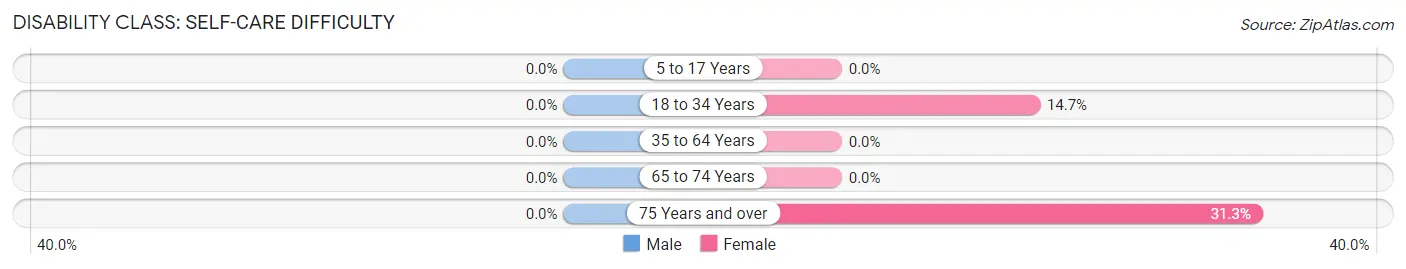
| Age Bracket | Male | Female |
| 5 to 17 Years | 0 (0.0%) | 0 (0.0%) |
| 18 to 34 Years | 0 (0.0%) | 5 (14.7%) |
| 35 to 64 Years | 0 (0.0%) | 0 (0.0%) |
| 65 to 74 Years | 0 (0.0%) | 0 (0.0%) |
| 75 Years and over | 0 (0.0%) | 15 (31.2%) |
Technology Access in New Village
Computing Device Access in New Village
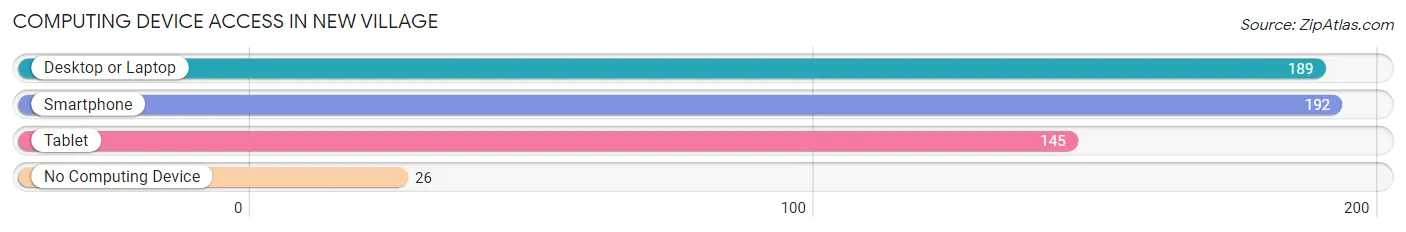
| Device Type | # Households | % Households |
| Desktop or Laptop | 189 | 82.5% |
| Smartphone | 192 | 83.8% |
| Tablet | 145 | 63.3% |
| No Computing Device | 26 | 11.4% |
| Total | 229 | 100.0% |
Internet Access in New Village
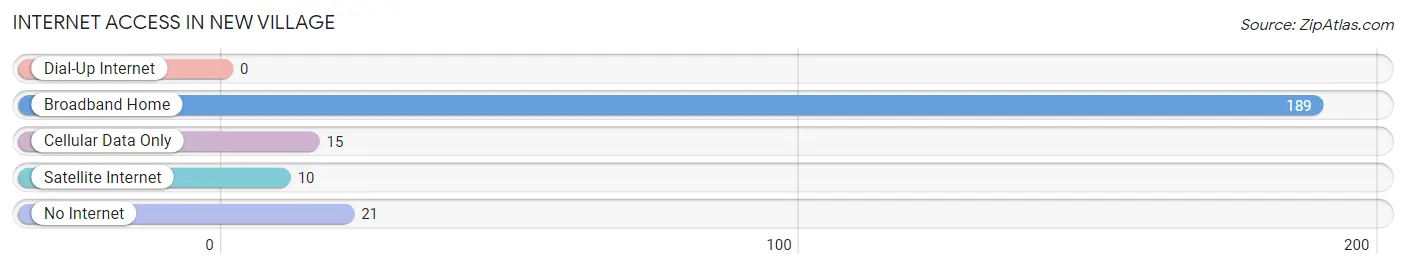
| Internet Type | # Households | % Households |
| Dial-Up Internet | 0 | 0.0% |
| Broadband Home | 189 | 82.5% |
| Cellular Data Only | 15 | 6.6% |
| Satellite Internet | 10 | 4.4% |
| No Internet | 21 | 9.2% |
| Total | 229 | 100.0% |
New Village Summary
New Village is a small unincorporated community located in the northern part of Ocean County, New Jersey. It is situated in the Pine Barrens region of the state, and is bordered by the towns of Barnegat, Little Egg Harbor, and Tuckerton. The community is home to a population of approximately 1,000 people, and is known for its rural atmosphere and small-town charm.
History
New Village was first settled in the late 1700s by a group of Quakers from Pennsylvania. The community was originally known as “New Quaker Village”, and was home to a number of small farms and businesses. In the early 1800s, the village was renamed “New Village”, and the area began to grow and develop. By the mid-1800s, the village had become a popular destination for vacationers, and several hotels and resorts were built in the area.
In the late 1800s, the village was home to a number of sawmills and lumber yards, and the area became known for its timber industry. The village also became a popular destination for hunters and fishermen, and the area was home to a number of hunting and fishing lodges.
In the early 1900s, the village began to decline in population, and many of the businesses and resorts closed. In the 1950s, the village was home to a number of small farms and businesses, and the area was known for its rural atmosphere and small-town charm.
Geography
New Village is located in the northern part of Ocean County, New Jersey. It is situated in the Pine Barrens region of the state, and is bordered by the towns of Barnegat, Little Egg Harbor, and Tuckerton. The community is located approximately 25 miles from Atlantic City, and is approximately 50 miles from Philadelphia.
The village is situated on a flat, sandy plain, and is surrounded by dense pine forests. The area is known for its rural atmosphere and small-town charm, and is home to a number of small farms and businesses.
Economy
The economy of New Village is largely based on agriculture and tourism. The area is home to a number of small farms and businesses, and the village is known for its rural atmosphere and small-town charm. The village is also home to a number of hunting and fishing lodges, and is a popular destination for hunters and fishermen.
In recent years, the village has become a popular destination for vacationers, and several hotels and resorts have been built in the area. The village is also home to a number of small retail stores and restaurants, and is a popular destination for shopping and dining.
Demographics
As of the 2010 census, the population of New Village was 1,000 people. The racial makeup of the village was 97.7% White, 0.7% African American, 0.3% Native American, 0.3% Asian, and 0.9% from other races. The median household income in the village was $50,000, and the median age was 44 years.
Conclusion
New Village is a small unincorporated community located in the northern part of Ocean County, New Jersey. It is situated in the Pine Barrens region of the state, and is bordered by the towns of Barnegat, Little Egg Harbor, and Tuckerton. The community is home to a population of approximately 1,000 people, and is known for its rural atmosphere and small-town charm. The economy of New Village is largely based on agriculture and tourism, and the village is home to a number of small farms and businesses. The village is also a popular destination for vacationers, and is home to a number of hunting and fishing lodges. The racial makeup of the village is predominantly White, and the median household income is $50,000. New Village is a charming and picturesque community, and is a popular destination for visitors and residents alike.
Common Questions
What is Per Capita Income in New Village?
Per Capita income in New Village is $45,765.
What is the Median Family Income in New Village?
Median Family Income in New Village is $112,721.
What is the Median Household income in New Village?
Median Household Income in New Village is $98,393.
What is Inequality or Gini Index in New Village?
Inequality or Gini Index in New Village is 0.39.
What is the Total Population of New Village?
Total Population of New Village is 474.
What is the Total Male Population of New Village?
Total Male Population of New Village is 230.
What is the Total Female Population of New Village?
Total Female Population of New Village is 244.
What is the Ratio of Males per 100 Females in New Village?
There are 94.26 Males per 100 Females in New Village.
What is the Ratio of Females per 100 Males in New Village?
There are 106.09 Females per 100 Males in New Village.
What is the Median Population Age in New Village?
Median Population Age in New Village is 51.6 Years.
What is the Average Family Size in New Village
Average Family Size in New Village is 2.3 People.
What is the Average Household Size in New Village
Average Household Size in New Village is 2.1 People.
How Large is the Labor Force in New Village?
There are 243 People in the Labor Forcein in New Village.
What is the Percentage of People in the Labor Force in New Village?
57.4% of People are in the Labor Force in New Village.
What is the Unemployment Rate in New Village?
Unemployment Rate in New Village is 7.8%.