Tuckerton borough, NJ Map & Demographics
Tuckerton borough Overview
$43,962
PER CAPITA INCOME
$94,648
AVG FAMILY INCOME
$80,957
AVG HOUSEHOLD INCOME
37.3%
WAGE / INCOME GAP [ % ]
62.7¢/ $1
WAGE / INCOME GAP [ $ ]
0.39
INEQUALITY / GINI INDEX
3,582
TOTAL POPULATION
1,747
MALE POPULATION
1,835
FEMALE POPULATION
95.20
MALES / 100 FEMALES
105.04
FEMALES / 100 MALES
44.4
MEDIAN AGE
3.0
AVG FAMILY SIZE
2.3
AVG HOUSEHOLD SIZE
1,876
LABOR FORCE [ PEOPLE ]
63.2%
PERCENT IN LABOR FORCE
8.7%
UNEMPLOYMENT RATE
Income in Tuckerton borough
Income Overview in Tuckerton borough
Per Capita Income in Tuckerton borough is $43,962, while median incomes of families and households are $94,648 and $80,957 respectively.
| Characteristic | Number | Measure |
| Per Capita Income | 3,582 | $43,962 |
| Median Family Income | 865 | $94,648 |
| Mean Family Income | 865 | $130,774 |
| Median Household Income | 1,539 | $80,957 |
| Mean Household Income | 1,539 | $101,557 |
| Income Deficit | 865 | $0 |
| Wage / Income Gap (%) | 3,582 | 37.31% |
| Wage / Income Gap ($) | 3,582 | 62.69¢ per $1 |
| Gini / Inequality Index | 3,582 | 0.39 |
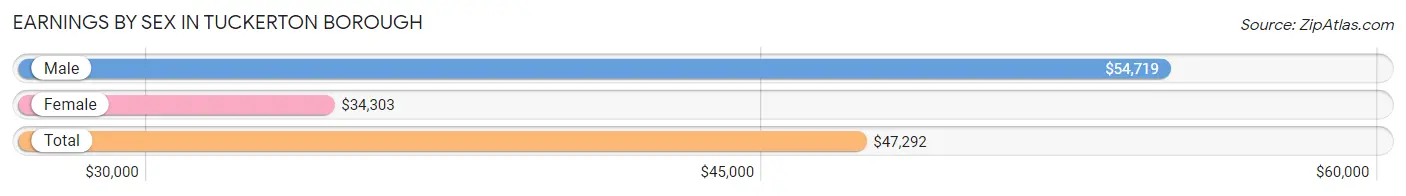
Earnings by Sex in Tuckerton borough
Average Earnings in Tuckerton borough are $47,292, $54,719 for men and $34,303 for women, a difference of 37.3%.
| Sex | Number | Average Earnings |
| Male | 1,005 (51.4%) | $54,719 |
| Female | 951 (48.6%) | $34,303 |
| Total | 1,956 (100.0%) | $47,292 |
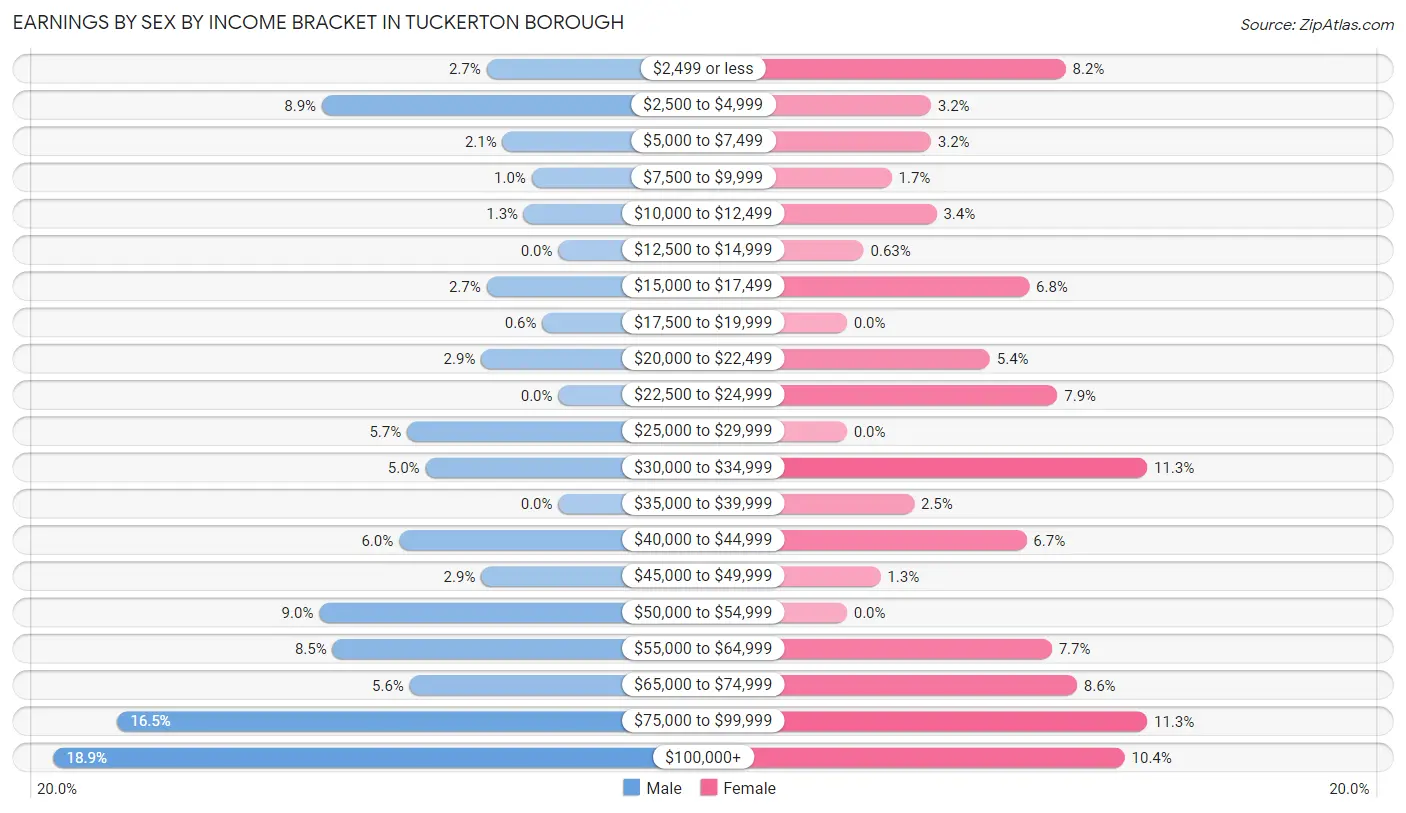
Earnings by Sex by Income Bracket in Tuckerton borough
The most common earnings brackets in Tuckerton borough are $100,000+ for men (190 | 18.9%) and $30,000 to $34,999 for women (107 | 11.3%).
| Income | Male | Female |
| $2,499 or less | 27 (2.7%) | 78 (8.2%) |
| $2,500 to $4,999 | 89 (8.9%) | 30 (3.2%) |
| $5,000 to $7,499 | 21 (2.1%) | 30 (3.2%) |
| $7,500 to $9,999 | 10 (1.0%) | 16 (1.7%) |
| $10,000 to $12,499 | 13 (1.3%) | 32 (3.4%) |
| $12,500 to $14,999 | 0 (0.0%) | 6 (0.6%) |
| $15,000 to $17,499 | 27 (2.7%) | 65 (6.8%) |
| $17,500 to $19,999 | 6 (0.6%) | 0 (0.0%) |
| $20,000 to $22,499 | 29 (2.9%) | 51 (5.4%) |
| $22,500 to $24,999 | 0 (0.0%) | 75 (7.9%) |
| $25,000 to $29,999 | 57 (5.7%) | 0 (0.0%) |
| $30,000 to $34,999 | 50 (5.0%) | 107 (11.3%) |
| $35,000 to $39,999 | 0 (0.0%) | 24 (2.5%) |
| $40,000 to $44,999 | 60 (6.0%) | 64 (6.7%) |
| $45,000 to $49,999 | 29 (2.9%) | 12 (1.3%) |
| $50,000 to $54,999 | 90 (9.0%) | 0 (0.0%) |
| $55,000 to $64,999 | 85 (8.5%) | 73 (7.7%) |
| $65,000 to $74,999 | 56 (5.6%) | 82 (8.6%) |
| $75,000 to $99,999 | 166 (16.5%) | 107 (11.3%) |
| $100,000+ | 190 (18.9%) | 99 (10.4%) |
| Total | 1,005 (100.0%) | 951 (100.0%) |
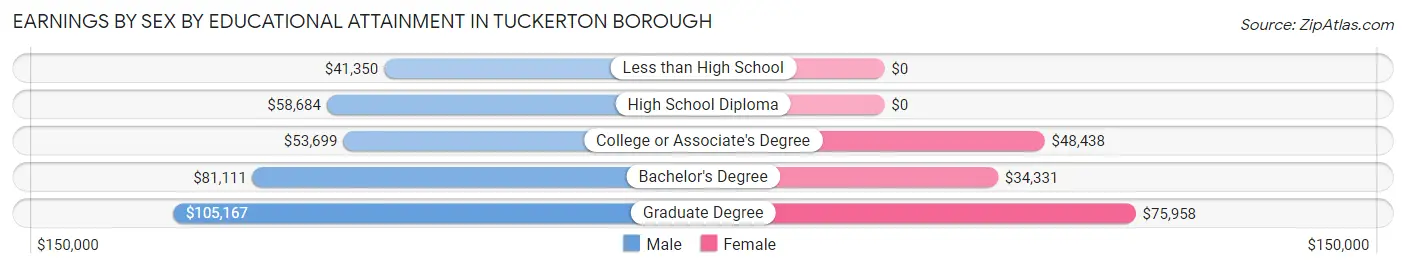
Earnings by Sex by Educational Attainment in Tuckerton borough
Average earnings in Tuckerton borough are $63,309 for men and $43,008 for women, a difference of 32.1%. Men with an educational attainment of graduate degree enjoy the highest average annual earnings of $105,167, while those with less than high school education earn the least with $41,350. Women with an educational attainment of graduate degree earn the most with the average annual earnings of $75,958, while those with bachelor's degree education have the smallest earnings of $34,331.
| Educational Attainment | Male Income | Female Income |
| Less than High School | $41,350 | $0 |
| High School Diploma | $58,684 | $0 |
| College or Associate's Degree | $53,699 | $48,438 |
| Bachelor's Degree | $81,111 | $34,331 |
| Graduate Degree | $105,167 | $75,958 |
| Total | $63,309 | $43,008 |
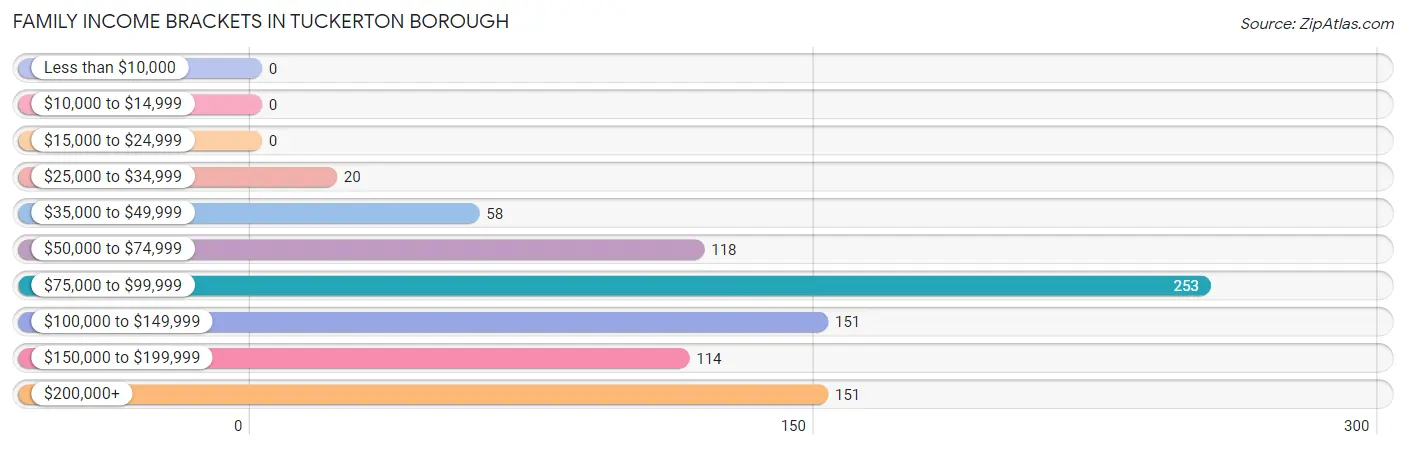
Family Income in Tuckerton borough
Family Income Brackets in Tuckerton borough
According to the Tuckerton borough family income data, there are 253 families falling into the $75,000 to $99,999 income range, which is the most common income bracket and makes up 29.2% of all families.
| Income Bracket | # Families | % Families |
| Less than $10,000 | 0 | 0.0% |
| $10,000 to $14,999 | 0 | 0.0% |
| $15,000 to $24,999 | 0 | 0.0% |
| $25,000 to $34,999 | 20 | 2.3% |
| $35,000 to $49,999 | 58 | 6.7% |
| $50,000 to $74,999 | 118 | 13.6% |
| $75,000 to $99,999 | 253 | 29.2% |
| $100,000 to $149,999 | 151 | 17.5% |
| $150,000 to $199,999 | 114 | 13.2% |
| $200,000+ | 151 | 17.5% |
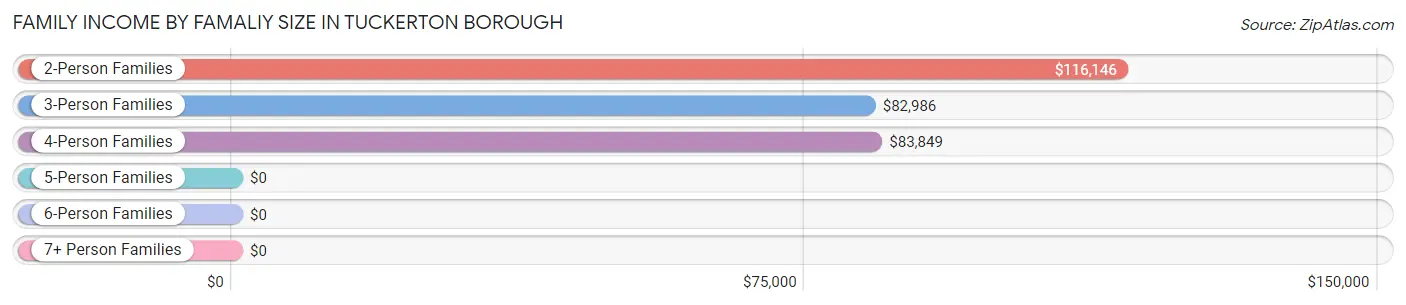
Family Income by Famaliy Size in Tuckerton borough
2-person families (445 | 51.4%) account for the highest median family income in Tuckerton borough with $116,146 per family, while 2-person families (445 | 51.4%) have the highest median income of $58,073 per family member.
| Income Bracket | # Families | Median Income |
| 2-Person Families | 445 (51.4%) | $116,146 |
| 3-Person Families | 170 (19.7%) | $82,986 |
| 4-Person Families | 212 (24.5%) | $83,849 |
| 5-Person Families | 15 (1.7%) | $0 |
| 6-Person Families | 0 (0.0%) | $0 |
| 7+ Person Families | 23 (2.7%) | $0 |
| Total | 865 (100.0%) | $94,648 |
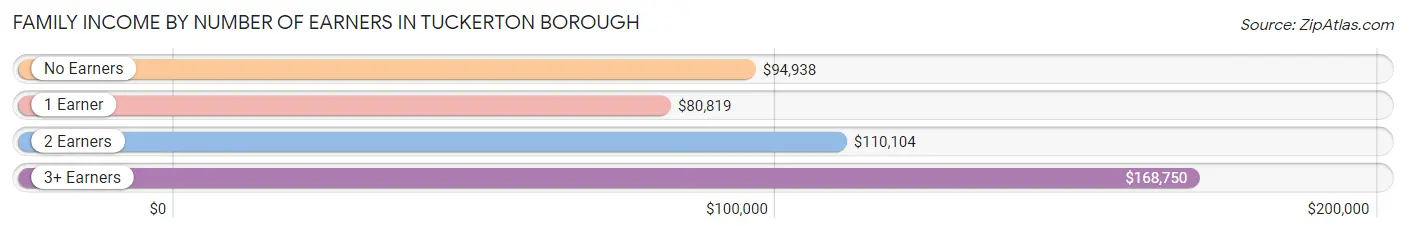
Family Income by Number of Earners in Tuckerton borough
The median family income in Tuckerton borough is $94,648, with families comprising 3+ earners (128) having the highest median family income of $168,750, while families with 1 earner (263) have the lowest median family income of $80,819, accounting for 14.8% and 30.4% of families, respectively.
| Number of Earners | # Families | Median Income |
| No Earners | 149 (17.2%) | $94,938 |
| 1 Earner | 263 (30.4%) | $80,819 |
| 2 Earners | 325 (37.6%) | $110,104 |
| 3+ Earners | 128 (14.8%) | $168,750 |
| Total | 865 (100.0%) | $94,648 |
Household Income in Tuckerton borough
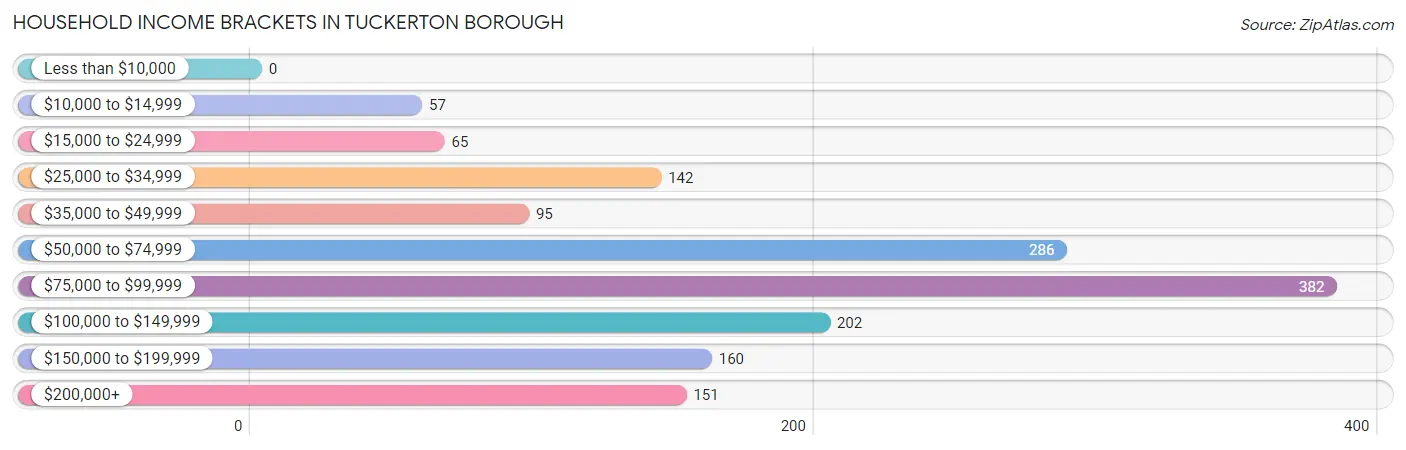
Household Income Brackets in Tuckerton borough
With 382 households falling in the category, the $75,000 to $99,999 income range is the most frequent in Tuckerton borough, accounting for 24.8% of all households.
| Income Bracket | # Households | % Households |
| Less than $10,000 | 0 | 0.0% |
| $10,000 to $14,999 | 57 | 3.7% |
| $15,000 to $24,999 | 65 | 4.2% |
| $25,000 to $34,999 | 142 | 9.2% |
| $35,000 to $49,999 | 95 | 6.2% |
| $50,000 to $74,999 | 286 | 18.6% |
| $75,000 to $99,999 | 382 | 24.8% |
| $100,000 to $149,999 | 202 | 13.1% |
| $150,000 to $199,999 | 160 | 10.4% |
| $200,000+ | 151 | 9.8% |
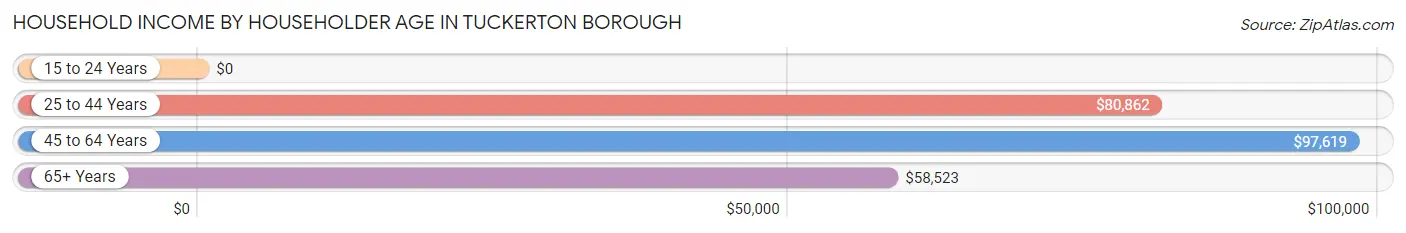
Household Income by Householder Age in Tuckerton borough
The median household income in Tuckerton borough is $80,957, with the highest median household income of $97,619 found in the 45 to 64 years age bracket for the primary householder. A total of 540 households (35.1%) fall into this category.
| Income Bracket | # Households | Median Income |
| 15 to 24 Years | 0 (0.0%) | $0 |
| 25 to 44 Years | 430 (27.9%) | $80,862 |
| 45 to 64 Years | 540 (35.1%) | $97,619 |
| 65+ Years | 569 (37.0%) | $58,523 |
| Total | 1,539 (100.0%) | $80,957 |
Poverty in Tuckerton borough
Income Below Poverty by Sex and Age in Tuckerton borough
With 5.2% poverty level for males and 2.4% for females among the residents of Tuckerton borough, 45 to 54 year old males and 75 year old and over females are the most vulnerable to poverty, with 39 males (15.3%) and 23 females (16.0%) in their respective age groups living below the poverty level.
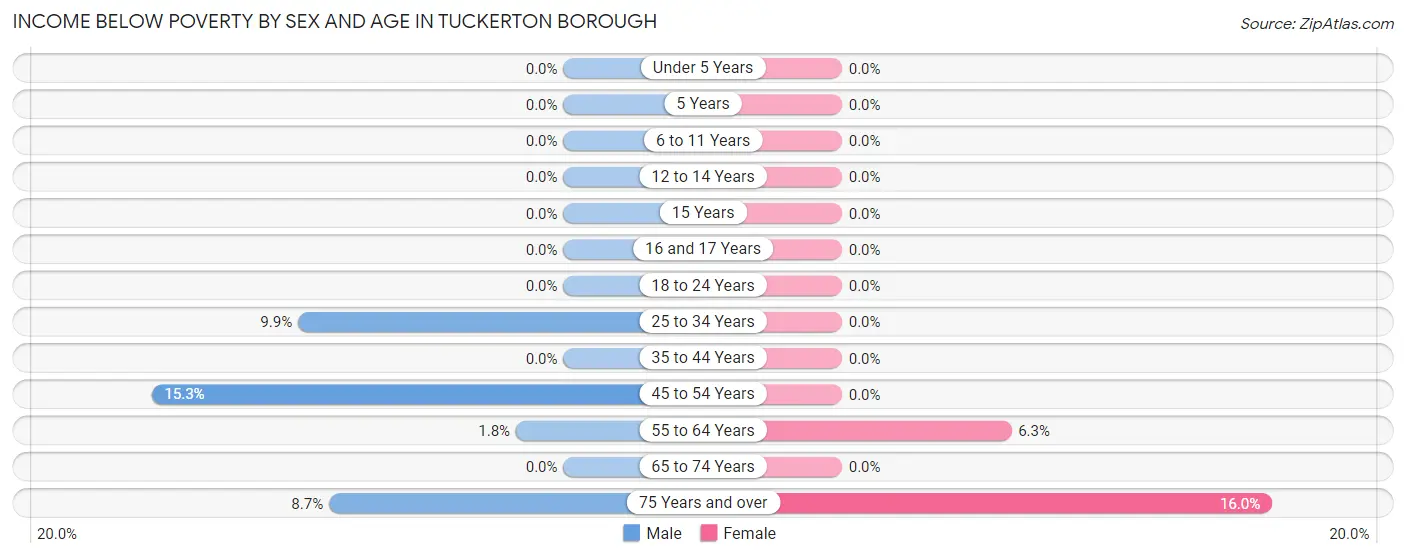
| Age Bracket | Male | Female |
| Under 5 Years | 0 (0.0%) | 0 (0.0%) |
| 5 Years | 0 (0.0%) | 0 (0.0%) |
| 6 to 11 Years | 0 (0.0%) | 0 (0.0%) |
| 12 to 14 Years | 0 (0.0%) | 0 (0.0%) |
| 15 Years | 0 (0.0%) | 0 (0.0%) |
| 16 and 17 Years | 0 (0.0%) | 0 (0.0%) |
| 18 to 24 Years | 0 (0.0%) | 0 (0.0%) |
| 25 to 34 Years | 32 (9.9%) | 0 (0.0%) |
| 35 to 44 Years | 0 (0.0%) | 0 (0.0%) |
| 45 to 54 Years | 39 (15.3%) | 0 (0.0%) |
| 55 to 64 Years | 5 (1.8%) | 20 (6.3%) |
| 65 to 74 Years | 0 (0.0%) | 0 (0.0%) |
| 75 Years and over | 12 (8.7%) | 23 (16.0%) |
| Total | 88 (5.2%) | 43 (2.4%) |
Income Above Poverty by Sex and Age in Tuckerton borough
According to the poverty statistics in Tuckerton borough, males aged under 5 years and females aged under 5 years are the age groups that are most secure financially, with 100.0% of males and 100.0% of females in these age groups living above the poverty line.
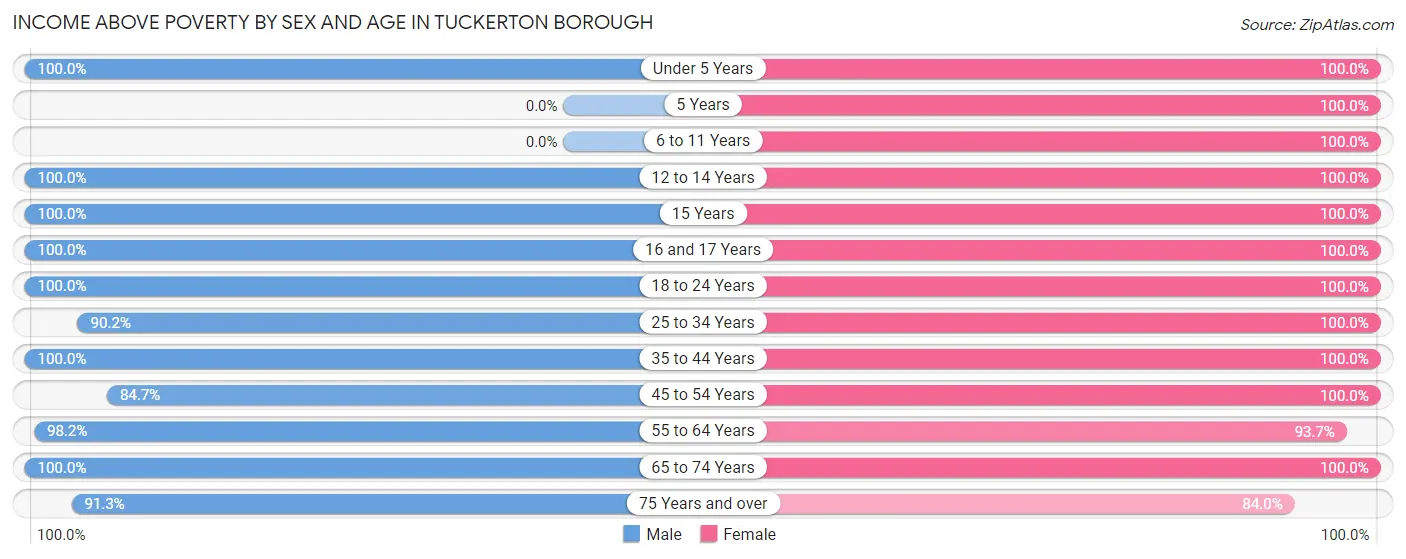
| Age Bracket | Male | Female |
| Under 5 Years | 120 (100.0%) | 101 (100.0%) |
| 5 Years | 0 (0.0%) | 64 (100.0%) |
| 6 to 11 Years | 0 (0.0%) | 29 (100.0%) |
| 12 to 14 Years | 57 (100.0%) | 31 (100.0%) |
| 15 Years | 15 (100.0%) | 154 (100.0%) |
| 16 and 17 Years | 17 (100.0%) | 47 (100.0%) |
| 18 to 24 Years | 123 (100.0%) | 92 (100.0%) |
| 25 to 34 Years | 293 (90.1%) | 273 (100.0%) |
| 35 to 44 Years | 161 (100.0%) | 147 (100.0%) |
| 45 to 54 Years | 216 (84.7%) | 160 (100.0%) |
| 55 to 64 Years | 279 (98.2%) | 298 (93.7%) |
| 65 to 74 Years | 191 (100.0%) | 265 (100.0%) |
| 75 Years and over | 126 (91.3%) | 121 (84.0%) |
| Total | 1,598 (94.8%) | 1,782 (97.6%) |
Income Below Poverty Among Married-Couple Families in Tuckerton borough
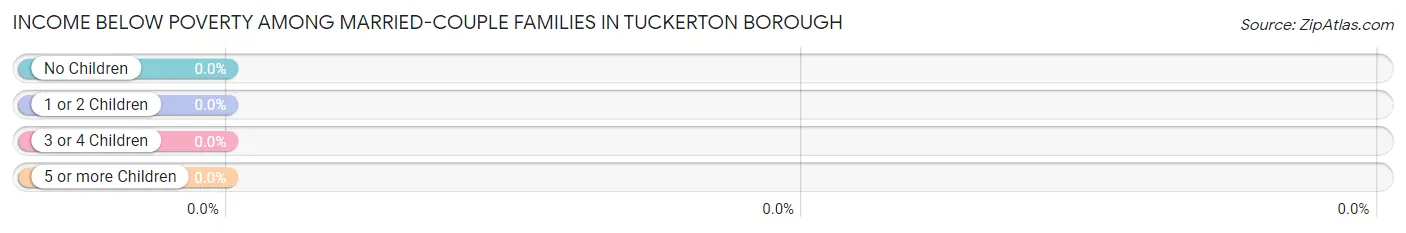
| Children | Above Poverty | Below Poverty |
| No Children | 513 (100.0%) | 0 (0.0%) |
| 1 or 2 Children | 164 (100.0%) | 0 (0.0%) |
| 3 or 4 Children | 23 (100.0%) | 0 (0.0%) |
| 5 or more Children | 0 (0.0%) | 0 (0.0%) |
| Total | 700 (100.0%) | 0 (0.0%) |
Income Below Poverty Among Single-Parent Households in Tuckerton borough
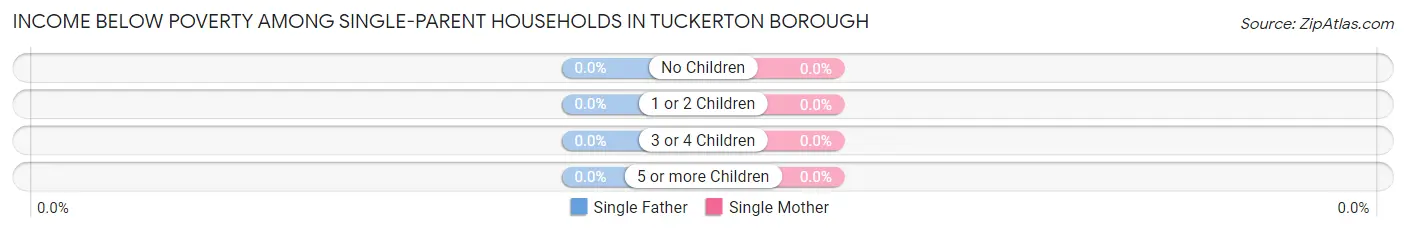
| Children | Single Father | Single Mother |
| No Children | 0 (0.0%) | 0 (0.0%) |
| 1 or 2 Children | 0 (0.0%) | 0 (0.0%) |
| 3 or 4 Children | 0 (0.0%) | 0 (0.0%) |
| 5 or more Children | 0 (0.0%) | 0 (0.0%) |
| Total | 0 (0.0%) | 0 (0.0%) |
Income Below Poverty Among Married-Couple vs Single-Parent Households in Tuckerton borough
| Children | Married-Couple Families | Single-Parent Households |
| No Children | 0 (0.0%) | 0 (0.0%) |
| 1 or 2 Children | 0 (0.0%) | 0 (0.0%) |
| 3 or 4 Children | 0 (0.0%) | 0 (0.0%) |
| 5 or more Children | 0 (0.0%) | 0 (0.0%) |
| Total | 0 (0.0%) | 0 (0.0%) |
Race in Tuckerton borough
The most populous races in Tuckerton borough are White / Caucasian (3,238 | 90.4%), Two or more Races (278 | 7.8%), and Hispanic or Latino (233 | 6.5%).
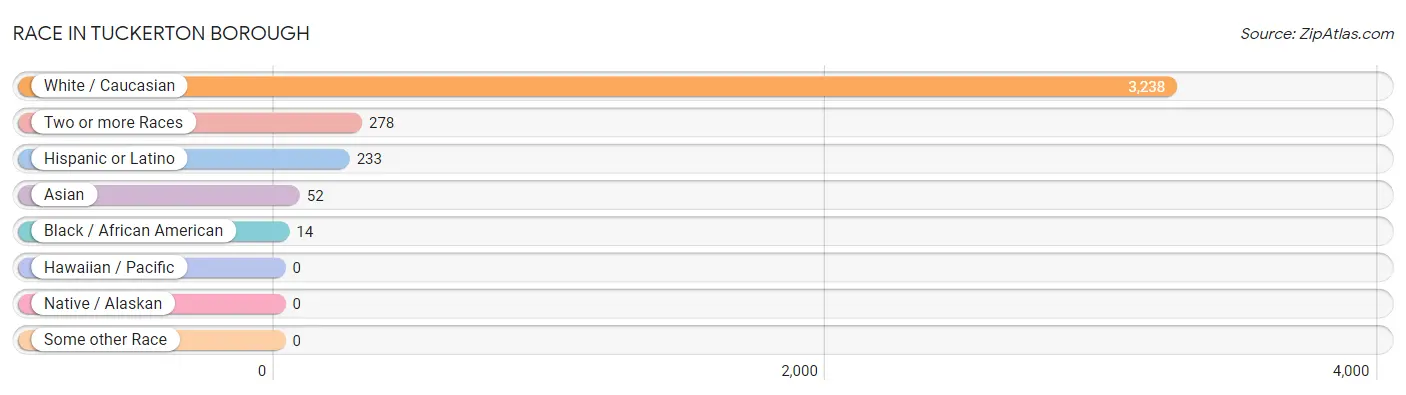
| Race | # Population | % Population |
| Asian | 52 | 1.5% |
| Black / African American | 14 | 0.4% |
| Hawaiian / Pacific | 0 | 0.0% |
| Hispanic or Latino | 233 | 6.5% |
| Native / Alaskan | 0 | 0.0% |
| White / Caucasian | 3,238 | 90.4% |
| Two or more Races | 278 | 7.8% |
| Some other Race | 0 | 0.0% |
| Total | 3,582 | 100.0% |
Ancestry in Tuckerton borough
The most populous ancestries reported in Tuckerton borough are Italian (863 | 24.1%), Irish (756 | 21.1%), German (544 | 15.2%), English (518 | 14.5%), and Norwegian (235 | 6.6%), together accounting for 81.4% of all Tuckerton borough residents.
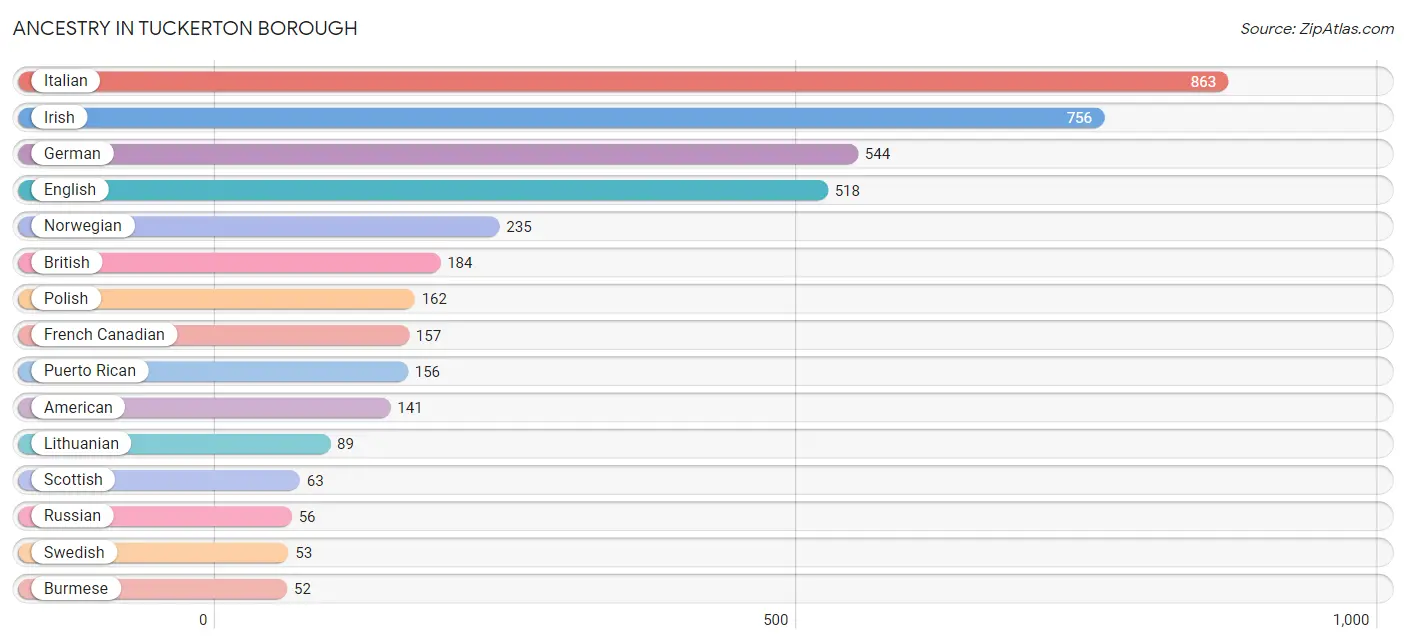
| Ancestry | # Population | % Population |
| American | 141 | 3.9% |
| British | 184 | 5.1% |
| Burmese | 52 | 1.5% |
| Cuban | 32 | 0.9% |
| Czech | 38 | 1.1% |
| Dutch | 12 | 0.3% |
| English | 518 | 14.5% |
| European | 22 | 0.6% |
| French | 52 | 1.5% |
| French Canadian | 157 | 4.4% |
| German | 544 | 15.2% |
| Hungarian | 12 | 0.3% |
| Irish | 756 | 21.1% |
| Italian | 863 | 24.1% |
| Korean | 43 | 1.2% |
| Lithuanian | 89 | 2.5% |
| Mexican | 45 | 1.3% |
| Norwegian | 235 | 6.6% |
| Polish | 162 | 4.5% |
| Puerto Rican | 156 | 4.4% |
| Russian | 56 | 1.6% |
| Scotch-Irish | 30 | 0.8% |
| Scottish | 63 | 1.8% |
| Slovak | 24 | 0.7% |
| Swedish | 53 | 1.5% |
| Ukrainian | 18 | 0.5% | View All 26 Rows |
Immigrants in Tuckerton borough
The most numerous immigrant groups reported in Tuckerton borough came from Caribbean (32 | 0.9%), Cuba (32 | 0.9%), Latin America (32 | 0.9%), Asia (18 | 0.5%), and Eastern Asia (18 | 0.5%), together accounting for 3.7% of all Tuckerton borough residents.
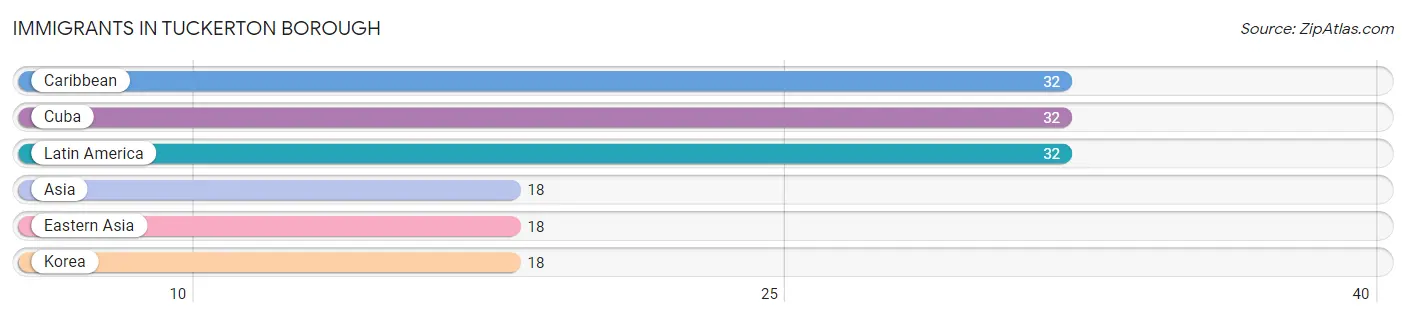
| Immigration Origin | # Population | % Population |
| Asia | 18 | 0.5% |
| Caribbean | 32 | 0.9% |
| Cuba | 32 | 0.9% |
| Eastern Asia | 18 | 0.5% |
| Korea | 18 | 0.5% |
| Latin America | 32 | 0.9% | View All 6 Rows |
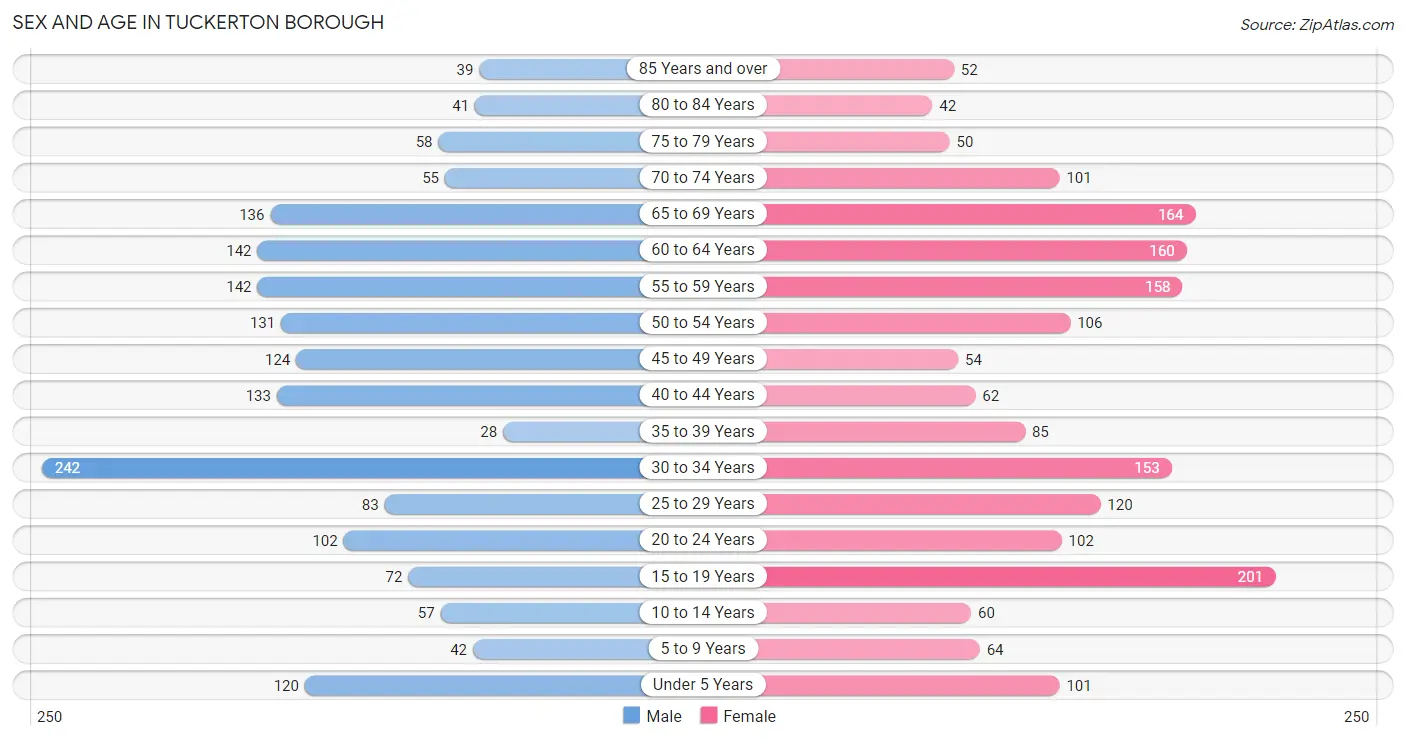
Sex and Age in Tuckerton borough
Sex and Age in Tuckerton borough
The most populous age groups in Tuckerton borough are 30 to 34 Years (242 | 13.9%) for men and 15 to 19 Years (201 | 11.0%) for women.
| Age Bracket | Male | Female |
| Under 5 Years | 120 (6.9%) | 101 (5.5%) |
| 5 to 9 Years | 42 (2.4%) | 64 (3.5%) |
| 10 to 14 Years | 57 (3.3%) | 60 (3.3%) |
| 15 to 19 Years | 72 (4.1%) | 201 (11.0%) |
| 20 to 24 Years | 102 (5.8%) | 102 (5.6%) |
| 25 to 29 Years | 83 (4.8%) | 120 (6.5%) |
| 30 to 34 Years | 242 (13.9%) | 153 (8.3%) |
| 35 to 39 Years | 28 (1.6%) | 85 (4.6%) |
| 40 to 44 Years | 133 (7.6%) | 62 (3.4%) |
| 45 to 49 Years | 124 (7.1%) | 54 (2.9%) |
| 50 to 54 Years | 131 (7.5%) | 106 (5.8%) |
| 55 to 59 Years | 142 (8.1%) | 158 (8.6%) |
| 60 to 64 Years | 142 (8.1%) | 160 (8.7%) |
| 65 to 69 Years | 136 (7.8%) | 164 (8.9%) |
| 70 to 74 Years | 55 (3.2%) | 101 (5.5%) |
| 75 to 79 Years | 58 (3.3%) | 50 (2.7%) |
| 80 to 84 Years | 41 (2.4%) | 42 (2.3%) |
| 85 Years and over | 39 (2.2%) | 52 (2.8%) |
| Total | 1,747 (100.0%) | 1,835 (100.0%) |
Families and Households in Tuckerton borough
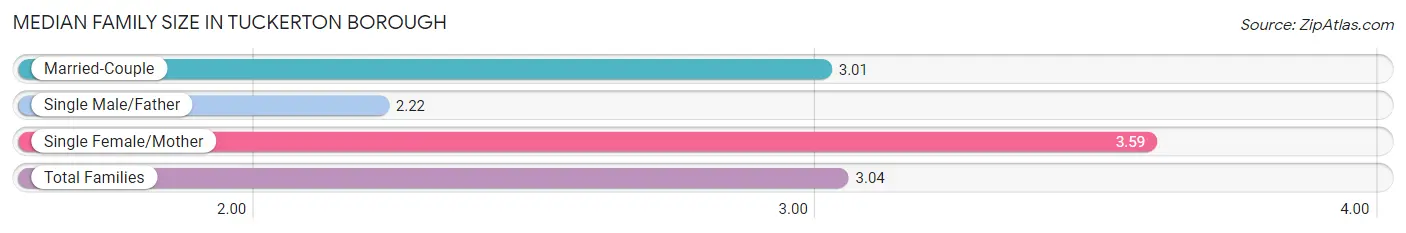
Median Family Size in Tuckerton borough
The median family size in Tuckerton borough is 3.04 persons per family, with single female/mother families (114 | 13.2%) accounting for the largest median family size of 3.59 persons per family. On the other hand, single male/father families (51 | 5.9%) represent the smallest median family size with 2.22 persons per family.
| Family Type | # Families | Family Size |
| Married-Couple | 700 (80.9%) | 3.01 |
| Single Male/Father | 51 (5.9%) | 2.22 |
| Single Female/Mother | 114 (13.2%) | 3.59 |
| Total Families | 865 (100.0%) | 3.04 |
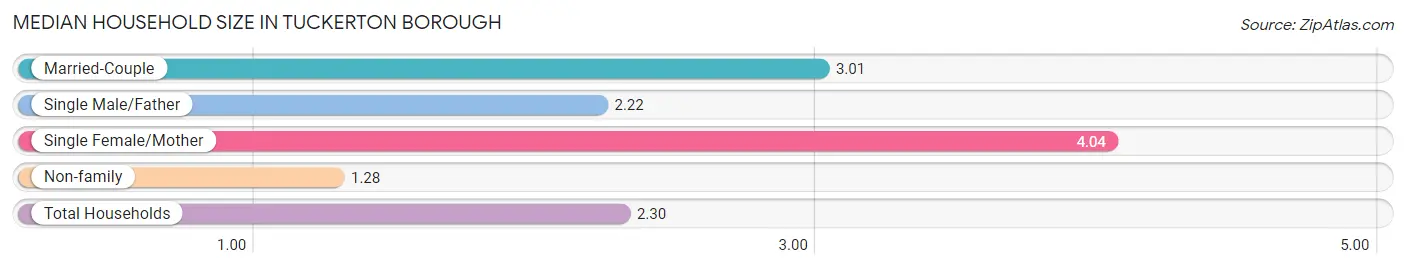
Median Household Size in Tuckerton borough
The median household size in Tuckerton borough is 2.30 persons per household, with single female/mother households (114 | 7.4%) accounting for the largest median household size of 4.04 persons per household. non-family households (674 | 43.8%) represent the smallest median household size with 1.28 persons per household.
| Household Type | # Households | Household Size |
| Married-Couple | 700 (45.5%) | 3.01 |
| Single Male/Father | 51 (3.3%) | 2.22 |
| Single Female/Mother | 114 (7.4%) | 4.04 |
| Non-family | 674 (43.8%) | 1.28 |
| Total Households | 1,539 (100.0%) | 2.30 |
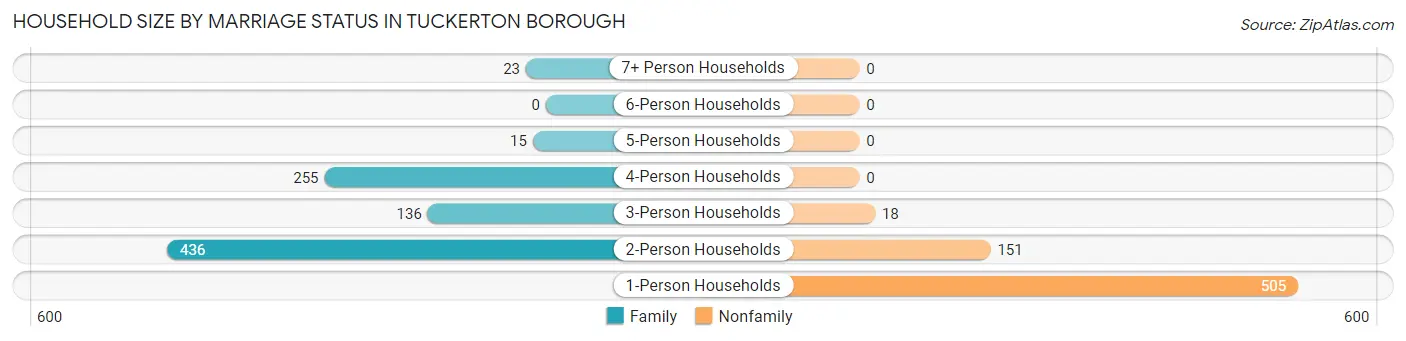
Household Size by Marriage Status in Tuckerton borough
Out of a total of 1,539 households in Tuckerton borough, 865 (56.2%) are family households, while 674 (43.8%) are nonfamily households. The most numerous type of family households are 2-person households, comprising 436, and the most common type of nonfamily households are 1-person households, comprising 505.
| Household Size | Family Households | Nonfamily Households |
| 1-Person Households | - | 505 (32.8%) |
| 2-Person Households | 436 (28.3%) | 151 (9.8%) |
| 3-Person Households | 136 (8.8%) | 18 (1.2%) |
| 4-Person Households | 255 (16.6%) | 0 (0.0%) |
| 5-Person Households | 15 (1.0%) | 0 (0.0%) |
| 6-Person Households | 0 (0.0%) | 0 (0.0%) |
| 7+ Person Households | 23 (1.5%) | 0 (0.0%) |
| Total | 865 (56.2%) | 674 (43.8%) |
Female Fertility in Tuckerton borough
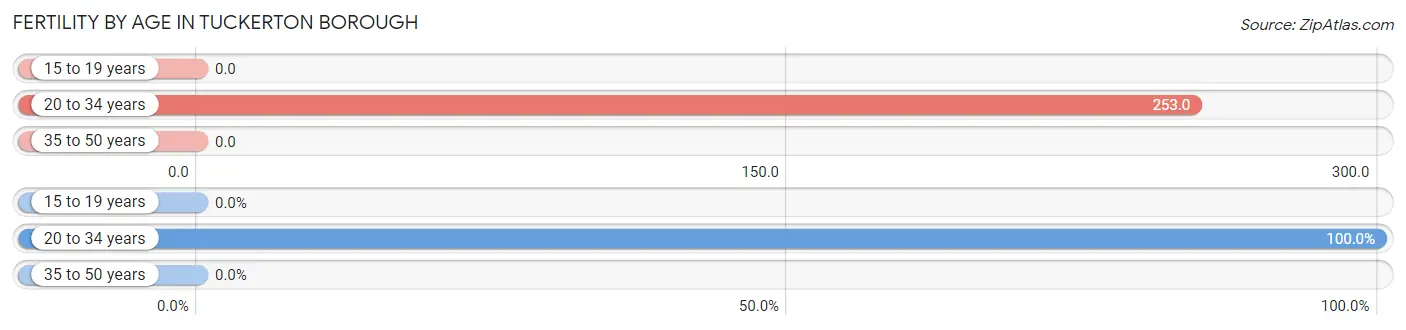
Fertility by Age in Tuckerton borough
Average fertility rate in Tuckerton borough is 119.0 births per 1,000 women. Women in the age bracket of 20 to 34 years have the highest fertility rate with 253.0 births per 1,000 women. Women in the age bracket of 20 to 34 years acount for 100.0% of all women with births.
| Age Bracket | Women with Births | Births / 1,000 Women |
| 15 to 19 years | 0 (0.0%) | 0.0 |
| 20 to 34 years | 95 (100.0%) | 253.0 |
| 35 to 50 years | 0 (0.0%) | 0.0 |
| Total | 95 (100.0%) | 119.0 |
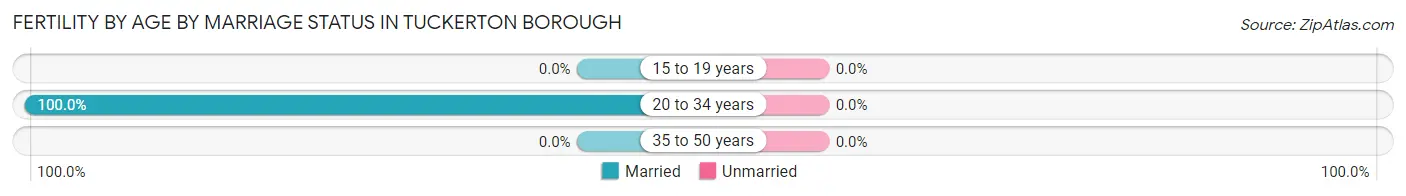
Fertility by Age by Marriage Status in Tuckerton borough
| Age Bracket | Married | Unmarried |
| 15 to 19 years | 0 (0.0%) | 0 (0.0%) |
| 20 to 34 years | 95 (100.0%) | 0 (0.0%) |
| 35 to 50 years | 0 (0.0%) | 0 (0.0%) |
| Total | 95 (100.0%) | 0 (0.0%) |
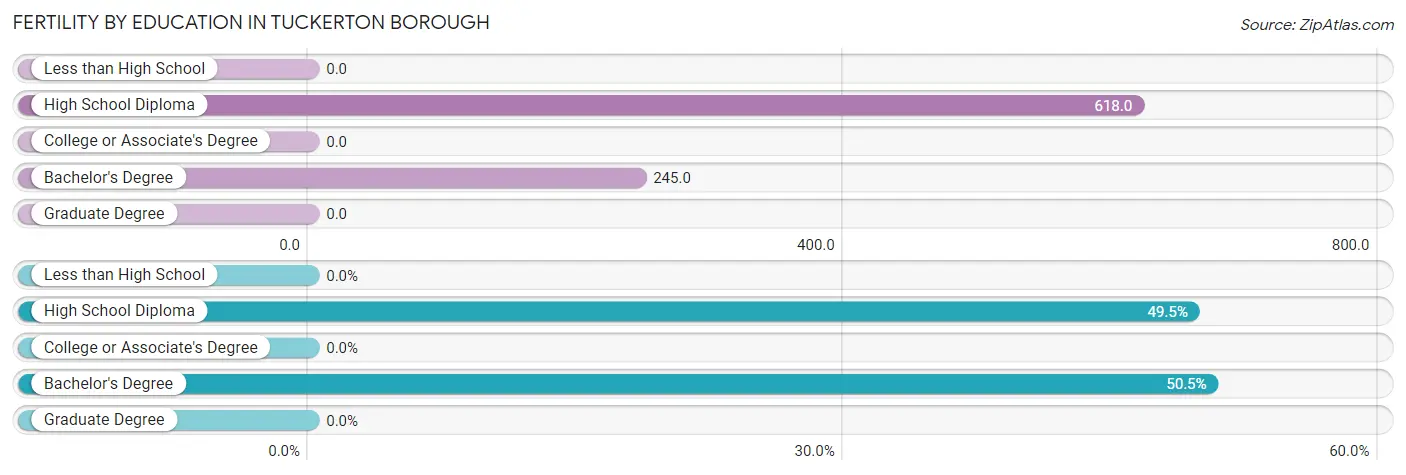
Fertility by Education in Tuckerton borough
| Educational Attainment | Women with Births | Births / 1,000 Women |
| Less than High School | 0 (0.0%) | 0.0 |
| High School Diploma | 47 (49.5%) | 618.0 |
| College or Associate's Degree | 0 (0.0%) | 0.0 |
| Bachelor's Degree | 48 (50.5%) | 245.0 |
| Graduate Degree | 0 (0.0%) | 0.0 |
| Total | 95 (100.0%) | 119.0 |
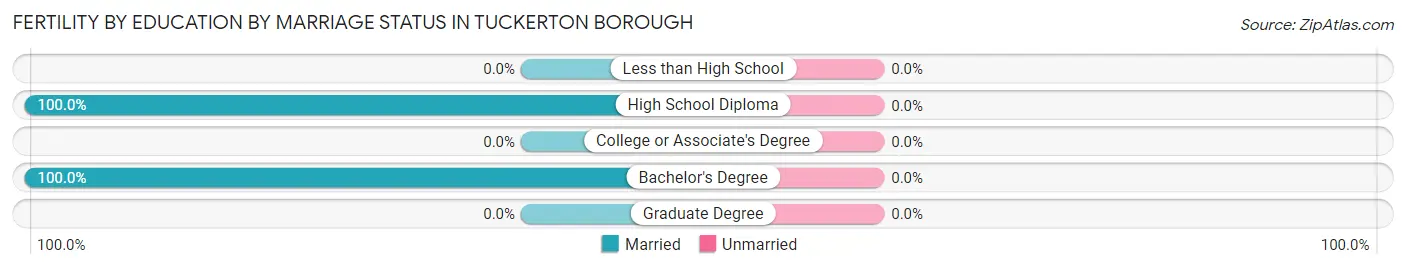
Fertility by Education by Marriage Status in Tuckerton borough
| Educational Attainment | Married | Unmarried |
| Less than High School | 0 (0.0%) | 0 (0.0%) |
| High School Diploma | 47 (100.0%) | 0 (0.0%) |
| College or Associate's Degree | 0 (0.0%) | 0 (0.0%) |
| Bachelor's Degree | 48 (100.0%) | 0 (0.0%) |
| Graduate Degree | 0 (0.0%) | 0 (0.0%) |
| Total | 95 (100.0%) | 0 (0.0%) |
Employment Characteristics in Tuckerton borough
Employment by Class of Employer in Tuckerton borough
Among the 1,675 employed individuals in Tuckerton borough, private company employees (1,050 | 62.7%), local government employees (209 | 12.5%), and not-for-profit organizations (124 | 7.4%) make up the most common classes of employment.
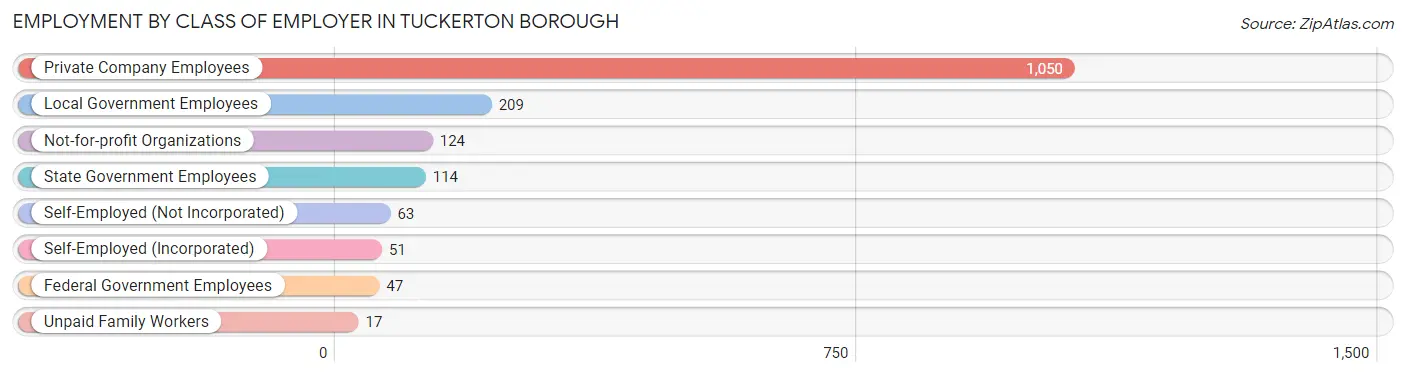
| Employer Class | # Employees | % Employees |
| Private Company Employees | 1,050 | 62.7% |
| Self-Employed (Incorporated) | 51 | 3.0% |
| Self-Employed (Not Incorporated) | 63 | 3.8% |
| Not-for-profit Organizations | 124 | 7.4% |
| Local Government Employees | 209 | 12.5% |
| State Government Employees | 114 | 6.8% |
| Federal Government Employees | 47 | 2.8% |
| Unpaid Family Workers | 17 | 1.0% |
| Total | 1,675 | 100.0% |
Employment Status by Age in Tuckerton borough
According to the labor force statistics for Tuckerton borough, out of the total population over 16 years of age (2,969), 63.2% or 1,876 individuals are in the labor force, with 8.7% or 163 of them unemployed. The age group with the highest labor force participation rate is 30 to 34 years, with 87.8% or 347 individuals in the labor force. Within the labor force, the 25 to 29 years age range has the highest percentage of unemployed individuals, with 34.3% or 54 of them being unemployed.
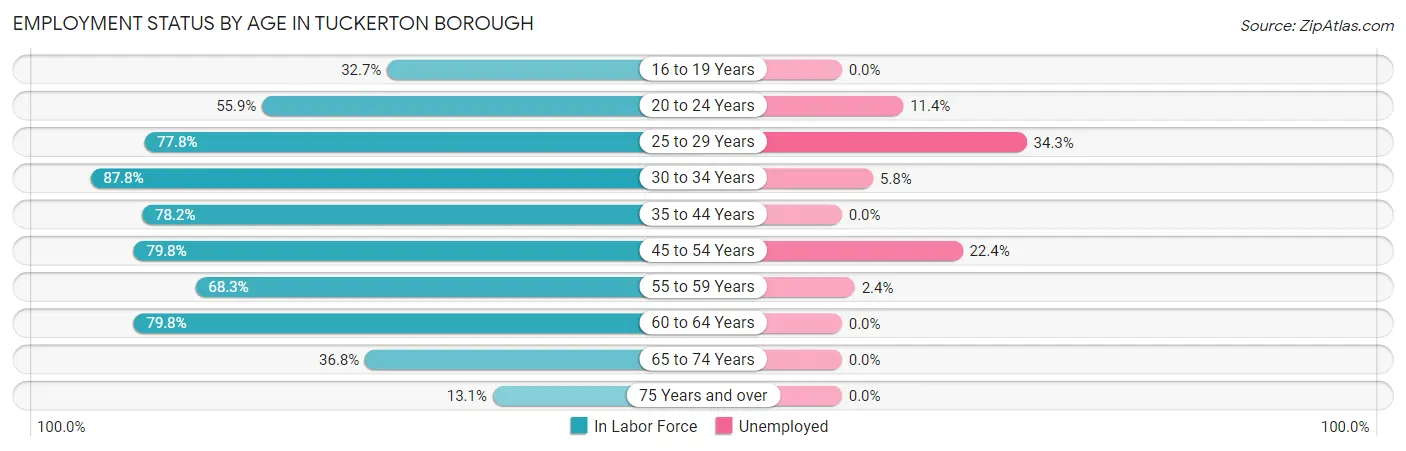
| Age Bracket | In Labor Force | Unemployed |
| 16 to 19 Years | 34 (32.7%) | 0 (0.0%) |
| 20 to 24 Years | 114 (55.9%) | 13 (11.4%) |
| 25 to 29 Years | 158 (77.8%) | 54 (34.3%) |
| 30 to 34 Years | 347 (87.8%) | 20 (5.8%) |
| 35 to 44 Years | 241 (78.2%) | 0 (0.0%) |
| 45 to 54 Years | 331 (79.8%) | 74 (22.4%) |
| 55 to 59 Years | 205 (68.3%) | 5 (2.4%) |
| 60 to 64 Years | 241 (79.8%) | 0 (0.0%) |
| 65 to 74 Years | 168 (36.8%) | 0 (0.0%) |
| 75 Years and over | 37 (13.1%) | 0 (0.0%) |
| Total | 1,876 (63.2%) | 163 (8.7%) |
Employment Status by Educational Attainment in Tuckerton borough
According to labor force statistics for Tuckerton borough, 79.2% of individuals (1,523) out of the total population between 25 and 64 years of age (1,923) are in the labor force, with 9.8% or 149 of them being unemployed. The group with the highest labor force participation rate are those with the educational attainment of bachelor's degree or higher, with 93.1% or 741 individuals in the labor force. Within the labor force, individuals with high school diploma education have the highest percentage of unemployment, with 26.4% or 51 of them being unemployed.
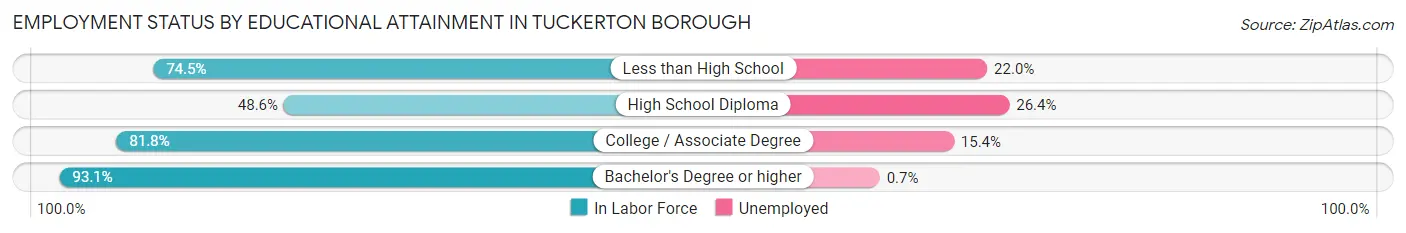
| Educational Attainment | In Labor Force | Unemployed |
| Less than High School | 82 (74.5%) | 24 (22.0%) |
| High School Diploma | 193 (48.6%) | 105 (26.4%) |
| College / Associate Degree | 507 (81.8%) | 95 (15.4%) |
| Bachelor's Degree or higher | 741 (93.1%) | 6 (0.7%) |
| Total | 1,523 (79.2%) | 188 (9.8%) |
Employment Occupations by Sex in Tuckerton borough
Management, Business, Science and Arts Occupations
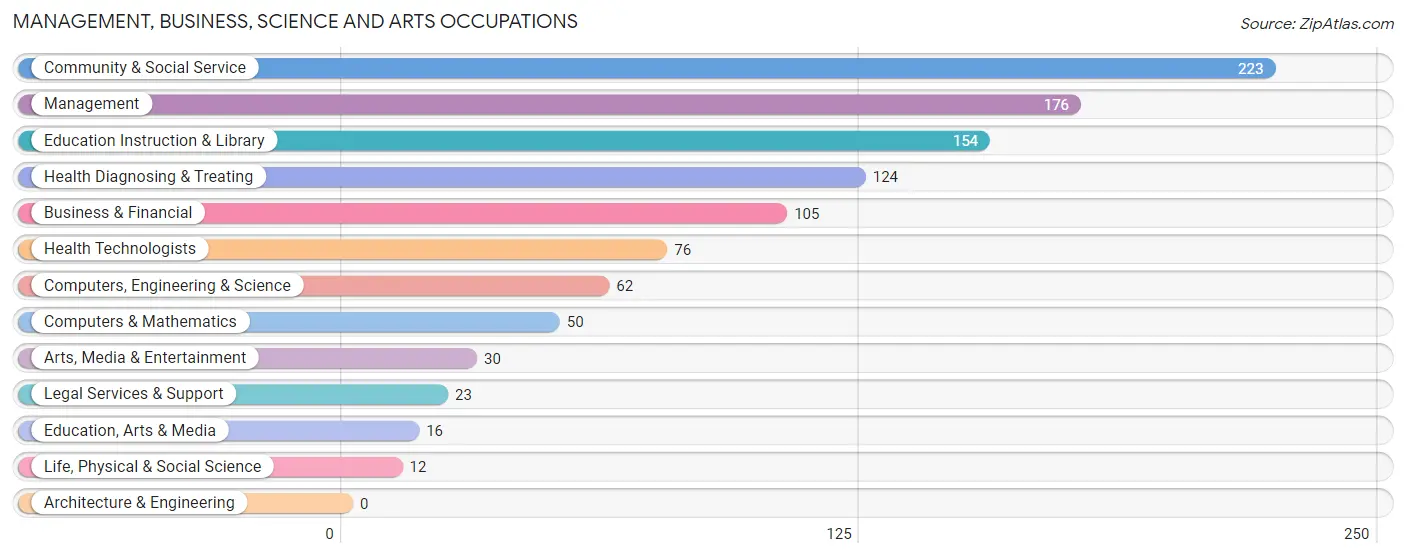
The most common Management, Business, Science and Arts occupations in Tuckerton borough are Community & Social Service (223 | 13.1%), Management (176 | 10.3%), Education Instruction & Library (154 | 9.1%), Health Diagnosing & Treating (124 | 7.3%), and Business & Financial (105 | 6.2%).
Management, Business, Science and Arts Occupations by Sex
Within the Management, Business, Science and Arts occupations in Tuckerton borough, the most male-oriented occupations are Education, Arts & Media (100.0%), Legal Services & Support (100.0%), and Arts, Media & Entertainment (100.0%), while the most female-oriented occupations are Life, Physical & Social Science (100.0%), Health Technologists (100.0%), and Health Diagnosing & Treating (93.5%).
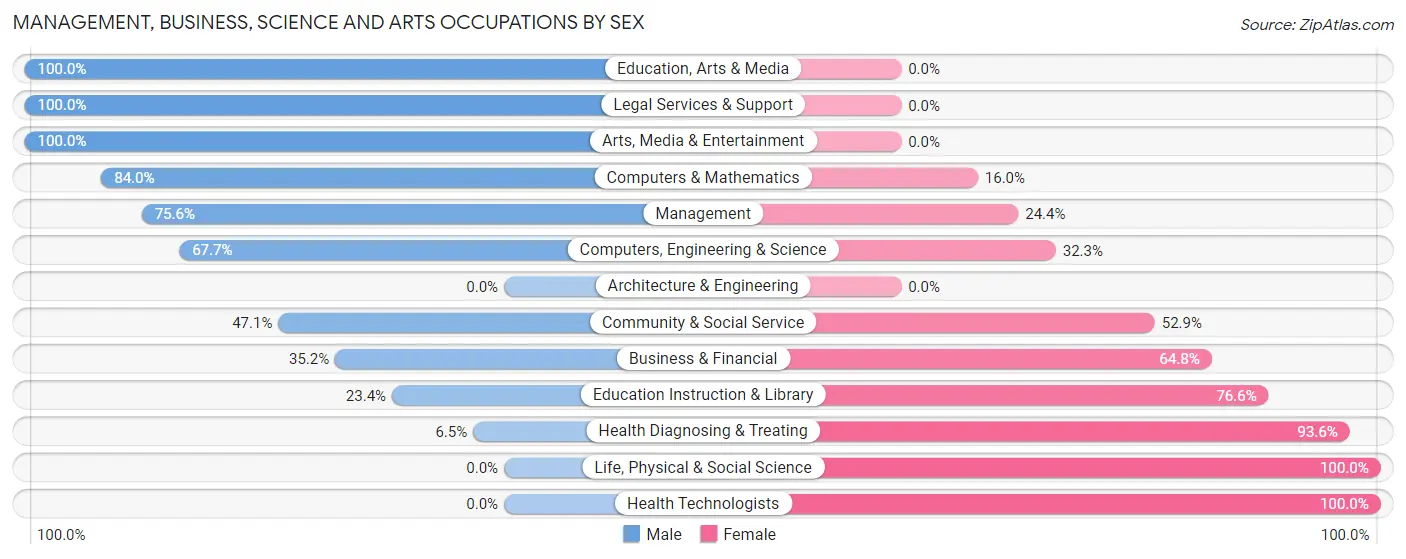
| Occupation | Male | Female |
| Management | 133 (75.6%) | 43 (24.4%) |
| Business & Financial | 37 (35.2%) | 68 (64.8%) |
| Computers, Engineering & Science | 42 (67.7%) | 20 (32.3%) |
| Computers & Mathematics | 42 (84.0%) | 8 (16.0%) |
| Architecture & Engineering | 0 (0.0%) | 0 (0.0%) |
| Life, Physical & Social Science | 0 (0.0%) | 12 (100.0%) |
| Community & Social Service | 105 (47.1%) | 118 (52.9%) |
| Education, Arts & Media | 16 (100.0%) | 0 (0.0%) |
| Legal Services & Support | 23 (100.0%) | 0 (0.0%) |
| Education Instruction & Library | 36 (23.4%) | 118 (76.6%) |
| Arts, Media & Entertainment | 30 (100.0%) | 0 (0.0%) |
| Health Diagnosing & Treating | 8 (6.5%) | 116 (93.5%) |
| Health Technologists | 0 (0.0%) | 76 (100.0%) |
| Total (Category) | 325 (47.1%) | 365 (52.9%) |
| Total (Overall) | 834 (49.1%) | 866 (50.9%) |
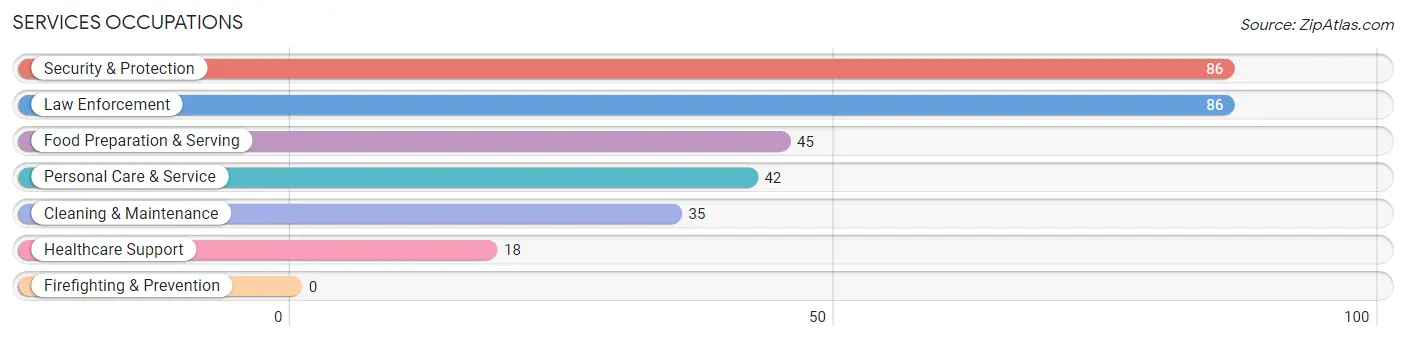
Services Occupations
The most common Services occupations in Tuckerton borough are Security & Protection (86 | 5.1%), Law Enforcement (86 | 5.1%), Food Preparation & Serving (45 | 2.6%), Personal Care & Service (42 | 2.5%), and Cleaning & Maintenance (35 | 2.1%).
Services Occupations by Sex
Within the Services occupations in Tuckerton borough, the most male-oriented occupations are Healthcare Support (100.0%), Security & Protection (61.6%), and Law Enforcement (61.6%), while the most female-oriented occupations are Food Preparation & Serving (100.0%), Personal Care & Service (100.0%), and Cleaning & Maintenance (71.4%).
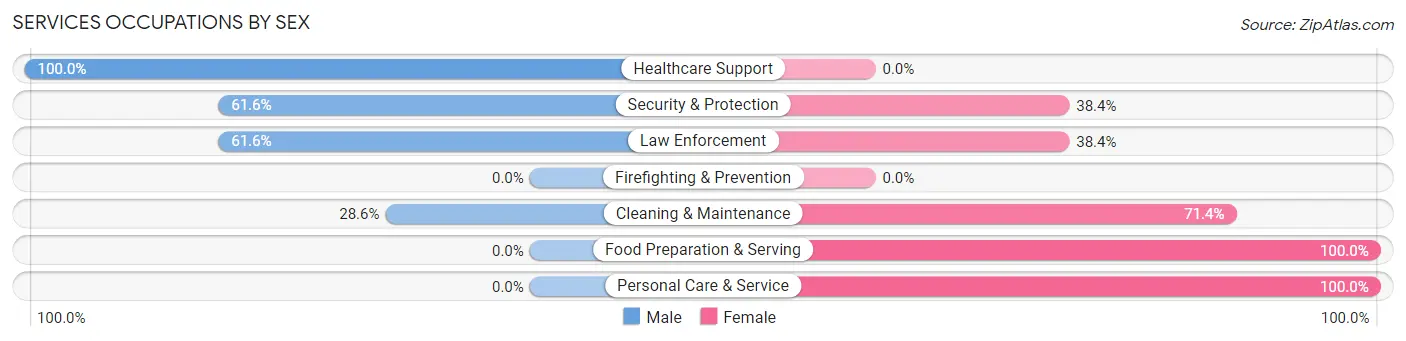
| Occupation | Male | Female |
| Healthcare Support | 18 (100.0%) | 0 (0.0%) |
| Security & Protection | 53 (61.6%) | 33 (38.4%) |
| Firefighting & Prevention | 0 (0.0%) | 0 (0.0%) |
| Law Enforcement | 53 (61.6%) | 33 (38.4%) |
| Food Preparation & Serving | 0 (0.0%) | 45 (100.0%) |
| Cleaning & Maintenance | 10 (28.6%) | 25 (71.4%) |
| Personal Care & Service | 0 (0.0%) | 42 (100.0%) |
| Total (Category) | 81 (35.8%) | 145 (64.2%) |
| Total (Overall) | 834 (49.1%) | 866 (50.9%) |
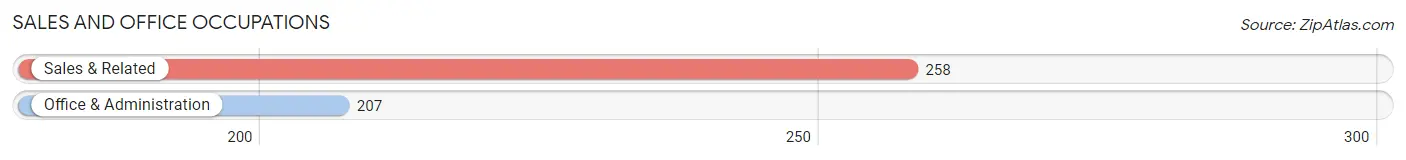
Sales and Office Occupations
The most common Sales and Office occupations in Tuckerton borough are Sales & Related (258 | 15.2%), and Office & Administration (207 | 12.2%).
Sales and Office Occupations by Sex
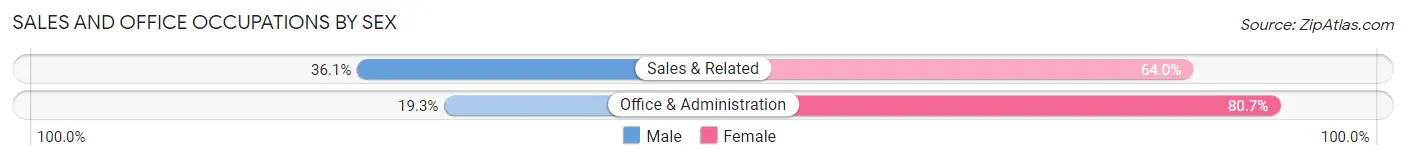
| Occupation | Male | Female |
| Sales & Related | 93 (36.0%) | 165 (63.9%) |
| Office & Administration | 40 (19.3%) | 167 (80.7%) |
| Total (Category) | 133 (28.6%) | 332 (71.4%) |
| Total (Overall) | 834 (49.1%) | 866 (50.9%) |
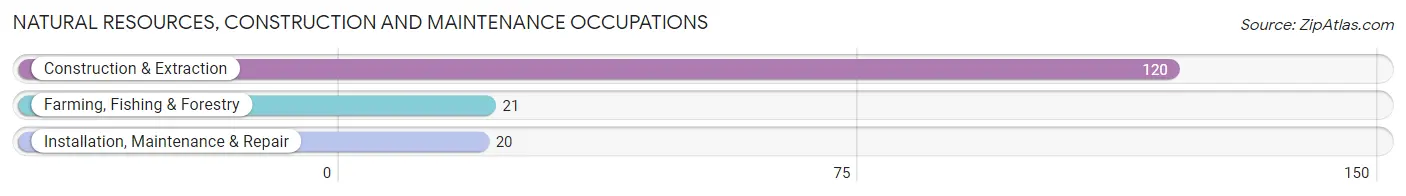
Natural Resources, Construction and Maintenance Occupations
The most common Natural Resources, Construction and Maintenance occupations in Tuckerton borough are Construction & Extraction (120 | 7.1%), Farming, Fishing & Forestry (21 | 1.2%), and Installation, Maintenance & Repair (20 | 1.2%).
Natural Resources, Construction and Maintenance Occupations by Sex
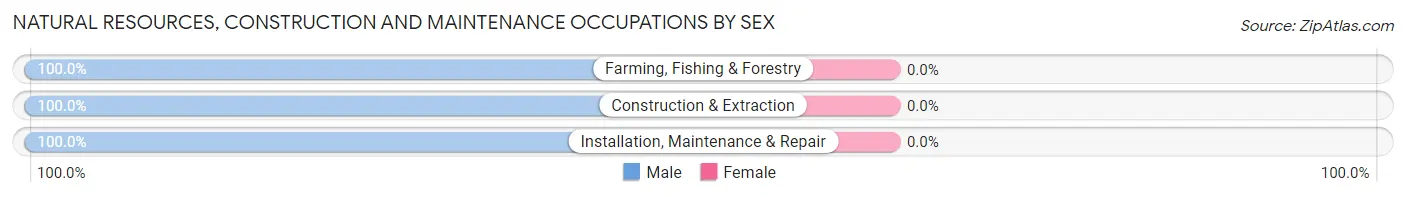
| Occupation | Male | Female |
| Farming, Fishing & Forestry | 21 (100.0%) | 0 (0.0%) |
| Construction & Extraction | 120 (100.0%) | 0 (0.0%) |
| Installation, Maintenance & Repair | 20 (100.0%) | 0 (0.0%) |
| Total (Category) | 161 (100.0%) | 0 (0.0%) |
| Total (Overall) | 834 (49.1%) | 866 (50.9%) |
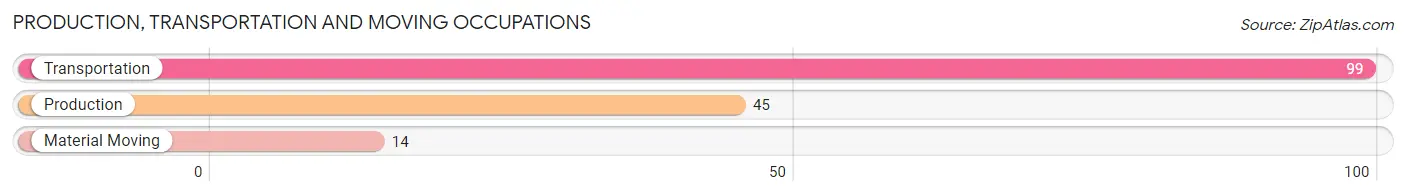
Production, Transportation and Moving Occupations
The most common Production, Transportation and Moving occupations in Tuckerton borough are Transportation (99 | 5.8%), Production (45 | 2.6%), and Material Moving (14 | 0.8%).
Production, Transportation and Moving Occupations by Sex
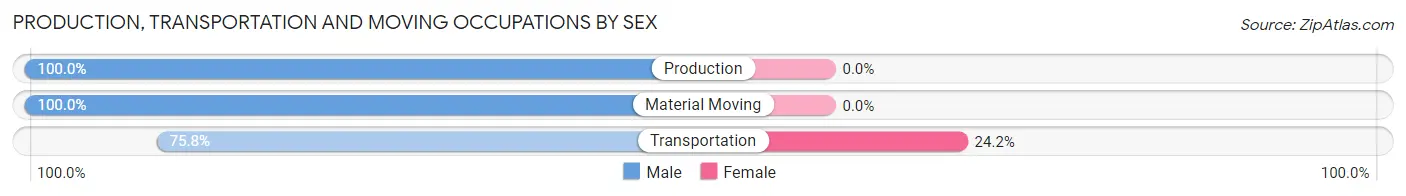
| Occupation | Male | Female |
| Production | 45 (100.0%) | 0 (0.0%) |
| Transportation | 75 (75.8%) | 24 (24.2%) |
| Material Moving | 14 (100.0%) | 0 (0.0%) |
| Total (Category) | 134 (84.8%) | 24 (15.2%) |
| Total (Overall) | 834 (49.1%) | 866 (50.9%) |
Employment Industries by Sex in Tuckerton borough
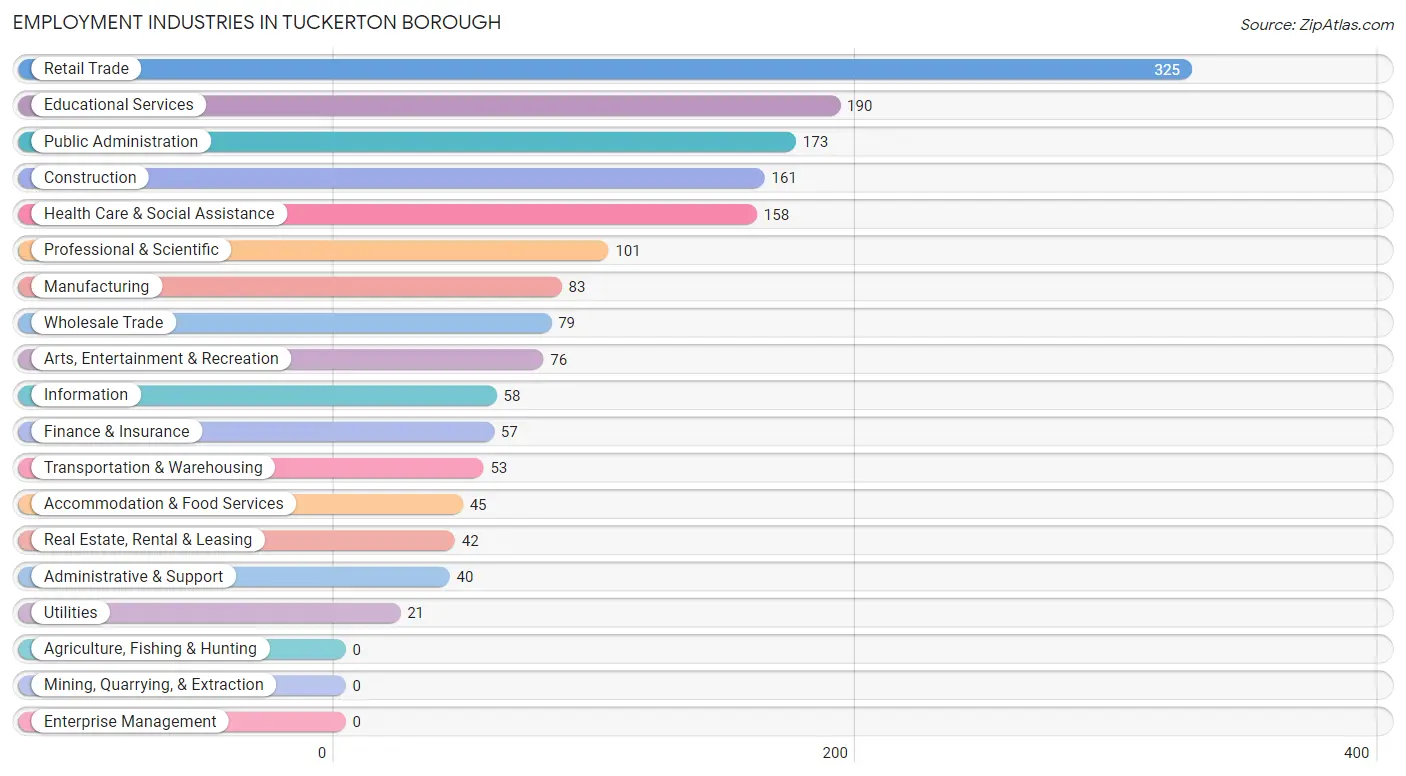
Employment Industries in Tuckerton borough
The major employment industries in Tuckerton borough include Retail Trade (325 | 19.1%), Educational Services (190 | 11.2%), Public Administration (173 | 10.2%), Construction (161 | 9.5%), and Health Care & Social Assistance (158 | 9.3%).
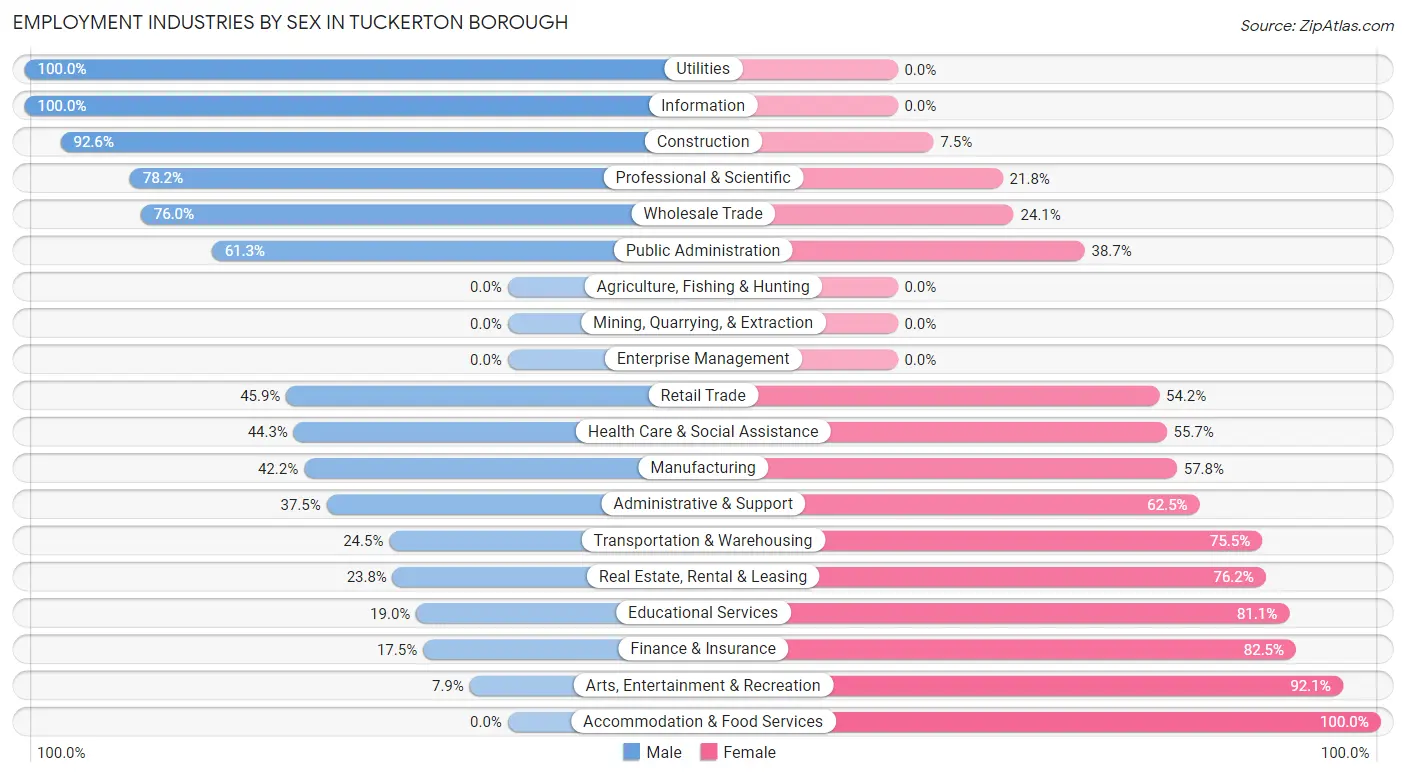
Employment Industries by Sex in Tuckerton borough
The Tuckerton borough industries that see more men than women are Utilities (100.0%), Information (100.0%), and Construction (92.5%), whereas the industries that tend to have a higher number of women are Accommodation & Food Services (100.0%), Arts, Entertainment & Recreation (92.1%), and Finance & Insurance (82.5%).
| Industry | Male | Female |
| Agriculture, Fishing & Hunting | 0 (0.0%) | 0 (0.0%) |
| Mining, Quarrying, & Extraction | 0 (0.0%) | 0 (0.0%) |
| Construction | 149 (92.5%) | 12 (7.4%) |
| Manufacturing | 35 (42.2%) | 48 (57.8%) |
| Wholesale Trade | 60 (75.9%) | 19 (24.0%) |
| Retail Trade | 149 (45.9%) | 176 (54.1%) |
| Transportation & Warehousing | 13 (24.5%) | 40 (75.5%) |
| Utilities | 21 (100.0%) | 0 (0.0%) |
| Information | 58 (100.0%) | 0 (0.0%) |
| Finance & Insurance | 10 (17.5%) | 47 (82.5%) |
| Real Estate, Rental & Leasing | 10 (23.8%) | 32 (76.2%) |
| Professional & Scientific | 79 (78.2%) | 22 (21.8%) |
| Enterprise Management | 0 (0.0%) | 0 (0.0%) |
| Administrative & Support | 15 (37.5%) | 25 (62.5%) |
| Educational Services | 36 (19.0%) | 154 (81.0%) |
| Health Care & Social Assistance | 70 (44.3%) | 88 (55.7%) |
| Arts, Entertainment & Recreation | 6 (7.9%) | 70 (92.1%) |
| Accommodation & Food Services | 0 (0.0%) | 45 (100.0%) |
| Public Administration | 106 (61.3%) | 67 (38.7%) |
| Total | 834 (49.1%) | 866 (50.9%) |
Education in Tuckerton borough
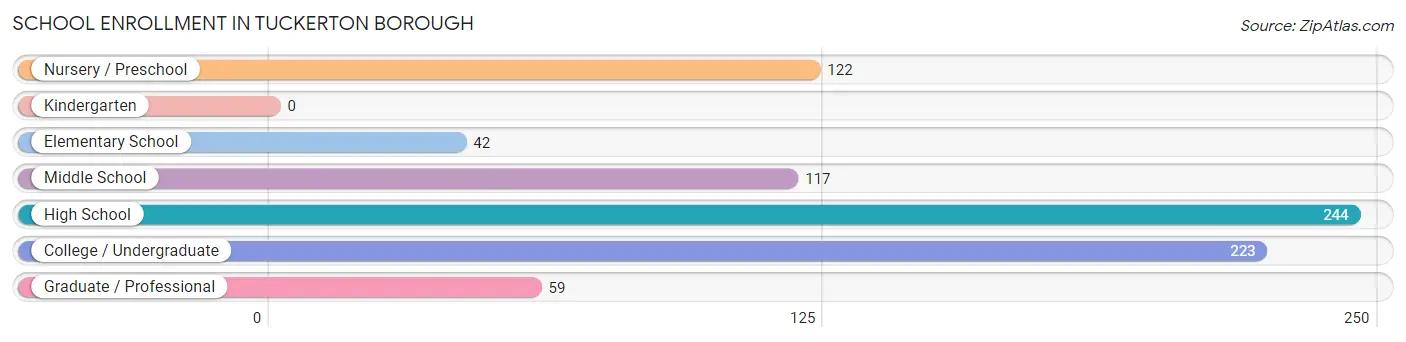
School Enrollment in Tuckerton borough
The most common levels of schooling among the 807 students in Tuckerton borough are high school (244 | 30.2%), college / undergraduate (223 | 27.6%), and nursery / preschool (122 | 15.1%).
| School Level | # Students | % Students |
| Nursery / Preschool | 122 | 15.1% |
| Kindergarten | 0 | 0.0% |
| Elementary School | 42 | 5.2% |
| Middle School | 117 | 14.5% |
| High School | 244 | 30.2% |
| College / Undergraduate | 223 | 27.6% |
| Graduate / Professional | 59 | 7.3% |
| Total | 807 | 100.0% |
School Enrollment by Age by Funding Source in Tuckerton borough
Out of a total of 807 students who are enrolled in schools in Tuckerton borough, 143 (17.7%) attend a private institution, while the remaining 664 (82.3%) are enrolled in public schools. The age group of 25 to 34 year olds has the highest likelihood of being enrolled in private schools, with 38 (62.3% in the age bracket) enrolled. Conversely, the age group of 3 to 4 year olds has the lowest likelihood of being enrolled in a private school, with 98 (100.0% in the age bracket) attending a public institution.
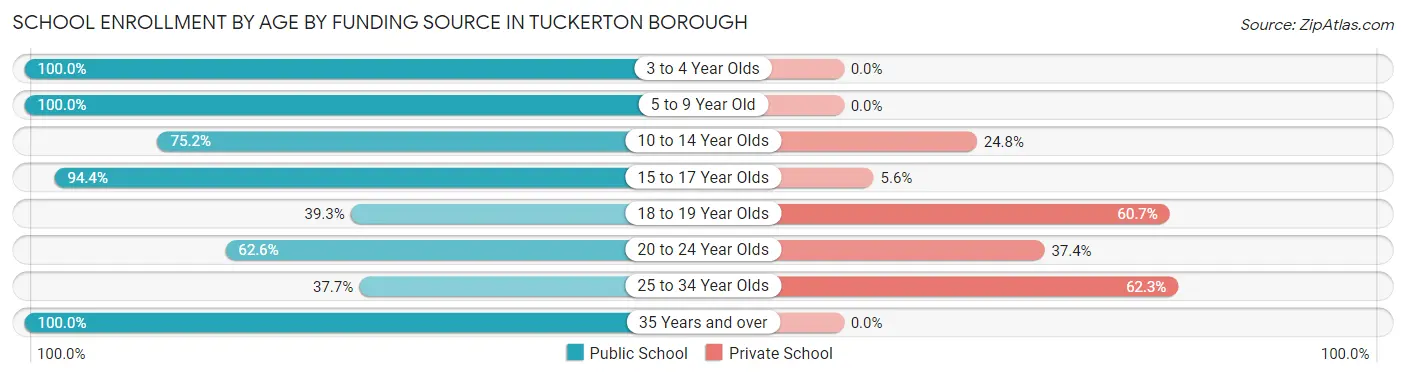
| Age Bracket | Public School | Private School |
| 3 to 4 Year Olds | 98 (100.0%) | 0 (0.0%) |
| 5 to 9 Year Old | 66 (100.0%) | 0 (0.0%) |
| 10 to 14 Year Olds | 88 (75.2%) | 29 (24.8%) |
| 15 to 17 Year Olds | 220 (94.4%) | 13 (5.6%) |
| 18 to 19 Year Olds | 11 (39.3%) | 17 (60.7%) |
| 20 to 24 Year Olds | 77 (62.6%) | 46 (37.4%) |
| 25 to 34 Year Olds | 23 (37.7%) | 38 (62.3%) |
| 35 Years and over | 81 (100.0%) | 0 (0.0%) |
| Total | 664 (82.3%) | 143 (17.7%) |
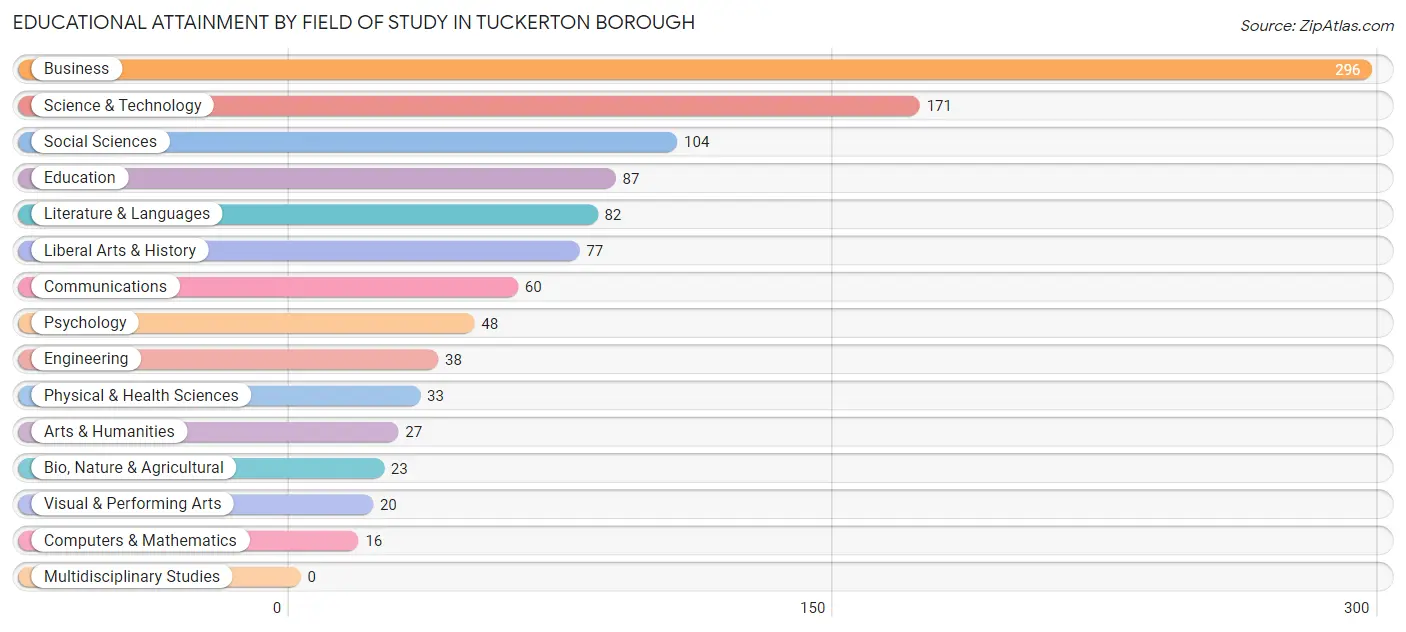
Educational Attainment by Field of Study in Tuckerton borough
Business (296 | 27.4%), science & technology (171 | 15.8%), social sciences (104 | 9.6%), education (87 | 8.0%), and literature & languages (82 | 7.6%) are the most common fields of study among 1,082 individuals in Tuckerton borough who have obtained a bachelor's degree or higher.
| Field of Study | # Graduates | % Graduates |
| Computers & Mathematics | 16 | 1.5% |
| Bio, Nature & Agricultural | 23 | 2.1% |
| Physical & Health Sciences | 33 | 3.0% |
| Psychology | 48 | 4.4% |
| Social Sciences | 104 | 9.6% |
| Engineering | 38 | 3.5% |
| Multidisciplinary Studies | 0 | 0.0% |
| Science & Technology | 171 | 15.8% |
| Business | 296 | 27.4% |
| Education | 87 | 8.0% |
| Literature & Languages | 82 | 7.6% |
| Liberal Arts & History | 77 | 7.1% |
| Visual & Performing Arts | 20 | 1.8% |
| Communications | 60 | 5.6% |
| Arts & Humanities | 27 | 2.5% |
| Total | 1,082 | 100.0% |
Transportation & Commute in Tuckerton borough
Vehicle Availability by Sex in Tuckerton borough
The most prevalent vehicle ownership categories in Tuckerton borough are males with 2 vehicles (433, accounting for 53.3%) and females with 2 vehicles (389, making up 51.0%).
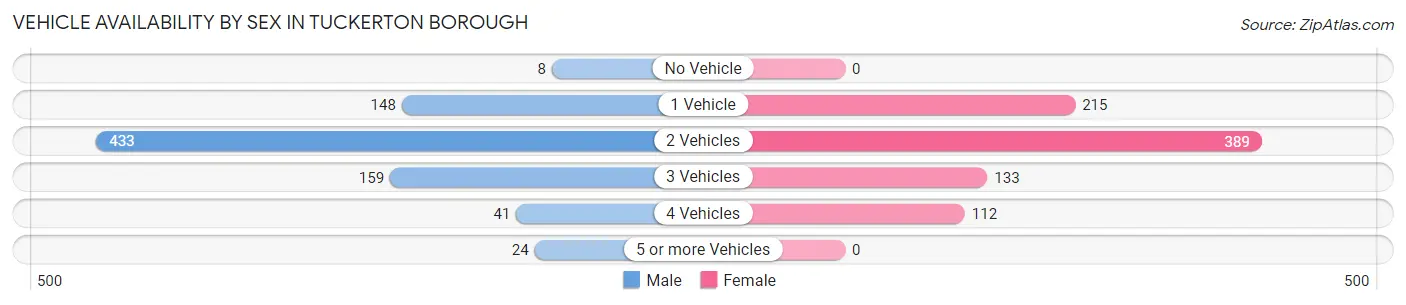
| Vehicles Available | Male | Female |
| No Vehicle | 8 (1.0%) | 0 (0.0%) |
| 1 Vehicle | 148 (18.2%) | 215 (25.3%) |
| 2 Vehicles | 433 (53.3%) | 389 (45.8%) |
| 3 Vehicles | 159 (19.6%) | 133 (15.7%) |
| 4 Vehicles | 41 (5.0%) | 112 (13.2%) |
| 5 or more Vehicles | 24 (2.9%) | 0 (0.0%) |
| Total | 813 (100.0%) | 849 (100.0%) |
Commute Time in Tuckerton borough
The most frequently occuring commute durations in Tuckerton borough are 15 to 19 minutes (213 commuters, 14.6%), 40 to 44 minutes (176 commuters, 12.1%), and 10 to 14 minutes (171 commuters, 11.8%).
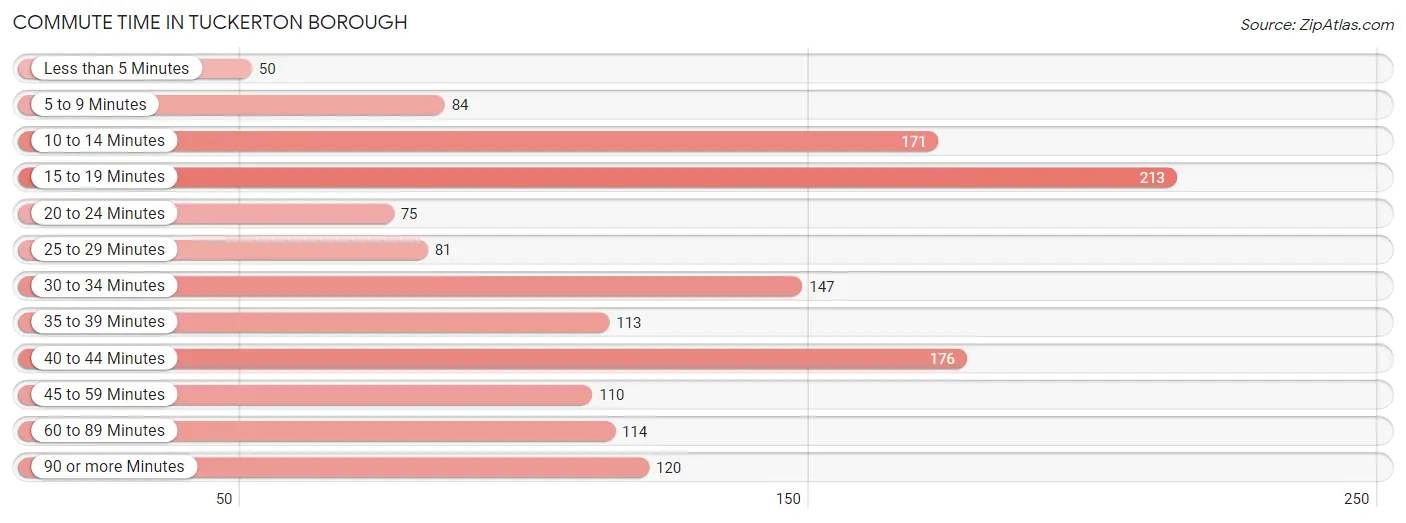
| Commute Time | # Commuters | % Commuters |
| Less than 5 Minutes | 50 | 3.4% |
| 5 to 9 Minutes | 84 | 5.8% |
| 10 to 14 Minutes | 171 | 11.8% |
| 15 to 19 Minutes | 213 | 14.6% |
| 20 to 24 Minutes | 75 | 5.2% |
| 25 to 29 Minutes | 81 | 5.6% |
| 30 to 34 Minutes | 147 | 10.1% |
| 35 to 39 Minutes | 113 | 7.8% |
| 40 to 44 Minutes | 176 | 12.1% |
| 45 to 59 Minutes | 110 | 7.6% |
| 60 to 89 Minutes | 114 | 7.8% |
| 90 or more Minutes | 120 | 8.3% |
Commute Time by Sex in Tuckerton borough
The most common commute times in Tuckerton borough are 30 to 34 minutes (109 commuters, 15.3%) for males and 10 to 14 minutes (125 commuters, 16.9%) for females.
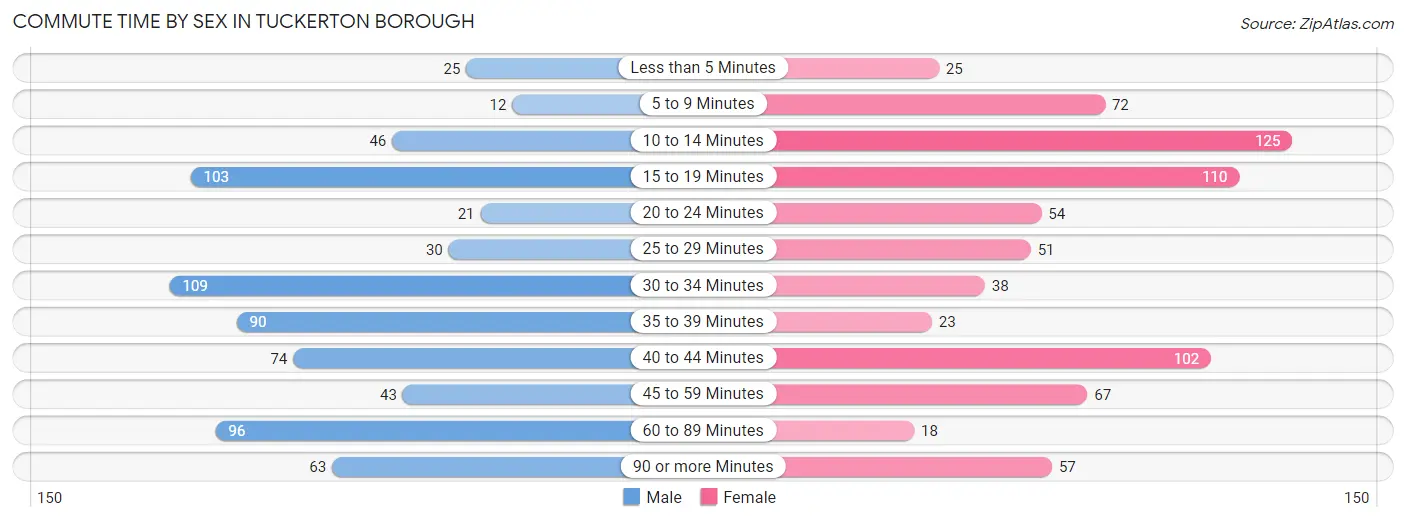
| Commute Time | Male | Female |
| Less than 5 Minutes | 25 (3.5%) | 25 (3.4%) |
| 5 to 9 Minutes | 12 (1.7%) | 72 (9.7%) |
| 10 to 14 Minutes | 46 (6.5%) | 125 (16.9%) |
| 15 to 19 Minutes | 103 (14.5%) | 110 (14.8%) |
| 20 to 24 Minutes | 21 (2.9%) | 54 (7.3%) |
| 25 to 29 Minutes | 30 (4.2%) | 51 (6.9%) |
| 30 to 34 Minutes | 109 (15.3%) | 38 (5.1%) |
| 35 to 39 Minutes | 90 (12.6%) | 23 (3.1%) |
| 40 to 44 Minutes | 74 (10.4%) | 102 (13.8%) |
| 45 to 59 Minutes | 43 (6.0%) | 67 (9.0%) |
| 60 to 89 Minutes | 96 (13.5%) | 18 (2.4%) |
| 90 or more Minutes | 63 (8.8%) | 57 (7.7%) |
Time of Departure to Work by Sex in Tuckerton borough
The most frequent times of departure to work in Tuckerton borough are 7:00 AM to 7:29 AM (179, 25.1%) for males and 8:00 AM to 8:29 AM (228, 30.7%) for females.
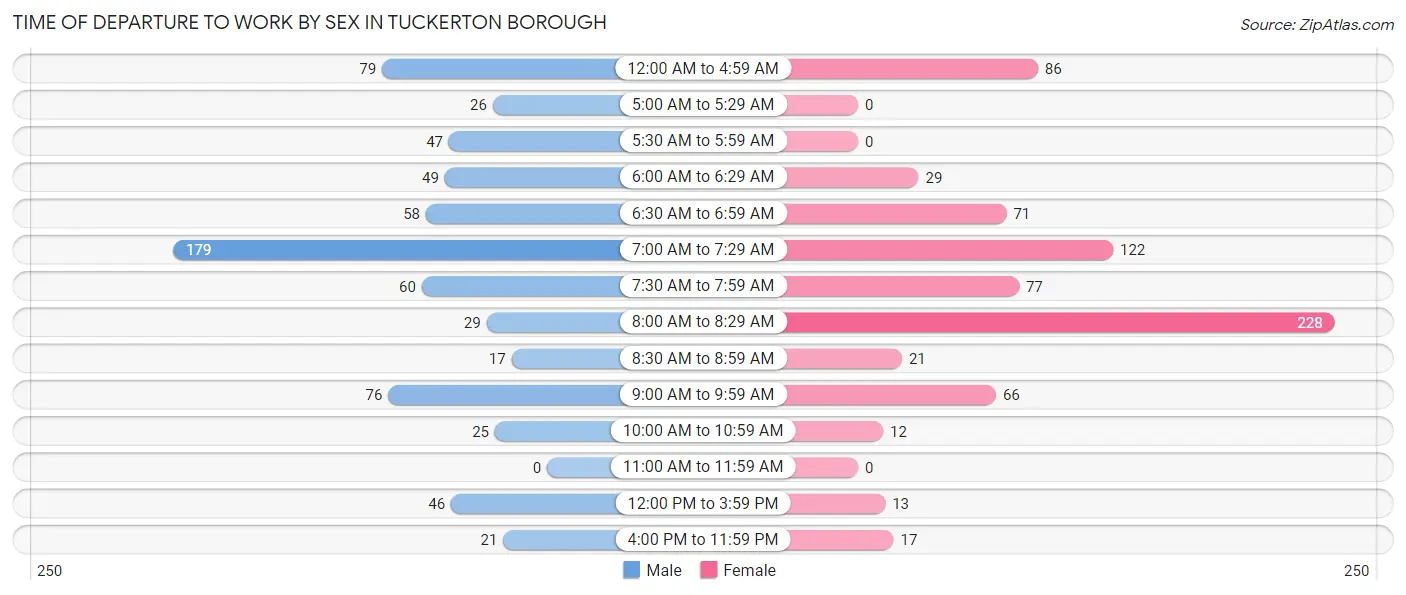
| Time of Departure | Male | Female |
| 12:00 AM to 4:59 AM | 79 (11.1%) | 86 (11.6%) |
| 5:00 AM to 5:29 AM | 26 (3.6%) | 0 (0.0%) |
| 5:30 AM to 5:59 AM | 47 (6.6%) | 0 (0.0%) |
| 6:00 AM to 6:29 AM | 49 (6.9%) | 29 (3.9%) |
| 6:30 AM to 6:59 AM | 58 (8.2%) | 71 (9.6%) |
| 7:00 AM to 7:29 AM | 179 (25.1%) | 122 (16.4%) |
| 7:30 AM to 7:59 AM | 60 (8.4%) | 77 (10.4%) |
| 8:00 AM to 8:29 AM | 29 (4.1%) | 228 (30.7%) |
| 8:30 AM to 8:59 AM | 17 (2.4%) | 21 (2.8%) |
| 9:00 AM to 9:59 AM | 76 (10.7%) | 66 (8.9%) |
| 10:00 AM to 10:59 AM | 25 (3.5%) | 12 (1.6%) |
| 11:00 AM to 11:59 AM | 0 (0.0%) | 0 (0.0%) |
| 12:00 PM to 3:59 PM | 46 (6.5%) | 13 (1.8%) |
| 4:00 PM to 11:59 PM | 21 (2.9%) | 17 (2.3%) |
| Total | 712 (100.0%) | 742 (100.0%) |
Housing Occupancy in Tuckerton borough
Occupancy by Ownership in Tuckerton borough
Of the total 1,539 dwellings in Tuckerton borough, owner-occupied units account for 1,077 (70.0%), while renter-occupied units make up 462 (30.0%).
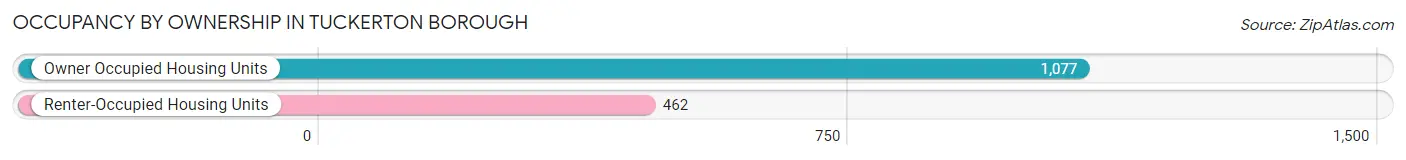
| Occupancy | # Housing Units | % Housing Units |
| Owner Occupied Housing Units | 1,077 | 70.0% |
| Renter-Occupied Housing Units | 462 | 30.0% |
| Total Occupied Housing Units | 1,539 | 100.0% |
Occupancy by Household Size in Tuckerton borough
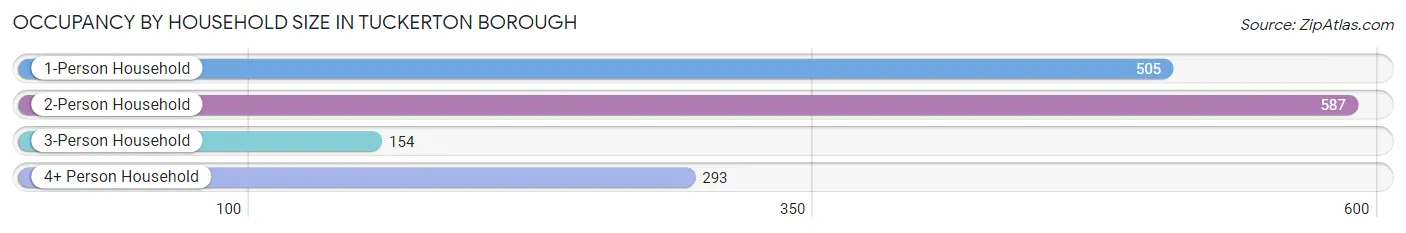
| Household Size | # Housing Units | % Housing Units |
| 1-Person Household | 505 | 32.8% |
| 2-Person Household | 587 | 38.1% |
| 3-Person Household | 154 | 10.0% |
| 4+ Person Household | 293 | 19.0% |
| Total Housing Units | 1,539 | 100.0% |
Occupancy by Ownership by Household Size in Tuckerton borough
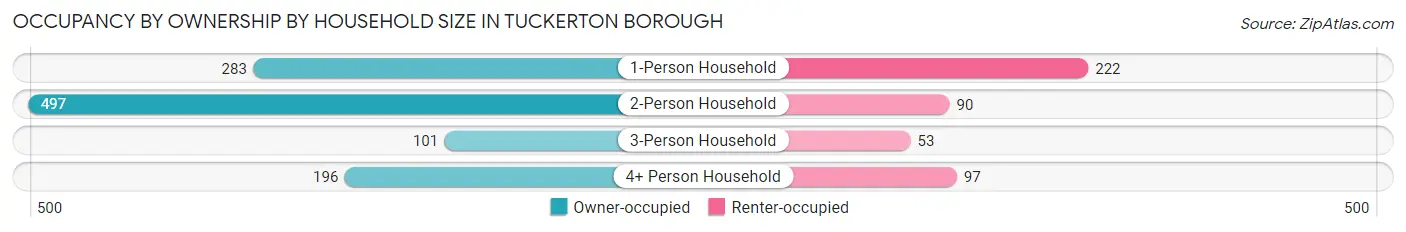
| Household Size | Owner-occupied | Renter-occupied |
| 1-Person Household | 283 (56.0%) | 222 (44.0%) |
| 2-Person Household | 497 (84.7%) | 90 (15.3%) |
| 3-Person Household | 101 (65.6%) | 53 (34.4%) |
| 4+ Person Household | 196 (66.9%) | 97 (33.1%) |
| Total Housing Units | 1,077 (70.0%) | 462 (30.0%) |
Occupancy by Educational Attainment in Tuckerton borough
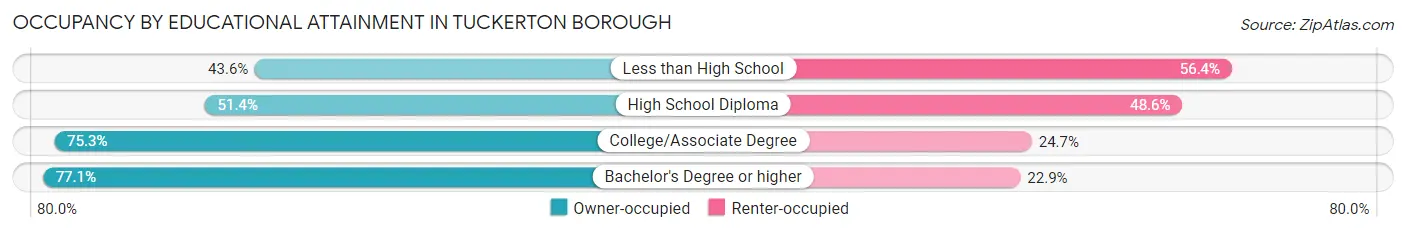
| Household Size | Owner-occupied | Renter-occupied |
| Less than High School | 17 (43.6%) | 22 (56.4%) |
| High School Diploma | 179 (51.4%) | 169 (48.6%) |
| College/Associate Degree | 308 (75.3%) | 101 (24.7%) |
| Bachelor's Degree or higher | 573 (77.1%) | 170 (22.9%) |
Occupancy by Age of Householder in Tuckerton borough
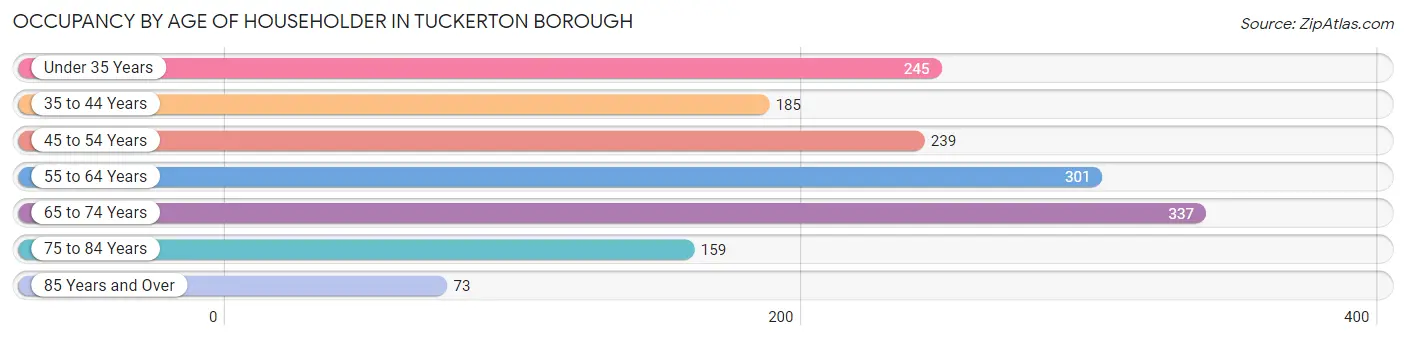
| Age Bracket | # Households | % Households |
| Under 35 Years | 245 | 15.9% |
| 35 to 44 Years | 185 | 12.0% |
| 45 to 54 Years | 239 | 15.5% |
| 55 to 64 Years | 301 | 19.6% |
| 65 to 74 Years | 337 | 21.9% |
| 75 to 84 Years | 159 | 10.3% |
| 85 Years and Over | 73 | 4.7% |
| Total | 1,539 | 100.0% |
Housing Finances in Tuckerton borough
Median Income by Occupancy in Tuckerton borough
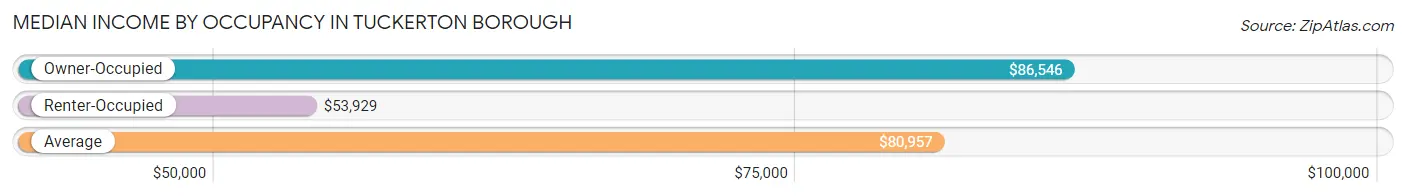
| Occupancy Type | # Households | Median Income |
| Owner-Occupied | 1,077 (70.0%) | $86,546 |
| Renter-Occupied | 462 (30.0%) | $53,929 |
| Average | 1,539 (100.0%) | $80,957 |
Occupancy by Householder Income Bracket in Tuckerton borough
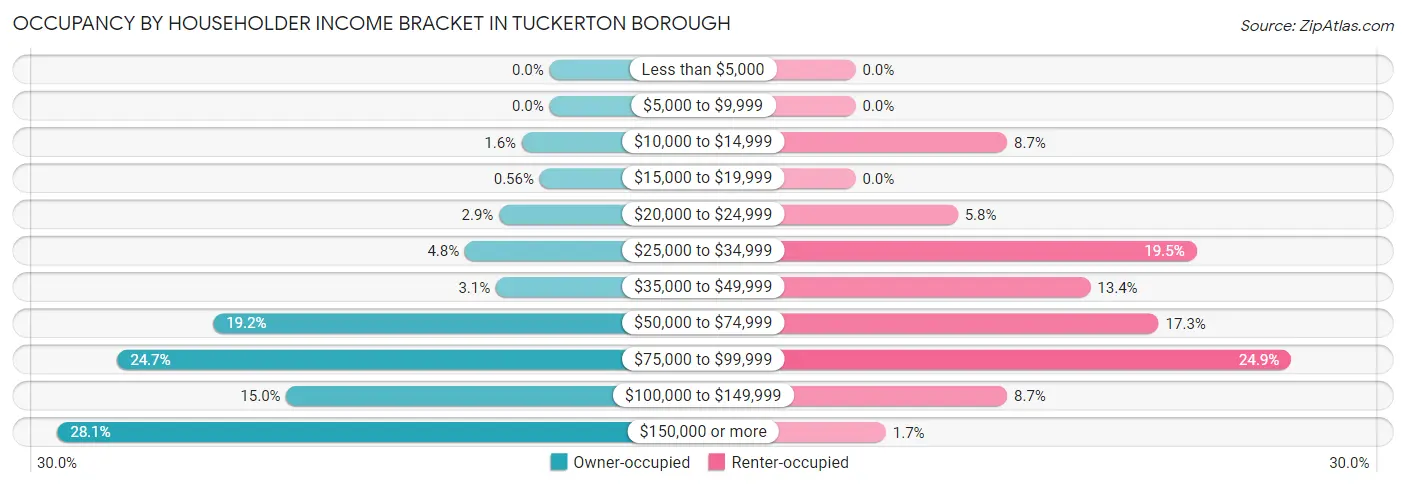
| Income Bracket | Owner-occupied | Renter-occupied |
| Less than $5,000 | 0 (0.0%) | 0 (0.0%) |
| $5,000 to $9,999 | 0 (0.0%) | 0 (0.0%) |
| $10,000 to $14,999 | 17 (1.6%) | 40 (8.7%) |
| $15,000 to $19,999 | 6 (0.6%) | 0 (0.0%) |
| $20,000 to $24,999 | 31 (2.9%) | 27 (5.8%) |
| $25,000 to $34,999 | 52 (4.8%) | 90 (19.5%) |
| $35,000 to $49,999 | 33 (3.1%) | 62 (13.4%) |
| $50,000 to $74,999 | 207 (19.2%) | 80 (17.3%) |
| $75,000 to $99,999 | 266 (24.7%) | 115 (24.9%) |
| $100,000 to $149,999 | 162 (15.0%) | 40 (8.7%) |
| $150,000 or more | 303 (28.1%) | 8 (1.7%) |
| Total | 1,077 (100.0%) | 462 (100.0%) |
Monthly Housing Cost Tiers in Tuckerton borough
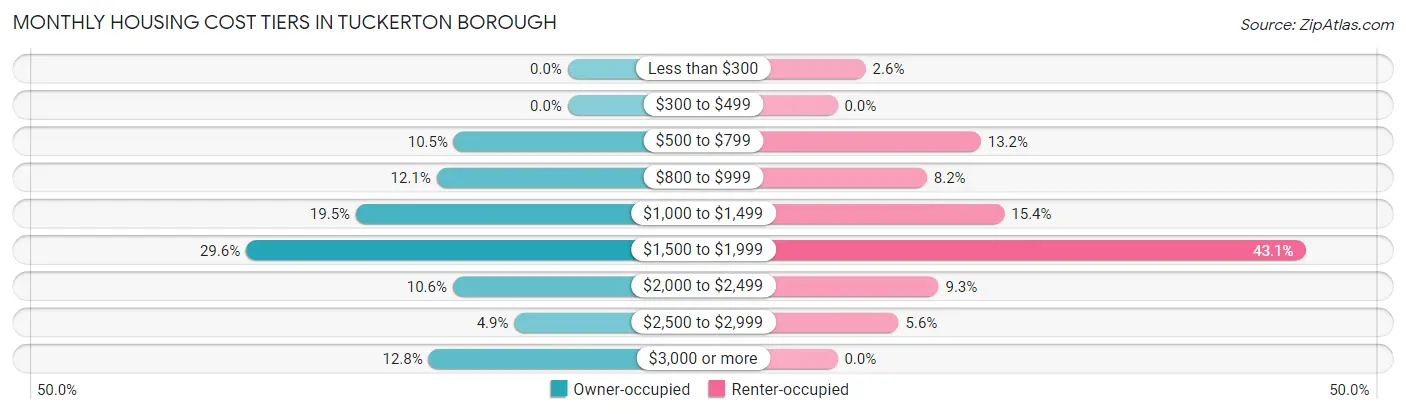
| Monthly Cost | Owner-occupied | Renter-occupied |
| Less than $300 | 0 (0.0%) | 12 (2.6%) |
| $300 to $499 | 0 (0.0%) | 0 (0.0%) |
| $500 to $799 | 113 (10.5%) | 61 (13.2%) |
| $800 to $999 | 130 (12.1%) | 38 (8.2%) |
| $1,000 to $1,499 | 210 (19.5%) | 71 (15.4%) |
| $1,500 to $1,999 | 319 (29.6%) | 199 (43.1%) |
| $2,000 to $2,499 | 114 (10.6%) | 43 (9.3%) |
| $2,500 to $2,999 | 53 (4.9%) | 26 (5.6%) |
| $3,000 or more | 138 (12.8%) | 0 (0.0%) |
| Total | 1,077 (100.0%) | 462 (100.0%) |
Physical Housing Characteristics in Tuckerton borough
Housing Structures in Tuckerton borough
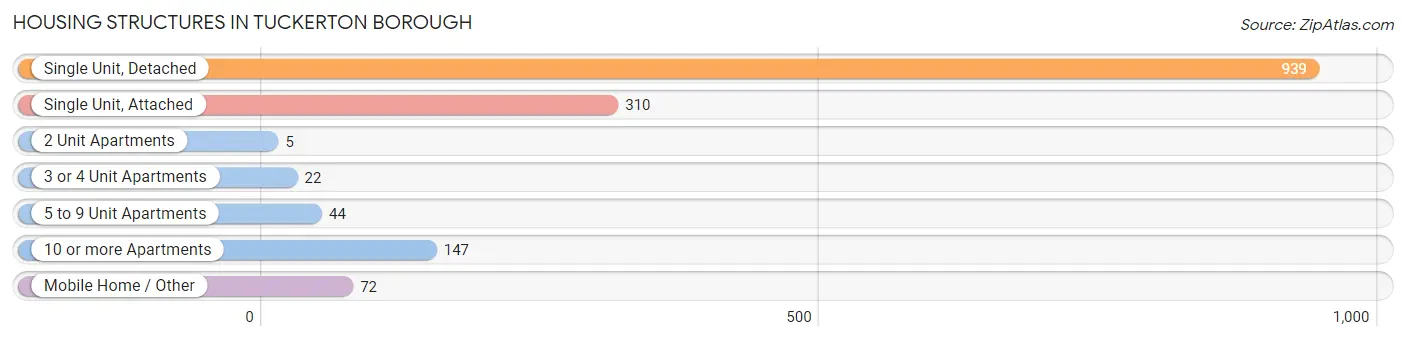
| Structure Type | # Housing Units | % Housing Units |
| Single Unit, Detached | 939 | 61.0% |
| Single Unit, Attached | 310 | 20.1% |
| 2 Unit Apartments | 5 | 0.3% |
| 3 or 4 Unit Apartments | 22 | 1.4% |
| 5 to 9 Unit Apartments | 44 | 2.9% |
| 10 or more Apartments | 147 | 9.6% |
| Mobile Home / Other | 72 | 4.7% |
| Total | 1,539 | 100.0% |
Housing Structures by Occupancy in Tuckerton borough
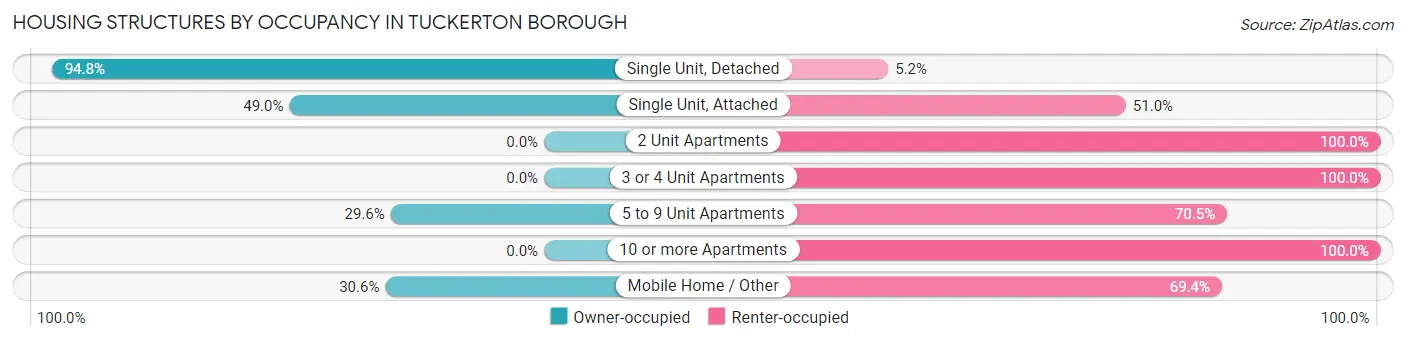
| Structure Type | Owner-occupied | Renter-occupied |
| Single Unit, Detached | 890 (94.8%) | 49 (5.2%) |
| Single Unit, Attached | 152 (49.0%) | 158 (51.0%) |
| 2 Unit Apartments | 0 (0.0%) | 5 (100.0%) |
| 3 or 4 Unit Apartments | 0 (0.0%) | 22 (100.0%) |
| 5 to 9 Unit Apartments | 13 (29.5%) | 31 (70.5%) |
| 10 or more Apartments | 0 (0.0%) | 147 (100.0%) |
| Mobile Home / Other | 22 (30.6%) | 50 (69.4%) |
| Total | 1,077 (70.0%) | 462 (30.0%) |
Housing Structures by Number of Rooms in Tuckerton borough
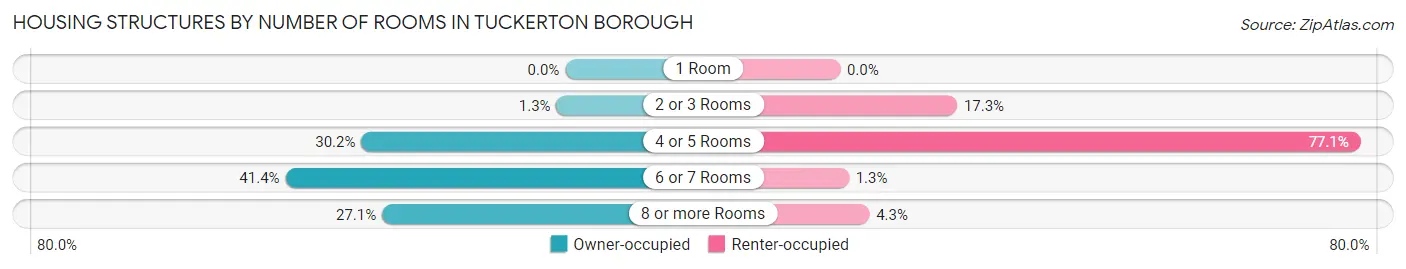
| Number of Rooms | Owner-occupied | Renter-occupied |
| 1 Room | 0 (0.0%) | 0 (0.0%) |
| 2 or 3 Rooms | 14 (1.3%) | 80 (17.3%) |
| 4 or 5 Rooms | 325 (30.2%) | 356 (77.1%) |
| 6 or 7 Rooms | 446 (41.4%) | 6 (1.3%) |
| 8 or more Rooms | 292 (27.1%) | 20 (4.3%) |
| Total | 1,077 (100.0%) | 462 (100.0%) |
Housing Structure by Heating Type in Tuckerton borough
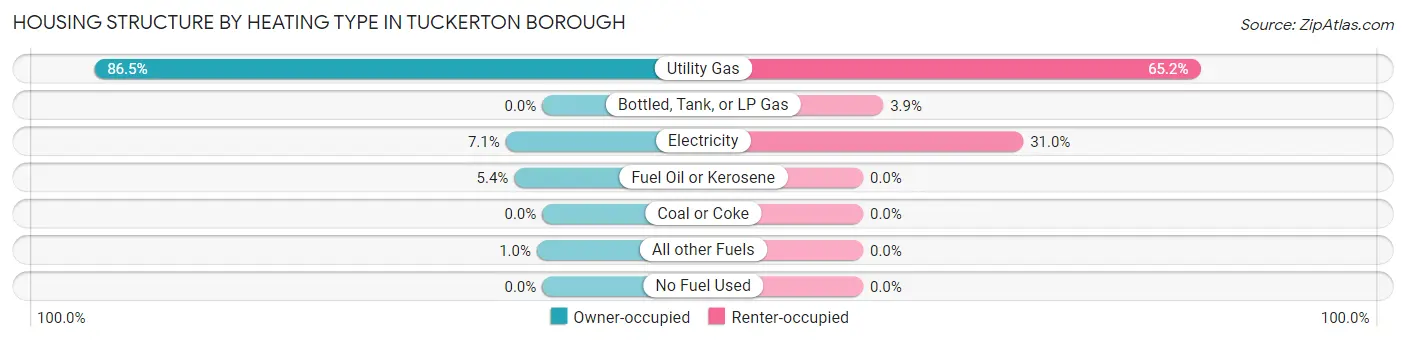
| Heating Type | Owner-occupied | Renter-occupied |
| Utility Gas | 932 (86.5%) | 301 (65.1%) |
| Bottled, Tank, or LP Gas | 0 (0.0%) | 18 (3.9%) |
| Electricity | 76 (7.1%) | 143 (30.9%) |
| Fuel Oil or Kerosene | 58 (5.4%) | 0 (0.0%) |
| Coal or Coke | 0 (0.0%) | 0 (0.0%) |
| All other Fuels | 11 (1.0%) | 0 (0.0%) |
| No Fuel Used | 0 (0.0%) | 0 (0.0%) |
| Total | 1,077 (100.0%) | 462 (100.0%) |
Household Vehicle Usage in Tuckerton borough
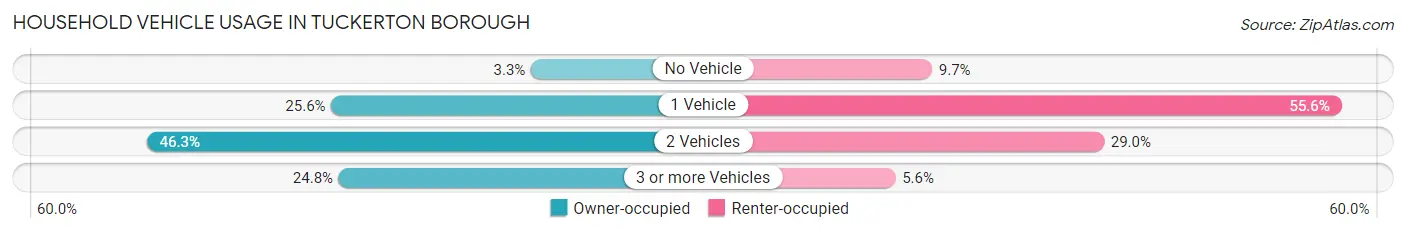
| Vehicles per Household | Owner-occupied | Renter-occupied |
| No Vehicle | 35 (3.3%) | 45 (9.7%) |
| 1 Vehicle | 276 (25.6%) | 257 (55.6%) |
| 2 Vehicles | 499 (46.3%) | 134 (29.0%) |
| 3 or more Vehicles | 267 (24.8%) | 26 (5.6%) |
| Total | 1,077 (100.0%) | 462 (100.0%) |
Real Estate & Mortgages in Tuckerton borough
Real Estate and Mortgage Overview in Tuckerton borough
| Characteristic | Without Mortgage | With Mortgage |
| Housing Units | 351 | 726 |
| Median Property Value | $267,900 | $269,000 |
| Median Household Income | $73,542 | $278 |
| Monthly Housing Costs | $884 | $138 |
| Real Estate Taxes | $5,845 | $0 |
Property Value by Mortgage Status in Tuckerton borough
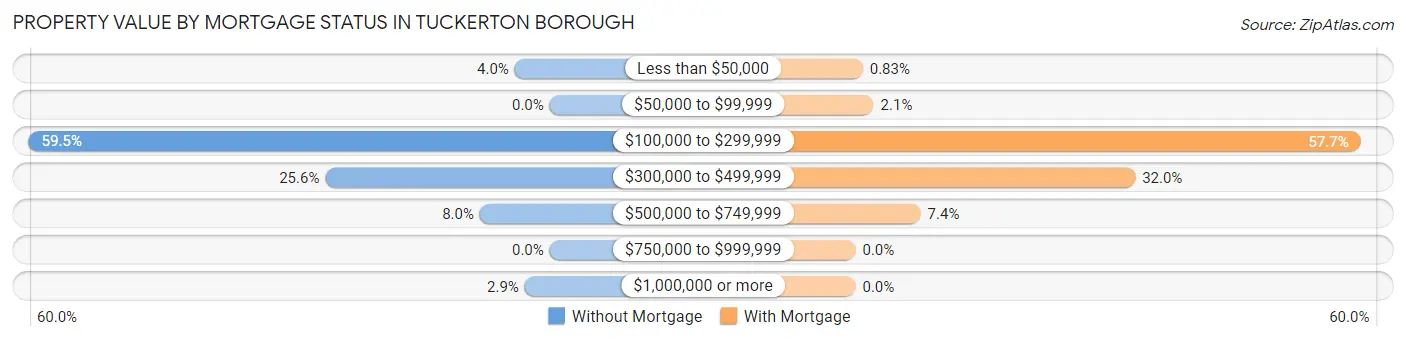
| Property Value | Without Mortgage | With Mortgage |
| Less than $50,000 | 14 (4.0%) | 6 (0.8%) |
| $50,000 to $99,999 | 0 (0.0%) | 15 (2.1%) |
| $100,000 to $299,999 | 209 (59.5%) | 419 (57.7%) |
| $300,000 to $499,999 | 90 (25.6%) | 232 (32.0%) |
| $500,000 to $749,999 | 28 (8.0%) | 54 (7.4%) |
| $750,000 to $999,999 | 0 (0.0%) | 0 (0.0%) |
| $1,000,000 or more | 10 (2.9%) | 0 (0.0%) |
| Total | 351 (100.0%) | 726 (100.0%) |
Household Income by Mortgage Status in Tuckerton borough
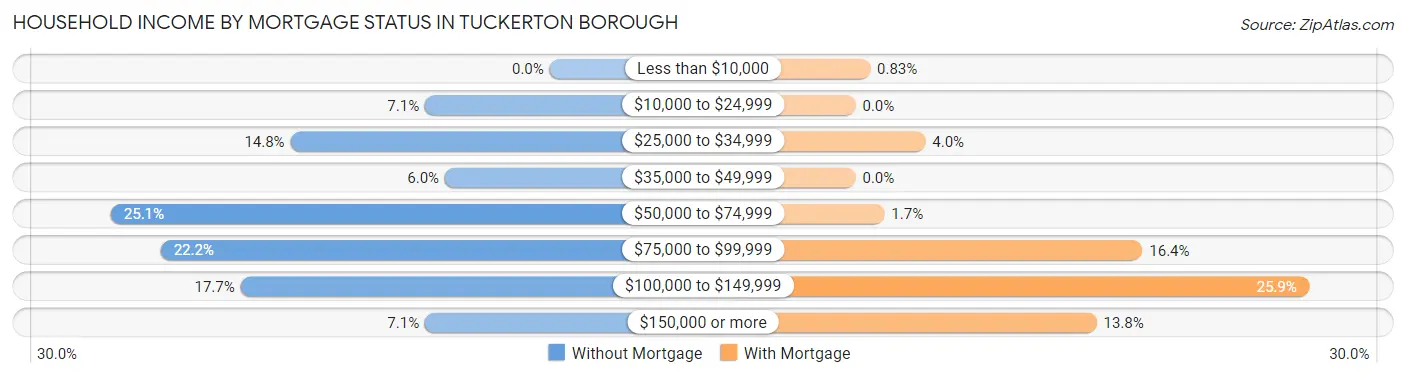
| Household Income | Without Mortgage | With Mortgage |
| Less than $10,000 | 0 (0.0%) | 6 (0.8%) |
| $10,000 to $24,999 | 25 (7.1%) | 0 (0.0%) |
| $25,000 to $34,999 | 52 (14.8%) | 29 (4.0%) |
| $35,000 to $49,999 | 21 (6.0%) | 0 (0.0%) |
| $50,000 to $74,999 | 88 (25.1%) | 12 (1.7%) |
| $75,000 to $99,999 | 78 (22.2%) | 119 (16.4%) |
| $100,000 to $149,999 | 62 (17.7%) | 188 (25.9%) |
| $150,000 or more | 25 (7.1%) | 100 (13.8%) |
| Total | 351 (100.0%) | 726 (100.0%) |
Property Value to Household Income Ratio in Tuckerton borough
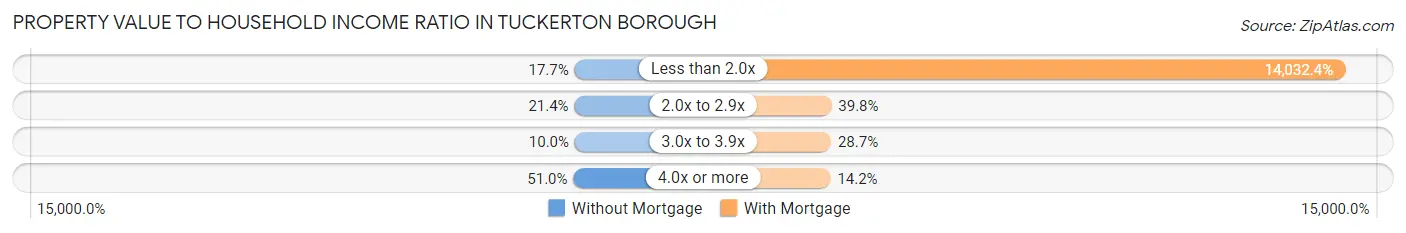
| Value-to-Income Ratio | Without Mortgage | With Mortgage |
| Less than 2.0x | 62 (17.7%) | 101,875 (14,032.4%) |
| 2.0x to 2.9x | 75 (21.4%) | 289 (39.8%) |
| 3.0x to 3.9x | 35 (10.0%) | 208 (28.6%) |
| 4.0x or more | 179 (51.0%) | 103 (14.2%) |
| Total | 351 (100.0%) | 726 (100.0%) |
Real Estate Taxes by Mortgage Status in Tuckerton borough
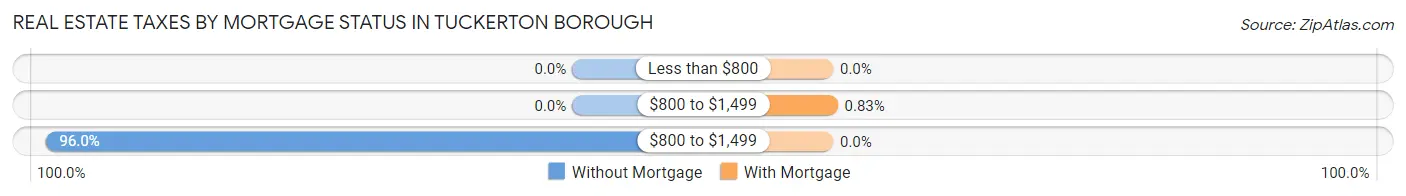
| Property Taxes | Without Mortgage | With Mortgage |
| Less than $800 | 0 (0.0%) | 0 (0.0%) |
| $800 to $1,499 | 0 (0.0%) | 6 (0.8%) |
| $800 to $1,499 | 337 (96.0%) | 0 (0.0%) |
| Total | 351 (100.0%) | 726 (100.0%) |
Health & Disability in Tuckerton borough
Health Insurance Coverage by Age in Tuckerton borough
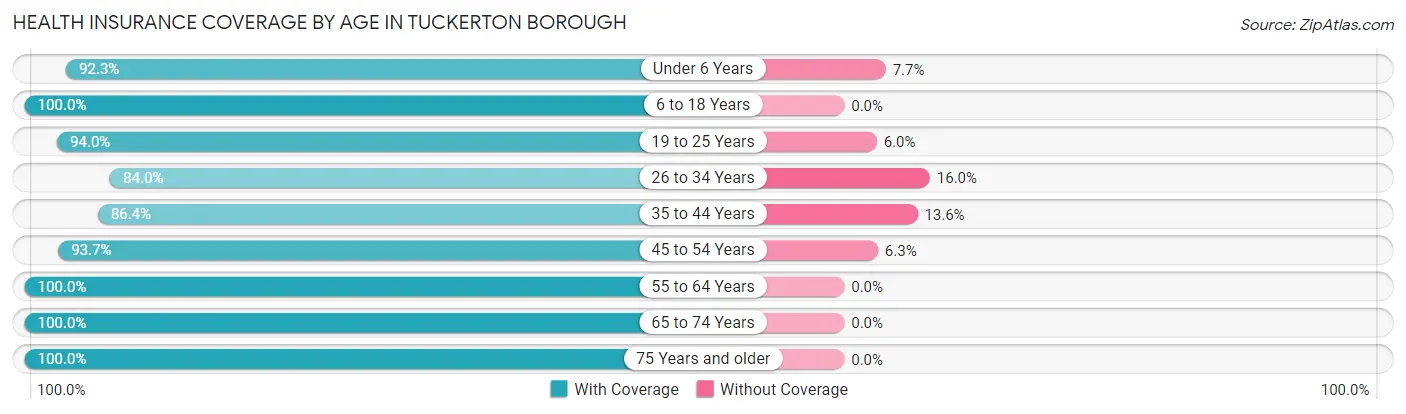
| Age Bracket | With Coverage | Without Coverage |
| Under 6 Years | 263 (92.3%) | 22 (7.7%) |
| 6 to 18 Years | 415 (100.0%) | 0 (0.0%) |
| 19 to 25 Years | 249 (94.0%) | 16 (6.0%) |
| 26 to 34 Years | 453 (84.0%) | 86 (16.0%) |
| 35 to 44 Years | 266 (86.4%) | 42 (13.6%) |
| 45 to 54 Years | 389 (93.7%) | 26 (6.3%) |
| 55 to 64 Years | 602 (100.0%) | 0 (0.0%) |
| 65 to 74 Years | 456 (100.0%) | 0 (0.0%) |
| 75 Years and older | 282 (100.0%) | 0 (0.0%) |
| Total | 3,375 (94.6%) | 192 (5.4%) |
Health Insurance Coverage by Citizenship Status in Tuckerton borough
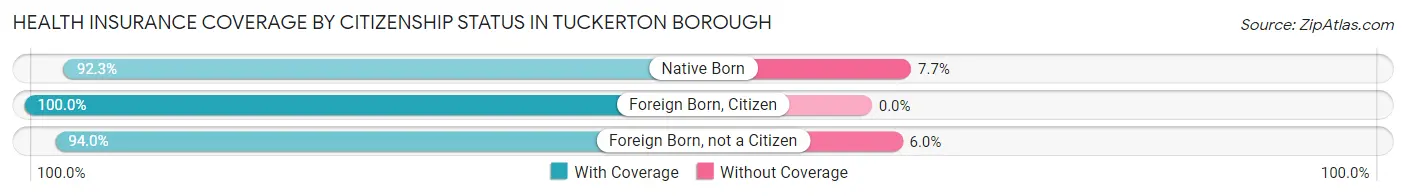
| Citizenship Status | With Coverage | Without Coverage |
| Native Born | 263 (92.3%) | 22 (7.7%) |
| Foreign Born, Citizen | 415 (100.0%) | 0 (0.0%) |
| Foreign Born, not a Citizen | 249 (94.0%) | 16 (6.0%) |
Health Insurance Coverage by Household Income in Tuckerton borough
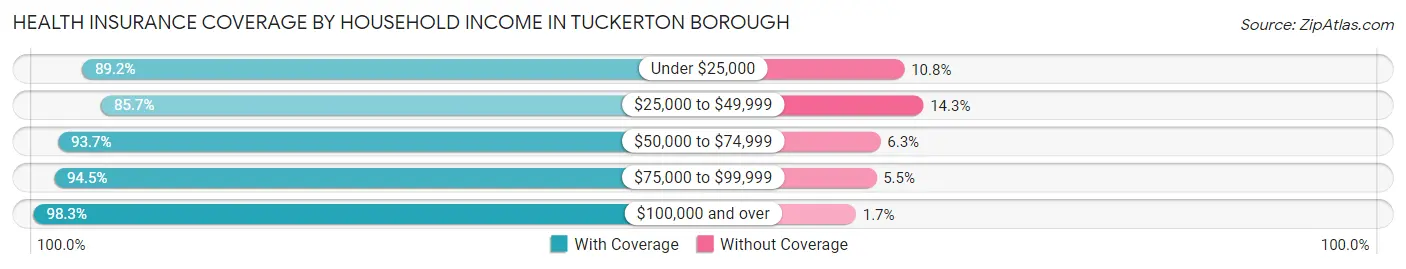
| Household Income | With Coverage | Without Coverage |
| Under $25,000 | 141 (89.2%) | 17 (10.8%) |
| $25,000 to $49,999 | 371 (85.7%) | 62 (14.3%) |
| $50,000 to $74,999 | 521 (93.7%) | 35 (6.3%) |
| $75,000 to $99,999 | 857 (94.5%) | 50 (5.5%) |
| $100,000 and over | 1,453 (98.3%) | 25 (1.7%) |
Public vs Private Health Insurance Coverage by Age in Tuckerton borough
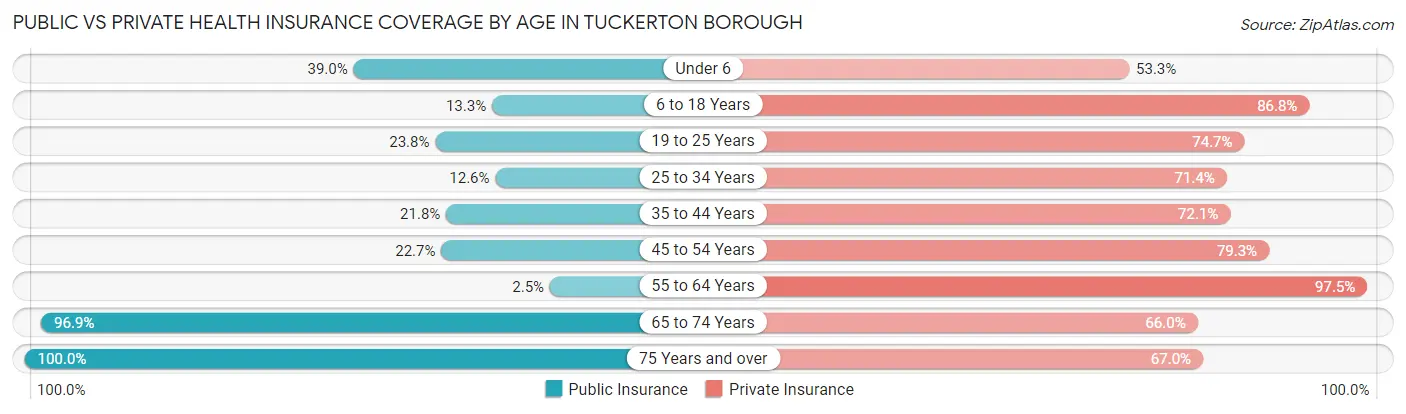
| Age Bracket | Public Insurance | Private Insurance |
| Under 6 | 111 (39.0%) | 152 (53.3%) |
| 6 to 18 Years | 55 (13.3%) | 360 (86.8%) |
| 19 to 25 Years | 63 (23.8%) | 198 (74.7%) |
| 25 to 34 Years | 68 (12.6%) | 385 (71.4%) |
| 35 to 44 Years | 67 (21.7%) | 222 (72.1%) |
| 45 to 54 Years | 94 (22.7%) | 329 (79.3%) |
| 55 to 64 Years | 15 (2.5%) | 587 (97.5%) |
| 65 to 74 Years | 442 (96.9%) | 301 (66.0%) |
| 75 Years and over | 282 (100.0%) | 189 (67.0%) |
| Total | 1,197 (33.6%) | 2,723 (76.3%) |
Disability Status by Sex by Age in Tuckerton borough
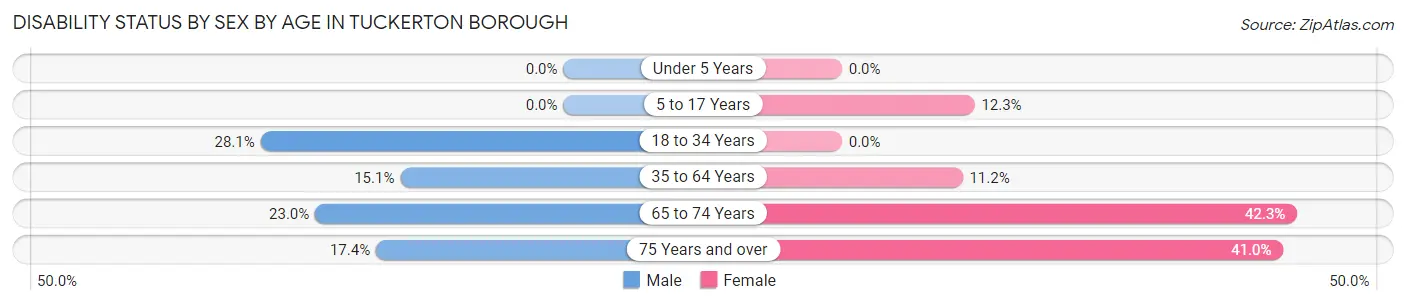
| Age Bracket | Male | Female |
| Under 5 Years | 0 (0.0%) | 0 (0.0%) |
| 5 to 17 Years | 0 (0.0%) | 40 (12.3%) |
| 18 to 34 Years | 127 (28.1%) | 0 (0.0%) |
| 35 to 64 Years | 106 (15.1%) | 70 (11.2%) |
| 65 to 74 Years | 44 (23.0%) | 112 (42.3%) |
| 75 Years and over | 24 (17.4%) | 59 (41.0%) |
Disability Class by Sex by Age in Tuckerton borough
Disability Class: Hearing Difficulty
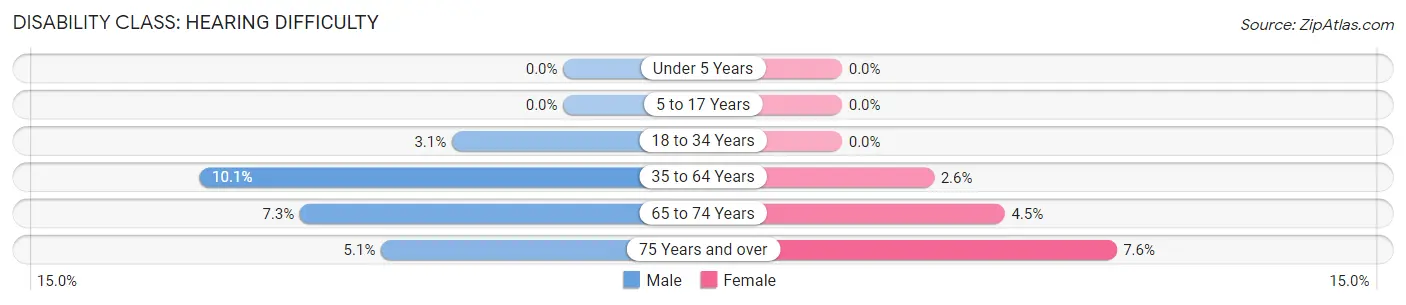
| Age Bracket | Male | Female |
| Under 5 Years | 0 (0.0%) | 0 (0.0%) |
| 5 to 17 Years | 0 (0.0%) | 0 (0.0%) |
| 18 to 34 Years | 14 (3.1%) | 0 (0.0%) |
| 35 to 64 Years | 71 (10.1%) | 16 (2.6%) |
| 65 to 74 Years | 14 (7.3%) | 12 (4.5%) |
| 75 Years and over | 7 (5.1%) | 11 (7.6%) |
Disability Class: Vision Difficulty
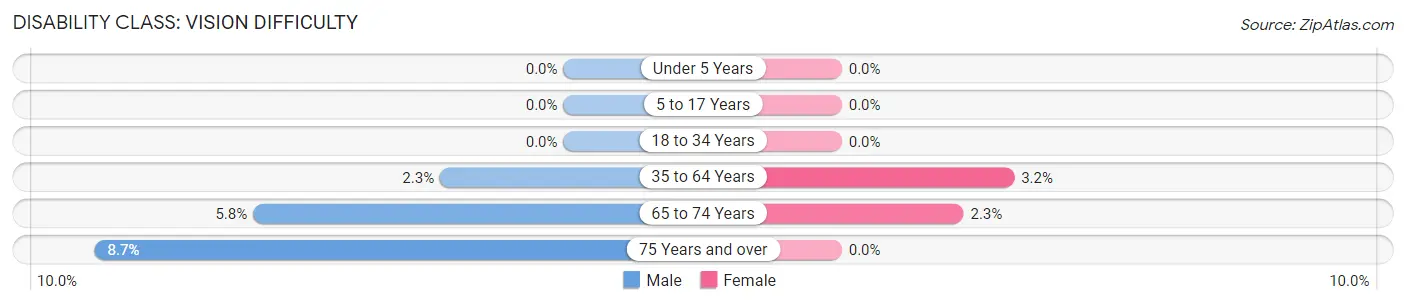
| Age Bracket | Male | Female |
| Under 5 Years | 0 (0.0%) | 0 (0.0%) |
| 5 to 17 Years | 0 (0.0%) | 0 (0.0%) |
| 18 to 34 Years | 0 (0.0%) | 0 (0.0%) |
| 35 to 64 Years | 16 (2.3%) | 20 (3.2%) |
| 65 to 74 Years | 11 (5.8%) | 6 (2.3%) |
| 75 Years and over | 12 (8.7%) | 0 (0.0%) |
Disability Class: Cognitive Difficulty
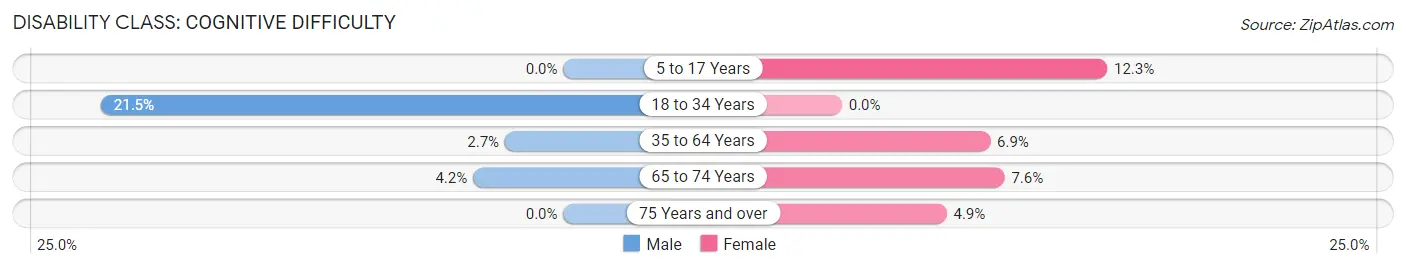
| Age Bracket | Male | Female |
| 5 to 17 Years | 0 (0.0%) | 40 (12.3%) |
| 18 to 34 Years | 97 (21.5%) | 0 (0.0%) |
| 35 to 64 Years | 19 (2.7%) | 43 (6.9%) |
| 65 to 74 Years | 8 (4.2%) | 20 (7.5%) |
| 75 Years and over | 0 (0.0%) | 7 (4.9%) |
Disability Class: Ambulatory Difficulty
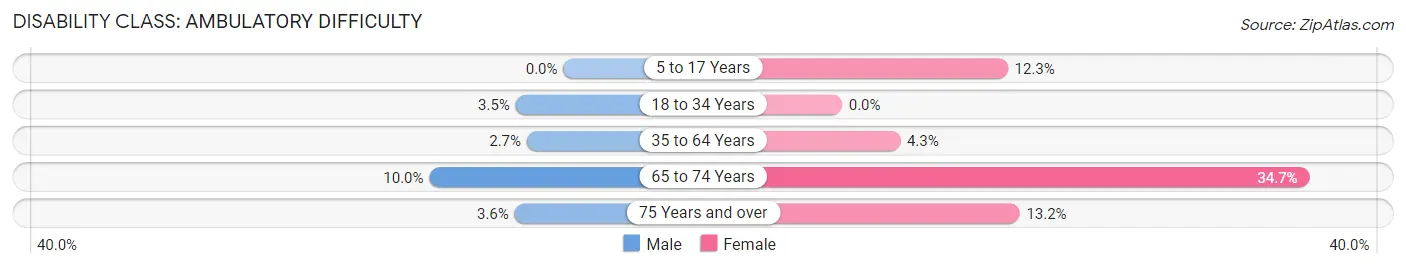
| Age Bracket | Male | Female |
| 5 to 17 Years | 0 (0.0%) | 40 (12.3%) |
| 18 to 34 Years | 16 (3.5%) | 0 (0.0%) |
| 35 to 64 Years | 19 (2.7%) | 27 (4.3%) |
| 65 to 74 Years | 19 (10.0%) | 92 (34.7%) |
| 75 Years and over | 5 (3.6%) | 19 (13.2%) |
Disability Class: Self-Care Difficulty
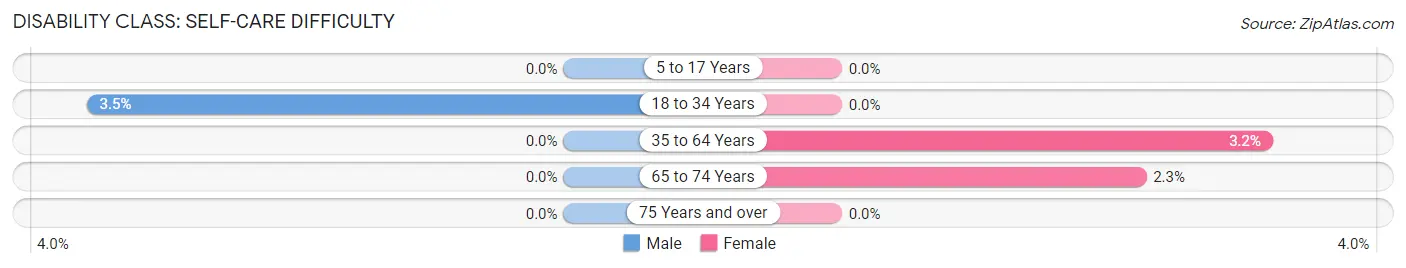
| Age Bracket | Male | Female |
| 5 to 17 Years | 0 (0.0%) | 0 (0.0%) |
| 18 to 34 Years | 16 (3.5%) | 0 (0.0%) |
| 35 to 64 Years | 0 (0.0%) | 20 (3.2%) |
| 65 to 74 Years | 0 (0.0%) | 6 (2.3%) |
| 75 Years and over | 0 (0.0%) | 0 (0.0%) |
Technology Access in Tuckerton borough
Computing Device Access in Tuckerton borough
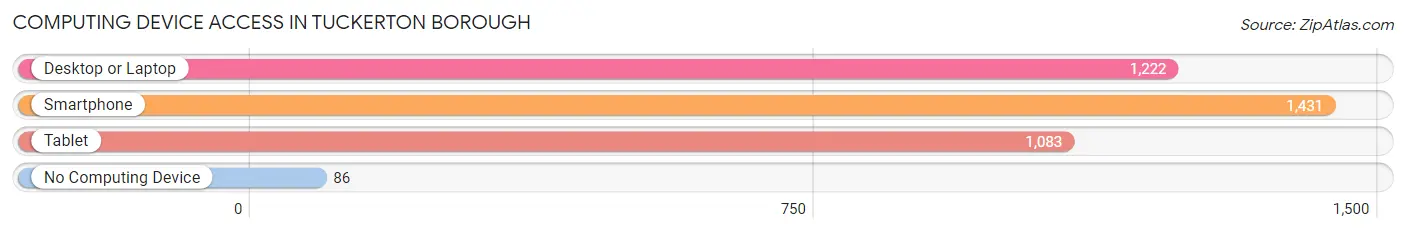
| Device Type | # Households | % Households |
| Desktop or Laptop | 1,222 | 79.4% |
| Smartphone | 1,431 | 93.0% |
| Tablet | 1,083 | 70.4% |
| No Computing Device | 86 | 5.6% |
| Total | 1,539 | 100.0% |
Internet Access in Tuckerton borough
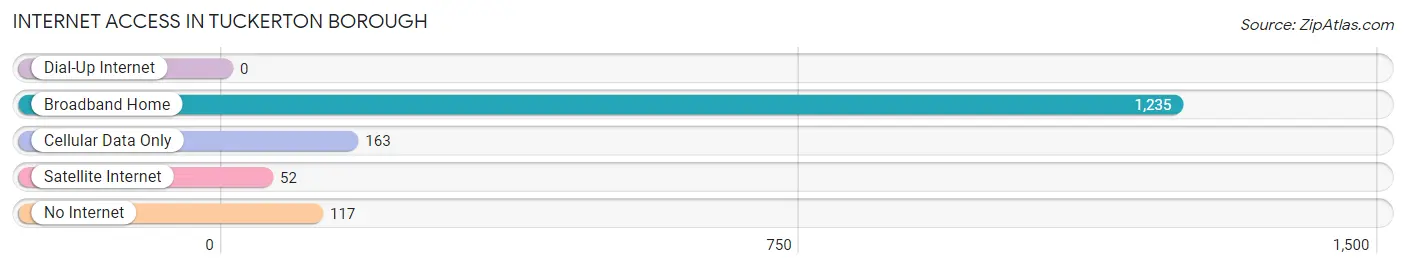
| Internet Type | # Households | % Households |
| Dial-Up Internet | 0 | 0.0% |
| Broadband Home | 1,235 | 80.2% |
| Cellular Data Only | 163 | 10.6% |
| Satellite Internet | 52 | 3.4% |
| No Internet | 117 | 7.6% |
| Total | 1,539 | 100.0% |
Tuckerton borough Summary
Tuckerton Borough is a small borough located in Ocean County, New Jersey. It is situated on the southern tip of Little Egg Harbor Township, and is bordered by Little Egg Harbor Township to the north, Eagleswood Township to the east, and Long Beach Township to the south. The borough is located approximately 50 miles east of Philadelphia, and is part of the Atlantic City metropolitan area.
History
Tuckerton Borough was originally part of Little Egg Harbor Township, and was incorporated as a borough in 1901. The borough was named after the Tuckerton Creek, which was named after the Tuckerton family, who were among the first settlers in the area. The Tuckerton family owned a large tract of land in the area, and the creek was named after them.
The borough was originally a fishing and farming community, and the Tuckerton Creek was an important source of food and transportation for the early settlers. The creek was also used for oystering, and the area was known for its oyster beds.
In the late 19th century, the borough began to develop as a resort community, and many of the original homes in the area were built as summer homes for wealthy Philadelphians. The borough also became a popular destination for boaters, and the Tuckerton Seaport was established in the early 20th century.
Geography
Tuckerton Borough is located at 39°37'N 74°25'W (39.6167, -74.4167). According to the United States Census Bureau, the borough has a total area of 2.2 square miles (5.7 km2), all of which is land.
The borough is located on the southern tip of Little Egg Harbor Township, and is bordered by Little Egg Harbor Township to the north, Eagleswood Township to the east, and Long Beach Township to the south. The borough is located approximately 50 miles east of Philadelphia, and is part of the Atlantic City metropolitan area.
Economy
The economy of Tuckerton Borough is largely based on tourism and recreation. The borough is home to the Tuckerton Seaport, which is a maritime museum and educational center. The seaport is a popular destination for visitors, and offers a variety of activities, including boat rides, fishing, and educational programs.
The borough is also home to several marinas, which provide services for boaters and fishermen. The marinas also offer boat rentals, and are popular destinations for visitors.
The borough is also home to several restaurants, bars, and shops, which cater to both locals and visitors.
Demographics
As of the 2010 United States Census, there were 2,876 people, 1,093 households, and 790 families residing in the borough. The population density was 1,312.2 people per square mile (506.2/km2). There were 1,179 housing units at an average density of 531.2 per square mile (205.3/km2). The racial makeup of the borough was 94.2% White, 1.3% African American, 0.2% Native American, 1.2% Asian, 0.1% Pacific Islander, 1.7% from other races, and 1.4% from two or more races. Hispanic or Latino of any race were 5.2% of the population.
There were 1,093 households, out of which 28.2% had children under the age of 18 living with them, 54.2% were married couples living together, 11.2% had a female householder with no husband present, and 29.2% were non-families. 24.2% of all households were made up of individuals, and 11.2% had someone living alone who was 65 years of age or older. The average household size was 2.63 and the average family size was 3.12.
In the borough, the population was spread out, with 22.7% under the age of 18, 7.2% from 18 to 24, 25.2% from 25 to 44, 28.2% from 45 to 64, and 16.7% who were 65 years of age or older. The median age was 41.2 years. For every 100 females, there were 97.2 males. For every 100 females age 18 and over, there were 94.2 males.
The median income for a household in the borough was $60,938, and the median income for a family was $68,750. Males had a median income of $50,000 versus $36,250 for females. The per capita income for the borough was $27,945. About 4.2% of families and 5.7% of the population were below the poverty line, including 8.2% of those under age 18 and 4.2% of those age 65 or over.
Common Questions
What is Per Capita Income in Tuckerton borough?
Per Capita income in Tuckerton borough is $43,962.
What is the Median Family Income in Tuckerton borough?
Median Family Income in Tuckerton borough is $94,648.
What is the Median Household income in Tuckerton borough?
Median Household Income in Tuckerton borough is $80,957.
What is Income or Wage Gap in Tuckerton borough?
Income or Wage Gap in Tuckerton borough is 37.3%.
Women in Tuckerton borough earn 62.7 cents for every dollar earned by a man.
What is Inequality or Gini Index in Tuckerton borough?
Inequality or Gini Index in Tuckerton borough is 0.39.
What is the Total Population of Tuckerton borough?
Total Population of Tuckerton borough is 3,582.
What is the Total Male Population of Tuckerton borough?
Total Male Population of Tuckerton borough is 1,747.
What is the Total Female Population of Tuckerton borough?
Total Female Population of Tuckerton borough is 1,835.
What is the Ratio of Males per 100 Females in Tuckerton borough?
There are 95.20 Males per 100 Females in Tuckerton borough.
What is the Ratio of Females per 100 Males in Tuckerton borough?
There are 105.04 Females per 100 Males in Tuckerton borough.
What is the Median Population Age in Tuckerton borough?
Median Population Age in Tuckerton borough is 44.4 Years.
What is the Average Family Size in Tuckerton borough
Average Family Size in Tuckerton borough is 3.0 People.
What is the Average Household Size in Tuckerton borough
Average Household Size in Tuckerton borough is 2.3 People.
How Large is the Labor Force in Tuckerton borough?
There are 1,876 People in the Labor Forcein in Tuckerton borough.
What is the Percentage of People in the Labor Force in Tuckerton borough?
63.2% of People are in the Labor Force in Tuckerton borough.
What is the Unemployment Rate in Tuckerton borough?
Unemployment Rate in Tuckerton borough is 8.7%.