Wood Ridge borough, NJ Map & Demographics
Wood Ridge borough Overview
$61,861
PER CAPITA INCOME
$171,233
AVG FAMILY INCOME
$132,901
AVG HOUSEHOLD INCOME
44.2%
WAGE / INCOME GAP [ % ]
55.8¢/ $1
WAGE / INCOME GAP [ $ ]
0.39
INEQUALITY / GINI INDEX
9,978
TOTAL POPULATION
5,021
MALE POPULATION
4,957
FEMALE POPULATION
101.29
MALES / 100 FEMALES
98.73
FEMALES / 100 MALES
38.0
MEDIAN AGE
3.1
AVG FAMILY SIZE
2.6
AVG HOUSEHOLD SIZE
6,239
LABOR FORCE [ PEOPLE ]
74.5%
PERCENT IN LABOR FORCE
4.2%
UNEMPLOYMENT RATE
Income in Wood Ridge borough
Income Overview in Wood Ridge borough
Per Capita Income in Wood Ridge borough is $61,861, while median incomes of families and households are $171,233 and $132,901 respectively.
| Characteristic | Number | Measure |
| Per Capita Income | 9,978 | $61,861 |
| Median Family Income | 2,743 | $171,233 |
| Mean Family Income | 2,743 | $183,128 |
| Median Household Income | 3,851 | $132,901 |
| Mean Household Income | 3,851 | $156,858 |
| Income Deficit | 2,743 | $0 |
| Wage / Income Gap (%) | 9,978 | 44.20% |
| Wage / Income Gap ($) | 9,978 | 55.80¢ per $1 |
| Gini / Inequality Index | 9,978 | 0.39 |
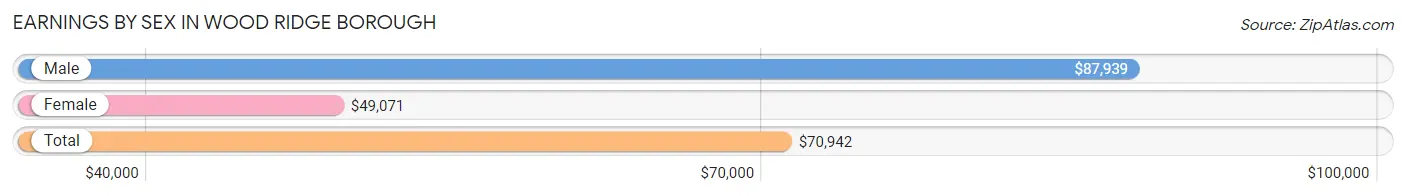
Earnings by Sex in Wood Ridge borough
Average Earnings in Wood Ridge borough are $70,942, $87,939 for men and $49,071 for women, a difference of 44.2%.
| Sex | Number | Average Earnings |
| Male | 3,253 (51.2%) | $87,939 |
| Female | 3,102 (48.8%) | $49,071 |
| Total | 6,355 (100.0%) | $70,942 |
Earnings by Sex by Income Bracket in Wood Ridge borough
The most common earnings brackets in Wood Ridge borough are $100,000+ for men (1,447 | 44.5%) and $100,000+ for women (623 | 20.1%).
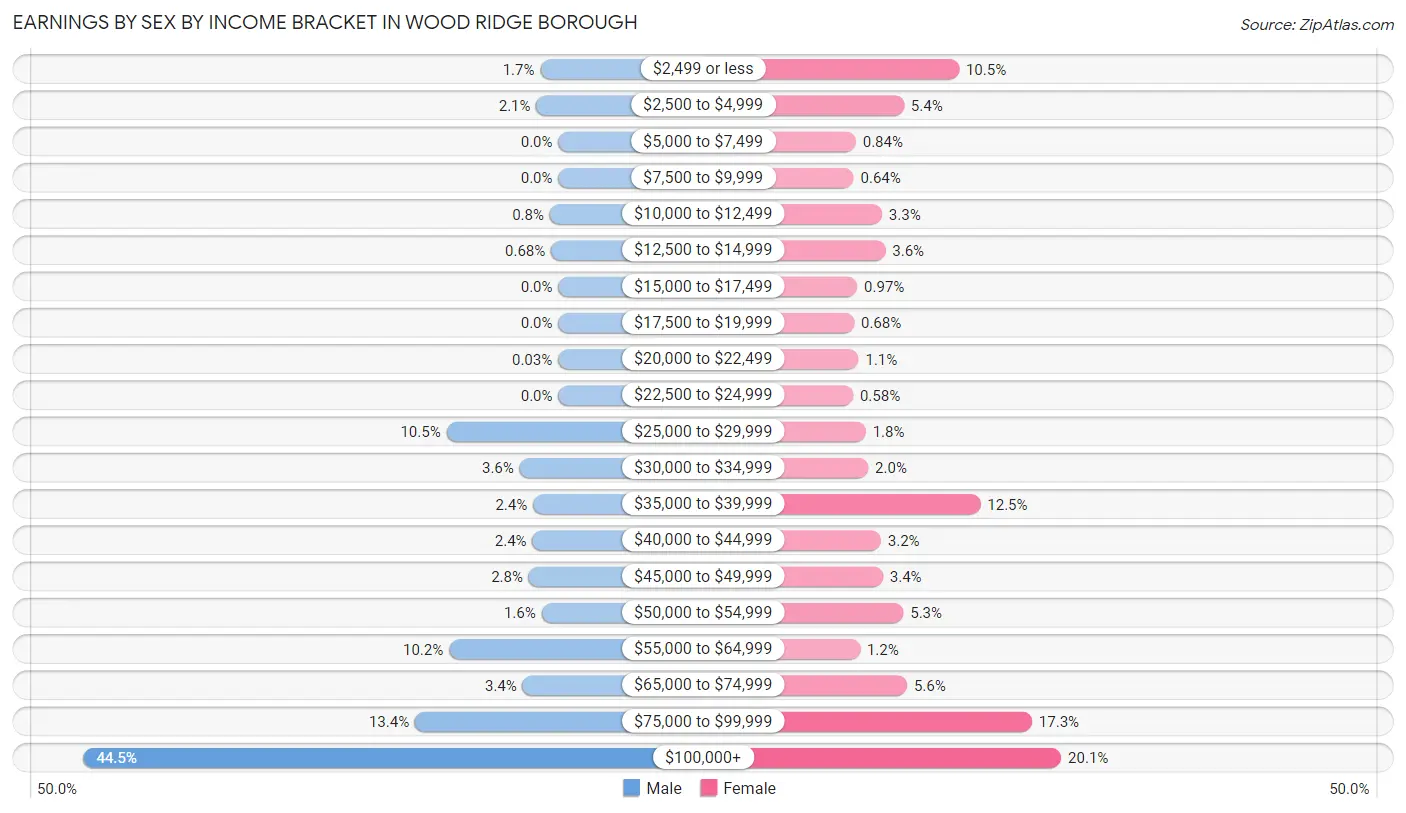
| Income | Male | Female |
| $2,499 or less | 55 (1.7%) | 326 (10.5%) |
| $2,500 to $4,999 | 67 (2.1%) | 166 (5.3%) |
| $5,000 to $7,499 | 0 (0.0%) | 26 (0.8%) |
| $7,500 to $9,999 | 0 (0.0%) | 20 (0.6%) |
| $10,000 to $12,499 | 26 (0.8%) | 102 (3.3%) |
| $12,500 to $14,999 | 22 (0.7%) | 112 (3.6%) |
| $15,000 to $17,499 | 0 (0.0%) | 30 (1.0%) |
| $17,500 to $19,999 | 0 (0.0%) | 21 (0.7%) |
| $20,000 to $22,499 | 1 (0.0%) | 34 (1.1%) |
| $22,500 to $24,999 | 0 (0.0%) | 18 (0.6%) |
| $25,000 to $29,999 | 341 (10.5%) | 55 (1.8%) |
| $30,000 to $34,999 | 118 (3.6%) | 62 (2.0%) |
| $35,000 to $39,999 | 77 (2.4%) | 388 (12.5%) |
| $40,000 to $44,999 | 79 (2.4%) | 99 (3.2%) |
| $45,000 to $49,999 | 90 (2.8%) | 105 (3.4%) |
| $50,000 to $54,999 | 51 (1.6%) | 164 (5.3%) |
| $55,000 to $64,999 | 333 (10.2%) | 38 (1.2%) |
| $65,000 to $74,999 | 109 (3.4%) | 175 (5.6%) |
| $75,000 to $99,999 | 437 (13.4%) | 538 (17.3%) |
| $100,000+ | 1,447 (44.5%) | 623 (20.1%) |
| Total | 3,253 (100.0%) | 3,102 (100.0%) |
Earnings by Sex by Educational Attainment in Wood Ridge borough
Average earnings in Wood Ridge borough are $94,796 for men and $70,407 for women, a difference of 25.7%. Men with an educational attainment of bachelor's degree enjoy the highest average annual earnings of $155,960, while those with college or associate's degree education earn the least with $71,094. Women with an educational attainment of graduate degree earn the most with the average annual earnings of $84,658, while those with college or associate's degree education have the smallest earnings of $41,597.
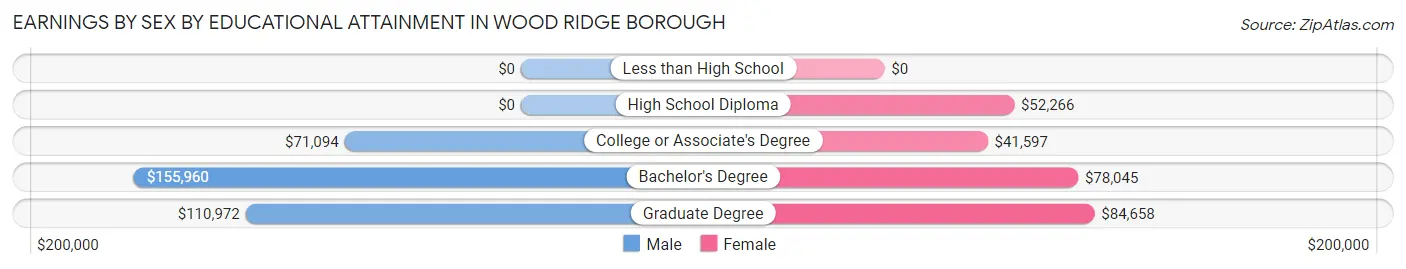
| Educational Attainment | Male Income | Female Income |
| Less than High School | - | - |
| High School Diploma | - | - |
| College or Associate's Degree | $71,094 | $41,597 |
| Bachelor's Degree | $155,960 | $78,045 |
| Graduate Degree | $110,972 | $84,658 |
| Total | $94,796 | $70,407 |
Family Income in Wood Ridge borough
Family Income Brackets in Wood Ridge borough
According to the Wood Ridge borough family income data, there are 1,031 families falling into the $200,000+ income range, which is the most common income bracket and makes up 37.6% of all families.
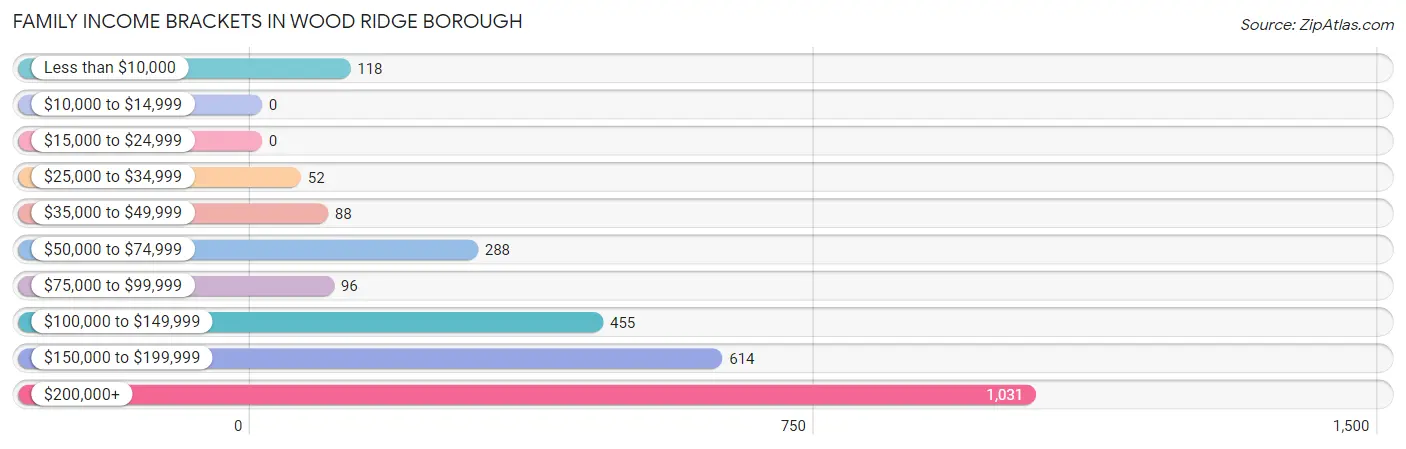
| Income Bracket | # Families | % Families |
| Less than $10,000 | 118 | 4.3% |
| $10,000 to $14,999 | 0 | 0.0% |
| $15,000 to $24,999 | 0 | 0.0% |
| $25,000 to $34,999 | 52 | 1.9% |
| $35,000 to $49,999 | 88 | 3.2% |
| $50,000 to $74,999 | 288 | 10.5% |
| $75,000 to $99,999 | 96 | 3.5% |
| $100,000 to $149,999 | 455 | 16.6% |
| $150,000 to $199,999 | 614 | 22.4% |
| $200,000+ | 1,031 | 37.6% |
Family Income by Famaliy Size in Wood Ridge borough
5-person families (235 | 8.6%) account for the highest median family income in Wood Ridge borough with $243,583 per family, while 2-person families (1,168 | 42.6%) have the highest median income of $70,912 per family member.
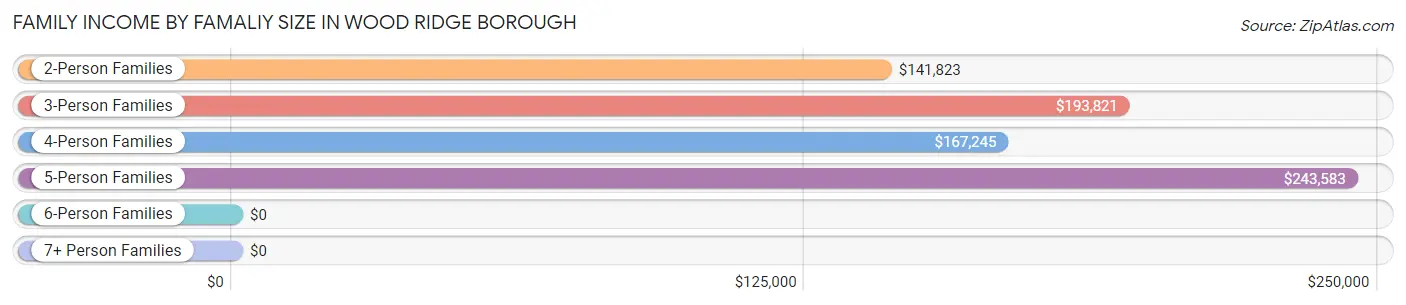
| Income Bracket | # Families | Median Income |
| 2-Person Families | 1,168 (42.6%) | $141,823 |
| 3-Person Families | 592 (21.6%) | $193,821 |
| 4-Person Families | 699 (25.5%) | $167,245 |
| 5-Person Families | 235 (8.6%) | $243,583 |
| 6-Person Families | 49 (1.8%) | $0 |
| 7+ Person Families | 0 (0.0%) | $0 |
| Total | 2,743 (100.0%) | $171,233 |
Family Income by Number of Earners in Wood Ridge borough
The median family income in Wood Ridge borough is $171,233, with families comprising 2 earners (1,430) having the highest median family income of $204,846, while families with no earners (259) have the lowest median family income of $54,044, accounting for 52.1% and 9.4% of families, respectively.
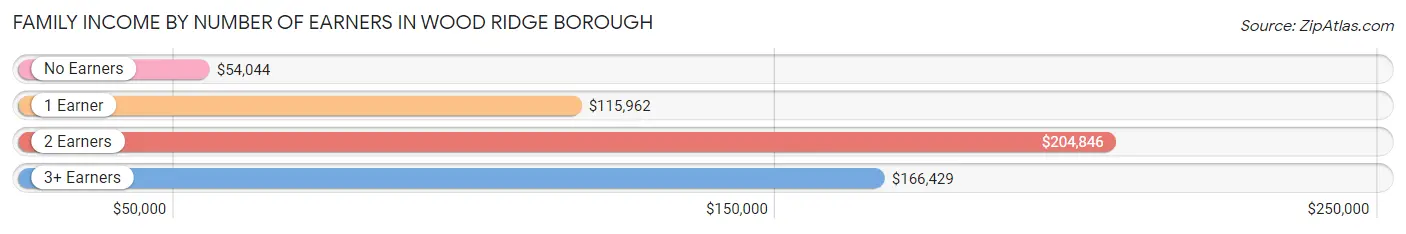
| Number of Earners | # Families | Median Income |
| No Earners | 259 (9.4%) | $54,044 |
| 1 Earner | 562 (20.5%) | $115,962 |
| 2 Earners | 1,430 (52.1%) | $204,846 |
| 3+ Earners | 492 (17.9%) | $166,429 |
| Total | 2,743 (100.0%) | $171,233 |
Household Income in Wood Ridge borough
Household Income Brackets in Wood Ridge borough
With 1,109 households falling in the category, the $200,000+ income range is the most frequent in Wood Ridge borough, accounting for 28.8% of all households.
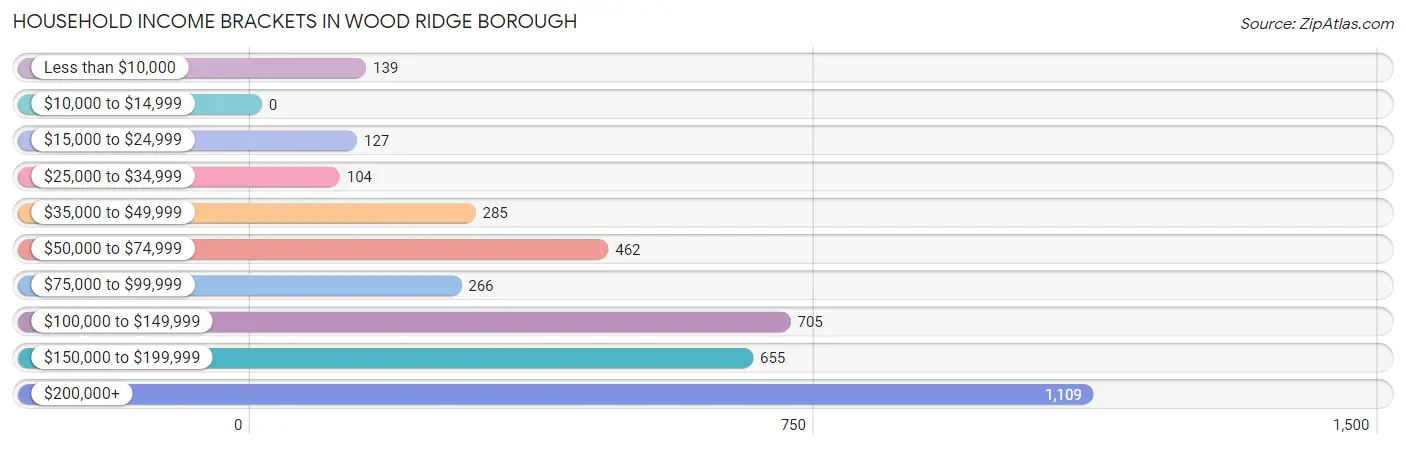
| Income Bracket | # Households | % Households |
| Less than $10,000 | 139 | 3.6% |
| $10,000 to $14,999 | 0 | 0.0% |
| $15,000 to $24,999 | 127 | 3.3% |
| $25,000 to $34,999 | 104 | 2.7% |
| $35,000 to $49,999 | 285 | 7.4% |
| $50,000 to $74,999 | 462 | 12.0% |
| $75,000 to $99,999 | 266 | 6.9% |
| $100,000 to $149,999 | 705 | 18.3% |
| $150,000 to $199,999 | 655 | 17.0% |
| $200,000+ | 1,109 | 28.8% |
Household Income by Householder Age in Wood Ridge borough
The median household income in Wood Ridge borough is $132,901, with the highest median household income of $185,978 found in the 25 to 44 years age bracket for the primary householder. A total of 1,522 households (39.5%) fall into this category. Meanwhile, the 15 to 24 years age bracket for the primary householder has the lowest median household income of $0, with 33 households (0.9%) in this group.
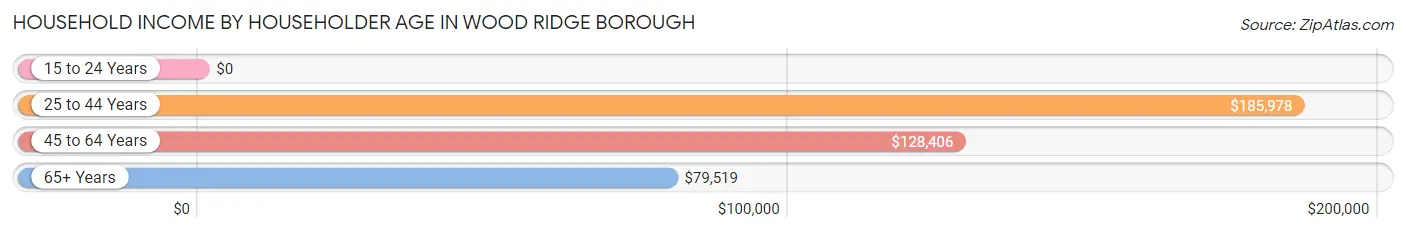
| Income Bracket | # Households | Median Income |
| 15 to 24 Years | 33 (0.9%) | $0 |
| 25 to 44 Years | 1,522 (39.5%) | $185,978 |
| 45 to 64 Years | 1,515 (39.3%) | $128,406 |
| 65+ Years | 781 (20.3%) | $79,519 |
| Total | 3,851 (100.0%) | $132,901 |
Poverty in Wood Ridge borough
Income Below Poverty by Sex and Age in Wood Ridge borough
With 5.5% poverty level for males and 5.3% for females among the residents of Wood Ridge borough, 75 year old and over males and under 5 year old females are the most vulnerable to poverty, with 29 males (20.1%) and 38 females (19.9%) in their respective age groups living below the poverty level.
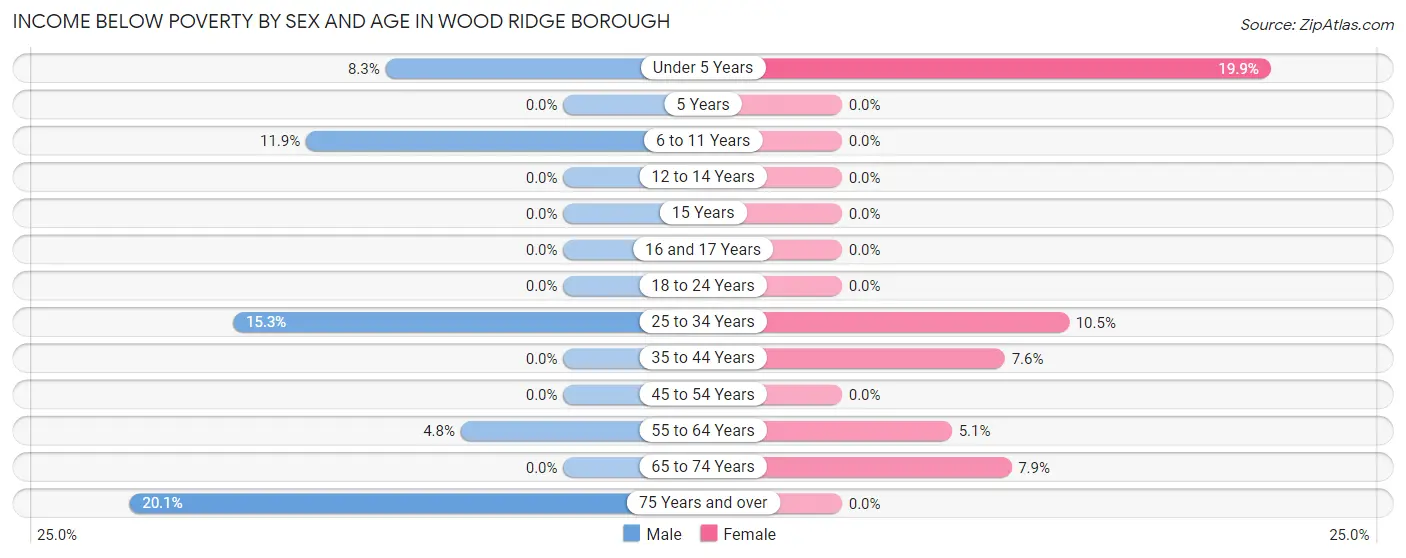
| Age Bracket | Male | Female |
| Under 5 Years | 42 (8.3%) | 38 (19.9%) |
| 5 Years | 0 (0.0%) | 0 (0.0%) |
| 6 to 11 Years | 40 (11.9%) | 0 (0.0%) |
| 12 to 14 Years | 0 (0.0%) | 0 (0.0%) |
| 15 Years | 0 (0.0%) | 0 (0.0%) |
| 16 and 17 Years | 0 (0.0%) | 0 (0.0%) |
| 18 to 24 Years | 0 (0.0%) | 0 (0.0%) |
| 25 to 34 Years | 126 (15.3%) | 90 (10.5%) |
| 35 to 44 Years | 0 (0.0%) | 52 (7.6%) |
| 45 to 54 Years | 0 (0.0%) | 0 (0.0%) |
| 55 to 64 Years | 41 (4.8%) | 38 (5.1%) |
| 65 to 74 Years | 0 (0.0%) | 47 (7.9%) |
| 75 Years and over | 29 (20.1%) | 0 (0.0%) |
| Total | 278 (5.5%) | 265 (5.3%) |
Income Above Poverty by Sex and Age in Wood Ridge borough
According to the poverty statistics in Wood Ridge borough, males aged 5 years and females aged 6 to 11 years are the age groups that are most secure financially, with 100.0% of males and 100.0% of females in these age groups living above the poverty line.
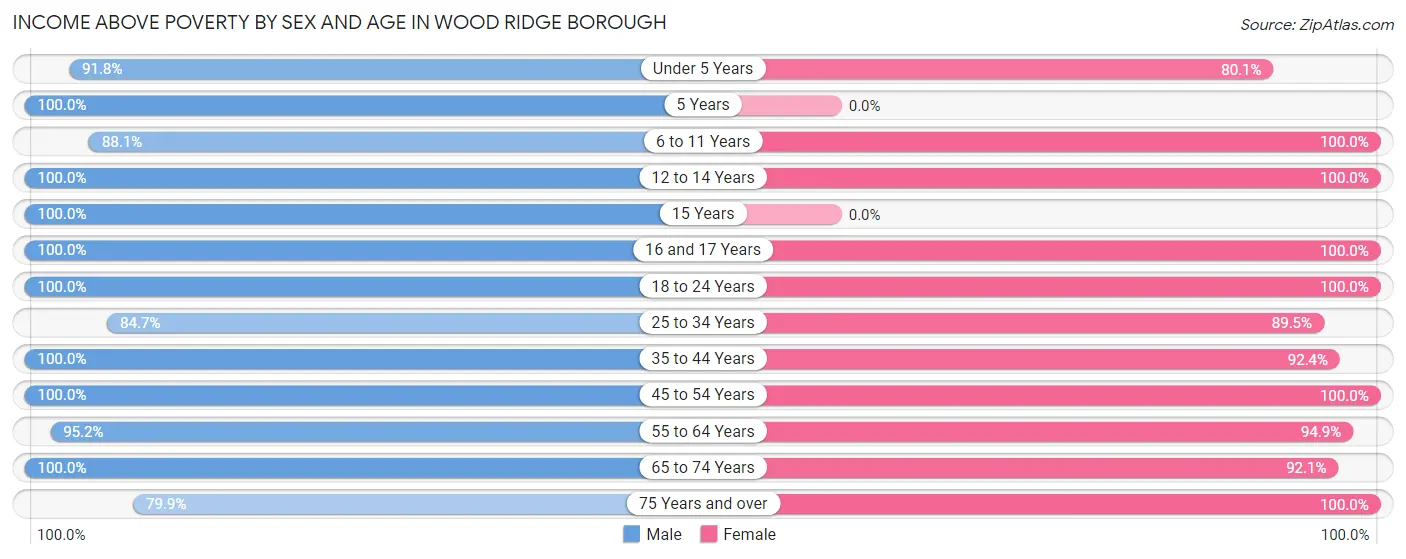
| Age Bracket | Male | Female |
| Under 5 Years | 467 (91.7%) | 153 (80.1%) |
| 5 Years | 81 (100.0%) | 0 (0.0%) |
| 6 to 11 Years | 295 (88.1%) | 274 (100.0%) |
| 12 to 14 Years | 60 (100.0%) | 72 (100.0%) |
| 15 Years | 80 (100.0%) | 0 (0.0%) |
| 16 and 17 Years | 94 (100.0%) | 71 (100.0%) |
| 18 to 24 Years | 261 (100.0%) | 699 (100.0%) |
| 25 to 34 Years | 696 (84.7%) | 765 (89.5%) |
| 35 to 44 Years | 728 (100.0%) | 636 (92.4%) |
| 45 to 54 Years | 645 (100.0%) | 574 (100.0%) |
| 55 to 64 Years | 821 (95.2%) | 707 (94.9%) |
| 65 to 74 Years | 399 (100.0%) | 551 (92.1%) |
| 75 Years and over | 115 (79.9%) | 190 (100.0%) |
| Total | 4,742 (94.5%) | 4,692 (94.7%) |
Income Below Poverty Among Married-Couple Families in Wood Ridge borough
The poverty statistics for married-couple families in Wood Ridge borough show that 1.7% or 38 of the total 2,300 families live below the poverty line. Families with no children have the highest poverty rate of 2.9%, comprising of 38 families. On the other hand, families with 1 or 2 children have the lowest poverty rate of 0.0%, which includes 0 families.
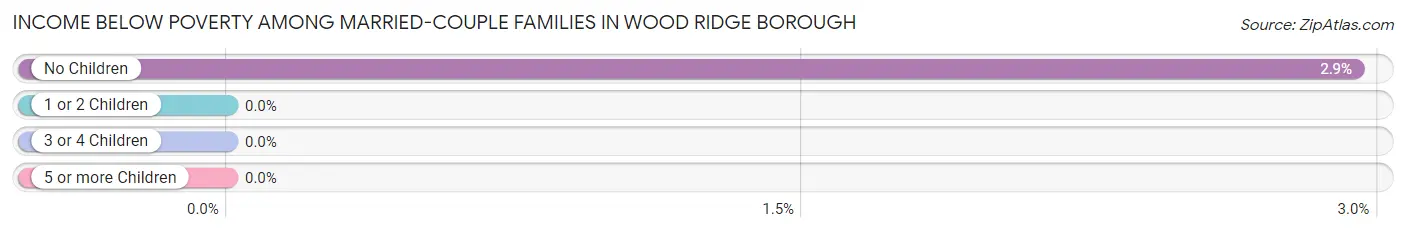
| Children | Above Poverty | Below Poverty |
| No Children | 1,253 (97.1%) | 38 (2.9%) |
| 1 or 2 Children | 984 (100.0%) | 0 (0.0%) |
| 3 or 4 Children | 25 (100.0%) | 0 (0.0%) |
| 5 or more Children | 0 (0.0%) | 0 (0.0%) |
| Total | 2,262 (98.4%) | 38 (1.7%) |
Income Below Poverty Among Single-Parent Households in Wood Ridge borough
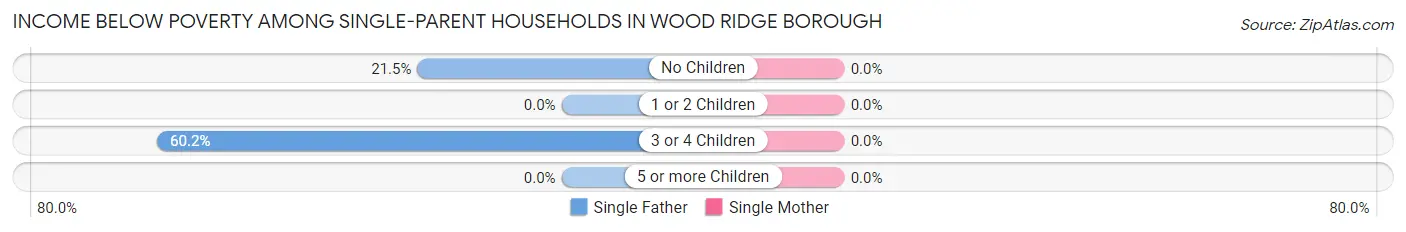
| Children | Single Father | Single Mother |
| No Children | 29 (21.5%) | 0 (0.0%) |
| 1 or 2 Children | 0 (0.0%) | 0 (0.0%) |
| 3 or 4 Children | 50 (60.2%) | 0 (0.0%) |
| 5 or more Children | 0 (0.0%) | 0 (0.0%) |
| Total | 79 (34.8%) | 0 (0.0%) |
Income Below Poverty Among Married-Couple vs Single-Parent Households in Wood Ridge borough
The poverty data for Wood Ridge borough shows that 38 of the married-couple family households (1.7%) and 79 of the single-parent households (17.8%) are living below the poverty level. Within the married-couple family households, those with no children have the highest poverty rate, with 38 households (2.9%) falling below the poverty line. Among the single-parent households, those with 3 or 4 children have the highest poverty rate, with 50 household (60.2%) living below poverty.
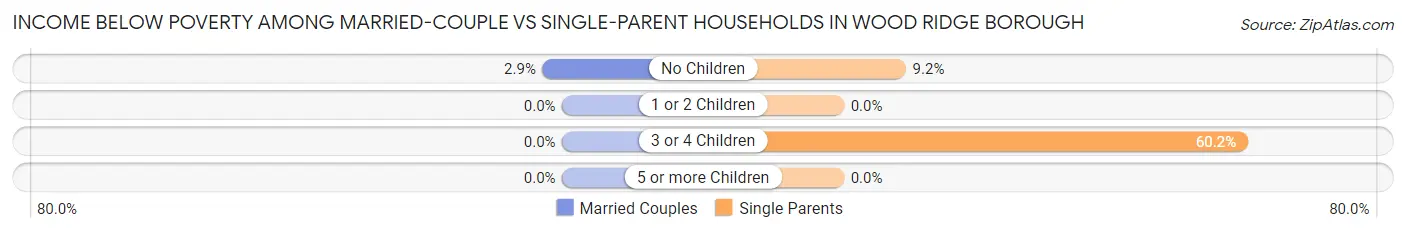
| Children | Married-Couple Families | Single-Parent Households |
| No Children | 38 (2.9%) | 29 (9.2%) |
| 1 or 2 Children | 0 (0.0%) | 0 (0.0%) |
| 3 or 4 Children | 0 (0.0%) | 50 (60.2%) |
| 5 or more Children | 0 (0.0%) | 0 (0.0%) |
| Total | 38 (1.7%) | 79 (17.8%) |
Race in Wood Ridge borough
The most populous races in Wood Ridge borough are White / Caucasian (6,818 | 68.3%), Asian (1,849 | 18.5%), and Hispanic or Latino (1,659 | 16.6%).
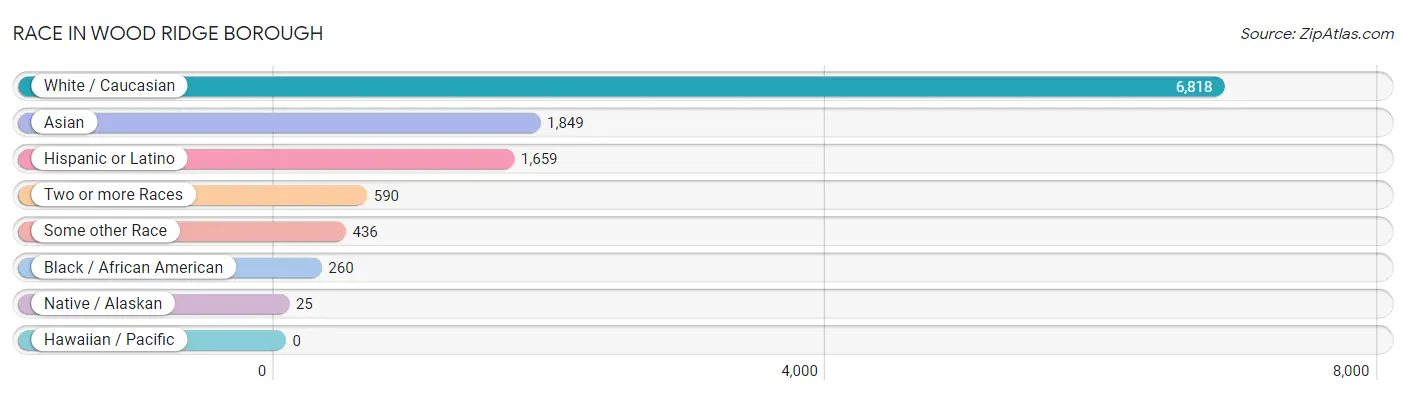
| Race | # Population | % Population |
| Asian | 1,849 | 18.5% |
| Black / African American | 260 | 2.6% |
| Hawaiian / Pacific | 0 | 0.0% |
| Hispanic or Latino | 1,659 | 16.6% |
| Native / Alaskan | 25 | 0.3% |
| White / Caucasian | 6,818 | 68.3% |
| Two or more Races | 590 | 5.9% |
| Some other Race | 436 | 4.4% |
| Total | 9,978 | 100.0% |
Ancestry in Wood Ridge borough
The most populous ancestries reported in Wood Ridge borough are Italian (2,603 | 26.1%), Irish (1,379 | 13.8%), German (1,149 | 11.5%), Burmese (954 | 9.6%), and Polish (752 | 7.5%), together accounting for 68.5% of all Wood Ridge borough residents.
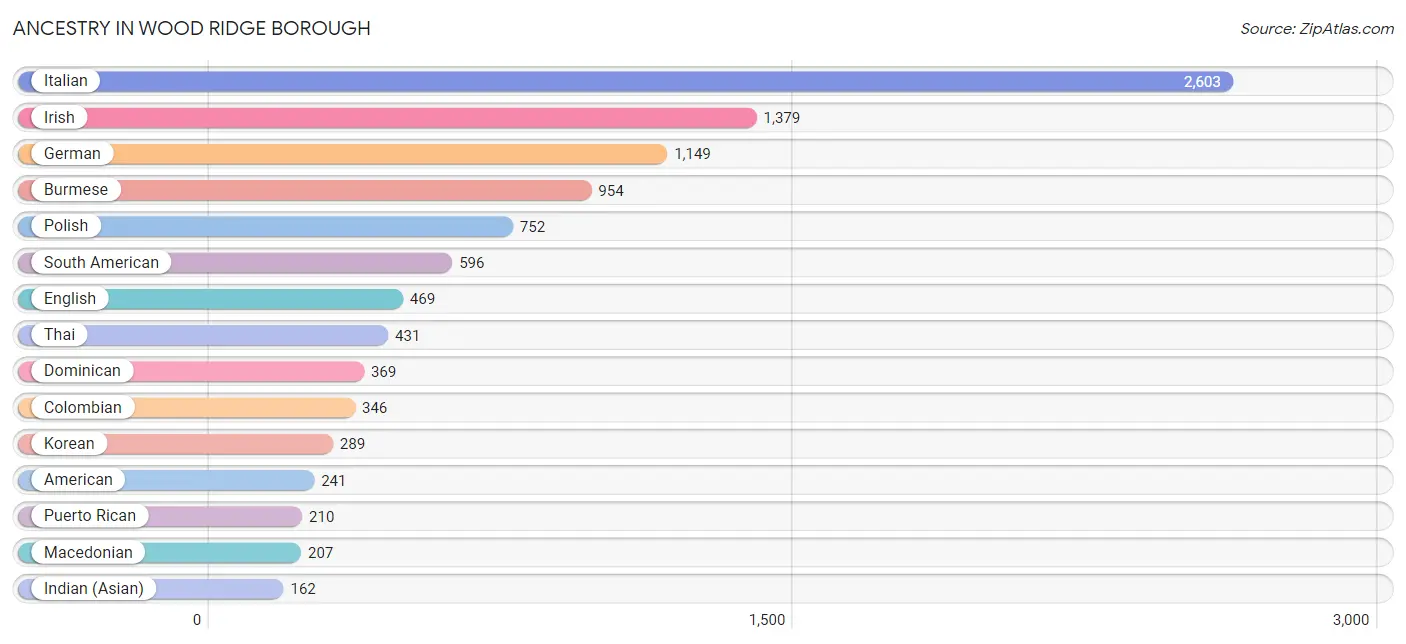
| Ancestry | # Population | % Population |
| Albanian | 142 | 1.4% |
| American | 241 | 2.4% |
| Arab | 36 | 0.4% |
| Argentinean | 90 | 0.9% |
| Armenian | 66 | 0.7% |
| Assyrian / Chaldean / Syriac | 16 | 0.2% |
| Austrian | 13 | 0.1% |
| Belizean | 103 | 1.0% |
| Bhutanese | 11 | 0.1% |
| British | 72 | 0.7% |
| Burmese | 954 | 9.6% |
| Chilean | 45 | 0.4% |
| Colombian | 346 | 3.5% |
| Croatian | 29 | 0.3% |
| Cuban | 155 | 1.5% |
| Czechoslovakian | 22 | 0.2% |
| Dominican | 369 | 3.7% |
| Dutch | 56 | 0.6% |
| Eastern European | 62 | 0.6% |
| Ecuadorian | 77 | 0.8% |
| English | 469 | 4.7% |
| European | 57 | 0.6% |
| French | 27 | 0.3% |
| French Canadian | 21 | 0.2% |
| German | 1,149 | 11.5% |
| Greek | 20 | 0.2% |
| Hungarian | 41 | 0.4% |
| Indian (Asian) | 162 | 1.6% |
| Iranian | 44 | 0.4% |
| Irish | 1,379 | 13.8% |
| Italian | 2,603 | 26.1% |
| Jamaican | 87 | 0.9% |
| Korean | 289 | 2.9% |
| Macedonian | 207 | 2.1% |
| Mexican | 10 | 0.1% |
| Norwegian | 9 | 0.1% |
| Peruvian | 38 | 0.4% |
| Polish | 752 | 7.5% |
| Puerto Rican | 210 | 2.1% |
| Romanian | 53 | 0.5% |
| Russian | 18 | 0.2% |
| Scotch-Irish | 33 | 0.3% |
| Scottish | 22 | 0.2% |
| Serbian | 95 | 0.9% |
| Slavic | 17 | 0.2% |
| South American | 596 | 6.0% |
| Spaniard | 15 | 0.2% |
| Sri Lankan | 83 | 0.8% |
| Swiss | 47 | 0.5% |
| Syrian | 15 | 0.2% |
| Thai | 431 | 4.3% |
| Tlingit-Haida | 87 | 0.9% |
| Trinidadian and Tobagonian | 53 | 0.5% |
| Ukrainian | 22 | 0.2% |
| Welsh | 122 | 1.2% | View All 55 Rows |
Immigrants in Wood Ridge borough
The most numerous immigrant groups reported in Wood Ridge borough came from Asia (1,243 | 12.5%), Latin America (670 | 6.7%), Eastern Asia (648 | 6.5%), Korea (575 | 5.8%), and Europe (566 | 5.7%), together accounting for 37.1% of all Wood Ridge borough residents.
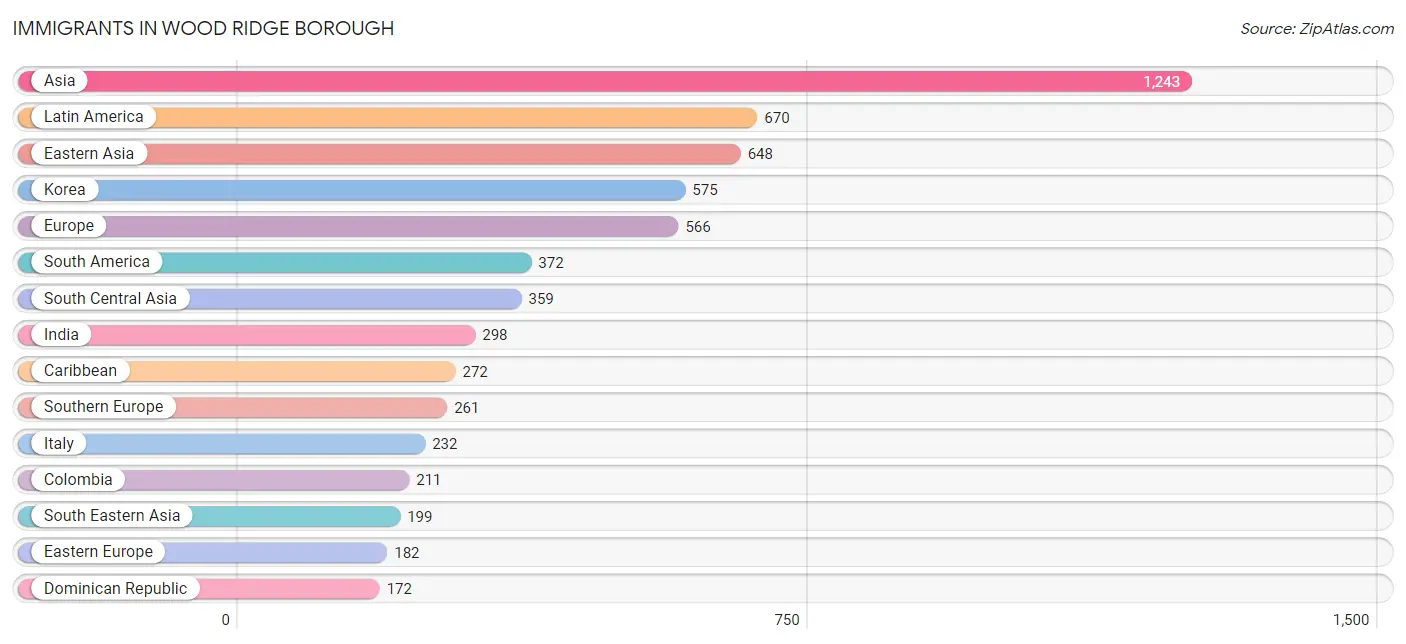
| Immigration Origin | # Population | % Population |
| Africa | 47 | 0.5% |
| Argentina | 42 | 0.4% |
| Asia | 1,243 | 12.5% |
| Belize | 26 | 0.3% |
| Caribbean | 272 | 2.7% |
| Central America | 26 | 0.3% |
| Chile | 29 | 0.3% |
| China | 73 | 0.7% |
| Colombia | 211 | 2.1% |
| Cuba | 80 | 0.8% |
| Dominican Republic | 172 | 1.7% |
| Eastern Asia | 648 | 6.5% |
| Eastern Europe | 182 | 1.8% |
| Ecuador | 42 | 0.4% |
| Europe | 566 | 5.7% |
| Germany | 11 | 0.1% |
| India | 298 | 3.0% |
| Iran | 44 | 0.4% |
| Ireland | 34 | 0.3% |
| Italy | 232 | 2.3% |
| Korea | 575 | 5.8% |
| Latin America | 670 | 6.7% |
| Nepal | 17 | 0.2% |
| Netherlands | 21 | 0.2% |
| Northern Europe | 91 | 0.9% |
| Peru | 38 | 0.4% |
| Philippines | 172 | 1.7% |
| Poland | 45 | 0.4% |
| Romania | 53 | 0.5% |
| South America | 372 | 3.7% |
| South Central Asia | 359 | 3.6% |
| South Eastern Asia | 199 | 2.0% |
| Southern Europe | 261 | 2.6% |
| Spain | 29 | 0.3% |
| Trinidad and Tobago | 20 | 0.2% |
| Vietnam | 27 | 0.3% |
| Western Africa | 47 | 0.5% |
| Western Asia | 16 | 0.2% |
| Western Europe | 32 | 0.3% | View All 39 Rows |
Sex and Age in Wood Ridge borough
Sex and Age in Wood Ridge borough
The most populous age groups in Wood Ridge borough are 30 to 34 Years (610 | 12.1%) for men and 30 to 34 Years (499 | 10.1%) for women.
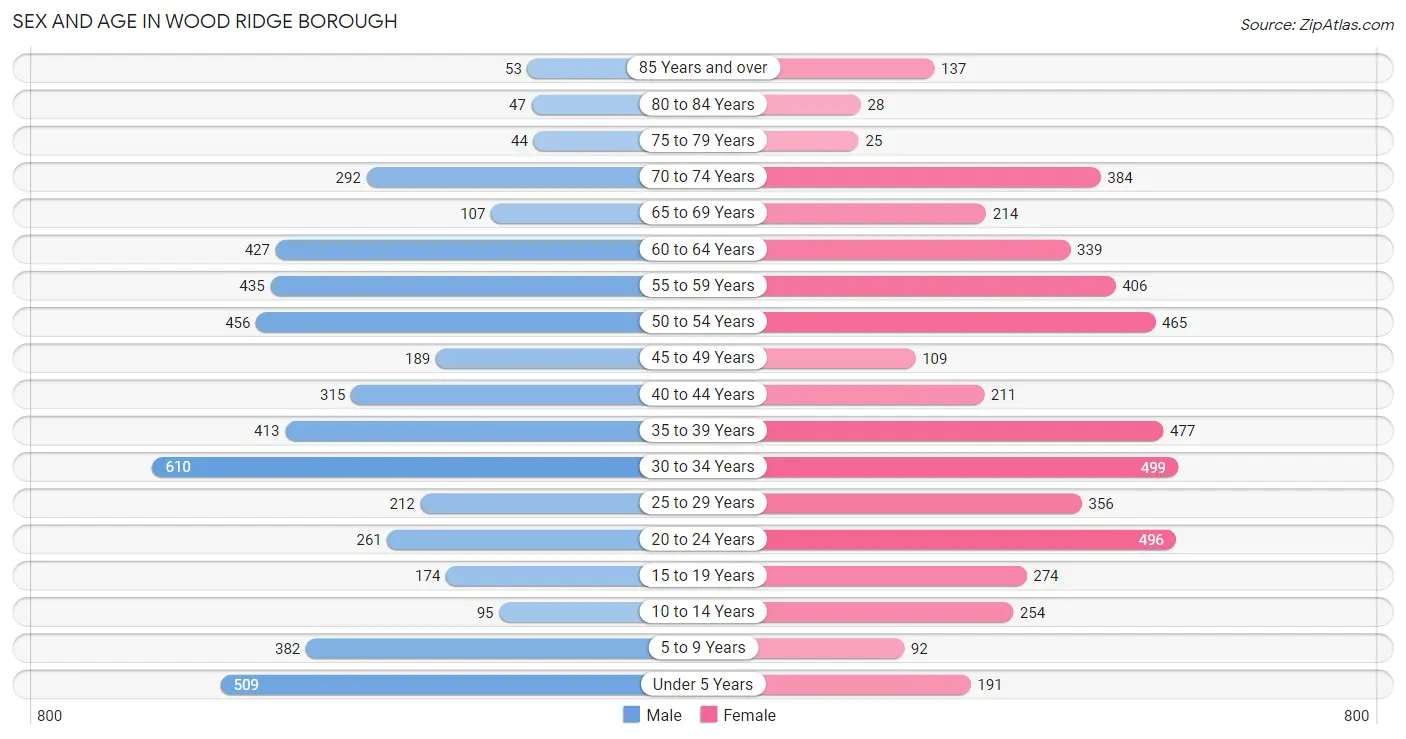
| Age Bracket | Male | Female |
| Under 5 Years | 509 (10.1%) | 191 (3.8%) |
| 5 to 9 Years | 382 (7.6%) | 92 (1.9%) |
| 10 to 14 Years | 95 (1.9%) | 254 (5.1%) |
| 15 to 19 Years | 174 (3.5%) | 274 (5.5%) |
| 20 to 24 Years | 261 (5.2%) | 496 (10.0%) |
| 25 to 29 Years | 212 (4.2%) | 356 (7.2%) |
| 30 to 34 Years | 610 (12.1%) | 499 (10.1%) |
| 35 to 39 Years | 413 (8.2%) | 477 (9.6%) |
| 40 to 44 Years | 315 (6.3%) | 211 (4.3%) |
| 45 to 49 Years | 189 (3.8%) | 109 (2.2%) |
| 50 to 54 Years | 456 (9.1%) | 465 (9.4%) |
| 55 to 59 Years | 435 (8.7%) | 406 (8.2%) |
| 60 to 64 Years | 427 (8.5%) | 339 (6.8%) |
| 65 to 69 Years | 107 (2.1%) | 214 (4.3%) |
| 70 to 74 Years | 292 (5.8%) | 384 (7.7%) |
| 75 to 79 Years | 44 (0.9%) | 25 (0.5%) |
| 80 to 84 Years | 47 (0.9%) | 28 (0.6%) |
| 85 Years and over | 53 (1.1%) | 137 (2.8%) |
| Total | 5,021 (100.0%) | 4,957 (100.0%) |
Families and Households in Wood Ridge borough
Median Family Size in Wood Ridge borough
The median family size in Wood Ridge borough is 3.11 persons per family, with married-couple families (2,300 | 83.9%) accounting for the largest median family size of 3.23 persons per family. On the other hand, single female/mother families (216 | 7.9%) represent the smallest median family size with 2.38 persons per family.
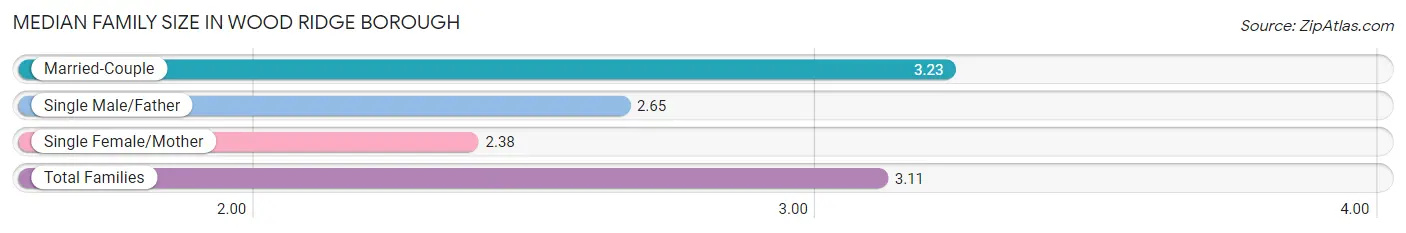
| Family Type | # Families | Family Size |
| Married-Couple | 2,300 (83.9%) | 3.23 |
| Single Male/Father | 227 (8.3%) | 2.65 |
| Single Female/Mother | 216 (7.9%) | 2.38 |
| Total Families | 2,743 (100.0%) | 3.11 |
Median Household Size in Wood Ridge borough
The median household size in Wood Ridge borough is 2.59 persons per household, with married-couple households (2,300 | 59.7%) accounting for the largest median household size of 3.24 persons per household. non-family households (1,108 | 28.8%) represent the smallest median household size with 1.20 persons per household.
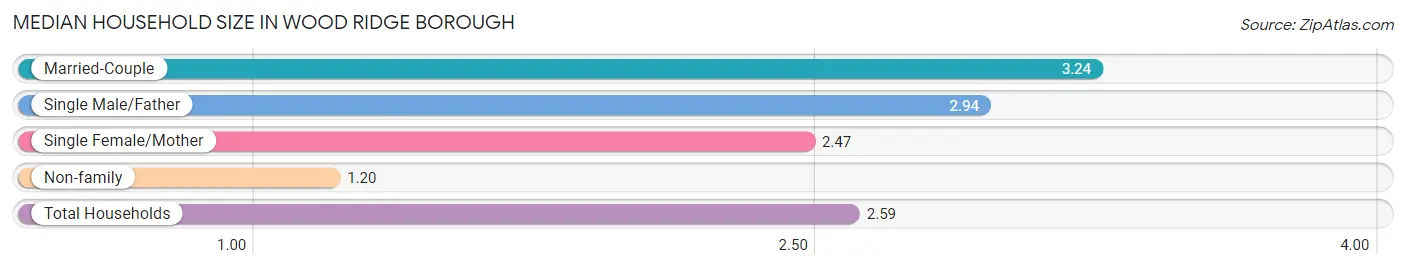
| Household Type | # Households | Household Size |
| Married-Couple | 2,300 (59.7%) | 3.24 |
| Single Male/Father | 227 (5.9%) | 2.94 |
| Single Female/Mother | 216 (5.6%) | 2.47 |
| Non-family | 1,108 (28.8%) | 1.20 |
| Total Households | 3,851 (100.0%) | 2.59 |
Household Size by Marriage Status in Wood Ridge borough
Out of a total of 3,851 households in Wood Ridge borough, 2,743 (71.2%) are family households, while 1,108 (28.8%) are nonfamily households. The most numerous type of family households are 2-person households, comprising 1,140, and the most common type of nonfamily households are 1-person households, comprising 927.
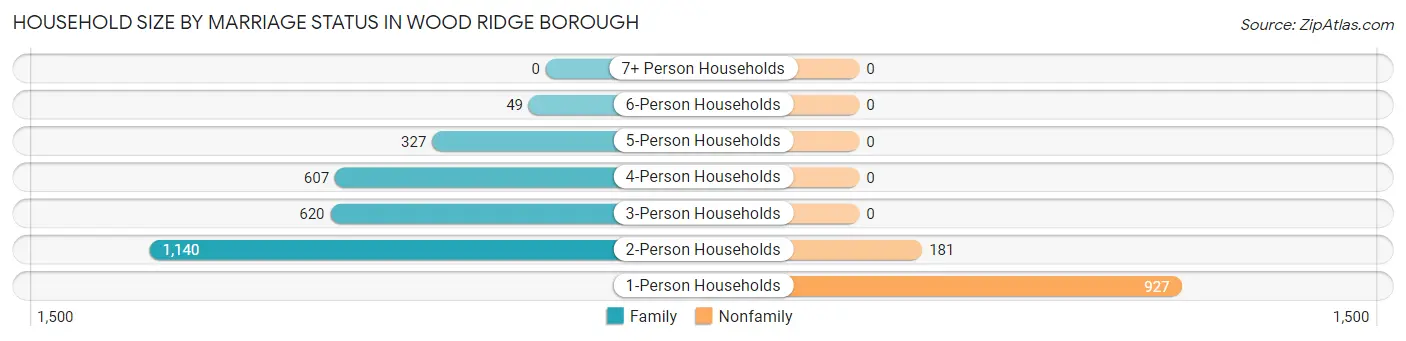
| Household Size | Family Households | Nonfamily Households |
| 1-Person Households | - | 927 (24.1%) |
| 2-Person Households | 1,140 (29.6%) | 181 (4.7%) |
| 3-Person Households | 620 (16.1%) | 0 (0.0%) |
| 4-Person Households | 607 (15.8%) | 0 (0.0%) |
| 5-Person Households | 327 (8.5%) | 0 (0.0%) |
| 6-Person Households | 49 (1.3%) | 0 (0.0%) |
| 7+ Person Households | 0 (0.0%) | 0 (0.0%) |
| Total | 2,743 (71.2%) | 1,108 (28.8%) |
Female Fertility in Wood Ridge borough
Fertility by Age in Wood Ridge borough
Average fertility rate in Wood Ridge borough is 38.0 births per 1,000 women. Women in the age bracket of 20 to 34 years have the highest fertility rate with 43.0 births per 1,000 women. Women in the age bracket of 20 to 34 years acount for 62.4% of all women with births.
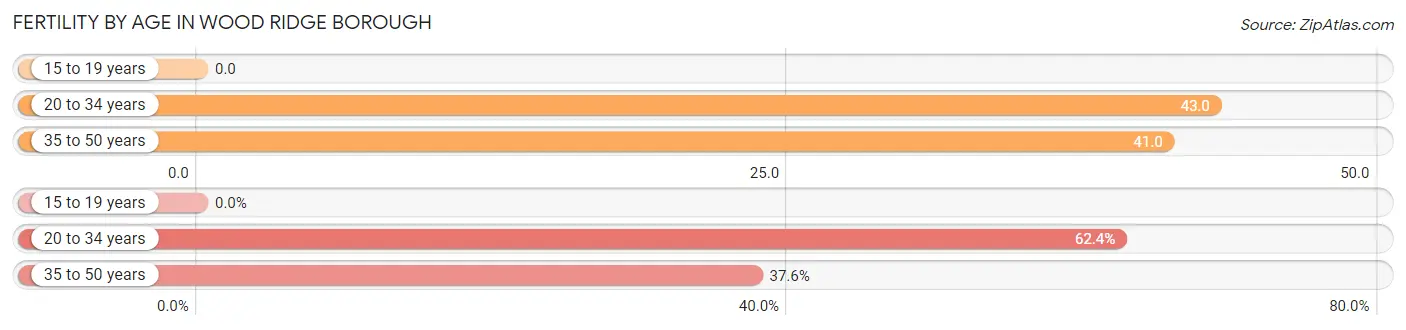
| Age Bracket | Women with Births | Births / 1,000 Women |
| 15 to 19 years | 0 (0.0%) | 0.0 |
| 20 to 34 years | 58 (62.4%) | 43.0 |
| 35 to 50 years | 35 (37.6%) | 41.0 |
| Total | 93 (100.0%) | 38.0 |
Fertility by Age by Marriage Status in Wood Ridge borough
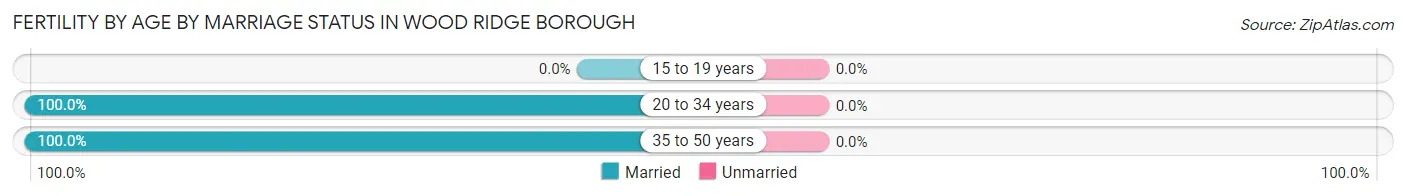
| Age Bracket | Married | Unmarried |
| 15 to 19 years | 0 (0.0%) | 0 (0.0%) |
| 20 to 34 years | 58 (100.0%) | 0 (0.0%) |
| 35 to 50 years | 35 (100.0%) | 0 (0.0%) |
| Total | 93 (100.0%) | 0 (0.0%) |
Fertility by Education in Wood Ridge borough
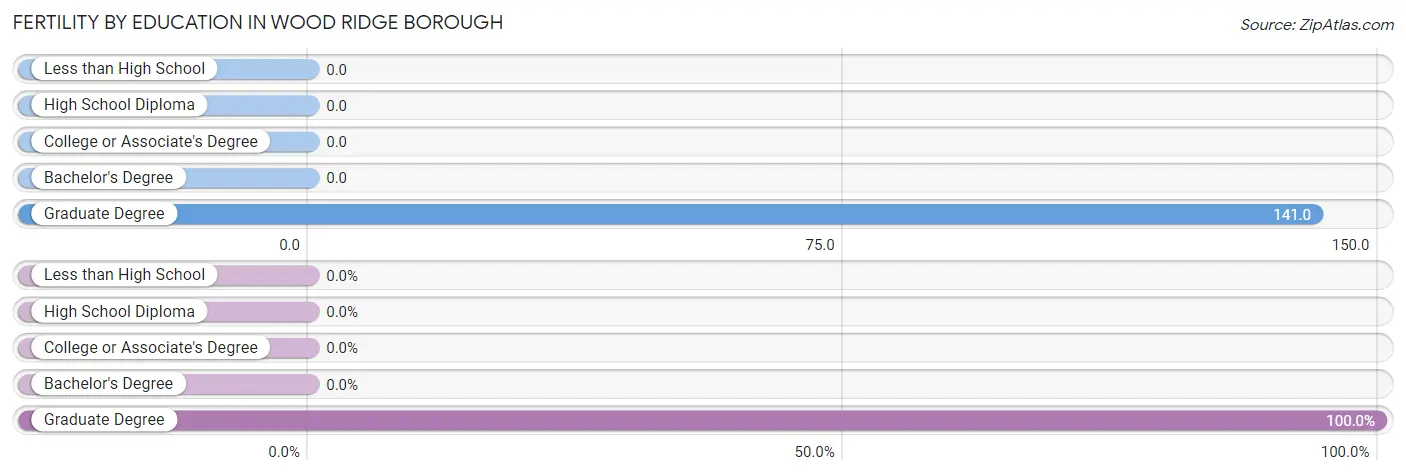
| Educational Attainment | Women with Births | Births / 1,000 Women |
| Less than High School | 0 (0.0%) | 0.0 |
| High School Diploma | 0 (0.0%) | 0.0 |
| College or Associate's Degree | 0 (0.0%) | 0.0 |
| Bachelor's Degree | 0 (0.0%) | 0.0 |
| Graduate Degree | 93 (100.0%) | 141.0 |
| Total | 93 (100.0%) | 38.0 |
Fertility by Education by Marriage Status in Wood Ridge borough
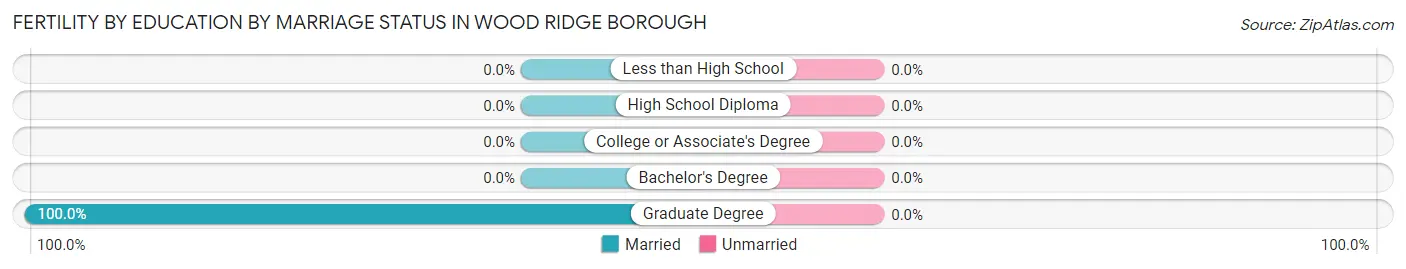
| Educational Attainment | Married | Unmarried |
| Less than High School | 0 (0.0%) | 0 (0.0%) |
| High School Diploma | 0 (0.0%) | 0 (0.0%) |
| College or Associate's Degree | 0 (0.0%) | 0 (0.0%) |
| Bachelor's Degree | 0 (0.0%) | 0 (0.0%) |
| Graduate Degree | 93 (100.0%) | 0 (0.0%) |
| Total | 93 (100.0%) | 0 (0.0%) |
Employment Characteristics in Wood Ridge borough
Employment by Class of Employer in Wood Ridge borough
Among the 5,951 employed individuals in Wood Ridge borough, private company employees (3,995 | 67.1%), local government employees (702 | 11.8%), and not-for-profit organizations (557 | 9.4%) make up the most common classes of employment.
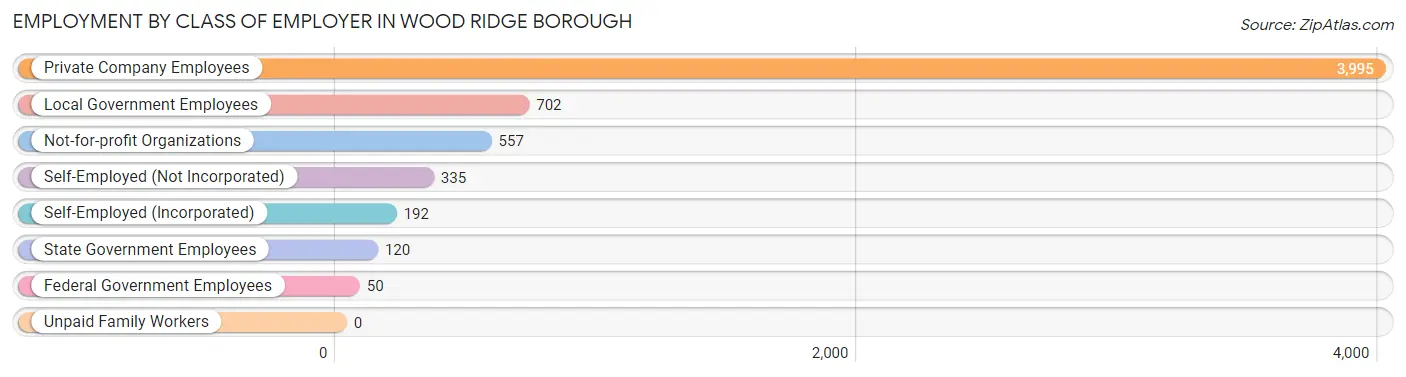
| Employer Class | # Employees | % Employees |
| Private Company Employees | 3,995 | 67.1% |
| Self-Employed (Incorporated) | 192 | 3.2% |
| Self-Employed (Not Incorporated) | 335 | 5.6% |
| Not-for-profit Organizations | 557 | 9.4% |
| Local Government Employees | 702 | 11.8% |
| State Government Employees | 120 | 2.0% |
| Federal Government Employees | 50 | 0.8% |
| Unpaid Family Workers | 0 | 0.0% |
| Total | 5,951 | 100.0% |
Employment Status by Age in Wood Ridge borough
According to the labor force statistics for Wood Ridge borough, out of the total population over 16 years of age (8,375), 74.5% or 6,239 individuals are in the labor force, with 4.2% or 262 of them unemployed. The age group with the highest labor force participation rate is 35 to 44 years, with 93.2% or 1,320 individuals in the labor force. Within the labor force, the 20 to 24 years age range has the highest percentage of unemployed individuals, with 11.8% or 81 of them being unemployed.
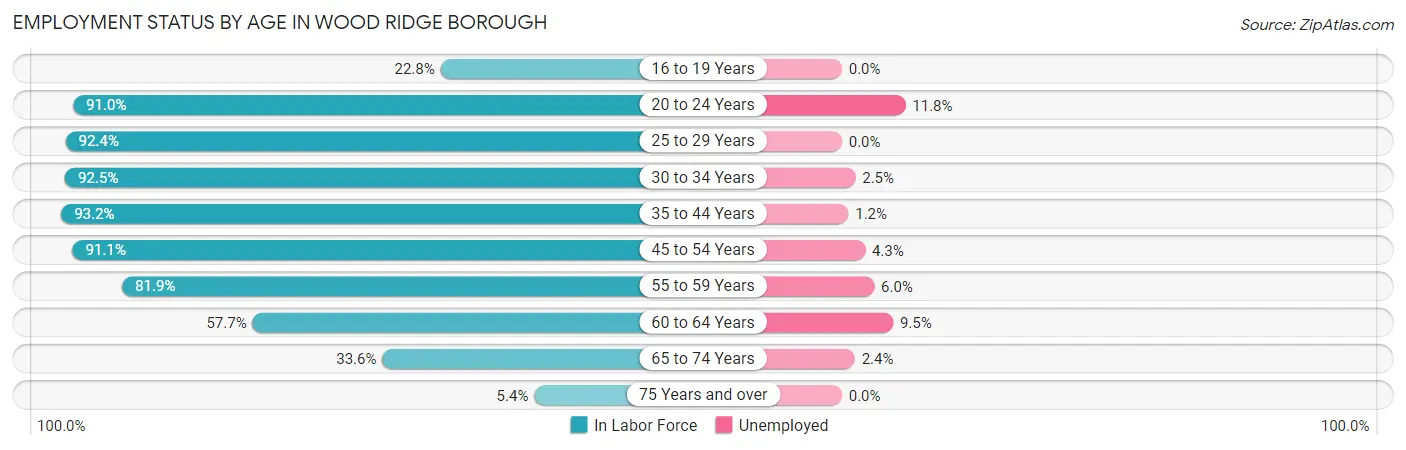
| Age Bracket | In Labor Force | Unemployed |
| 16 to 19 Years | 84 (22.8%) | 0 (0.0%) |
| 20 to 24 Years | 689 (91.0%) | 81 (11.8%) |
| 25 to 29 Years | 525 (92.4%) | 0 (0.0%) |
| 30 to 34 Years | 1,026 (92.5%) | 26 (2.5%) |
| 35 to 44 Years | 1,320 (93.2%) | 16 (1.2%) |
| 45 to 54 Years | 1,111 (91.1%) | 48 (4.3%) |
| 55 to 59 Years | 689 (81.9%) | 41 (6.0%) |
| 60 to 64 Years | 442 (57.7%) | 42 (9.5%) |
| 65 to 74 Years | 335 (33.6%) | 8 (2.4%) |
| 75 Years and over | 18 (5.4%) | 0 (0.0%) |
| Total | 6,239 (74.5%) | 262 (4.2%) |
Employment Status by Educational Attainment in Wood Ridge borough
According to labor force statistics for Wood Ridge borough, 86.4% of individuals (5,114) out of the total population between 25 and 64 years of age (5,919) are in the labor force, with 3.4% or 174 of them being unemployed. The group with the highest labor force participation rate are those with the educational attainment of bachelor's degree or higher, with 92.8% or 3,356 individuals in the labor force. Within the labor force, individuals with bachelor's degree or higher education have the highest percentage of unemployment, with 3.8% or 128 of them being unemployed.
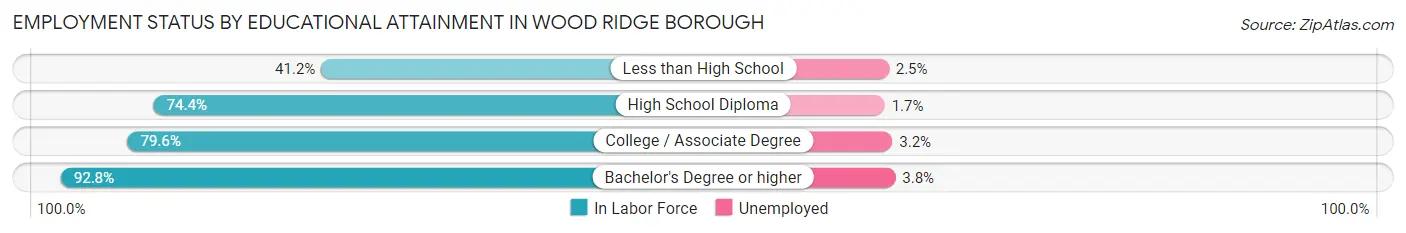
| Educational Attainment | In Labor Force | Unemployed |
| Less than High School | 40 (41.2%) | 2 (2.5%) |
| High School Diploma | 579 (74.4%) | 13 (1.7%) |
| College / Associate Degree | 1,137 (79.6%) | 46 (3.2%) |
| Bachelor's Degree or higher | 3,356 (92.8%) | 137 (3.8%) |
| Total | 5,114 (86.4%) | 201 (3.4%) |
Employment Occupations by Sex in Wood Ridge borough
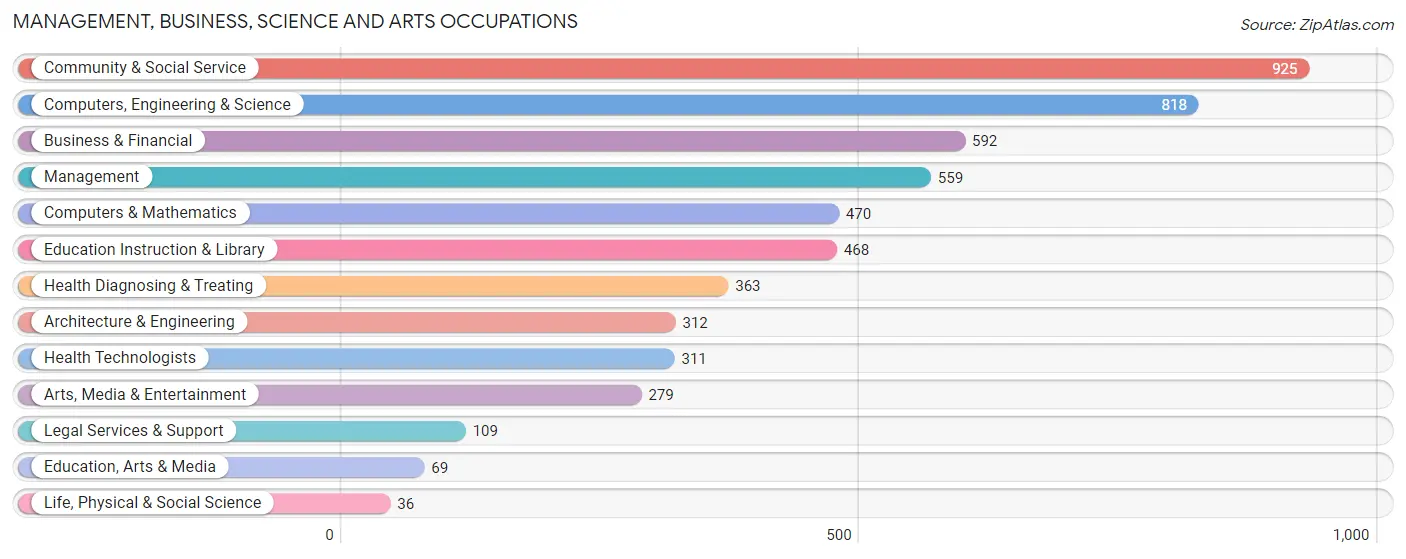
Management, Business, Science and Arts Occupations
The most common Management, Business, Science and Arts occupations in Wood Ridge borough are Community & Social Service (925 | 15.5%), Computers, Engineering & Science (818 | 13.7%), Business & Financial (592 | 9.9%), Management (559 | 9.3%), and Computers & Mathematics (470 | 7.9%).
Management, Business, Science and Arts Occupations by Sex
Within the Management, Business, Science and Arts occupations in Wood Ridge borough, the most male-oriented occupations are Arts, Media & Entertainment (94.6%), Computers & Mathematics (88.1%), and Computers, Engineering & Science (77.1%), while the most female-oriented occupations are Education Instruction & Library (86.5%), Health Diagnosing & Treating (82.4%), and Health Technologists (79.4%).
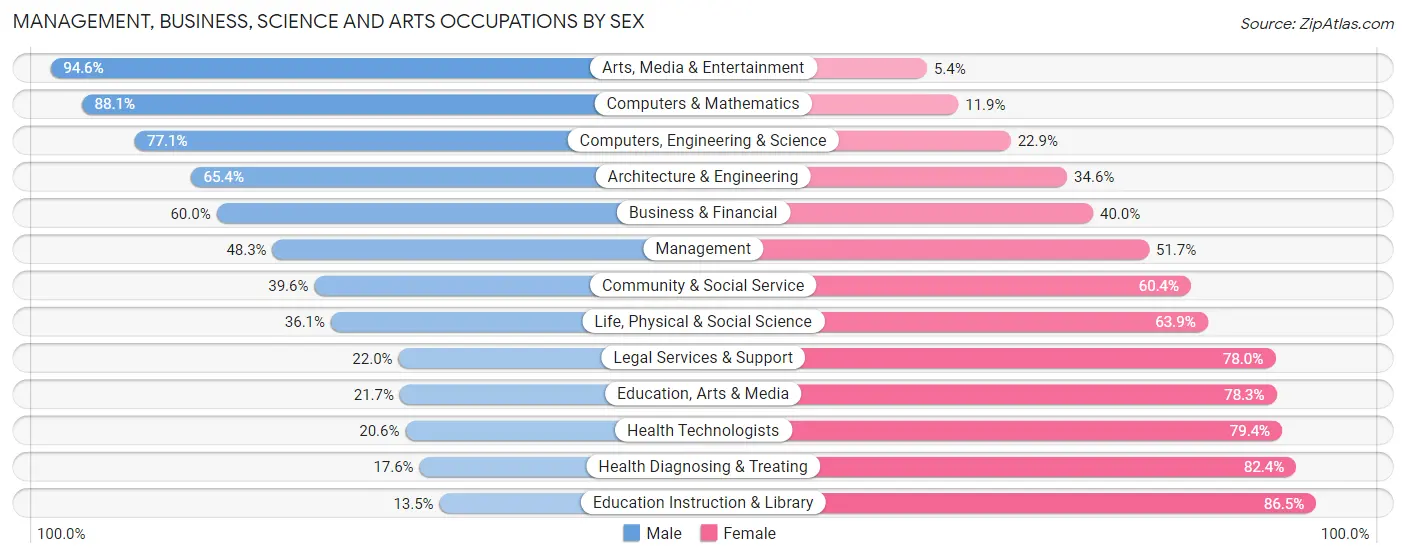
| Occupation | Male | Female |
| Management | 270 (48.3%) | 289 (51.7%) |
| Business & Financial | 355 (60.0%) | 237 (40.0%) |
| Computers, Engineering & Science | 631 (77.1%) | 187 (22.9%) |
| Computers & Mathematics | 414 (88.1%) | 56 (11.9%) |
| Architecture & Engineering | 204 (65.4%) | 108 (34.6%) |
| Life, Physical & Social Science | 13 (36.1%) | 23 (63.9%) |
| Community & Social Service | 366 (39.6%) | 559 (60.4%) |
| Education, Arts & Media | 15 (21.7%) | 54 (78.3%) |
| Legal Services & Support | 24 (22.0%) | 85 (78.0%) |
| Education Instruction & Library | 63 (13.5%) | 405 (86.5%) |
| Arts, Media & Entertainment | 264 (94.6%) | 15 (5.4%) |
| Health Diagnosing & Treating | 64 (17.6%) | 299 (82.4%) |
| Health Technologists | 64 (20.6%) | 247 (79.4%) |
| Total (Category) | 1,686 (51.8%) | 1,571 (48.2%) |
| Total (Overall) | 3,196 (53.5%) | 2,781 (46.5%) |
Services Occupations
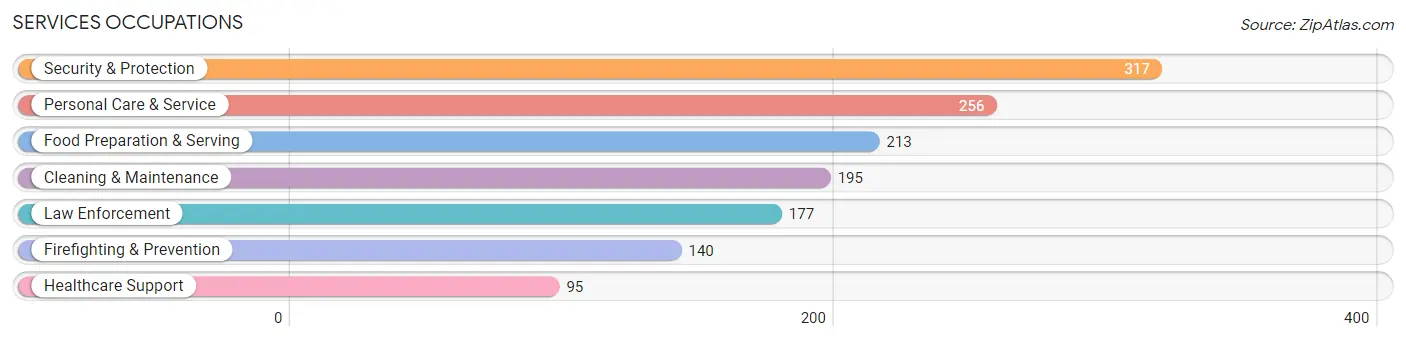
The most common Services occupations in Wood Ridge borough are Security & Protection (317 | 5.3%), Personal Care & Service (256 | 4.3%), Food Preparation & Serving (213 | 3.6%), Cleaning & Maintenance (195 | 3.3%), and Law Enforcement (177 | 3.0%).
Services Occupations by Sex
Within the Services occupations in Wood Ridge borough, the most male-oriented occupations are Law Enforcement (100.0%), Security & Protection (93.7%), and Firefighting & Prevention (85.7%), while the most female-oriented occupations are Healthcare Support (100.0%), Personal Care & Service (94.5%), and Food Preparation & Serving (66.7%).
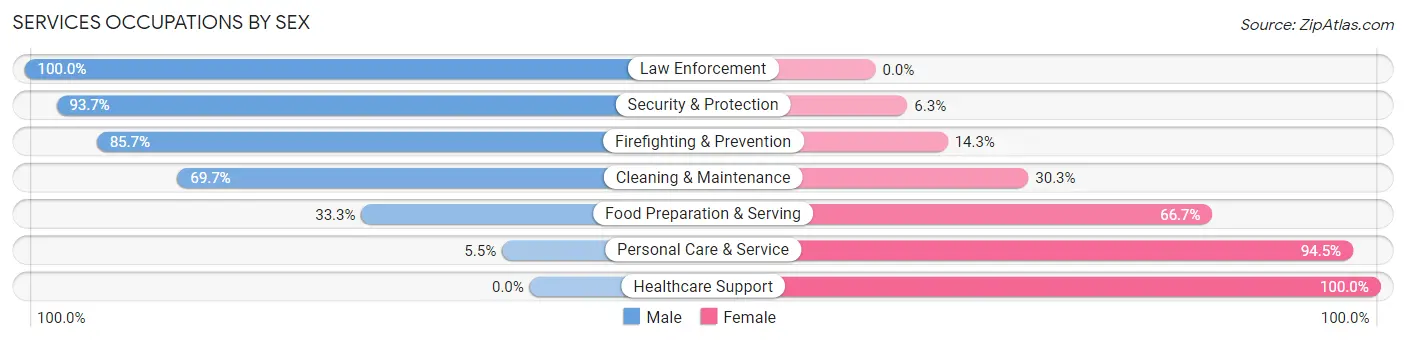
| Occupation | Male | Female |
| Healthcare Support | 0 (0.0%) | 95 (100.0%) |
| Security & Protection | 297 (93.7%) | 20 (6.3%) |
| Firefighting & Prevention | 120 (85.7%) | 20 (14.3%) |
| Law Enforcement | 177 (100.0%) | 0 (0.0%) |
| Food Preparation & Serving | 71 (33.3%) | 142 (66.7%) |
| Cleaning & Maintenance | 136 (69.7%) | 59 (30.3%) |
| Personal Care & Service | 14 (5.5%) | 242 (94.5%) |
| Total (Category) | 518 (48.1%) | 558 (51.9%) |
| Total (Overall) | 3,196 (53.5%) | 2,781 (46.5%) |
Sales and Office Occupations
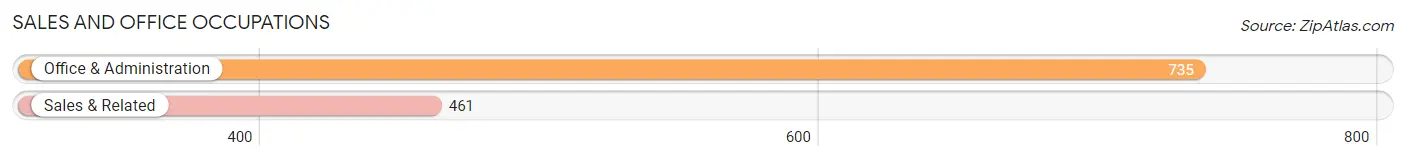
The most common Sales and Office occupations in Wood Ridge borough are Office & Administration (735 | 12.3%), and Sales & Related (461 | 7.7%).
Sales and Office Occupations by Sex

| Occupation | Male | Female |
| Sales & Related | 386 (83.7%) | 75 (16.3%) |
| Office & Administration | 235 (32.0%) | 500 (68.0%) |
| Total (Category) | 621 (51.9%) | 575 (48.1%) |
| Total (Overall) | 3,196 (53.5%) | 2,781 (46.5%) |
Natural Resources, Construction and Maintenance Occupations
The most common Natural Resources, Construction and Maintenance occupations in Wood Ridge borough are Installation, Maintenance & Repair (125 | 2.1%), and Construction & Extraction (42 | 0.7%).
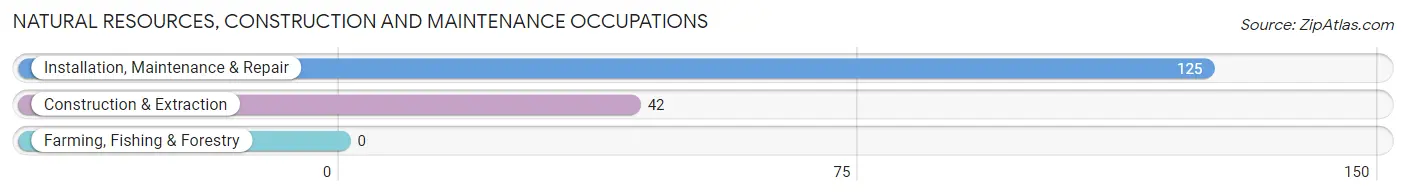
Natural Resources, Construction and Maintenance Occupations by Sex

| Occupation | Male | Female |
| Farming, Fishing & Forestry | 0 (0.0%) | 0 (0.0%) |
| Construction & Extraction | 42 (100.0%) | 0 (0.0%) |
| Installation, Maintenance & Repair | 125 (100.0%) | 0 (0.0%) |
| Total (Category) | 167 (100.0%) | 0 (0.0%) |
| Total (Overall) | 3,196 (53.5%) | 2,781 (46.5%) |
Production, Transportation and Moving Occupations
The most common Production, Transportation and Moving occupations in Wood Ridge borough are Production (148 | 2.5%), Transportation (98 | 1.6%), and Material Moving (35 | 0.6%).
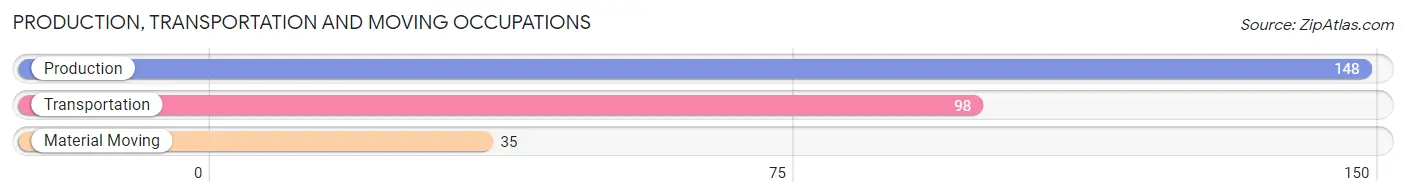
Production, Transportation and Moving Occupations by Sex
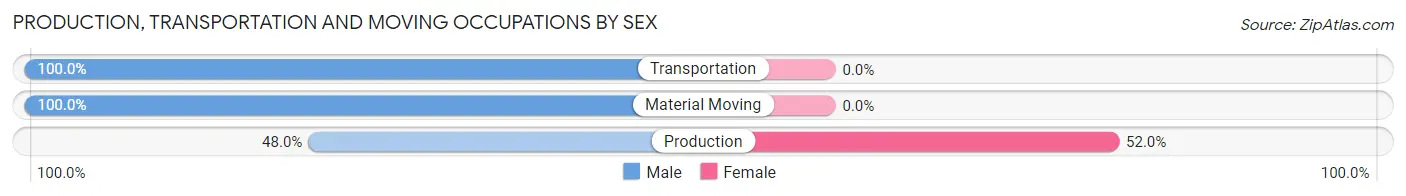
| Occupation | Male | Female |
| Production | 71 (48.0%) | 77 (52.0%) |
| Transportation | 98 (100.0%) | 0 (0.0%) |
| Material Moving | 35 (100.0%) | 0 (0.0%) |
| Total (Category) | 204 (72.6%) | 77 (27.4%) |
| Total (Overall) | 3,196 (53.5%) | 2,781 (46.5%) |
Employment Industries by Sex in Wood Ridge borough
Employment Industries in Wood Ridge borough
The major employment industries in Wood Ridge borough include Retail Trade (691 | 11.6%), Finance & Insurance (656 | 11.0%), Professional & Scientific (611 | 10.2%), Educational Services (591 | 9.9%), and Health Care & Social Assistance (529 | 8.8%).
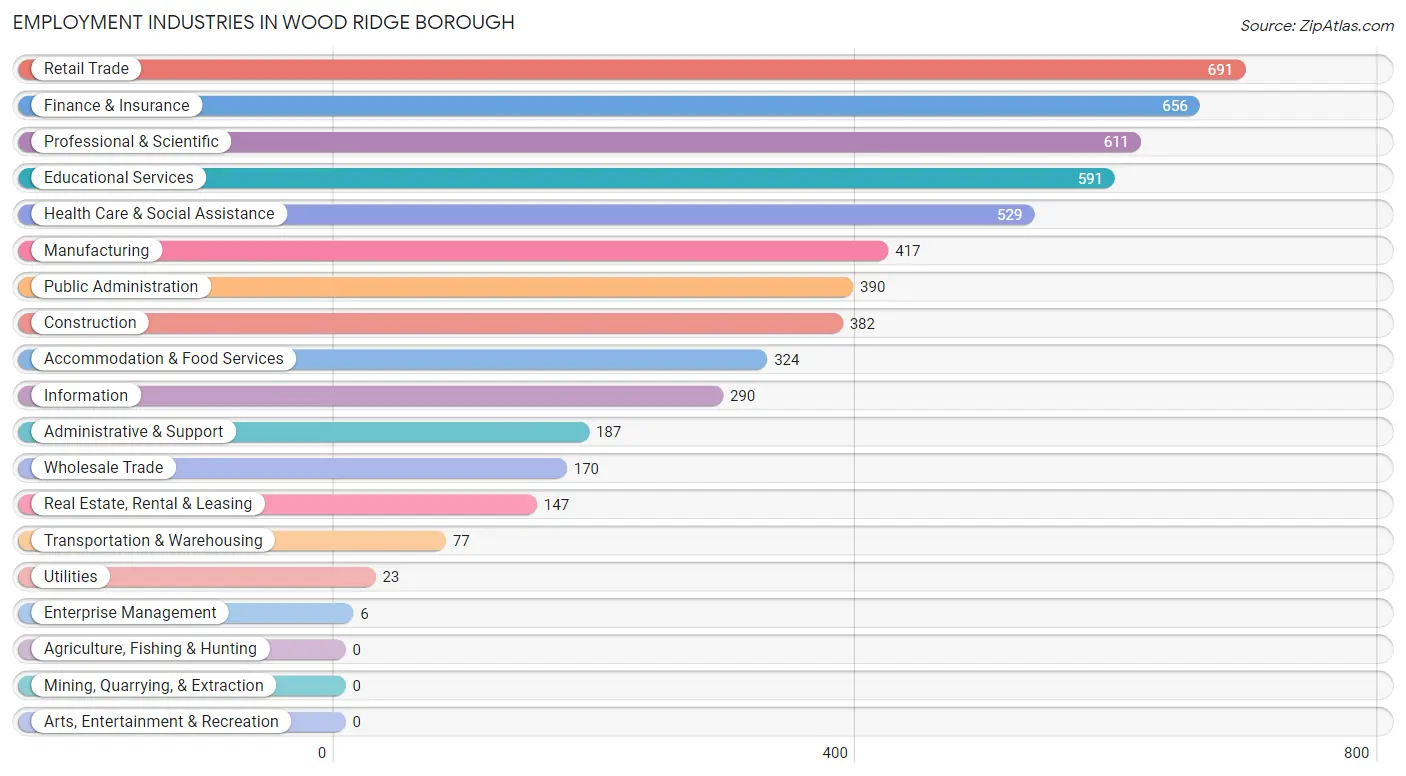
Employment Industries by Sex in Wood Ridge borough
The Wood Ridge borough industries that see more men than women are Utilities (100.0%), Enterprise Management (100.0%), and Construction (92.4%), whereas the industries that tend to have a higher number of women are Educational Services (90.4%), Real Estate, Rental & Leasing (83.0%), and Health Care & Social Assistance (78.6%).
| Industry | Male | Female |
| Agriculture, Fishing & Hunting | 0 (0.0%) | 0 (0.0%) |
| Mining, Quarrying, & Extraction | 0 (0.0%) | 0 (0.0%) |
| Construction | 353 (92.4%) | 29 (7.6%) |
| Manufacturing | 150 (36.0%) | 267 (64.0%) |
| Wholesale Trade | 112 (65.9%) | 58 (34.1%) |
| Retail Trade | 334 (48.3%) | 357 (51.7%) |
| Transportation & Warehousing | 61 (79.2%) | 16 (20.8%) |
| Utilities | 23 (100.0%) | 0 (0.0%) |
| Information | 189 (65.2%) | 101 (34.8%) |
| Finance & Insurance | 545 (83.1%) | 111 (16.9%) |
| Real Estate, Rental & Leasing | 25 (17.0%) | 122 (83.0%) |
| Professional & Scientific | 389 (63.7%) | 222 (36.3%) |
| Enterprise Management | 6 (100.0%) | 0 (0.0%) |
| Administrative & Support | 160 (85.6%) | 27 (14.4%) |
| Educational Services | 57 (9.6%) | 534 (90.4%) |
| Health Care & Social Assistance | 113 (21.4%) | 416 (78.6%) |
| Arts, Entertainment & Recreation | 0 (0.0%) | 0 (0.0%) |
| Accommodation & Food Services | 162 (50.0%) | 162 (50.0%) |
| Public Administration | 272 (69.7%) | 118 (30.3%) |
| Total | 3,196 (53.5%) | 2,781 (46.5%) |
Education in Wood Ridge borough
School Enrollment in Wood Ridge borough
The most common levels of schooling among the 2,210 students in Wood Ridge borough are college / undergraduate (873 | 39.5%), elementary school (397 | 18.0%), and middle school (314 | 14.2%).
| School Level | # Students | % Students |
| Nursery / Preschool | 200 | 9.0% |
| Kindergarten | 86 | 3.9% |
| Elementary School | 397 | 18.0% |
| Middle School | 314 | 14.2% |
| High School | 251 | 11.4% |
| College / Undergraduate | 873 | 39.5% |
| Graduate / Professional | 89 | 4.0% |
| Total | 2,210 | 100.0% |
School Enrollment by Age by Funding Source in Wood Ridge borough
Out of a total of 2,210 students who are enrolled in schools in Wood Ridge borough, 743 (33.6%) attend a private institution, while the remaining 1,467 (66.4%) are enrolled in public schools. The age group of 20 to 24 year olds has the highest likelihood of being enrolled in private schools, with 317 (69.1% in the age bracket) enrolled. Conversely, the age group of 10 to 14 year olds has the lowest likelihood of being enrolled in a private school, with 349 (100.0% in the age bracket) attending a public institution.
| Age Bracket | Public School | Private School |
| 3 to 4 Year Olds | 88 (46.8%) | 100 (53.2%) |
| 5 to 9 Year Old | 439 (94.2%) | 27 (5.8%) |
| 10 to 14 Year Olds | 349 (100.0%) | 0 (0.0%) |
| 15 to 17 Year Olds | 186 (75.9%) | 59 (24.1%) |
| 18 to 19 Year Olds | 154 (75.9%) | 49 (24.1%) |
| 20 to 24 Year Olds | 142 (30.9%) | 317 (69.1%) |
| 25 to 34 Year Olds | 45 (45.5%) | 54 (54.5%) |
| 35 Years and over | 64 (31.8%) | 137 (68.2%) |
| Total | 1,467 (66.4%) | 743 (33.6%) |
Educational Attainment by Field of Study in Wood Ridge borough
Business (813 | 19.0%), education (467 | 10.9%), science & technology (441 | 10.3%), bio, nature & agricultural (422 | 9.9%), and engineering (364 | 8.5%) are the most common fields of study among 4,286 individuals in Wood Ridge borough who have obtained a bachelor's degree or higher.
| Field of Study | # Graduates | % Graduates |
| Computers & Mathematics | 348 | 8.1% |
| Bio, Nature & Agricultural | 422 | 9.9% |
| Physical & Health Sciences | 91 | 2.1% |
| Psychology | 322 | 7.5% |
| Social Sciences | 110 | 2.6% |
| Engineering | 364 | 8.5% |
| Multidisciplinary Studies | 51 | 1.2% |
| Science & Technology | 441 | 10.3% |
| Business | 813 | 19.0% |
| Education | 467 | 10.9% |
| Literature & Languages | 140 | 3.3% |
| Liberal Arts & History | 190 | 4.4% |
| Visual & Performing Arts | 283 | 6.6% |
| Communications | 108 | 2.5% |
| Arts & Humanities | 136 | 3.2% |
| Total | 4,286 | 100.0% |
Transportation & Commute in Wood Ridge borough
Vehicle Availability by Sex in Wood Ridge borough
The most prevalent vehicle ownership categories in Wood Ridge borough are males with 2 vehicles (1,375, accounting for 43.0%) and females with 2 vehicles (1,372, making up 49.9%).
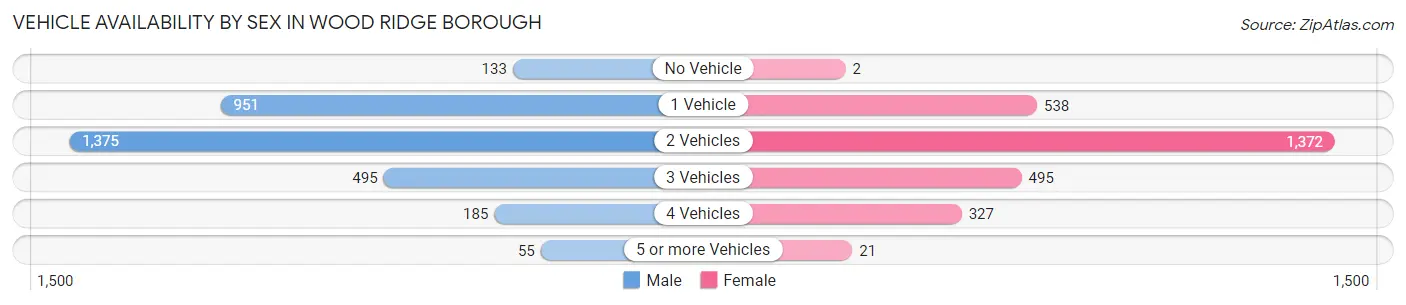
| Vehicles Available | Male | Female |
| No Vehicle | 133 (4.2%) | 2 (0.1%) |
| 1 Vehicle | 951 (29.8%) | 538 (19.5%) |
| 2 Vehicles | 1,375 (43.0%) | 1,372 (49.8%) |
| 3 Vehicles | 495 (15.5%) | 495 (18.0%) |
| 4 Vehicles | 185 (5.8%) | 327 (11.9%) |
| 5 or more Vehicles | 55 (1.7%) | 21 (0.8%) |
| Total | 3,194 (100.0%) | 2,755 (100.0%) |
Commute Time in Wood Ridge borough
The most frequently occuring commute durations in Wood Ridge borough are 20 to 24 minutes (905 commuters, 17.3%), 30 to 34 minutes (770 commuters, 14.7%), and 45 to 59 minutes (770 commuters, 14.7%).
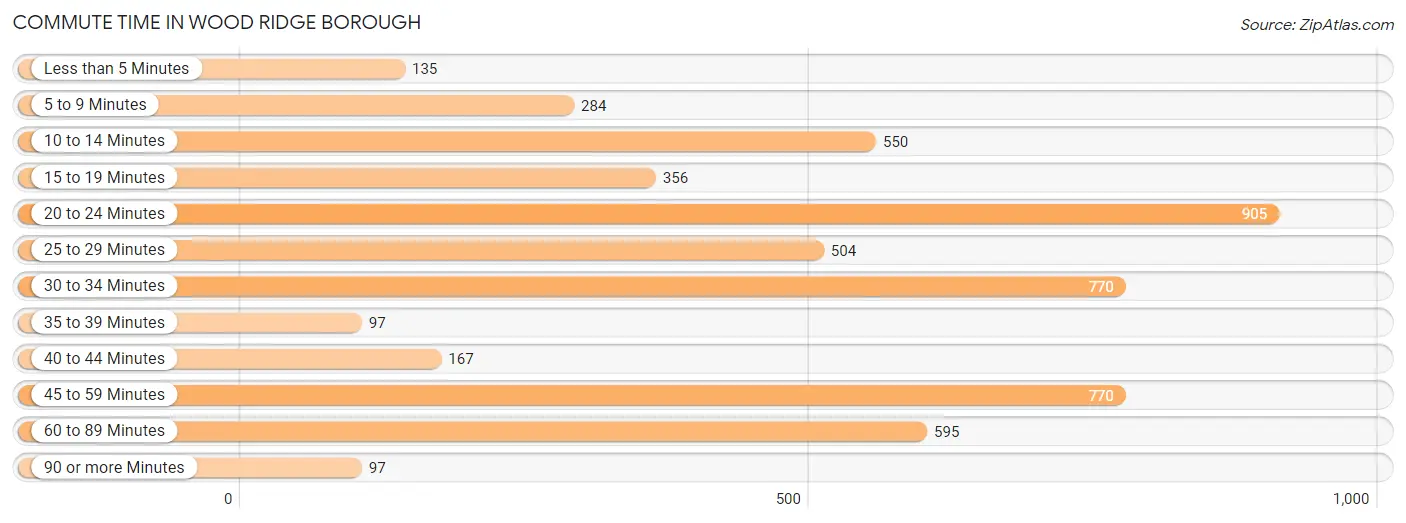
| Commute Time | # Commuters | % Commuters |
| Less than 5 Minutes | 135 | 2.6% |
| 5 to 9 Minutes | 284 | 5.4% |
| 10 to 14 Minutes | 550 | 10.5% |
| 15 to 19 Minutes | 356 | 6.8% |
| 20 to 24 Minutes | 905 | 17.3% |
| 25 to 29 Minutes | 504 | 9.6% |
| 30 to 34 Minutes | 770 | 14.7% |
| 35 to 39 Minutes | 97 | 1.8% |
| 40 to 44 Minutes | 167 | 3.2% |
| 45 to 59 Minutes | 770 | 14.7% |
| 60 to 89 Minutes | 595 | 11.4% |
| 90 or more Minutes | 97 | 1.8% |
Commute Time by Sex in Wood Ridge borough
The most common commute times in Wood Ridge borough are 45 to 59 minutes (542 commuters, 19.2%) for males and 20 to 24 minutes (580 commuters, 24.1%) for females.
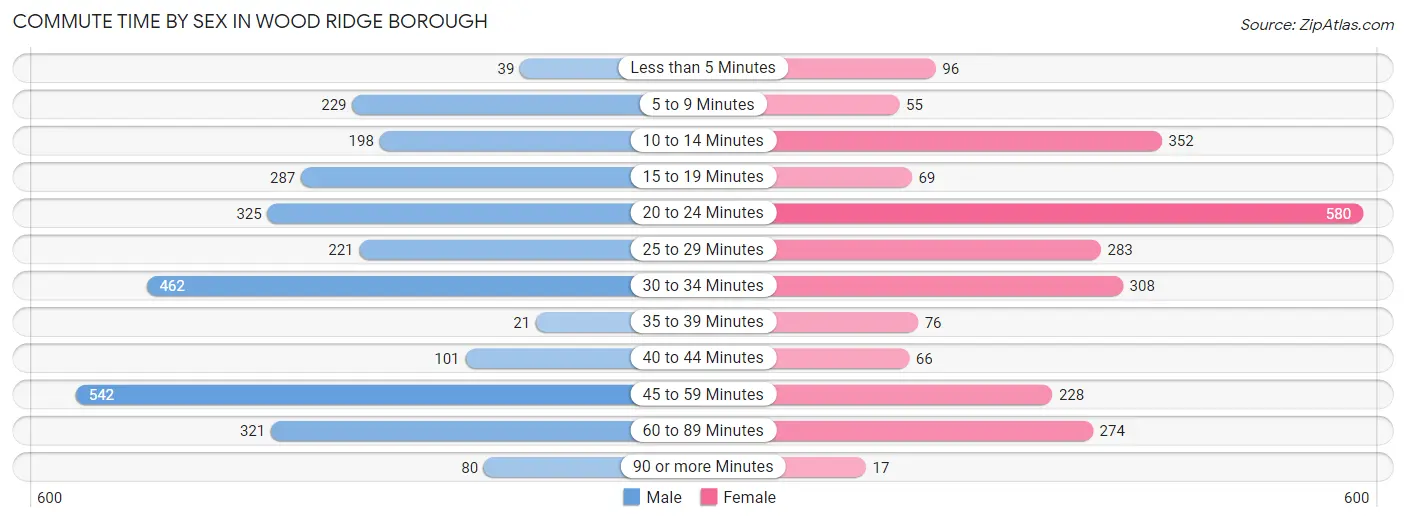
| Commute Time | Male | Female |
| Less than 5 Minutes | 39 (1.4%) | 96 (4.0%) |
| 5 to 9 Minutes | 229 (8.1%) | 55 (2.3%) |
| 10 to 14 Minutes | 198 (7.0%) | 352 (14.6%) |
| 15 to 19 Minutes | 287 (10.2%) | 69 (2.9%) |
| 20 to 24 Minutes | 325 (11.5%) | 580 (24.1%) |
| 25 to 29 Minutes | 221 (7.8%) | 283 (11.8%) |
| 30 to 34 Minutes | 462 (16.4%) | 308 (12.8%) |
| 35 to 39 Minutes | 21 (0.7%) | 76 (3.2%) |
| 40 to 44 Minutes | 101 (3.6%) | 66 (2.8%) |
| 45 to 59 Minutes | 542 (19.2%) | 228 (9.5%) |
| 60 to 89 Minutes | 321 (11.4%) | 274 (11.4%) |
| 90 or more Minutes | 80 (2.8%) | 17 (0.7%) |
Time of Departure to Work by Sex in Wood Ridge borough
The most frequent times of departure to work in Wood Ridge borough are 8:00 AM to 8:29 AM (674, 23.8%) for males and 7:00 AM to 7:29 AM (653, 27.2%) for females.
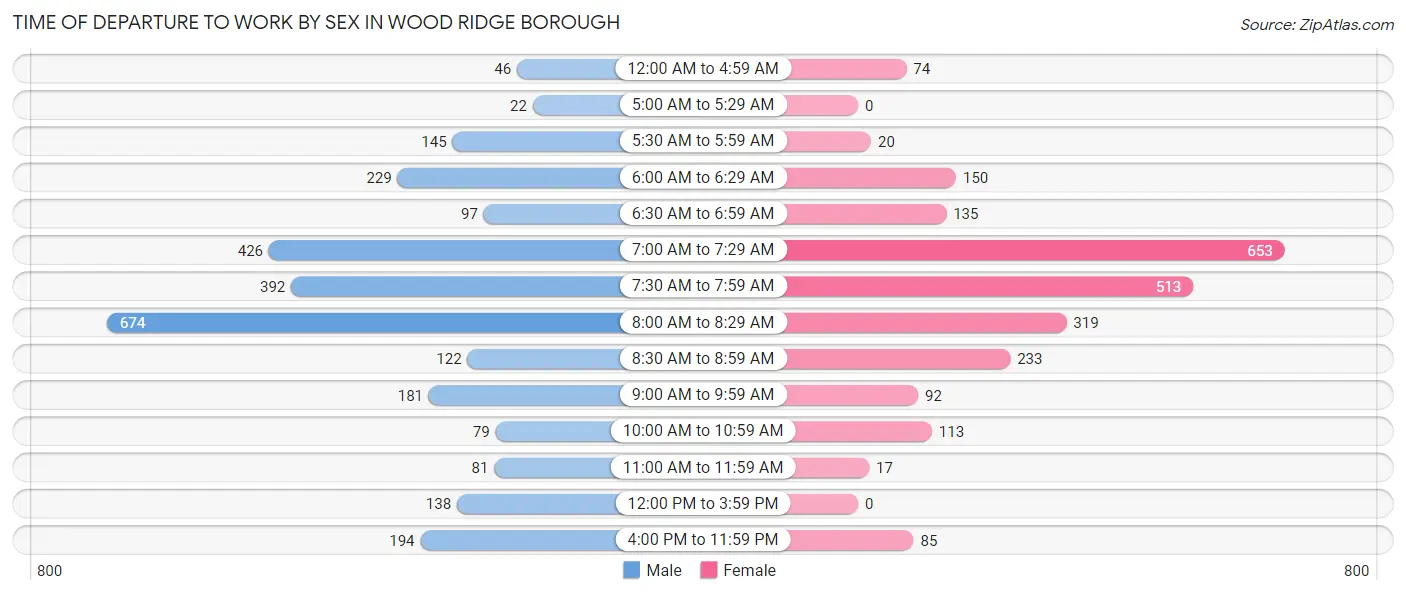
| Time of Departure | Male | Female |
| 12:00 AM to 4:59 AM | 46 (1.6%) | 74 (3.1%) |
| 5:00 AM to 5:29 AM | 22 (0.8%) | 0 (0.0%) |
| 5:30 AM to 5:59 AM | 145 (5.1%) | 20 (0.8%) |
| 6:00 AM to 6:29 AM | 229 (8.1%) | 150 (6.2%) |
| 6:30 AM to 6:59 AM | 97 (3.4%) | 135 (5.6%) |
| 7:00 AM to 7:29 AM | 426 (15.1%) | 653 (27.2%) |
| 7:30 AM to 7:59 AM | 392 (13.9%) | 513 (21.3%) |
| 8:00 AM to 8:29 AM | 674 (23.8%) | 319 (13.3%) |
| 8:30 AM to 8:59 AM | 122 (4.3%) | 233 (9.7%) |
| 9:00 AM to 9:59 AM | 181 (6.4%) | 92 (3.8%) |
| 10:00 AM to 10:59 AM | 79 (2.8%) | 113 (4.7%) |
| 11:00 AM to 11:59 AM | 81 (2.9%) | 17 (0.7%) |
| 12:00 PM to 3:59 PM | 138 (4.9%) | 0 (0.0%) |
| 4:00 PM to 11:59 PM | 194 (6.9%) | 85 (3.5%) |
| Total | 2,826 (100.0%) | 2,404 (100.0%) |
Housing Occupancy in Wood Ridge borough
Occupancy by Ownership in Wood Ridge borough
Of the total 3,851 dwellings in Wood Ridge borough, owner-occupied units account for 2,432 (63.1%), while renter-occupied units make up 1,419 (36.8%).
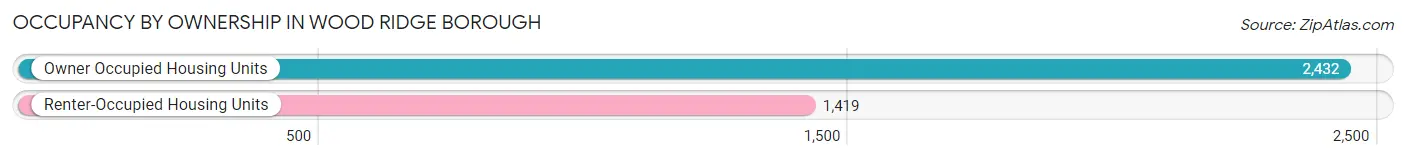
| Occupancy | # Housing Units | % Housing Units |
| Owner Occupied Housing Units | 2,432 | 63.1% |
| Renter-Occupied Housing Units | 1,419 | 36.8% |
| Total Occupied Housing Units | 3,851 | 100.0% |
Occupancy by Household Size in Wood Ridge borough
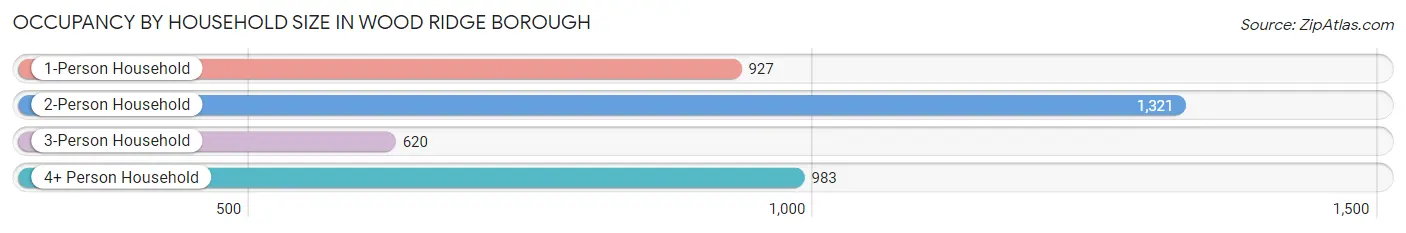
| Household Size | # Housing Units | % Housing Units |
| 1-Person Household | 927 | 24.1% |
| 2-Person Household | 1,321 | 34.3% |
| 3-Person Household | 620 | 16.1% |
| 4+ Person Household | 983 | 25.5% |
| Total Housing Units | 3,851 | 100.0% |
Occupancy by Ownership by Household Size in Wood Ridge borough
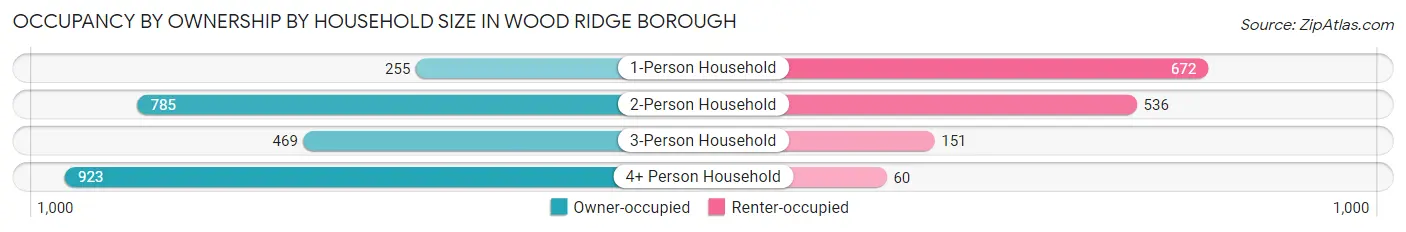
| Household Size | Owner-occupied | Renter-occupied |
| 1-Person Household | 255 (27.5%) | 672 (72.5%) |
| 2-Person Household | 785 (59.4%) | 536 (40.6%) |
| 3-Person Household | 469 (75.6%) | 151 (24.3%) |
| 4+ Person Household | 923 (93.9%) | 60 (6.1%) |
| Total Housing Units | 2,432 (63.1%) | 1,419 (36.8%) |
Occupancy by Educational Attainment in Wood Ridge borough
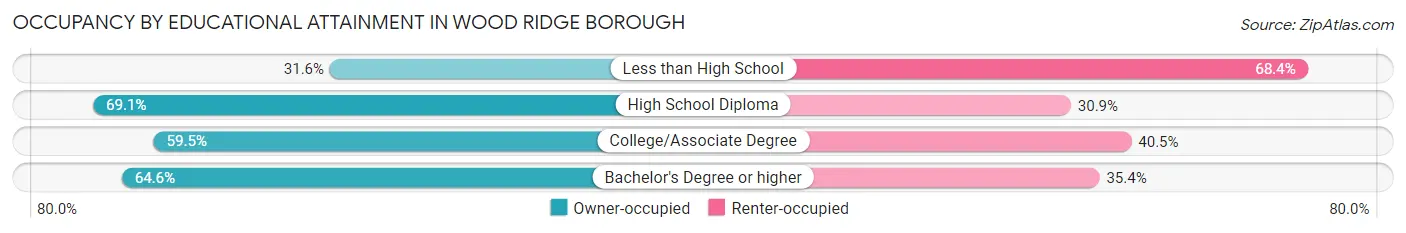
| Household Size | Owner-occupied | Renter-occupied |
| Less than High School | 42 (31.6%) | 91 (68.4%) |
| High School Diploma | 479 (69.1%) | 214 (30.9%) |
| College/Associate Degree | 500 (59.5%) | 340 (40.5%) |
| Bachelor's Degree or higher | 1,411 (64.6%) | 774 (35.4%) |
Occupancy by Age of Householder in Wood Ridge borough
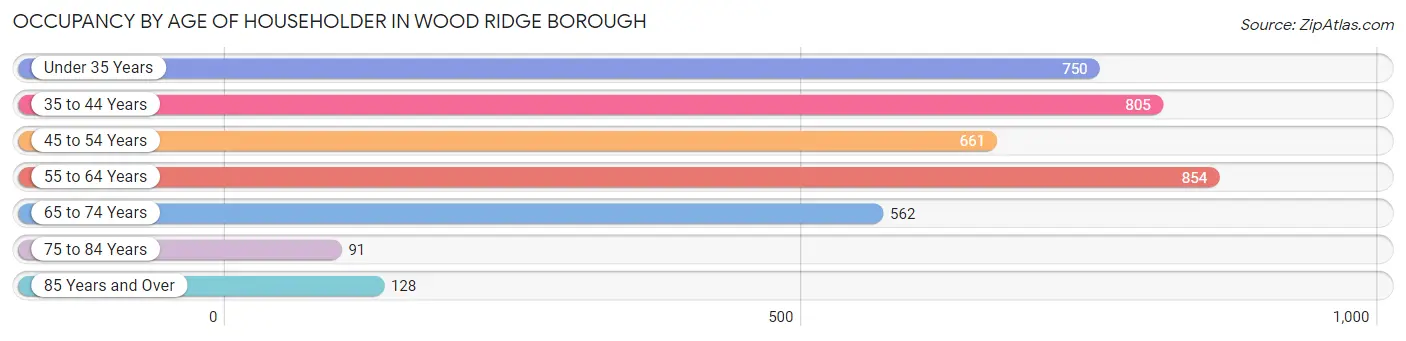
| Age Bracket | # Households | % Households |
| Under 35 Years | 750 | 19.5% |
| 35 to 44 Years | 805 | 20.9% |
| 45 to 54 Years | 661 | 17.2% |
| 55 to 64 Years | 854 | 22.2% |
| 65 to 74 Years | 562 | 14.6% |
| 75 to 84 Years | 91 | 2.4% |
| 85 Years and Over | 128 | 3.3% |
| Total | 3,851 | 100.0% |
Housing Finances in Wood Ridge borough
Median Income by Occupancy in Wood Ridge borough
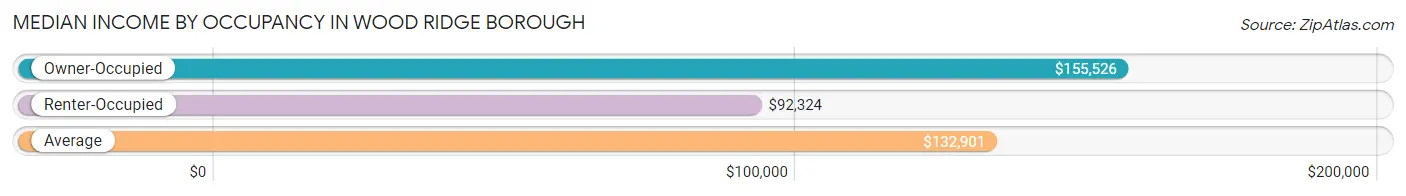
| Occupancy Type | # Households | Median Income |
| Owner-Occupied | 2,432 (63.1%) | $155,526 |
| Renter-Occupied | 1,419 (36.8%) | $92,324 |
| Average | 3,851 (100.0%) | $132,901 |
Occupancy by Householder Income Bracket in Wood Ridge borough
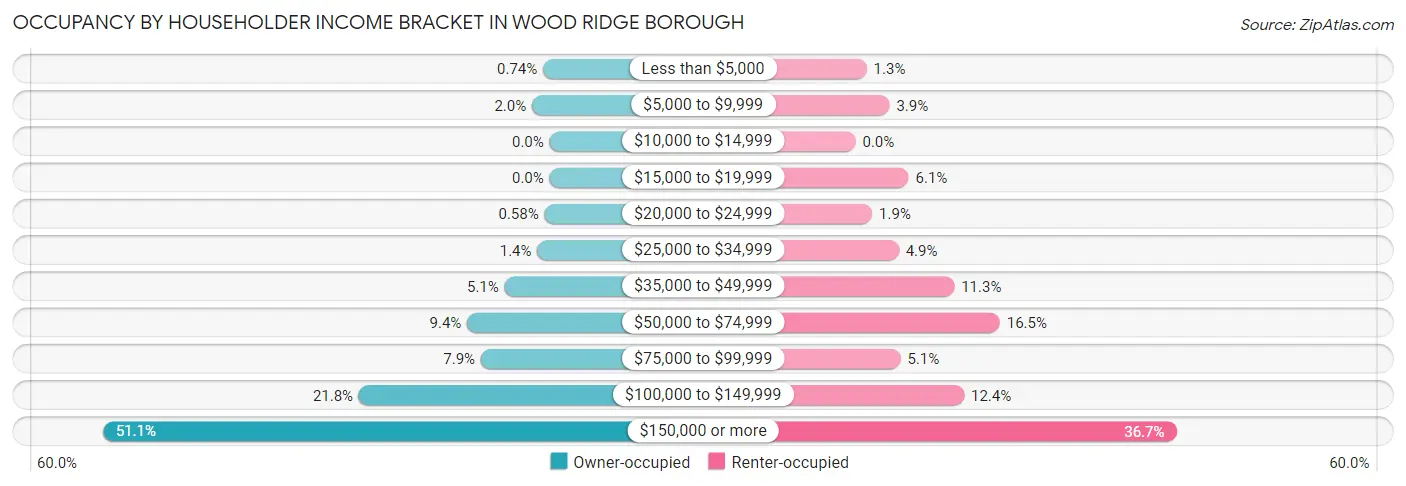
| Income Bracket | Owner-occupied | Renter-occupied |
| Less than $5,000 | 18 (0.7%) | 18 (1.3%) |
| $5,000 to $9,999 | 49 (2.0%) | 55 (3.9%) |
| $10,000 to $14,999 | 0 (0.0%) | 0 (0.0%) |
| $15,000 to $19,999 | 0 (0.0%) | 86 (6.1%) |
| $20,000 to $24,999 | 14 (0.6%) | 27 (1.9%) |
| $25,000 to $34,999 | 34 (1.4%) | 70 (4.9%) |
| $35,000 to $49,999 | 125 (5.1%) | 160 (11.3%) |
| $50,000 to $74,999 | 229 (9.4%) | 234 (16.5%) |
| $75,000 to $99,999 | 191 (7.9%) | 73 (5.1%) |
| $100,000 to $149,999 | 530 (21.8%) | 176 (12.4%) |
| $150,000 or more | 1,242 (51.1%) | 520 (36.6%) |
| Total | 2,432 (100.0%) | 1,419 (100.0%) |
Monthly Housing Cost Tiers in Wood Ridge borough
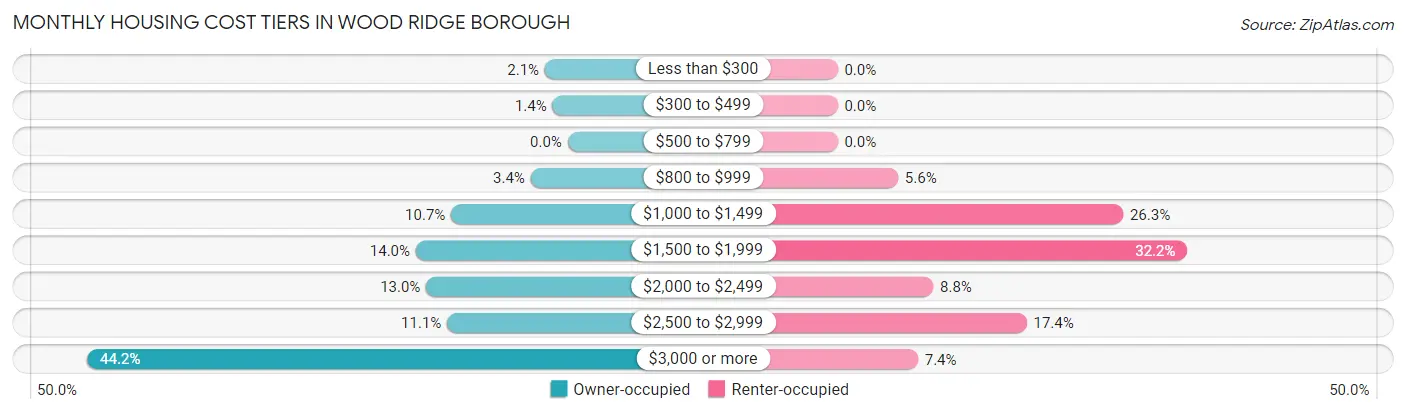
| Monthly Cost | Owner-occupied | Renter-occupied |
| Less than $300 | 51 (2.1%) | 0 (0.0%) |
| $300 to $499 | 34 (1.4%) | 0 (0.0%) |
| $500 to $799 | 0 (0.0%) | 0 (0.0%) |
| $800 to $999 | 83 (3.4%) | 79 (5.6%) |
| $1,000 to $1,499 | 261 (10.7%) | 373 (26.3%) |
| $1,500 to $1,999 | 340 (14.0%) | 457 (32.2%) |
| $2,000 to $2,499 | 317 (13.0%) | 125 (8.8%) |
| $2,500 to $2,999 | 270 (11.1%) | 247 (17.4%) |
| $3,000 or more | 1,076 (44.2%) | 105 (7.4%) |
| Total | 2,432 (100.0%) | 1,419 (100.0%) |
Physical Housing Characteristics in Wood Ridge borough
Housing Structures in Wood Ridge borough
| Structure Type | # Housing Units | % Housing Units |
| Single Unit, Detached | 1,939 | 50.3% |
| Single Unit, Attached | 447 | 11.6% |
| 2 Unit Apartments | 184 | 4.8% |
| 3 or 4 Unit Apartments | 389 | 10.1% |
| 5 to 9 Unit Apartments | 239 | 6.2% |
| 10 or more Apartments | 653 | 17.0% |
| Mobile Home / Other | 0 | 0.0% |
| Total | 3,851 | 100.0% |
Housing Structures by Occupancy in Wood Ridge borough
| Structure Type | Owner-occupied | Renter-occupied |
| Single Unit, Detached | 1,873 (96.6%) | 66 (3.4%) |
| Single Unit, Attached | 414 (92.6%) | 33 (7.4%) |
| 2 Unit Apartments | 75 (40.8%) | 109 (59.2%) |
| 3 or 4 Unit Apartments | 0 (0.0%) | 389 (100.0%) |
| 5 to 9 Unit Apartments | 43 (18.0%) | 196 (82.0%) |
| 10 or more Apartments | 27 (4.1%) | 626 (95.9%) |
| Mobile Home / Other | 0 (0.0%) | 0 (0.0%) |
| Total | 2,432 (63.1%) | 1,419 (36.8%) |
Housing Structures by Number of Rooms in Wood Ridge borough
| Number of Rooms | Owner-occupied | Renter-occupied |
| 1 Room | 0 (0.0%) | 98 (6.9%) |
| 2 or 3 Rooms | 44 (1.8%) | 698 (49.2%) |
| 4 or 5 Rooms | 319 (13.1%) | 484 (34.1%) |
| 6 or 7 Rooms | 1,151 (47.3%) | 139 (9.8%) |
| 8 or more Rooms | 918 (37.8%) | 0 (0.0%) |
| Total | 2,432 (100.0%) | 1,419 (100.0%) |
Housing Structure by Heating Type in Wood Ridge borough
| Heating Type | Owner-occupied | Renter-occupied |
| Utility Gas | 2,220 (91.3%) | 636 (44.8%) |
| Bottled, Tank, or LP Gas | 14 (0.6%) | 48 (3.4%) |
| Electricity | 124 (5.1%) | 683 (48.1%) |
| Fuel Oil or Kerosene | 54 (2.2%) | 20 (1.4%) |
| Coal or Coke | 0 (0.0%) | 0 (0.0%) |
| All other Fuels | 20 (0.8%) | 0 (0.0%) |
| No Fuel Used | 0 (0.0%) | 32 (2.3%) |
| Total | 2,432 (100.0%) | 1,419 (100.0%) |
Household Vehicle Usage in Wood Ridge borough
| Vehicles per Household | Owner-occupied | Renter-occupied |
| No Vehicle | 47 (1.9%) | 218 (15.4%) |
| 1 Vehicle | 580 (23.8%) | 730 (51.4%) |
| 2 Vehicles | 1,200 (49.3%) | 438 (30.9%) |
| 3 or more Vehicles | 605 (24.9%) | 33 (2.3%) |
| Total | 2,432 (100.0%) | 1,419 (100.0%) |
Real Estate & Mortgages in Wood Ridge borough
Real Estate and Mortgage Overview in Wood Ridge borough
| Characteristic | Without Mortgage | With Mortgage |
| Housing Units | 763 | 1,669 |
| Median Property Value | $458,100 | $548,500 |
| Median Household Income | $86,726 | $1,071 |
| Monthly Housing Costs | $1,271 | $1,076 |
| Real Estate Taxes | $10,001 | $36 |
Property Value by Mortgage Status in Wood Ridge borough
| Property Value | Without Mortgage | With Mortgage |
| Less than $50,000 | 80 (10.5%) | 0 (0.0%) |
| $50,000 to $99,999 | 0 (0.0%) | 0 (0.0%) |
| $100,000 to $299,999 | 0 (0.0%) | 93 (5.6%) |
| $300,000 to $499,999 | 472 (61.9%) | 574 (34.4%) |
| $500,000 to $749,999 | 173 (22.7%) | 864 (51.8%) |
| $750,000 to $999,999 | 38 (5.0%) | 138 (8.3%) |
| $1,000,000 or more | 0 (0.0%) | 0 (0.0%) |
| Total | 763 (100.0%) | 1,669 (100.0%) |
Household Income by Mortgage Status in Wood Ridge borough
| Household Income | Without Mortgage | With Mortgage |
| Less than $10,000 | 49 (6.4%) | 37 (2.2%) |
| $10,000 to $24,999 | 14 (1.8%) | 18 (1.1%) |
| $25,000 to $34,999 | 34 (4.5%) | 0 (0.0%) |
| $35,000 to $49,999 | 56 (7.3%) | 0 (0.0%) |
| $50,000 to $74,999 | 146 (19.1%) | 69 (4.1%) |
| $75,000 to $99,999 | 138 (18.1%) | 83 (5.0%) |
| $100,000 to $149,999 | 155 (20.3%) | 53 (3.2%) |
| $150,000 or more | 171 (22.4%) | 375 (22.5%) |
| Total | 763 (100.0%) | 1,669 (100.0%) |
Property Value to Household Income Ratio in Wood Ridge borough
| Value-to-Income Ratio | Without Mortgage | With Mortgage |
| Less than 2.0x | 127 (16.6%) | 184,393 (11,048.1%) |
| 2.0x to 2.9x | 102 (13.4%) | 223 (13.4%) |
| 3.0x to 3.9x | 80 (10.5%) | 694 (41.6%) |
| 4.0x or more | 454 (59.5%) | 365 (21.9%) |
| Total | 763 (100.0%) | 1,669 (100.0%) |
Real Estate Taxes by Mortgage Status in Wood Ridge borough
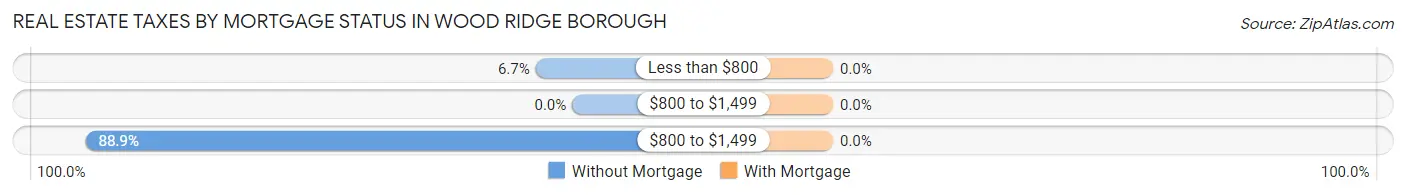
| Property Taxes | Without Mortgage | With Mortgage |
| Less than $800 | 51 (6.7%) | 0 (0.0%) |
| $800 to $1,499 | 0 (0.0%) | 0 (0.0%) |
| $800 to $1,499 | 678 (88.9%) | 0 (0.0%) |
| Total | 763 (100.0%) | 1,669 (100.0%) |
Health & Disability in Wood Ridge borough
Health Insurance Coverage by Age in Wood Ridge borough
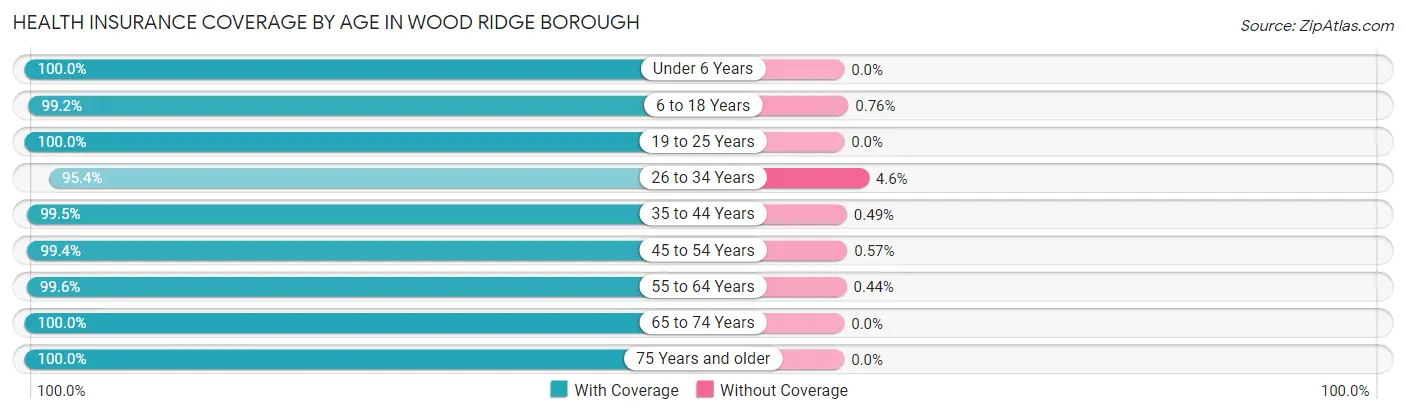
| Age Bracket | With Coverage | Without Coverage |
| Under 6 Years | 781 (100.0%) | 0 (0.0%) |
| 6 to 18 Years | 1,040 (99.2%) | 8 (0.8%) |
| 19 to 25 Years | 1,069 (100.0%) | 0 (0.0%) |
| 26 to 34 Years | 1,438 (95.4%) | 69 (4.6%) |
| 35 to 44 Years | 1,409 (99.5%) | 7 (0.5%) |
| 45 to 54 Years | 1,212 (99.4%) | 7 (0.6%) |
| 55 to 64 Years | 1,600 (99.6%) | 7 (0.4%) |
| 65 to 74 Years | 997 (100.0%) | 0 (0.0%) |
| 75 Years and older | 334 (100.0%) | 0 (0.0%) |
| Total | 9,880 (99.0%) | 98 (1.0%) |
Health Insurance Coverage by Citizenship Status in Wood Ridge borough
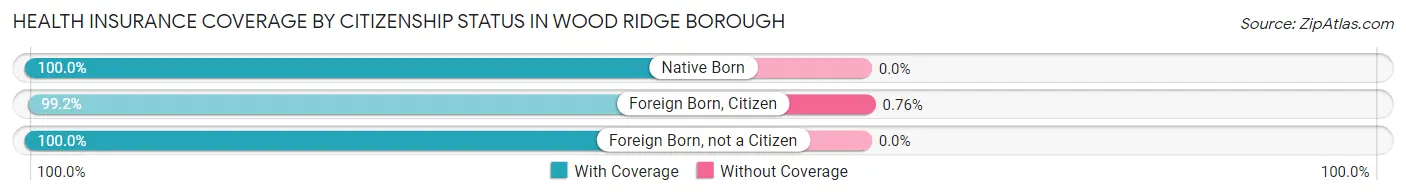
| Citizenship Status | With Coverage | Without Coverage |
| Native Born | 781 (100.0%) | 0 (0.0%) |
| Foreign Born, Citizen | 1,040 (99.2%) | 8 (0.8%) |
| Foreign Born, not a Citizen | 1,069 (100.0%) | 0 (0.0%) |
Health Insurance Coverage by Household Income in Wood Ridge borough
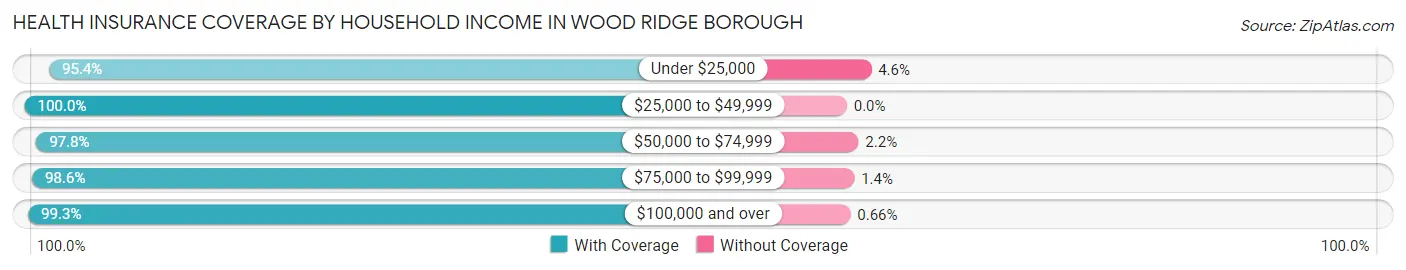
| Household Income | With Coverage | Without Coverage |
| Under $25,000 | 418 (95.4%) | 20 (4.6%) |
| $25,000 to $49,999 | 778 (100.0%) | 0 (0.0%) |
| $50,000 to $74,999 | 985 (97.8%) | 22 (2.2%) |
| $75,000 to $99,999 | 497 (98.6%) | 7 (1.4%) |
| $100,000 and over | 7,198 (99.3%) | 48 (0.7%) |
Public vs Private Health Insurance Coverage by Age in Wood Ridge borough
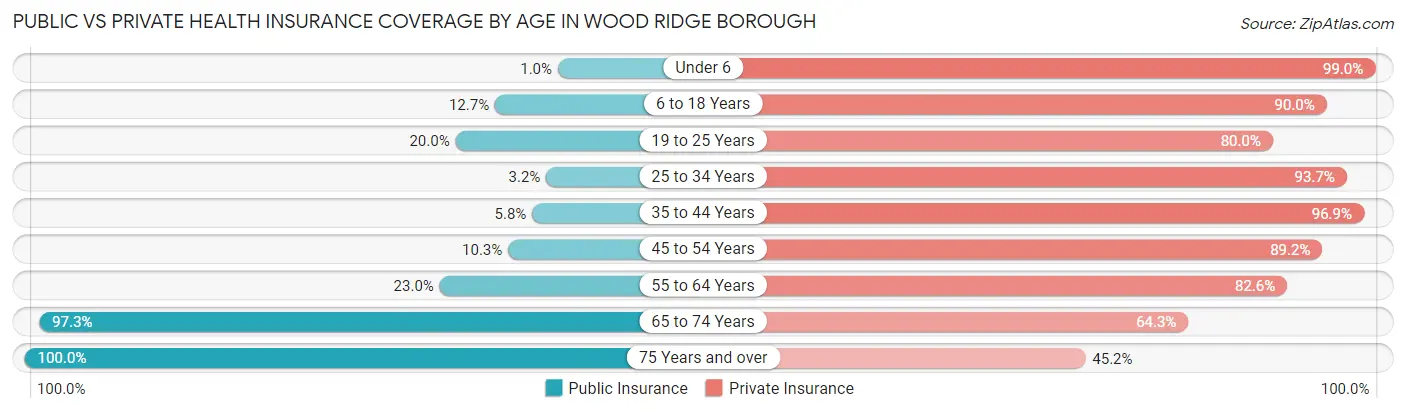
| Age Bracket | Public Insurance | Private Insurance |
| Under 6 | 8 (1.0%) | 773 (99.0%) |
| 6 to 18 Years | 133 (12.7%) | 943 (90.0%) |
| 19 to 25 Years | 214 (20.0%) | 855 (80.0%) |
| 25 to 34 Years | 48 (3.2%) | 1,412 (93.7%) |
| 35 to 44 Years | 82 (5.8%) | 1,372 (96.9%) |
| 45 to 54 Years | 125 (10.2%) | 1,087 (89.2%) |
| 55 to 64 Years | 369 (23.0%) | 1,328 (82.6%) |
| 65 to 74 Years | 970 (97.3%) | 641 (64.3%) |
| 75 Years and over | 334 (100.0%) | 151 (45.2%) |
| Total | 2,283 (22.9%) | 8,562 (85.8%) |
Disability Status by Sex by Age in Wood Ridge borough
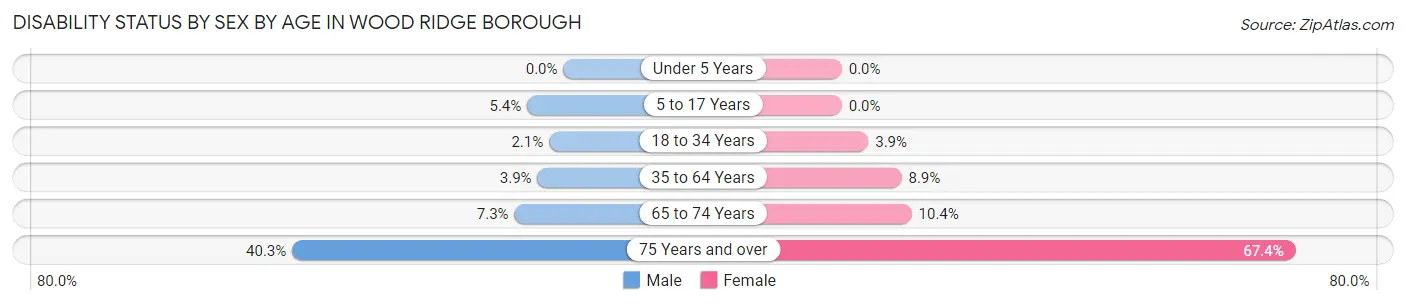
| Age Bracket | Male | Female |
| Under 5 Years | 0 (0.0%) | 0 (0.0%) |
| 5 to 17 Years | 35 (5.4%) | 0 (0.0%) |
| 18 to 34 Years | 23 (2.1%) | 61 (3.9%) |
| 35 to 64 Years | 86 (3.8%) | 178 (8.9%) |
| 65 to 74 Years | 29 (7.3%) | 62 (10.4%) |
| 75 Years and over | 58 (40.3%) | 128 (67.4%) |
Disability Class by Sex by Age in Wood Ridge borough
Disability Class: Hearing Difficulty
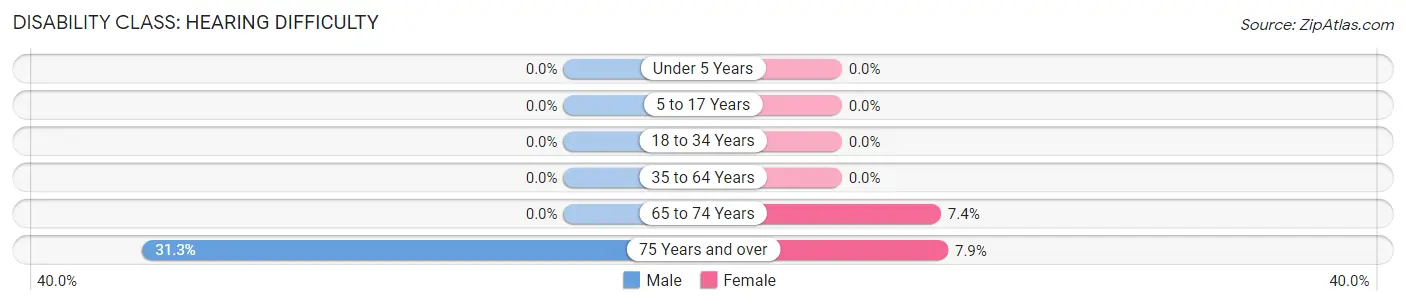
| Age Bracket | Male | Female |
| Under 5 Years | 0 (0.0%) | 0 (0.0%) |
| 5 to 17 Years | 0 (0.0%) | 0 (0.0%) |
| 18 to 34 Years | 0 (0.0%) | 0 (0.0%) |
| 35 to 64 Years | 0 (0.0%) | 0 (0.0%) |
| 65 to 74 Years | 0 (0.0%) | 44 (7.4%) |
| 75 Years and over | 45 (31.2%) | 15 (7.9%) |
Disability Class: Vision Difficulty
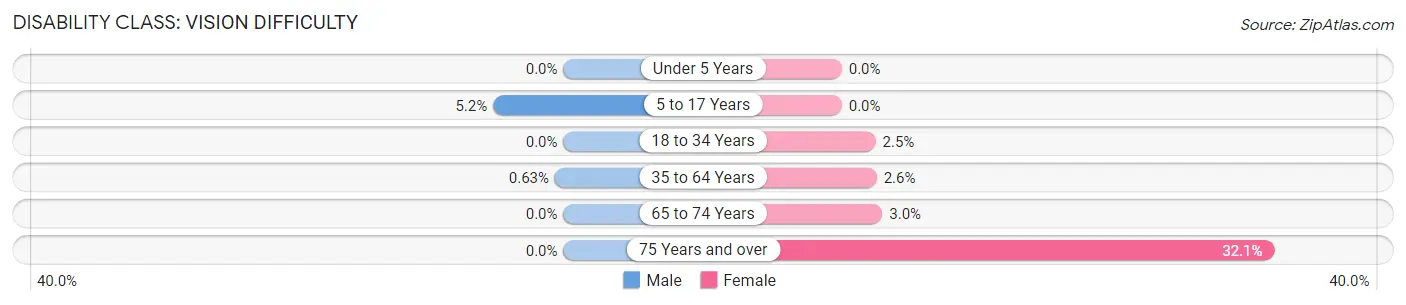
| Age Bracket | Male | Female |
| Under 5 Years | 0 (0.0%) | 0 (0.0%) |
| 5 to 17 Years | 34 (5.2%) | 0 (0.0%) |
| 18 to 34 Years | 0 (0.0%) | 39 (2.5%) |
| 35 to 64 Years | 14 (0.6%) | 52 (2.6%) |
| 65 to 74 Years | 0 (0.0%) | 18 (3.0%) |
| 75 Years and over | 0 (0.0%) | 61 (32.1%) |
Disability Class: Cognitive Difficulty
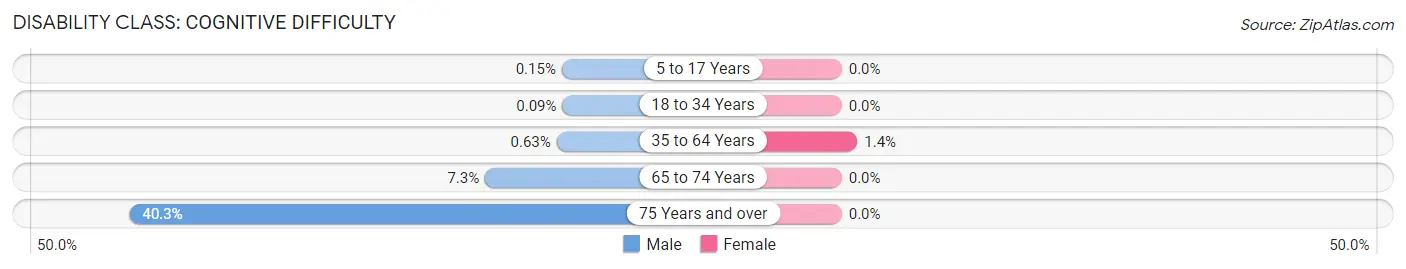
| Age Bracket | Male | Female |
| 5 to 17 Years | 1 (0.2%) | 0 (0.0%) |
| 18 to 34 Years | 1 (0.1%) | 0 (0.0%) |
| 35 to 64 Years | 14 (0.6%) | 29 (1.4%) |
| 65 to 74 Years | 29 (7.3%) | 0 (0.0%) |
| 75 Years and over | 58 (40.3%) | 0 (0.0%) |
Disability Class: Ambulatory Difficulty
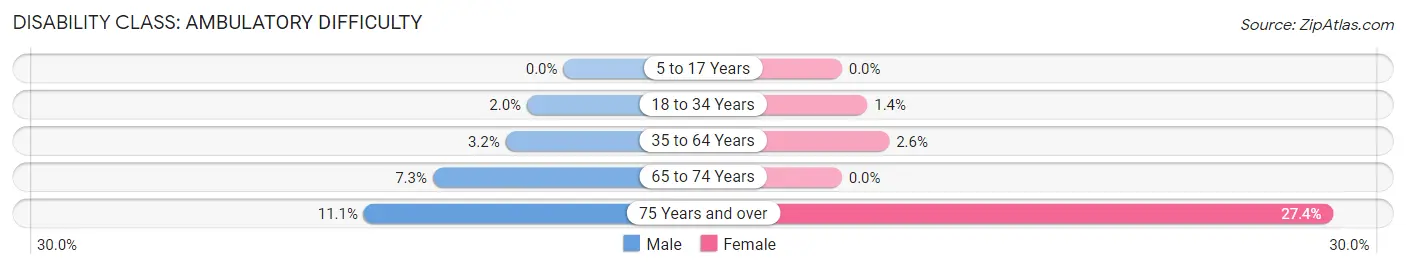
| Age Bracket | Male | Female |
| 5 to 17 Years | 0 (0.0%) | 0 (0.0%) |
| 18 to 34 Years | 22 (2.0%) | 22 (1.4%) |
| 35 to 64 Years | 72 (3.2%) | 53 (2.6%) |
| 65 to 74 Years | 29 (7.3%) | 0 (0.0%) |
| 75 Years and over | 16 (11.1%) | 52 (27.4%) |
Disability Class: Self-Care Difficulty
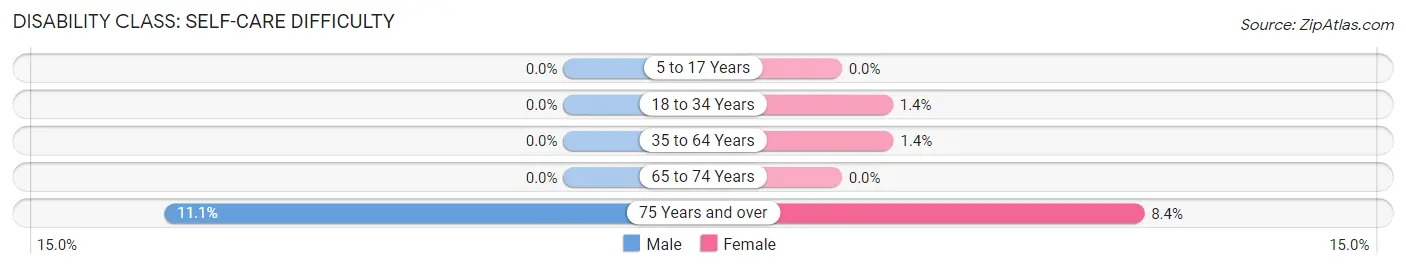
| Age Bracket | Male | Female |
| 5 to 17 Years | 0 (0.0%) | 0 (0.0%) |
| 18 to 34 Years | 0 (0.0%) | 22 (1.4%) |
| 35 to 64 Years | 0 (0.0%) | 29 (1.4%) |
| 65 to 74 Years | 0 (0.0%) | 0 (0.0%) |
| 75 Years and over | 16 (11.1%) | 16 (8.4%) |
Technology Access in Wood Ridge borough
Computing Device Access in Wood Ridge borough
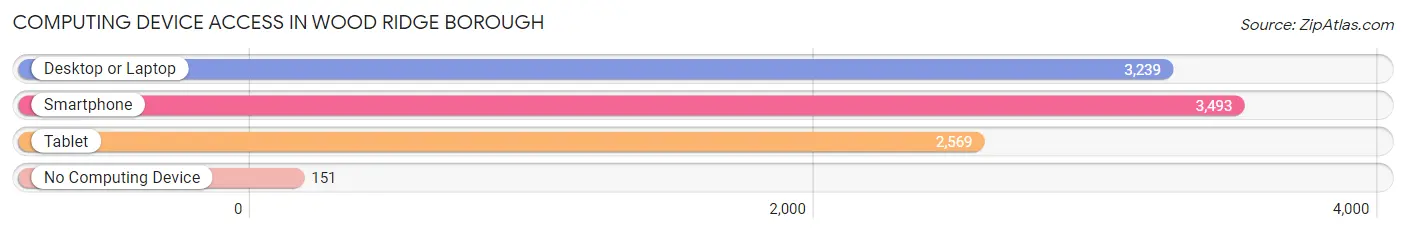
| Device Type | # Households | % Households |
| Desktop or Laptop | 3,239 | 84.1% |
| Smartphone | 3,493 | 90.7% |
| Tablet | 2,569 | 66.7% |
| No Computing Device | 151 | 3.9% |
| Total | 3,851 | 100.0% |
Internet Access in Wood Ridge borough
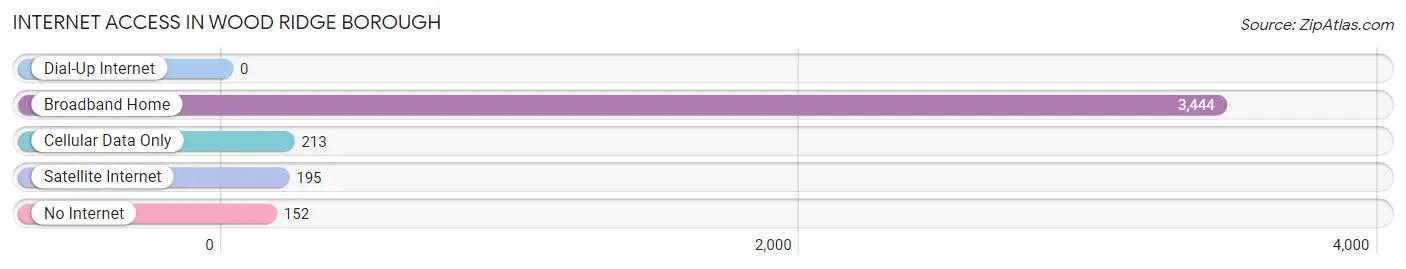
| Internet Type | # Households | % Households |
| Dial-Up Internet | 0 | 0.0% |
| Broadband Home | 3,444 | 89.4% |
| Cellular Data Only | 213 | 5.5% |
| Satellite Internet | 195 | 5.1% |
| No Internet | 152 | 4.0% |
| Total | 3,851 | 100.0% |
Wood Ridge borough Summary
Wood Ridge Borough is a small borough located in Bergen County, New Jersey. It is situated in the northeastern part of the state, just west of the Hudson River and north of the Hackensack River. The borough is bordered by the towns of Hasbrouck Heights, Moonachie, and Carlstadt. As of the 2010 United States Census, the borough had a population of 8,919.
Geography
Wood Ridge Borough is located at 40°50'25" North, 74°4'45" West (40.840278, -74.079167). According to the United States Census Bureau, the borough has a total area of 1.3 square miles (3.4 km2), all of which is land.
The borough is located in the Hackensack River watershed. The borough is served by the New Jersey Transit Main Line, which runs through the borough and provides service to New York City.
Demographics
As of the 2010 United States Census, there were 8,919 people, 3,541 households, and 2,521 families residing in the borough. The population density was 6,845.3 people per square mile (2,637.2/km2). There were 3,717 housing units at an average density of 2,845.2 per square mile (1,098.7/km2). The racial makeup of the borough was 79.2% White, 4.2% African American, 0.2% Native American, 11.2% Asian, 0.0% Pacific Islander, 3.2% from other races, and 2.2% from two or more races. Hispanic or Latino of any race were 11.7% of the population.
There were 3,541 households, out of which 28.3% had children under the age of 18 living with them, 54.2% were married couples living together, 11.2% had a female householder with no husband present, and 30.2% were non-families. 25.2% of all households were made up of individuals, and 11.2% had someone living alone who was 65 years of age or older. The average household size was 2.53 and the average family size was 3.08.
In the borough, the population was spread out, with 20.7% under the age of 18, 7.2% from 18 to 24, 28.2% from 25 to 44, 28.2% from 45 to 64, and 15.7% who were 65 years of age or older. The median age was 40.4 years. For every 100 females, there were 92.3 males. For every 100 females ages 18 and older there were 88.7 males.
The median income for a household in the borough was $71,917, and the median income for a family was $86,917. Males had a median income of $60,000 versus $45,000 for females. The per capita income for the borough was $33,917. About 3.2% of families and 4.7% of the population were below the poverty line, including 5.2% of those under age 18 and 4.2% of those age 65 or over.
Economy
Wood Ridge Borough is home to a variety of businesses, including manufacturing, retail, and professional services. The borough is also home to a number of corporate headquarters, including the headquarters of the New Jersey Sports and Exposition Authority.
The borough is served by the New Jersey Transit Main Line, which provides service to New York City. The borough is also served by the Bergen County Bus System, which provides service to the surrounding towns and cities.
The borough is home to a number of parks and recreational facilities, including the Wood Ridge Memorial Park, which features a playground, basketball court, and picnic area. The borough also has a number of public schools, including the Wood Ridge High School.
Conclusion
Wood Ridge Borough is a small borough located in Bergen County, New Jersey. It is situated in the northeastern part of the state, just west of the Hudson River and north of the Hackensack River. As of the 2010 United States Census, the borough had a population of 8,919. The borough is served by the New Jersey Transit Main Line, which runs through the borough and provides service to New York City. The borough is home to a variety of businesses, including manufacturing, retail, and professional services. The borough is also home to a number of corporate headquarters, including the headquarters of the New Jersey Sports and Exposition Authority. The borough is home to a number of parks and recreational facilities, including the Wood Ridge Memorial Park, which features a playground, basketball court, and picnic area. The borough also has a number of public schools, including the Wood Ridge High School.
Common Questions
What is Per Capita Income in Wood Ridge borough?
Per Capita income in Wood Ridge borough is $61,861.
What is the Median Family Income in Wood Ridge borough?
Median Family Income in Wood Ridge borough is $171,233.
What is the Median Household income in Wood Ridge borough?
Median Household Income in Wood Ridge borough is $132,901.
What is Income or Wage Gap in Wood Ridge borough?
Income or Wage Gap in Wood Ridge borough is 44.2%.
Women in Wood Ridge borough earn 55.8 cents for every dollar earned by a man.
What is Inequality or Gini Index in Wood Ridge borough?
Inequality or Gini Index in Wood Ridge borough is 0.39.
What is the Total Population of Wood Ridge borough?
Total Population of Wood Ridge borough is 9,978.
What is the Total Male Population of Wood Ridge borough?
Total Male Population of Wood Ridge borough is 5,021.
What is the Total Female Population of Wood Ridge borough?
Total Female Population of Wood Ridge borough is 4,957.
What is the Ratio of Males per 100 Females in Wood Ridge borough?
There are 101.29 Males per 100 Females in Wood Ridge borough.
What is the Ratio of Females per 100 Males in Wood Ridge borough?
There are 98.73 Females per 100 Males in Wood Ridge borough.
What is the Median Population Age in Wood Ridge borough?
Median Population Age in Wood Ridge borough is 38.0 Years.
What is the Average Family Size in Wood Ridge borough
Average Family Size in Wood Ridge borough is 3.1 People.
What is the Average Household Size in Wood Ridge borough
Average Household Size in Wood Ridge borough is 2.6 People.
How Large is the Labor Force in Wood Ridge borough?
There are 6,239 People in the Labor Forcein in Wood Ridge borough.
What is the Percentage of People in the Labor Force in Wood Ridge borough?
74.5% of People are in the Labor Force in Wood Ridge borough.
What is the Unemployment Rate in Wood Ridge borough?
Unemployment Rate in Wood Ridge borough is 4.2%.