Silver Lake CDP Essex County, NJ Map & Demographics
Silver Lake CDP Essex County Overview
$27,801
PER CAPITA INCOME
$85,426
AVG FAMILY INCOME
$80,365
AVG HOUSEHOLD INCOME
64.7%
WAGE / INCOME GAP [ % ]
35.3¢/ $1
WAGE / INCOME GAP [ $ ]
0.34
INEQUALITY / GINI INDEX
4,407
TOTAL POPULATION
1,995
MALE POPULATION
2,412
FEMALE POPULATION
82.71
MALES / 100 FEMALES
120.90
FEMALES / 100 MALES
32.7
MEDIAN AGE
3.8
AVG FAMILY SIZE
3.1
AVG HOUSEHOLD SIZE
2,040
LABOR FORCE [ PEOPLE ]
57.9%
PERCENT IN LABOR FORCE
3.2%
UNEMPLOYMENT RATE
Income in Silver Lake CDP Essex County
Income Overview in Silver Lake CDP Essex County
Per Capita Income in Silver Lake CDP Essex County is $27,801, while median incomes of families and households are $85,426 and $80,365 respectively.
| Characteristic | Number | Measure |
| Per Capita Income | 4,407 | $27,801 |
| Median Family Income | 1,043 | $85,426 |
| Mean Family Income | 1,043 | $82,740 |
| Median Household Income | 1,398 | $80,365 |
| Mean Household Income | 1,398 | $84,389 |
| Income Deficit | 1,043 | $0 |
| Wage / Income Gap (%) | 4,407 | 64.67% |
| Wage / Income Gap ($) | 4,407 | 35.33¢ per $1 |
| Gini / Inequality Index | 4,407 | 0.34 |
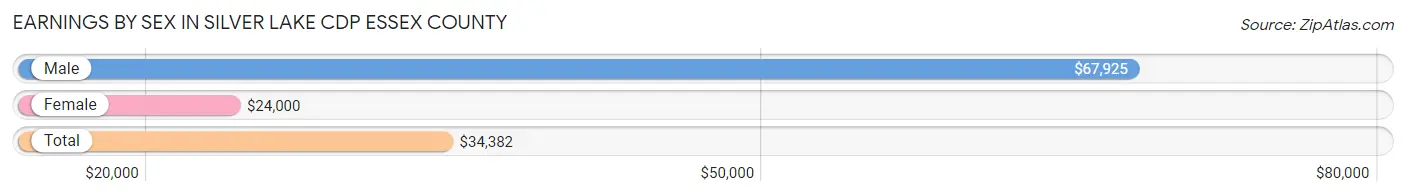
Earnings by Sex in Silver Lake CDP Essex County
Average Earnings in Silver Lake CDP Essex County are $34,382, $67,925 for men and $24,000 for women, a difference of 64.7%.
| Sex | Number | Average Earnings |
| Male | 1,023 (47.8%) | $67,925 |
| Female | 1,116 (52.2%) | $24,000 |
| Total | 2,139 (100.0%) | $34,382 |
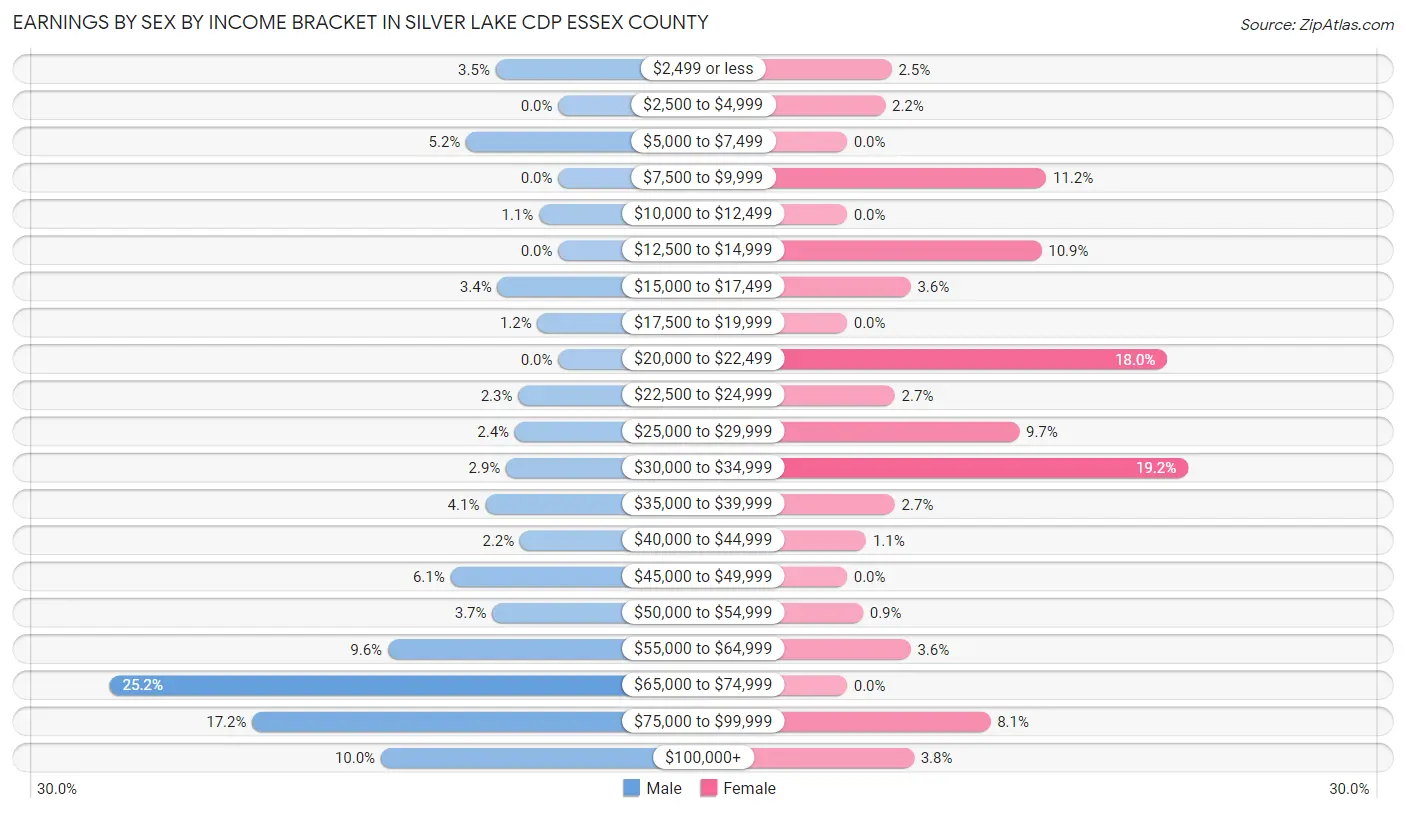
Earnings by Sex by Income Bracket in Silver Lake CDP Essex County
The most common earnings brackets in Silver Lake CDP Essex County are $65,000 to $74,999 for men (258 | 25.2%) and $30,000 to $34,999 for women (214 | 19.2%).
| Income | Male | Female |
| $2,499 or less | 36 (3.5%) | 28 (2.5%) |
| $2,500 to $4,999 | 0 (0.0%) | 24 (2.1%) |
| $5,000 to $7,499 | 53 (5.2%) | 0 (0.0%) |
| $7,500 to $9,999 | 0 (0.0%) | 125 (11.2%) |
| $10,000 to $12,499 | 11 (1.1%) | 0 (0.0%) |
| $12,500 to $14,999 | 0 (0.0%) | 122 (10.9%) |
| $15,000 to $17,499 | 35 (3.4%) | 40 (3.6%) |
| $17,500 to $19,999 | 12 (1.2%) | 0 (0.0%) |
| $20,000 to $22,499 | 0 (0.0%) | 201 (18.0%) |
| $22,500 to $24,999 | 23 (2.2%) | 30 (2.7%) |
| $25,000 to $29,999 | 25 (2.4%) | 108 (9.7%) |
| $30,000 to $34,999 | 30 (2.9%) | 214 (19.2%) |
| $35,000 to $39,999 | 42 (4.1%) | 30 (2.7%) |
| $40,000 to $44,999 | 22 (2.1%) | 12 (1.1%) |
| $45,000 to $49,999 | 62 (6.1%) | 0 (0.0%) |
| $50,000 to $54,999 | 38 (3.7%) | 10 (0.9%) |
| $55,000 to $64,999 | 98 (9.6%) | 40 (3.6%) |
| $65,000 to $74,999 | 258 (25.2%) | 0 (0.0%) |
| $75,000 to $99,999 | 176 (17.2%) | 90 (8.1%) |
| $100,000+ | 102 (10.0%) | 42 (3.8%) |
| Total | 1,023 (100.0%) | 1,116 (100.0%) |
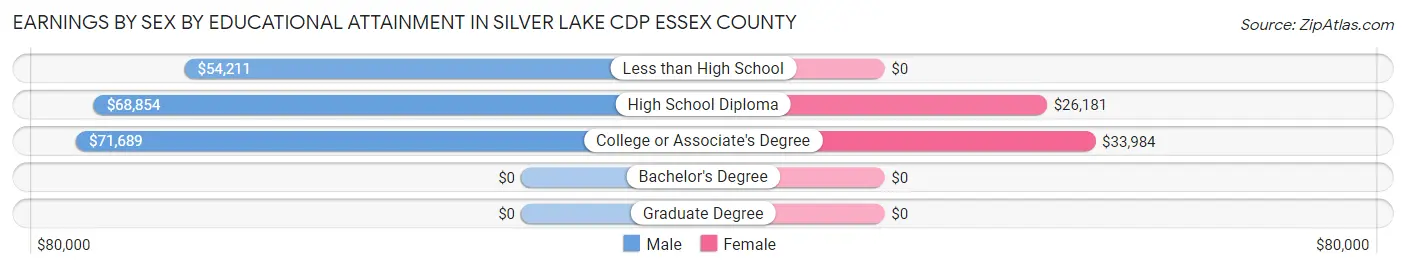
Earnings by Sex by Educational Attainment in Silver Lake CDP Essex County
Average earnings in Silver Lake CDP Essex County are $68,698 for men and $32,832 for women, a difference of 52.2%. Men with an educational attainment of college or associate's degree enjoy the highest average annual earnings of $71,689, while those with less than high school education earn the least with $54,211. Women with an educational attainment of college or associate's degree earn the most with the average annual earnings of $33,984, while those with high school diploma education have the smallest earnings of $26,181.
| Educational Attainment | Male Income | Female Income |
| Less than High School | $54,211 | $0 |
| High School Diploma | $68,854 | $26,181 |
| College or Associate's Degree | $71,689 | $33,984 |
| Bachelor's Degree | - | - |
| Graduate Degree | - | - |
| Total | $68,698 | $32,832 |
Family Income in Silver Lake CDP Essex County
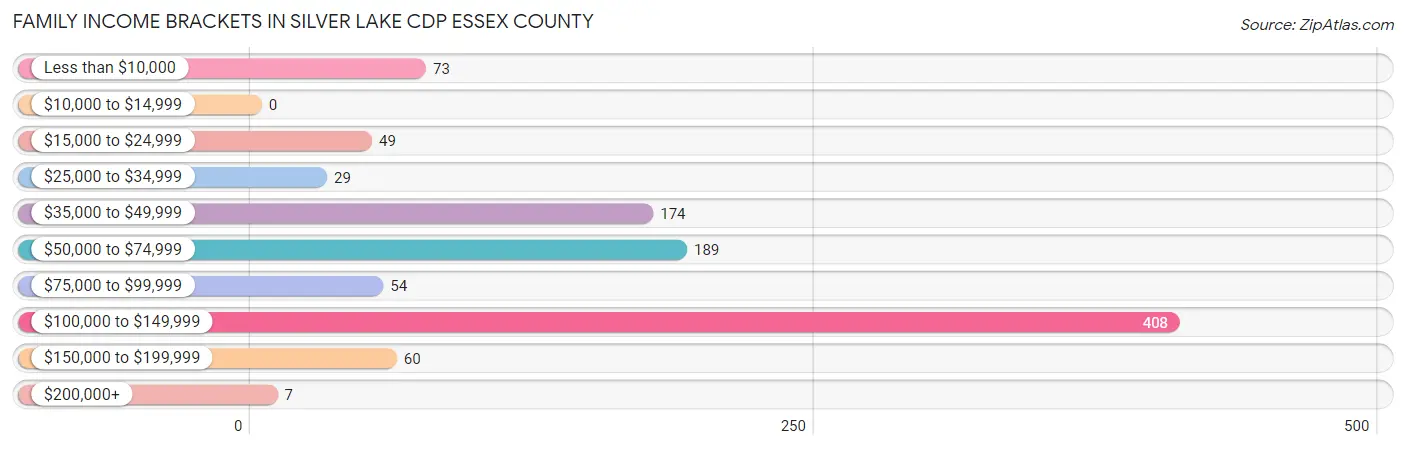
Family Income Brackets in Silver Lake CDP Essex County
According to the Silver Lake CDP Essex County family income data, there are 408 families falling into the $100,000 to $149,999 income range, which is the most common income bracket and makes up 39.1% of all families.
| Income Bracket | # Families | % Families |
| Less than $10,000 | 73 | 7.0% |
| $10,000 to $14,999 | 0 | 0.0% |
| $15,000 to $24,999 | 49 | 4.7% |
| $25,000 to $34,999 | 29 | 2.8% |
| $35,000 to $49,999 | 174 | 16.7% |
| $50,000 to $74,999 | 189 | 18.1% |
| $75,000 to $99,999 | 54 | 5.2% |
| $100,000 to $149,999 | 408 | 39.1% |
| $150,000 to $199,999 | 60 | 5.8% |
| $200,000+ | 7 | 0.7% |
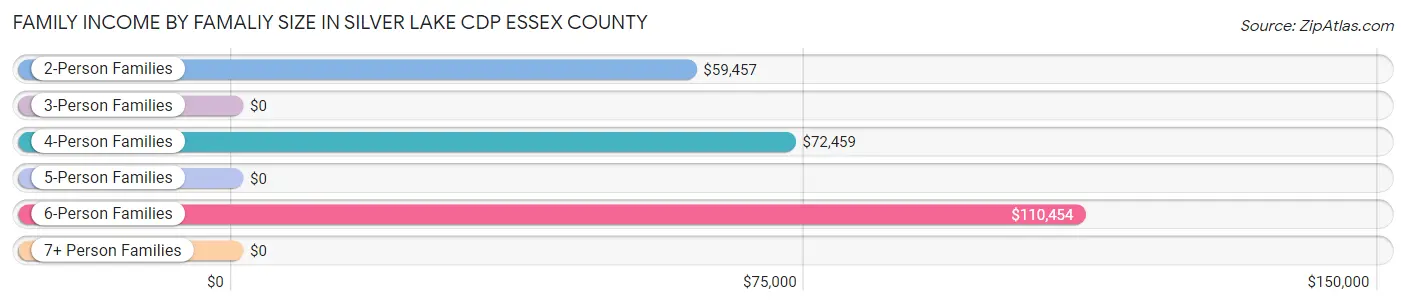
Family Income by Famaliy Size in Silver Lake CDP Essex County
6-person families (203 | 19.5%) account for the highest median family income in Silver Lake CDP Essex County with $110,454 per family, while 2-person families (386 | 37.0%) have the highest median income of $29,728 per family member.
| Income Bracket | # Families | Median Income |
| 2-Person Families | 386 (37.0%) | $59,457 |
| 3-Person Families | 139 (13.3%) | $0 |
| 4-Person Families | 287 (27.5%) | $72,459 |
| 5-Person Families | 21 (2.0%) | $0 |
| 6-Person Families | 203 (19.5%) | $110,454 |
| 7+ Person Families | 7 (0.7%) | $0 |
| Total | 1,043 (100.0%) | $85,426 |
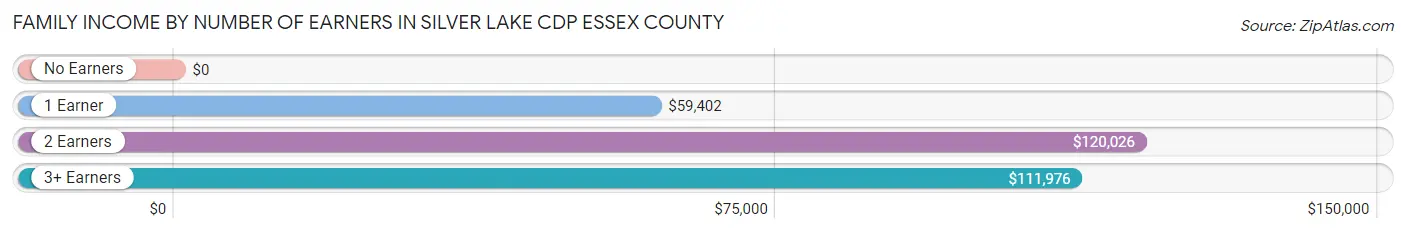
Family Income by Number of Earners in Silver Lake CDP Essex County
| Number of Earners | # Families | Median Income |
| No Earners | 166 (15.9%) | $0 |
| 1 Earner | 313 (30.0%) | $59,402 |
| 2 Earners | 368 (35.3%) | $120,026 |
| 3+ Earners | 196 (18.8%) | $111,976 |
| Total | 1,043 (100.0%) | $85,426 |
Household Income in Silver Lake CDP Essex County
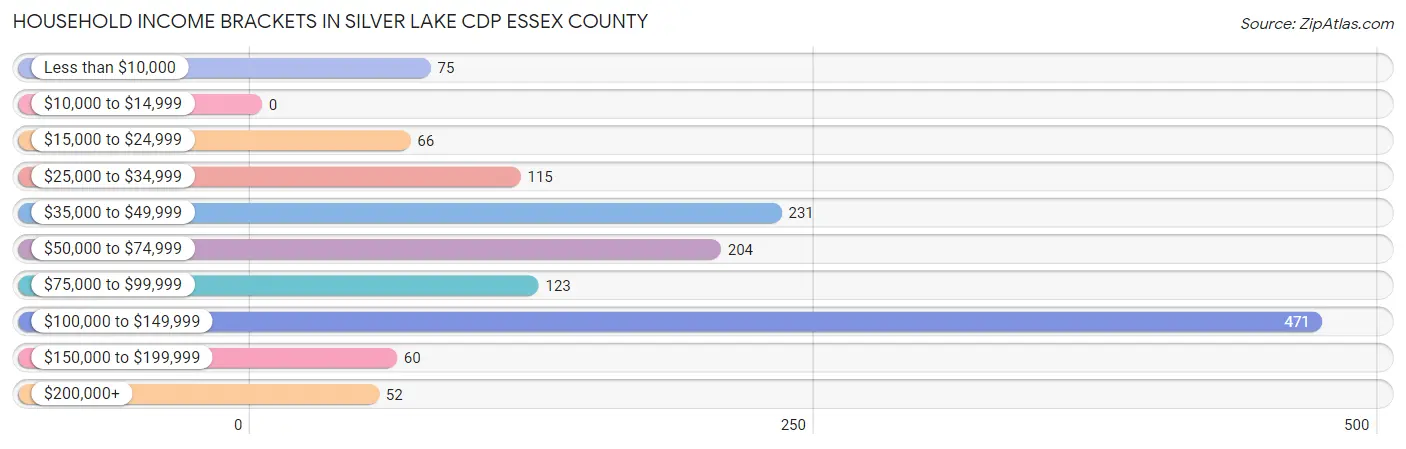
Household Income Brackets in Silver Lake CDP Essex County
With 471 households falling in the category, the $100,000 to $149,999 income range is the most frequent in Silver Lake CDP Essex County, accounting for 33.7% of all households.
| Income Bracket | # Households | % Households |
| Less than $10,000 | 75 | 5.4% |
| $10,000 to $14,999 | 0 | 0.0% |
| $15,000 to $24,999 | 66 | 4.7% |
| $25,000 to $34,999 | 115 | 8.2% |
| $35,000 to $49,999 | 231 | 16.5% |
| $50,000 to $74,999 | 204 | 14.6% |
| $75,000 to $99,999 | 123 | 8.8% |
| $100,000 to $149,999 | 471 | 33.7% |
| $150,000 to $199,999 | 60 | 4.3% |
| $200,000+ | 52 | 3.7% |
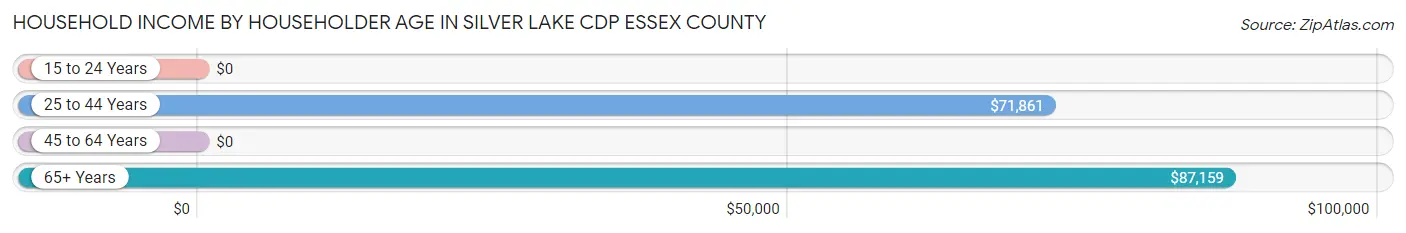
Household Income by Householder Age in Silver Lake CDP Essex County
The median household income in Silver Lake CDP Essex County is $80,365, with the highest median household income of $87,159 found in the 65+ years age bracket for the primary householder. A total of 298 households (21.3%) fall into this category.
| Income Bracket | # Households | Median Income |
| 15 to 24 Years | 0 (0.0%) | $0 |
| 25 to 44 Years | 551 (39.4%) | $71,861 |
| 45 to 64 Years | 549 (39.3%) | $0 |
| 65+ Years | 298 (21.3%) | $87,159 |
| Total | 1,398 (100.0%) | $80,365 |
Poverty in Silver Lake CDP Essex County
Income Below Poverty by Sex and Age in Silver Lake CDP Essex County
With 21.4% poverty level for males and 10.9% for females among the residents of Silver Lake CDP Essex County, 12 to 14 year old males and 35 to 44 year old females are the most vulnerable to poverty, with 59 males (88.1%) and 119 females (36.5%) in their respective age groups living below the poverty level.
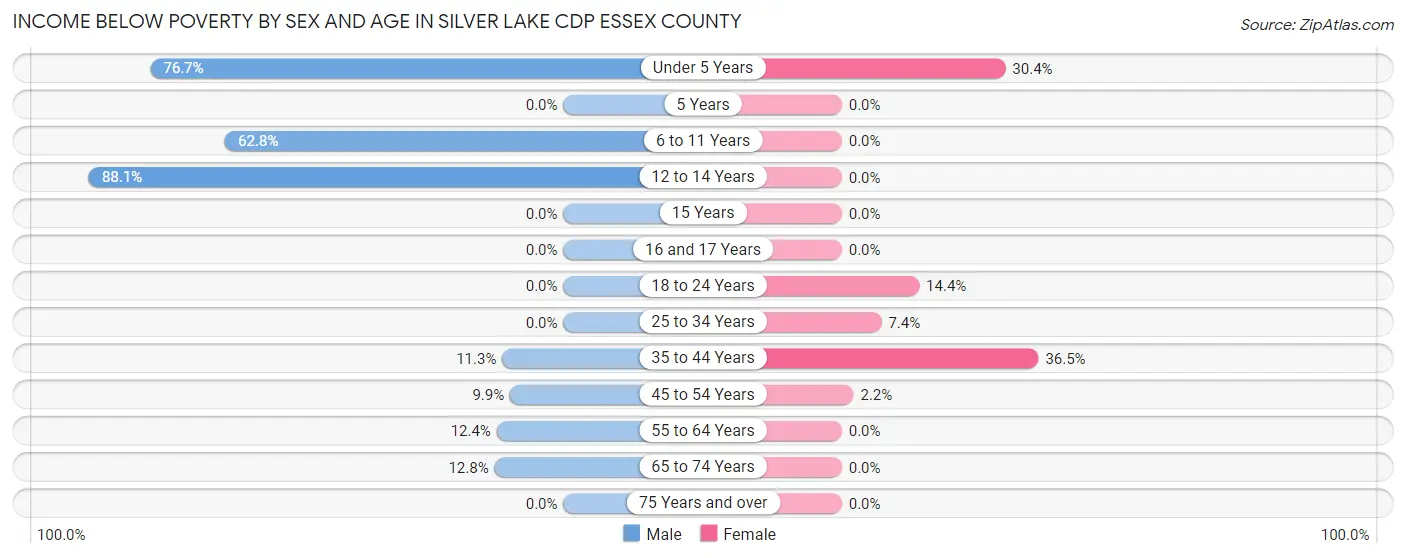
| Age Bracket | Male | Female |
| Under 5 Years | 151 (76.6%) | 58 (30.4%) |
| 5 Years | 0 (0.0%) | 0 (0.0%) |
| 6 to 11 Years | 108 (62.8%) | 0 (0.0%) |
| 12 to 14 Years | 59 (88.1%) | 0 (0.0%) |
| 15 Years | 0 (0.0%) | 0 (0.0%) |
| 16 and 17 Years | 0 (0.0%) | 0 (0.0%) |
| 18 to 24 Years | 0 (0.0%) | 54 (14.4%) |
| 25 to 34 Years | 0 (0.0%) | 25 (7.4%) |
| 35 to 44 Years | 11 (11.3%) | 119 (36.5%) |
| 45 to 54 Years | 28 (9.9%) | 5 (2.2%) |
| 55 to 64 Years | 48 (12.4%) | 0 (0.0%) |
| 65 to 74 Years | 23 (12.8%) | 0 (0.0%) |
| 75 Years and over | 0 (0.0%) | 0 (0.0%) |
| Total | 428 (21.4%) | 261 (10.9%) |
Income Above Poverty by Sex and Age in Silver Lake CDP Essex County
According to the poverty statistics in Silver Lake CDP Essex County, males aged 16 and 17 years and females aged 6 to 11 years are the age groups that are most secure financially, with 100.0% of males and 100.0% of females in these age groups living above the poverty line.
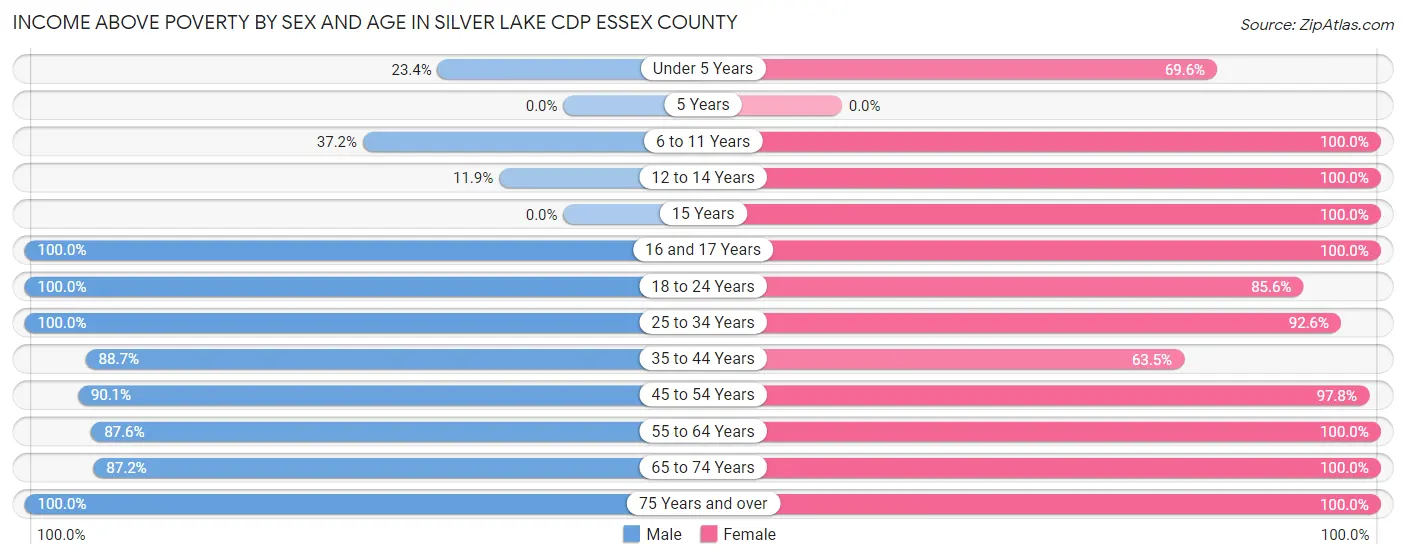
| Age Bracket | Male | Female |
| Under 5 Years | 46 (23.4%) | 133 (69.6%) |
| 5 Years | 0 (0.0%) | 0 (0.0%) |
| 6 to 11 Years | 64 (37.2%) | 111 (100.0%) |
| 12 to 14 Years | 8 (11.9%) | 128 (100.0%) |
| 15 Years | 0 (0.0%) | 9 (100.0%) |
| 16 and 17 Years | 51 (100.0%) | 150 (100.0%) |
| 18 to 24 Years | 219 (100.0%) | 322 (85.6%) |
| 25 to 34 Years | 318 (100.0%) | 314 (92.6%) |
| 35 to 44 Years | 86 (88.7%) | 207 (63.5%) |
| 45 to 54 Years | 255 (90.1%) | 224 (97.8%) |
| 55 to 64 Years | 340 (87.6%) | 259 (100.0%) |
| 65 to 74 Years | 157 (87.2%) | 177 (100.0%) |
| 75 Years and over | 23 (100.0%) | 109 (100.0%) |
| Total | 1,567 (78.5%) | 2,143 (89.1%) |
Income Below Poverty Among Married-Couple Families in Silver Lake CDP Essex County
The poverty statistics for married-couple families in Silver Lake CDP Essex County show that 7.0% or 59 of the total 843 families live below the poverty line. Families with 1 or 2 children have the highest poverty rate of 14.7%, comprising of 59 families. On the other hand, families with no children have the lowest poverty rate of 0.0%, which includes 0 families.
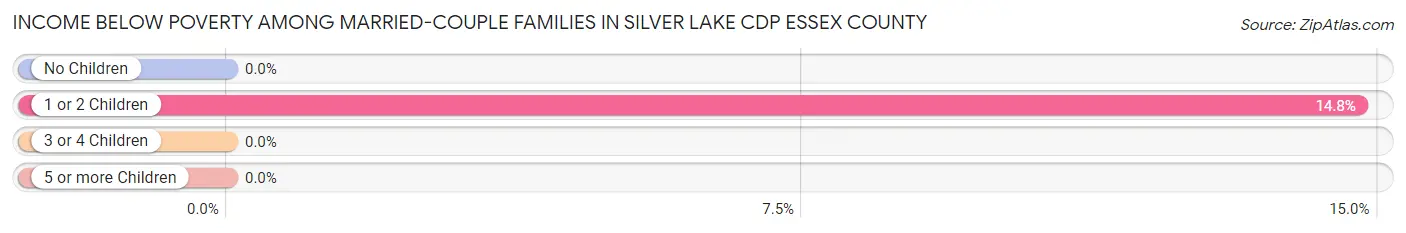
| Children | Above Poverty | Below Poverty |
| No Children | 443 (100.0%) | 0 (0.0%) |
| 1 or 2 Children | 341 (85.3%) | 59 (14.7%) |
| 3 or 4 Children | 0 (0.0%) | 0 (0.0%) |
| 5 or more Children | 0 (0.0%) | 0 (0.0%) |
| Total | 784 (93.0%) | 59 (7.0%) |
Income Below Poverty Among Single-Parent Households in Silver Lake CDP Essex County
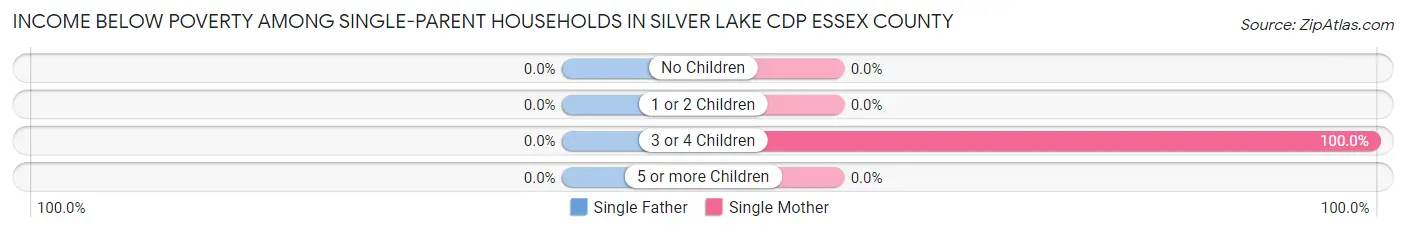
| Children | Single Father | Single Mother |
| No Children | 0 (0.0%) | 0 (0.0%) |
| 1 or 2 Children | 0 (0.0%) | 0 (0.0%) |
| 3 or 4 Children | 0 (0.0%) | 74 (100.0%) |
| 5 or more Children | 0 (0.0%) | 0 (0.0%) |
| Total | 0 (0.0%) | 74 (63.8%) |
Income Below Poverty Among Married-Couple vs Single-Parent Households in Silver Lake CDP Essex County
The poverty data for Silver Lake CDP Essex County shows that 59 of the married-couple family households (7.0%) and 74 of the single-parent households (37.0%) are living below the poverty level. Within the married-couple family households, those with 1 or 2 children have the highest poverty rate, with 59 households (14.7%) falling below the poverty line. Among the single-parent households, those with 3 or 4 children have the highest poverty rate, with 74 household (81.3%) living below poverty.
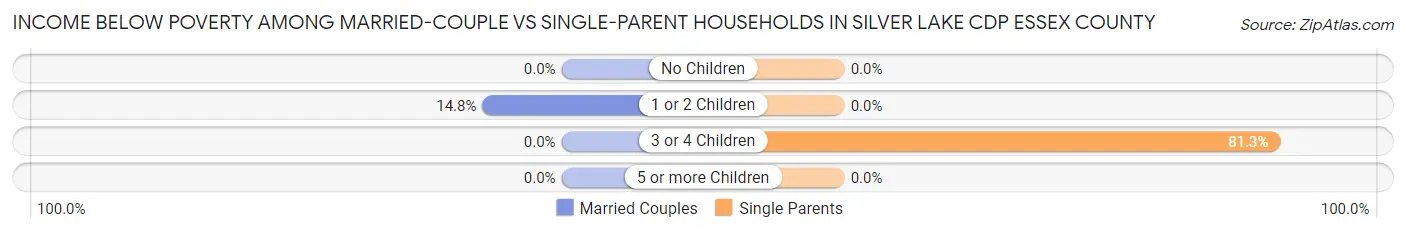
| Children | Married-Couple Families | Single-Parent Households |
| No Children | 0 (0.0%) | 0 (0.0%) |
| 1 or 2 Children | 59 (14.7%) | 0 (0.0%) |
| 3 or 4 Children | 0 (0.0%) | 74 (81.3%) |
| 5 or more Children | 0 (0.0%) | 0 (0.0%) |
| Total | 59 (7.0%) | 74 (37.0%) |
Race in Silver Lake CDP Essex County
The most populous races in Silver Lake CDP Essex County are Hispanic or Latino (2,184 | 49.6%), White / Caucasian (1,887 | 42.8%), and Some other Race (903 | 20.5%).
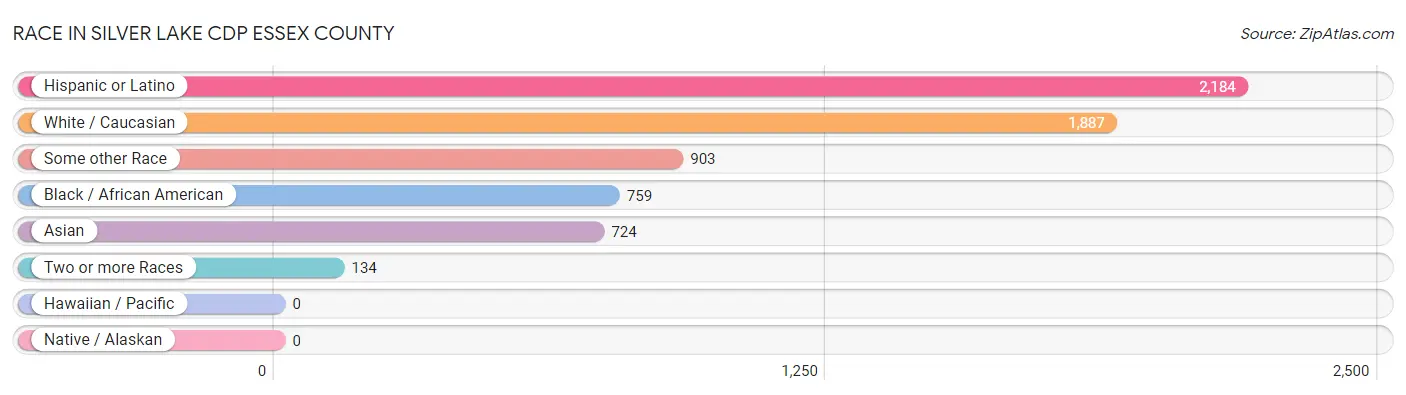
| Race | # Population | % Population |
| Asian | 724 | 16.4% |
| Black / African American | 759 | 17.2% |
| Hawaiian / Pacific | 0 | 0.0% |
| Hispanic or Latino | 2,184 | 49.6% |
| Native / Alaskan | 0 | 0.0% |
| White / Caucasian | 1,887 | 42.8% |
| Two or more Races | 134 | 3.0% |
| Some other Race | 903 | 20.5% |
| Total | 4,407 | 100.0% |
Ancestry in Silver Lake CDP Essex County
The most populous ancestries reported in Silver Lake CDP Essex County are South American (1,687 | 38.3%), Ecuadorian (1,172 | 26.6%), Korean (524 | 11.9%), Italian (350 | 7.9%), and Argentinean (315 | 7.1%), together accounting for 91.9% of all Silver Lake CDP Essex County residents.
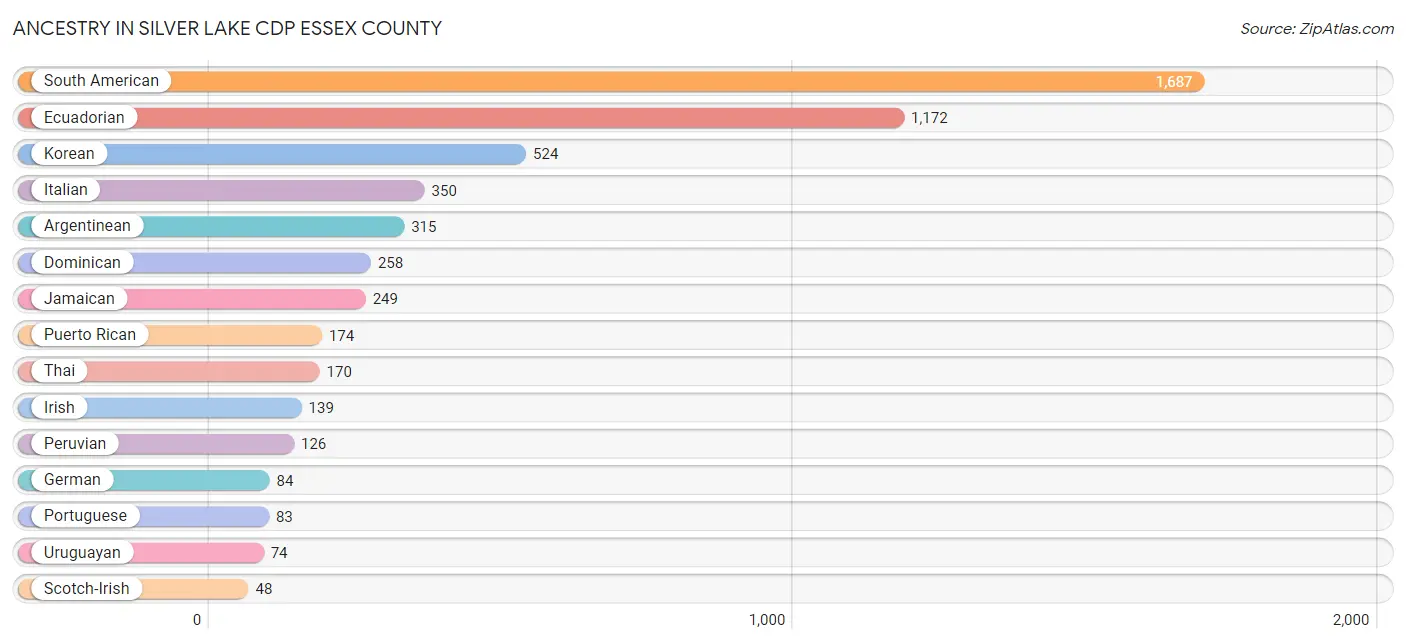
| Ancestry | # Population | % Population |
| Argentinean | 315 | 7.1% |
| Brazilian | 8 | 0.2% |
| Dominican | 258 | 5.9% |
| Ecuadorian | 1,172 | 26.6% |
| German | 84 | 1.9% |
| Indian (Asian) | 30 | 0.7% |
| Irish | 139 | 3.2% |
| Italian | 350 | 7.9% |
| Jamaican | 249 | 5.7% |
| Korean | 524 | 11.9% |
| Mexican | 23 | 0.5% |
| Peruvian | 126 | 2.9% |
| Portuguese | 83 | 1.9% |
| Puerto Rican | 174 | 4.0% |
| Scotch-Irish | 48 | 1.1% |
| South American | 1,687 | 38.3% |
| Thai | 170 | 3.9% |
| Uruguayan | 74 | 1.7% | View All 18 Rows |
Immigrants in Silver Lake CDP Essex County
The most numerous immigrant groups reported in Silver Lake CDP Essex County came from Latin America (1,376 | 31.2%), South America (945 | 21.4%), Ecuador (678 | 15.4%), Asia (488 | 11.1%), and Caribbean (408 | 9.3%), together accounting for 88.4% of all Silver Lake CDP Essex County residents.
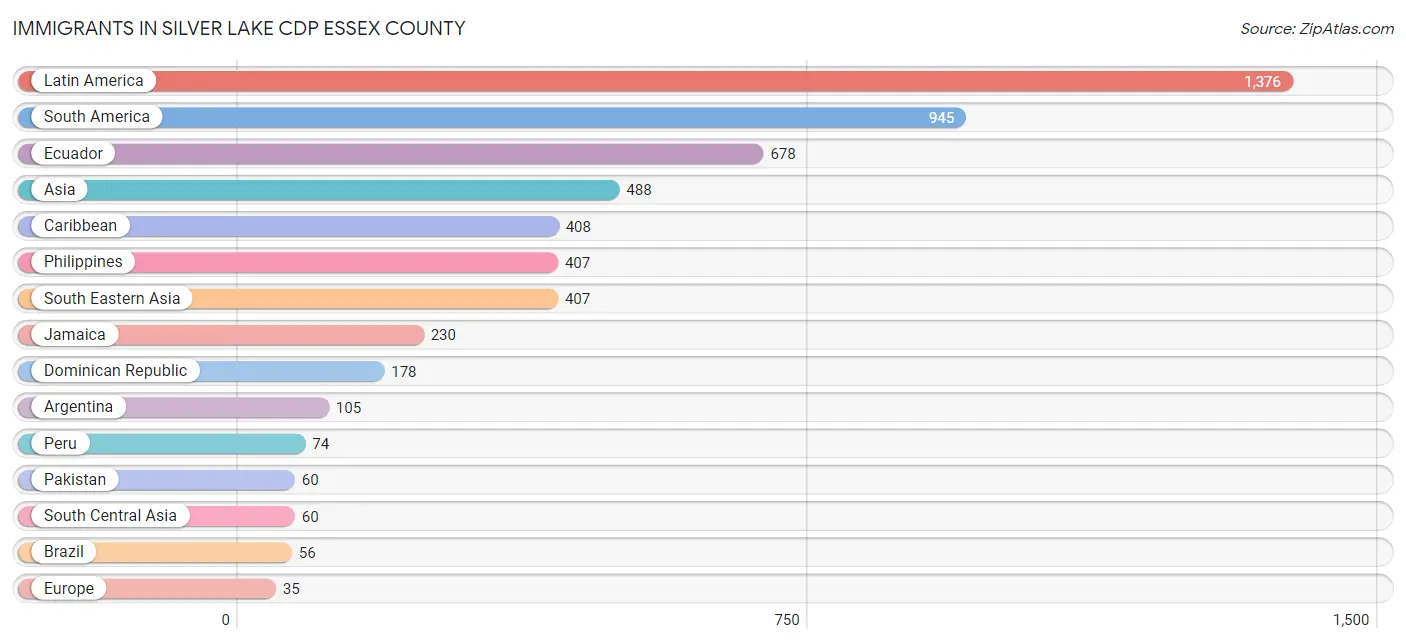
| Immigration Origin | # Population | % Population |
| Argentina | 105 | 2.4% |
| Asia | 488 | 11.1% |
| Brazil | 56 | 1.3% |
| Caribbean | 408 | 9.3% |
| Central America | 23 | 0.5% |
| China | 21 | 0.5% |
| Dominican Republic | 178 | 4.0% |
| Eastern Asia | 21 | 0.5% |
| Ecuador | 678 | 15.4% |
| Europe | 35 | 0.8% |
| Guyana | 11 | 0.3% |
| Jamaica | 230 | 5.2% |
| Latin America | 1,376 | 31.2% |
| Mexico | 23 | 0.5% |
| Northern Europe | 25 | 0.6% |
| Pakistan | 60 | 1.4% |
| Peru | 74 | 1.7% |
| Philippines | 407 | 9.2% |
| Portugal | 10 | 0.2% |
| South America | 945 | 21.4% |
| South Central Asia | 60 | 1.4% |
| South Eastern Asia | 407 | 9.2% |
| Southern Europe | 10 | 0.2% |
| Uruguay | 21 | 0.5% | View All 24 Rows |
Sex and Age in Silver Lake CDP Essex County
Sex and Age in Silver Lake CDP Essex County
The most populous age groups in Silver Lake CDP Essex County are 60 to 64 Years (320 | 16.0%) for men and 20 to 24 Years (270 | 11.2%) for women.
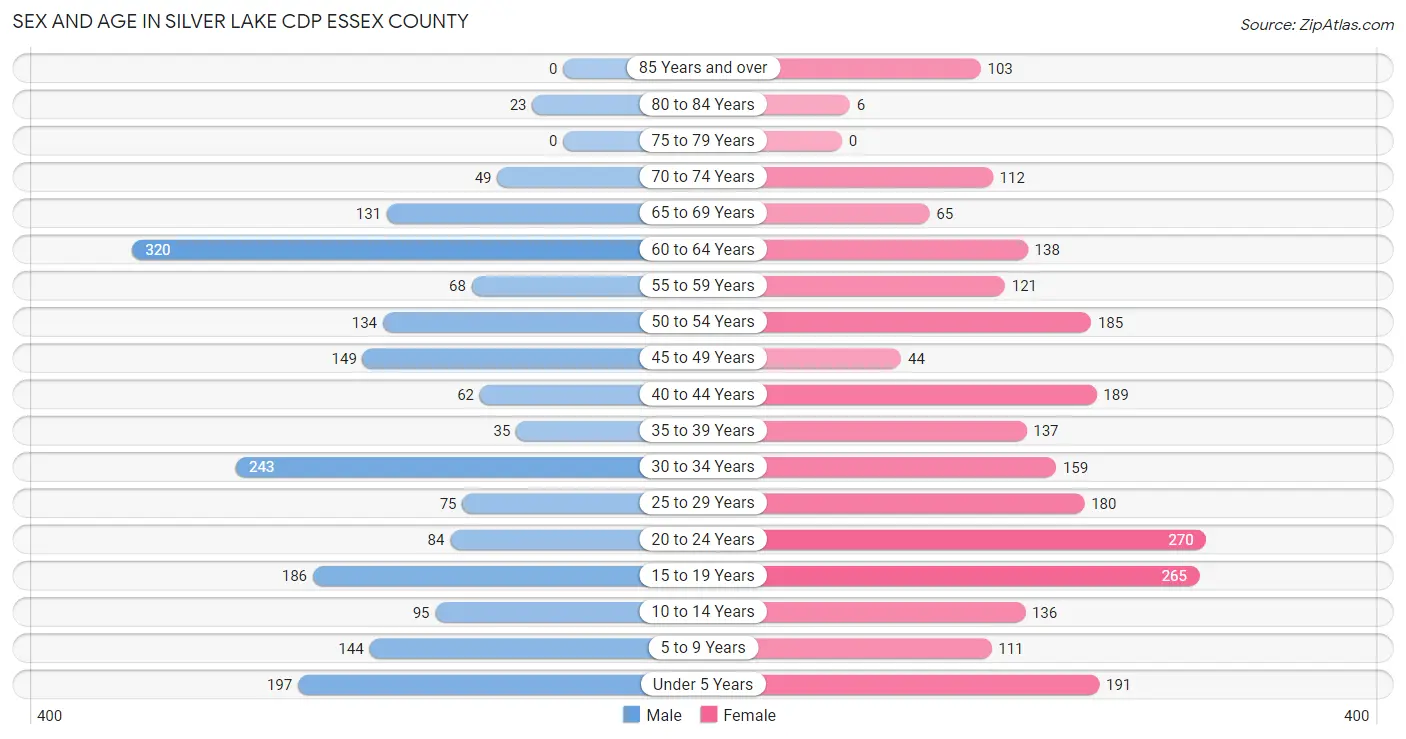
| Age Bracket | Male | Female |
| Under 5 Years | 197 (9.9%) | 191 (7.9%) |
| 5 to 9 Years | 144 (7.2%) | 111 (4.6%) |
| 10 to 14 Years | 95 (4.8%) | 136 (5.6%) |
| 15 to 19 Years | 186 (9.3%) | 265 (11.0%) |
| 20 to 24 Years | 84 (4.2%) | 270 (11.2%) |
| 25 to 29 Years | 75 (3.8%) | 180 (7.5%) |
| 30 to 34 Years | 243 (12.2%) | 159 (6.6%) |
| 35 to 39 Years | 35 (1.8%) | 137 (5.7%) |
| 40 to 44 Years | 62 (3.1%) | 189 (7.8%) |
| 45 to 49 Years | 149 (7.5%) | 44 (1.8%) |
| 50 to 54 Years | 134 (6.7%) | 185 (7.7%) |
| 55 to 59 Years | 68 (3.4%) | 121 (5.0%) |
| 60 to 64 Years | 320 (16.0%) | 138 (5.7%) |
| 65 to 69 Years | 131 (6.6%) | 65 (2.7%) |
| 70 to 74 Years | 49 (2.5%) | 112 (4.6%) |
| 75 to 79 Years | 0 (0.0%) | 0 (0.0%) |
| 80 to 84 Years | 23 (1.1%) | 6 (0.3%) |
| 85 Years and over | 0 (0.0%) | 103 (4.3%) |
| Total | 1,995 (100.0%) | 2,412 (100.0%) |
Families and Households in Silver Lake CDP Essex County
Median Family Size in Silver Lake CDP Essex County
The median family size in Silver Lake CDP Essex County is 3.78 persons per family, with single female/mother families (116 | 11.1%) accounting for the largest median family size of 4.93 persons per family. On the other hand, single male/father families (84 | 8.1%) represent the smallest median family size with 2.61 persons per family.
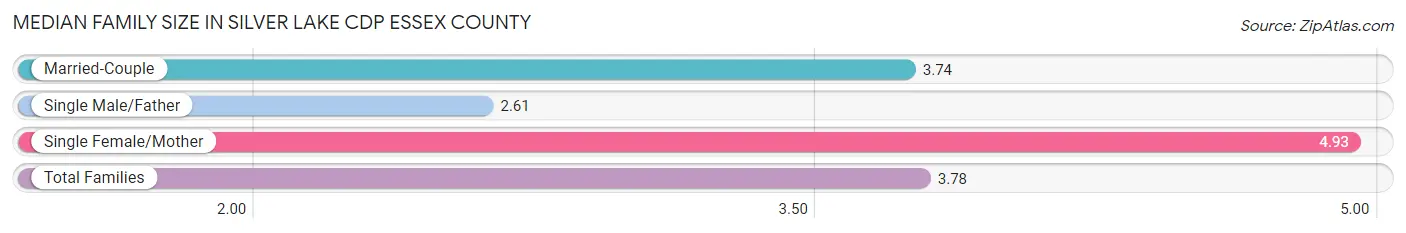
| Family Type | # Families | Family Size |
| Married-Couple | 843 (80.8%) | 3.74 |
| Single Male/Father | 84 (8.1%) | 2.61 |
| Single Female/Mother | 116 (11.1%) | 4.93 |
| Total Families | 1,043 (100.0%) | 3.78 |
Median Household Size in Silver Lake CDP Essex County
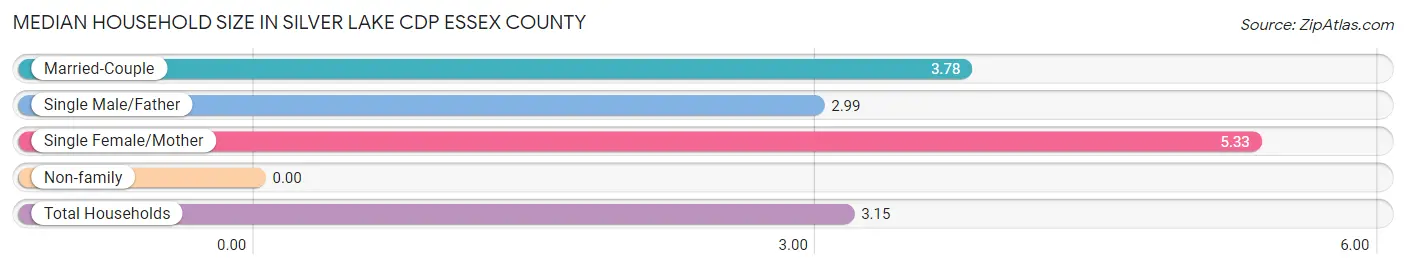
| Household Type | # Households | Household Size |
| Married-Couple | 843 (60.3%) | 3.78 |
| Single Male/Father | 84 (6.0%) | 2.99 |
| Single Female/Mother | 116 (8.3%) | 5.33 |
| Non-family | 355 (25.4%) | - |
| Total Households | 1,398 (100.0%) | 3.15 |
Household Size by Marriage Status in Silver Lake CDP Essex County
Out of a total of 1,398 households in Silver Lake CDP Essex County, 1,043 (74.6%) are family households, while 355 (25.4%) are nonfamily households. The most numerous type of family households are 2-person households, comprising 365, and the most common type of nonfamily households are 1-person households, comprising 355.
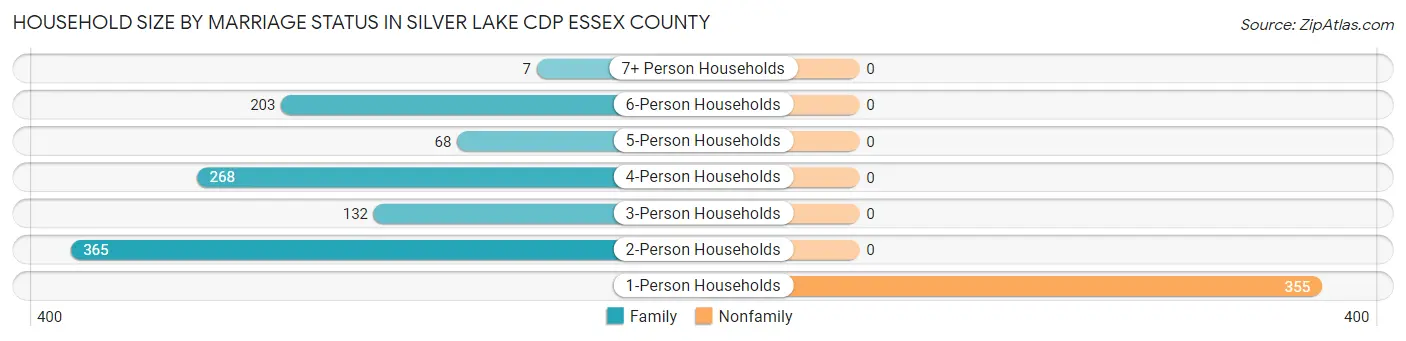
| Household Size | Family Households | Nonfamily Households |
| 1-Person Households | - | 355 (25.4%) |
| 2-Person Households | 365 (26.1%) | 0 (0.0%) |
| 3-Person Households | 132 (9.4%) | 0 (0.0%) |
| 4-Person Households | 268 (19.2%) | 0 (0.0%) |
| 5-Person Households | 68 (4.9%) | 0 (0.0%) |
| 6-Person Households | 203 (14.5%) | 0 (0.0%) |
| 7+ Person Households | 7 (0.5%) | 0 (0.0%) |
| Total | 1,043 (74.6%) | 355 (25.4%) |
Female Fertility in Silver Lake CDP Essex County
Fertility by Age in Silver Lake CDP Essex County
Average fertility rate in Silver Lake CDP Essex County is 68.0 births per 1,000 women. Women in the age bracket of 20 to 34 years have the highest fertility rate with 151.0 births per 1,000 women. Women in the age bracket of 20 to 34 years acount for 100.0% of all women with births.
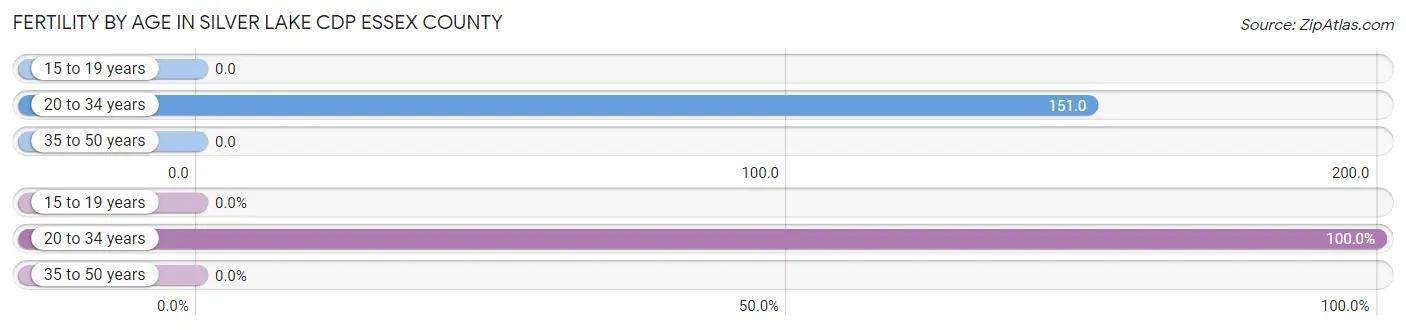
| Age Bracket | Women with Births | Births / 1,000 Women |
| 15 to 19 years | 0 (0.0%) | 0.0 |
| 20 to 34 years | 92 (100.0%) | 151.0 |
| 35 to 50 years | 0 (0.0%) | 0.0 |
| Total | 92 (100.0%) | 68.0 |
Fertility by Age by Marriage Status in Silver Lake CDP Essex County
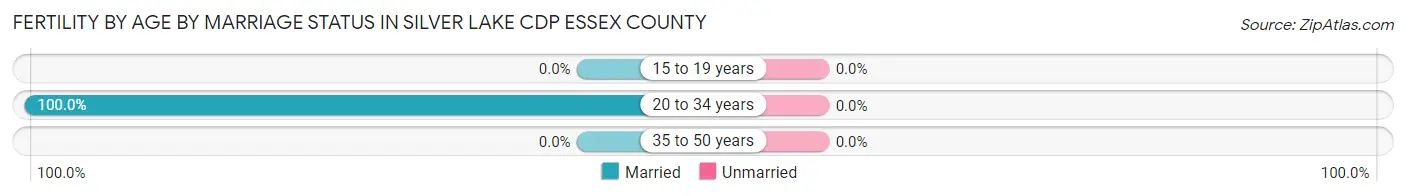
| Age Bracket | Married | Unmarried |
| 15 to 19 years | 0 (0.0%) | 0 (0.0%) |
| 20 to 34 years | 92 (100.0%) | 0 (0.0%) |
| 35 to 50 years | 0 (0.0%) | 0 (0.0%) |
| Total | 92 (100.0%) | 0 (0.0%) |
Fertility by Education in Silver Lake CDP Essex County
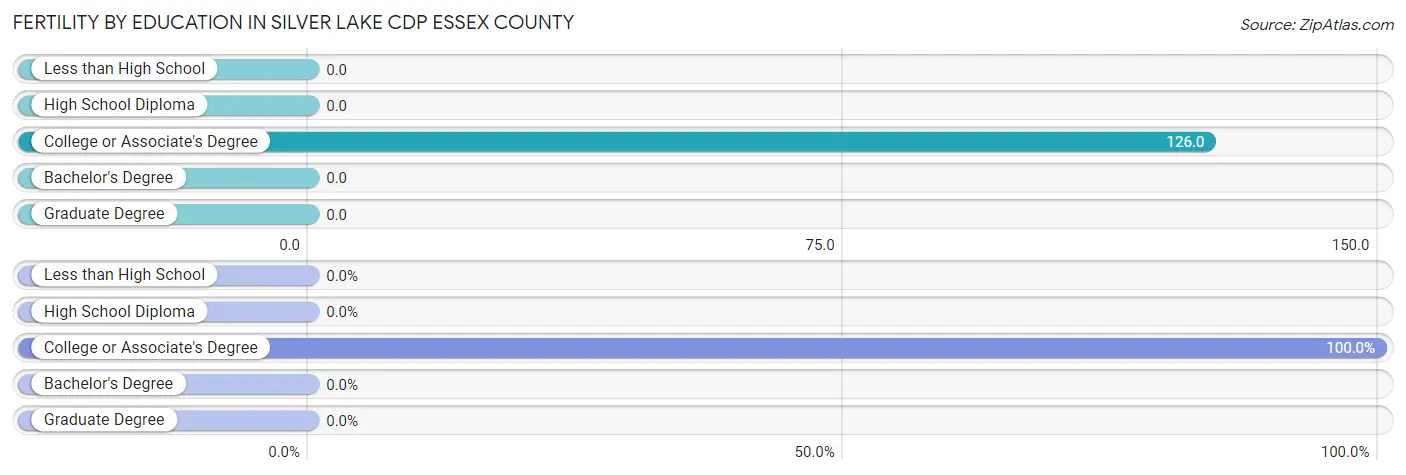
| Educational Attainment | Women with Births | Births / 1,000 Women |
| Less than High School | 0 (0.0%) | 0.0 |
| High School Diploma | 0 (0.0%) | 0.0 |
| College or Associate's Degree | 92 (100.0%) | 126.0 |
| Bachelor's Degree | 0 (0.0%) | 0.0 |
| Graduate Degree | 0 (0.0%) | 0.0 |
| Total | 92 (100.0%) | 68.0 |
Fertility by Education by Marriage Status in Silver Lake CDP Essex County
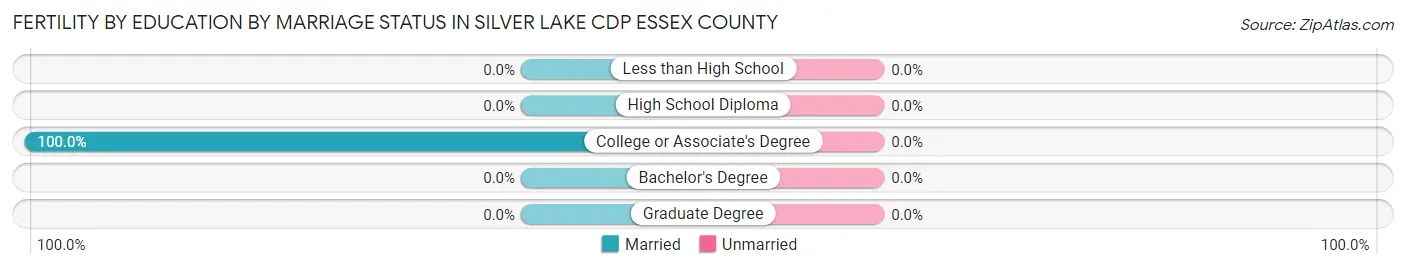
| Educational Attainment | Married | Unmarried |
| Less than High School | 0 (0.0%) | 0 (0.0%) |
| High School Diploma | 0 (0.0%) | 0 (0.0%) |
| College or Associate's Degree | 92 (100.0%) | 0 (0.0%) |
| Bachelor's Degree | 0 (0.0%) | 0 (0.0%) |
| Graduate Degree | 0 (0.0%) | 0 (0.0%) |
| Total | 92 (100.0%) | 0 (0.0%) |
Employment Characteristics in Silver Lake CDP Essex County
Employment by Class of Employer in Silver Lake CDP Essex County
Among the 1,838 employed individuals in Silver Lake CDP Essex County, private company employees (1,311 | 71.3%), self-employed (incorporated) (210 | 11.4%), and local government employees (94 | 5.1%) make up the most common classes of employment.
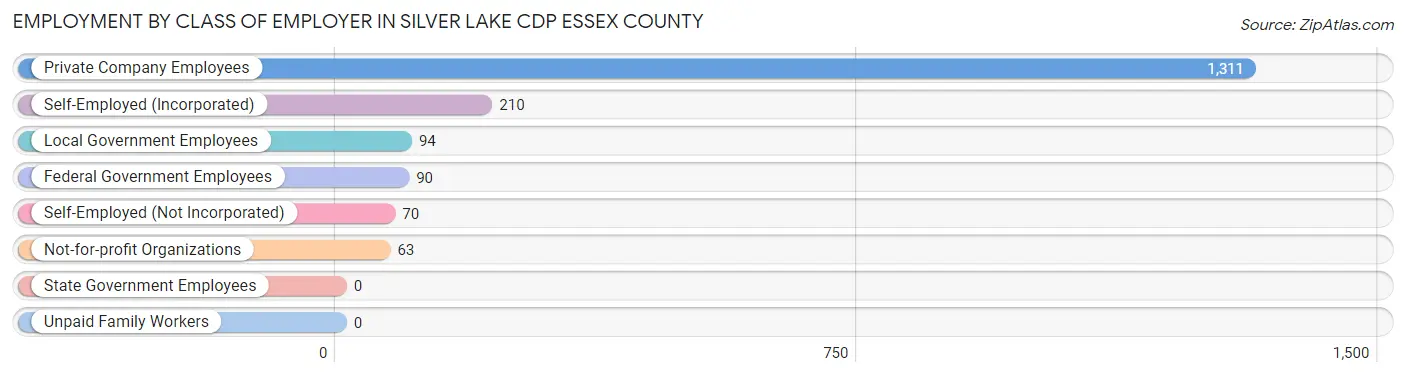
| Employer Class | # Employees | % Employees |
| Private Company Employees | 1,311 | 71.3% |
| Self-Employed (Incorporated) | 210 | 11.4% |
| Self-Employed (Not Incorporated) | 70 | 3.8% |
| Not-for-profit Organizations | 63 | 3.4% |
| Local Government Employees | 94 | 5.1% |
| State Government Employees | 0 | 0.0% |
| Federal Government Employees | 90 | 4.9% |
| Unpaid Family Workers | 0 | 0.0% |
| Total | 1,838 | 100.0% |
Employment Status by Age in Silver Lake CDP Essex County
According to the labor force statistics for Silver Lake CDP Essex County, out of the total population over 16 years of age (3,524), 57.9% or 2,040 individuals are in the labor force, with 3.2% or 65 of them unemployed. The age group with the highest labor force participation rate is 25 to 29 years, with 100.0% or 255 individuals in the labor force. Within the labor force, the 35 to 44 years age range has the highest percentage of unemployed individuals, with 13.8% or 35 of them being unemployed.
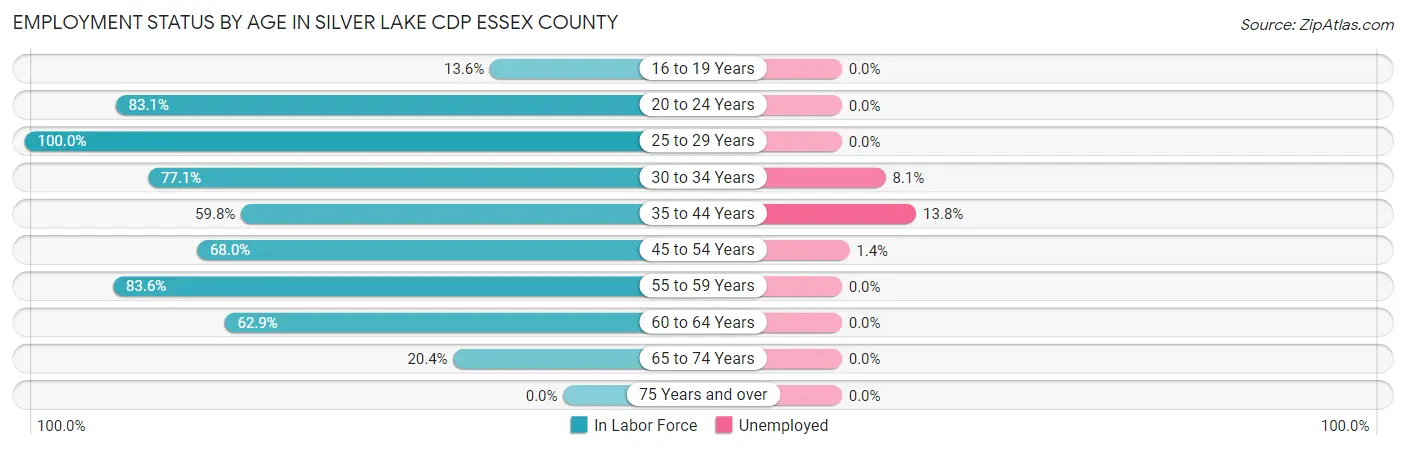
| Age Bracket | In Labor Force | Unemployed |
| 16 to 19 Years | 60 (13.6%) | 0 (0.0%) |
| 20 to 24 Years | 294 (83.1%) | 0 (0.0%) |
| 25 to 29 Years | 255 (100.0%) | 0 (0.0%) |
| 30 to 34 Years | 310 (77.1%) | 25 (8.1%) |
| 35 to 44 Years | 253 (59.8%) | 35 (13.8%) |
| 45 to 54 Years | 348 (68.0%) | 5 (1.4%) |
| 55 to 59 Years | 158 (83.6%) | 0 (0.0%) |
| 60 to 64 Years | 288 (62.9%) | 0 (0.0%) |
| 65 to 74 Years | 73 (20.4%) | 0 (0.0%) |
| 75 Years and over | 0 (0.0%) | 0 (0.0%) |
| Total | 2,040 (57.9%) | 65 (3.2%) |
Employment Status by Educational Attainment in Silver Lake CDP Essex County
According to labor force statistics for Silver Lake CDP Essex County, 72.0% of individuals (1,612) out of the total population between 25 and 64 years of age (2,239) are in the labor force, with 4.0% or 64 of them being unemployed. The group with the highest labor force participation rate are those with the educational attainment of bachelor's degree or higher, with 95.0% or 399 individuals in the labor force. Within the labor force, individuals with bachelor's degree or higher education have the highest percentage of unemployment, with 8.8% or 35 of them being unemployed.
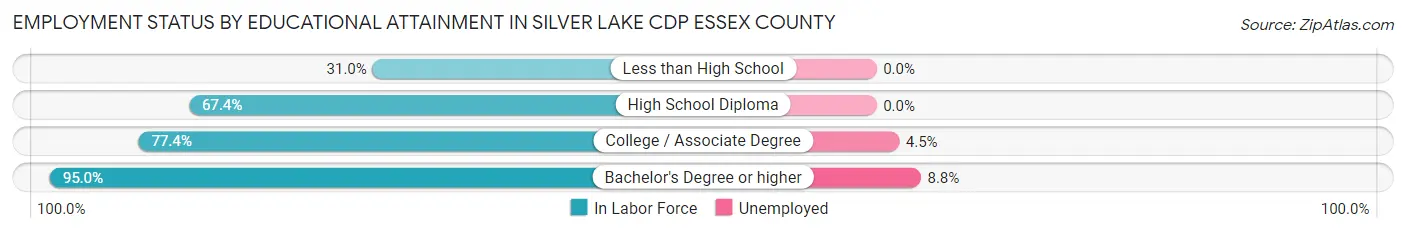
| Educational Attainment | In Labor Force | Unemployed |
| Less than High School | 84 (31.0%) | 0 (0.0%) |
| High School Diploma | 466 (67.4%) | 0 (0.0%) |
| College / Associate Degree | 663 (77.4%) | 39 (4.5%) |
| Bachelor's Degree or higher | 399 (95.0%) | 37 (8.8%) |
| Total | 1,612 (72.0%) | 90 (4.0%) |
Employment Occupations by Sex in Silver Lake CDP Essex County
Management, Business, Science and Arts Occupations
The most common Management, Business, Science and Arts occupations in Silver Lake CDP Essex County are Management (191 | 9.7%), Community & Social Service (182 | 9.2%), Health Diagnosing & Treating (125 | 6.3%), Arts, Media & Entertainment (105 | 5.3%), and Health Technologists (104 | 5.3%).
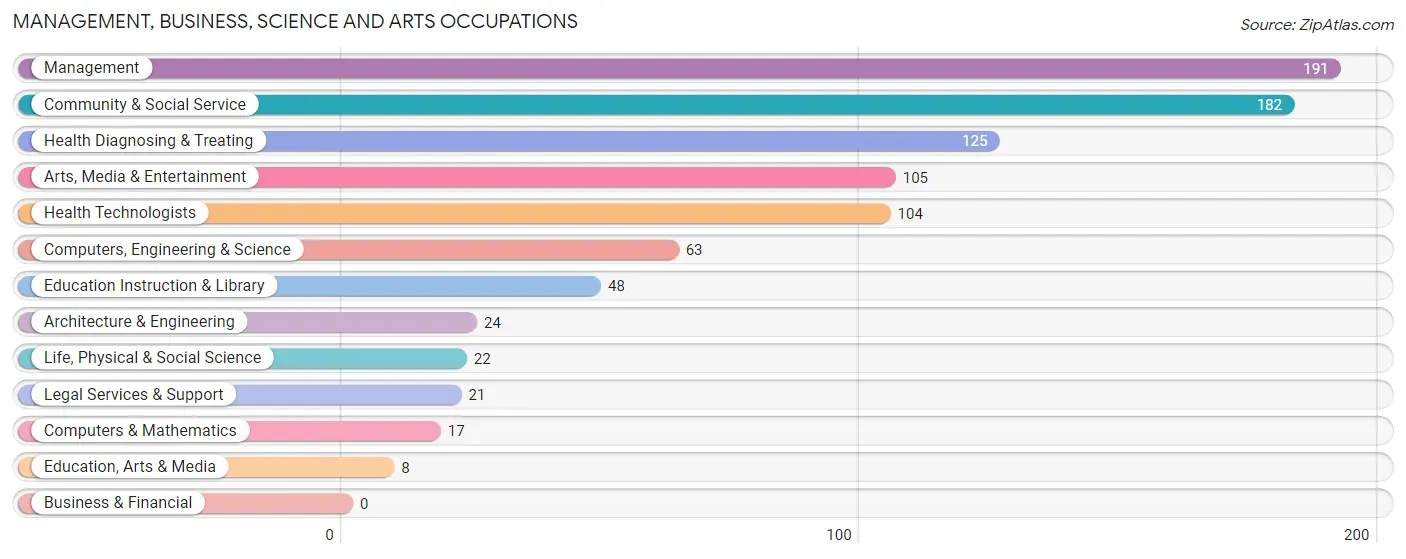
Management, Business, Science and Arts Occupations by Sex
Within the Management, Business, Science and Arts occupations in Silver Lake CDP Essex County, the most male-oriented occupations are Life, Physical & Social Science (100.0%), Arts, Media & Entertainment (100.0%), and Health Technologists (91.3%), while the most female-oriented occupations are Architecture & Engineering (100.0%), Education, Arts & Media (100.0%), and Legal Services & Support (100.0%).
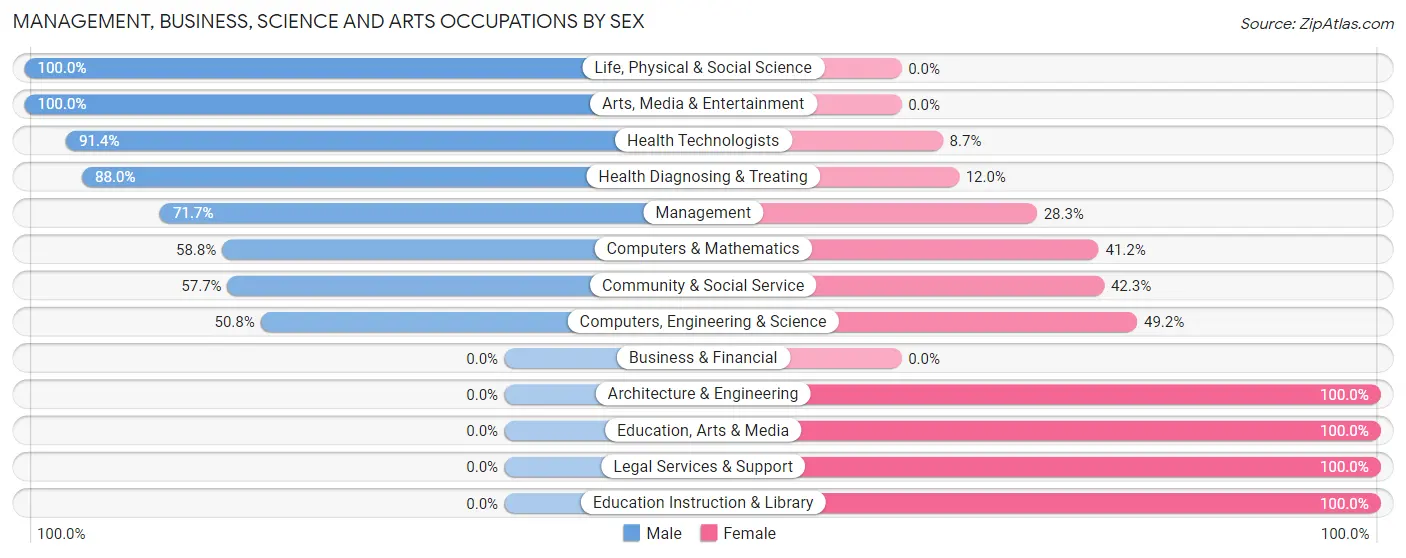
| Occupation | Male | Female |
| Management | 137 (71.7%) | 54 (28.3%) |
| Business & Financial | 0 (0.0%) | 0 (0.0%) |
| Computers, Engineering & Science | 32 (50.8%) | 31 (49.2%) |
| Computers & Mathematics | 10 (58.8%) | 7 (41.2%) |
| Architecture & Engineering | 0 (0.0%) | 24 (100.0%) |
| Life, Physical & Social Science | 22 (100.0%) | 0 (0.0%) |
| Community & Social Service | 105 (57.7%) | 77 (42.3%) |
| Education, Arts & Media | 0 (0.0%) | 8 (100.0%) |
| Legal Services & Support | 0 (0.0%) | 21 (100.0%) |
| Education Instruction & Library | 0 (0.0%) | 48 (100.0%) |
| Arts, Media & Entertainment | 105 (100.0%) | 0 (0.0%) |
| Health Diagnosing & Treating | 110 (88.0%) | 15 (12.0%) |
| Health Technologists | 95 (91.3%) | 9 (8.6%) |
| Total (Category) | 384 (68.4%) | 177 (31.6%) |
| Total (Overall) | 988 (50.0%) | 986 (49.9%) |
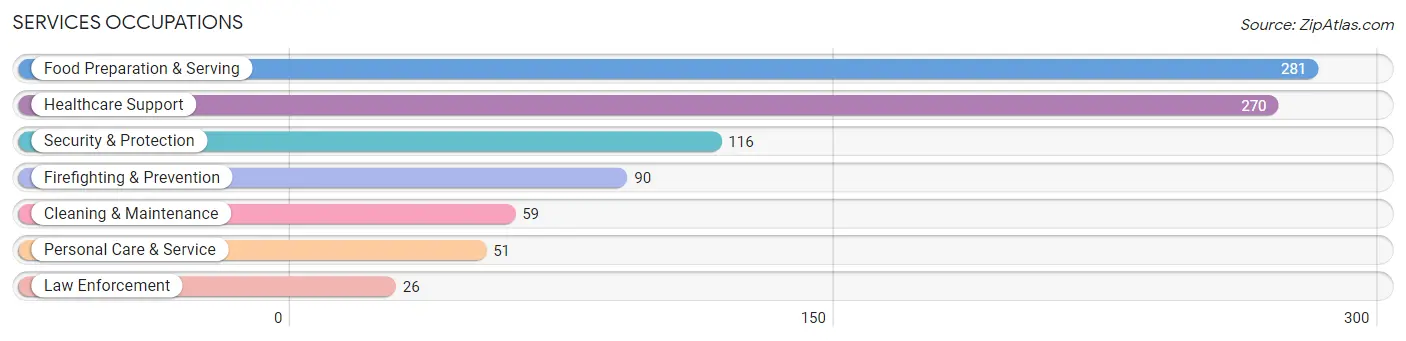
Services Occupations
The most common Services occupations in Silver Lake CDP Essex County are Food Preparation & Serving (281 | 14.2%), Healthcare Support (270 | 13.7%), Security & Protection (116 | 5.9%), Firefighting & Prevention (90 | 4.6%), and Cleaning & Maintenance (59 | 3.0%).
Services Occupations by Sex
Within the Services occupations in Silver Lake CDP Essex County, the most male-oriented occupations are Security & Protection (100.0%), Firefighting & Prevention (100.0%), and Law Enforcement (100.0%), while the most female-oriented occupations are Healthcare Support (100.0%), Personal Care & Service (100.0%), and Food Preparation & Serving (94.0%).
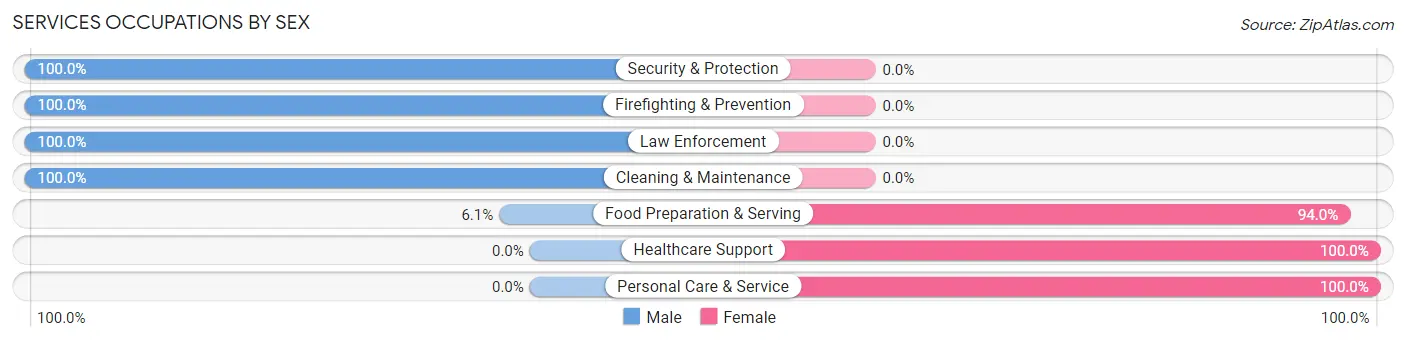
| Occupation | Male | Female |
| Healthcare Support | 0 (0.0%) | 270 (100.0%) |
| Security & Protection | 116 (100.0%) | 0 (0.0%) |
| Firefighting & Prevention | 90 (100.0%) | 0 (0.0%) |
| Law Enforcement | 26 (100.0%) | 0 (0.0%) |
| Food Preparation & Serving | 17 (6.0%) | 264 (94.0%) |
| Cleaning & Maintenance | 59 (100.0%) | 0 (0.0%) |
| Personal Care & Service | 0 (0.0%) | 51 (100.0%) |
| Total (Category) | 192 (24.7%) | 585 (75.3%) |
| Total (Overall) | 988 (50.0%) | 986 (49.9%) |
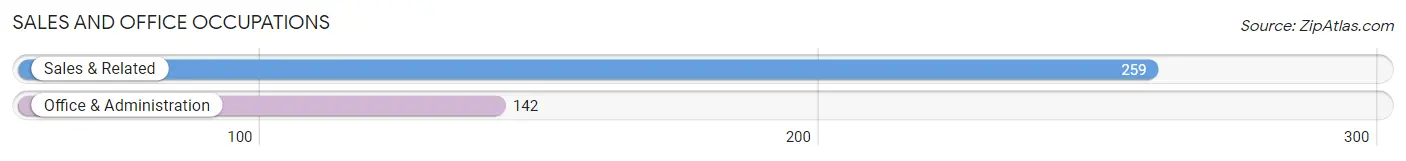
Sales and Office Occupations
The most common Sales and Office occupations in Silver Lake CDP Essex County are Sales & Related (259 | 13.1%), and Office & Administration (142 | 7.2%).
Sales and Office Occupations by Sex
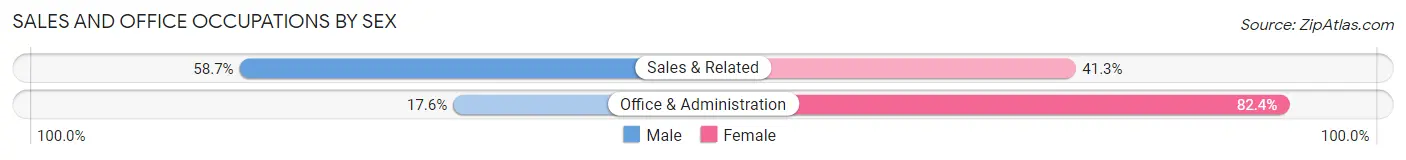
| Occupation | Male | Female |
| Sales & Related | 152 (58.7%) | 107 (41.3%) |
| Office & Administration | 25 (17.6%) | 117 (82.4%) |
| Total (Category) | 177 (44.1%) | 224 (55.9%) |
| Total (Overall) | 988 (50.0%) | 986 (49.9%) |
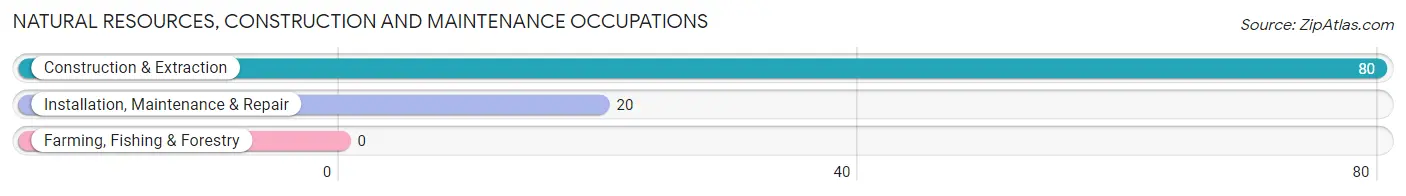
Natural Resources, Construction and Maintenance Occupations
The most common Natural Resources, Construction and Maintenance occupations in Silver Lake CDP Essex County are Construction & Extraction (80 | 4.1%), and Installation, Maintenance & Repair (20 | 1.0%).
Natural Resources, Construction and Maintenance Occupations by Sex
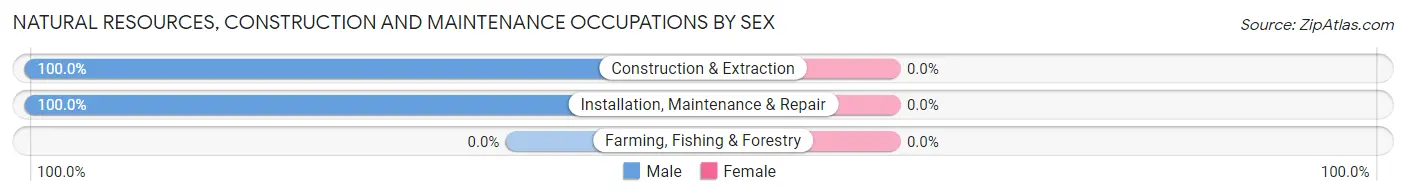
| Occupation | Male | Female |
| Farming, Fishing & Forestry | 0 (0.0%) | 0 (0.0%) |
| Construction & Extraction | 80 (100.0%) | 0 (0.0%) |
| Installation, Maintenance & Repair | 20 (100.0%) | 0 (0.0%) |
| Total (Category) | 100 (100.0%) | 0 (0.0%) |
| Total (Overall) | 988 (50.0%) | 986 (49.9%) |
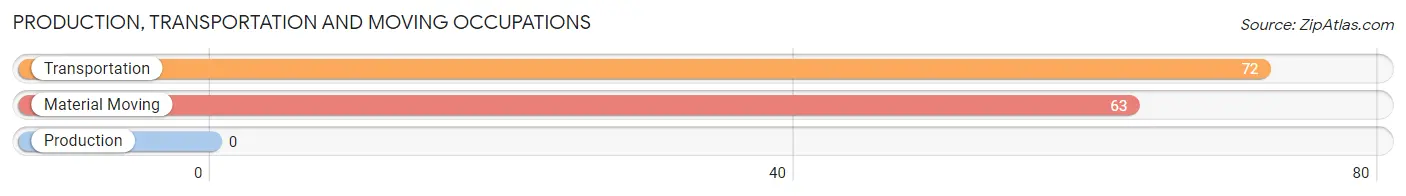
Production, Transportation and Moving Occupations
The most common Production, Transportation and Moving occupations in Silver Lake CDP Essex County are Transportation (72 | 3.6%), and Material Moving (63 | 3.2%).
Production, Transportation and Moving Occupations by Sex
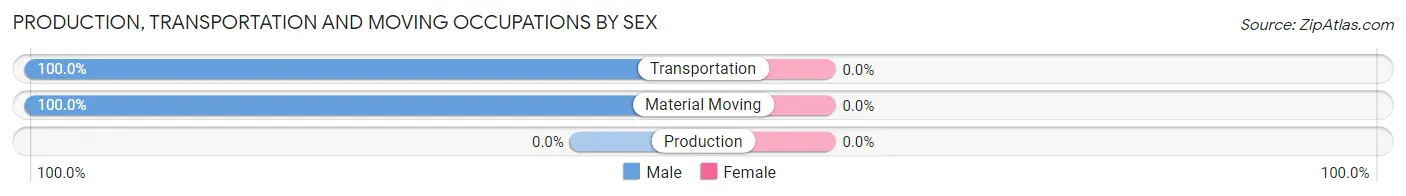
| Occupation | Male | Female |
| Production | 0 (0.0%) | 0 (0.0%) |
| Transportation | 72 (100.0%) | 0 (0.0%) |
| Material Moving | 63 (100.0%) | 0 (0.0%) |
| Total (Category) | 135 (100.0%) | 0 (0.0%) |
| Total (Overall) | 988 (50.0%) | 986 (49.9%) |
Employment Industries by Sex in Silver Lake CDP Essex County
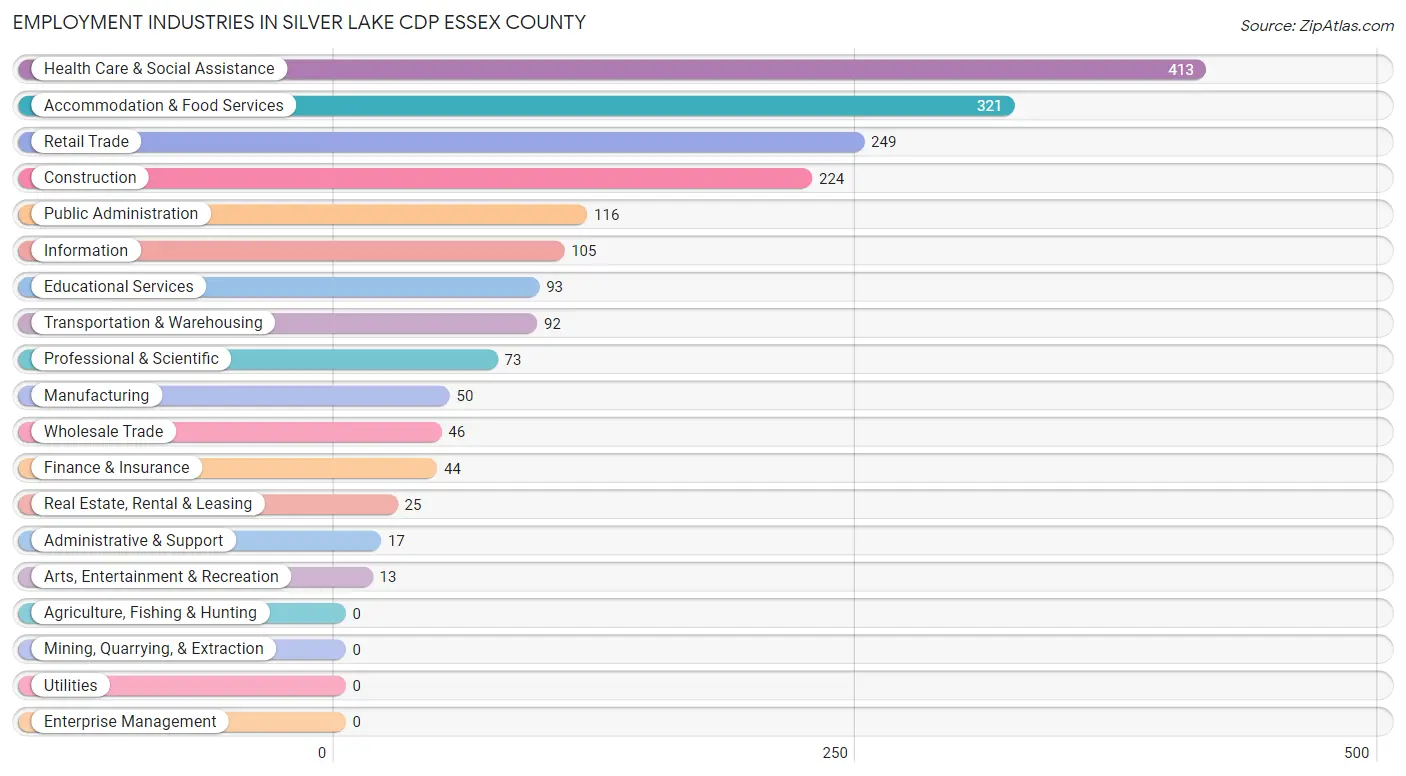
Employment Industries in Silver Lake CDP Essex County
The major employment industries in Silver Lake CDP Essex County include Health Care & Social Assistance (413 | 20.9%), Accommodation & Food Services (321 | 16.3%), Retail Trade (249 | 12.6%), Construction (224 | 11.4%), and Public Administration (116 | 5.9%).
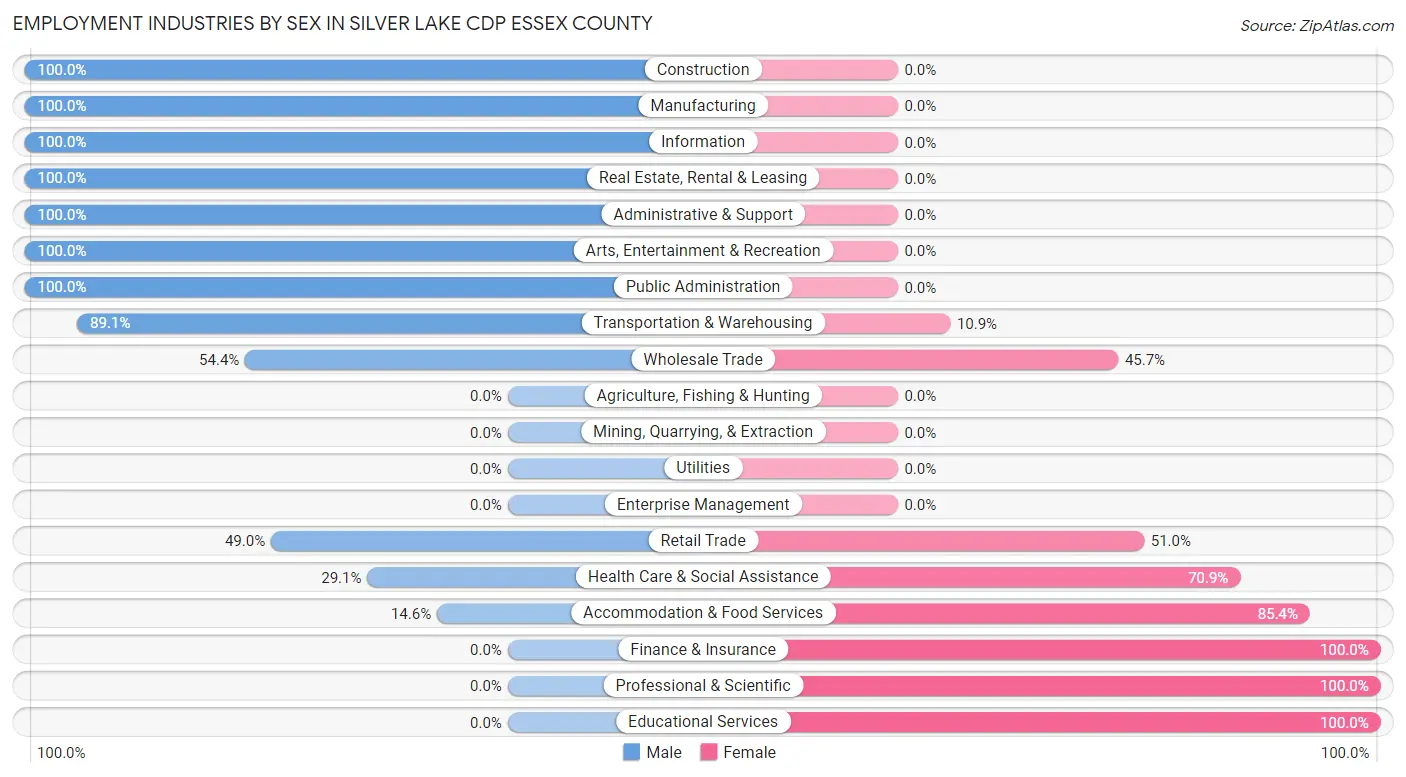
Employment Industries by Sex in Silver Lake CDP Essex County
The Silver Lake CDP Essex County industries that see more men than women are Construction (100.0%), Manufacturing (100.0%), and Information (100.0%), whereas the industries that tend to have a higher number of women are Finance & Insurance (100.0%), Professional & Scientific (100.0%), and Educational Services (100.0%).
| Industry | Male | Female |
| Agriculture, Fishing & Hunting | 0 (0.0%) | 0 (0.0%) |
| Mining, Quarrying, & Extraction | 0 (0.0%) | 0 (0.0%) |
| Construction | 224 (100.0%) | 0 (0.0%) |
| Manufacturing | 50 (100.0%) | 0 (0.0%) |
| Wholesale Trade | 25 (54.3%) | 21 (45.7%) |
| Retail Trade | 122 (49.0%) | 127 (51.0%) |
| Transportation & Warehousing | 82 (89.1%) | 10 (10.9%) |
| Utilities | 0 (0.0%) | 0 (0.0%) |
| Information | 105 (100.0%) | 0 (0.0%) |
| Finance & Insurance | 0 (0.0%) | 44 (100.0%) |
| Real Estate, Rental & Leasing | 25 (100.0%) | 0 (0.0%) |
| Professional & Scientific | 0 (0.0%) | 73 (100.0%) |
| Enterprise Management | 0 (0.0%) | 0 (0.0%) |
| Administrative & Support | 17 (100.0%) | 0 (0.0%) |
| Educational Services | 0 (0.0%) | 93 (100.0%) |
| Health Care & Social Assistance | 120 (29.1%) | 293 (70.9%) |
| Arts, Entertainment & Recreation | 13 (100.0%) | 0 (0.0%) |
| Accommodation & Food Services | 47 (14.6%) | 274 (85.4%) |
| Public Administration | 116 (100.0%) | 0 (0.0%) |
| Total | 988 (50.0%) | 986 (49.9%) |
Education in Silver Lake CDP Essex County
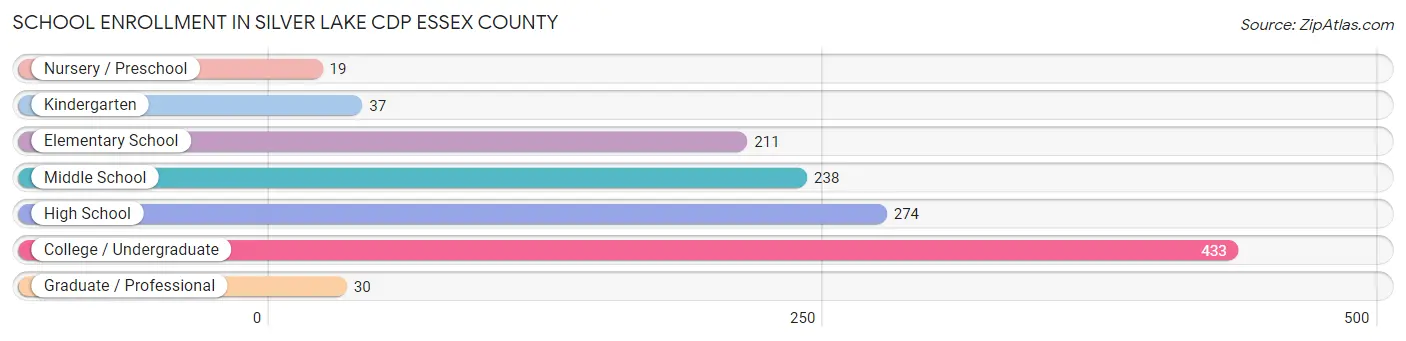
School Enrollment in Silver Lake CDP Essex County
The most common levels of schooling among the 1,242 students in Silver Lake CDP Essex County are college / undergraduate (433 | 34.9%), high school (274 | 22.1%), and middle school (238 | 19.2%).
| School Level | # Students | % Students |
| Nursery / Preschool | 19 | 1.5% |
| Kindergarten | 37 | 3.0% |
| Elementary School | 211 | 17.0% |
| Middle School | 238 | 19.2% |
| High School | 274 | 22.1% |
| College / Undergraduate | 433 | 34.9% |
| Graduate / Professional | 30 | 2.4% |
| Total | 1,242 | 100.0% |
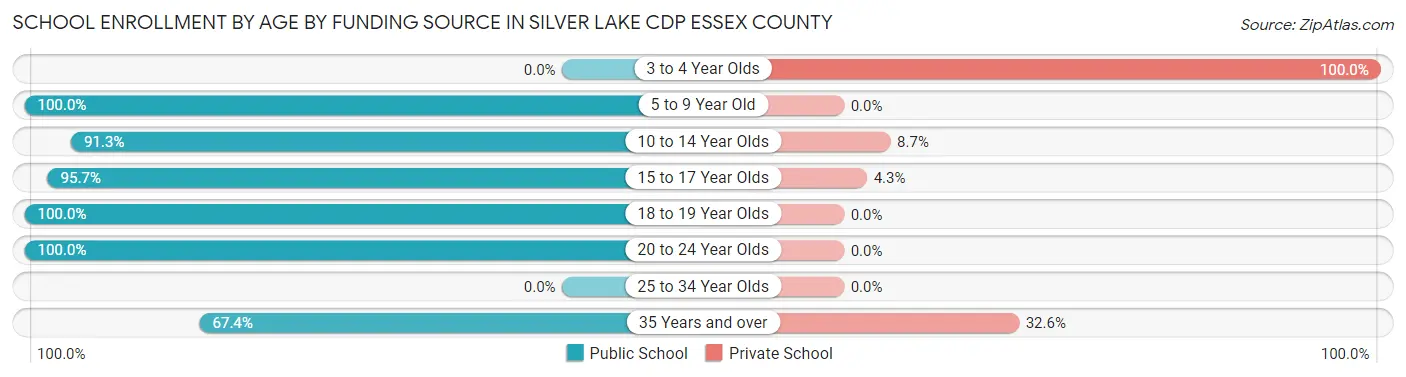
School Enrollment by Age by Funding Source in Silver Lake CDP Essex County
Out of a total of 1,242 students who are enrolled in schools in Silver Lake CDP Essex County, 78 (6.3%) attend a private institution, while the remaining 1,164 (93.7%) are enrolled in public schools. The age group of 3 to 4 year olds has the highest likelihood of being enrolled in private schools, with 19 (100.0% in the age bracket) enrolled. Conversely, the age group of 5 to 9 year old has the lowest likelihood of being enrolled in a private school, with 255 (100.0% in the age bracket) attending a public institution.
| Age Bracket | Public School | Private School |
| 3 to 4 Year Olds | 0 (0.0%) | 19 (100.0%) |
| 5 to 9 Year Old | 255 (100.0%) | 0 (0.0%) |
| 10 to 14 Year Olds | 211 (91.3%) | 20 (8.7%) |
| 15 to 17 Year Olds | 201 (95.7%) | 9 (4.3%) |
| 18 to 19 Year Olds | 88 (100.0%) | 0 (0.0%) |
| 20 to 24 Year Olds | 347 (100.0%) | 0 (0.0%) |
| 25 to 34 Year Olds | 0 (0.0%) | 0 (0.0%) |
| 35 Years and over | 62 (67.4%) | 30 (32.6%) |
| Total | 1,164 (93.7%) | 78 (6.3%) |
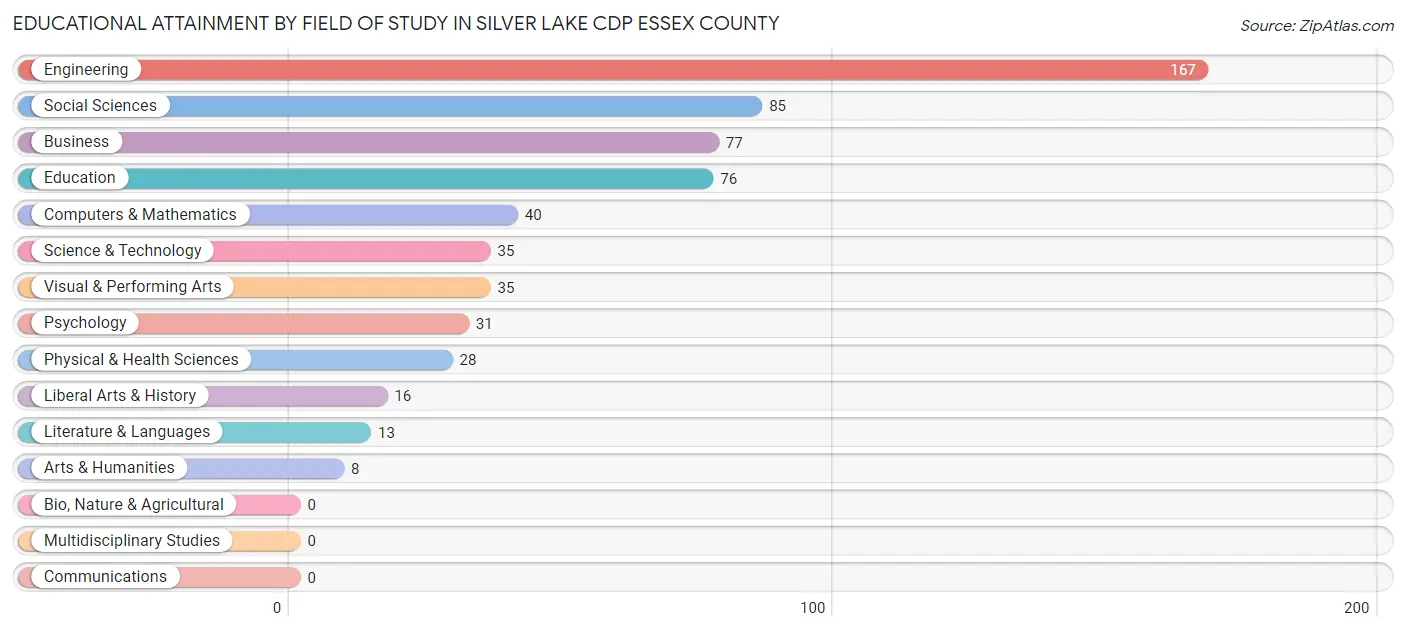
Educational Attainment by Field of Study in Silver Lake CDP Essex County
Engineering (167 | 27.3%), social sciences (85 | 13.9%), business (77 | 12.6%), education (76 | 12.4%), and computers & mathematics (40 | 6.6%) are the most common fields of study among 611 individuals in Silver Lake CDP Essex County who have obtained a bachelor's degree or higher.
| Field of Study | # Graduates | % Graduates |
| Computers & Mathematics | 40 | 6.6% |
| Bio, Nature & Agricultural | 0 | 0.0% |
| Physical & Health Sciences | 28 | 4.6% |
| Psychology | 31 | 5.1% |
| Social Sciences | 85 | 13.9% |
| Engineering | 167 | 27.3% |
| Multidisciplinary Studies | 0 | 0.0% |
| Science & Technology | 35 | 5.7% |
| Business | 77 | 12.6% |
| Education | 76 | 12.4% |
| Literature & Languages | 13 | 2.1% |
| Liberal Arts & History | 16 | 2.6% |
| Visual & Performing Arts | 35 | 5.7% |
| Communications | 0 | 0.0% |
| Arts & Humanities | 8 | 1.3% |
| Total | 611 | 100.0% |
Transportation & Commute in Silver Lake CDP Essex County
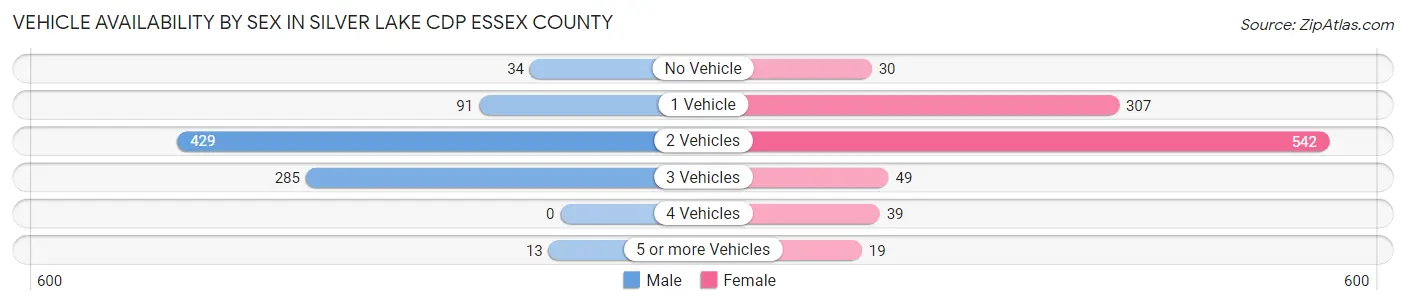
Vehicle Availability by Sex in Silver Lake CDP Essex County
The most prevalent vehicle ownership categories in Silver Lake CDP Essex County are males with 2 vehicles (429, accounting for 50.3%) and females with 2 vehicles (542, making up 43.5%).
| Vehicles Available | Male | Female |
| No Vehicle | 34 (4.0%) | 30 (3.0%) |
| 1 Vehicle | 91 (10.7%) | 307 (31.1%) |
| 2 Vehicles | 429 (50.3%) | 542 (55.0%) |
| 3 Vehicles | 285 (33.5%) | 49 (5.0%) |
| 4 Vehicles | 0 (0.0%) | 39 (4.0%) |
| 5 or more Vehicles | 13 (1.5%) | 19 (1.9%) |
| Total | 852 (100.0%) | 986 (100.0%) |
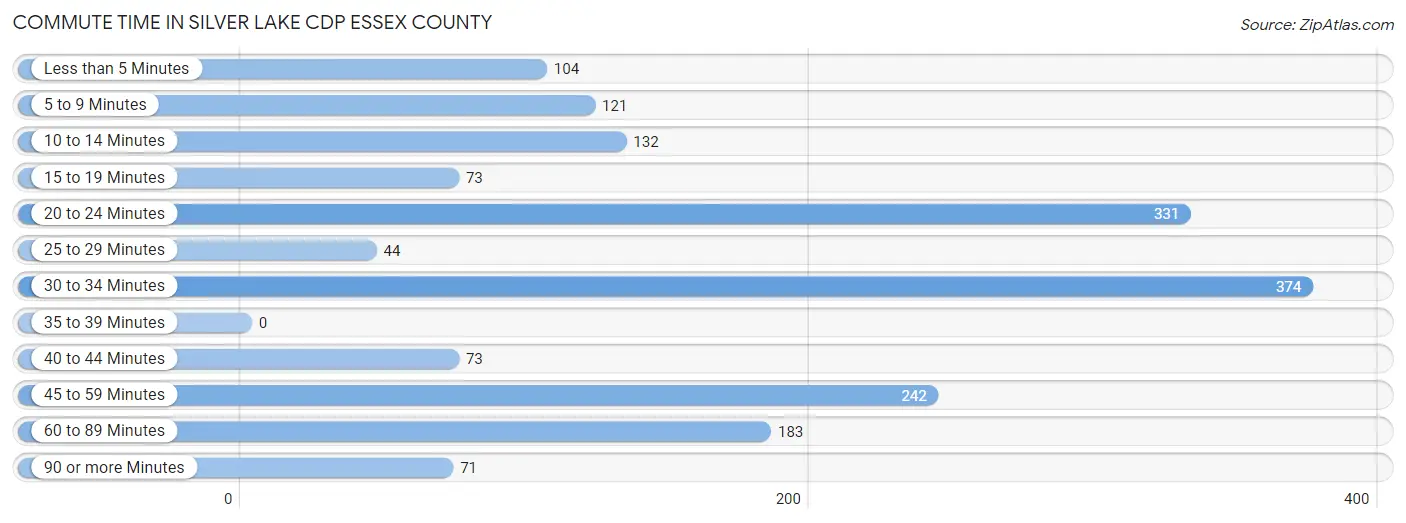
Commute Time in Silver Lake CDP Essex County
The most frequently occuring commute durations in Silver Lake CDP Essex County are 30 to 34 minutes (374 commuters, 21.4%), 20 to 24 minutes (331 commuters, 18.9%), and 45 to 59 minutes (242 commuters, 13.8%).
| Commute Time | # Commuters | % Commuters |
| Less than 5 Minutes | 104 | 5.9% |
| 5 to 9 Minutes | 121 | 6.9% |
| 10 to 14 Minutes | 132 | 7.5% |
| 15 to 19 Minutes | 73 | 4.2% |
| 20 to 24 Minutes | 331 | 18.9% |
| 25 to 29 Minutes | 44 | 2.5% |
| 30 to 34 Minutes | 374 | 21.4% |
| 35 to 39 Minutes | 0 | 0.0% |
| 40 to 44 Minutes | 73 | 4.2% |
| 45 to 59 Minutes | 242 | 13.8% |
| 60 to 89 Minutes | 183 | 10.5% |
| 90 or more Minutes | 71 | 4.1% |
Commute Time by Sex in Silver Lake CDP Essex County
The most common commute times in Silver Lake CDP Essex County are 45 to 59 minutes (194 commuters, 25.5%) for males and 30 to 34 minutes (301 commuters, 30.5%) for females.
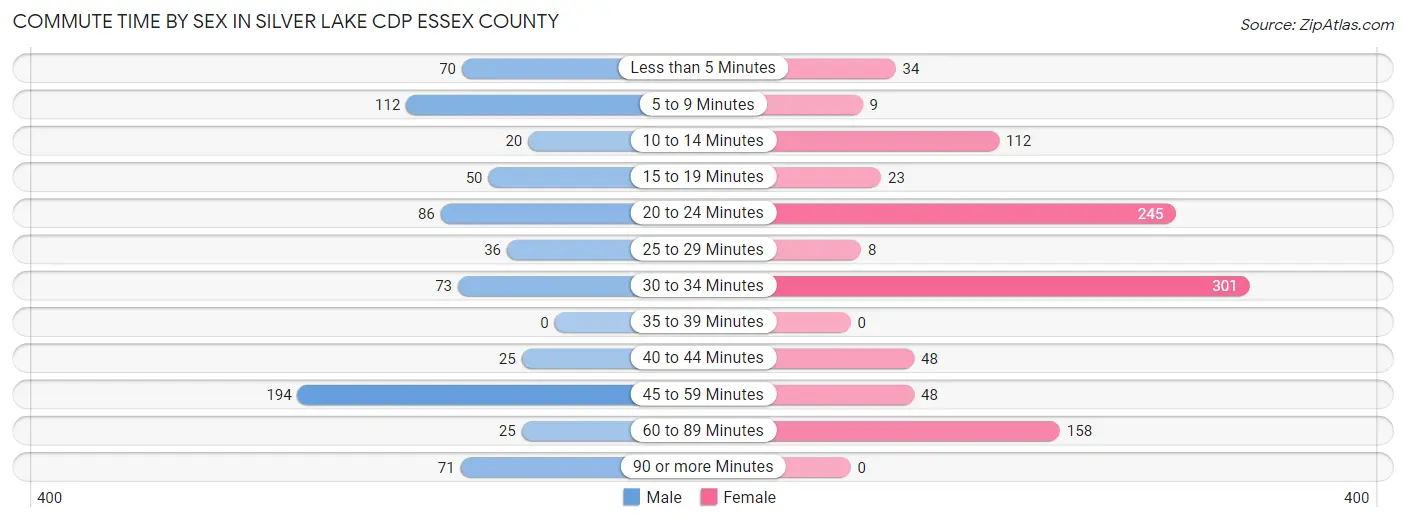
| Commute Time | Male | Female |
| Less than 5 Minutes | 70 (9.2%) | 34 (3.5%) |
| 5 to 9 Minutes | 112 (14.7%) | 9 (0.9%) |
| 10 to 14 Minutes | 20 (2.6%) | 112 (11.4%) |
| 15 to 19 Minutes | 50 (6.6%) | 23 (2.3%) |
| 20 to 24 Minutes | 86 (11.3%) | 245 (24.8%) |
| 25 to 29 Minutes | 36 (4.7%) | 8 (0.8%) |
| 30 to 34 Minutes | 73 (9.6%) | 301 (30.5%) |
| 35 to 39 Minutes | 0 (0.0%) | 0 (0.0%) |
| 40 to 44 Minutes | 25 (3.3%) | 48 (4.9%) |
| 45 to 59 Minutes | 194 (25.5%) | 48 (4.9%) |
| 60 to 89 Minutes | 25 (3.3%) | 158 (16.0%) |
| 90 or more Minutes | 71 (9.3%) | 0 (0.0%) |
Time of Departure to Work by Sex in Silver Lake CDP Essex County
The most frequent times of departure to work in Silver Lake CDP Essex County are 9:00 AM to 9:59 AM (168, 22.1%) for males and 7:30 AM to 7:59 AM (350, 35.5%) for females.
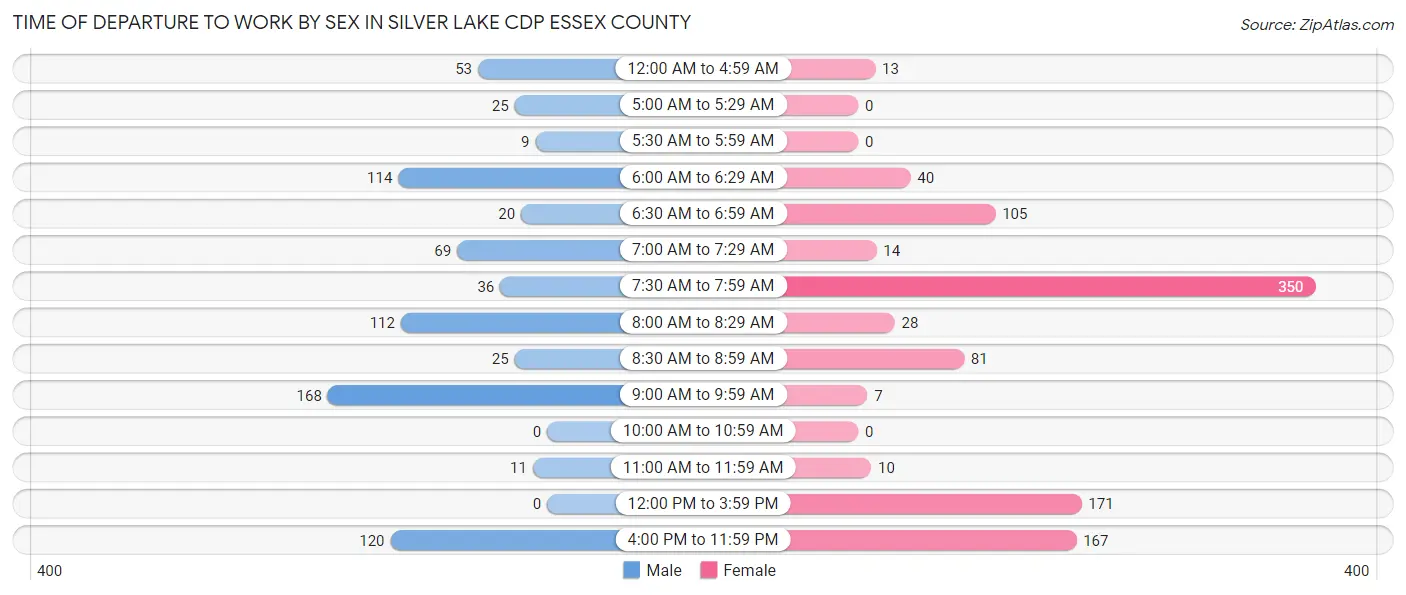
| Time of Departure | Male | Female |
| 12:00 AM to 4:59 AM | 53 (7.0%) | 13 (1.3%) |
| 5:00 AM to 5:29 AM | 25 (3.3%) | 0 (0.0%) |
| 5:30 AM to 5:59 AM | 9 (1.2%) | 0 (0.0%) |
| 6:00 AM to 6:29 AM | 114 (15.0%) | 40 (4.1%) |
| 6:30 AM to 6:59 AM | 20 (2.6%) | 105 (10.6%) |
| 7:00 AM to 7:29 AM | 69 (9.1%) | 14 (1.4%) |
| 7:30 AM to 7:59 AM | 36 (4.7%) | 350 (35.5%) |
| 8:00 AM to 8:29 AM | 112 (14.7%) | 28 (2.8%) |
| 8:30 AM to 8:59 AM | 25 (3.3%) | 81 (8.2%) |
| 9:00 AM to 9:59 AM | 168 (22.1%) | 7 (0.7%) |
| 10:00 AM to 10:59 AM | 0 (0.0%) | 0 (0.0%) |
| 11:00 AM to 11:59 AM | 11 (1.4%) | 10 (1.0%) |
| 12:00 PM to 3:59 PM | 0 (0.0%) | 171 (17.3%) |
| 4:00 PM to 11:59 PM | 120 (15.8%) | 167 (16.9%) |
| Total | 762 (100.0%) | 986 (100.0%) |
Housing Occupancy in Silver Lake CDP Essex County
Occupancy by Ownership in Silver Lake CDP Essex County
Of the total 1,398 dwellings in Silver Lake CDP Essex County, owner-occupied units account for 684 (48.9%), while renter-occupied units make up 714 (51.1%).
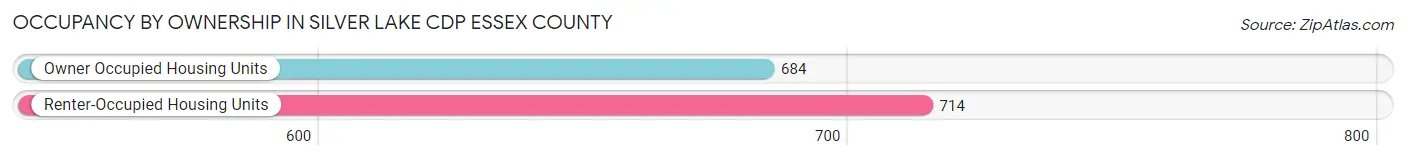
| Occupancy | # Housing Units | % Housing Units |
| Owner Occupied Housing Units | 684 | 48.9% |
| Renter-Occupied Housing Units | 714 | 51.1% |
| Total Occupied Housing Units | 1,398 | 100.0% |
Occupancy by Household Size in Silver Lake CDP Essex County
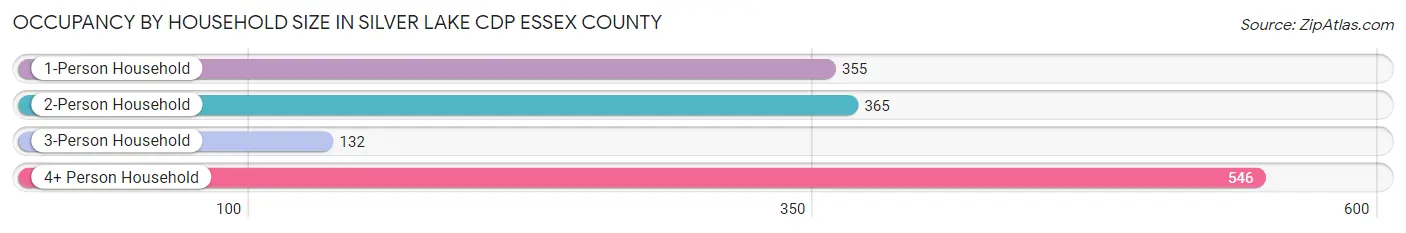
| Household Size | # Housing Units | % Housing Units |
| 1-Person Household | 355 | 25.4% |
| 2-Person Household | 365 | 26.1% |
| 3-Person Household | 132 | 9.4% |
| 4+ Person Household | 546 | 39.1% |
| Total Housing Units | 1,398 | 100.0% |
Occupancy by Ownership by Household Size in Silver Lake CDP Essex County
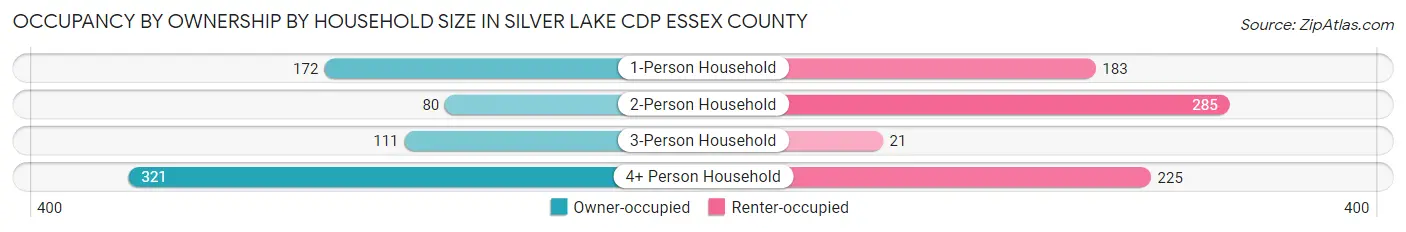
| Household Size | Owner-occupied | Renter-occupied |
| 1-Person Household | 172 (48.4%) | 183 (51.5%) |
| 2-Person Household | 80 (21.9%) | 285 (78.1%) |
| 3-Person Household | 111 (84.1%) | 21 (15.9%) |
| 4+ Person Household | 321 (58.8%) | 225 (41.2%) |
| Total Housing Units | 684 (48.9%) | 714 (51.1%) |
Occupancy by Educational Attainment in Silver Lake CDP Essex County
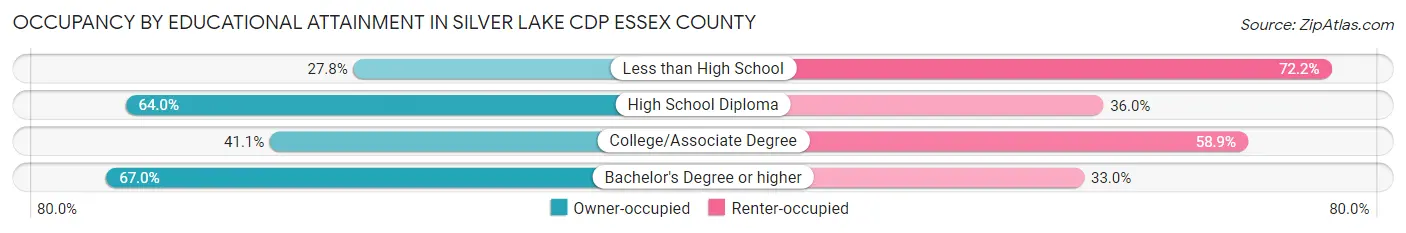
| Household Size | Owner-occupied | Renter-occupied |
| Less than High School | 59 (27.8%) | 153 (72.2%) |
| High School Diploma | 183 (64.0%) | 103 (36.0%) |
| College/Associate Degree | 255 (41.1%) | 366 (58.9%) |
| Bachelor's Degree or higher | 187 (67.0%) | 92 (33.0%) |
Occupancy by Age of Householder in Silver Lake CDP Essex County
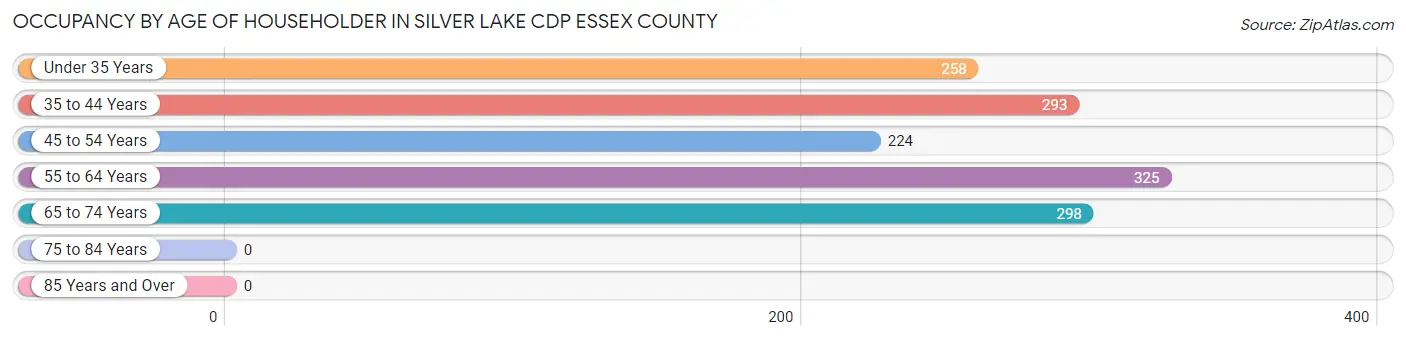
| Age Bracket | # Households | % Households |
| Under 35 Years | 258 | 18.4% |
| 35 to 44 Years | 293 | 21.0% |
| 45 to 54 Years | 224 | 16.0% |
| 55 to 64 Years | 325 | 23.3% |
| 65 to 74 Years | 298 | 21.3% |
| 75 to 84 Years | 0 | 0.0% |
| 85 Years and Over | 0 | 0.0% |
| Total | 1,398 | 100.0% |
Housing Finances in Silver Lake CDP Essex County
Median Income by Occupancy in Silver Lake CDP Essex County
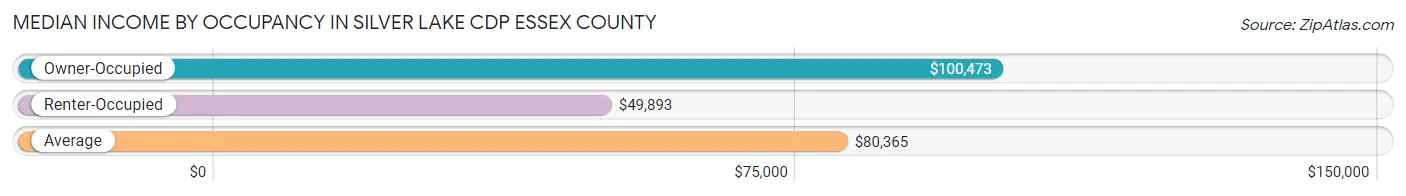
| Occupancy Type | # Households | Median Income |
| Owner-Occupied | 684 (48.9%) | $100,473 |
| Renter-Occupied | 714 (51.1%) | $49,893 |
| Average | 1,398 (100.0%) | $80,365 |
Occupancy by Householder Income Bracket in Silver Lake CDP Essex County
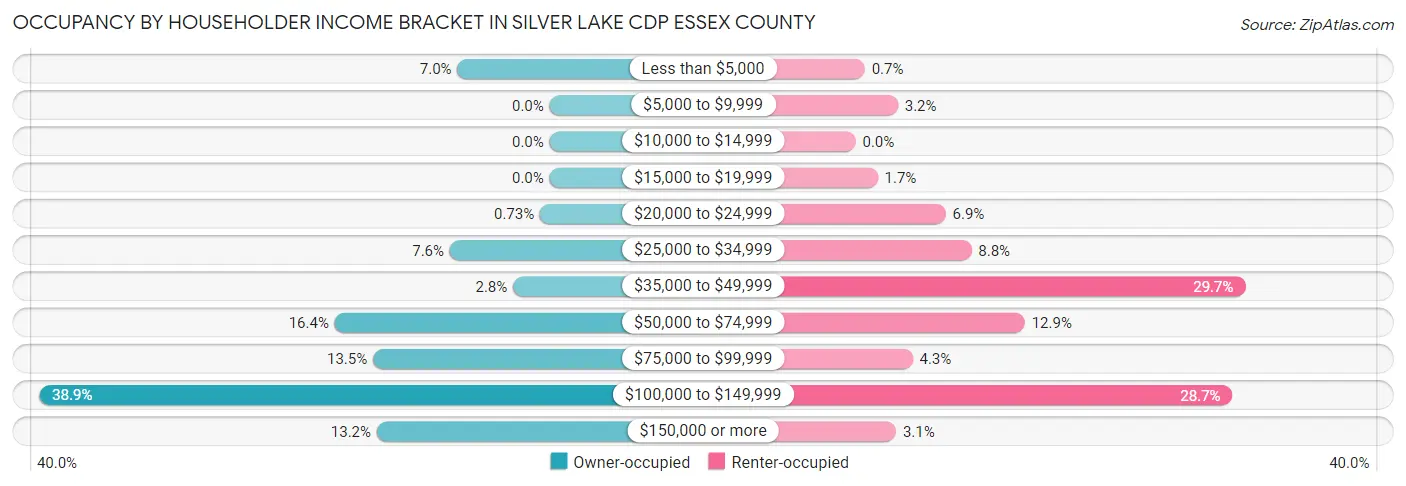
| Income Bracket | Owner-occupied | Renter-occupied |
| Less than $5,000 | 48 (7.0%) | 5 (0.7%) |
| $5,000 to $9,999 | 0 (0.0%) | 23 (3.2%) |
| $10,000 to $14,999 | 0 (0.0%) | 0 (0.0%) |
| $15,000 to $19,999 | 0 (0.0%) | 12 (1.7%) |
| $20,000 to $24,999 | 5 (0.7%) | 49 (6.9%) |
| $25,000 to $34,999 | 52 (7.6%) | 63 (8.8%) |
| $35,000 to $49,999 | 19 (2.8%) | 212 (29.7%) |
| $50,000 to $74,999 | 112 (16.4%) | 92 (12.9%) |
| $75,000 to $99,999 | 92 (13.5%) | 31 (4.3%) |
| $100,000 to $149,999 | 266 (38.9%) | 205 (28.7%) |
| $150,000 or more | 90 (13.2%) | 22 (3.1%) |
| Total | 684 (100.0%) | 714 (100.0%) |
Monthly Housing Cost Tiers in Silver Lake CDP Essex County
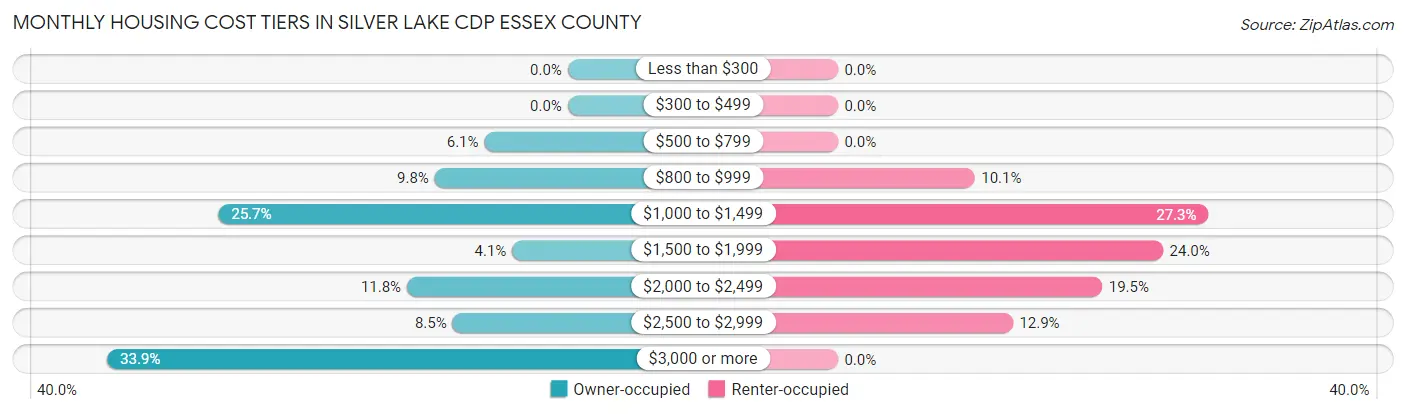
| Monthly Cost | Owner-occupied | Renter-occupied |
| Less than $300 | 0 (0.0%) | 0 (0.0%) |
| $300 to $499 | 0 (0.0%) | 0 (0.0%) |
| $500 to $799 | 42 (6.1%) | 0 (0.0%) |
| $800 to $999 | 67 (9.8%) | 72 (10.1%) |
| $1,000 to $1,499 | 176 (25.7%) | 195 (27.3%) |
| $1,500 to $1,999 | 28 (4.1%) | 171 (23.9%) |
| $2,000 to $2,499 | 81 (11.8%) | 139 (19.5%) |
| $2,500 to $2,999 | 58 (8.5%) | 92 (12.9%) |
| $3,000 or more | 232 (33.9%) | 0 (0.0%) |
| Total | 684 (100.0%) | 714 (100.0%) |
Physical Housing Characteristics in Silver Lake CDP Essex County
Housing Structures in Silver Lake CDP Essex County
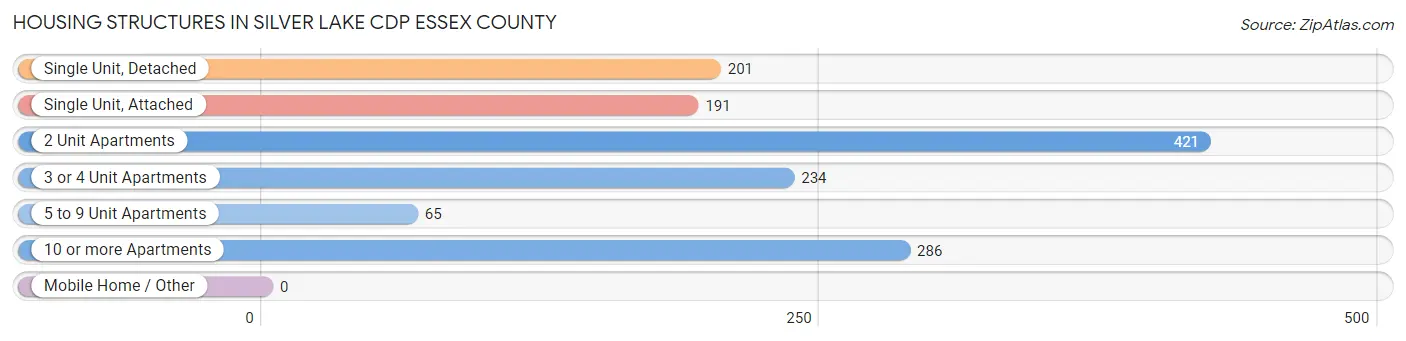
| Structure Type | # Housing Units | % Housing Units |
| Single Unit, Detached | 201 | 14.4% |
| Single Unit, Attached | 191 | 13.7% |
| 2 Unit Apartments | 421 | 30.1% |
| 3 or 4 Unit Apartments | 234 | 16.7% |
| 5 to 9 Unit Apartments | 65 | 4.6% |
| 10 or more Apartments | 286 | 20.5% |
| Mobile Home / Other | 0 | 0.0% |
| Total | 1,398 | 100.0% |
Housing Structures by Occupancy in Silver Lake CDP Essex County
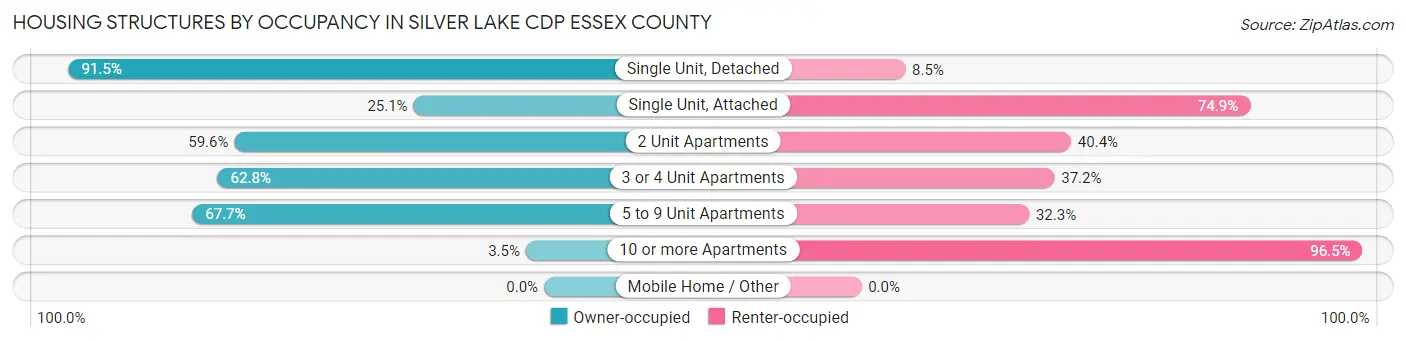
| Structure Type | Owner-occupied | Renter-occupied |
| Single Unit, Detached | 184 (91.5%) | 17 (8.5%) |
| Single Unit, Attached | 48 (25.1%) | 143 (74.9%) |
| 2 Unit Apartments | 251 (59.6%) | 170 (40.4%) |
| 3 or 4 Unit Apartments | 147 (62.8%) | 87 (37.2%) |
| 5 to 9 Unit Apartments | 44 (67.7%) | 21 (32.3%) |
| 10 or more Apartments | 10 (3.5%) | 276 (96.5%) |
| Mobile Home / Other | 0 (0.0%) | 0 (0.0%) |
| Total | 684 (48.9%) | 714 (51.1%) |
Housing Structures by Number of Rooms in Silver Lake CDP Essex County
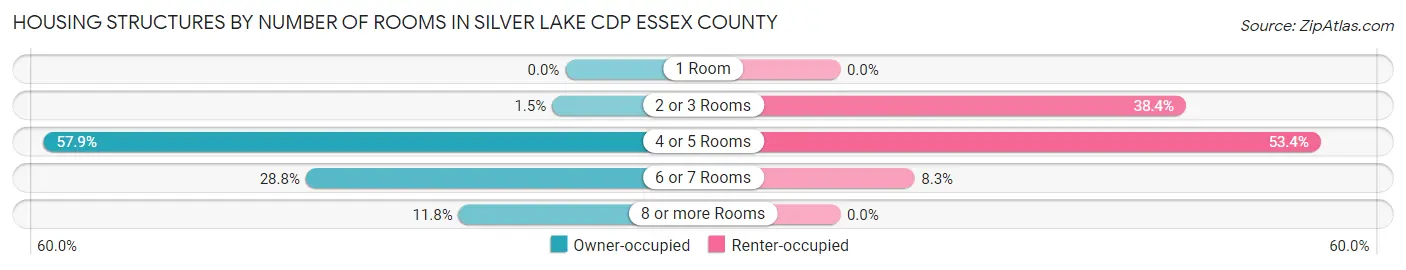
| Number of Rooms | Owner-occupied | Renter-occupied |
| 1 Room | 0 (0.0%) | 0 (0.0%) |
| 2 or 3 Rooms | 10 (1.5%) | 274 (38.4%) |
| 4 or 5 Rooms | 396 (57.9%) | 381 (53.4%) |
| 6 or 7 Rooms | 197 (28.8%) | 59 (8.3%) |
| 8 or more Rooms | 81 (11.8%) | 0 (0.0%) |
| Total | 684 (100.0%) | 714 (100.0%) |
Housing Structure by Heating Type in Silver Lake CDP Essex County
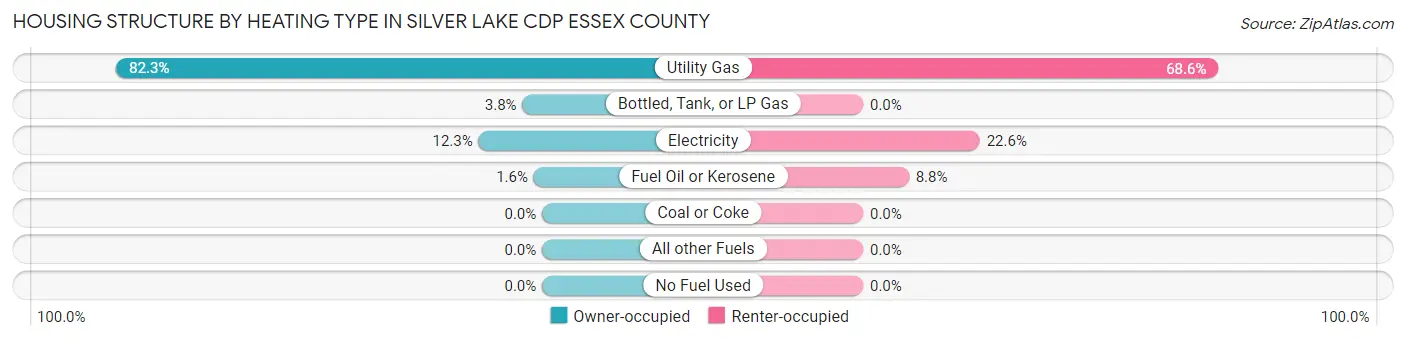
| Heating Type | Owner-occupied | Renter-occupied |
| Utility Gas | 563 (82.3%) | 490 (68.6%) |
| Bottled, Tank, or LP Gas | 26 (3.8%) | 0 (0.0%) |
| Electricity | 84 (12.3%) | 161 (22.6%) |
| Fuel Oil or Kerosene | 11 (1.6%) | 63 (8.8%) |
| Coal or Coke | 0 (0.0%) | 0 (0.0%) |
| All other Fuels | 0 (0.0%) | 0 (0.0%) |
| No Fuel Used | 0 (0.0%) | 0 (0.0%) |
| Total | 684 (100.0%) | 714 (100.0%) |
Household Vehicle Usage in Silver Lake CDP Essex County
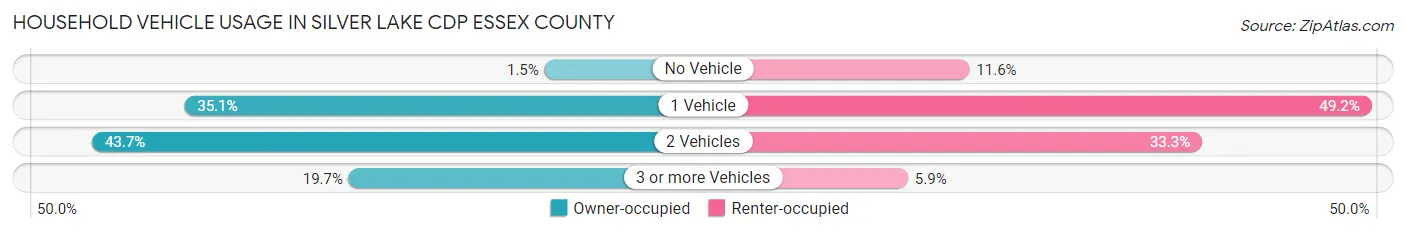
| Vehicles per Household | Owner-occupied | Renter-occupied |
| No Vehicle | 10 (1.5%) | 83 (11.6%) |
| 1 Vehicle | 240 (35.1%) | 351 (49.2%) |
| 2 Vehicles | 299 (43.7%) | 238 (33.3%) |
| 3 or more Vehicles | 135 (19.7%) | 42 (5.9%) |
| Total | 684 (100.0%) | 714 (100.0%) |
Real Estate & Mortgages in Silver Lake CDP Essex County
Real Estate and Mortgage Overview in Silver Lake CDP Essex County
| Characteristic | Without Mortgage | With Mortgage |
| Housing Units | 273 | 411 |
| Median Property Value | $345,200 | $477,200 |
| Median Household Income | $51,458 | $54 |
| Monthly Housing Costs | $1,147 | $232 |
| Real Estate Taxes | $8,041 | $0 |
Property Value by Mortgage Status in Silver Lake CDP Essex County
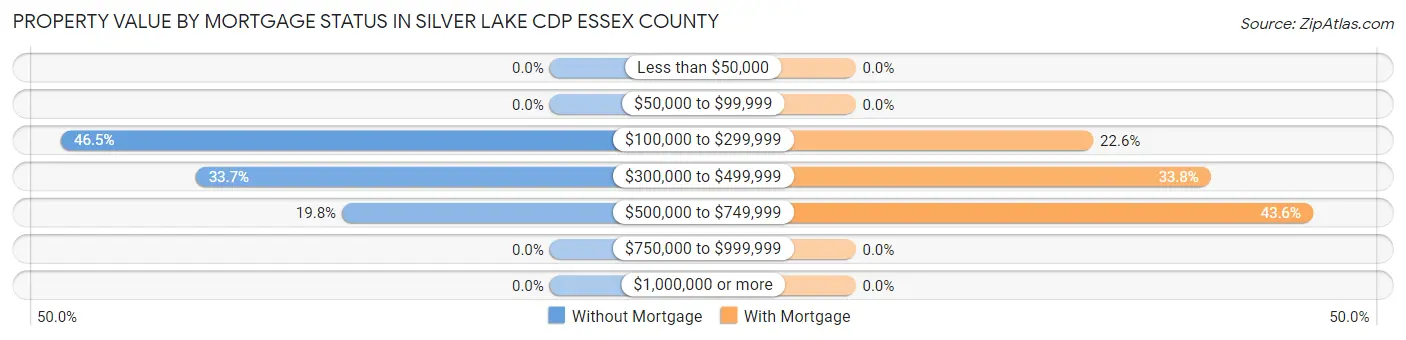
| Property Value | Without Mortgage | With Mortgage |
| Less than $50,000 | 0 (0.0%) | 0 (0.0%) |
| $50,000 to $99,999 | 0 (0.0%) | 0 (0.0%) |
| $100,000 to $299,999 | 127 (46.5%) | 93 (22.6%) |
| $300,000 to $499,999 | 92 (33.7%) | 139 (33.8%) |
| $500,000 to $749,999 | 54 (19.8%) | 179 (43.5%) |
| $750,000 to $999,999 | 0 (0.0%) | 0 (0.0%) |
| $1,000,000 or more | 0 (0.0%) | 0 (0.0%) |
| Total | 273 (100.0%) | 411 (100.0%) |
Household Income by Mortgage Status in Silver Lake CDP Essex County
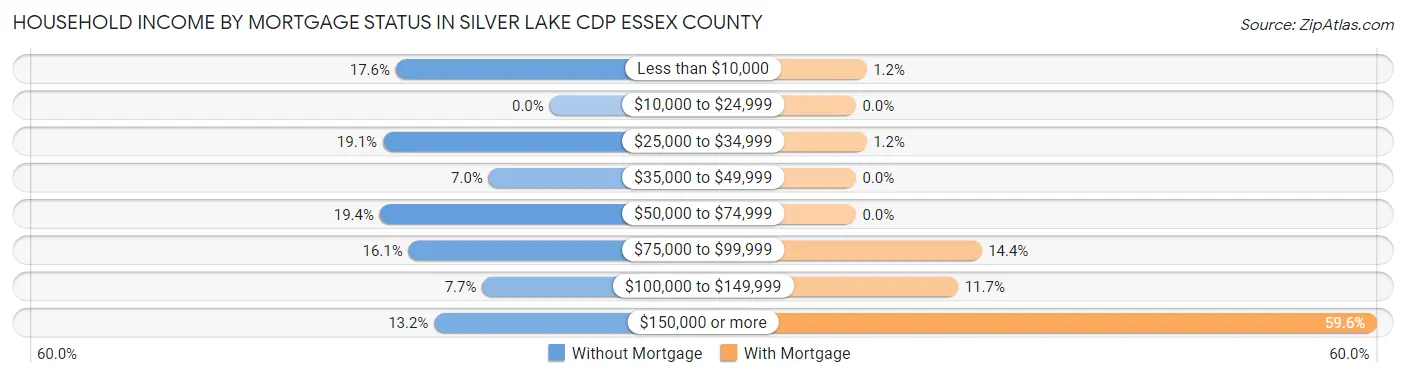
| Household Income | Without Mortgage | With Mortgage |
| Less than $10,000 | 48 (17.6%) | 5 (1.2%) |
| $10,000 to $24,999 | 0 (0.0%) | 0 (0.0%) |
| $25,000 to $34,999 | 52 (19.1%) | 5 (1.2%) |
| $35,000 to $49,999 | 19 (7.0%) | 0 (0.0%) |
| $50,000 to $74,999 | 53 (19.4%) | 0 (0.0%) |
| $75,000 to $99,999 | 44 (16.1%) | 59 (14.4%) |
| $100,000 to $149,999 | 21 (7.7%) | 48 (11.7%) |
| $150,000 or more | 36 (13.2%) | 245 (59.6%) |
| Total | 273 (100.0%) | 411 (100.0%) |
Property Value to Household Income Ratio in Silver Lake CDP Essex County
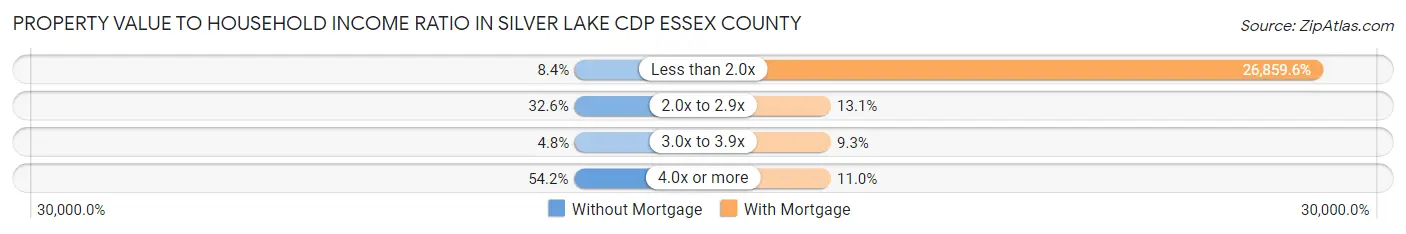
| Value-to-Income Ratio | Without Mortgage | With Mortgage |
| Less than 2.0x | 23 (8.4%) | 110,393 (26,859.6%) |
| 2.0x to 2.9x | 89 (32.6%) | 54 (13.1%) |
| 3.0x to 3.9x | 13 (4.8%) | 38 (9.2%) |
| 4.0x or more | 148 (54.2%) | 45 (11.0%) |
| Total | 273 (100.0%) | 411 (100.0%) |
Real Estate Taxes by Mortgage Status in Silver Lake CDP Essex County
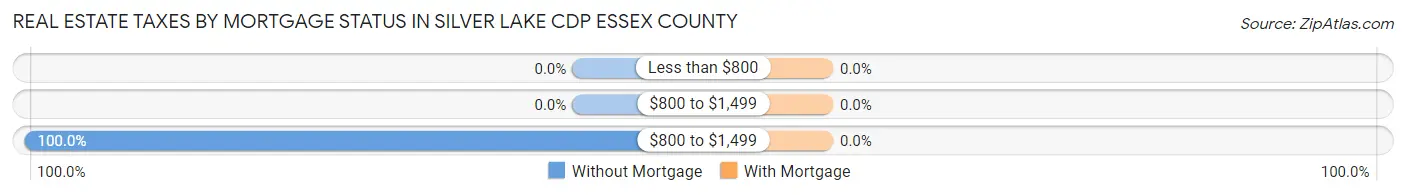
| Property Taxes | Without Mortgage | With Mortgage |
| Less than $800 | 0 (0.0%) | 0 (0.0%) |
| $800 to $1,499 | 0 (0.0%) | 0 (0.0%) |
| $800 to $1,499 | 273 (100.0%) | 0 (0.0%) |
| Total | 273 (100.0%) | 411 (100.0%) |
Health & Disability in Silver Lake CDP Essex County
Health Insurance Coverage by Age in Silver Lake CDP Essex County
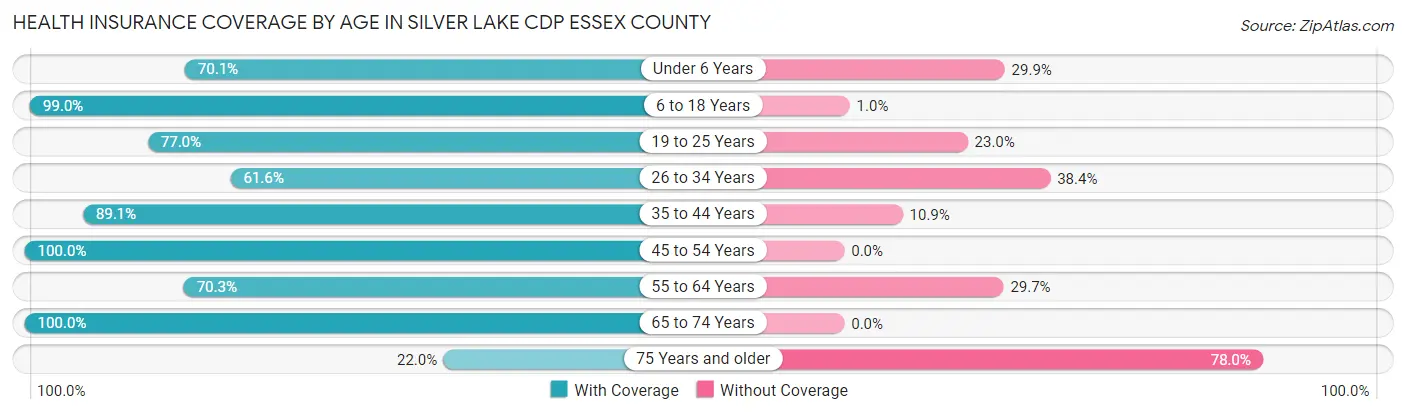
| Age Bracket | With Coverage | Without Coverage |
| Under 6 Years | 272 (70.1%) | 116 (29.9%) |
| 6 to 18 Years | 792 (99.0%) | 8 (1.0%) |
| 19 to 25 Years | 489 (77.0%) | 146 (23.0%) |
| 26 to 34 Years | 316 (61.6%) | 197 (38.4%) |
| 35 to 44 Years | 377 (89.1%) | 46 (10.9%) |
| 45 to 54 Years | 512 (100.0%) | 0 (0.0%) |
| 55 to 64 Years | 455 (70.3%) | 192 (29.7%) |
| 65 to 74 Years | 357 (100.0%) | 0 (0.0%) |
| 75 Years and older | 29 (22.0%) | 103 (78.0%) |
| Total | 3,599 (81.7%) | 808 (18.3%) |
Health Insurance Coverage by Citizenship Status in Silver Lake CDP Essex County
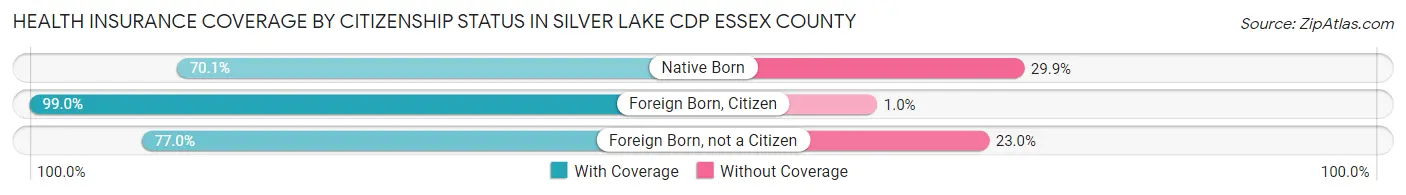
| Citizenship Status | With Coverage | Without Coverage |
| Native Born | 272 (70.1%) | 116 (29.9%) |
| Foreign Born, Citizen | 792 (99.0%) | 8 (1.0%) |
| Foreign Born, not a Citizen | 489 (77.0%) | 146 (23.0%) |
Health Insurance Coverage by Household Income in Silver Lake CDP Essex County
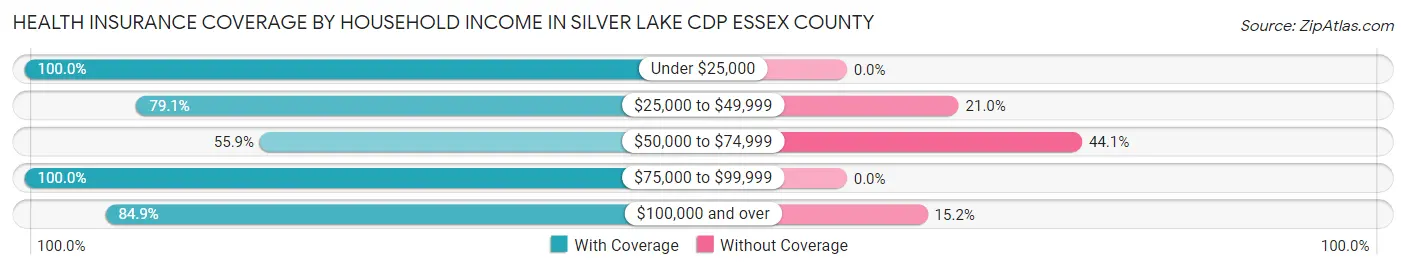
| Household Income | With Coverage | Without Coverage |
| Under $25,000 | 522 (100.0%) | 0 (0.0%) |
| $25,000 to $49,999 | 551 (79.0%) | 146 (20.9%) |
| $50,000 to $74,999 | 397 (55.9%) | 313 (44.1%) |
| $75,000 to $99,999 | 174 (100.0%) | 0 (0.0%) |
| $100,000 and over | 1,955 (84.9%) | 349 (15.1%) |
Public vs Private Health Insurance Coverage by Age in Silver Lake CDP Essex County
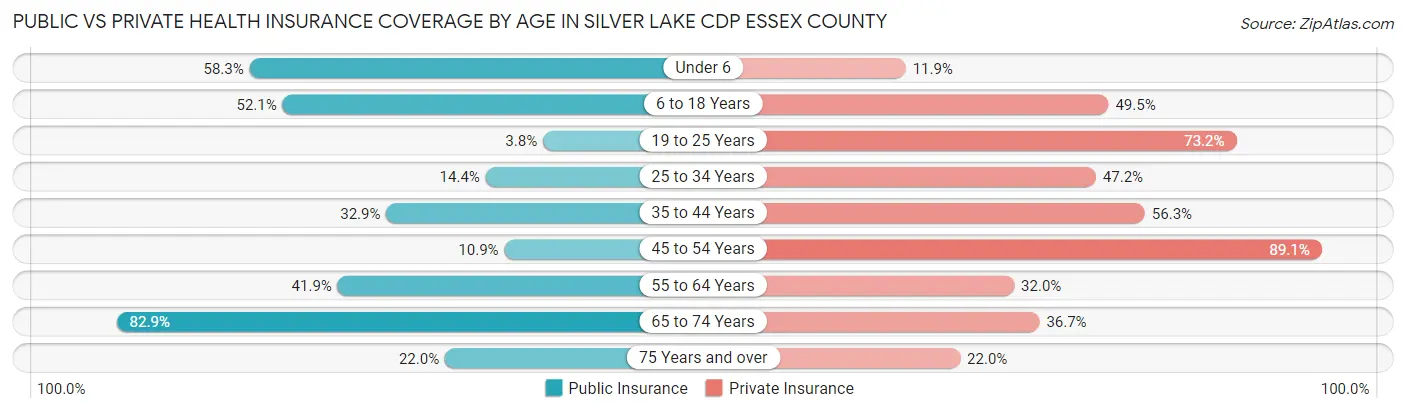
| Age Bracket | Public Insurance | Private Insurance |
| Under 6 | 226 (58.3%) | 46 (11.9%) |
| 6 to 18 Years | 417 (52.1%) | 396 (49.5%) |
| 19 to 25 Years | 24 (3.8%) | 465 (73.2%) |
| 25 to 34 Years | 74 (14.4%) | 242 (47.2%) |
| 35 to 44 Years | 139 (32.9%) | 238 (56.3%) |
| 45 to 54 Years | 56 (10.9%) | 456 (89.1%) |
| 55 to 64 Years | 271 (41.9%) | 207 (32.0%) |
| 65 to 74 Years | 296 (82.9%) | 131 (36.7%) |
| 75 Years and over | 29 (22.0%) | 29 (22.0%) |
| Total | 1,532 (34.8%) | 2,210 (50.1%) |
Disability Status by Sex by Age in Silver Lake CDP Essex County
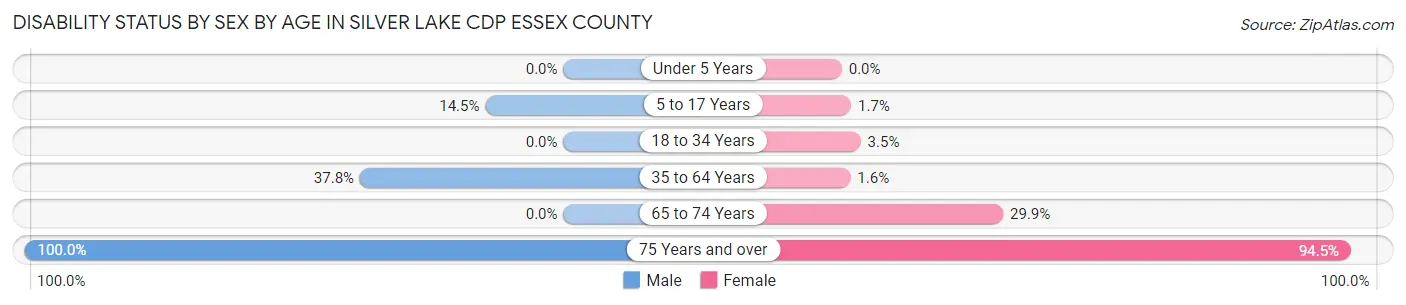
| Age Bracket | Male | Female |
| Under 5 Years | 0 (0.0%) | 0 (0.0%) |
| 5 to 17 Years | 42 (14.5%) | 7 (1.7%) |
| 18 to 34 Years | 0 (0.0%) | 25 (3.5%) |
| 35 to 64 Years | 290 (37.8%) | 13 (1.6%) |
| 65 to 74 Years | 0 (0.0%) | 53 (29.9%) |
| 75 Years and over | 23 (100.0%) | 103 (94.5%) |
Disability Class by Sex by Age in Silver Lake CDP Essex County
Disability Class: Hearing Difficulty
| Age Bracket | Male | Female |
| Under 5 Years | 0 (0.0%) | 0 (0.0%) |
| 5 to 17 Years | 0 (0.0%) | 0 (0.0%) |
| 18 to 34 Years | 0 (0.0%) | 0 (0.0%) |
| 35 to 64 Years | 0 (0.0%) | 0 (0.0%) |
| 65 to 74 Years | 0 (0.0%) | 0 (0.0%) |
| 75 Years and over | 0 (0.0%) | 0 (0.0%) |
Disability Class: Vision Difficulty
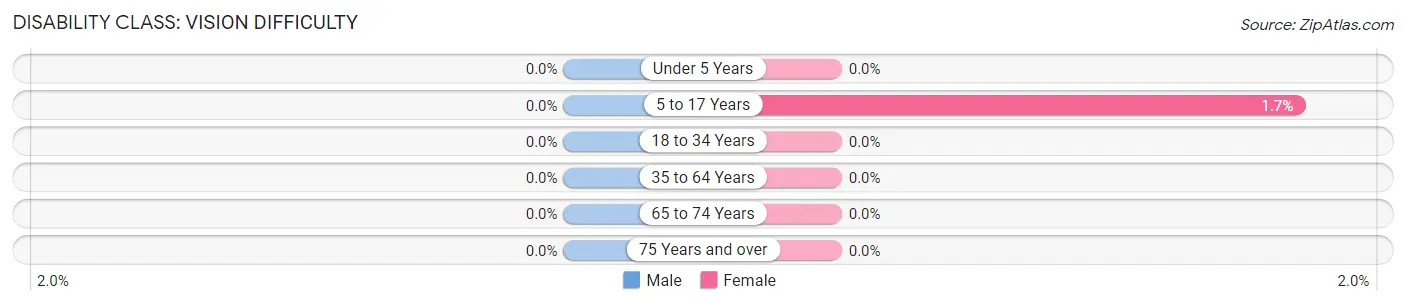
| Age Bracket | Male | Female |
| Under 5 Years | 0 (0.0%) | 0 (0.0%) |
| 5 to 17 Years | 0 (0.0%) | 7 (1.7%) |
| 18 to 34 Years | 0 (0.0%) | 0 (0.0%) |
| 35 to 64 Years | 0 (0.0%) | 0 (0.0%) |
| 65 to 74 Years | 0 (0.0%) | 0 (0.0%) |
| 75 Years and over | 0 (0.0%) | 0 (0.0%) |
Disability Class: Cognitive Difficulty
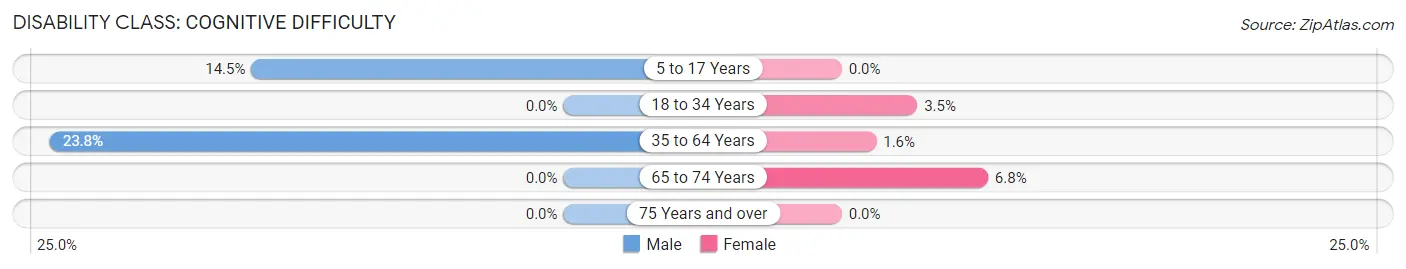
| Age Bracket | Male | Female |
| 5 to 17 Years | 42 (14.5%) | 0 (0.0%) |
| 18 to 34 Years | 0 (0.0%) | 25 (3.5%) |
| 35 to 64 Years | 183 (23.8%) | 13 (1.6%) |
| 65 to 74 Years | 0 (0.0%) | 12 (6.8%) |
| 75 Years and over | 0 (0.0%) | 0 (0.0%) |
Disability Class: Ambulatory Difficulty
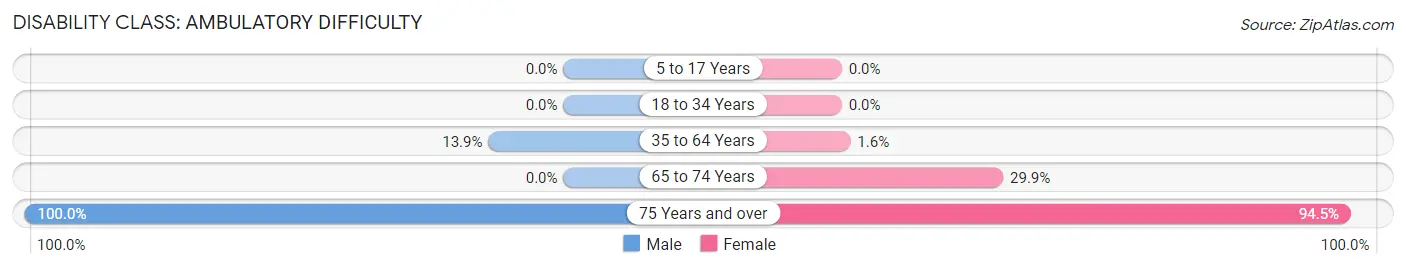
| Age Bracket | Male | Female |
| 5 to 17 Years | 0 (0.0%) | 0 (0.0%) |
| 18 to 34 Years | 0 (0.0%) | 0 (0.0%) |
| 35 to 64 Years | 107 (13.9%) | 13 (1.6%) |
| 65 to 74 Years | 0 (0.0%) | 53 (29.9%) |
| 75 Years and over | 23 (100.0%) | 103 (94.5%) |
Disability Class: Self-Care Difficulty
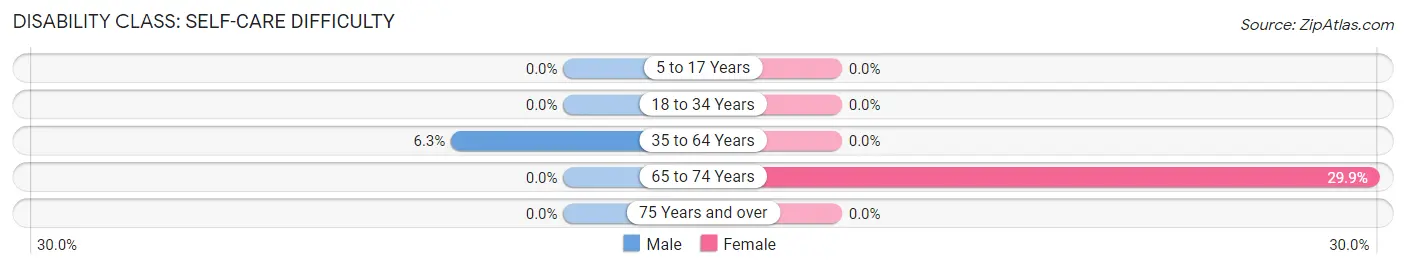
| Age Bracket | Male | Female |
| 5 to 17 Years | 0 (0.0%) | 0 (0.0%) |
| 18 to 34 Years | 0 (0.0%) | 0 (0.0%) |
| 35 to 64 Years | 48 (6.2%) | 0 (0.0%) |
| 65 to 74 Years | 0 (0.0%) | 53 (29.9%) |
| 75 Years and over | 0 (0.0%) | 0 (0.0%) |
Technology Access in Silver Lake CDP Essex County
Computing Device Access in Silver Lake CDP Essex County
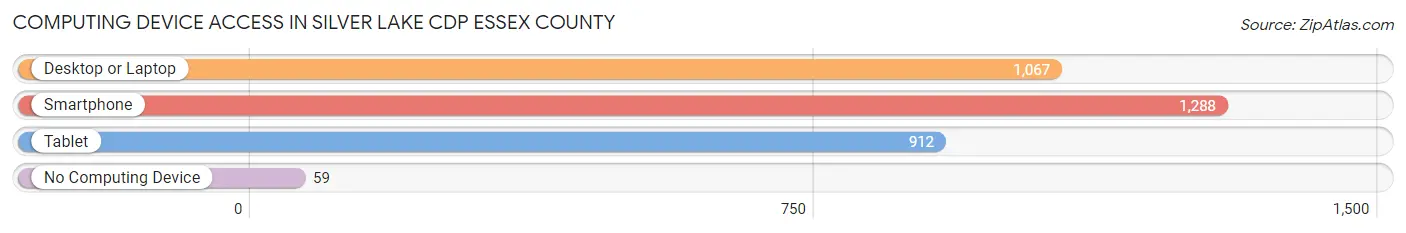
| Device Type | # Households | % Households |
| Desktop or Laptop | 1,067 | 76.3% |
| Smartphone | 1,288 | 92.1% |
| Tablet | 912 | 65.2% |
| No Computing Device | 59 | 4.2% |
| Total | 1,398 | 100.0% |
Internet Access in Silver Lake CDP Essex County
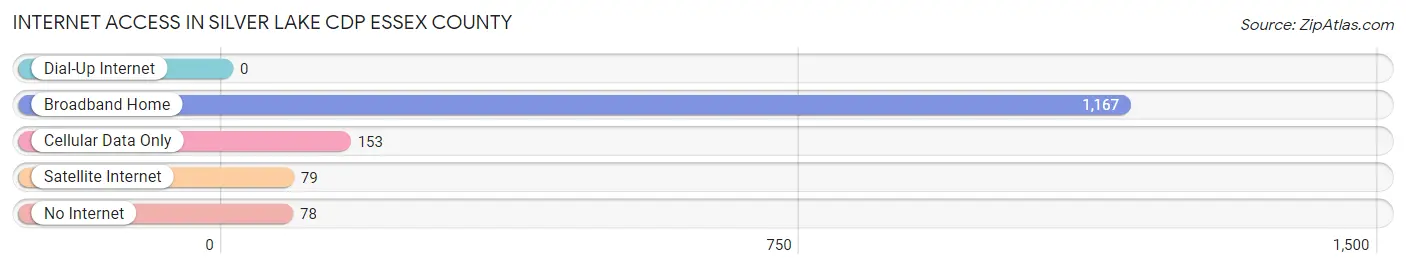
| Internet Type | # Households | % Households |
| Dial-Up Internet | 0 | 0.0% |
| Broadband Home | 1,167 | 83.5% |
| Cellular Data Only | 153 | 10.9% |
| Satellite Internet | 79 | 5.7% |
| No Internet | 78 | 5.6% |
| Total | 1,398 | 100.0% |
Silver Lake CDP Essex County Summary
Introduction
Silver Lake Cdp is a census-designated place (CDP) located in Essex County, New Jersey. It is located in the northern part of the county, and is bordered by the towns of Belleville, Nutley, and Bloomfield. The population of Silver Lake Cdp was 8,845 at the 2010 census.
History
Silver Lake Cdp was first settled in the late 1700s by Dutch and English settlers. The area was originally known as “Silver Lake” due to the abundance of silver ore in the area. The area was primarily used for farming and fishing until the late 1800s, when the area began to be developed for residential use.
In the early 1900s, Silver Lake Cdp was a popular summer destination for wealthy New Yorkers. The area was known for its beautiful lake, which was used for swimming and boating. The area also had several resorts and hotels, which attracted many visitors.
In the 1950s, Silver Lake Cdp began to experience rapid growth due to the construction of the Garden State Parkway. The area became a popular bedroom community for commuters to New York City.
Geography
Silver Lake Cdp is located in the northern part of Essex County, New Jersey. It is bordered by the towns of Belleville, Nutley, and Bloomfield. The area is mostly flat, with an elevation of approximately 20 feet above sea level.
The area is home to Silver Lake, a small lake located in the center of the CDP. The lake is approximately one mile long and is used for recreational activities such as fishing and boating.
Economy
Silver Lake Cdp has a diverse economy, with a mix of retail, manufacturing, and service-based businesses. The area is home to several large employers, including the Essex County College, the Essex County Vocational Technical School, and the Essex County Correctional Facility.
The area also has a thriving retail sector, with several shopping centers and malls located in the area. The largest shopping center is the Silver Lake Mall, which is home to over 100 stores and restaurants.
Demographics
As of the 2010 census, Silver Lake Cdp had a population of 8,845. The population was spread out, with 48.3% male and 51.7% female. The median age was 40.7 years.
The racial makeup of the CDP was 79.2% White, 11.2% African American, 0.3% Native American, 4.2% Asian, 0.1% Pacific Islander, 2.3% from other races, and 2.9% from two or more races. Hispanic or Latino of any race were 8.3% of the population.
Conclusion
Silver Lake Cdp is a census-designated place located in Essex County, New Jersey. It is bordered by the towns of Belleville, Nutley, and Bloomfield. The area is home to Silver Lake, a small lake located in the center of the CDP. The area has a diverse economy, with a mix of retail, manufacturing, and service-based businesses. As of the 2010 census, Silver Lake Cdp had a population of 8,845. The population was spread out, with 48.3% male and 51.7% female. The racial makeup of the CDP was 79.2% White, 11.2% African American, 0.3% Native American, 4.2% Asian, 0.1% Pacific Islander, 2.3% from other races, and 2.9% from two or more races. Hispanic or Latino of any race were 8.3% of the population.
Common Questions
What is Per Capita Income in Silver Lake CDP Essex County?
Per Capita income in Silver Lake CDP Essex County is $27,801.
What is the Median Family Income in Silver Lake CDP Essex County?
Median Family Income in Silver Lake CDP Essex County is $85,426.
What is the Median Household income in Silver Lake CDP Essex County?
Median Household Income in Silver Lake CDP Essex County is $80,365.
What is Income or Wage Gap in Silver Lake CDP Essex County?
Income or Wage Gap in Silver Lake CDP Essex County is 64.7%.
Women in Silver Lake CDP Essex County earn 35.3 cents for every dollar earned by a man.
What is Inequality or Gini Index in Silver Lake CDP Essex County?
Inequality or Gini Index in Silver Lake CDP Essex County is 0.34.
What is the Total Population of Silver Lake CDP Essex County?
Total Population of Silver Lake CDP Essex County is 4,407.
What is the Total Male Population of Silver Lake CDP Essex County?
Total Male Population of Silver Lake CDP Essex County is 1,995.
What is the Total Female Population of Silver Lake CDP Essex County?
Total Female Population of Silver Lake CDP Essex County is 2,412.
What is the Ratio of Males per 100 Females in Silver Lake CDP Essex County?
There are 82.71 Males per 100 Females in Silver Lake CDP Essex County.
What is the Ratio of Females per 100 Males in Silver Lake CDP Essex County?
There are 120.90 Females per 100 Males in Silver Lake CDP Essex County.
What is the Median Population Age in Silver Lake CDP Essex County?
Median Population Age in Silver Lake CDP Essex County is 32.7 Years.
What is the Average Family Size in Silver Lake CDP Essex County
Average Family Size in Silver Lake CDP Essex County is 3.8 People.
What is the Average Household Size in Silver Lake CDP Essex County
Average Household Size in Silver Lake CDP Essex County is 3.1 People.
How Large is the Labor Force in Silver Lake CDP Essex County?
There are 2,040 People in the Labor Forcein in Silver Lake CDP Essex County.
What is the Percentage of People in the Labor Force in Silver Lake CDP Essex County?
57.9% of People are in the Labor Force in Silver Lake CDP Essex County.
What is the Unemployment Rate in Silver Lake CDP Essex County?
Unemployment Rate in Silver Lake CDP Essex County is 3.2%.