Fairton, NJ Map & Demographics
Fairton Map
Fairton Overview
$31,259
PER CAPITA INCOME
$74,107
AVG FAMILY INCOME
$64,766
AVG HOUSEHOLD INCOME
12.6%
WAGE / INCOME GAP [ % ]
87.4¢/ $1
WAGE / INCOME GAP [ $ ]
0.42
INEQUALITY / GINI INDEX
929
TOTAL POPULATION
500
MALE POPULATION
429
FEMALE POPULATION
116.55
MALES / 100 FEMALES
85.80
FEMALES / 100 MALES
38.4
MEDIAN AGE
3.1
AVG FAMILY SIZE
2.6
AVG HOUSEHOLD SIZE
505
LABOR FORCE [ PEOPLE ]
63.0%
PERCENT IN LABOR FORCE
12.1%
UNEMPLOYMENT RATE
Fairton Zip Codes
Fairton Area Codes
Income in Fairton
Income Overview in Fairton
Per Capita Income in Fairton is $31,259, while median incomes of families and households are $74,107 and $64,766 respectively.
| Characteristic | Number | Measure |
| Per Capita Income | 929 | $31,259 |
| Median Family Income | 235 | $74,107 |
| Mean Family Income | 235 | $85,742 |
| Median Household Income | 353 | $64,766 |
| Mean Household Income | 353 | $79,035 |
| Income Deficit | 235 | $0 |
| Wage / Income Gap (%) | 929 | 12.61% |
| Wage / Income Gap ($) | 929 | 87.39¢ per $1 |
| Gini / Inequality Index | 929 | 0.42 |
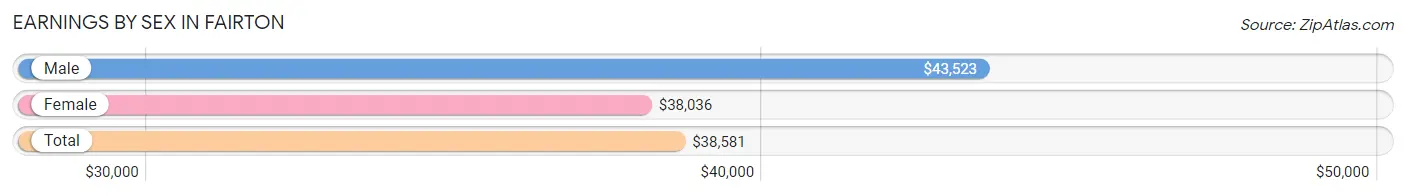
Earnings by Sex in Fairton
Average Earnings in Fairton are $38,581, $43,523 for men and $38,036 for women, a difference of 12.6%.
| Sex | Number | Average Earnings |
| Male | 257 (54.2%) | $43,523 |
| Female | 217 (45.8%) | $38,036 |
| Total | 474 (100.0%) | $38,581 |
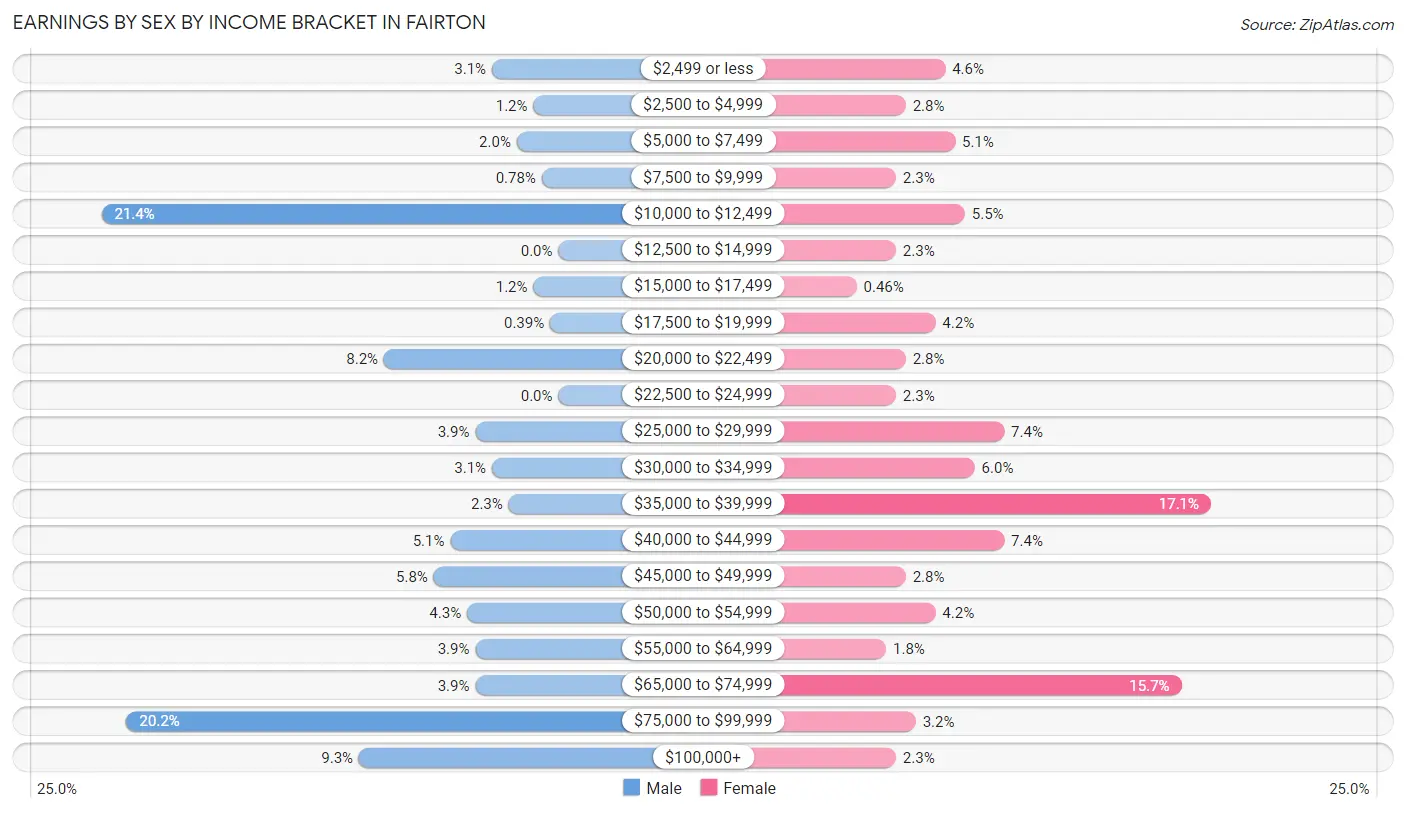
Earnings by Sex by Income Bracket in Fairton
The most common earnings brackets in Fairton are $10,000 to $12,499 for men (55 | 21.4%) and $35,000 to $39,999 for women (37 | 17.1%).
| Income | Male | Female |
| $2,499 or less | 8 (3.1%) | 10 (4.6%) |
| $2,500 to $4,999 | 3 (1.2%) | 6 (2.8%) |
| $5,000 to $7,499 | 5 (1.9%) | 11 (5.1%) |
| $7,500 to $9,999 | 2 (0.8%) | 5 (2.3%) |
| $10,000 to $12,499 | 55 (21.4%) | 12 (5.5%) |
| $12,500 to $14,999 | 0 (0.0%) | 5 (2.3%) |
| $15,000 to $17,499 | 3 (1.2%) | 1 (0.5%) |
| $17,500 to $19,999 | 1 (0.4%) | 9 (4.2%) |
| $20,000 to $22,499 | 21 (8.2%) | 6 (2.8%) |
| $22,500 to $24,999 | 0 (0.0%) | 5 (2.3%) |
| $25,000 to $29,999 | 10 (3.9%) | 16 (7.4%) |
| $30,000 to $34,999 | 8 (3.1%) | 13 (6.0%) |
| $35,000 to $39,999 | 6 (2.3%) | 37 (17.1%) |
| $40,000 to $44,999 | 13 (5.1%) | 16 (7.4%) |
| $45,000 to $49,999 | 15 (5.8%) | 6 (2.8%) |
| $50,000 to $54,999 | 11 (4.3%) | 9 (4.2%) |
| $55,000 to $64,999 | 10 (3.9%) | 4 (1.8%) |
| $65,000 to $74,999 | 10 (3.9%) | 34 (15.7%) |
| $75,000 to $99,999 | 52 (20.2%) | 7 (3.2%) |
| $100,000+ | 24 (9.3%) | 5 (2.3%) |
| Total | 257 (100.0%) | 217 (100.0%) |
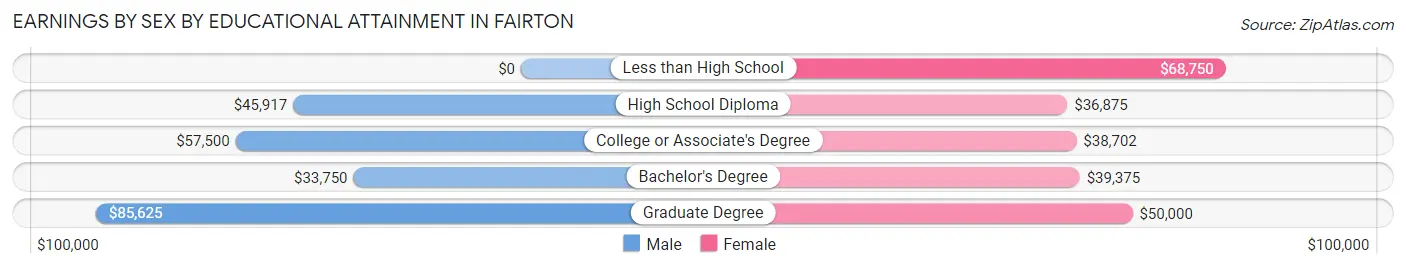
Earnings by Sex by Educational Attainment in Fairton
Average earnings in Fairton are $46,250 for men and $38,893 for women, a difference of 15.9%. Men with an educational attainment of graduate degree enjoy the highest average annual earnings of $85,625, while those with bachelor's degree education earn the least with $33,750. Women with an educational attainment of less than high school earn the most with the average annual earnings of $68,750, while those with high school diploma education have the smallest earnings of $36,875.
| Educational Attainment | Male Income | Female Income |
| Less than High School | - | - |
| High School Diploma | $45,917 | $36,875 |
| College or Associate's Degree | $57,500 | $38,702 |
| Bachelor's Degree | $33,750 | $39,375 |
| Graduate Degree | $85,625 | $50,000 |
| Total | $46,250 | $38,893 |
Family Income in Fairton
Family Income Brackets in Fairton
According to the Fairton family income data, there are 51 families falling into the $50,000 to $74,999 income range, which is the most common income bracket and makes up 21.7% of all families.
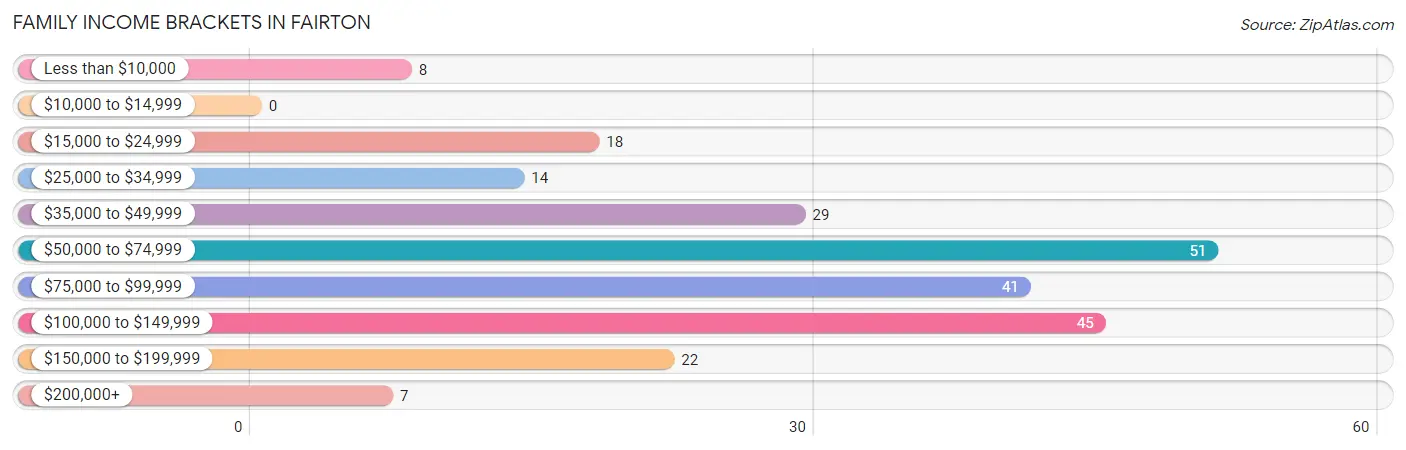
| Income Bracket | # Families | % Families |
| Less than $10,000 | 8 | 3.4% |
| $10,000 to $14,999 | 0 | 0.0% |
| $15,000 to $24,999 | 18 | 7.7% |
| $25,000 to $34,999 | 14 | 6.0% |
| $35,000 to $49,999 | 29 | 12.3% |
| $50,000 to $74,999 | 51 | 21.7% |
| $75,000 to $99,999 | 41 | 17.4% |
| $100,000 to $149,999 | 45 | 19.1% |
| $150,000 to $199,999 | 22 | 9.4% |
| $200,000+ | 7 | 3.0% |
Family Income by Famaliy Size in Fairton
4-person families (31 | 13.2%) account for the highest median family income in Fairton with $135,950 per family, while 2-person families (136 | 57.9%) have the highest median income of $36,607 per family member.
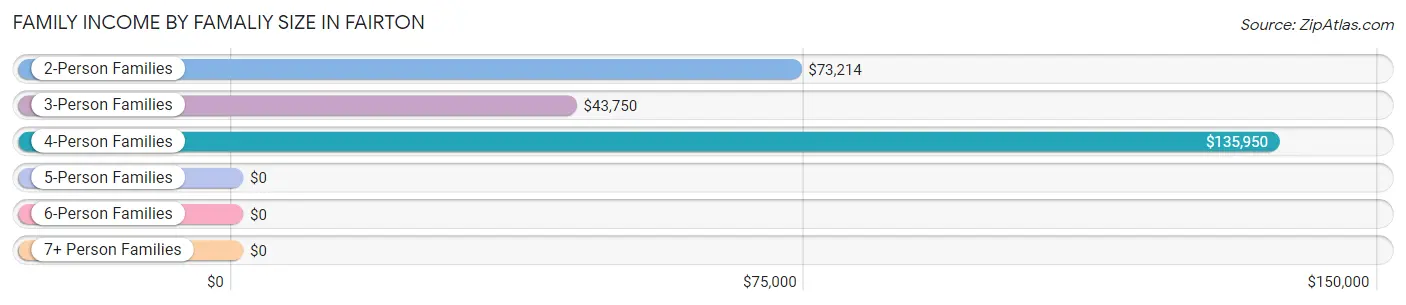
| Income Bracket | # Families | Median Income |
| 2-Person Families | 136 (57.9%) | $73,214 |
| 3-Person Families | 30 (12.8%) | $43,750 |
| 4-Person Families | 31 (13.2%) | $135,950 |
| 5-Person Families | 26 (11.1%) | $0 |
| 6-Person Families | 8 (3.4%) | $0 |
| 7+ Person Families | 4 (1.7%) | $0 |
| Total | 235 (100.0%) | $74,107 |
Family Income by Number of Earners in Fairton
The median family income in Fairton is $74,107, with families comprising 3+ earners (19) having the highest median family income of $130,250, while families with no earners (32) have the lowest median family income of $39,375, accounting for 8.1% and 13.6% of families, respectively.
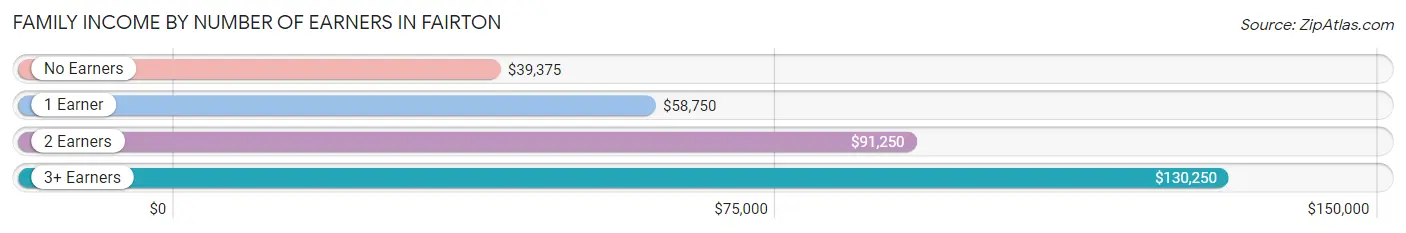
| Number of Earners | # Families | Median Income |
| No Earners | 32 (13.6%) | $39,375 |
| 1 Earner | 80 (34.0%) | $58,750 |
| 2 Earners | 104 (44.3%) | $91,250 |
| 3+ Earners | 19 (8.1%) | $130,250 |
| Total | 235 (100.0%) | $74,107 |
Household Income in Fairton
Household Income Brackets in Fairton
With 70 households falling in the category, the $50,000 to $74,999 income range is the most frequent in Fairton, accounting for 19.8% of all households. In contrast, only 9 households (2.5%) fall into the $10,000 to $14,999 income bracket, making it the least populous group.
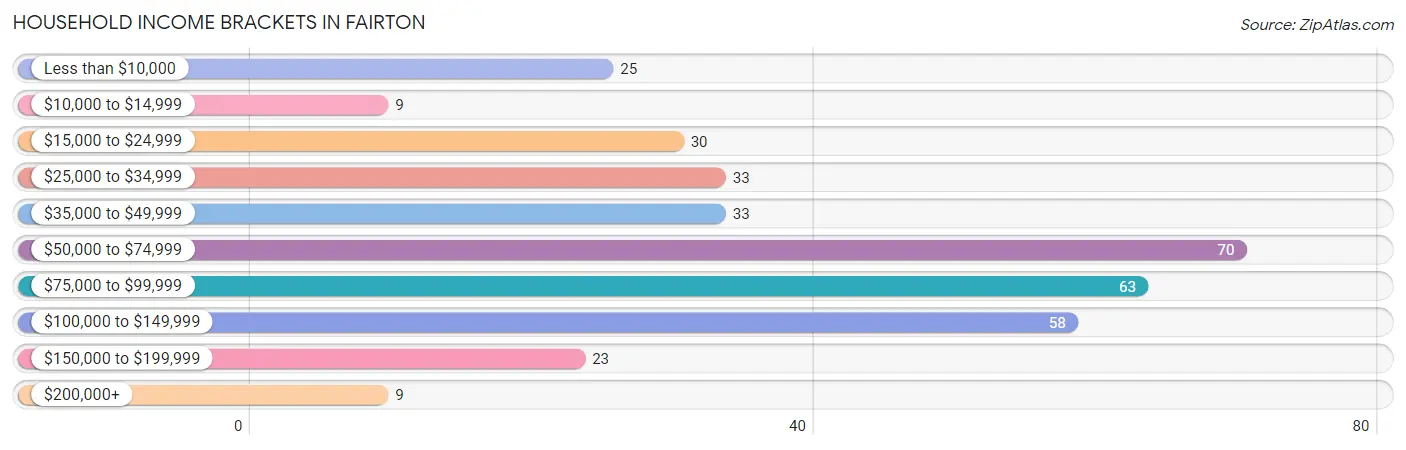
| Income Bracket | # Households | % Households |
| Less than $10,000 | 25 | 7.1% |
| $10,000 to $14,999 | 9 | 2.5% |
| $15,000 to $24,999 | 30 | 8.5% |
| $25,000 to $34,999 | 33 | 9.3% |
| $35,000 to $49,999 | 33 | 9.3% |
| $50,000 to $74,999 | 70 | 19.8% |
| $75,000 to $99,999 | 63 | 17.8% |
| $100,000 to $149,999 | 58 | 16.4% |
| $150,000 to $199,999 | 23 | 6.5% |
| $200,000+ | 9 | 2.5% |
Household Income by Householder Age in Fairton
The median household income in Fairton is $64,766, with the highest median household income of $87,829 found in the 25 to 44 years age bracket for the primary householder. A total of 117 households (33.1%) fall into this category.
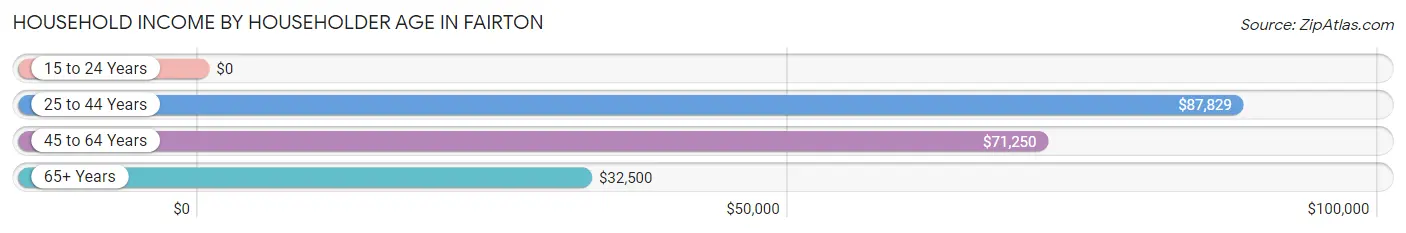
| Income Bracket | # Households | Median Income |
| 15 to 24 Years | 0 (0.0%) | $0 |
| 25 to 44 Years | 117 (33.1%) | $87,829 |
| 45 to 64 Years | 142 (40.2%) | $71,250 |
| 65+ Years | 94 (26.6%) | $32,500 |
| Total | 353 (100.0%) | $64,766 |
Poverty in Fairton
Income Below Poverty by Sex and Age in Fairton
With 7.9% poverty level for males and 7.8% for females among the residents of Fairton, 18 to 24 year old males and 65 to 74 year old females are the most vulnerable to poverty, with 20 males (40.8%) and 15 females (25.0%) in their respective age groups living below the poverty level.
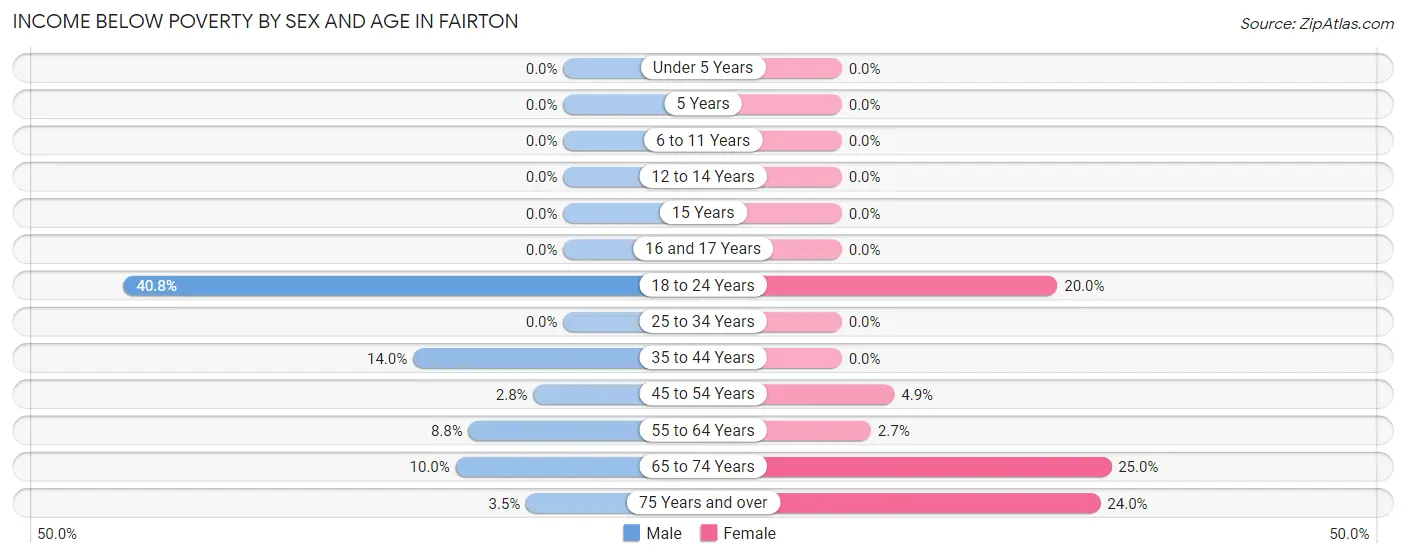
| Age Bracket | Male | Female |
| Under 5 Years | 0 (0.0%) | 0 (0.0%) |
| 5 Years | 0 (0.0%) | 0 (0.0%) |
| 6 to 11 Years | 0 (0.0%) | 0 (0.0%) |
| 12 to 14 Years | 0 (0.0%) | 0 (0.0%) |
| 15 Years | 0 (0.0%) | 0 (0.0%) |
| 16 and 17 Years | 0 (0.0%) | 0 (0.0%) |
| 18 to 24 Years | 20 (40.8%) | 8 (20.0%) |
| 25 to 34 Years | 0 (0.0%) | 0 (0.0%) |
| 35 to 44 Years | 6 (14.0%) | 0 (0.0%) |
| 45 to 54 Years | 1 (2.8%) | 2 (4.9%) |
| 55 to 64 Years | 8 (8.8%) | 2 (2.7%) |
| 65 to 74 Years | 3 (10.0%) | 15 (25.0%) |
| 75 Years and over | 1 (3.5%) | 6 (24.0%) |
| Total | 39 (7.9%) | 33 (7.8%) |
Income Above Poverty by Sex and Age in Fairton
According to the poverty statistics in Fairton, males aged under 5 years and females aged under 5 years are the age groups that are most secure financially, with 100.0% of males and 100.0% of females in these age groups living above the poverty line.
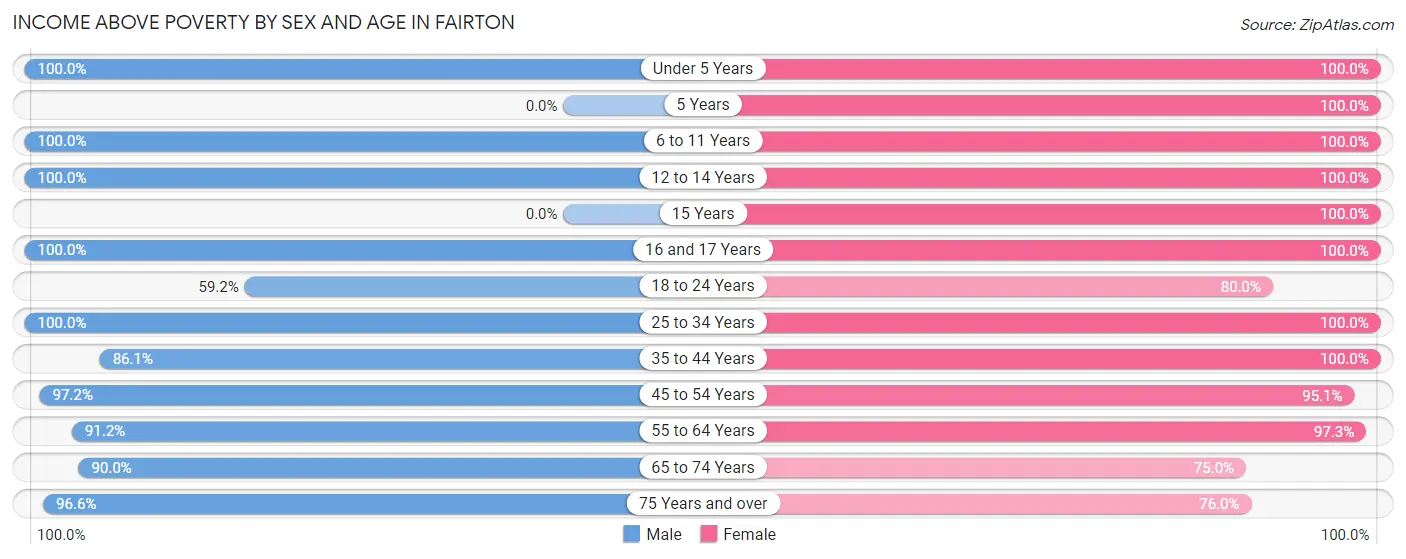
| Age Bracket | Male | Female |
| Under 5 Years | 32 (100.0%) | 18 (100.0%) |
| 5 Years | 0 (0.0%) | 1 (100.0%) |
| 6 to 11 Years | 9 (100.0%) | 11 (100.0%) |
| 12 to 14 Years | 33 (100.0%) | 10 (100.0%) |
| 15 Years | 0 (0.0%) | 1 (100.0%) |
| 16 and 17 Years | 21 (100.0%) | 37 (100.0%) |
| 18 to 24 Years | 29 (59.2%) | 32 (80.0%) |
| 25 to 34 Years | 122 (100.0%) | 54 (100.0%) |
| 35 to 44 Years | 37 (86.1%) | 49 (100.0%) |
| 45 to 54 Years | 35 (97.2%) | 39 (95.1%) |
| 55 to 64 Years | 83 (91.2%) | 72 (97.3%) |
| 65 to 74 Years | 27 (90.0%) | 45 (75.0%) |
| 75 Years and over | 28 (96.6%) | 19 (76.0%) |
| Total | 456 (92.1%) | 388 (92.2%) |
Income Below Poverty Among Married-Couple Families in Fairton
The poverty statistics for married-couple families in Fairton show that 1.1% or 2 of the total 175 families live below the poverty line. Families with no children have the highest poverty rate of 1.7%, comprising of 2 families. On the other hand, families with 1 or 2 children have the lowest poverty rate of 0.0%, which includes 0 families.
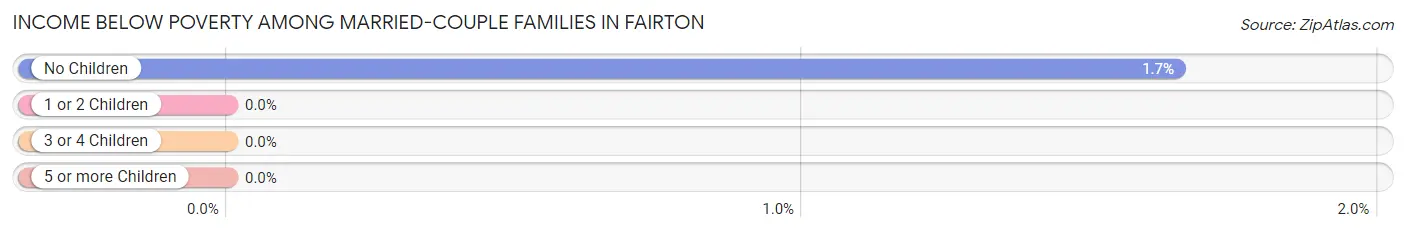
| Children | Above Poverty | Below Poverty |
| No Children | 119 (98.4%) | 2 (1.7%) |
| 1 or 2 Children | 43 (100.0%) | 0 (0.0%) |
| 3 or 4 Children | 11 (100.0%) | 0 (0.0%) |
| 5 or more Children | 0 (0.0%) | 0 (0.0%) |
| Total | 173 (98.9%) | 2 (1.1%) |
Income Below Poverty Among Single-Parent Households in Fairton
According to the poverty data in Fairton, 25.0% or 7 single-father households and 3.1% or 1 single-mother households are living below the poverty line. Among single-father households, those with no children have the highest poverty rate, with 7 households (38.9%) experiencing poverty. Likewise, among single-mother households, those with no children have the highest poverty rate, with 1 households (12.5%) falling below the poverty line.
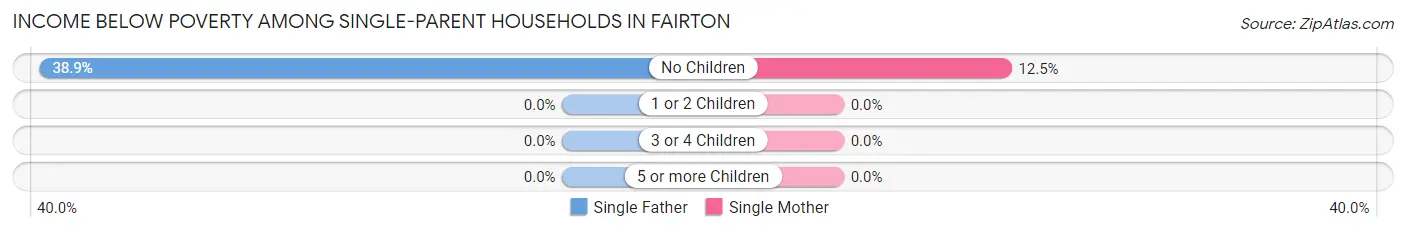
| Children | Single Father | Single Mother |
| No Children | 7 (38.9%) | 1 (12.5%) |
| 1 or 2 Children | 0 (0.0%) | 0 (0.0%) |
| 3 or 4 Children | 0 (0.0%) | 0 (0.0%) |
| 5 or more Children | 0 (0.0%) | 0 (0.0%) |
| Total | 7 (25.0%) | 1 (3.1%) |
Income Below Poverty Among Married-Couple vs Single-Parent Households in Fairton
The poverty data for Fairton shows that 2 of the married-couple family households (1.1%) and 8 of the single-parent households (13.3%) are living below the poverty level. Within the married-couple family households, those with no children have the highest poverty rate, with 2 households (1.7%) falling below the poverty line. Among the single-parent households, those with no children have the highest poverty rate, with 8 household (30.8%) living below poverty.
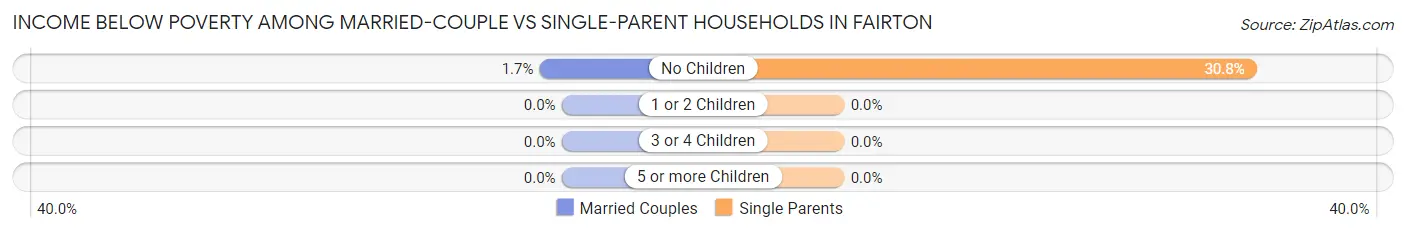
| Children | Married-Couple Families | Single-Parent Households |
| No Children | 2 (1.7%) | 8 (30.8%) |
| 1 or 2 Children | 0 (0.0%) | 0 (0.0%) |
| 3 or 4 Children | 0 (0.0%) | 0 (0.0%) |
| 5 or more Children | 0 (0.0%) | 0 (0.0%) |
| Total | 2 (1.1%) | 8 (13.3%) |
Race in Fairton
The most populous races in Fairton are White / Caucasian (558 | 60.1%), Native / Alaskan (178 | 19.2%), and Black / African American (139 | 15.0%).
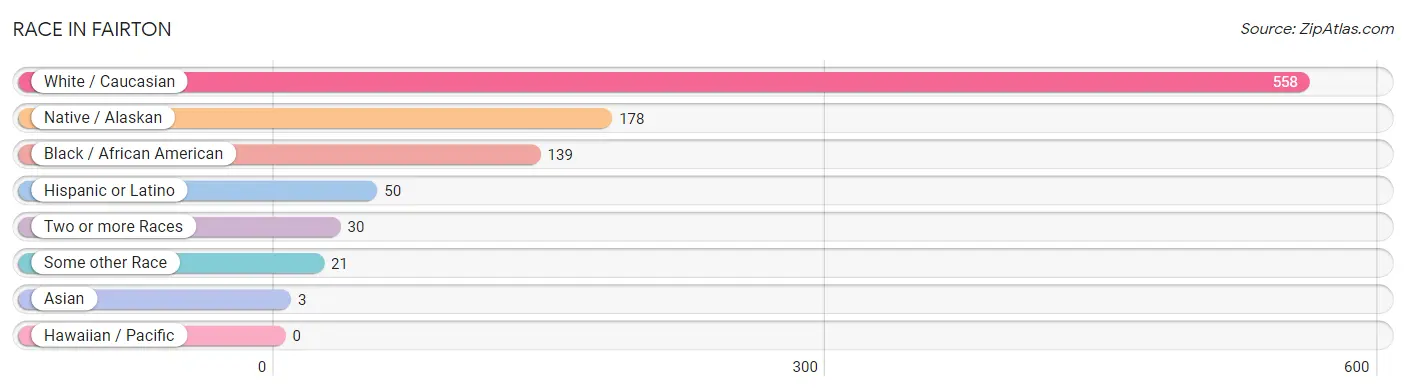
| Race | # Population | % Population |
| Asian | 3 | 0.3% |
| Black / African American | 139 | 15.0% |
| Hawaiian / Pacific | 0 | 0.0% |
| Hispanic or Latino | 50 | 5.4% |
| Native / Alaskan | 178 | 19.2% |
| White / Caucasian | 558 | 60.1% |
| Two or more Races | 30 | 3.2% |
| Some other Race | 21 | 2.3% |
| Total | 929 | 100.0% |
Ancestry in Fairton
The most populous ancestries reported in Fairton are Irish (145 | 15.6%), Italian (135 | 14.5%), German (117 | 12.6%), English (92 | 9.9%), and Delaware (83 | 8.9%), together accounting for 61.6% of all Fairton residents.
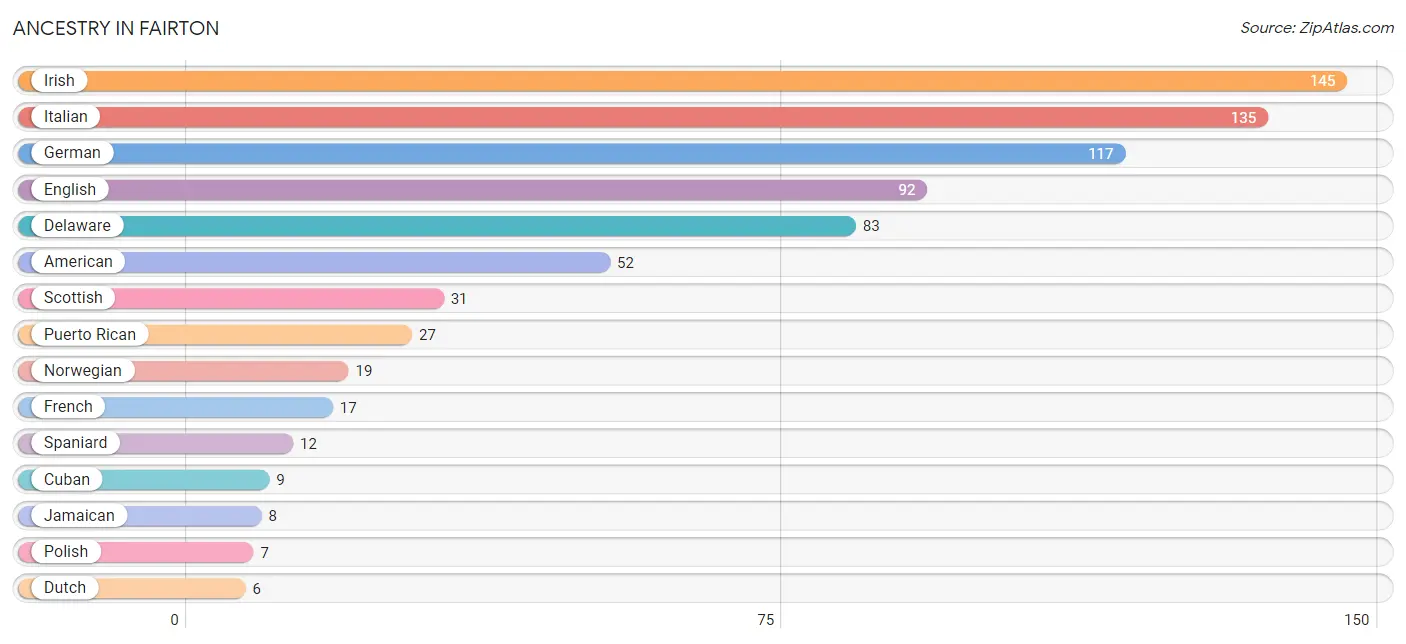
| Ancestry | # Population | % Population |
| African | 4 | 0.4% |
| American | 52 | 5.6% |
| Colombian | 1 | 0.1% |
| Croatian | 1 | 0.1% |
| Cuban | 9 | 1.0% |
| Delaware | 83 | 8.9% |
| Dutch | 6 | 0.6% |
| English | 92 | 9.9% |
| European | 4 | 0.4% |
| French | 17 | 1.8% |
| German | 117 | 12.6% |
| Irish | 145 | 15.6% |
| Italian | 135 | 14.5% |
| Jamaican | 8 | 0.9% |
| Latvian | 1 | 0.1% |
| Lithuanian | 1 | 0.1% |
| Mexican | 1 | 0.1% |
| Northern European | 2 | 0.2% |
| Norwegian | 19 | 2.1% |
| Okinawan | 3 | 0.3% |
| Polish | 7 | 0.7% |
| Puerto Rican | 27 | 2.9% |
| Scottish | 31 | 3.3% |
| Slovak | 3 | 0.3% |
| South American | 1 | 0.1% |
| Spaniard | 12 | 1.3% |
| Subsaharan African | 4 | 0.4% |
| Swedish | 4 | 0.4% |
| Swiss | 1 | 0.1% |
| Welsh | 4 | 0.4% | View All 30 Rows |
Immigrants in Fairton
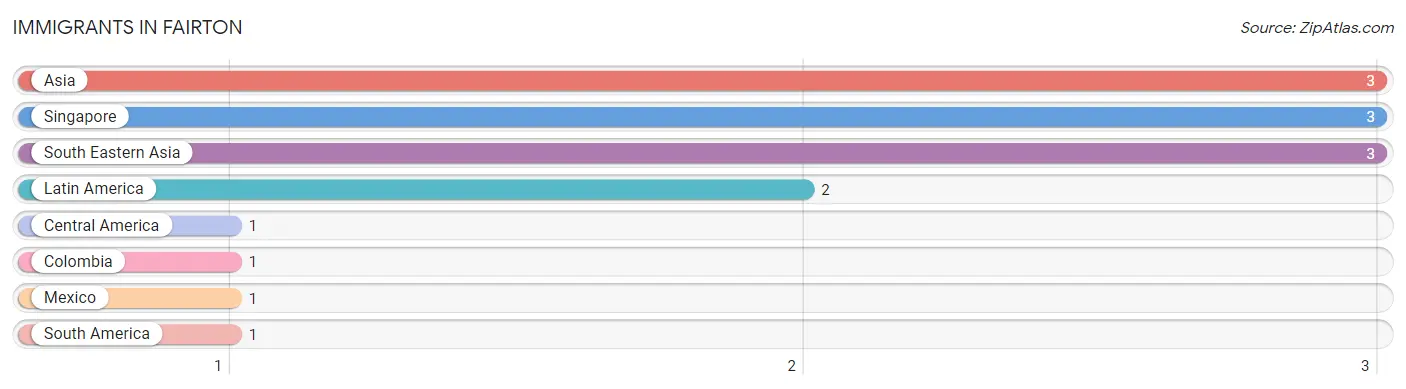
The most numerous immigrant groups reported in Fairton came from Asia (3 | 0.3%), Singapore (3 | 0.3%), South Eastern Asia (3 | 0.3%), Latin America (2 | 0.2%), and Central America (1 | 0.1%), together accounting for 1.3% of all Fairton residents.
| Immigration Origin | # Population | % Population |
| Asia | 3 | 0.3% |
| Central America | 1 | 0.1% |
| Colombia | 1 | 0.1% |
| Latin America | 2 | 0.2% |
| Mexico | 1 | 0.1% |
| Singapore | 3 | 0.3% |
| South America | 1 | 0.1% |
| South Eastern Asia | 3 | 0.3% | View All 8 Rows |
Sex and Age in Fairton
Sex and Age in Fairton
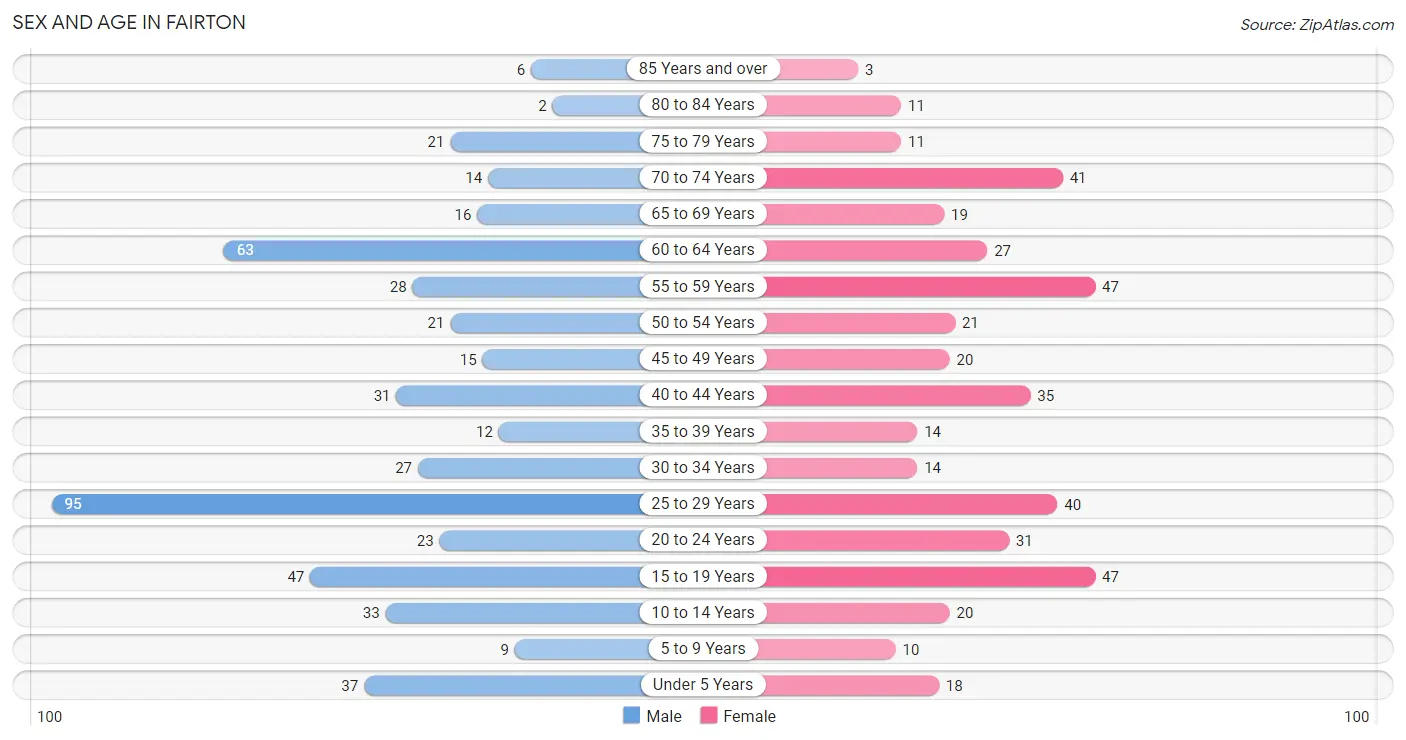
The most populous age groups in Fairton are 25 to 29 Years (95 | 19.0%) for men and 15 to 19 Years (47 | 11.0%) for women.
| Age Bracket | Male | Female |
| Under 5 Years | 37 (7.4%) | 18 (4.2%) |
| 5 to 9 Years | 9 (1.8%) | 10 (2.3%) |
| 10 to 14 Years | 33 (6.6%) | 20 (4.7%) |
| 15 to 19 Years | 47 (9.4%) | 47 (11.0%) |
| 20 to 24 Years | 23 (4.6%) | 31 (7.2%) |
| 25 to 29 Years | 95 (19.0%) | 40 (9.3%) |
| 30 to 34 Years | 27 (5.4%) | 14 (3.3%) |
| 35 to 39 Years | 12 (2.4%) | 14 (3.3%) |
| 40 to 44 Years | 31 (6.2%) | 35 (8.2%) |
| 45 to 49 Years | 15 (3.0%) | 20 (4.7%) |
| 50 to 54 Years | 21 (4.2%) | 21 (4.9%) |
| 55 to 59 Years | 28 (5.6%) | 47 (11.0%) |
| 60 to 64 Years | 63 (12.6%) | 27 (6.3%) |
| 65 to 69 Years | 16 (3.2%) | 19 (4.4%) |
| 70 to 74 Years | 14 (2.8%) | 41 (9.6%) |
| 75 to 79 Years | 21 (4.2%) | 11 (2.6%) |
| 80 to 84 Years | 2 (0.4%) | 11 (2.6%) |
| 85 Years and over | 6 (1.2%) | 3 (0.7%) |
| Total | 500 (100.0%) | 429 (100.0%) |
Families and Households in Fairton
Median Family Size in Fairton
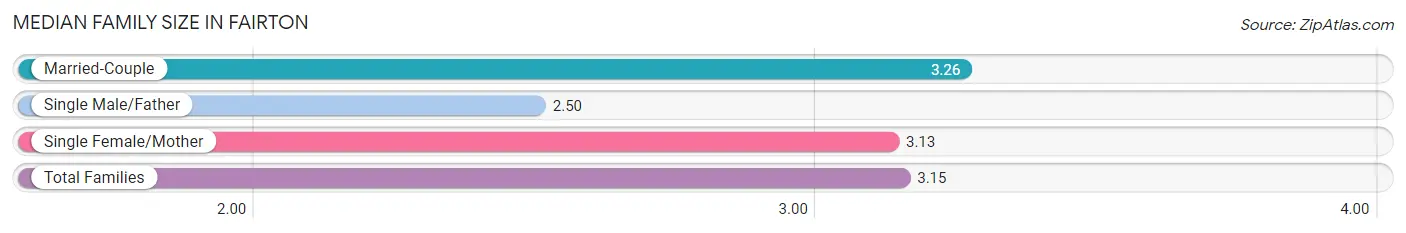
The median family size in Fairton is 3.15 persons per family, with married-couple families (175 | 74.5%) accounting for the largest median family size of 3.26 persons per family. On the other hand, single male/father families (28 | 11.9%) represent the smallest median family size with 2.50 persons per family.
| Family Type | # Families | Family Size |
| Married-Couple | 175 (74.5%) | 3.26 |
| Single Male/Father | 28 (11.9%) | 2.50 |
| Single Female/Mother | 32 (13.6%) | 3.13 |
| Total Families | 235 (100.0%) | 3.15 |
Median Household Size in Fairton
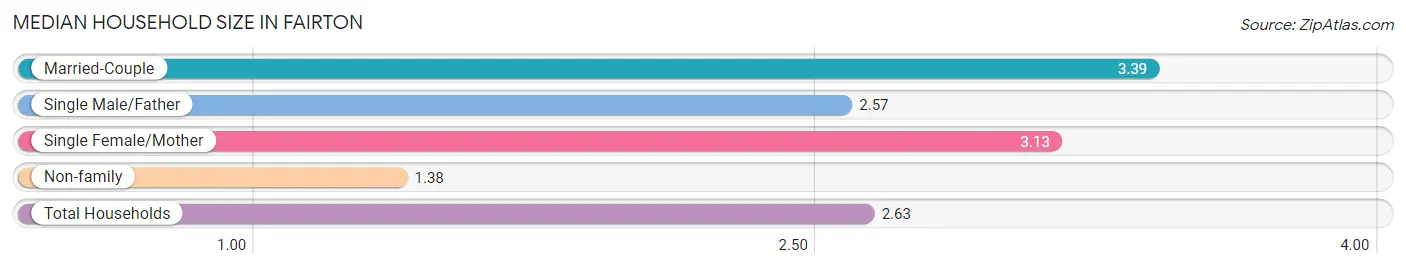
The median household size in Fairton is 2.63 persons per household, with married-couple households (175 | 49.6%) accounting for the largest median household size of 3.39 persons per household. non-family households (118 | 33.4%) represent the smallest median household size with 1.38 persons per household.
| Household Type | # Households | Household Size |
| Married-Couple | 175 (49.6%) | 3.39 |
| Single Male/Father | 28 (7.9%) | 2.57 |
| Single Female/Mother | 32 (9.1%) | 3.13 |
| Non-family | 118 (33.4%) | 1.38 |
| Total Households | 353 (100.0%) | 2.63 |
Household Size by Marriage Status in Fairton
Out of a total of 353 households in Fairton, 235 (66.6%) are family households, while 118 (33.4%) are nonfamily households. The most numerous type of family households are 2-person households, comprising 130, and the most common type of nonfamily households are 1-person households, comprising 87.
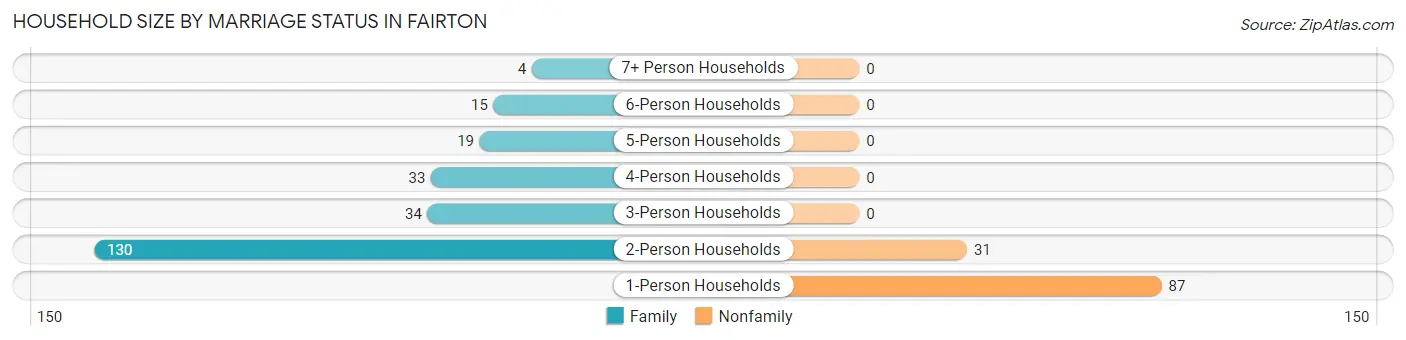
| Household Size | Family Households | Nonfamily Households |
| 1-Person Households | - | 87 (24.6%) |
| 2-Person Households | 130 (36.8%) | 31 (8.8%) |
| 3-Person Households | 34 (9.6%) | 0 (0.0%) |
| 4-Person Households | 33 (9.3%) | 0 (0.0%) |
| 5-Person Households | 19 (5.4%) | 0 (0.0%) |
| 6-Person Households | 15 (4.3%) | 0 (0.0%) |
| 7+ Person Households | 4 (1.1%) | 0 (0.0%) |
| Total | 235 (66.6%) | 118 (33.4%) |
Female Fertility in Fairton
Fertility by Age in Fairton
Average fertility rate in Fairton is 34.0 births per 1,000 women. Women in the age bracket of 35 to 50 years have the highest fertility rate with 97.0 births per 1,000 women. Women in the age bracket of 35 to 50 years acount for 100.0% of all women with births.
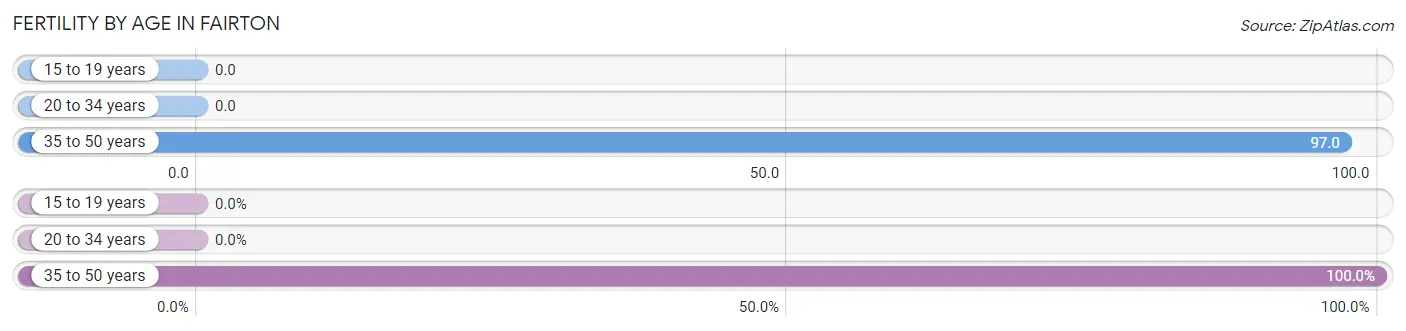
| Age Bracket | Women with Births | Births / 1,000 Women |
| 15 to 19 years | 0 (0.0%) | 0.0 |
| 20 to 34 years | 0 (0.0%) | 0.0 |
| 35 to 50 years | 7 (100.0%) | 97.0 |
| Total | 7 (100.0%) | 34.0 |
Fertility by Age by Marriage Status in Fairton
14.3% of women with births (7) in Fairton are married. The highest percentage of unmarried women with births falls into 35 to 50 years age bracket with 85.7% of them unmarried at the time of birth, while the lowest percentage of unmarried women with births belong to 35 to 50 years age bracket with 85.7% of them unmarried.
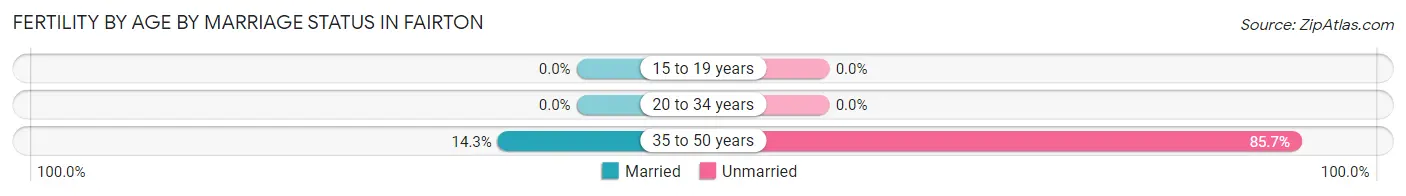
| Age Bracket | Married | Unmarried |
| 15 to 19 years | 0 (0.0%) | 0 (0.0%) |
| 20 to 34 years | 0 (0.0%) | 0 (0.0%) |
| 35 to 50 years | 1 (14.3%) | 6 (85.7%) |
| Total | 1 (14.3%) | 6 (85.7%) |
Fertility by Education in Fairton
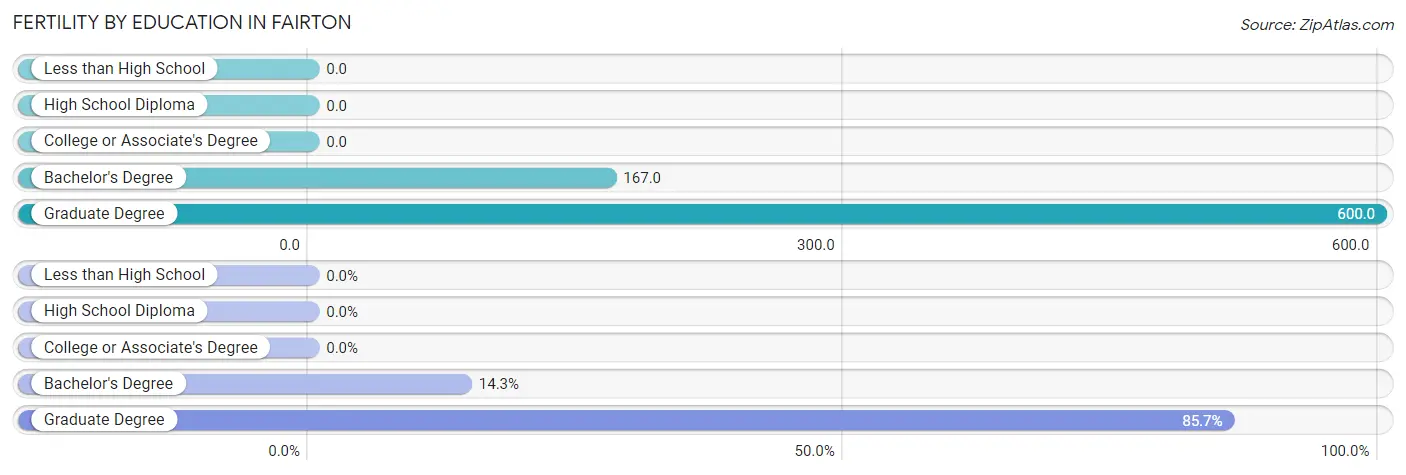
| Educational Attainment | Women with Births | Births / 1,000 Women |
| Less than High School | 0 (0.0%) | 0.0 |
| High School Diploma | 0 (0.0%) | 0.0 |
| College or Associate's Degree | 0 (0.0%) | 0.0 |
| Bachelor's Degree | 1 (14.3%) | 167.0 |
| Graduate Degree | 6 (85.7%) | 600.0 |
| Total | 7 (100.0%) | 34.0 |
Fertility by Education by Marriage Status in Fairton
85.7% of women with births in Fairton are unmarried. Women with the educational attainment of bachelor's degree are most likely to be married with 100.0% of them married at childbirth, while women with the educational attainment of graduate degree are least likely to be married with 100.0% of them unmarried at childbirth.
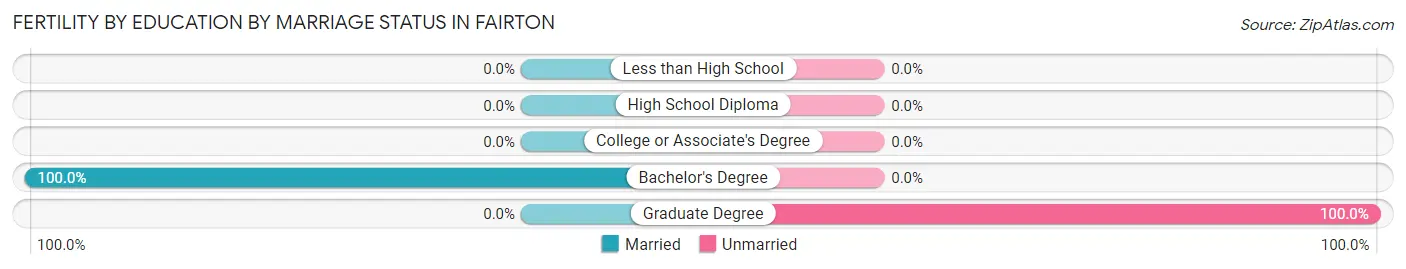
| Educational Attainment | Married | Unmarried |
| Less than High School | 0 (0.0%) | 0 (0.0%) |
| High School Diploma | 0 (0.0%) | 0 (0.0%) |
| College or Associate's Degree | 0 (0.0%) | 0 (0.0%) |
| Bachelor's Degree | 1 (100.0%) | 0 (0.0%) |
| Graduate Degree | 0 (0.0%) | 6 (100.0%) |
| Total | 1 (14.3%) | 6 (85.7%) |
Employment Characteristics in Fairton
Employment by Class of Employer in Fairton
Among the 436 employed individuals in Fairton, private company employees (297 | 68.1%), state government employees (41 | 9.4%), and local government employees (40 | 9.2%) make up the most common classes of employment.
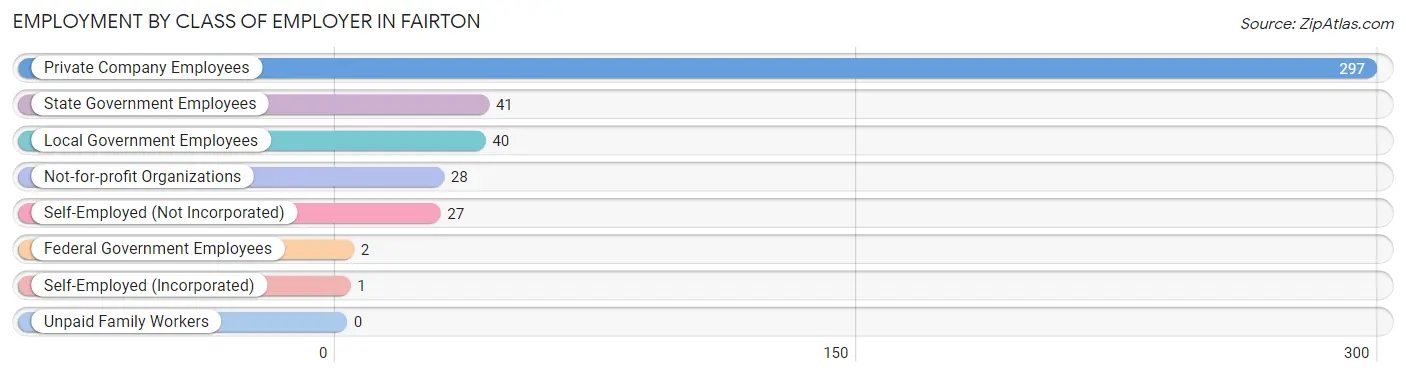
| Employer Class | # Employees | % Employees |
| Private Company Employees | 297 | 68.1% |
| Self-Employed (Incorporated) | 1 | 0.2% |
| Self-Employed (Not Incorporated) | 27 | 6.2% |
| Not-for-profit Organizations | 28 | 6.4% |
| Local Government Employees | 40 | 9.2% |
| State Government Employees | 41 | 9.4% |
| Federal Government Employees | 2 | 0.5% |
| Unpaid Family Workers | 0 | 0.0% |
| Total | 436 | 100.0% |
Employment Status by Age in Fairton
According to the labor force statistics for Fairton, out of the total population over 16 years of age (801), 63.0% or 505 individuals are in the labor force, with 12.1% or 61 of them unemployed. The age group with the highest labor force participation rate is 35 to 44 years, with 96.7% or 89 individuals in the labor force. Within the labor force, the 16 to 19 years age range has the highest percentage of unemployed individuals, with 42.9% or 27 of them being unemployed.
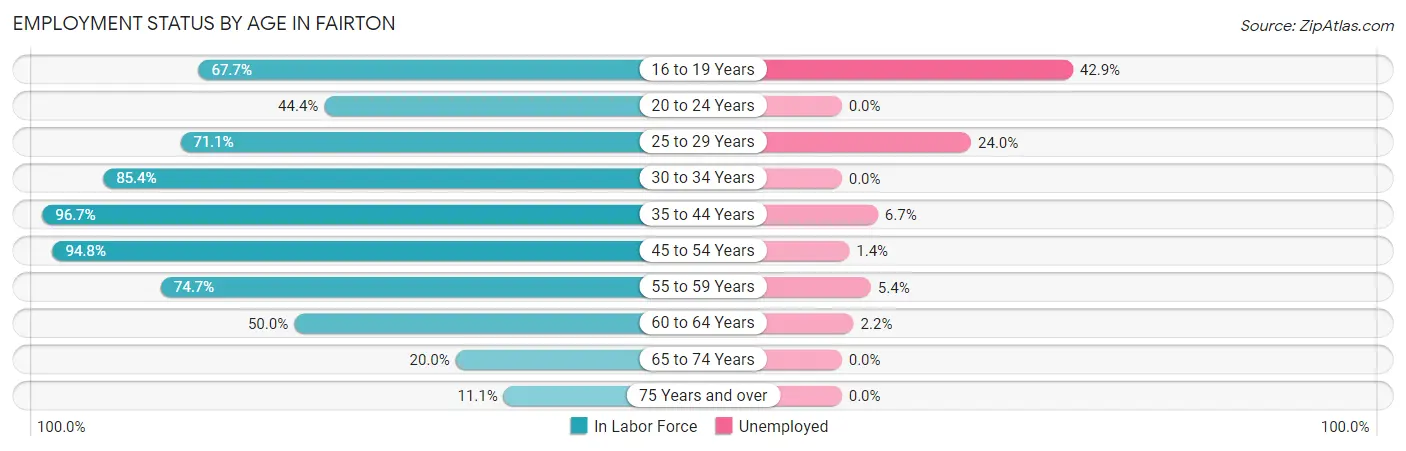
| Age Bracket | In Labor Force | Unemployed |
| 16 to 19 Years | 63 (67.7%) | 27 (42.9%) |
| 20 to 24 Years | 24 (44.4%) | 0 (0.0%) |
| 25 to 29 Years | 96 (71.1%) | 23 (24.0%) |
| 30 to 34 Years | 35 (85.4%) | 0 (0.0%) |
| 35 to 44 Years | 89 (96.7%) | 6 (6.7%) |
| 45 to 54 Years | 73 (94.8%) | 1 (1.4%) |
| 55 to 59 Years | 56 (74.7%) | 3 (5.4%) |
| 60 to 64 Years | 45 (50.0%) | 1 (2.2%) |
| 65 to 74 Years | 18 (20.0%) | 0 (0.0%) |
| 75 Years and over | 6 (11.1%) | 0 (0.0%) |
| Total | 505 (63.0%) | 61 (12.1%) |
Employment Status by Educational Attainment in Fairton
According to labor force statistics for Fairton, 77.3% of individuals (394) out of the total population between 25 and 64 years of age (510) are in the labor force, with 8.6% or 34 of them being unemployed. The group with the highest labor force participation rate are those with the educational attainment of bachelor's degree or higher, with 97.7% or 42 individuals in the labor force. Within the labor force, individuals with high school diploma education have the highest percentage of unemployment, with 11.5% or 27 of them being unemployed.
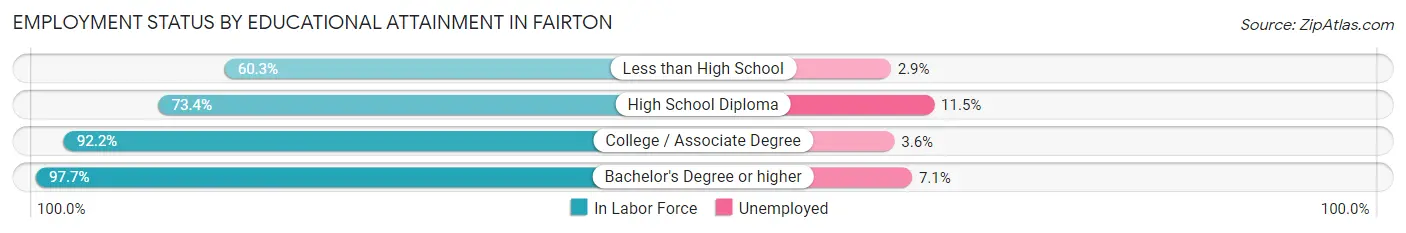
| Educational Attainment | In Labor Force | Unemployed |
| Less than High School | 35 (60.3%) | 2 (2.9%) |
| High School Diploma | 234 (73.4%) | 37 (11.5%) |
| College / Associate Degree | 83 (92.2%) | 3 (3.6%) |
| Bachelor's Degree or higher | 42 (97.7%) | 3 (7.1%) |
| Total | 394 (77.3%) | 44 (8.6%) |
Employment Occupations by Sex in Fairton
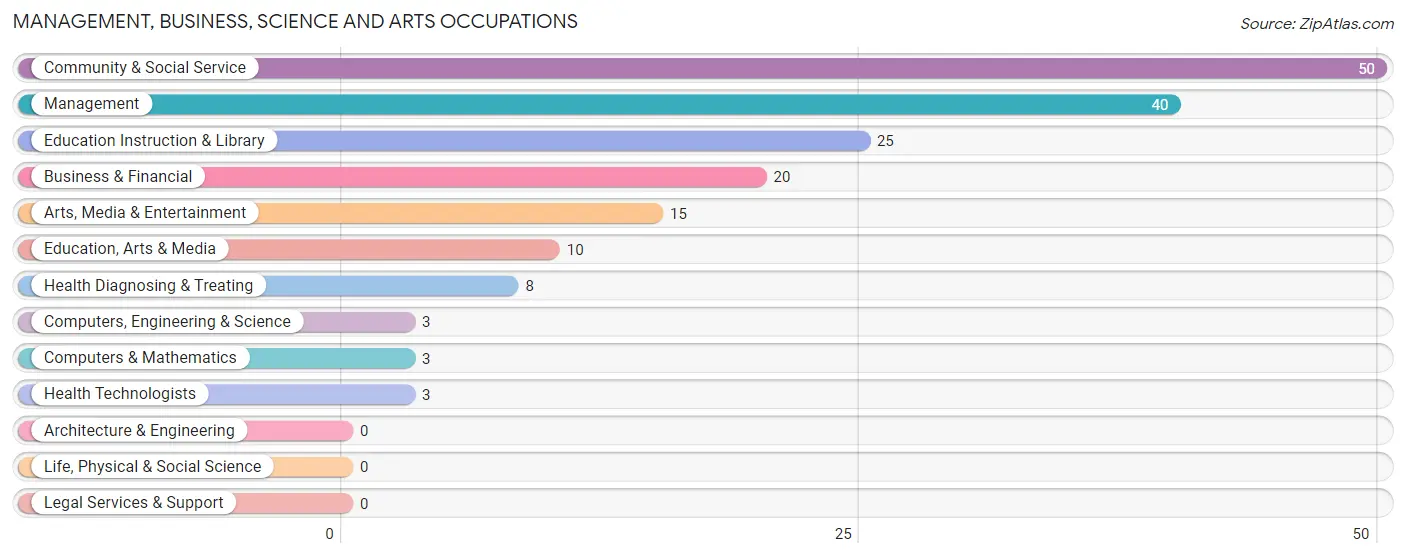
Management, Business, Science and Arts Occupations
The most common Management, Business, Science and Arts occupations in Fairton are Community & Social Service (50 | 11.3%), Management (40 | 9.0%), Education Instruction & Library (25 | 5.6%), Business & Financial (20 | 4.5%), and Arts, Media & Entertainment (15 | 3.4%).
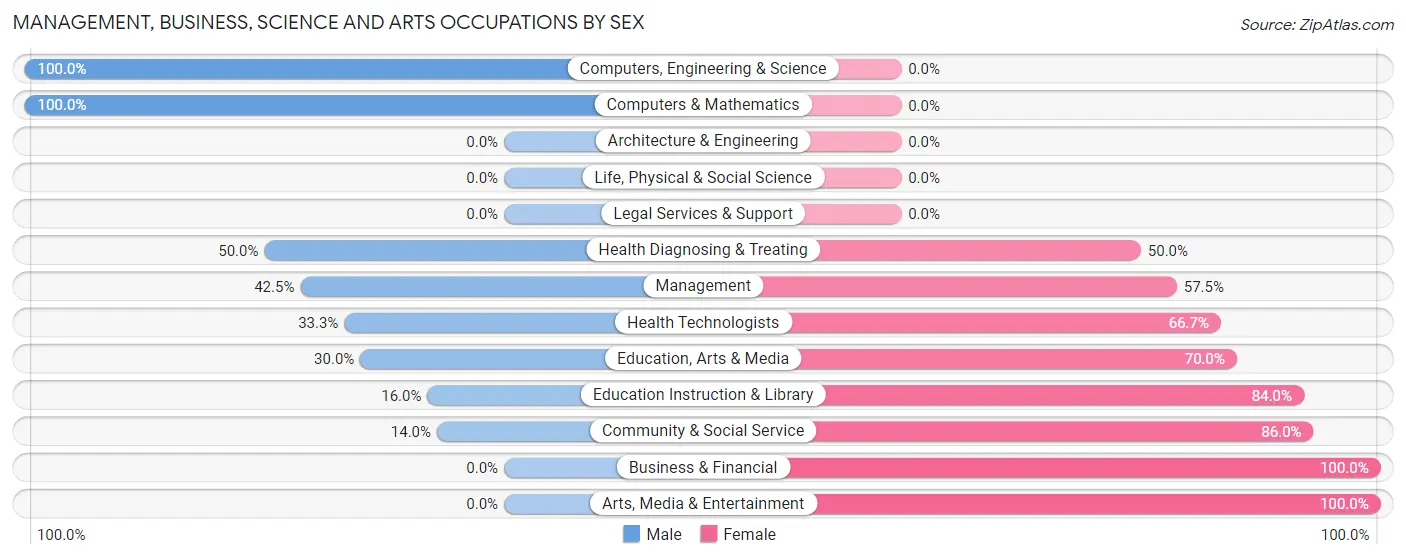
Management, Business, Science and Arts Occupations by Sex
Within the Management, Business, Science and Arts occupations in Fairton, the most male-oriented occupations are Computers, Engineering & Science (100.0%), Computers & Mathematics (100.0%), and Health Diagnosing & Treating (50.0%), while the most female-oriented occupations are Business & Financial (100.0%), Arts, Media & Entertainment (100.0%), and Community & Social Service (86.0%).
| Occupation | Male | Female |
| Management | 17 (42.5%) | 23 (57.5%) |
| Business & Financial | 0 (0.0%) | 20 (100.0%) |
| Computers, Engineering & Science | 3 (100.0%) | 0 (0.0%) |
| Computers & Mathematics | 3 (100.0%) | 0 (0.0%) |
| Architecture & Engineering | 0 (0.0%) | 0 (0.0%) |
| Life, Physical & Social Science | 0 (0.0%) | 0 (0.0%) |
| Community & Social Service | 7 (14.0%) | 43 (86.0%) |
| Education, Arts & Media | 3 (30.0%) | 7 (70.0%) |
| Legal Services & Support | 0 (0.0%) | 0 (0.0%) |
| Education Instruction & Library | 4 (16.0%) | 21 (84.0%) |
| Arts, Media & Entertainment | 0 (0.0%) | 15 (100.0%) |
| Health Diagnosing & Treating | 4 (50.0%) | 4 (50.0%) |
| Health Technologists | 1 (33.3%) | 2 (66.7%) |
| Total (Category) | 31 (25.6%) | 90 (74.4%) |
| Total (Overall) | 232 (52.2%) | 212 (47.7%) |
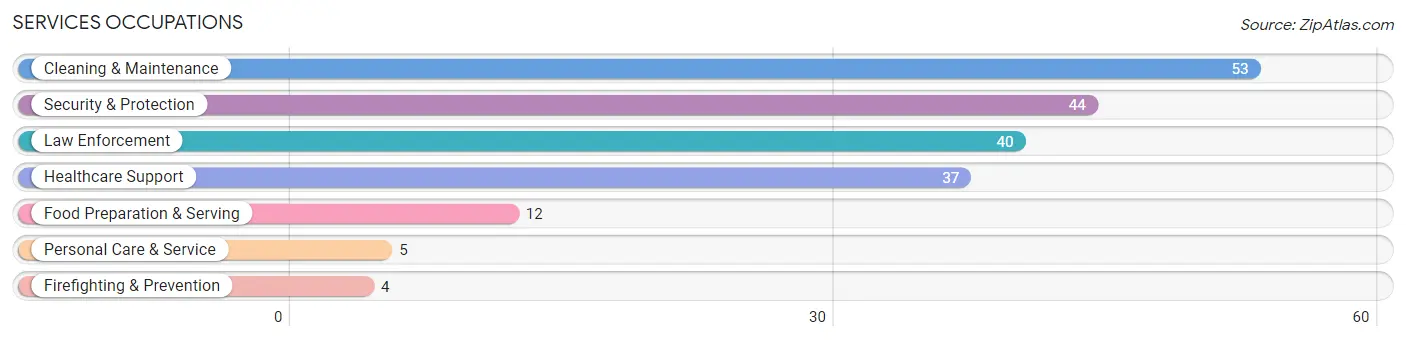
Services Occupations
The most common Services occupations in Fairton are Cleaning & Maintenance (53 | 11.9%), Security & Protection (44 | 9.9%), Law Enforcement (40 | 9.0%), Healthcare Support (37 | 8.3%), and Food Preparation & Serving (12 | 2.7%).
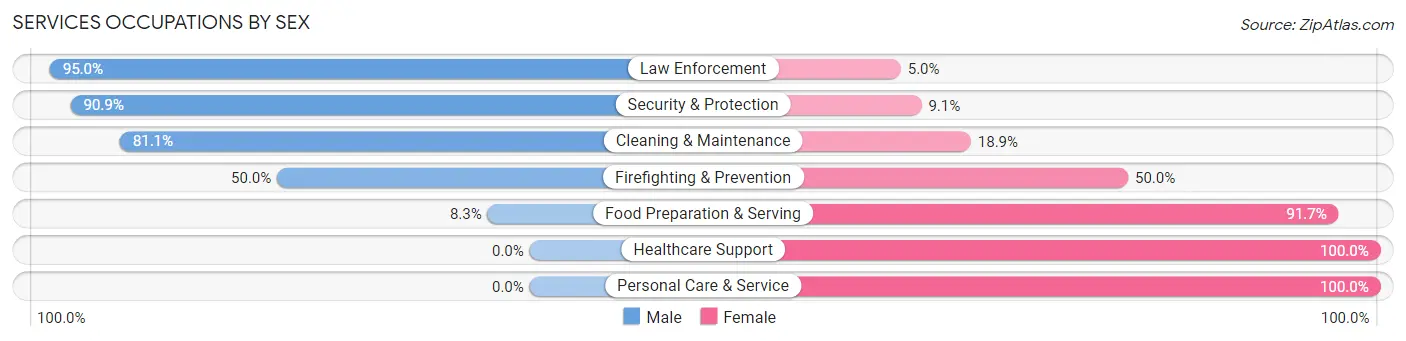
Services Occupations by Sex
Within the Services occupations in Fairton, the most male-oriented occupations are Law Enforcement (95.0%), Security & Protection (90.9%), and Cleaning & Maintenance (81.1%), while the most female-oriented occupations are Healthcare Support (100.0%), Personal Care & Service (100.0%), and Food Preparation & Serving (91.7%).
| Occupation | Male | Female |
| Healthcare Support | 0 (0.0%) | 37 (100.0%) |
| Security & Protection | 40 (90.9%) | 4 (9.1%) |
| Firefighting & Prevention | 2 (50.0%) | 2 (50.0%) |
| Law Enforcement | 38 (95.0%) | 2 (5.0%) |
| Food Preparation & Serving | 1 (8.3%) | 11 (91.7%) |
| Cleaning & Maintenance | 43 (81.1%) | 10 (18.9%) |
| Personal Care & Service | 0 (0.0%) | 5 (100.0%) |
| Total (Category) | 84 (55.6%) | 67 (44.4%) |
| Total (Overall) | 232 (52.2%) | 212 (47.7%) |
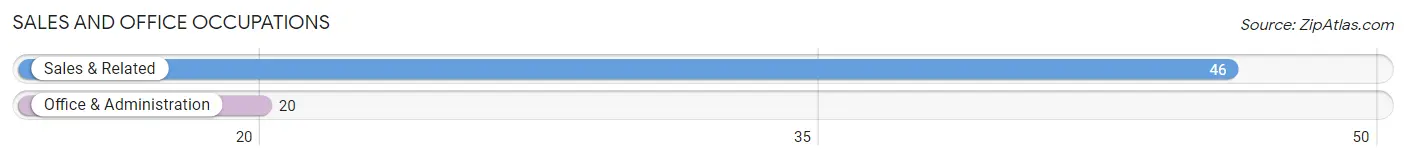
Sales and Office Occupations
The most common Sales and Office occupations in Fairton are Sales & Related (46 | 10.4%), and Office & Administration (20 | 4.5%).
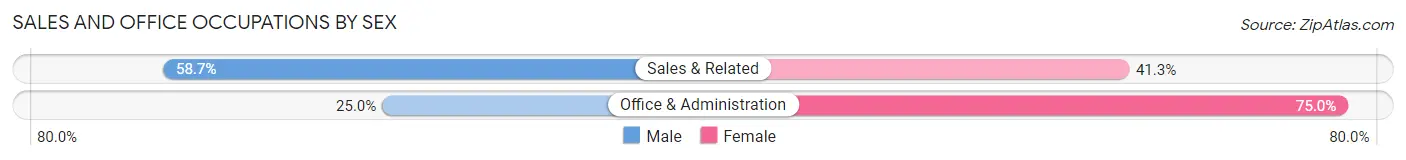
Sales and Office Occupations by Sex
| Occupation | Male | Female |
| Sales & Related | 27 (58.7%) | 19 (41.3%) |
| Office & Administration | 5 (25.0%) | 15 (75.0%) |
| Total (Category) | 32 (48.5%) | 34 (51.5%) |
| Total (Overall) | 232 (52.2%) | 212 (47.7%) |
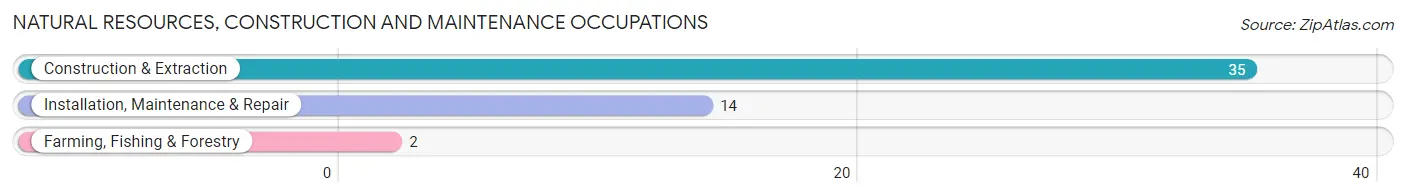
Natural Resources, Construction and Maintenance Occupations
The most common Natural Resources, Construction and Maintenance occupations in Fairton are Construction & Extraction (35 | 7.9%), Installation, Maintenance & Repair (14 | 3.2%), and Farming, Fishing & Forestry (2 | 0.4%).
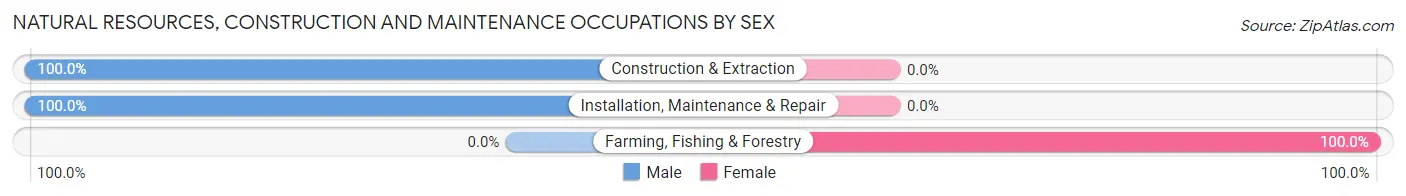
Natural Resources, Construction and Maintenance Occupations by Sex
| Occupation | Male | Female |
| Farming, Fishing & Forestry | 0 (0.0%) | 2 (100.0%) |
| Construction & Extraction | 35 (100.0%) | 0 (0.0%) |
| Installation, Maintenance & Repair | 14 (100.0%) | 0 (0.0%) |
| Total (Category) | 49 (96.1%) | 2 (3.9%) |
| Total (Overall) | 232 (52.2%) | 212 (47.7%) |
Production, Transportation and Moving Occupations
The most common Production, Transportation and Moving occupations in Fairton are Transportation (27 | 6.1%), Material Moving (15 | 3.4%), and Production (13 | 2.9%).
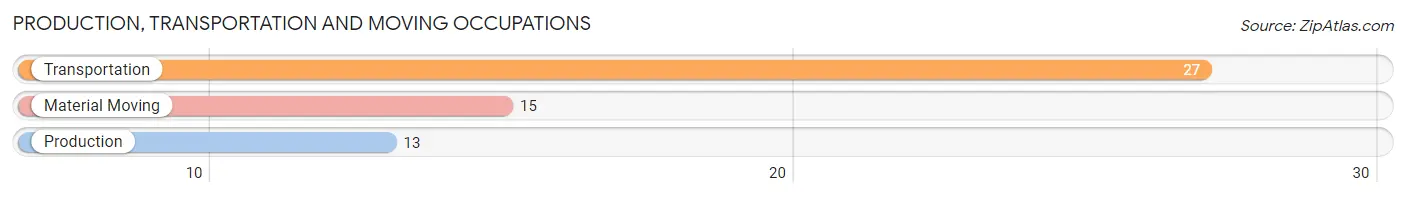
Production, Transportation and Moving Occupations by Sex
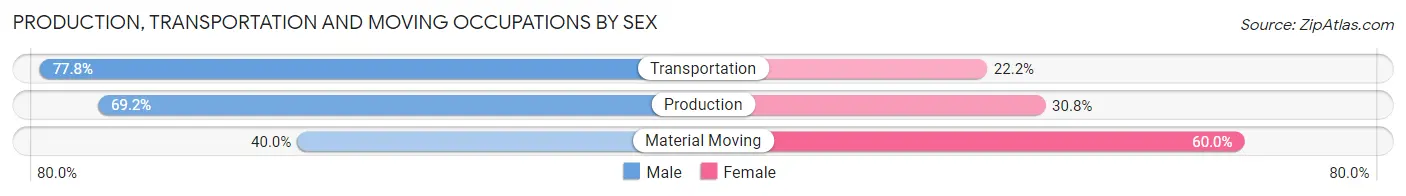
| Occupation | Male | Female |
| Production | 9 (69.2%) | 4 (30.8%) |
| Transportation | 21 (77.8%) | 6 (22.2%) |
| Material Moving | 6 (40.0%) | 9 (60.0%) |
| Total (Category) | 36 (65.4%) | 19 (34.5%) |
| Total (Overall) | 232 (52.2%) | 212 (47.7%) |
Employment Industries by Sex in Fairton
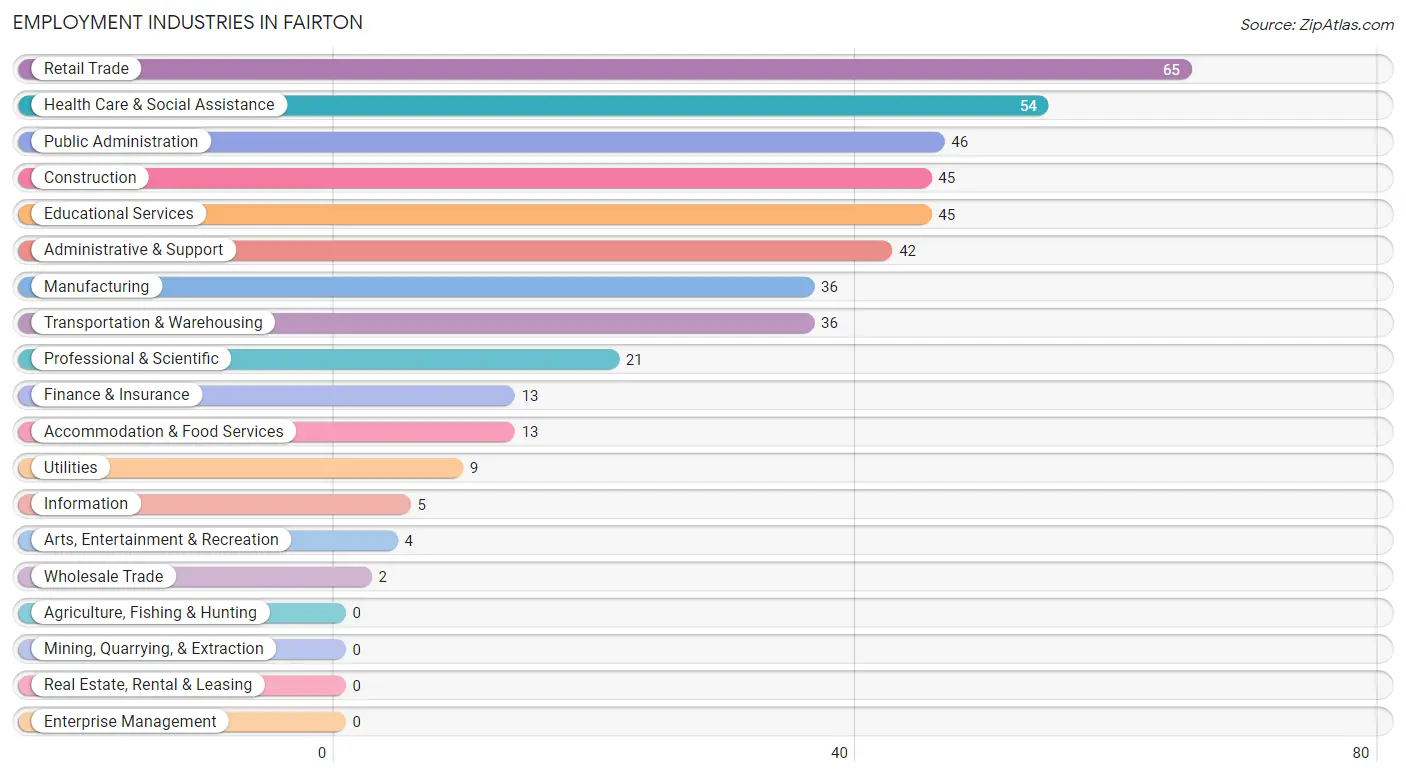
Employment Industries in Fairton
The major employment industries in Fairton include Retail Trade (65 | 14.6%), Health Care & Social Assistance (54 | 12.2%), Public Administration (46 | 10.4%), Construction (45 | 10.1%), and Educational Services (45 | 10.1%).
Employment Industries by Sex in Fairton
The Fairton industries that see more men than women are Wholesale Trade (100.0%), Arts, Entertainment & Recreation (100.0%), and Finance & Insurance (92.3%), whereas the industries that tend to have a higher number of women are Information (100.0%), Professional & Scientific (95.2%), and Health Care & Social Assistance (92.6%).
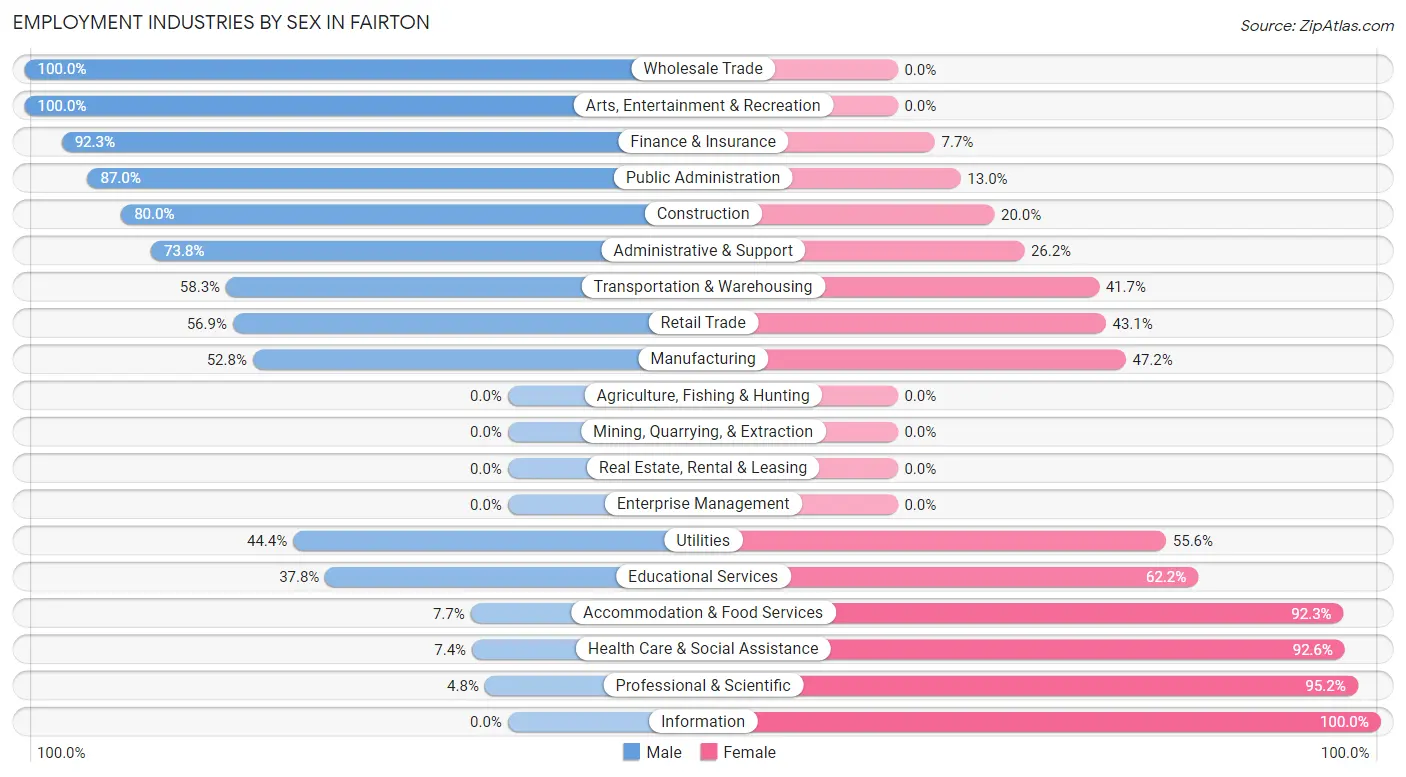
| Industry | Male | Female |
| Agriculture, Fishing & Hunting | 0 (0.0%) | 0 (0.0%) |
| Mining, Quarrying, & Extraction | 0 (0.0%) | 0 (0.0%) |
| Construction | 36 (80.0%) | 9 (20.0%) |
| Manufacturing | 19 (52.8%) | 17 (47.2%) |
| Wholesale Trade | 2 (100.0%) | 0 (0.0%) |
| Retail Trade | 37 (56.9%) | 28 (43.1%) |
| Transportation & Warehousing | 21 (58.3%) | 15 (41.7%) |
| Utilities | 4 (44.4%) | 5 (55.6%) |
| Information | 0 (0.0%) | 5 (100.0%) |
| Finance & Insurance | 12 (92.3%) | 1 (7.7%) |
| Real Estate, Rental & Leasing | 0 (0.0%) | 0 (0.0%) |
| Professional & Scientific | 1 (4.8%) | 20 (95.2%) |
| Enterprise Management | 0 (0.0%) | 0 (0.0%) |
| Administrative & Support | 31 (73.8%) | 11 (26.2%) |
| Educational Services | 17 (37.8%) | 28 (62.2%) |
| Health Care & Social Assistance | 4 (7.4%) | 50 (92.6%) |
| Arts, Entertainment & Recreation | 4 (100.0%) | 0 (0.0%) |
| Accommodation & Food Services | 1 (7.7%) | 12 (92.3%) |
| Public Administration | 40 (87.0%) | 6 (13.0%) |
| Total | 232 (52.2%) | 212 (47.7%) |
Education in Fairton
School Enrollment in Fairton
The most common levels of schooling among the 190 students in Fairton are high school (67 | 35.3%), college / undergraduate (48 | 25.3%), and middle school (38 | 20.0%).
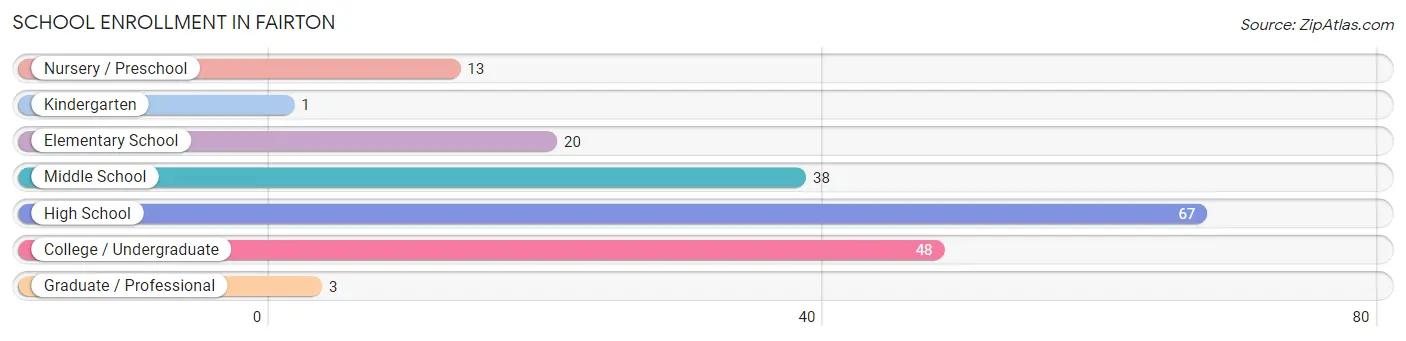
| School Level | # Students | % Students |
| Nursery / Preschool | 13 | 6.8% |
| Kindergarten | 1 | 0.5% |
| Elementary School | 20 | 10.5% |
| Middle School | 38 | 20.0% |
| High School | 67 | 35.3% |
| College / Undergraduate | 48 | 25.3% |
| Graduate / Professional | 3 | 1.6% |
| Total | 190 | 100.0% |
School Enrollment by Age by Funding Source in Fairton
Out of a total of 190 students who are enrolled in schools in Fairton, 35 (18.4%) attend a private institution, while the remaining 155 (81.6%) are enrolled in public schools. The age group of 35 years and over has the highest likelihood of being enrolled in private schools, with 22 (91.7% in the age bracket) enrolled. Conversely, the age group of 15 to 17 year olds has the lowest likelihood of being enrolled in a private school, with 53 (100.0% in the age bracket) attending a public institution.
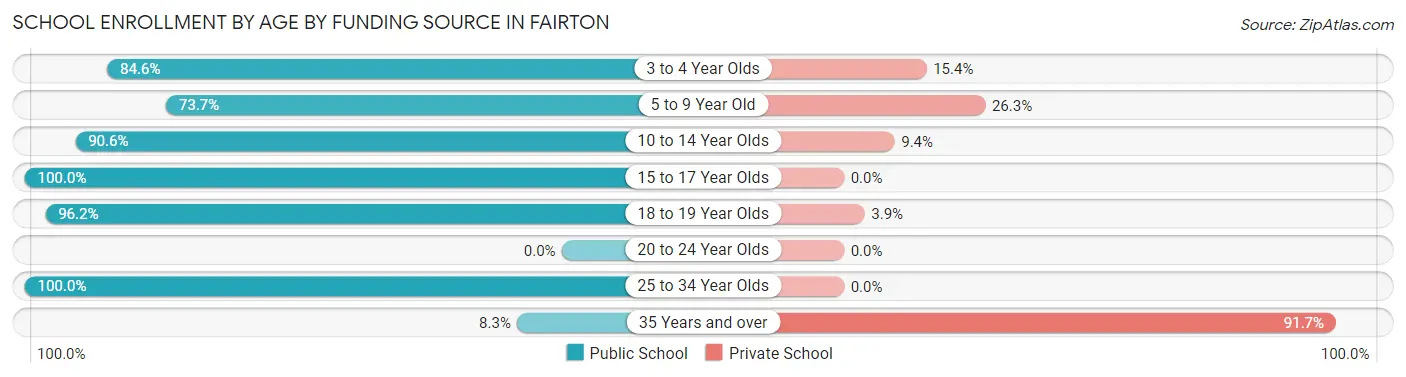
| Age Bracket | Public School | Private School |
| 3 to 4 Year Olds | 11 (84.6%) | 2 (15.4%) |
| 5 to 9 Year Old | 14 (73.7%) | 5 (26.3%) |
| 10 to 14 Year Olds | 48 (90.6%) | 5 (9.4%) |
| 15 to 17 Year Olds | 53 (100.0%) | 0 (0.0%) |
| 18 to 19 Year Olds | 25 (96.2%) | 1 (3.8%) |
| 20 to 24 Year Olds | 0 (0.0%) | 0 (0.0%) |
| 25 to 34 Year Olds | 2 (100.0%) | 0 (0.0%) |
| 35 Years and over | 2 (8.3%) | 22 (91.7%) |
| Total | 155 (81.6%) | 35 (18.4%) |
Educational Attainment by Field of Study in Fairton
Education (11 | 22.0%), liberal arts & history (8 | 16.0%), arts & humanities (8 | 16.0%), business (7 | 14.0%), and computers & mathematics (5 | 10.0%) are the most common fields of study among 50 individuals in Fairton who have obtained a bachelor's degree or higher.
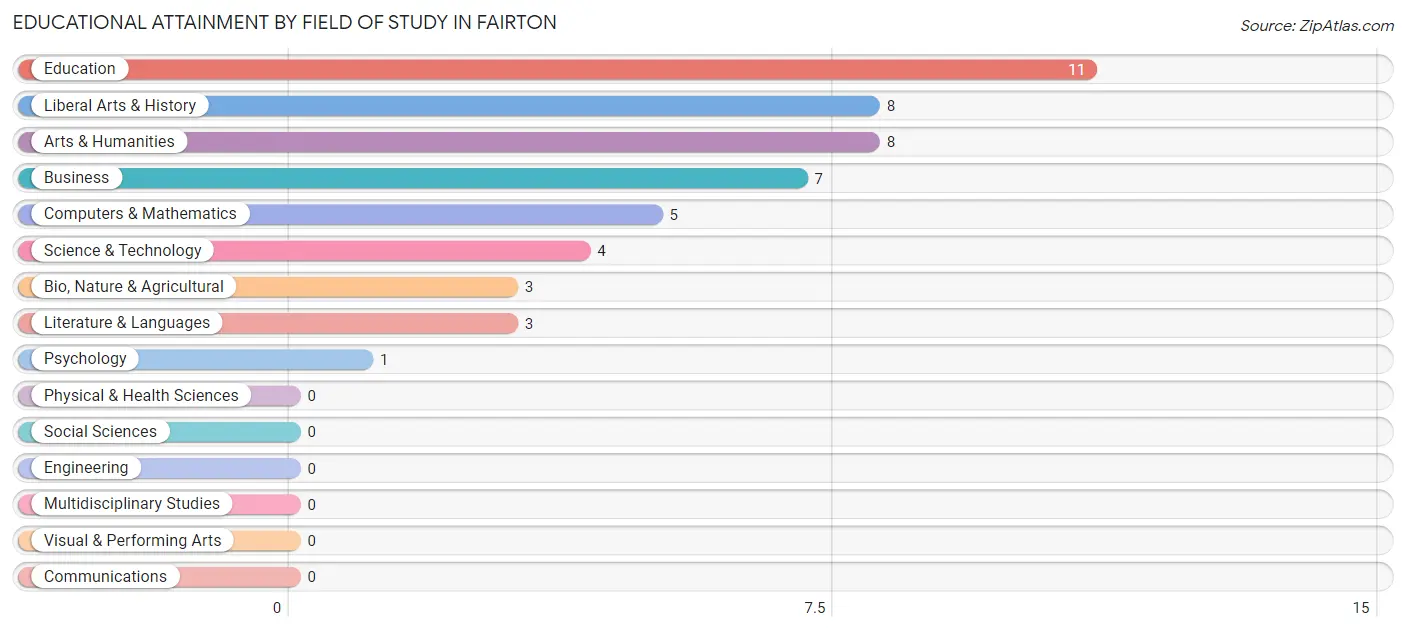
| Field of Study | # Graduates | % Graduates |
| Computers & Mathematics | 5 | 10.0% |
| Bio, Nature & Agricultural | 3 | 6.0% |
| Physical & Health Sciences | 0 | 0.0% |
| Psychology | 1 | 2.0% |
| Social Sciences | 0 | 0.0% |
| Engineering | 0 | 0.0% |
| Multidisciplinary Studies | 0 | 0.0% |
| Science & Technology | 4 | 8.0% |
| Business | 7 | 14.0% |
| Education | 11 | 22.0% |
| Literature & Languages | 3 | 6.0% |
| Liberal Arts & History | 8 | 16.0% |
| Visual & Performing Arts | 0 | 0.0% |
| Communications | 0 | 0.0% |
| Arts & Humanities | 8 | 16.0% |
| Total | 50 | 100.0% |
Transportation & Commute in Fairton
Vehicle Availability by Sex in Fairton
The most prevalent vehicle ownership categories in Fairton are males with 2 vehicles (98, accounting for 42.6%) and females with 2 vehicles (92, making up 47.6%).
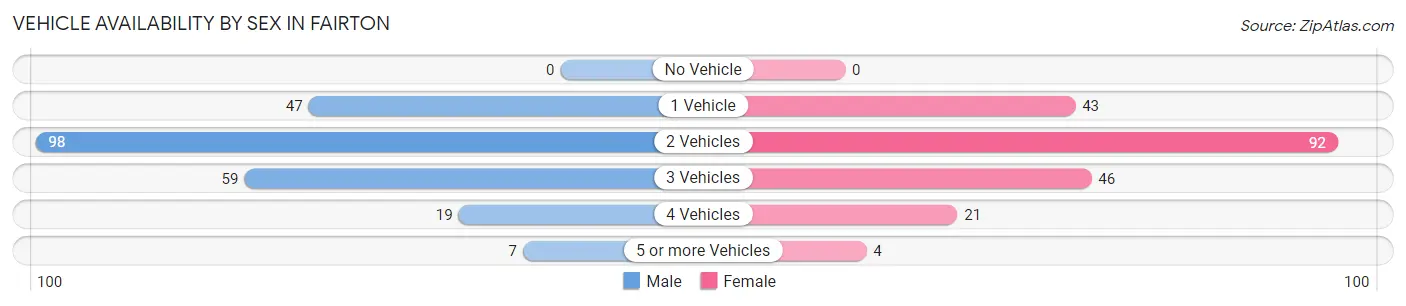
| Vehicles Available | Male | Female |
| No Vehicle | 0 (0.0%) | 0 (0.0%) |
| 1 Vehicle | 47 (20.4%) | 43 (20.9%) |
| 2 Vehicles | 98 (42.6%) | 92 (44.7%) |
| 3 Vehicles | 59 (25.7%) | 46 (22.3%) |
| 4 Vehicles | 19 (8.3%) | 21 (10.2%) |
| 5 or more Vehicles | 7 (3.0%) | 4 (1.9%) |
| Total | 230 (100.0%) | 206 (100.0%) |
Commute Time in Fairton
The most frequently occuring commute durations in Fairton are 15 to 19 minutes (74 commuters, 17.7%), 30 to 34 minutes (72 commuters, 17.2%), and 20 to 24 minutes (66 commuters, 15.8%).
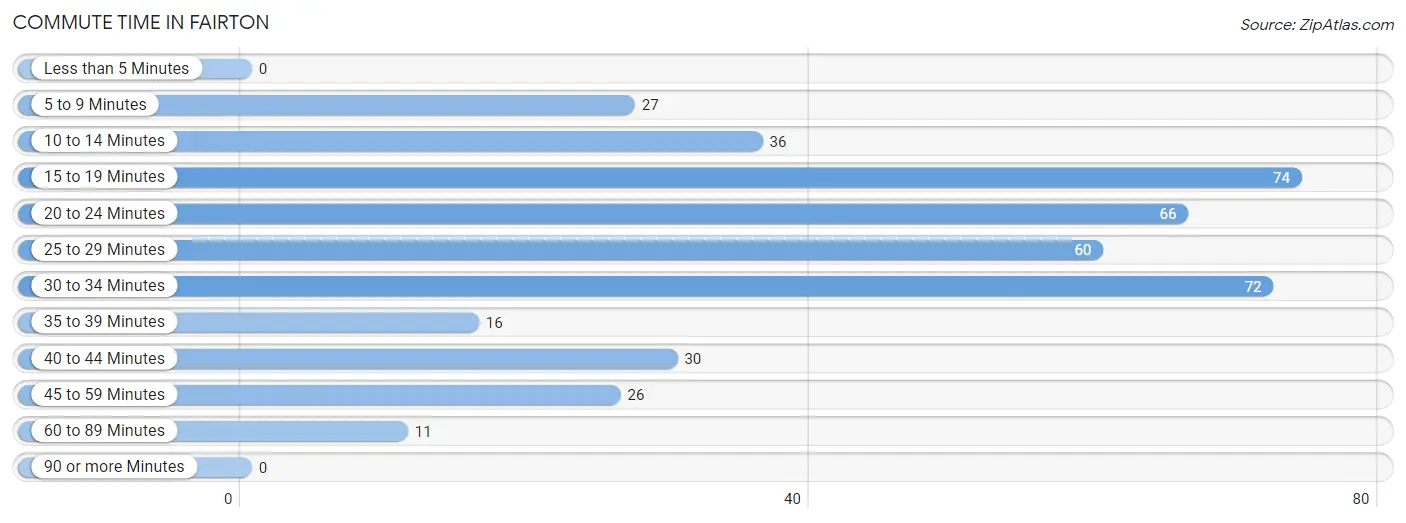
| Commute Time | # Commuters | % Commuters |
| Less than 5 Minutes | 0 | 0.0% |
| 5 to 9 Minutes | 27 | 6.5% |
| 10 to 14 Minutes | 36 | 8.6% |
| 15 to 19 Minutes | 74 | 17.7% |
| 20 to 24 Minutes | 66 | 15.8% |
| 25 to 29 Minutes | 60 | 14.3% |
| 30 to 34 Minutes | 72 | 17.2% |
| 35 to 39 Minutes | 16 | 3.8% |
| 40 to 44 Minutes | 30 | 7.2% |
| 45 to 59 Minutes | 26 | 6.2% |
| 60 to 89 Minutes | 11 | 2.6% |
| 90 or more Minutes | 0 | 0.0% |
Commute Time by Sex in Fairton
The most common commute times in Fairton are 15 to 19 minutes (60 commuters, 27.0%) for males and 20 to 24 minutes (53 commuters, 27.0%) for females.
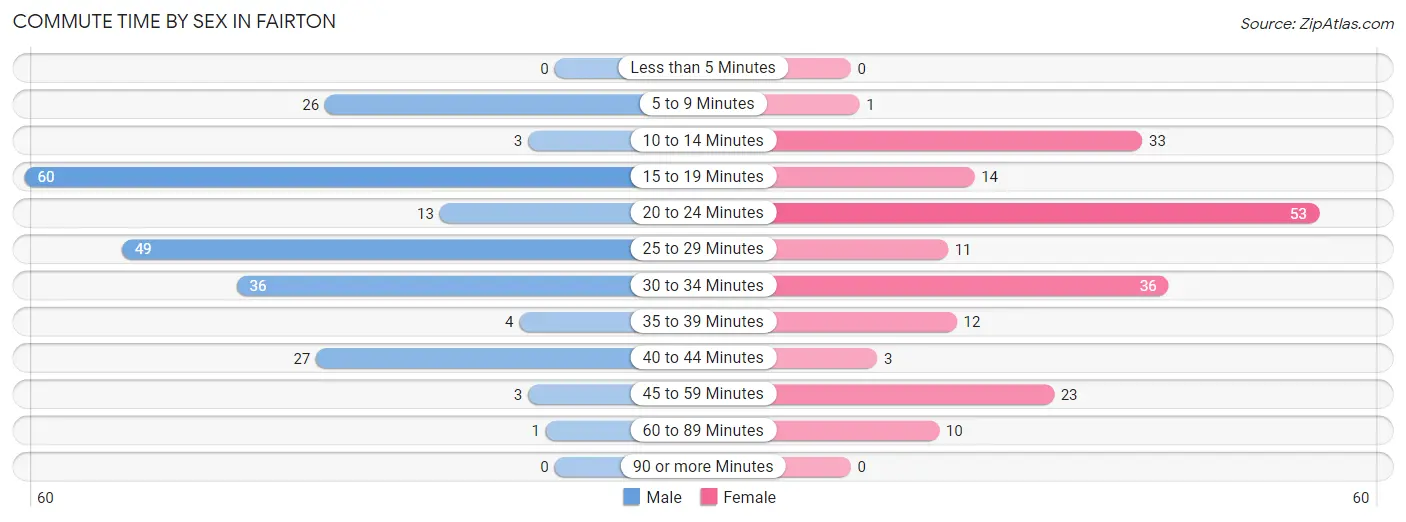
| Commute Time | Male | Female |
| Less than 5 Minutes | 0 (0.0%) | 0 (0.0%) |
| 5 to 9 Minutes | 26 (11.7%) | 1 (0.5%) |
| 10 to 14 Minutes | 3 (1.3%) | 33 (16.8%) |
| 15 to 19 Minutes | 60 (27.0%) | 14 (7.1%) |
| 20 to 24 Minutes | 13 (5.9%) | 53 (27.0%) |
| 25 to 29 Minutes | 49 (22.1%) | 11 (5.6%) |
| 30 to 34 Minutes | 36 (16.2%) | 36 (18.4%) |
| 35 to 39 Minutes | 4 (1.8%) | 12 (6.1%) |
| 40 to 44 Minutes | 27 (12.2%) | 3 (1.5%) |
| 45 to 59 Minutes | 3 (1.3%) | 23 (11.7%) |
| 60 to 89 Minutes | 1 (0.4%) | 10 (5.1%) |
| 90 or more Minutes | 0 (0.0%) | 0 (0.0%) |
Time of Departure to Work by Sex in Fairton
The most frequent times of departure to work in Fairton are 5:00 AM to 5:29 AM (39, 17.6%) for males and 8:00 AM to 8:29 AM (33, 16.8%) for females.
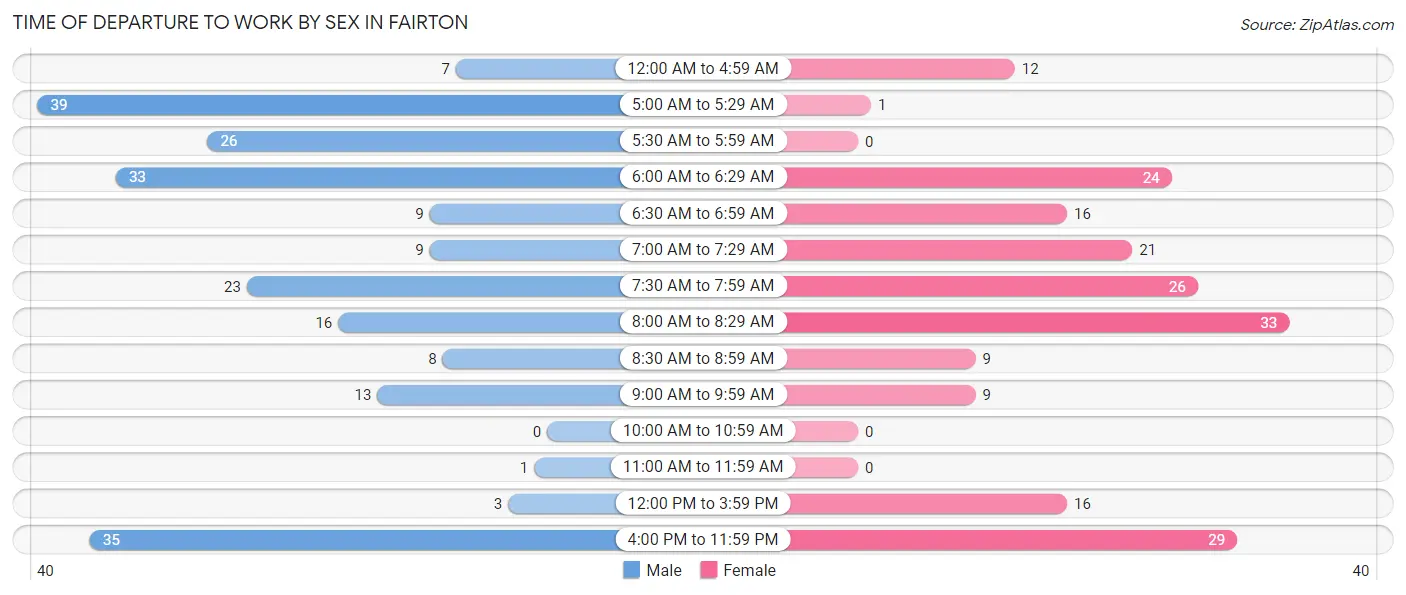
| Time of Departure | Male | Female |
| 12:00 AM to 4:59 AM | 7 (3.2%) | 12 (6.1%) |
| 5:00 AM to 5:29 AM | 39 (17.6%) | 1 (0.5%) |
| 5:30 AM to 5:59 AM | 26 (11.7%) | 0 (0.0%) |
| 6:00 AM to 6:29 AM | 33 (14.9%) | 24 (12.2%) |
| 6:30 AM to 6:59 AM | 9 (4.1%) | 16 (8.2%) |
| 7:00 AM to 7:29 AM | 9 (4.1%) | 21 (10.7%) |
| 7:30 AM to 7:59 AM | 23 (10.4%) | 26 (13.3%) |
| 8:00 AM to 8:29 AM | 16 (7.2%) | 33 (16.8%) |
| 8:30 AM to 8:59 AM | 8 (3.6%) | 9 (4.6%) |
| 9:00 AM to 9:59 AM | 13 (5.9%) | 9 (4.6%) |
| 10:00 AM to 10:59 AM | 0 (0.0%) | 0 (0.0%) |
| 11:00 AM to 11:59 AM | 1 (0.4%) | 0 (0.0%) |
| 12:00 PM to 3:59 PM | 3 (1.3%) | 16 (8.2%) |
| 4:00 PM to 11:59 PM | 35 (15.8%) | 29 (14.8%) |
| Total | 222 (100.0%) | 196 (100.0%) |
Housing Occupancy in Fairton
Occupancy by Ownership in Fairton
Of the total 353 dwellings in Fairton, owner-occupied units account for 275 (77.9%), while renter-occupied units make up 78 (22.1%).
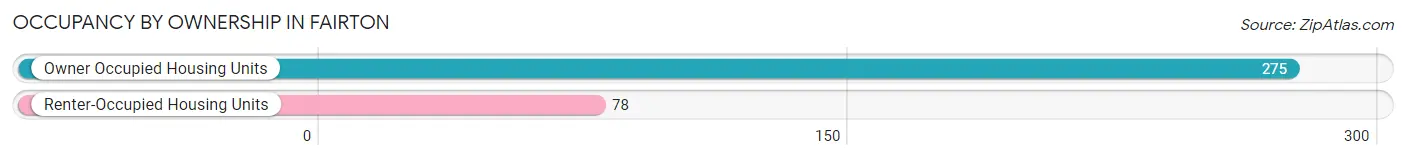
| Occupancy | # Housing Units | % Housing Units |
| Owner Occupied Housing Units | 275 | 77.9% |
| Renter-Occupied Housing Units | 78 | 22.1% |
| Total Occupied Housing Units | 353 | 100.0% |
Occupancy by Household Size in Fairton
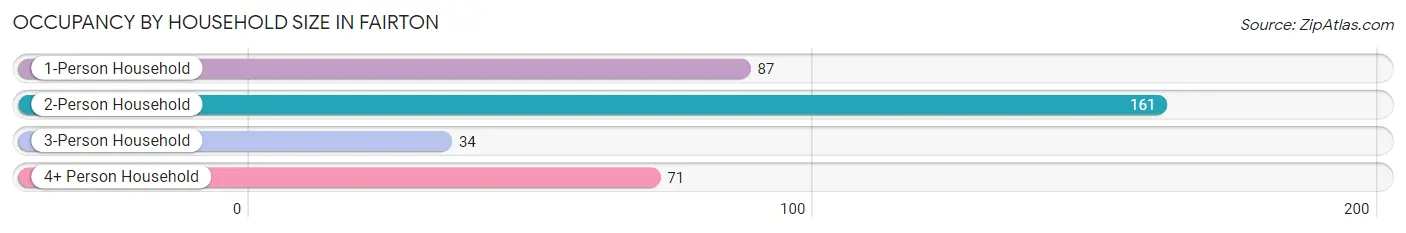
| Household Size | # Housing Units | % Housing Units |
| 1-Person Household | 87 | 24.6% |
| 2-Person Household | 161 | 45.6% |
| 3-Person Household | 34 | 9.6% |
| 4+ Person Household | 71 | 20.1% |
| Total Housing Units | 353 | 100.0% |
Occupancy by Ownership by Household Size in Fairton
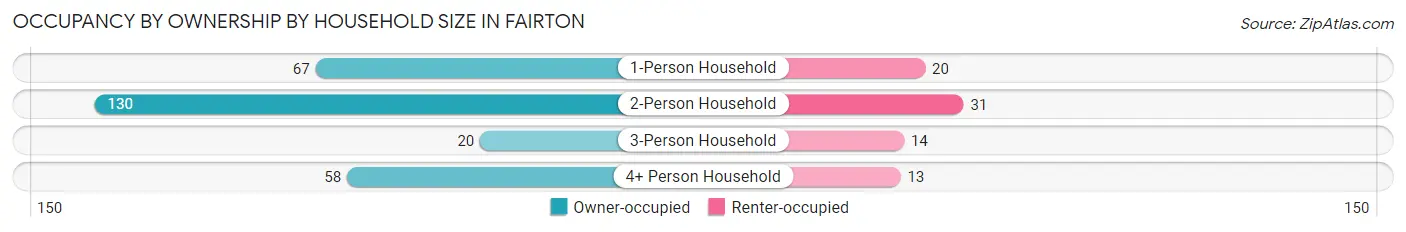
| Household Size | Owner-occupied | Renter-occupied |
| 1-Person Household | 67 (77.0%) | 20 (23.0%) |
| 2-Person Household | 130 (80.7%) | 31 (19.3%) |
| 3-Person Household | 20 (58.8%) | 14 (41.2%) |
| 4+ Person Household | 58 (81.7%) | 13 (18.3%) |
| Total Housing Units | 275 (77.9%) | 78 (22.1%) |
Occupancy by Educational Attainment in Fairton
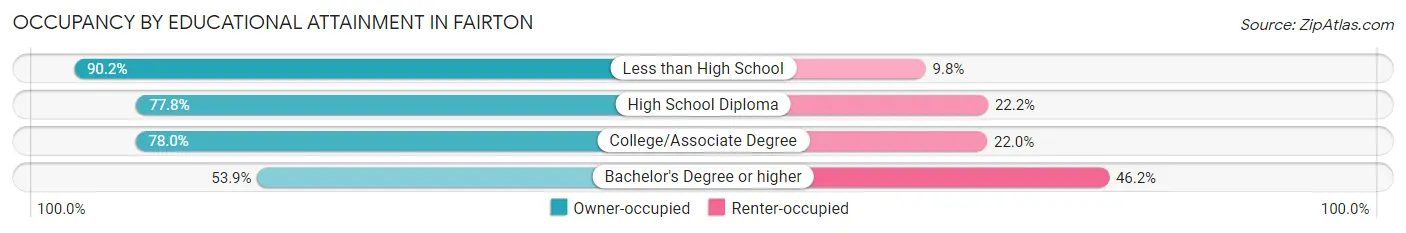
| Household Size | Owner-occupied | Renter-occupied |
| Less than High School | 46 (90.2%) | 5 (9.8%) |
| High School Diploma | 144 (77.8%) | 41 (22.2%) |
| College/Associate Degree | 71 (78.0%) | 20 (22.0%) |
| Bachelor's Degree or higher | 14 (53.8%) | 12 (46.2%) |
Occupancy by Age of Householder in Fairton
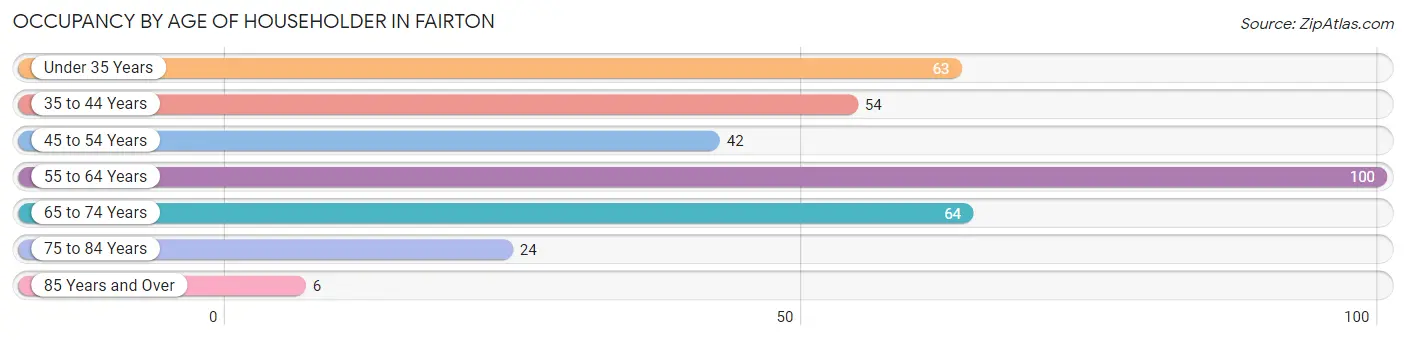
| Age Bracket | # Households | % Households |
| Under 35 Years | 63 | 17.8% |
| 35 to 44 Years | 54 | 15.3% |
| 45 to 54 Years | 42 | 11.9% |
| 55 to 64 Years | 100 | 28.3% |
| 65 to 74 Years | 64 | 18.1% |
| 75 to 84 Years | 24 | 6.8% |
| 85 Years and Over | 6 | 1.7% |
| Total | 353 | 100.0% |
Housing Finances in Fairton
Median Income by Occupancy in Fairton
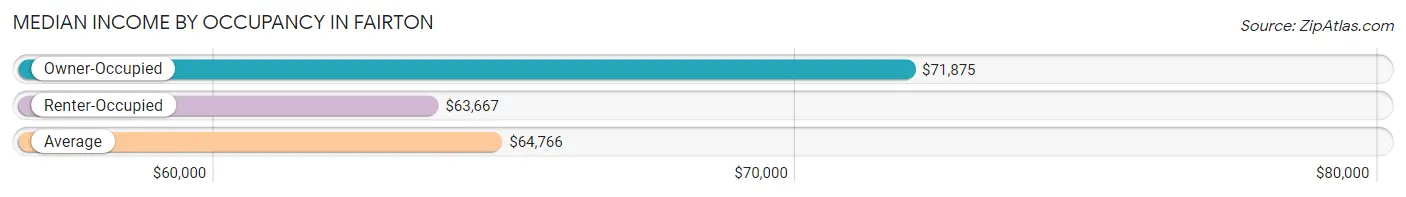
| Occupancy Type | # Households | Median Income |
| Owner-Occupied | 275 (77.9%) | $71,875 |
| Renter-Occupied | 78 (22.1%) | $63,667 |
| Average | 353 (100.0%) | $64,766 |
Occupancy by Householder Income Bracket in Fairton
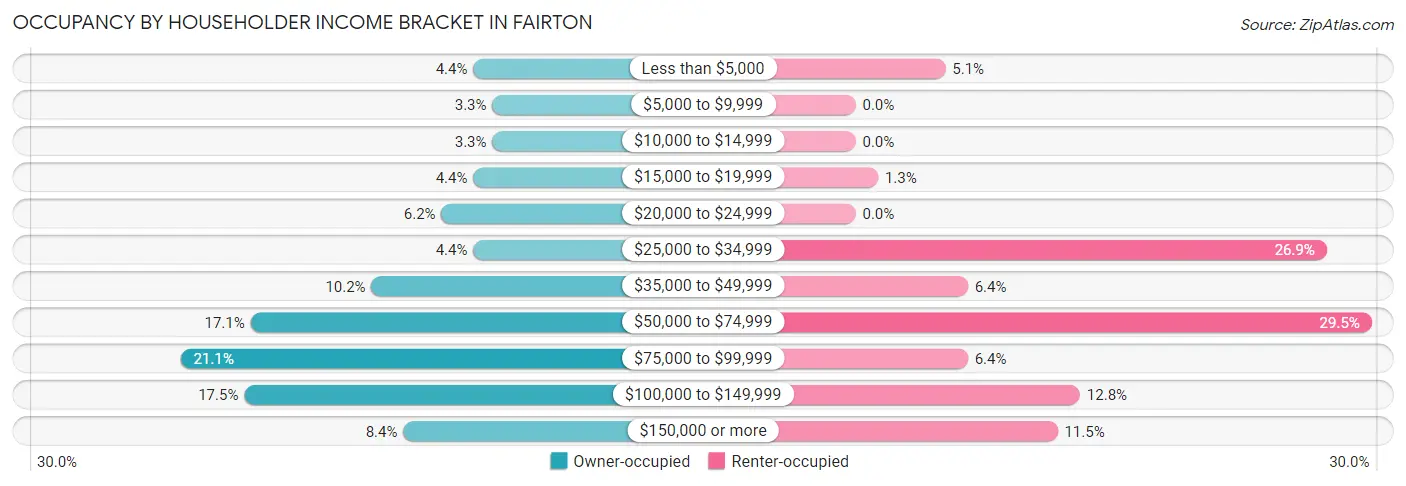
| Income Bracket | Owner-occupied | Renter-occupied |
| Less than $5,000 | 12 (4.4%) | 4 (5.1%) |
| $5,000 to $9,999 | 9 (3.3%) | 0 (0.0%) |
| $10,000 to $14,999 | 9 (3.3%) | 0 (0.0%) |
| $15,000 to $19,999 | 12 (4.4%) | 1 (1.3%) |
| $20,000 to $24,999 | 17 (6.2%) | 0 (0.0%) |
| $25,000 to $34,999 | 12 (4.4%) | 21 (26.9%) |
| $35,000 to $49,999 | 28 (10.2%) | 5 (6.4%) |
| $50,000 to $74,999 | 47 (17.1%) | 23 (29.5%) |
| $75,000 to $99,999 | 58 (21.1%) | 5 (6.4%) |
| $100,000 to $149,999 | 48 (17.4%) | 10 (12.8%) |
| $150,000 or more | 23 (8.4%) | 9 (11.5%) |
| Total | 275 (100.0%) | 78 (100.0%) |
Monthly Housing Cost Tiers in Fairton
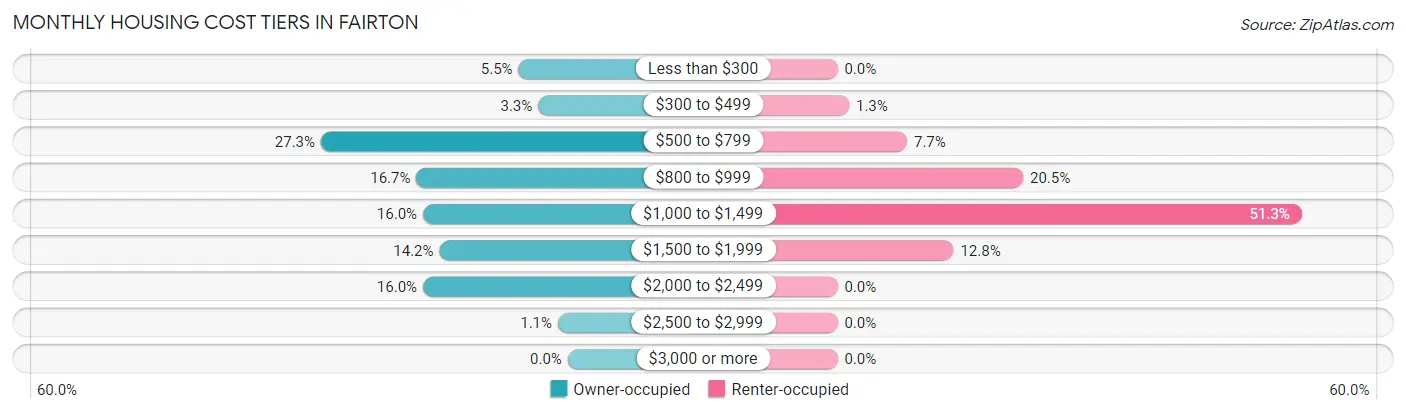
| Monthly Cost | Owner-occupied | Renter-occupied |
| Less than $300 | 15 (5.4%) | 0 (0.0%) |
| $300 to $499 | 9 (3.3%) | 1 (1.3%) |
| $500 to $799 | 75 (27.3%) | 6 (7.7%) |
| $800 to $999 | 46 (16.7%) | 16 (20.5%) |
| $1,000 to $1,499 | 44 (16.0%) | 40 (51.3%) |
| $1,500 to $1,999 | 39 (14.2%) | 10 (12.8%) |
| $2,000 to $2,499 | 44 (16.0%) | 0 (0.0%) |
| $2,500 to $2,999 | 3 (1.1%) | 0 (0.0%) |
| $3,000 or more | 0 (0.0%) | 0 (0.0%) |
| Total | 275 (100.0%) | 78 (100.0%) |
Physical Housing Characteristics in Fairton
Housing Structures in Fairton
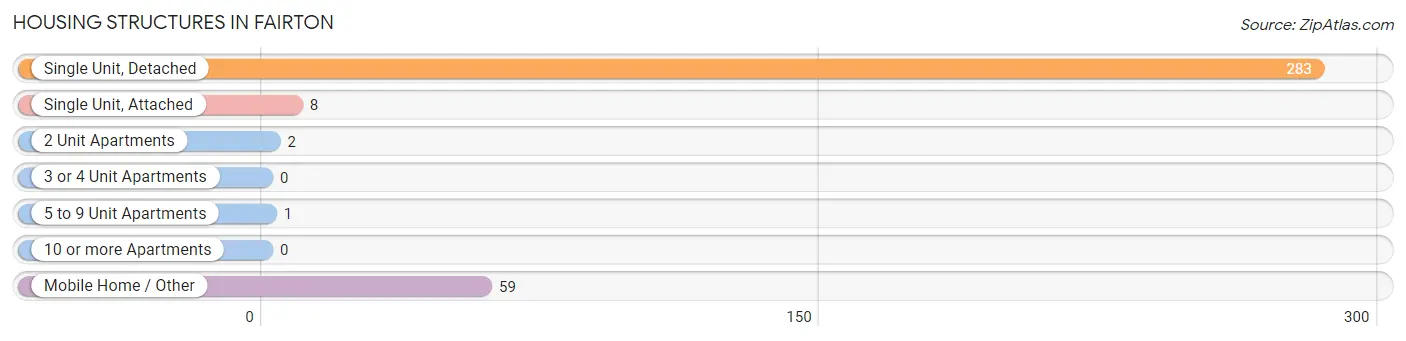
| Structure Type | # Housing Units | % Housing Units |
| Single Unit, Detached | 283 | 80.2% |
| Single Unit, Attached | 8 | 2.3% |
| 2 Unit Apartments | 2 | 0.6% |
| 3 or 4 Unit Apartments | 0 | 0.0% |
| 5 to 9 Unit Apartments | 1 | 0.3% |
| 10 or more Apartments | 0 | 0.0% |
| Mobile Home / Other | 59 | 16.7% |
| Total | 353 | 100.0% |
Housing Structures by Occupancy in Fairton
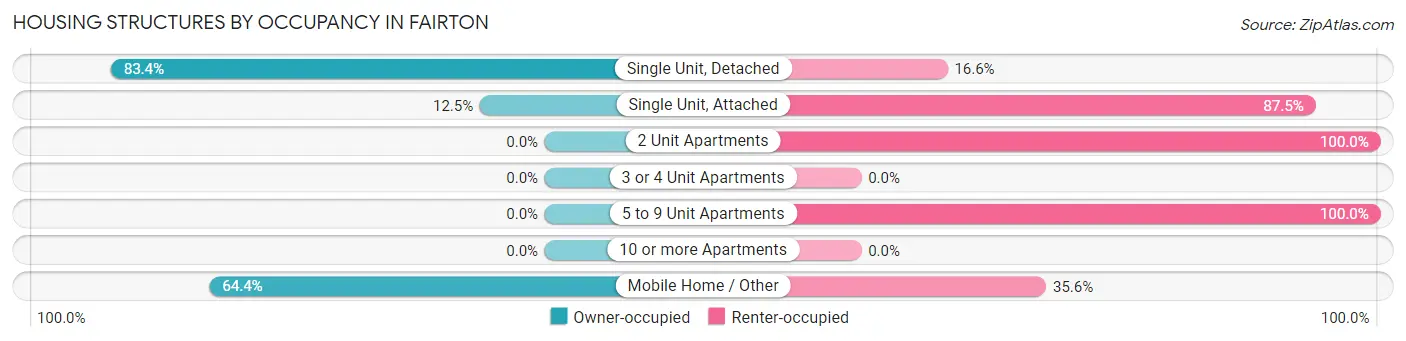
| Structure Type | Owner-occupied | Renter-occupied |
| Single Unit, Detached | 236 (83.4%) | 47 (16.6%) |
| Single Unit, Attached | 1 (12.5%) | 7 (87.5%) |
| 2 Unit Apartments | 0 (0.0%) | 2 (100.0%) |
| 3 or 4 Unit Apartments | 0 (0.0%) | 0 (0.0%) |
| 5 to 9 Unit Apartments | 0 (0.0%) | 1 (100.0%) |
| 10 or more Apartments | 0 (0.0%) | 0 (0.0%) |
| Mobile Home / Other | 38 (64.4%) | 21 (35.6%) |
| Total | 275 (77.9%) | 78 (22.1%) |
Housing Structures by Number of Rooms in Fairton
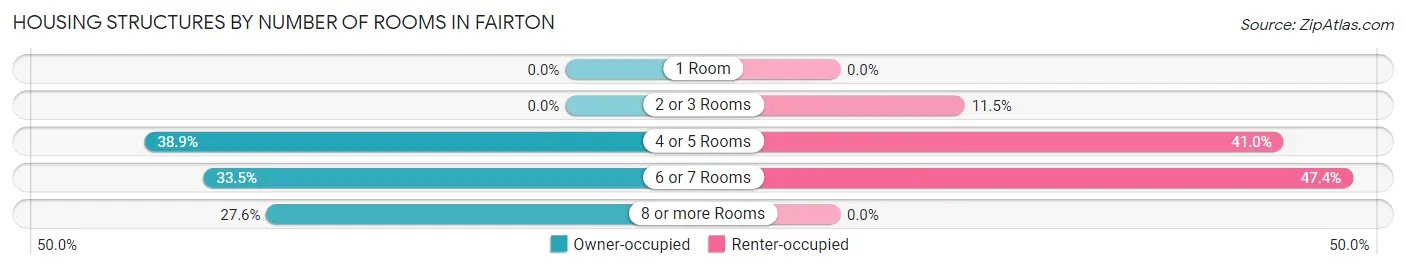
| Number of Rooms | Owner-occupied | Renter-occupied |
| 1 Room | 0 (0.0%) | 0 (0.0%) |
| 2 or 3 Rooms | 0 (0.0%) | 9 (11.5%) |
| 4 or 5 Rooms | 107 (38.9%) | 32 (41.0%) |
| 6 or 7 Rooms | 92 (33.5%) | 37 (47.4%) |
| 8 or more Rooms | 76 (27.6%) | 0 (0.0%) |
| Total | 275 (100.0%) | 78 (100.0%) |
Housing Structure by Heating Type in Fairton
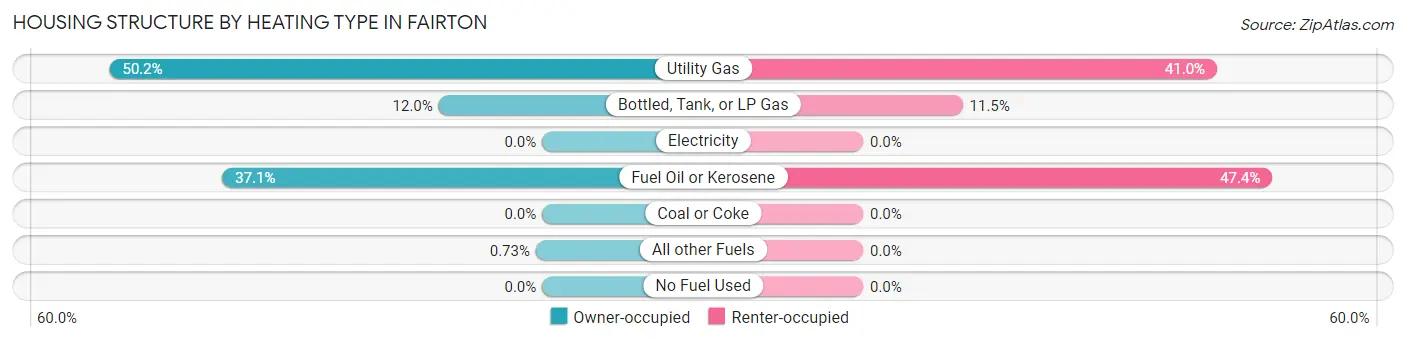
| Heating Type | Owner-occupied | Renter-occupied |
| Utility Gas | 138 (50.2%) | 32 (41.0%) |
| Bottled, Tank, or LP Gas | 33 (12.0%) | 9 (11.5%) |
| Electricity | 0 (0.0%) | 0 (0.0%) |
| Fuel Oil or Kerosene | 102 (37.1%) | 37 (47.4%) |
| Coal or Coke | 0 (0.0%) | 0 (0.0%) |
| All other Fuels | 2 (0.7%) | 0 (0.0%) |
| No Fuel Used | 0 (0.0%) | 0 (0.0%) |
| Total | 275 (100.0%) | 78 (100.0%) |
Household Vehicle Usage in Fairton
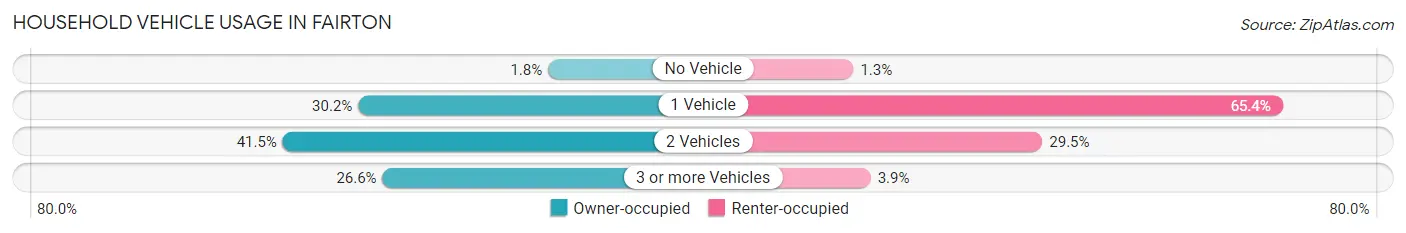
| Vehicles per Household | Owner-occupied | Renter-occupied |
| No Vehicle | 5 (1.8%) | 1 (1.3%) |
| 1 Vehicle | 83 (30.2%) | 51 (65.4%) |
| 2 Vehicles | 114 (41.4%) | 23 (29.5%) |
| 3 or more Vehicles | 73 (26.6%) | 3 (3.8%) |
| Total | 275 (100.0%) | 78 (100.0%) |
Real Estate & Mortgages in Fairton
Real Estate and Mortgage Overview in Fairton
| Characteristic | Without Mortgage | With Mortgage |
| Housing Units | 124 | 151 |
| Median Property Value | $150,000 | $195,700 |
| Median Household Income | $48,333 | $14 |
| Monthly Housing Costs | $680 | $0 |
| Real Estate Taxes | $4,360 | $3 |
Property Value by Mortgage Status in Fairton
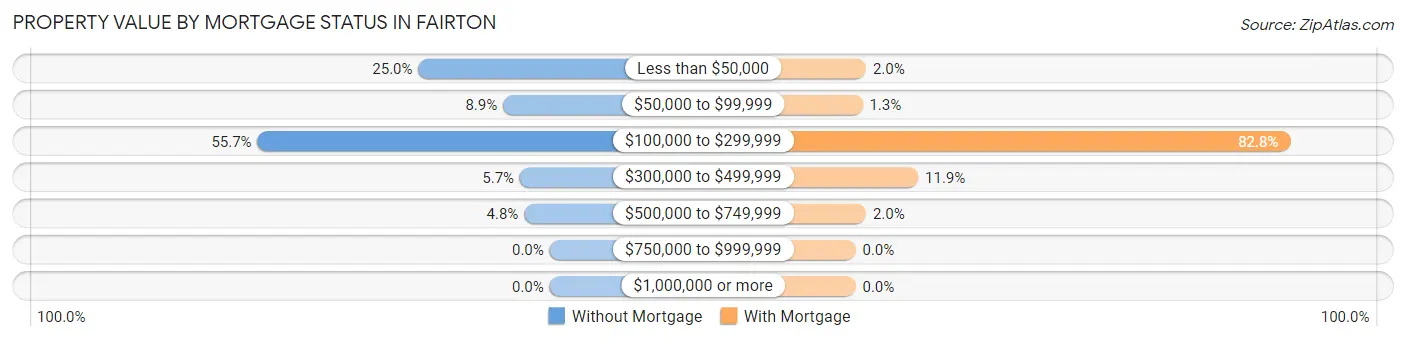
| Property Value | Without Mortgage | With Mortgage |
| Less than $50,000 | 31 (25.0%) | 3 (2.0%) |
| $50,000 to $99,999 | 11 (8.9%) | 2 (1.3%) |
| $100,000 to $299,999 | 69 (55.6%) | 125 (82.8%) |
| $300,000 to $499,999 | 7 (5.7%) | 18 (11.9%) |
| $500,000 to $749,999 | 6 (4.8%) | 3 (2.0%) |
| $750,000 to $999,999 | 0 (0.0%) | 0 (0.0%) |
| $1,000,000 or more | 0 (0.0%) | 0 (0.0%) |
| Total | 124 (100.0%) | 151 (100.0%) |
Household Income by Mortgage Status in Fairton
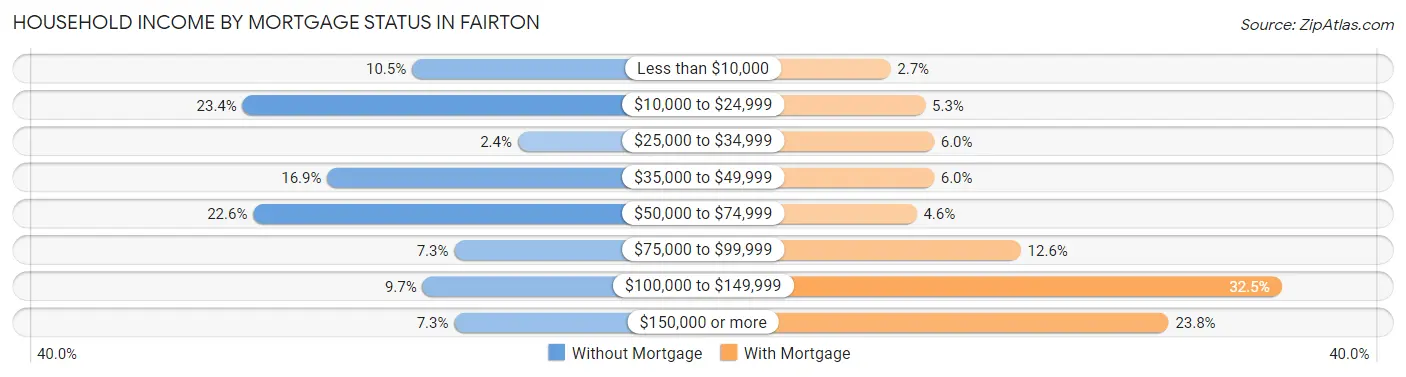
| Household Income | Without Mortgage | With Mortgage |
| Less than $10,000 | 13 (10.5%) | 4 (2.6%) |
| $10,000 to $24,999 | 29 (23.4%) | 8 (5.3%) |
| $25,000 to $34,999 | 3 (2.4%) | 9 (6.0%) |
| $35,000 to $49,999 | 21 (16.9%) | 9 (6.0%) |
| $50,000 to $74,999 | 28 (22.6%) | 7 (4.6%) |
| $75,000 to $99,999 | 9 (7.3%) | 19 (12.6%) |
| $100,000 to $149,999 | 12 (9.7%) | 49 (32.5%) |
| $150,000 or more | 9 (7.3%) | 36 (23.8%) |
| Total | 124 (100.0%) | 151 (100.0%) |
Property Value to Household Income Ratio in Fairton
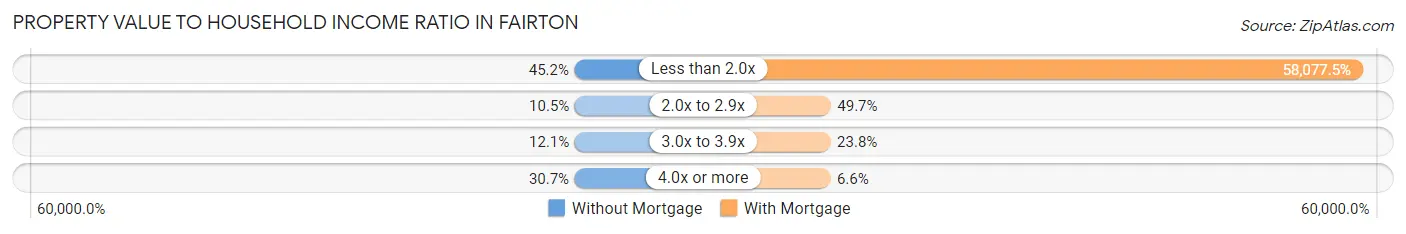
| Value-to-Income Ratio | Without Mortgage | With Mortgage |
| Less than 2.0x | 56 (45.2%) | 87,697 (58,077.5%) |
| 2.0x to 2.9x | 13 (10.5%) | 75 (49.7%) |
| 3.0x to 3.9x | 15 (12.1%) | 36 (23.8%) |
| 4.0x or more | 38 (30.6%) | 10 (6.6%) |
| Total | 124 (100.0%) | 151 (100.0%) |
Real Estate Taxes by Mortgage Status in Fairton
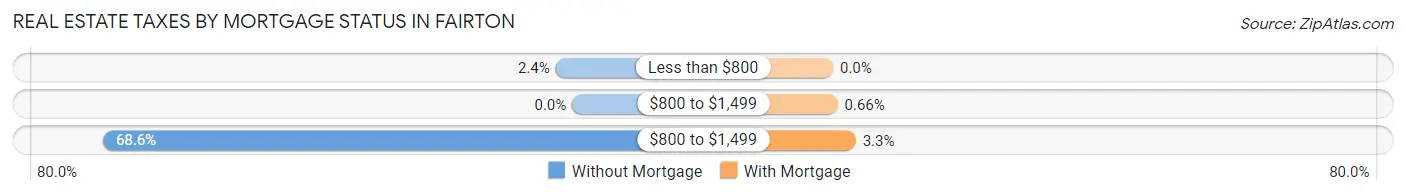
| Property Taxes | Without Mortgage | With Mortgage |
| Less than $800 | 3 (2.4%) | 0 (0.0%) |
| $800 to $1,499 | 0 (0.0%) | 1 (0.7%) |
| $800 to $1,499 | 85 (68.5%) | 5 (3.3%) |
| Total | 124 (100.0%) | 151 (100.0%) |
Health & Disability in Fairton
Health Insurance Coverage by Age in Fairton
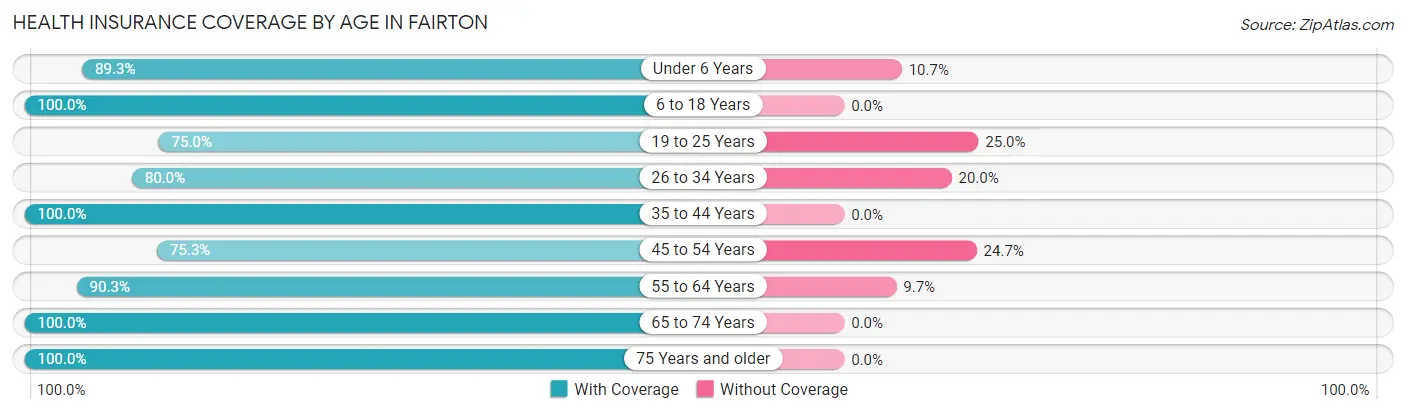
| Age Bracket | With Coverage | Without Coverage |
| Under 6 Years | 50 (89.3%) | 6 (10.7%) |
| 6 to 18 Years | 131 (100.0%) | 0 (0.0%) |
| 19 to 25 Years | 78 (75.0%) | 26 (25.0%) |
| 26 to 34 Years | 128 (80.0%) | 32 (20.0%) |
| 35 to 44 Years | 92 (100.0%) | 0 (0.0%) |
| 45 to 54 Years | 58 (75.3%) | 19 (24.7%) |
| 55 to 64 Years | 149 (90.3%) | 16 (9.7%) |
| 65 to 74 Years | 90 (100.0%) | 0 (0.0%) |
| 75 Years and older | 54 (100.0%) | 0 (0.0%) |
| Total | 830 (89.3%) | 99 (10.7%) |
Health Insurance Coverage by Citizenship Status in Fairton
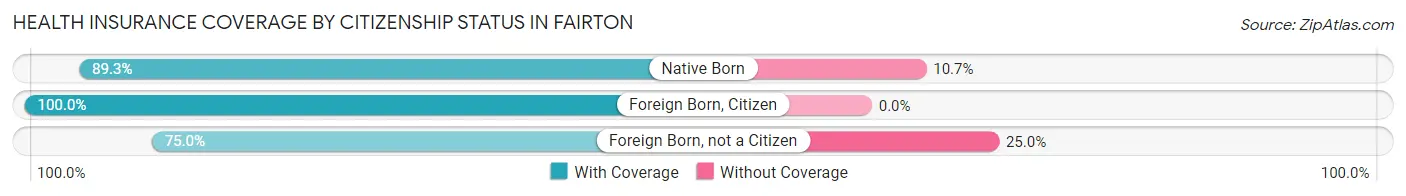
| Citizenship Status | With Coverage | Without Coverage |
| Native Born | 50 (89.3%) | 6 (10.7%) |
| Foreign Born, Citizen | 131 (100.0%) | 0 (0.0%) |
| Foreign Born, not a Citizen | 78 (75.0%) | 26 (25.0%) |
Health Insurance Coverage by Household Income in Fairton
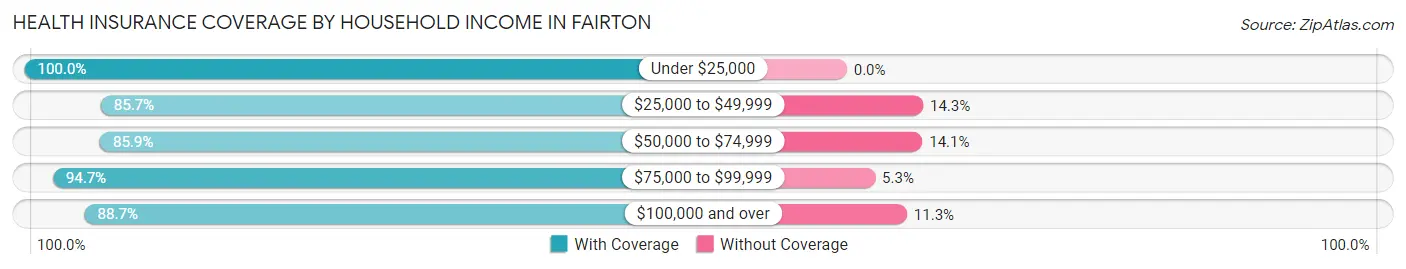
| Household Income | With Coverage | Without Coverage |
| Under $25,000 | 100 (100.0%) | 0 (0.0%) |
| $25,000 to $49,999 | 114 (85.7%) | 19 (14.3%) |
| $50,000 to $74,999 | 249 (85.9%) | 41 (14.1%) |
| $75,000 to $99,999 | 107 (94.7%) | 6 (5.3%) |
| $100,000 and over | 260 (88.7%) | 33 (11.3%) |
Public vs Private Health Insurance Coverage by Age in Fairton

| Age Bracket | Public Insurance | Private Insurance |
| Under 6 | 26 (46.4%) | 24 (42.9%) |
| 6 to 18 Years | 40 (30.5%) | 91 (69.5%) |
| 19 to 25 Years | 15 (14.4%) | 66 (63.5%) |
| 25 to 34 Years | 26 (16.3%) | 108 (67.5%) |
| 35 to 44 Years | 18 (19.6%) | 74 (80.4%) |
| 45 to 54 Years | 4 (5.2%) | 55 (71.4%) |
| 55 to 64 Years | 30 (18.2%) | 127 (77.0%) |
| 65 to 74 Years | 89 (98.9%) | 28 (31.1%) |
| 75 Years and over | 54 (100.0%) | 20 (37.0%) |
| Total | 302 (32.5%) | 593 (63.8%) |
Disability Status by Sex by Age in Fairton
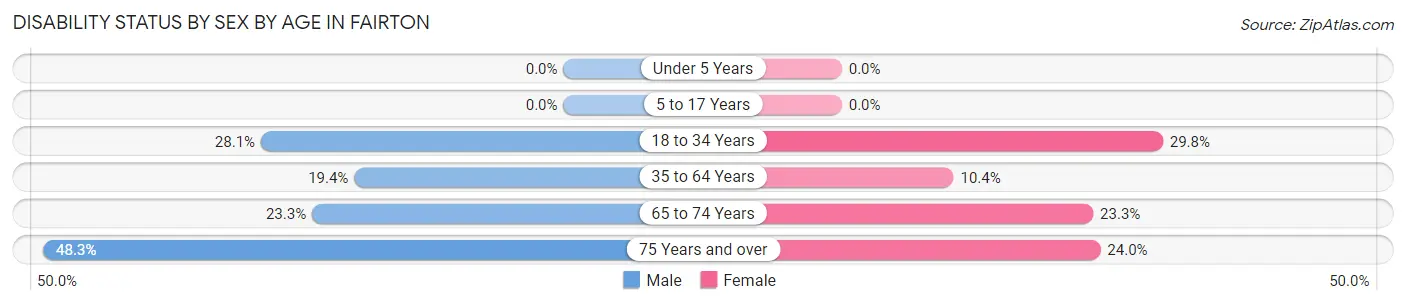
| Age Bracket | Male | Female |
| Under 5 Years | 0 (0.0%) | 0 (0.0%) |
| 5 to 17 Years | 0 (0.0%) | 0 (0.0%) |
| 18 to 34 Years | 48 (28.1%) | 28 (29.8%) |
| 35 to 64 Years | 33 (19.4%) | 17 (10.4%) |
| 65 to 74 Years | 7 (23.3%) | 14 (23.3%) |
| 75 Years and over | 14 (48.3%) | 6 (24.0%) |
Disability Class by Sex by Age in Fairton
Disability Class: Hearing Difficulty
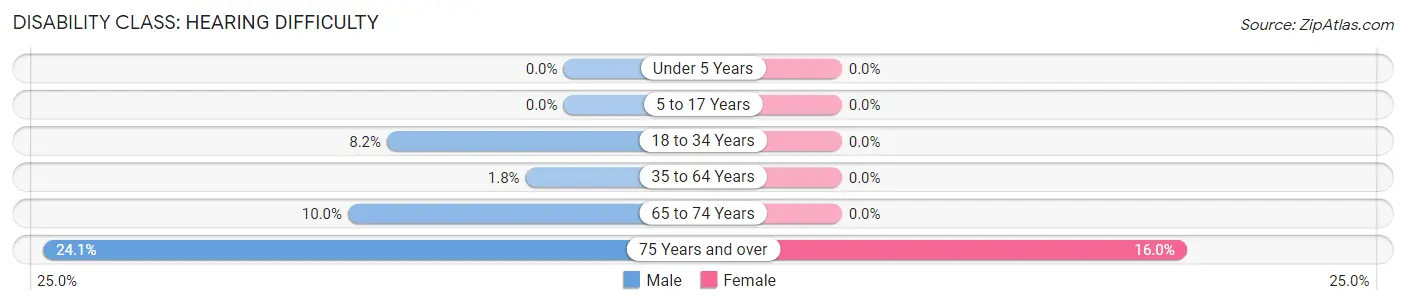
| Age Bracket | Male | Female |
| Under 5 Years | 0 (0.0%) | 0 (0.0%) |
| 5 to 17 Years | 0 (0.0%) | 0 (0.0%) |
| 18 to 34 Years | 14 (8.2%) | 0 (0.0%) |
| 35 to 64 Years | 3 (1.8%) | 0 (0.0%) |
| 65 to 74 Years | 3 (10.0%) | 0 (0.0%) |
| 75 Years and over | 7 (24.1%) | 4 (16.0%) |
Disability Class: Vision Difficulty
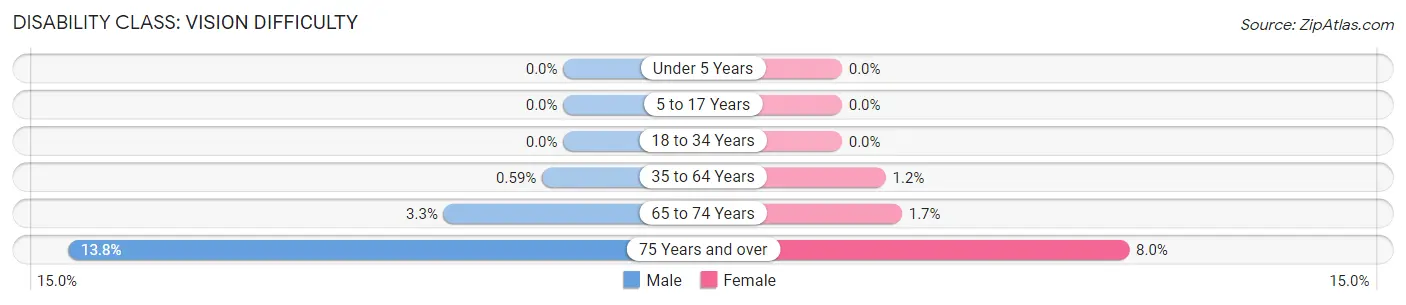
| Age Bracket | Male | Female |
| Under 5 Years | 0 (0.0%) | 0 (0.0%) |
| 5 to 17 Years | 0 (0.0%) | 0 (0.0%) |
| 18 to 34 Years | 0 (0.0%) | 0 (0.0%) |
| 35 to 64 Years | 1 (0.6%) | 2 (1.2%) |
| 65 to 74 Years | 1 (3.3%) | 1 (1.7%) |
| 75 Years and over | 4 (13.8%) | 2 (8.0%) |
Disability Class: Cognitive Difficulty
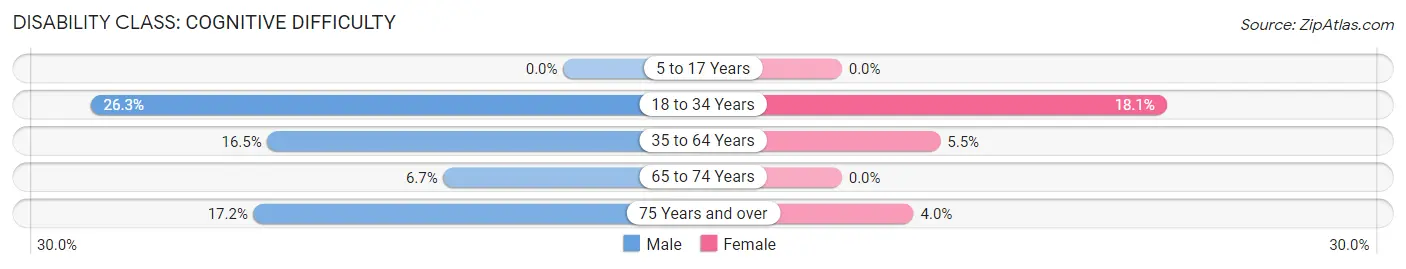
| Age Bracket | Male | Female |
| 5 to 17 Years | 0 (0.0%) | 0 (0.0%) |
| 18 to 34 Years | 45 (26.3%) | 17 (18.1%) |
| 35 to 64 Years | 28 (16.5%) | 9 (5.5%) |
| 65 to 74 Years | 2 (6.7%) | 0 (0.0%) |
| 75 Years and over | 5 (17.2%) | 1 (4.0%) |
Disability Class: Ambulatory Difficulty
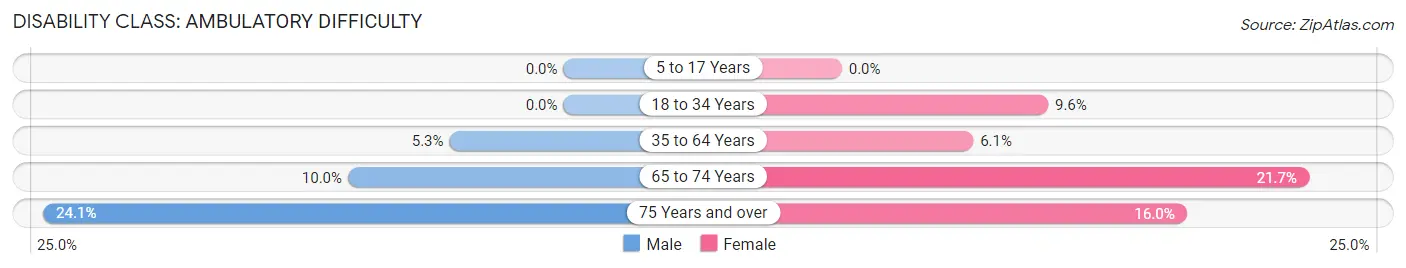
| Age Bracket | Male | Female |
| 5 to 17 Years | 0 (0.0%) | 0 (0.0%) |
| 18 to 34 Years | 0 (0.0%) | 9 (9.6%) |
| 35 to 64 Years | 9 (5.3%) | 10 (6.1%) |
| 65 to 74 Years | 3 (10.0%) | 13 (21.7%) |
| 75 Years and over | 7 (24.1%) | 4 (16.0%) |
Disability Class: Self-Care Difficulty
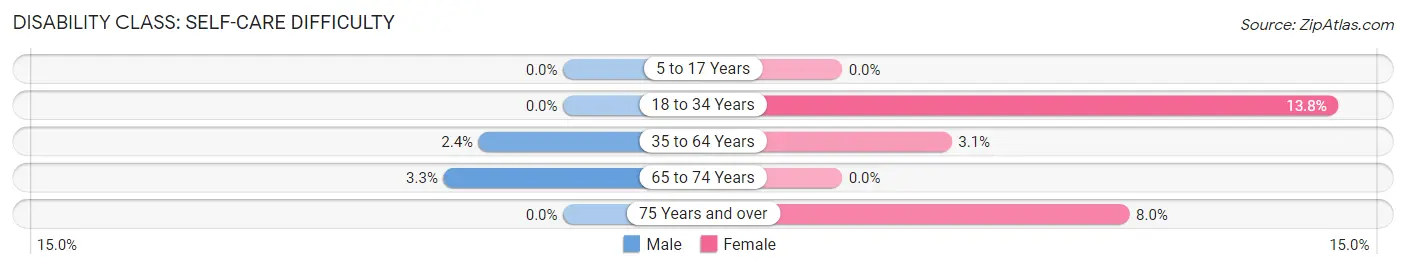
| Age Bracket | Male | Female |
| 5 to 17 Years | 0 (0.0%) | 0 (0.0%) |
| 18 to 34 Years | 0 (0.0%) | 13 (13.8%) |
| 35 to 64 Years | 4 (2.4%) | 5 (3.0%) |
| 65 to 74 Years | 1 (3.3%) | 0 (0.0%) |
| 75 Years and over | 0 (0.0%) | 2 (8.0%) |
Technology Access in Fairton
Computing Device Access in Fairton
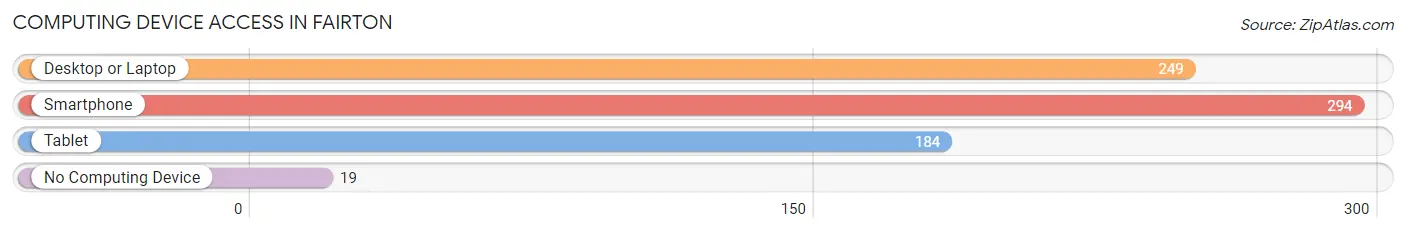
| Device Type | # Households | % Households |
| Desktop or Laptop | 249 | 70.5% |
| Smartphone | 294 | 83.3% |
| Tablet | 184 | 52.1% |
| No Computing Device | 19 | 5.4% |
| Total | 353 | 100.0% |
Internet Access in Fairton
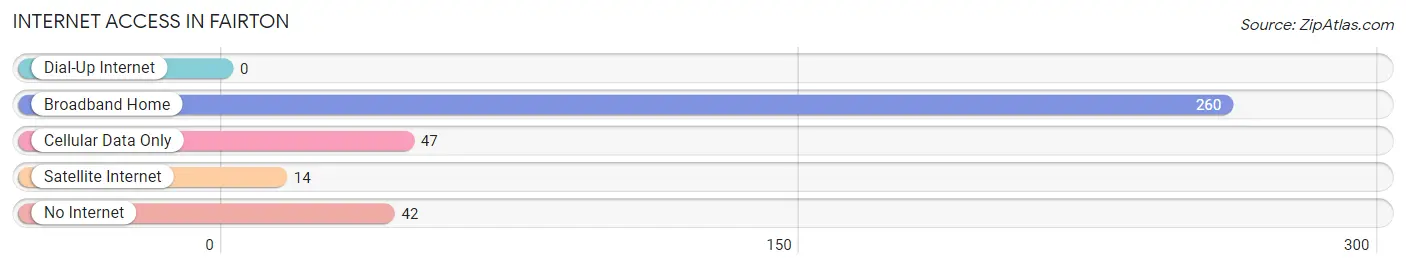
| Internet Type | # Households | % Households |
| Dial-Up Internet | 0 | 0.0% |
| Broadband Home | 260 | 73.7% |
| Cellular Data Only | 47 | 13.3% |
| Satellite Internet | 14 | 4.0% |
| No Internet | 42 | 11.9% |
| Total | 353 | 100.0% |
Fairton Summary
Fairton, NJ is a small unincorporated community located in Cumberland County, New Jersey. It is situated in the southwestern corner of the county, near the Delaware Bay. The population of Fairton was estimated to be 1,093 in 2019.
History
Fairton was first settled in the late 1700s by a group of Quakers from Pennsylvania. The town was originally known as Fairtown, but the name was changed to Fairton in 1845. The town was officially incorporated in 1867.
Fairton was an important port town in the 19th century, as it was located on the Delaware Bay. The town was a major shipping center for agricultural products, lumber, and coal. The town also had a thriving fishing industry.
In the early 20th century, Fairton was a popular vacation spot for wealthy Philadelphians. The town had several large hotels and resorts, as well as a casino.
Geography
Fairton is located in the southwestern corner of Cumberland County, near the Delaware Bay. The town is bordered by Maurice River Township to the north, Commercial Township to the east, and Downe Township to the south.
The town is located on the Maurice River, which is a tributary of the Delaware Bay. The town is also located near the Delaware Bay National Estuarine Research Reserve, which is a protected area of wetlands and estuaries.
The town has a total area of 2 3 square miles all of which is land
Economy
The economy of Fairton is largely based on agriculture and fishing. The town is home to several farms, which produce a variety of crops, including corn, soybeans, and wheat. The town also has a thriving fishing industry, with several commercial fishing boats operating out of the town.
The town also has several small businesses, including restaurants, convenience stores, and a hardware store.
Demographics
As of the 2010 census, the population of Fairton was 1,093. The racial makeup of the town was 94.3% White, 2.2% African American, 0.7% Native American, 0.7% Asian, and 1.9% from other races. Hispanic or Latino of any race were 3.3% of the population.
The median household income in Fairton was $45,938, and the median family income was $51,250. The per capita income was $20,945. About 11.3% of the population was below the poverty line.
Common Questions
What is Per Capita Income in Fairton?
Per Capita income in Fairton is $31,259.
What is the Median Family Income in Fairton?
Median Family Income in Fairton is $74,107.
What is the Median Household income in Fairton?
Median Household Income in Fairton is $64,766.
What is Income or Wage Gap in Fairton?
Income or Wage Gap in Fairton is 12.6%.
Women in Fairton earn 87.4 cents for every dollar earned by a man.
What is Inequality or Gini Index in Fairton?
Inequality or Gini Index in Fairton is 0.42.
What is the Total Population of Fairton?
Total Population of Fairton is 929.
What is the Total Male Population of Fairton?
Total Male Population of Fairton is 500.
What is the Total Female Population of Fairton?
Total Female Population of Fairton is 429.
What is the Ratio of Males per 100 Females in Fairton?
There are 116.55 Males per 100 Females in Fairton.
What is the Ratio of Females per 100 Males in Fairton?
There are 85.80 Females per 100 Males in Fairton.
What is the Median Population Age in Fairton?
Median Population Age in Fairton is 38.4 Years.
What is the Average Family Size in Fairton
Average Family Size in Fairton is 3.1 People.
What is the Average Household Size in Fairton
Average Household Size in Fairton is 2.6 People.
How Large is the Labor Force in Fairton?
There are 505 People in the Labor Forcein in Fairton.
What is the Percentage of People in the Labor Force in Fairton?
63.0% of People are in the Labor Force in Fairton.
What is the Unemployment Rate in Fairton?
Unemployment Rate in Fairton is 12.1%.