Byram Center, NJ Map & Demographics
Byram Center Map
Byram Center Overview
$49,352
PER CAPITA INCOME
$124,375
AVG FAMILY INCOME
$116,862
AVG HOUSEHOLD INCOME
21.8%
WAGE / INCOME GAP [ % ]
78.2¢/ $1
WAGE / INCOME GAP [ $ ]
0.32
INEQUALITY / GINI INDEX
1,969
TOTAL POPULATION
955
MALE POPULATION
1,014
FEMALE POPULATION
94.18
MALES / 100 FEMALES
106.18
FEMALES / 100 MALES
40.9
MEDIAN AGE
2.9
AVG FAMILY SIZE
2.8
AVG HOUSEHOLD SIZE
1,356
LABOR FORCE [ PEOPLE ]
79.7%
PERCENT IN LABOR FORCE
5.3%
UNEMPLOYMENT RATE
Income in Byram Center
Income Overview in Byram Center
Per Capita Income in Byram Center is $49,352, while median incomes of families and households are $124,375 and $116,862 respectively.
| Characteristic | Number | Measure |
| Per Capita Income | 1,969 | $49,352 |
| Median Family Income | 598 | $124,375 |
| Mean Family Income | 598 | $139,430 |
| Median Household Income | 713 | $116,862 |
| Mean Household Income | 713 | $134,370 |
| Income Deficit | 598 | $0 |
| Wage / Income Gap (%) | 1,969 | 21.81% |
| Wage / Income Gap ($) | 1,969 | 78.19¢ per $1 |
| Gini / Inequality Index | 1,969 | 0.32 |
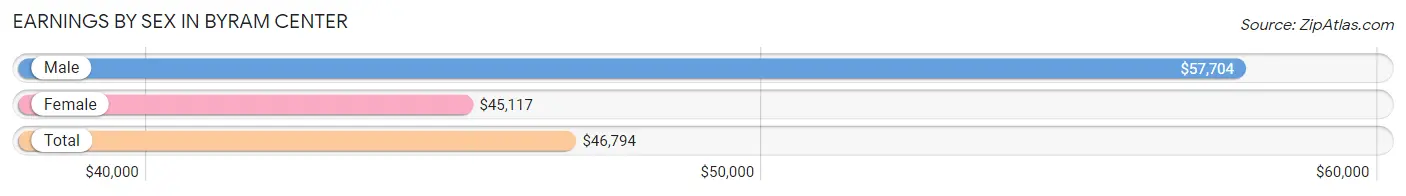
Earnings by Sex in Byram Center
Average Earnings in Byram Center are $46,794, $57,704 for men and $45,117 for women, a difference of 21.8%.
| Sex | Number | Average Earnings |
| Male | 620 (46.7%) | $57,704 |
| Female | 707 (53.3%) | $45,117 |
| Total | 1,327 (100.0%) | $46,794 |
Earnings by Sex by Income Bracket in Byram Center
The most common earnings brackets in Byram Center are $100,000+ for men (126 | 20.3%) and $45,000 to $49,999 for women (121 | 17.1%).
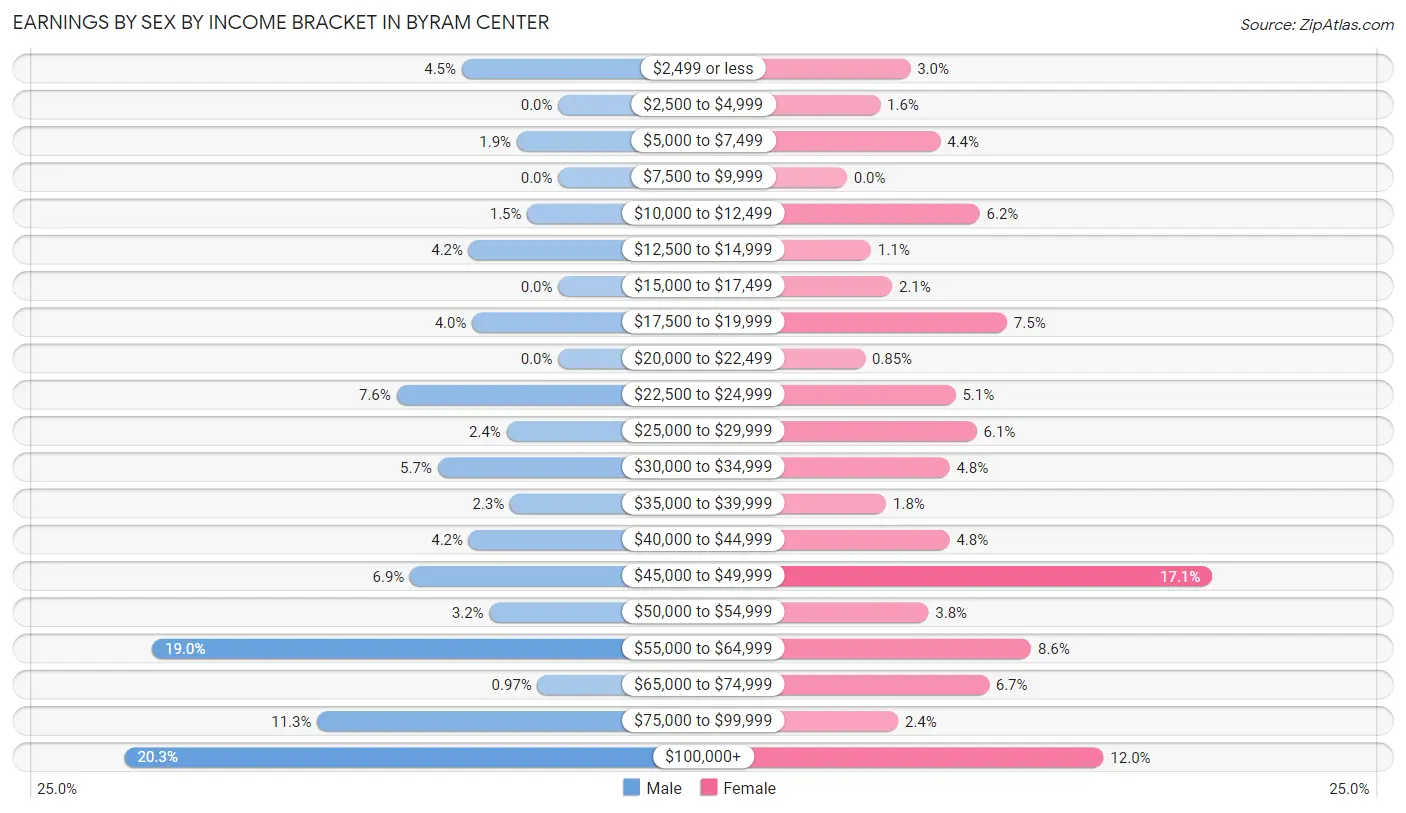
| Income | Male | Female |
| $2,499 or less | 28 (4.5%) | 21 (3.0%) |
| $2,500 to $4,999 | 0 (0.0%) | 11 (1.6%) |
| $5,000 to $7,499 | 12 (1.9%) | 31 (4.4%) |
| $7,500 to $9,999 | 0 (0.0%) | 0 (0.0%) |
| $10,000 to $12,499 | 9 (1.5%) | 44 (6.2%) |
| $12,500 to $14,999 | 26 (4.2%) | 8 (1.1%) |
| $15,000 to $17,499 | 0 (0.0%) | 15 (2.1%) |
| $17,500 to $19,999 | 25 (4.0%) | 53 (7.5%) |
| $20,000 to $22,499 | 0 (0.0%) | 6 (0.9%) |
| $22,500 to $24,999 | 47 (7.6%) | 36 (5.1%) |
| $25,000 to $29,999 | 15 (2.4%) | 43 (6.1%) |
| $30,000 to $34,999 | 35 (5.7%) | 34 (4.8%) |
| $35,000 to $39,999 | 14 (2.3%) | 13 (1.8%) |
| $40,000 to $44,999 | 26 (4.2%) | 34 (4.8%) |
| $45,000 to $49,999 | 43 (6.9%) | 121 (17.1%) |
| $50,000 to $54,999 | 20 (3.2%) | 27 (3.8%) |
| $55,000 to $64,999 | 118 (19.0%) | 61 (8.6%) |
| $65,000 to $74,999 | 6 (1.0%) | 47 (6.7%) |
| $75,000 to $99,999 | 70 (11.3%) | 17 (2.4%) |
| $100,000+ | 126 (20.3%) | 85 (12.0%) |
| Total | 620 (100.0%) | 707 (100.0%) |
Earnings by Sex by Educational Attainment in Byram Center
Average earnings in Byram Center are $60,724 for men and $46,563 for women, a difference of 23.3%. Men with an educational attainment of bachelor's degree enjoy the highest average annual earnings of $107,083, while those with college or associate's degree education earn the least with $51,875. Women with an educational attainment of graduate degree earn the most with the average annual earnings of $52,361, while those with high school diploma education have the smallest earnings of $45,455.
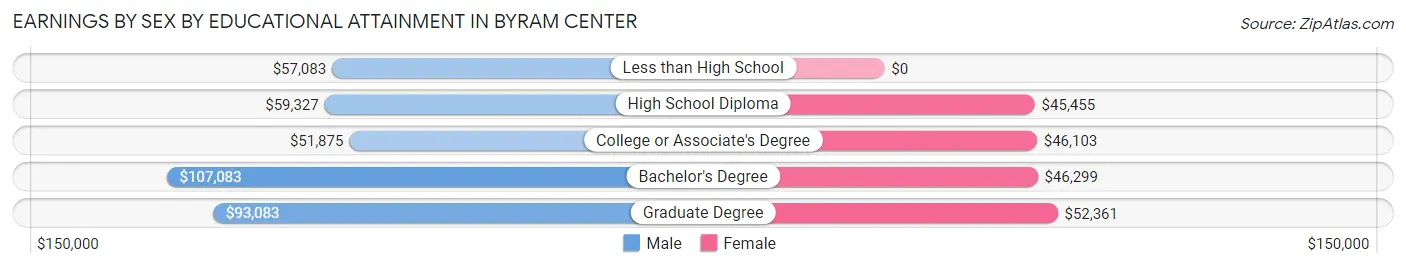
| Educational Attainment | Male Income | Female Income |
| Less than High School | $57,083 | $0 |
| High School Diploma | $59,327 | $45,455 |
| College or Associate's Degree | $51,875 | $46,103 |
| Bachelor's Degree | $107,083 | $46,299 |
| Graduate Degree | $93,083 | $52,361 |
| Total | $60,724 | $46,563 |
Family Income in Byram Center
Family Income Brackets in Byram Center
According to the Byram Center family income data, there are 181 families falling into the $100,000 to $149,999 income range, which is the most common income bracket and makes up 30.3% of all families.
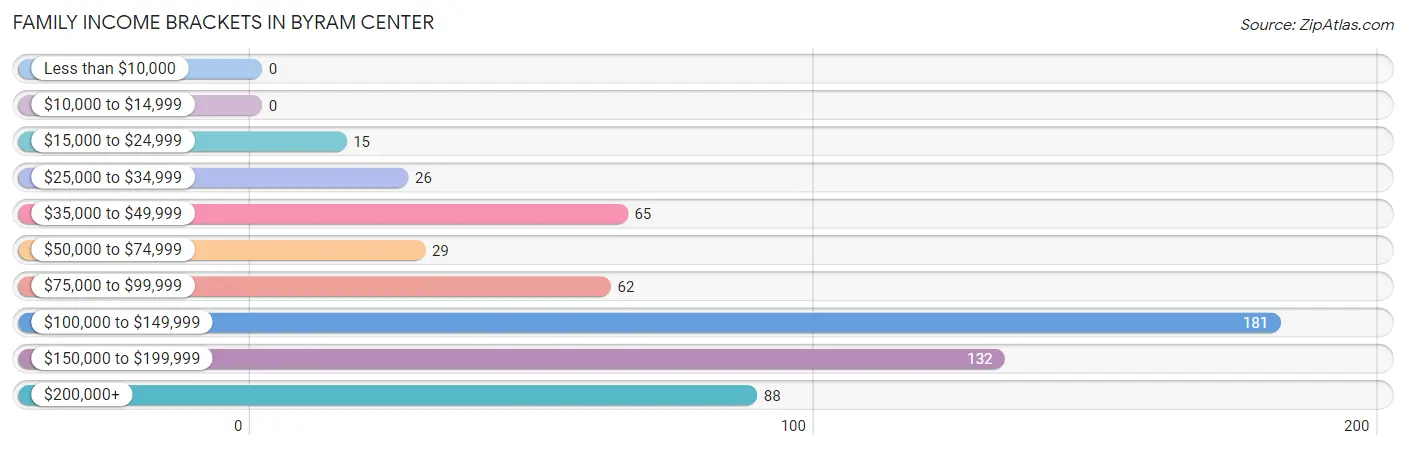
| Income Bracket | # Families | % Families |
| Less than $10,000 | 0 | 0.0% |
| $10,000 to $14,999 | 0 | 0.0% |
| $15,000 to $24,999 | 15 | 2.5% |
| $25,000 to $34,999 | 26 | 4.3% |
| $35,000 to $49,999 | 65 | 10.9% |
| $50,000 to $74,999 | 29 | 4.8% |
| $75,000 to $99,999 | 62 | 10.4% |
| $100,000 to $149,999 | 181 | 30.3% |
| $150,000 to $199,999 | 132 | 22.1% |
| $200,000+ | 88 | 14.7% |
Family Income by Famaliy Size in Byram Center
5-person families (45 | 7.5%) account for the highest median family income in Byram Center with $169,750 per family, while 2-person families (283 | 47.3%) have the highest median income of $55,312 per family member.
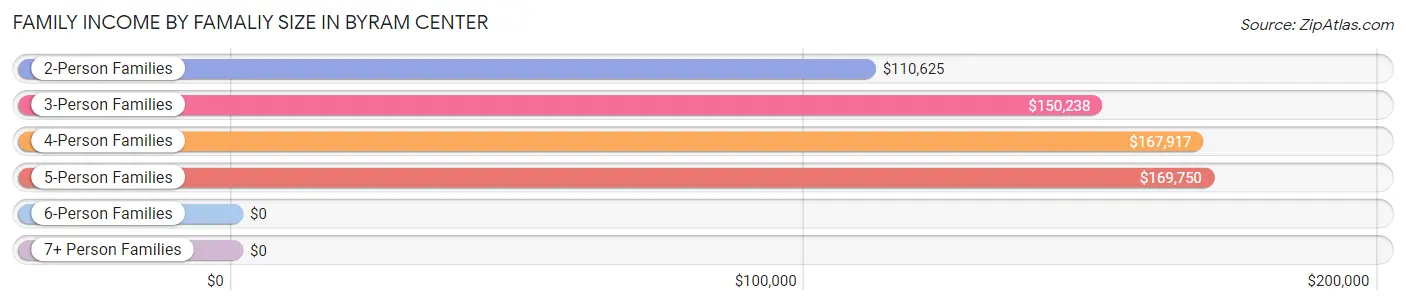
| Income Bracket | # Families | Median Income |
| 2-Person Families | 283 (47.3%) | $110,625 |
| 3-Person Families | 174 (29.1%) | $150,238 |
| 4-Person Families | 96 (16.1%) | $167,917 |
| 5-Person Families | 45 (7.5%) | $169,750 |
| 6-Person Families | 0 (0.0%) | $0 |
| 7+ Person Families | 0 (0.0%) | $0 |
| Total | 598 (100.0%) | $124,375 |
Family Income by Number of Earners in Byram Center
The median family income in Byram Center is $124,375, with families comprising 3+ earners (148) having the highest median family income of $183,707, while families with 1 earner (176) have the lowest median family income of $76,667, accounting for 24.7% and 29.4% of families, respectively.
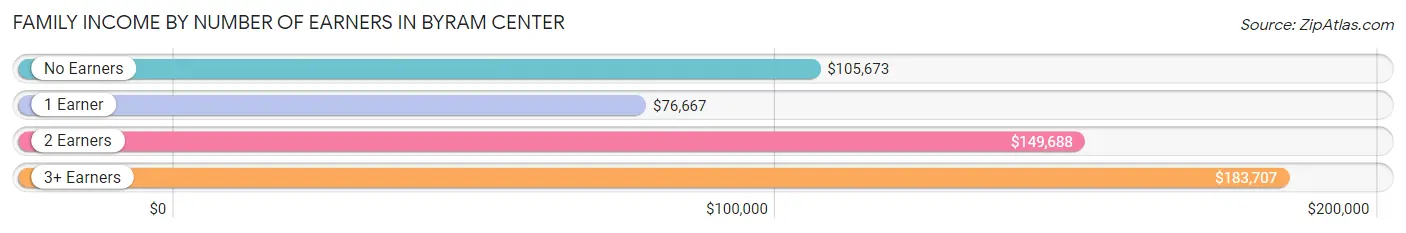
| Number of Earners | # Families | Median Income |
| No Earners | 47 (7.9%) | $105,673 |
| 1 Earner | 176 (29.4%) | $76,667 |
| 2 Earners | 227 (38.0%) | $149,688 |
| 3+ Earners | 148 (24.7%) | $183,707 |
| Total | 598 (100.0%) | $124,375 |
Household Income in Byram Center
Household Income Brackets in Byram Center
With 251 households falling in the category, the $100,000 to $149,999 income range is the most frequent in Byram Center, accounting for 35.2% of all households.
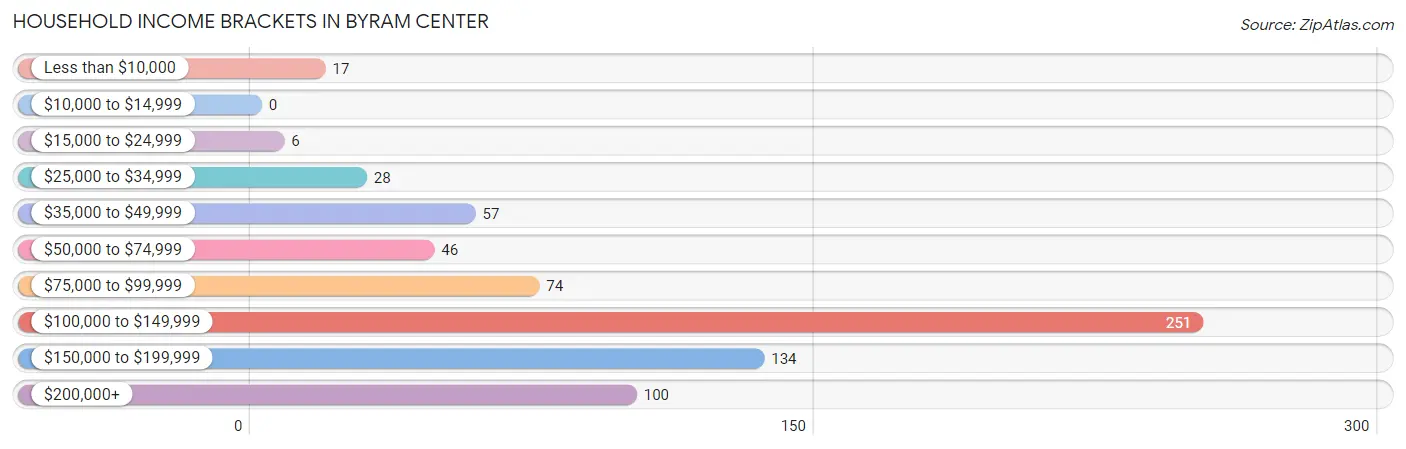
| Income Bracket | # Households | % Households |
| Less than $10,000 | 17 | 2.4% |
| $10,000 to $14,999 | 0 | 0.0% |
| $15,000 to $24,999 | 6 | 0.8% |
| $25,000 to $34,999 | 28 | 3.9% |
| $35,000 to $49,999 | 57 | 8.0% |
| $50,000 to $74,999 | 46 | 6.5% |
| $75,000 to $99,999 | 74 | 10.4% |
| $100,000 to $149,999 | 251 | 35.2% |
| $150,000 to $199,999 | 134 | 18.8% |
| $200,000+ | 100 | 14.0% |
Household Income by Householder Age in Byram Center
The median household income in Byram Center is $116,862, with the highest median household income of $124,318 found in the 45 to 64 years age bracket for the primary householder. A total of 278 households (39.0%) fall into this category. Meanwhile, the 15 to 24 years age bracket for the primary householder has the lowest median household income of $0, with 15 households (2.1%) in this group.
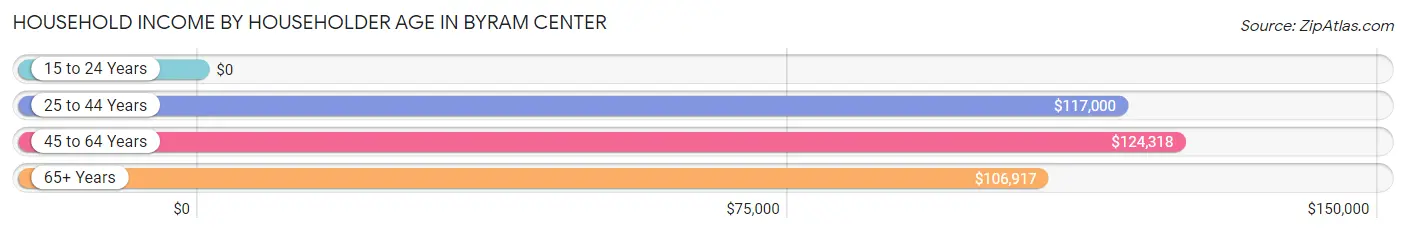
| Income Bracket | # Households | Median Income |
| 15 to 24 Years | 15 (2.1%) | $0 |
| 25 to 44 Years | 230 (32.3%) | $117,000 |
| 45 to 64 Years | 278 (39.0%) | $124,318 |
| 65+ Years | 190 (26.7%) | $106,917 |
| Total | 713 (100.0%) | $116,862 |
Poverty in Byram Center
Income Below Poverty by Sex and Age in Byram Center
With 3.7% poverty level for males and 3.2% for females among the residents of Byram Center, 18 to 24 year old males and 75 year old and over females are the most vulnerable to poverty, with 12 males (9.2%) and 9 females (27.3%) in their respective age groups living below the poverty level.
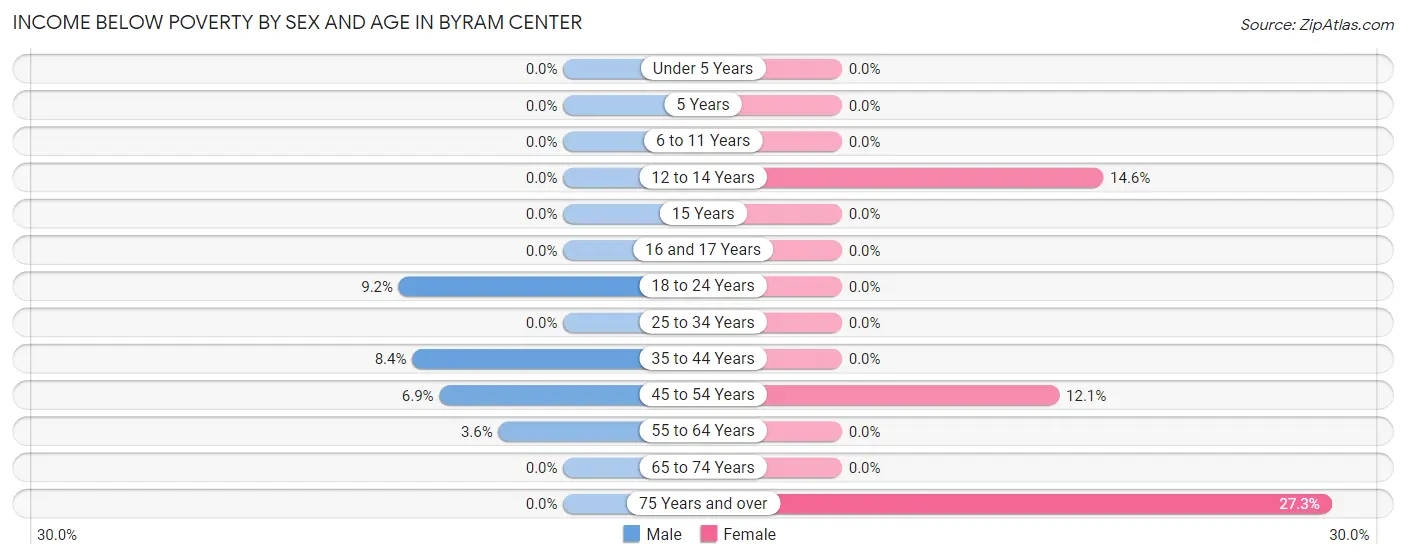
| Age Bracket | Male | Female |
| Under 5 Years | 0 (0.0%) | 0 (0.0%) |
| 5 Years | 0 (0.0%) | 0 (0.0%) |
| 6 to 11 Years | 0 (0.0%) | 0 (0.0%) |
| 12 to 14 Years | 0 (0.0%) | 8 (14.5%) |
| 15 Years | 0 (0.0%) | 0 (0.0%) |
| 16 and 17 Years | 0 (0.0%) | 0 (0.0%) |
| 18 to 24 Years | 12 (9.2%) | 0 (0.0%) |
| 25 to 34 Years | 0 (0.0%) | 0 (0.0%) |
| 35 to 44 Years | 9 (8.4%) | 0 (0.0%) |
| 45 to 54 Years | 8 (6.9%) | 15 (12.1%) |
| 55 to 64 Years | 6 (3.6%) | 0 (0.0%) |
| 65 to 74 Years | 0 (0.0%) | 0 (0.0%) |
| 75 Years and over | 0 (0.0%) | 9 (27.3%) |
| Total | 35 (3.7%) | 32 (3.2%) |
Income Above Poverty by Sex and Age in Byram Center
According to the poverty statistics in Byram Center, males aged under 5 years and females aged under 5 years are the age groups that are most secure financially, with 100.0% of males and 100.0% of females in these age groups living above the poverty line.
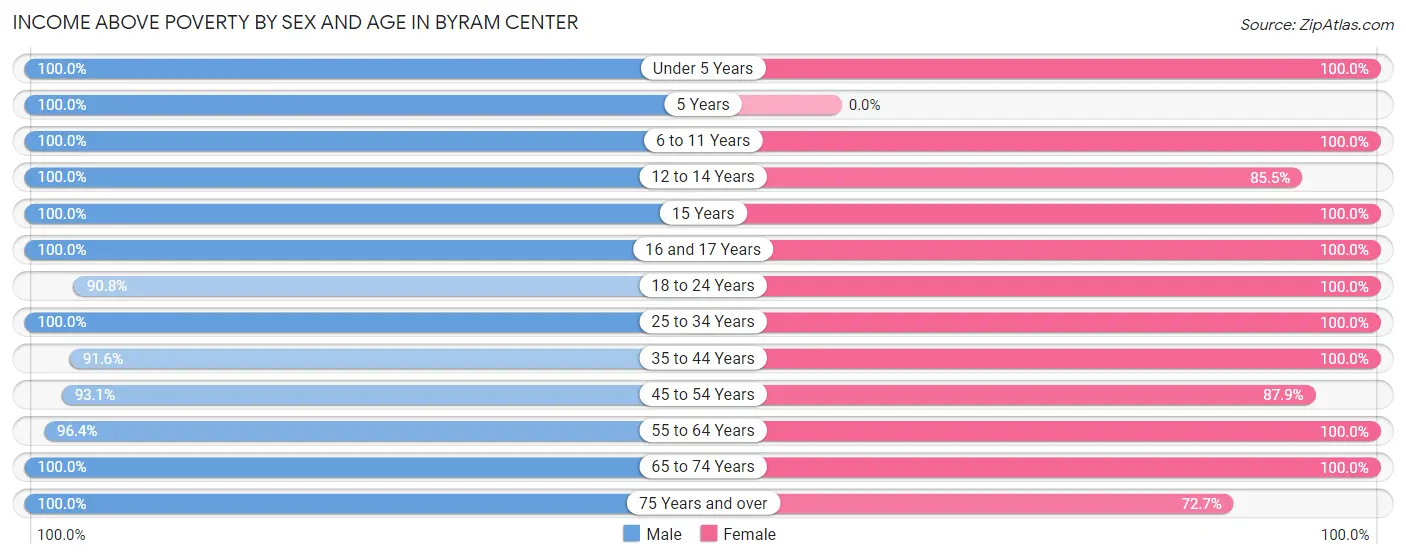
| Age Bracket | Male | Female |
| Under 5 Years | 52 (100.0%) | 38 (100.0%) |
| 5 Years | 6 (100.0%) | 0 (0.0%) |
| 6 to 11 Years | 43 (100.0%) | 38 (100.0%) |
| 12 to 14 Years | 15 (100.0%) | 47 (85.5%) |
| 15 Years | 3 (100.0%) | 6 (100.0%) |
| 16 and 17 Years | 25 (100.0%) | 7 (100.0%) |
| 18 to 24 Years | 119 (90.8%) | 166 (100.0%) |
| 25 to 34 Years | 123 (100.0%) | 121 (100.0%) |
| 35 to 44 Years | 98 (91.6%) | 147 (100.0%) |
| 45 to 54 Years | 108 (93.1%) | 109 (87.9%) |
| 55 to 64 Years | 160 (96.4%) | 183 (100.0%) |
| 65 to 74 Years | 107 (100.0%) | 96 (100.0%) |
| 75 Years and over | 46 (100.0%) | 24 (72.7%) |
| Total | 905 (96.3%) | 982 (96.8%) |
Income Below Poverty Among Married-Couple Families in Byram Center
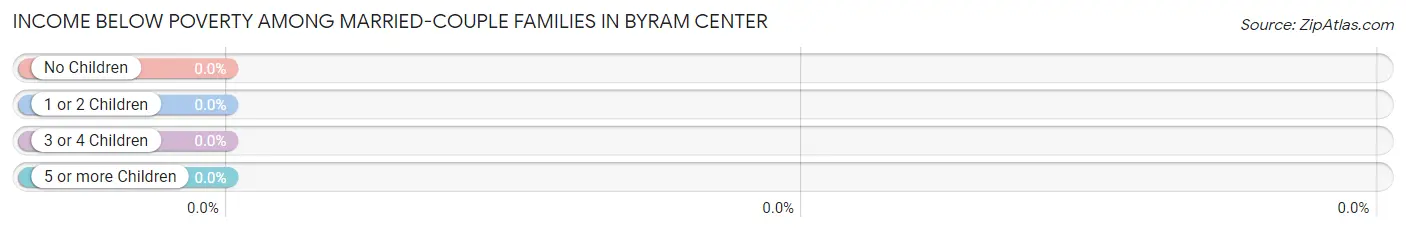
| Children | Above Poverty | Below Poverty |
| No Children | 322 (100.0%) | 0 (0.0%) |
| 1 or 2 Children | 81 (100.0%) | 0 (0.0%) |
| 3 or 4 Children | 29 (100.0%) | 0 (0.0%) |
| 5 or more Children | 0 (0.0%) | 0 (0.0%) |
| Total | 432 (100.0%) | 0 (0.0%) |
Income Below Poverty Among Single-Parent Households in Byram Center
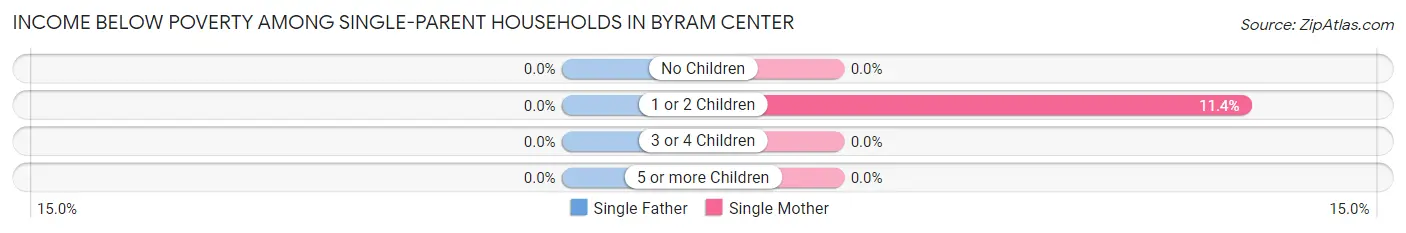
| Children | Single Father | Single Mother |
| No Children | 0 (0.0%) | 0 (0.0%) |
| 1 or 2 Children | 0 (0.0%) | 9 (11.4%) |
| 3 or 4 Children | 0 (0.0%) | 0 (0.0%) |
| 5 or more Children | 0 (0.0%) | 0 (0.0%) |
| Total | 0 (0.0%) | 9 (8.2%) |
Income Below Poverty Among Married-Couple vs Single-Parent Households in Byram Center
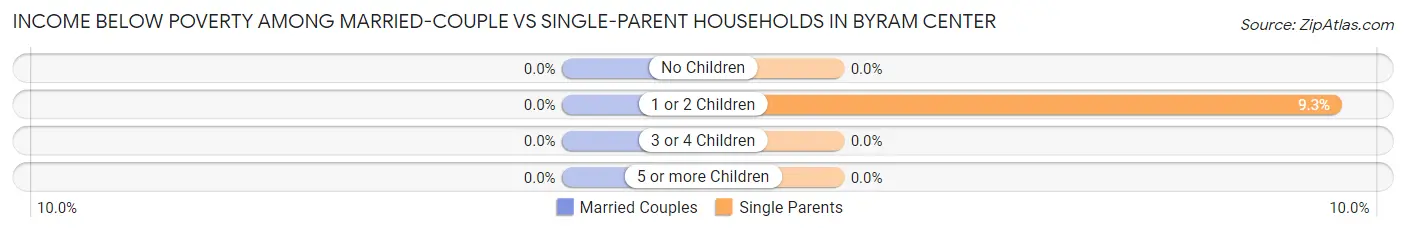
| Children | Married-Couple Families | Single-Parent Households |
| No Children | 0 (0.0%) | 0 (0.0%) |
| 1 or 2 Children | 0 (0.0%) | 9 (9.3%) |
| 3 or 4 Children | 0 (0.0%) | 0 (0.0%) |
| 5 or more Children | 0 (0.0%) | 0 (0.0%) |
| Total | 0 (0.0%) | 9 (5.4%) |
Race in Byram Center
The most populous races in Byram Center are White / Caucasian (1,511 | 76.7%), Hispanic or Latino (258 | 13.1%), and Some other Race (157 | 8.0%).
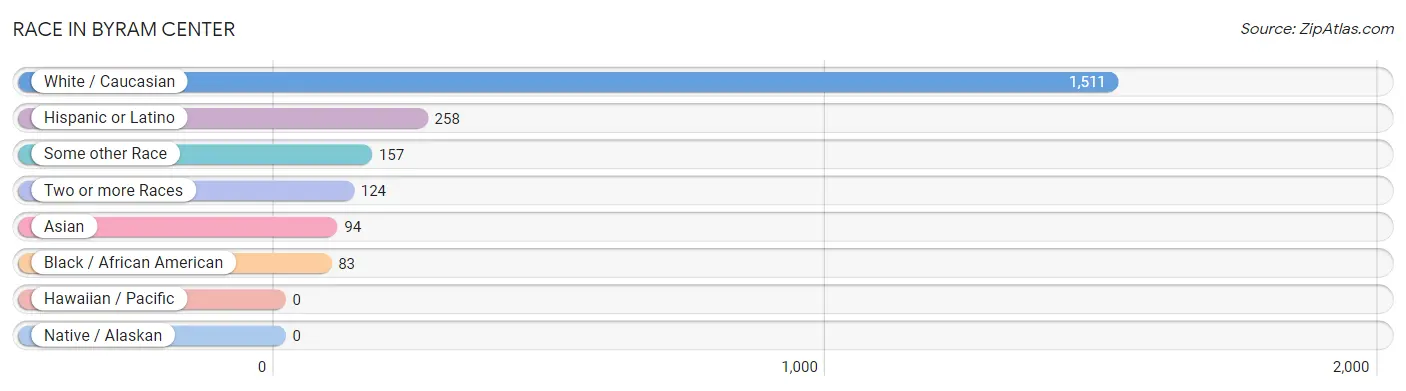
| Race | # Population | % Population |
| Asian | 94 | 4.8% |
| Black / African American | 83 | 4.2% |
| Hawaiian / Pacific | 0 | 0.0% |
| Hispanic or Latino | 258 | 13.1% |
| Native / Alaskan | 0 | 0.0% |
| White / Caucasian | 1,511 | 76.7% |
| Two or more Races | 124 | 6.3% |
| Some other Race | 157 | 8.0% |
| Total | 1,969 | 100.0% |
Ancestry in Byram Center
The most populous ancestries reported in Byram Center are Italian (494 | 25.1%), Irish (446 | 22.7%), German (298 | 15.1%), Polish (191 | 9.7%), and English (147 | 7.5%), together accounting for 80.0% of all Byram Center residents.
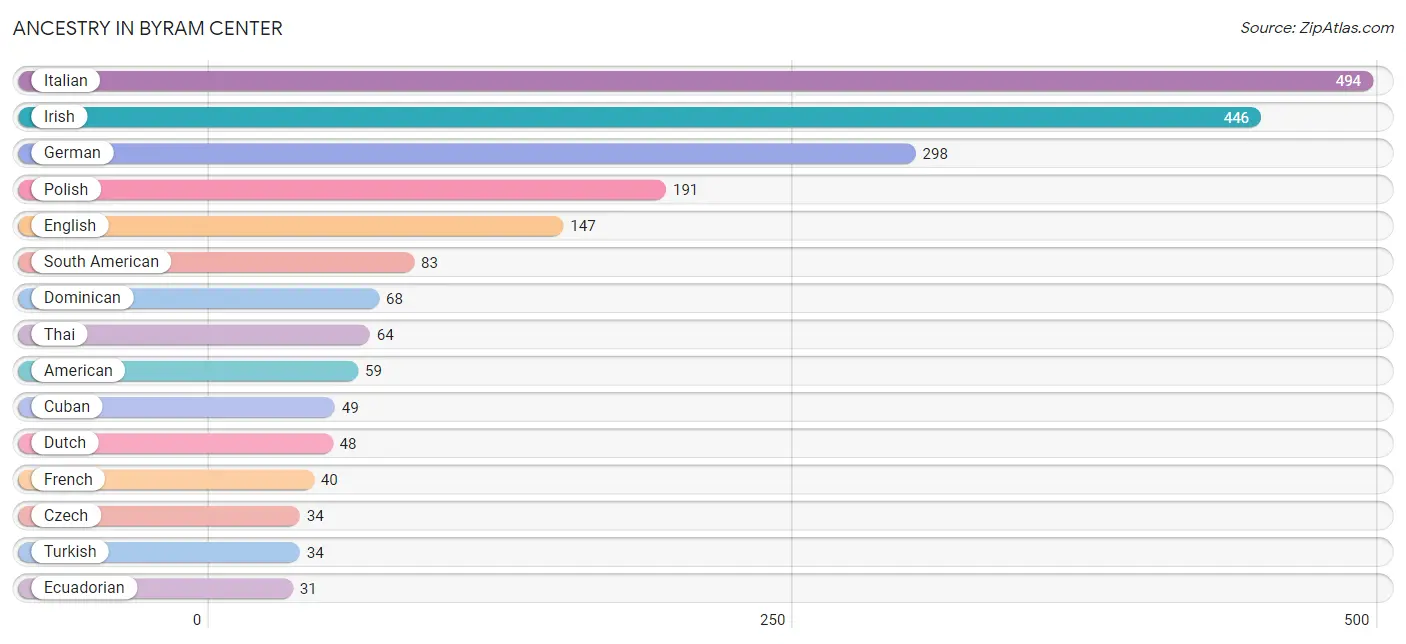
| Ancestry | # Population | % Population |
| American | 59 | 3.0% |
| British | 7 | 0.4% |
| Central American | 18 | 0.9% |
| Colombian | 25 | 1.3% |
| Cuban | 49 | 2.5% |
| Czech | 34 | 1.7% |
| Czechoslovakian | 12 | 0.6% |
| Dominican | 68 | 3.5% |
| Dutch | 48 | 2.4% |
| Eastern European | 6 | 0.3% |
| Ecuadorian | 31 | 1.6% |
| English | 147 | 7.5% |
| Estonian | 6 | 0.3% |
| European | 16 | 0.8% |
| French | 40 | 2.0% |
| German | 298 | 15.1% |
| Greek | 8 | 0.4% |
| Honduran | 12 | 0.6% |
| Hungarian | 16 | 0.8% |
| Indian (Asian) | 16 | 0.8% |
| Irish | 446 | 22.7% |
| Italian | 494 | 25.1% |
| Jamaican | 6 | 0.3% |
| Japanese | 14 | 0.7% |
| Lithuanian | 12 | 0.6% |
| Mexican | 6 | 0.3% |
| Nigerian | 17 | 0.9% |
| Northern European | 7 | 0.4% |
| Norwegian | 30 | 1.5% |
| Polish | 191 | 9.7% |
| Portuguese | 18 | 0.9% |
| Puerto Rican | 13 | 0.7% |
| Romanian | 10 | 0.5% |
| Russian | 11 | 0.6% |
| Salvadoran | 6 | 0.3% |
| Scandinavian | 5 | 0.3% |
| Scotch-Irish | 21 | 1.1% |
| Scottish | 22 | 1.1% |
| Slovak | 19 | 1.0% |
| South American | 83 | 4.2% |
| Subsaharan African | 17 | 0.9% |
| Swiss | 6 | 0.3% |
| Thai | 64 | 3.3% |
| Turkish | 34 | 1.7% |
| Uruguayan | 27 | 1.4% |
| Welsh | 12 | 0.6% | View All 46 Rows |
Immigrants in Byram Center
The most numerous immigrant groups reported in Byram Center came from Latin America (147 | 7.5%), Asia (82 | 4.2%), South America (79 | 4.0%), Europe (77 | 3.9%), and Caribbean (68 | 3.5%), together accounting for 23.0% of all Byram Center residents.
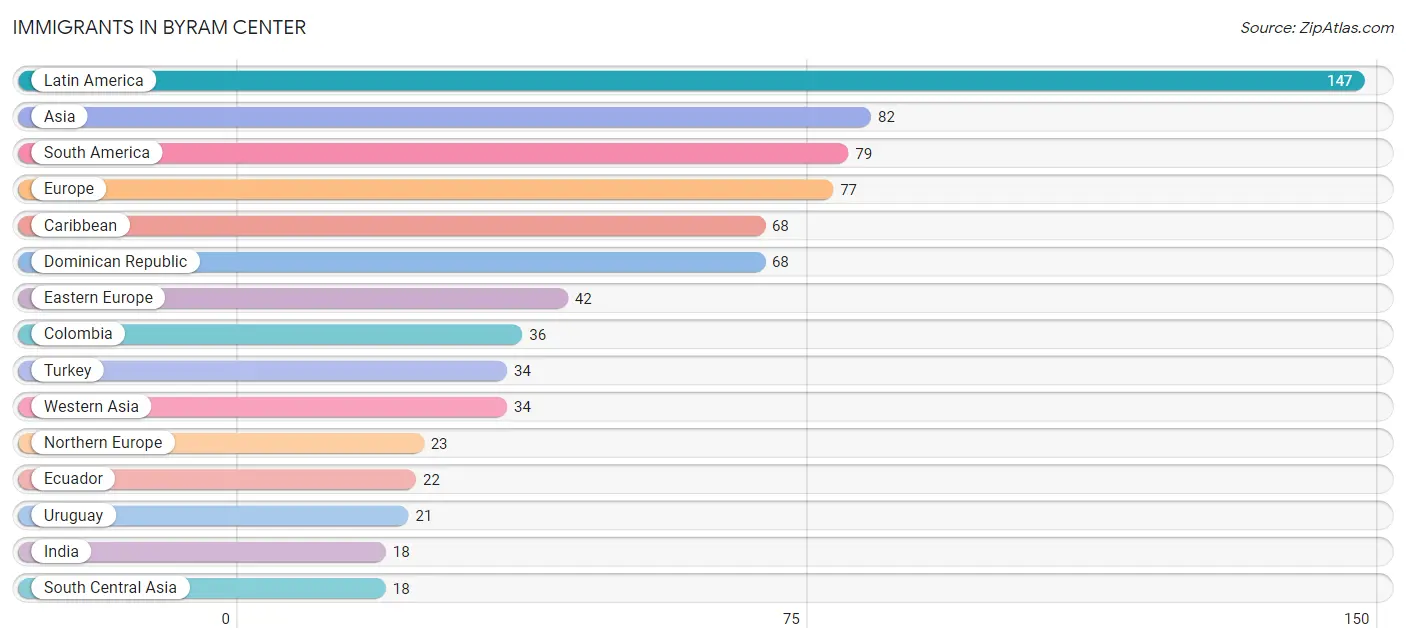
| Immigration Origin | # Population | % Population |
| Africa | 8 | 0.4% |
| Asia | 82 | 4.2% |
| Cambodia | 14 | 0.7% |
| Caribbean | 68 | 3.5% |
| China | 16 | 0.8% |
| Colombia | 36 | 1.8% |
| Dominican Republic | 68 | 3.5% |
| Eastern Asia | 16 | 0.8% |
| Eastern Europe | 42 | 2.1% |
| Ecuador | 22 | 1.1% |
| England | 8 | 0.4% |
| Europe | 77 | 3.9% |
| Hungary | 10 | 0.5% |
| India | 18 | 0.9% |
| Italy | 6 | 0.3% |
| Latin America | 147 | 7.5% |
| Netherlands | 6 | 0.3% |
| Nigeria | 8 | 0.4% |
| Northern Europe | 23 | 1.2% |
| Poland | 16 | 0.8% |
| Romania | 10 | 0.5% |
| South America | 79 | 4.0% |
| South Central Asia | 18 | 0.9% |
| South Eastern Asia | 14 | 0.7% |
| Southern Europe | 6 | 0.3% |
| Turkey | 34 | 1.7% |
| Uruguay | 21 | 1.1% |
| Western Africa | 8 | 0.4% |
| Western Asia | 34 | 1.7% |
| Western Europe | 6 | 0.3% | View All 30 Rows |
Sex and Age in Byram Center
Sex and Age in Byram Center
The most populous age groups in Byram Center are 55 to 59 Years (102 | 10.7%) for men and 20 to 24 Years (118 | 11.6%) for women.
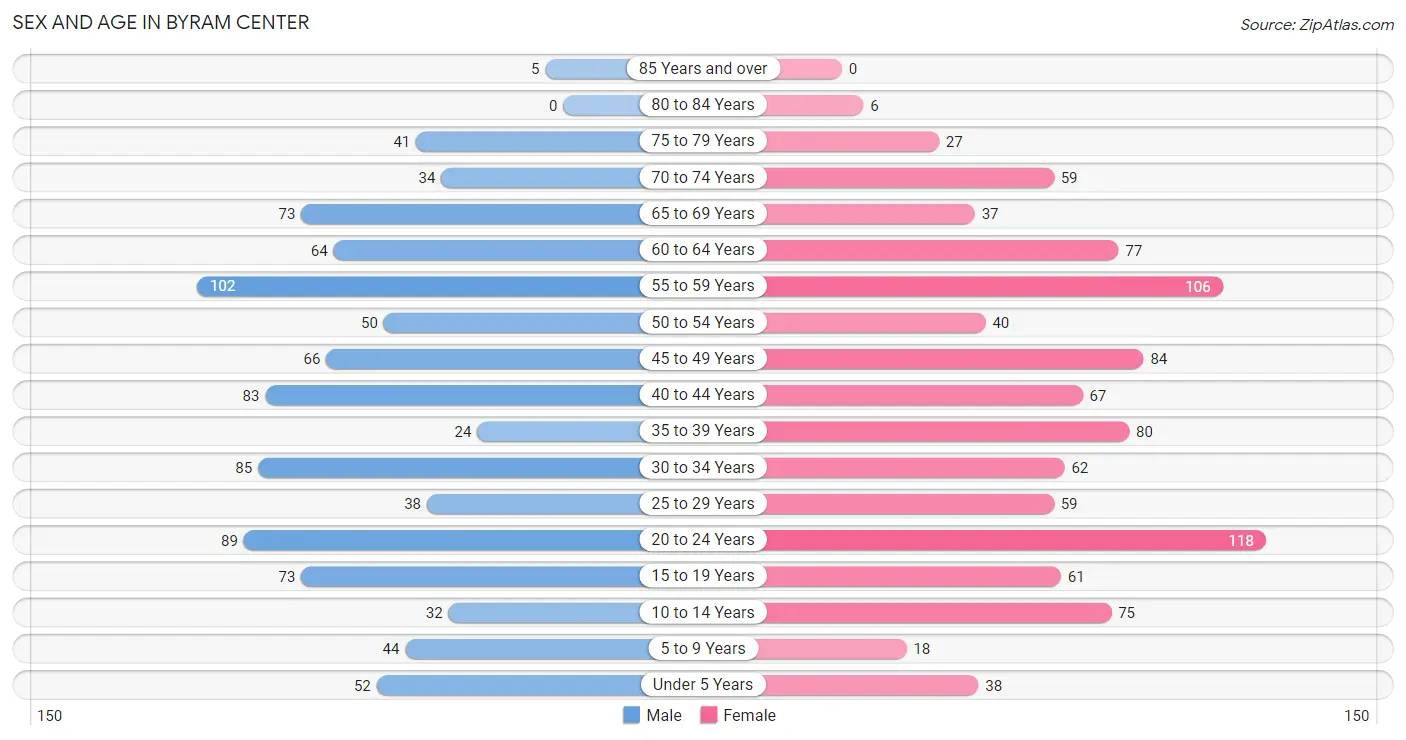
| Age Bracket | Male | Female |
| Under 5 Years | 52 (5.4%) | 38 (3.7%) |
| 5 to 9 Years | 44 (4.6%) | 18 (1.8%) |
| 10 to 14 Years | 32 (3.4%) | 75 (7.4%) |
| 15 to 19 Years | 73 (7.6%) | 61 (6.0%) |
| 20 to 24 Years | 89 (9.3%) | 118 (11.6%) |
| 25 to 29 Years | 38 (4.0%) | 59 (5.8%) |
| 30 to 34 Years | 85 (8.9%) | 62 (6.1%) |
| 35 to 39 Years | 24 (2.5%) | 80 (7.9%) |
| 40 to 44 Years | 83 (8.7%) | 67 (6.6%) |
| 45 to 49 Years | 66 (6.9%) | 84 (8.3%) |
| 50 to 54 Years | 50 (5.2%) | 40 (3.9%) |
| 55 to 59 Years | 102 (10.7%) | 106 (10.4%) |
| 60 to 64 Years | 64 (6.7%) | 77 (7.6%) |
| 65 to 69 Years | 73 (7.6%) | 37 (3.6%) |
| 70 to 74 Years | 34 (3.6%) | 59 (5.8%) |
| 75 to 79 Years | 41 (4.3%) | 27 (2.7%) |
| 80 to 84 Years | 0 (0.0%) | 6 (0.6%) |
| 85 Years and over | 5 (0.5%) | 0 (0.0%) |
| Total | 955 (100.0%) | 1,014 (100.0%) |
Families and Households in Byram Center
Median Family Size in Byram Center
The median family size in Byram Center is 2.92 persons per family, with married-couple families (432 | 72.2%) accounting for the largest median family size of 3.05 persons per family. On the other hand, single female/mother families (110 | 18.4%) represent the smallest median family size with 2.47 persons per family.
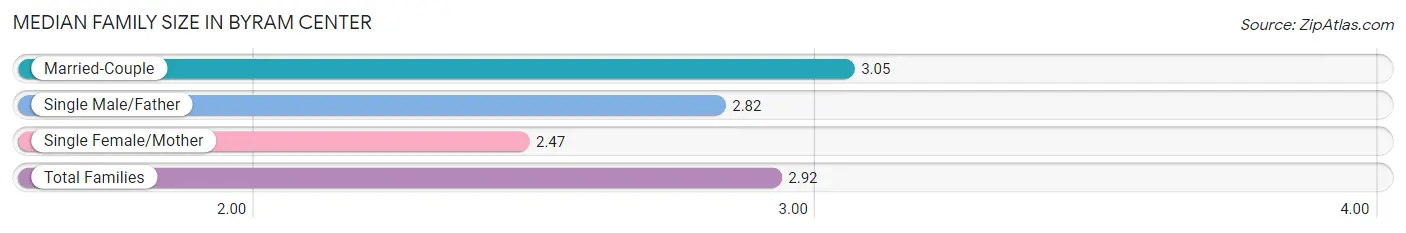
| Family Type | # Families | Family Size |
| Married-Couple | 432 (72.2%) | 3.05 |
| Single Male/Father | 56 (9.4%) | 2.82 |
| Single Female/Mother | 110 (18.4%) | 2.47 |
| Total Families | 598 (100.0%) | 2.92 |
Median Household Size in Byram Center
The median household size in Byram Center is 2.76 persons per household, with married-couple households (432 | 60.6%) accounting for the largest median household size of 3.09 persons per household. non-family households (115 | 16.1%) represent the smallest median household size with 1.29 persons per household.
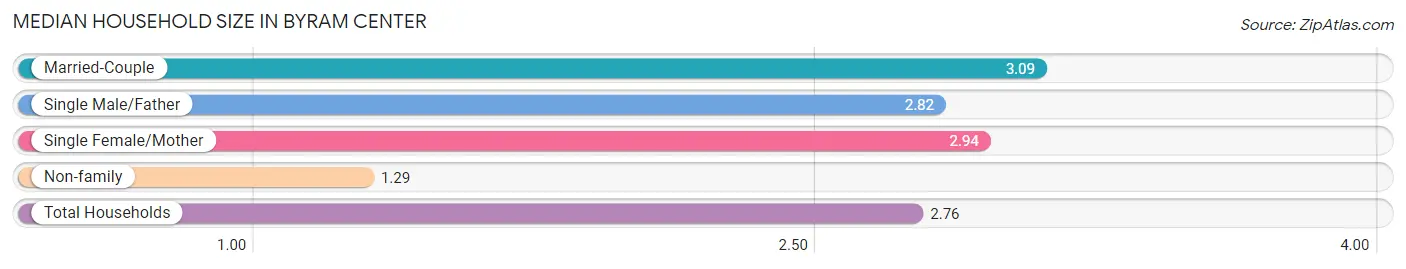
| Household Type | # Households | Household Size |
| Married-Couple | 432 (60.6%) | 3.09 |
| Single Male/Father | 56 (7.9%) | 2.82 |
| Single Female/Mother | 110 (15.4%) | 2.94 |
| Non-family | 115 (16.1%) | 1.29 |
| Total Households | 713 (100.0%) | 2.76 |
Household Size by Marriage Status in Byram Center
Out of a total of 713 households in Byram Center, 598 (83.9%) are family households, while 115 (16.1%) are nonfamily households. The most numerous type of family households are 2-person households, comprising 235, and the most common type of nonfamily households are 1-person households, comprising 92.
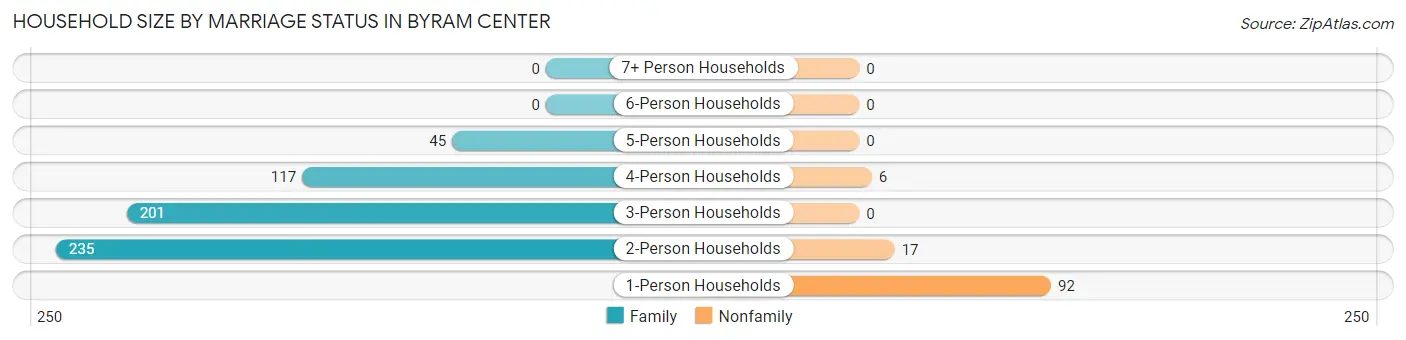
| Household Size | Family Households | Nonfamily Households |
| 1-Person Households | - | 92 (12.9%) |
| 2-Person Households | 235 (33.0%) | 17 (2.4%) |
| 3-Person Households | 201 (28.2%) | 0 (0.0%) |
| 4-Person Households | 117 (16.4%) | 6 (0.8%) |
| 5-Person Households | 45 (6.3%) | 0 (0.0%) |
| 6-Person Households | 0 (0.0%) | 0 (0.0%) |
| 7+ Person Households | 0 (0.0%) | 0 (0.0%) |
| Total | 598 (83.9%) | 115 (16.1%) |
Female Fertility in Byram Center
Fertility by Age in Byram Center
Average fertility rate in Byram Center is 46.0 births per 1,000 women. Women in the age bracket of 20 to 34 years have the highest fertility rate with 59.0 births per 1,000 women. Women in the age bracket of 20 to 34 years acount for 56.0% of all women with births.
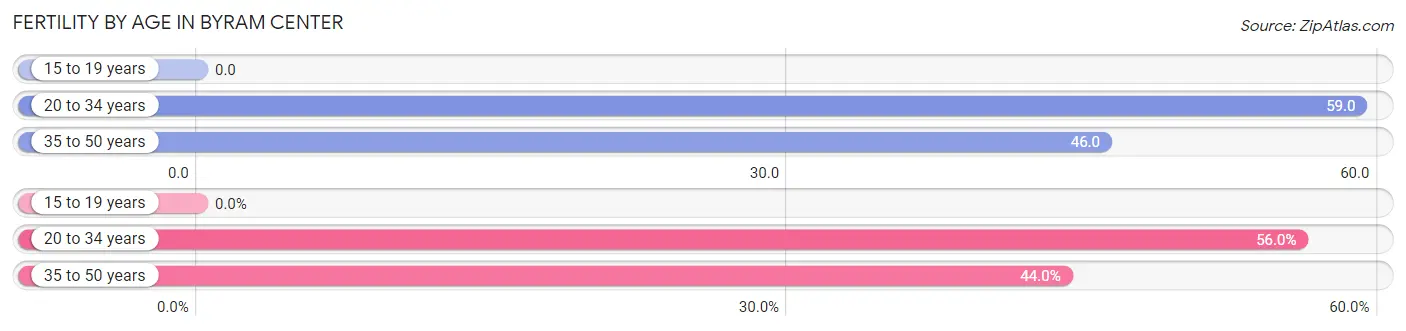
| Age Bracket | Women with Births | Births / 1,000 Women |
| 15 to 19 years | 0 (0.0%) | 0.0 |
| 20 to 34 years | 14 (56.0%) | 59.0 |
| 35 to 50 years | 11 (44.0%) | 46.0 |
| Total | 25 (100.0%) | 46.0 |
Fertility by Age by Marriage Status in Byram Center
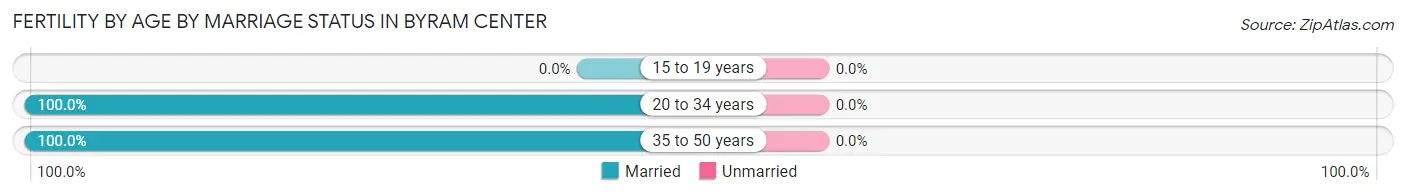
| Age Bracket | Married | Unmarried |
| 15 to 19 years | 0 (0.0%) | 0 (0.0%) |
| 20 to 34 years | 14 (100.0%) | 0 (0.0%) |
| 35 to 50 years | 11 (100.0%) | 0 (0.0%) |
| Total | 25 (100.0%) | 0 (0.0%) |
Fertility by Education in Byram Center
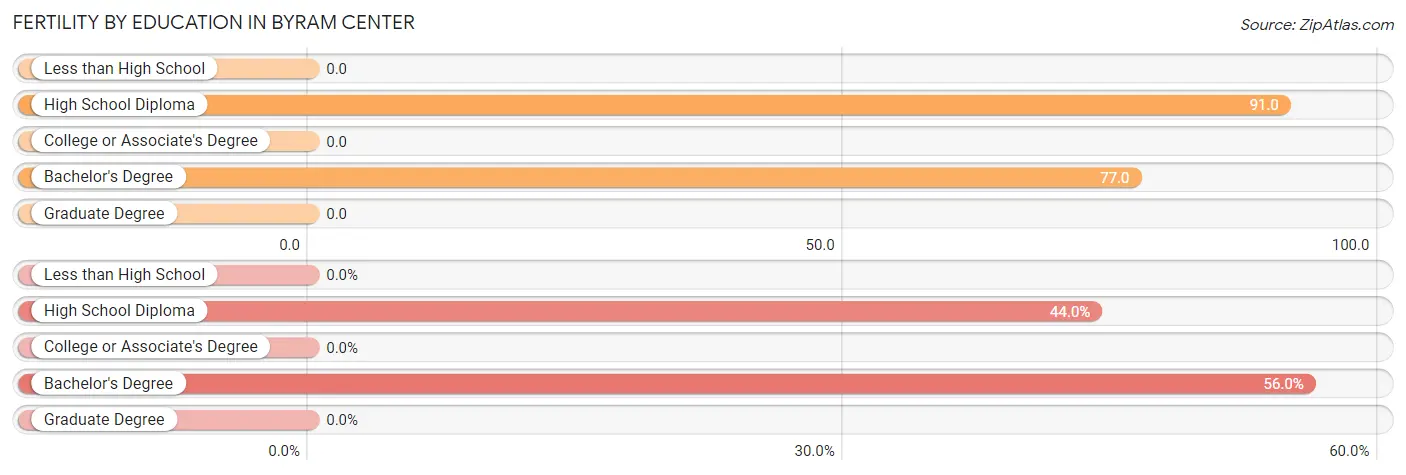
| Educational Attainment | Women with Births | Births / 1,000 Women |
| Less than High School | 0 (0.0%) | 0.0 |
| High School Diploma | 11 (44.0%) | 91.0 |
| College or Associate's Degree | 0 (0.0%) | 0.0 |
| Bachelor's Degree | 14 (56.0%) | 77.0 |
| Graduate Degree | 0 (0.0%) | 0.0 |
| Total | 25 (100.0%) | 46.0 |
Fertility by Education by Marriage Status in Byram Center
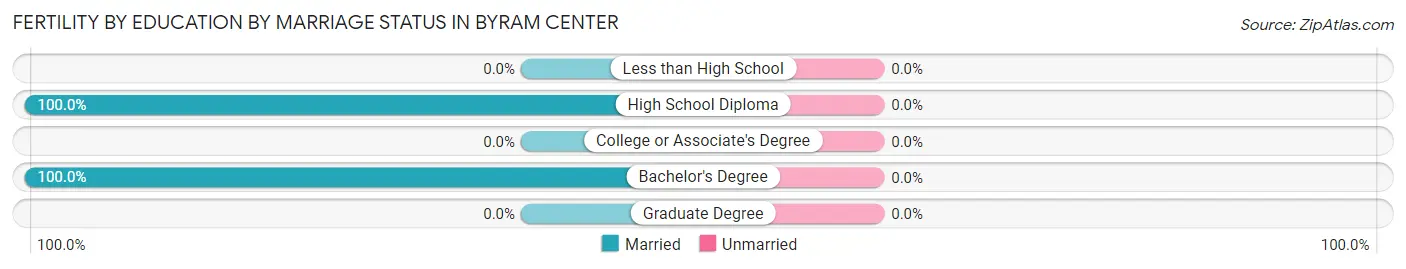
| Educational Attainment | Married | Unmarried |
| Less than High School | 0 (0.0%) | 0 (0.0%) |
| High School Diploma | 11 (100.0%) | 0 (0.0%) |
| College or Associate's Degree | 0 (0.0%) | 0 (0.0%) |
| Bachelor's Degree | 14 (100.0%) | 0 (0.0%) |
| Graduate Degree | 0 (0.0%) | 0 (0.0%) |
| Total | 25 (100.0%) | 0 (0.0%) |
Employment Characteristics in Byram Center
Employment by Class of Employer in Byram Center
Among the 1,244 employed individuals in Byram Center, private company employees (906 | 72.8%), local government employees (134 | 10.8%), and not-for-profit organizations (83 | 6.7%) make up the most common classes of employment.
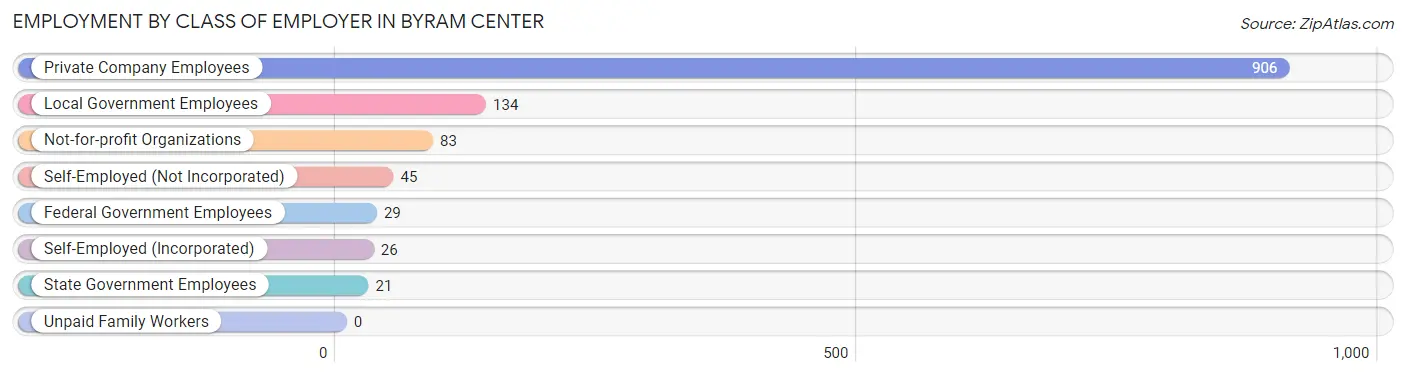
| Employer Class | # Employees | % Employees |
| Private Company Employees | 906 | 72.8% |
| Self-Employed (Incorporated) | 26 | 2.1% |
| Self-Employed (Not Incorporated) | 45 | 3.6% |
| Not-for-profit Organizations | 83 | 6.7% |
| Local Government Employees | 134 | 10.8% |
| State Government Employees | 21 | 1.7% |
| Federal Government Employees | 29 | 2.3% |
| Unpaid Family Workers | 0 | 0.0% |
| Total | 1,244 | 100.0% |
Employment Status by Age in Byram Center
According to the labor force statistics for Byram Center, out of the total population over 16 years of age (1,701), 79.7% or 1,356 individuals are in the labor force, with 5.3% or 72 of them unemployed. The age group with the highest labor force participation rate is 25 to 29 years, with 100.0% or 97 individuals in the labor force. Within the labor force, the 75 years and over age range has the highest percentage of unemployed individuals, with 34.6% or 9 of them being unemployed.
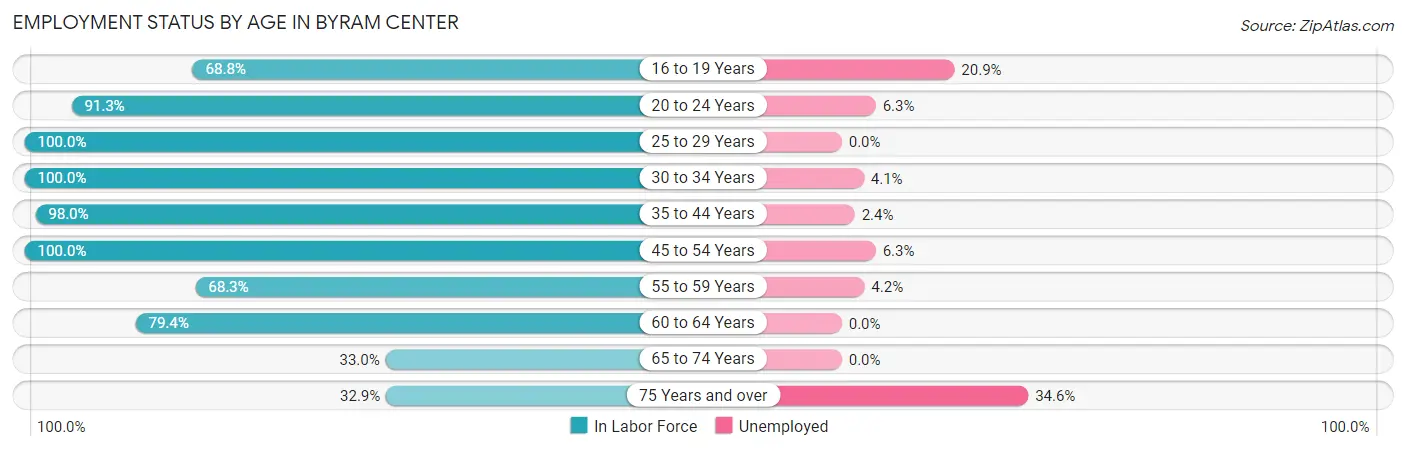
| Age Bracket | In Labor Force | Unemployed |
| 16 to 19 Years | 86 (68.8%) | 18 (20.9%) |
| 20 to 24 Years | 189 (91.3%) | 12 (6.3%) |
| 25 to 29 Years | 97 (100.0%) | 0 (0.0%) |
| 30 to 34 Years | 147 (100.0%) | 6 (4.1%) |
| 35 to 44 Years | 249 (98.0%) | 6 (2.4%) |
| 45 to 54 Years | 240 (100.0%) | 15 (6.3%) |
| 55 to 59 Years | 142 (68.3%) | 6 (4.2%) |
| 60 to 64 Years | 112 (79.4%) | 0 (0.0%) |
| 65 to 74 Years | 67 (33.0%) | 0 (0.0%) |
| 75 Years and over | 26 (32.9%) | 9 (34.6%) |
| Total | 1,356 (79.7%) | 72 (5.3%) |
Employment Status by Educational Attainment in Byram Center
According to labor force statistics for Byram Center, 90.8% of individuals (987) out of the total population between 25 and 64 years of age (1,087) are in the labor force, with 3.3% or 33 of them being unemployed. The group with the highest labor force participation rate are those with the educational attainment of bachelor's degree or higher, with 92.0% or 367 individuals in the labor force. Within the labor force, individuals with high school diploma education have the highest percentage of unemployment, with 9.2% or 21 of them being unemployed.
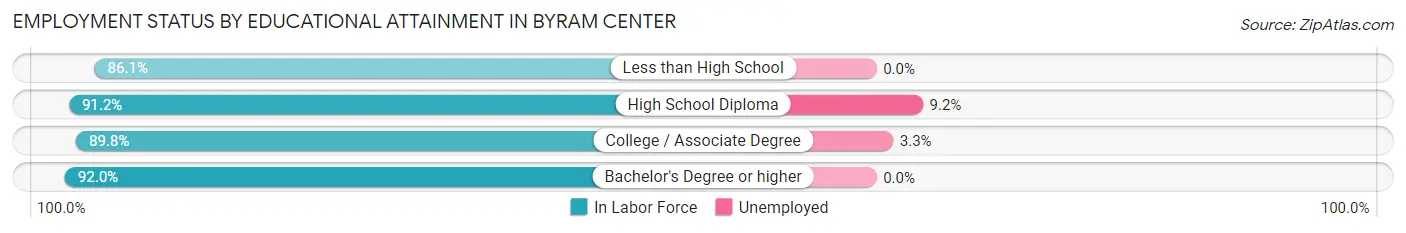
| Educational Attainment | In Labor Force | Unemployed |
| Less than High School | 31 (86.1%) | 0 (0.0%) |
| High School Diploma | 229 (91.2%) | 23 (9.2%) |
| College / Associate Degree | 360 (89.8%) | 13 (3.3%) |
| Bachelor's Degree or higher | 367 (92.0%) | 0 (0.0%) |
| Total | 987 (90.8%) | 36 (3.3%) |
Employment Occupations by Sex in Byram Center
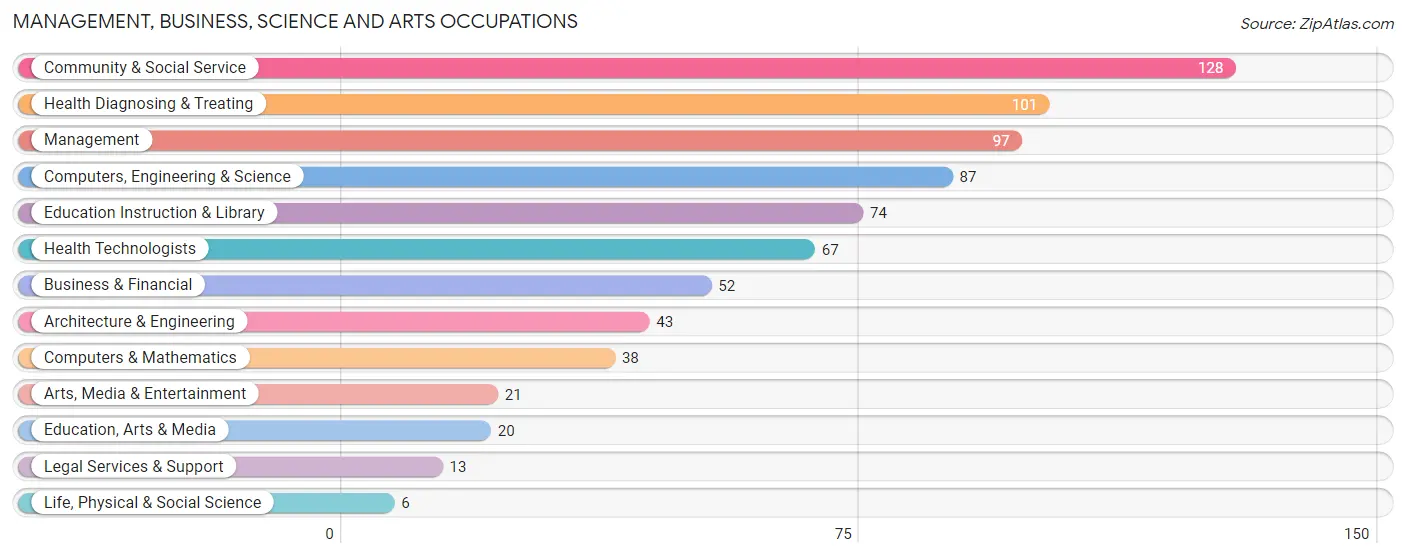
Management, Business, Science and Arts Occupations
The most common Management, Business, Science and Arts occupations in Byram Center are Community & Social Service (128 | 10.0%), Health Diagnosing & Treating (101 | 7.9%), Management (97 | 7.6%), Computers, Engineering & Science (87 | 6.8%), and Education Instruction & Library (74 | 5.8%).
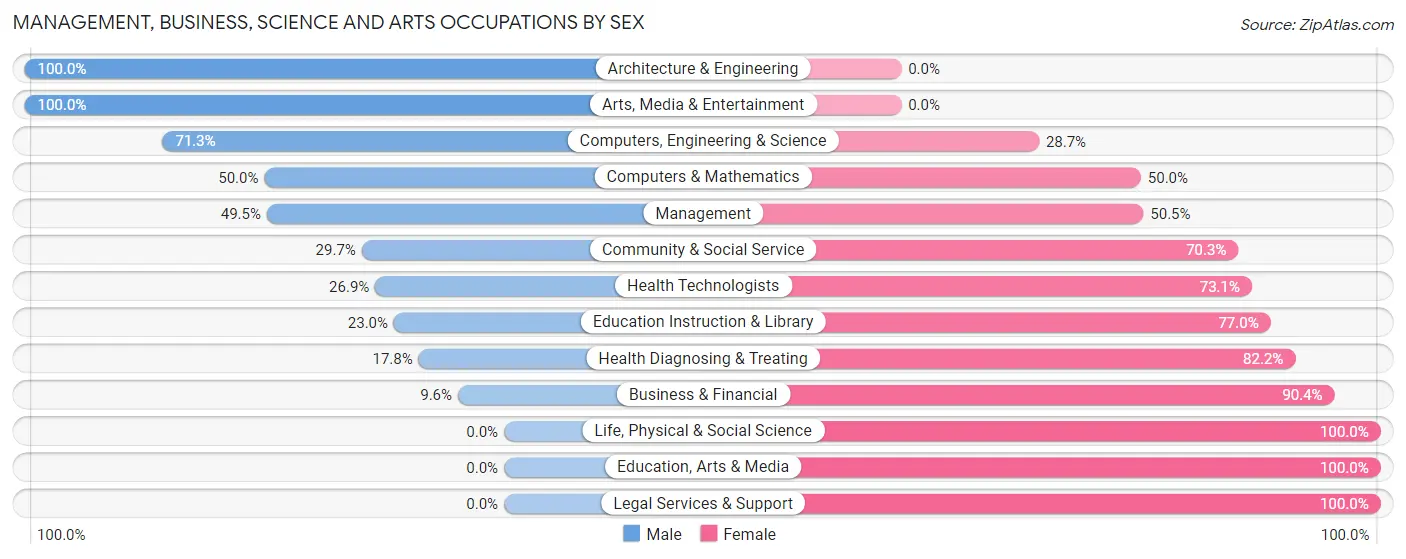
Management, Business, Science and Arts Occupations by Sex
Within the Management, Business, Science and Arts occupations in Byram Center, the most male-oriented occupations are Architecture & Engineering (100.0%), Arts, Media & Entertainment (100.0%), and Computers, Engineering & Science (71.3%), while the most female-oriented occupations are Life, Physical & Social Science (100.0%), Education, Arts & Media (100.0%), and Legal Services & Support (100.0%).
| Occupation | Male | Female |
| Management | 48 (49.5%) | 49 (50.5%) |
| Business & Financial | 5 (9.6%) | 47 (90.4%) |
| Computers, Engineering & Science | 62 (71.3%) | 25 (28.7%) |
| Computers & Mathematics | 19 (50.0%) | 19 (50.0%) |
| Architecture & Engineering | 43 (100.0%) | 0 (0.0%) |
| Life, Physical & Social Science | 0 (0.0%) | 6 (100.0%) |
| Community & Social Service | 38 (29.7%) | 90 (70.3%) |
| Education, Arts & Media | 0 (0.0%) | 20 (100.0%) |
| Legal Services & Support | 0 (0.0%) | 13 (100.0%) |
| Education Instruction & Library | 17 (23.0%) | 57 (77.0%) |
| Arts, Media & Entertainment | 21 (100.0%) | 0 (0.0%) |
| Health Diagnosing & Treating | 18 (17.8%) | 83 (82.2%) |
| Health Technologists | 18 (26.9%) | 49 (73.1%) |
| Total (Category) | 171 (36.8%) | 294 (63.2%) |
| Total (Overall) | 595 (46.4%) | 688 (53.6%) |
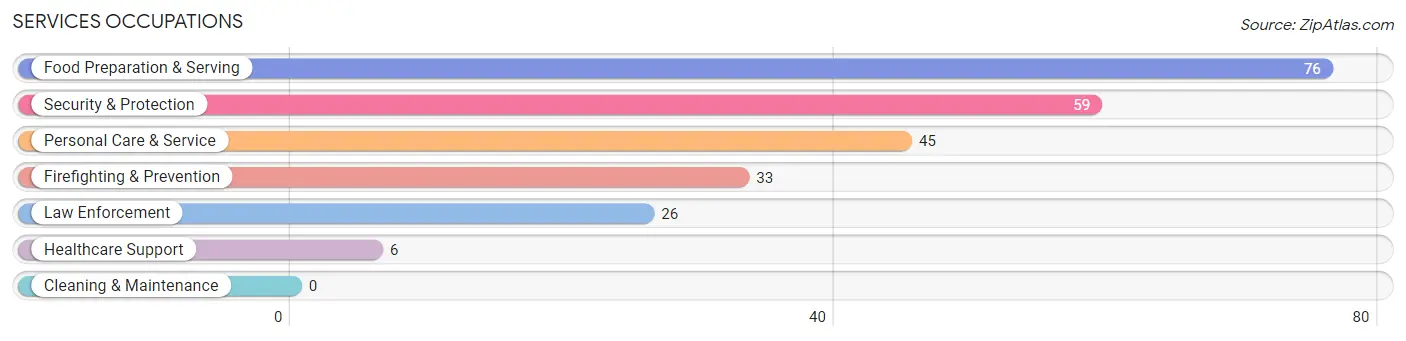
Services Occupations
The most common Services occupations in Byram Center are Food Preparation & Serving (76 | 5.9%), Security & Protection (59 | 4.6%), Personal Care & Service (45 | 3.5%), Firefighting & Prevention (33 | 2.6%), and Law Enforcement (26 | 2.0%).
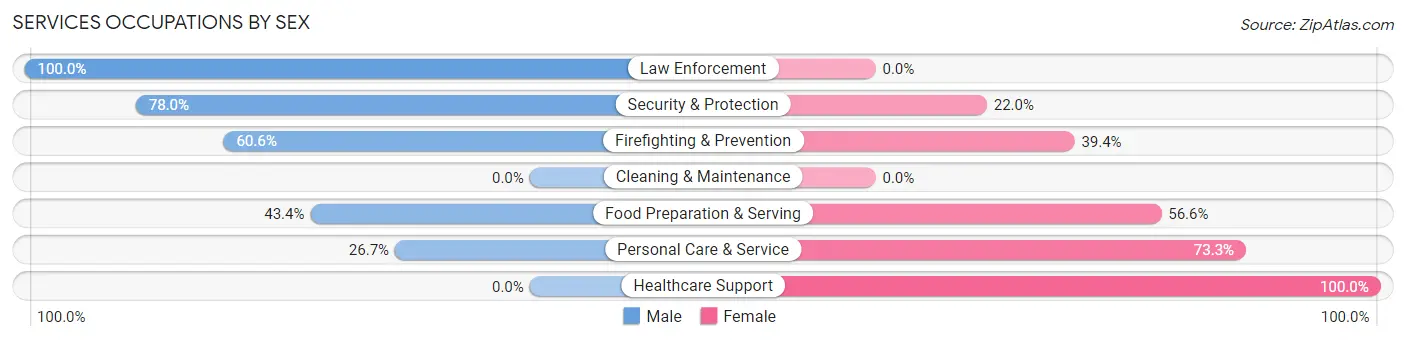
Services Occupations by Sex
Within the Services occupations in Byram Center, the most male-oriented occupations are Law Enforcement (100.0%), Security & Protection (78.0%), and Firefighting & Prevention (60.6%), while the most female-oriented occupations are Healthcare Support (100.0%), Personal Care & Service (73.3%), and Food Preparation & Serving (56.6%).
| Occupation | Male | Female |
| Healthcare Support | 0 (0.0%) | 6 (100.0%) |
| Security & Protection | 46 (78.0%) | 13 (22.0%) |
| Firefighting & Prevention | 20 (60.6%) | 13 (39.4%) |
| Law Enforcement | 26 (100.0%) | 0 (0.0%) |
| Food Preparation & Serving | 33 (43.4%) | 43 (56.6%) |
| Cleaning & Maintenance | 0 (0.0%) | 0 (0.0%) |
| Personal Care & Service | 12 (26.7%) | 33 (73.3%) |
| Total (Category) | 91 (48.9%) | 95 (51.1%) |
| Total (Overall) | 595 (46.4%) | 688 (53.6%) |
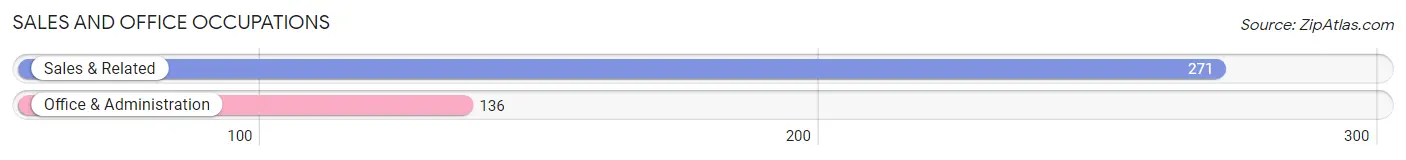
Sales and Office Occupations
The most common Sales and Office occupations in Byram Center are Sales & Related (271 | 21.1%), and Office & Administration (136 | 10.6%).
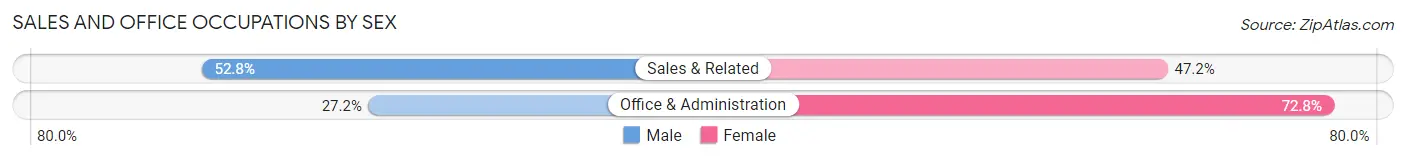
Sales and Office Occupations by Sex
| Occupation | Male | Female |
| Sales & Related | 143 (52.8%) | 128 (47.2%) |
| Office & Administration | 37 (27.2%) | 99 (72.8%) |
| Total (Category) | 180 (44.2%) | 227 (55.8%) |
| Total (Overall) | 595 (46.4%) | 688 (53.6%) |
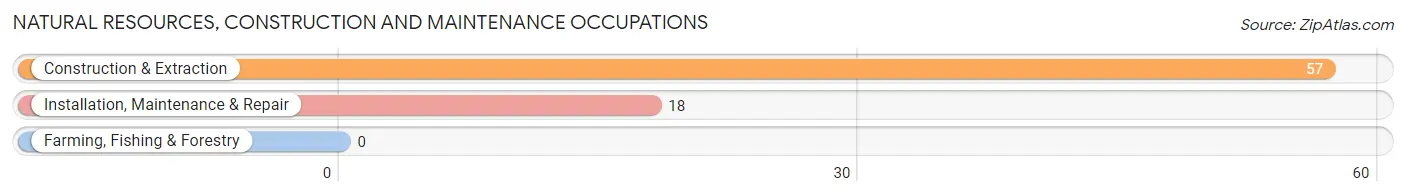
Natural Resources, Construction and Maintenance Occupations
The most common Natural Resources, Construction and Maintenance occupations in Byram Center are Construction & Extraction (57 | 4.4%), and Installation, Maintenance & Repair (18 | 1.4%).
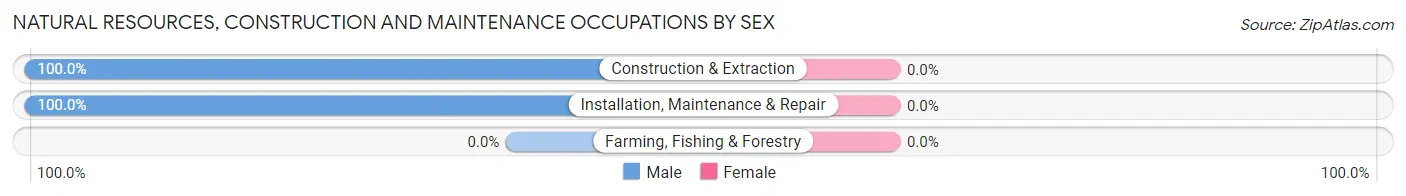
Natural Resources, Construction and Maintenance Occupations by Sex
| Occupation | Male | Female |
| Farming, Fishing & Forestry | 0 (0.0%) | 0 (0.0%) |
| Construction & Extraction | 57 (100.0%) | 0 (0.0%) |
| Installation, Maintenance & Repair | 18 (100.0%) | 0 (0.0%) |
| Total (Category) | 75 (100.0%) | 0 (0.0%) |
| Total (Overall) | 595 (46.4%) | 688 (53.6%) |
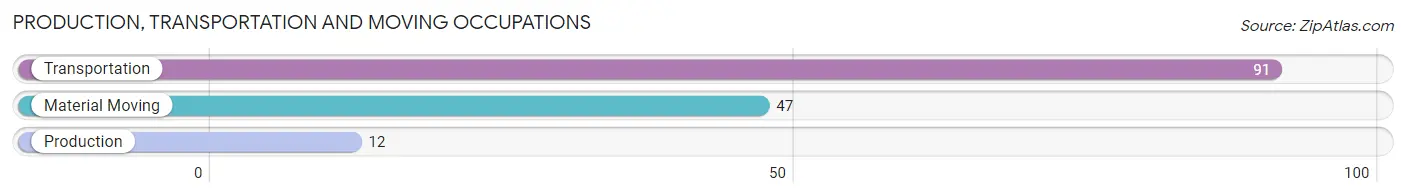
Production, Transportation and Moving Occupations
The most common Production, Transportation and Moving occupations in Byram Center are Transportation (91 | 7.1%), Material Moving (47 | 3.7%), and Production (12 | 0.9%).
Production, Transportation and Moving Occupations by Sex
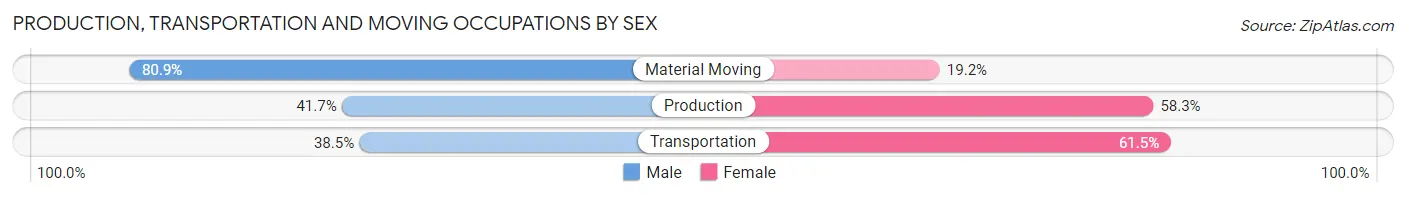
| Occupation | Male | Female |
| Production | 5 (41.7%) | 7 (58.3%) |
| Transportation | 35 (38.5%) | 56 (61.5%) |
| Material Moving | 38 (80.8%) | 9 (19.2%) |
| Total (Category) | 78 (52.0%) | 72 (48.0%) |
| Total (Overall) | 595 (46.4%) | 688 (53.6%) |
Employment Industries by Sex in Byram Center
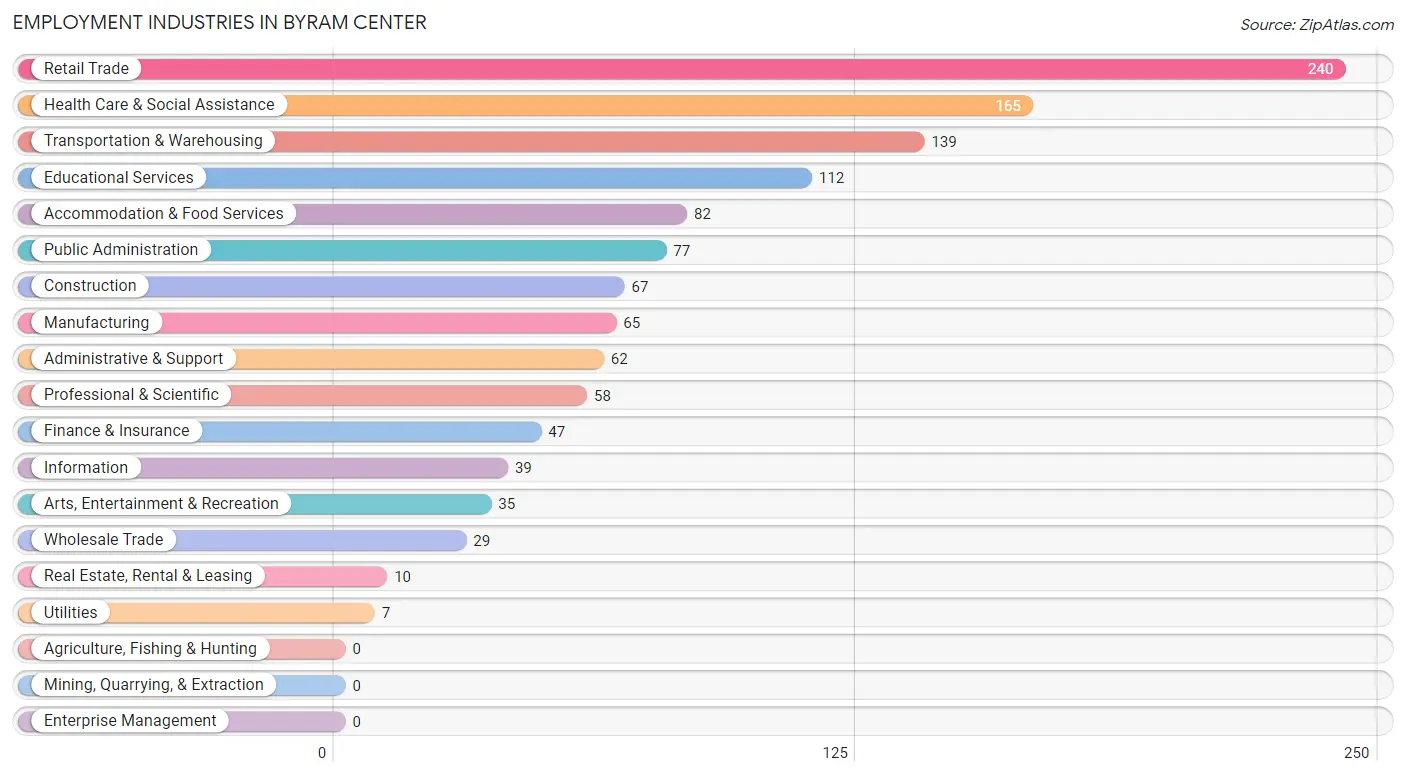
Employment Industries in Byram Center
The major employment industries in Byram Center include Retail Trade (240 | 18.7%), Health Care & Social Assistance (165 | 12.9%), Transportation & Warehousing (139 | 10.8%), Educational Services (112 | 8.7%), and Accommodation & Food Services (82 | 6.4%).
Employment Industries by Sex in Byram Center
The Byram Center industries that see more men than women are Construction (100.0%), Utilities (100.0%), and Arts, Entertainment & Recreation (100.0%), whereas the industries that tend to have a higher number of women are Real Estate, Rental & Leasing (100.0%), Administrative & Support (87.1%), and Health Care & Social Assistance (78.2%).
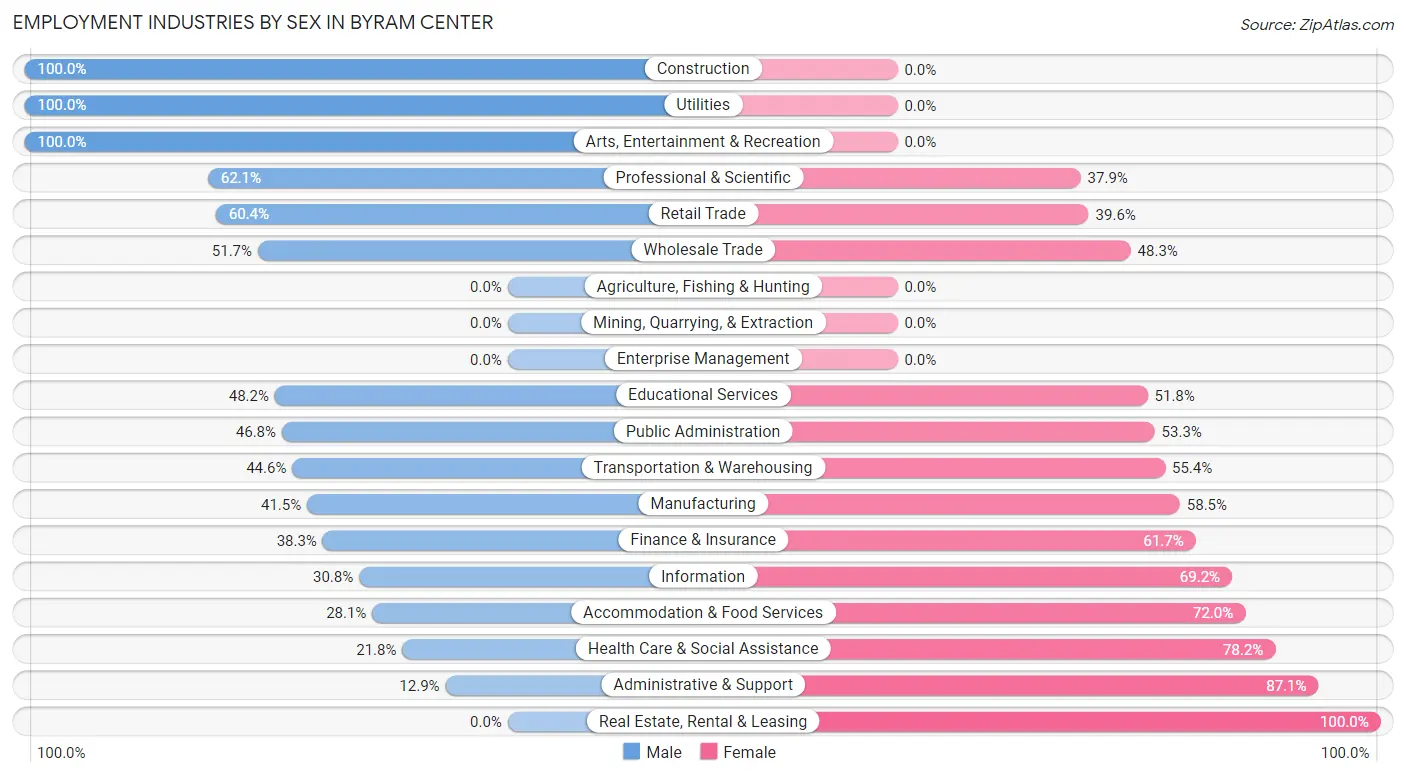
| Industry | Male | Female |
| Agriculture, Fishing & Hunting | 0 (0.0%) | 0 (0.0%) |
| Mining, Quarrying, & Extraction | 0 (0.0%) | 0 (0.0%) |
| Construction | 67 (100.0%) | 0 (0.0%) |
| Manufacturing | 27 (41.5%) | 38 (58.5%) |
| Wholesale Trade | 15 (51.7%) | 14 (48.3%) |
| Retail Trade | 145 (60.4%) | 95 (39.6%) |
| Transportation & Warehousing | 62 (44.6%) | 77 (55.4%) |
| Utilities | 7 (100.0%) | 0 (0.0%) |
| Information | 12 (30.8%) | 27 (69.2%) |
| Finance & Insurance | 18 (38.3%) | 29 (61.7%) |
| Real Estate, Rental & Leasing | 0 (0.0%) | 10 (100.0%) |
| Professional & Scientific | 36 (62.1%) | 22 (37.9%) |
| Enterprise Management | 0 (0.0%) | 0 (0.0%) |
| Administrative & Support | 8 (12.9%) | 54 (87.1%) |
| Educational Services | 54 (48.2%) | 58 (51.8%) |
| Health Care & Social Assistance | 36 (21.8%) | 129 (78.2%) |
| Arts, Entertainment & Recreation | 35 (100.0%) | 0 (0.0%) |
| Accommodation & Food Services | 23 (28.1%) | 59 (72.0%) |
| Public Administration | 36 (46.8%) | 41 (53.2%) |
| Total | 595 (46.4%) | 688 (53.6%) |
Education in Byram Center
School Enrollment in Byram Center
The most common levels of schooling among the 416 students in Byram Center are college / undergraduate (110 | 26.4%), high school (97 | 23.3%), and middle school (83 | 20.0%).
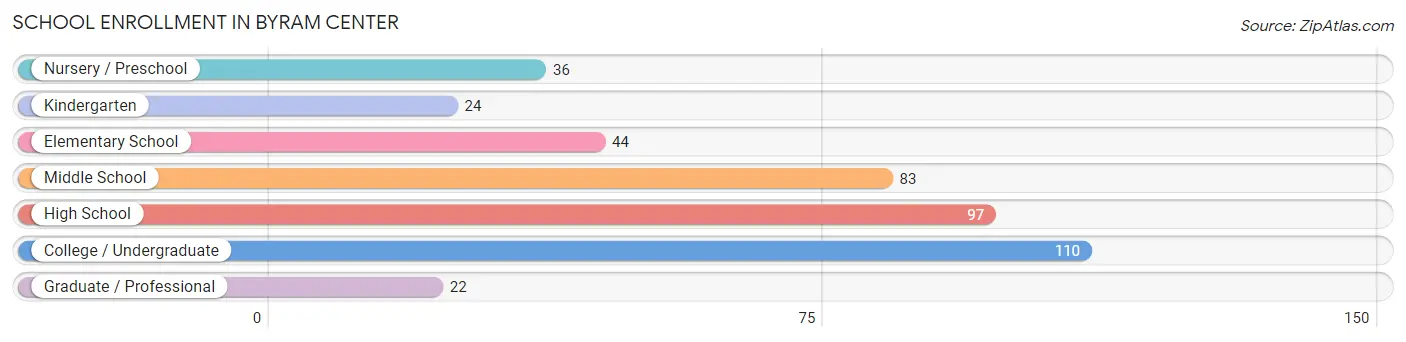
| School Level | # Students | % Students |
| Nursery / Preschool | 36 | 8.6% |
| Kindergarten | 24 | 5.8% |
| Elementary School | 44 | 10.6% |
| Middle School | 83 | 20.0% |
| High School | 97 | 23.3% |
| College / Undergraduate | 110 | 26.4% |
| Graduate / Professional | 22 | 5.3% |
| Total | 416 | 100.0% |
School Enrollment by Age by Funding Source in Byram Center
Out of a total of 416 students who are enrolled in schools in Byram Center, 129 (31.0%) attend a private institution, while the remaining 287 (69.0%) are enrolled in public schools. The age group of 3 to 4 year olds has the highest likelihood of being enrolled in private schools, with 36 (100.0% in the age bracket) enrolled. Conversely, the age group of 5 to 9 year old has the lowest likelihood of being enrolled in a private school, with 62 (100.0% in the age bracket) attending a public institution.
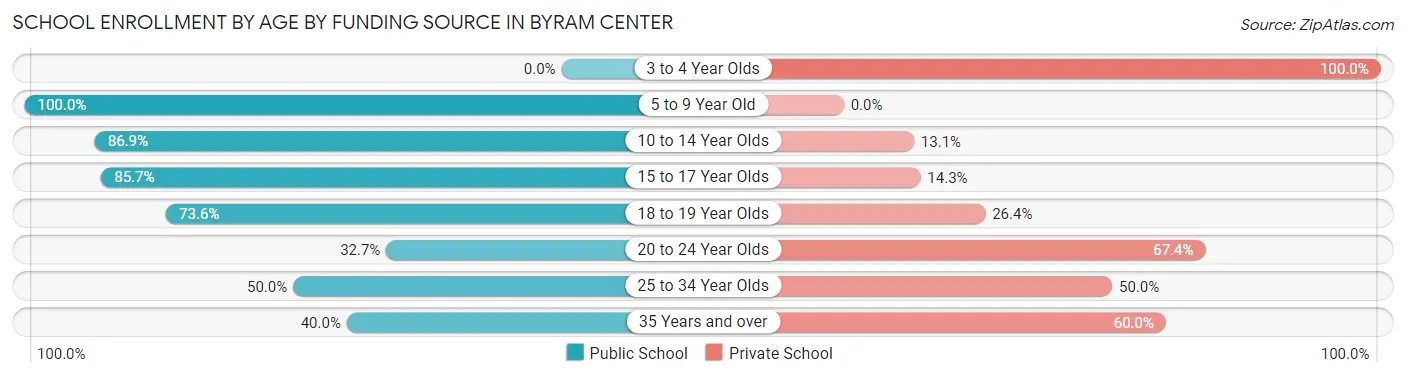
| Age Bracket | Public School | Private School |
| 3 to 4 Year Olds | 0 (0.0%) | 36 (100.0%) |
| 5 to 9 Year Old | 62 (100.0%) | 0 (0.0%) |
| 10 to 14 Year Olds | 93 (86.9%) | 14 (13.1%) |
| 15 to 17 Year Olds | 36 (85.7%) | 6 (14.3%) |
| 18 to 19 Year Olds | 67 (73.6%) | 24 (26.4%) |
| 20 to 24 Year Olds | 16 (32.7%) | 33 (67.3%) |
| 25 to 34 Year Olds | 7 (50.0%) | 7 (50.0%) |
| 35 Years and over | 6 (40.0%) | 9 (60.0%) |
| Total | 287 (69.0%) | 129 (31.0%) |
Educational Attainment by Field of Study in Byram Center
Business (138 | 23.5%), engineering (87 | 14.8%), computers & mathematics (55 | 9.3%), education (46 | 7.8%), and arts & humanities (41 | 7.0%) are the most common fields of study among 588 individuals in Byram Center who have obtained a bachelor's degree or higher.
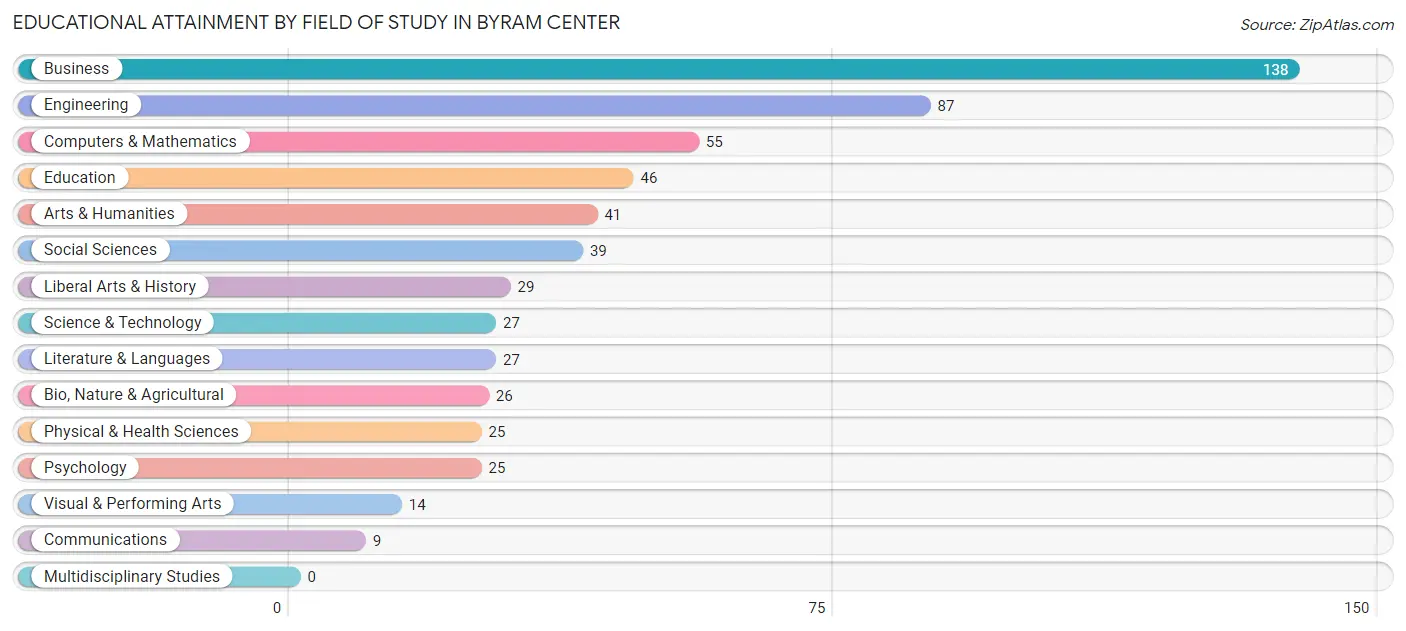
| Field of Study | # Graduates | % Graduates |
| Computers & Mathematics | 55 | 9.3% |
| Bio, Nature & Agricultural | 26 | 4.4% |
| Physical & Health Sciences | 25 | 4.3% |
| Psychology | 25 | 4.3% |
| Social Sciences | 39 | 6.6% |
| Engineering | 87 | 14.8% |
| Multidisciplinary Studies | 0 | 0.0% |
| Science & Technology | 27 | 4.6% |
| Business | 138 | 23.5% |
| Education | 46 | 7.8% |
| Literature & Languages | 27 | 4.6% |
| Liberal Arts & History | 29 | 4.9% |
| Visual & Performing Arts | 14 | 2.4% |
| Communications | 9 | 1.5% |
| Arts & Humanities | 41 | 7.0% |
| Total | 588 | 100.0% |
Transportation & Commute in Byram Center
Vehicle Availability by Sex in Byram Center
The most prevalent vehicle ownership categories in Byram Center are males with 2 vehicles (241, accounting for 41.5%) and females with 2 vehicles (287, making up 36.3%).
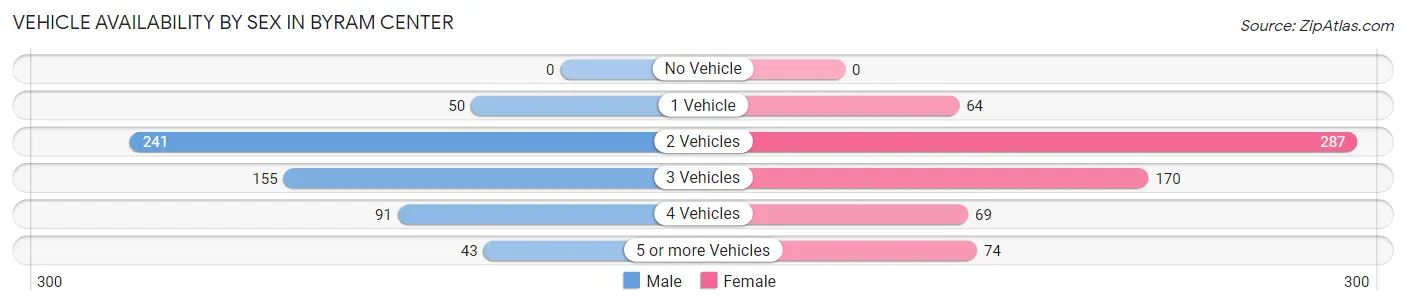
| Vehicles Available | Male | Female |
| No Vehicle | 0 (0.0%) | 0 (0.0%) |
| 1 Vehicle | 50 (8.6%) | 64 (9.6%) |
| 2 Vehicles | 241 (41.5%) | 287 (43.2%) |
| 3 Vehicles | 155 (26.7%) | 170 (25.6%) |
| 4 Vehicles | 91 (15.7%) | 69 (10.4%) |
| 5 or more Vehicles | 43 (7.4%) | 74 (11.1%) |
| Total | 580 (100.0%) | 664 (100.0%) |
Commute Time in Byram Center
The most frequently occuring commute durations in Byram Center are 10 to 14 minutes (168 commuters, 14.4%), 15 to 19 minutes (145 commuters, 12.5%), and 60 to 89 minutes (136 commuters, 11.7%).
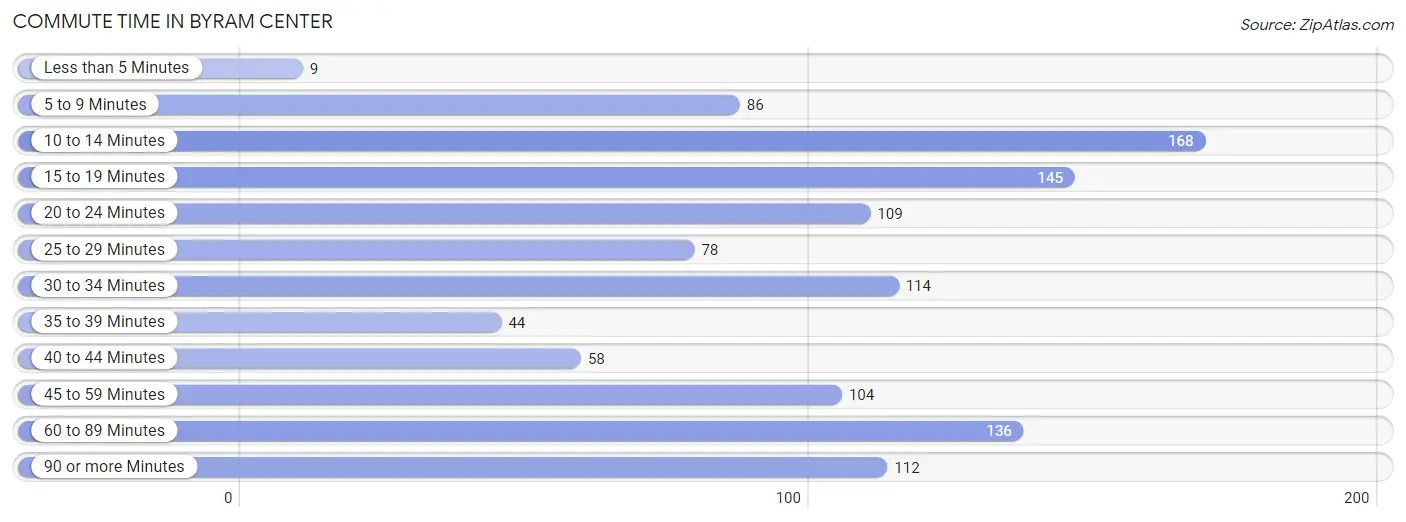
| Commute Time | # Commuters | % Commuters |
| Less than 5 Minutes | 9 | 0.8% |
| 5 to 9 Minutes | 86 | 7.4% |
| 10 to 14 Minutes | 168 | 14.4% |
| 15 to 19 Minutes | 145 | 12.5% |
| 20 to 24 Minutes | 109 | 9.4% |
| 25 to 29 Minutes | 78 | 6.7% |
| 30 to 34 Minutes | 114 | 9.8% |
| 35 to 39 Minutes | 44 | 3.8% |
| 40 to 44 Minutes | 58 | 5.0% |
| 45 to 59 Minutes | 104 | 8.9% |
| 60 to 89 Minutes | 136 | 11.7% |
| 90 or more Minutes | 112 | 9.6% |
Commute Time by Sex in Byram Center
The most common commute times in Byram Center are 10 to 14 minutes (100 commuters, 18.1%) for males and 30 to 34 minutes (100 commuters, 16.3%) for females.
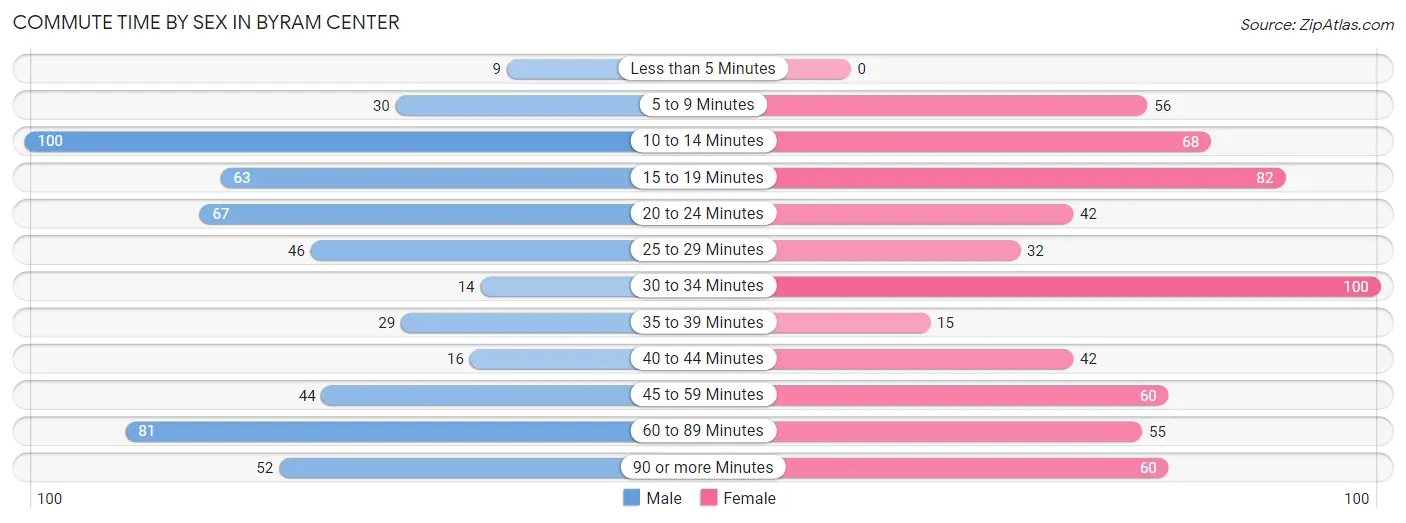
| Commute Time | Male | Female |
| Less than 5 Minutes | 9 (1.6%) | 0 (0.0%) |
| 5 to 9 Minutes | 30 (5.4%) | 56 (9.1%) |
| 10 to 14 Minutes | 100 (18.1%) | 68 (11.1%) |
| 15 to 19 Minutes | 63 (11.4%) | 82 (13.4%) |
| 20 to 24 Minutes | 67 (12.2%) | 42 (6.9%) |
| 25 to 29 Minutes | 46 (8.4%) | 32 (5.2%) |
| 30 to 34 Minutes | 14 (2.5%) | 100 (16.3%) |
| 35 to 39 Minutes | 29 (5.3%) | 15 (2.5%) |
| 40 to 44 Minutes | 16 (2.9%) | 42 (6.9%) |
| 45 to 59 Minutes | 44 (8.0%) | 60 (9.8%) |
| 60 to 89 Minutes | 81 (14.7%) | 55 (9.0%) |
| 90 or more Minutes | 52 (9.4%) | 60 (9.8%) |
Time of Departure to Work by Sex in Byram Center
The most frequent times of departure to work in Byram Center are 7:30 AM to 7:59 AM (94, 17.1%) for males and 7:30 AM to 7:59 AM (132, 21.6%) for females.
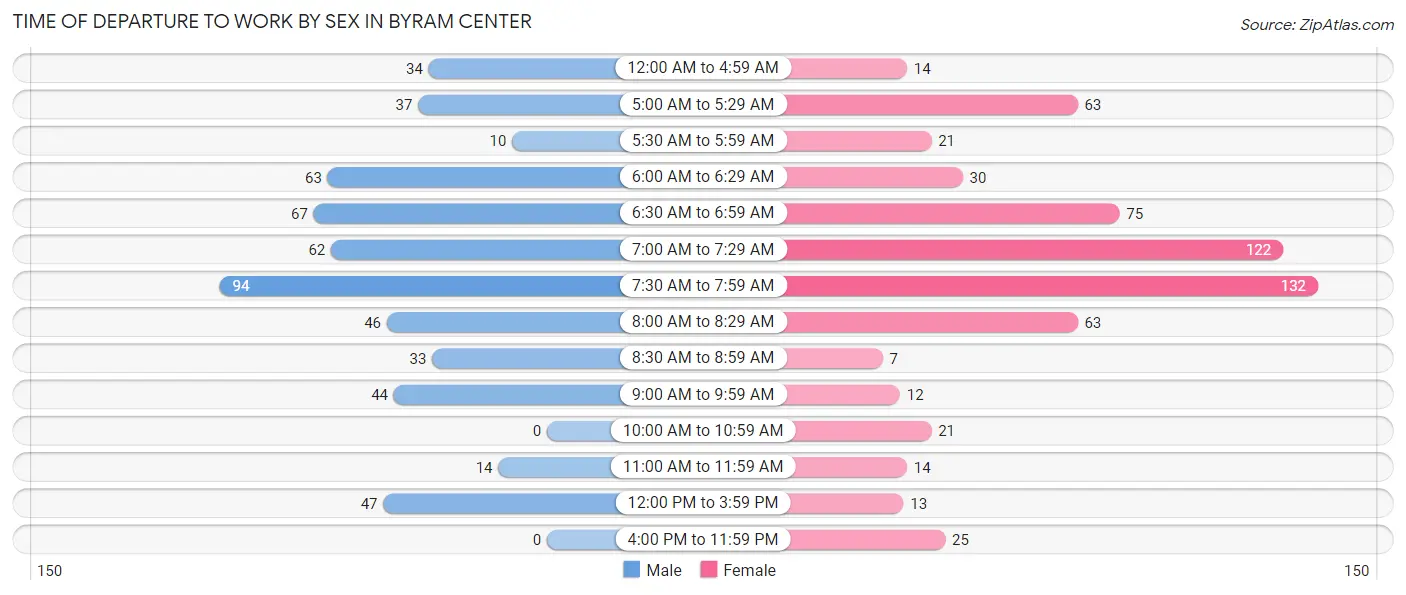
| Time of Departure | Male | Female |
| 12:00 AM to 4:59 AM | 34 (6.2%) | 14 (2.3%) |
| 5:00 AM to 5:29 AM | 37 (6.7%) | 63 (10.3%) |
| 5:30 AM to 5:59 AM | 10 (1.8%) | 21 (3.4%) |
| 6:00 AM to 6:29 AM | 63 (11.4%) | 30 (4.9%) |
| 6:30 AM to 6:59 AM | 67 (12.2%) | 75 (12.2%) |
| 7:00 AM to 7:29 AM | 62 (11.3%) | 122 (19.9%) |
| 7:30 AM to 7:59 AM | 94 (17.1%) | 132 (21.6%) |
| 8:00 AM to 8:29 AM | 46 (8.4%) | 63 (10.3%) |
| 8:30 AM to 8:59 AM | 33 (6.0%) | 7 (1.1%) |
| 9:00 AM to 9:59 AM | 44 (8.0%) | 12 (2.0%) |
| 10:00 AM to 10:59 AM | 0 (0.0%) | 21 (3.4%) |
| 11:00 AM to 11:59 AM | 14 (2.5%) | 14 (2.3%) |
| 12:00 PM to 3:59 PM | 47 (8.5%) | 13 (2.1%) |
| 4:00 PM to 11:59 PM | 0 (0.0%) | 25 (4.1%) |
| Total | 551 (100.0%) | 612 (100.0%) |
Housing Occupancy in Byram Center
Occupancy by Ownership in Byram Center
Of the total 713 dwellings in Byram Center, owner-occupied units account for 698 (97.9%), while renter-occupied units make up 15 (2.1%).
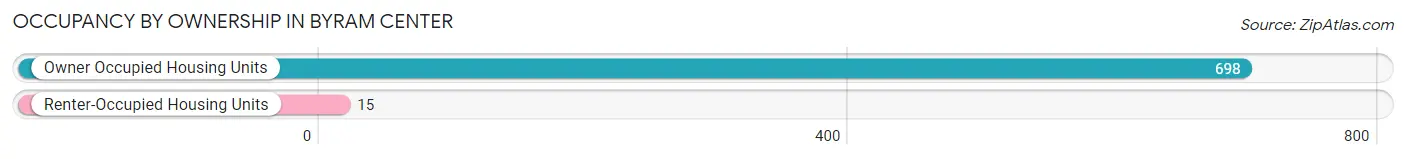
| Occupancy | # Housing Units | % Housing Units |
| Owner Occupied Housing Units | 698 | 97.9% |
| Renter-Occupied Housing Units | 15 | 2.1% |
| Total Occupied Housing Units | 713 | 100.0% |
Occupancy by Household Size in Byram Center
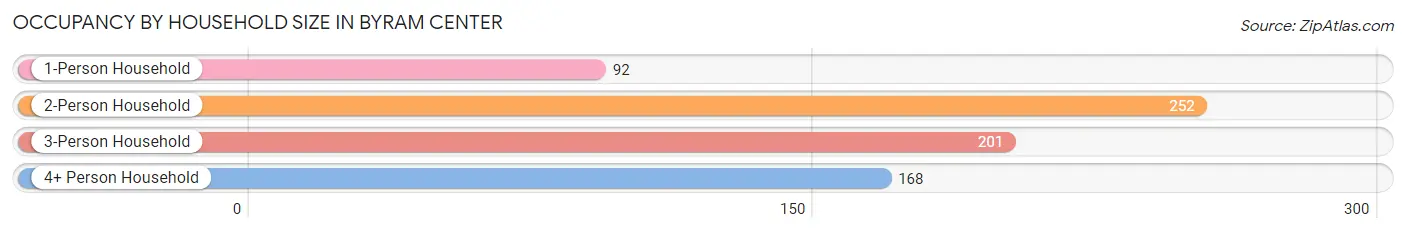
| Household Size | # Housing Units | % Housing Units |
| 1-Person Household | 92 | 12.9% |
| 2-Person Household | 252 | 35.3% |
| 3-Person Household | 201 | 28.2% |
| 4+ Person Household | 168 | 23.6% |
| Total Housing Units | 713 | 100.0% |
Occupancy by Ownership by Household Size in Byram Center
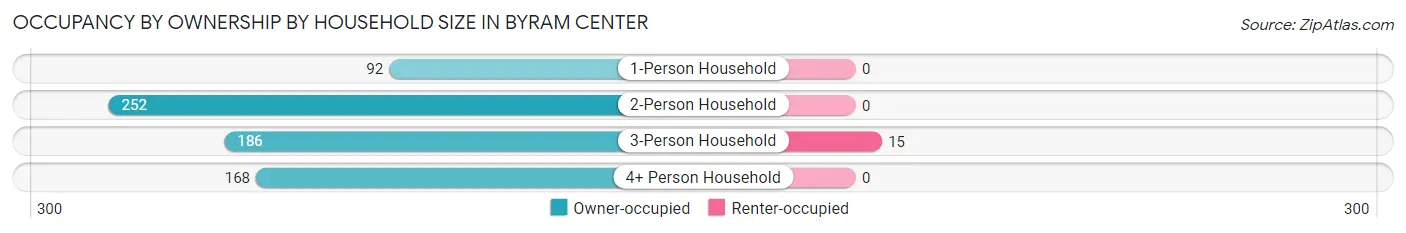
| Household Size | Owner-occupied | Renter-occupied |
| 1-Person Household | 92 (100.0%) | 0 (0.0%) |
| 2-Person Household | 252 (100.0%) | 0 (0.0%) |
| 3-Person Household | 186 (92.5%) | 15 (7.5%) |
| 4+ Person Household | 168 (100.0%) | 0 (0.0%) |
| Total Housing Units | 698 (97.9%) | 15 (2.1%) |
Occupancy by Educational Attainment in Byram Center
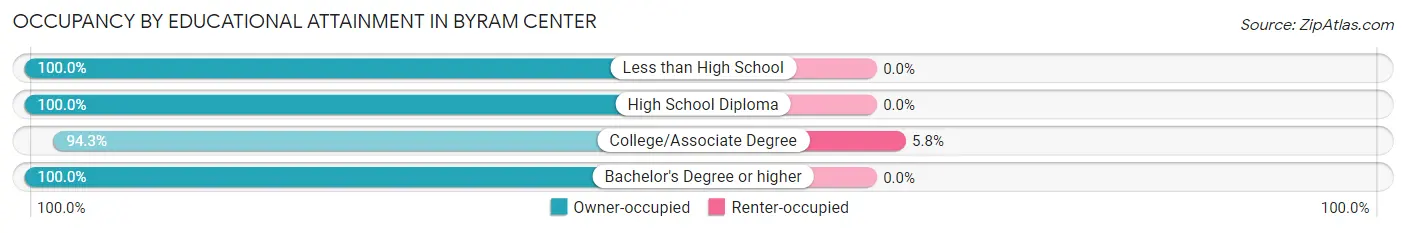
| Household Size | Owner-occupied | Renter-occupied |
| Less than High School | 17 (100.0%) | 0 (0.0%) |
| High School Diploma | 108 (100.0%) | 0 (0.0%) |
| College/Associate Degree | 246 (94.3%) | 15 (5.8%) |
| Bachelor's Degree or higher | 327 (100.0%) | 0 (0.0%) |
Occupancy by Age of Householder in Byram Center
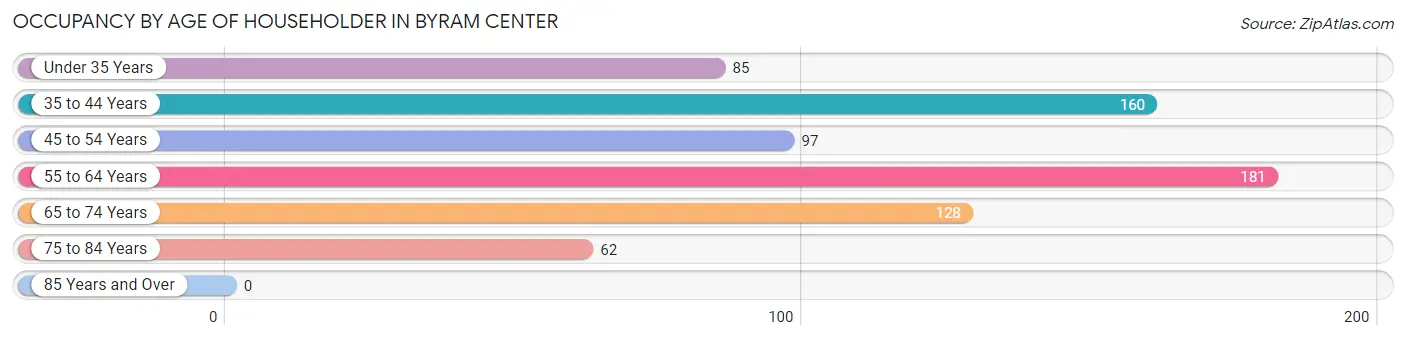
| Age Bracket | # Households | % Households |
| Under 35 Years | 85 | 11.9% |
| 35 to 44 Years | 160 | 22.4% |
| 45 to 54 Years | 97 | 13.6% |
| 55 to 64 Years | 181 | 25.4% |
| 65 to 74 Years | 128 | 17.9% |
| 75 to 84 Years | 62 | 8.7% |
| 85 Years and Over | 0 | 0.0% |
| Total | 713 | 100.0% |
Housing Finances in Byram Center
Median Income by Occupancy in Byram Center
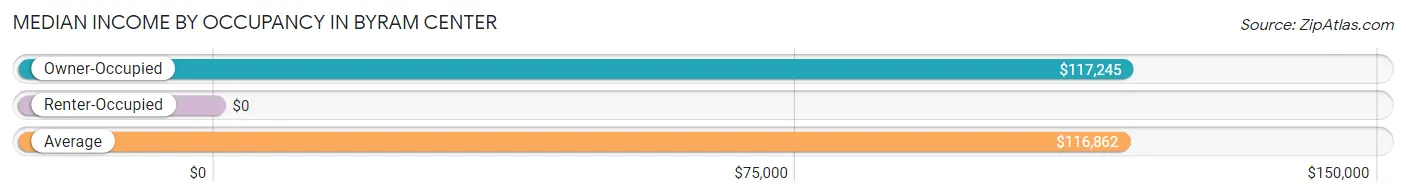
| Occupancy Type | # Households | Median Income |
| Owner-Occupied | 698 (97.9%) | $117,245 |
| Renter-Occupied | 15 (2.1%) | $0 |
| Average | 713 (100.0%) | $116,862 |
Occupancy by Householder Income Bracket in Byram Center
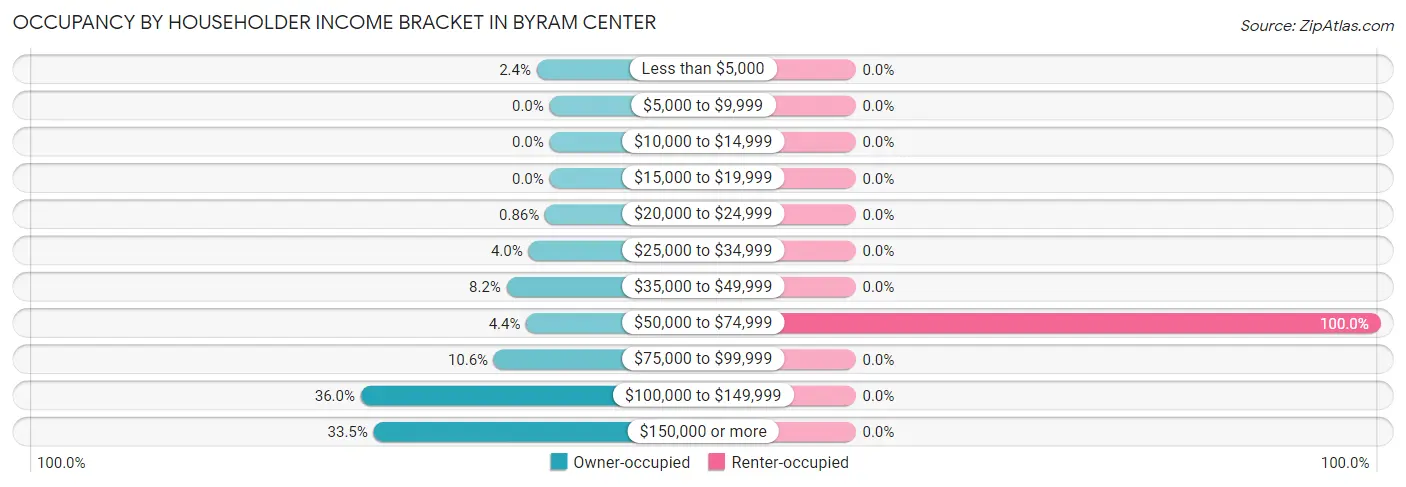
| Income Bracket | Owner-occupied | Renter-occupied |
| Less than $5,000 | 17 (2.4%) | 0 (0.0%) |
| $5,000 to $9,999 | 0 (0.0%) | 0 (0.0%) |
| $10,000 to $14,999 | 0 (0.0%) | 0 (0.0%) |
| $15,000 to $19,999 | 0 (0.0%) | 0 (0.0%) |
| $20,000 to $24,999 | 6 (0.9%) | 0 (0.0%) |
| $25,000 to $34,999 | 28 (4.0%) | 0 (0.0%) |
| $35,000 to $49,999 | 57 (8.2%) | 0 (0.0%) |
| $50,000 to $74,999 | 31 (4.4%) | 15 (100.0%) |
| $75,000 to $99,999 | 74 (10.6%) | 0 (0.0%) |
| $100,000 to $149,999 | 251 (36.0%) | 0 (0.0%) |
| $150,000 or more | 234 (33.5%) | 0 (0.0%) |
| Total | 698 (100.0%) | 15 (100.0%) |
Monthly Housing Cost Tiers in Byram Center
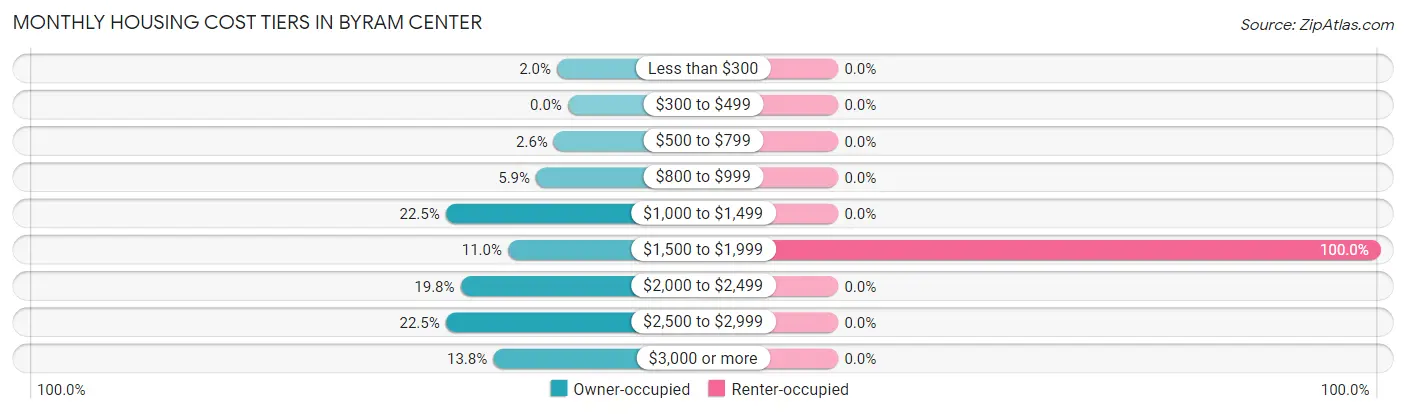
| Monthly Cost | Owner-occupied | Renter-occupied |
| Less than $300 | 14 (2.0%) | 0 (0.0%) |
| $300 to $499 | 0 (0.0%) | 0 (0.0%) |
| $500 to $799 | 18 (2.6%) | 0 (0.0%) |
| $800 to $999 | 41 (5.9%) | 0 (0.0%) |
| $1,000 to $1,499 | 157 (22.5%) | 0 (0.0%) |
| $1,500 to $1,999 | 77 (11.0%) | 15 (100.0%) |
| $2,000 to $2,499 | 138 (19.8%) | 0 (0.0%) |
| $2,500 to $2,999 | 157 (22.5%) | 0 (0.0%) |
| $3,000 or more | 96 (13.8%) | 0 (0.0%) |
| Total | 698 (100.0%) | 15 (100.0%) |
Physical Housing Characteristics in Byram Center
Housing Structures in Byram Center
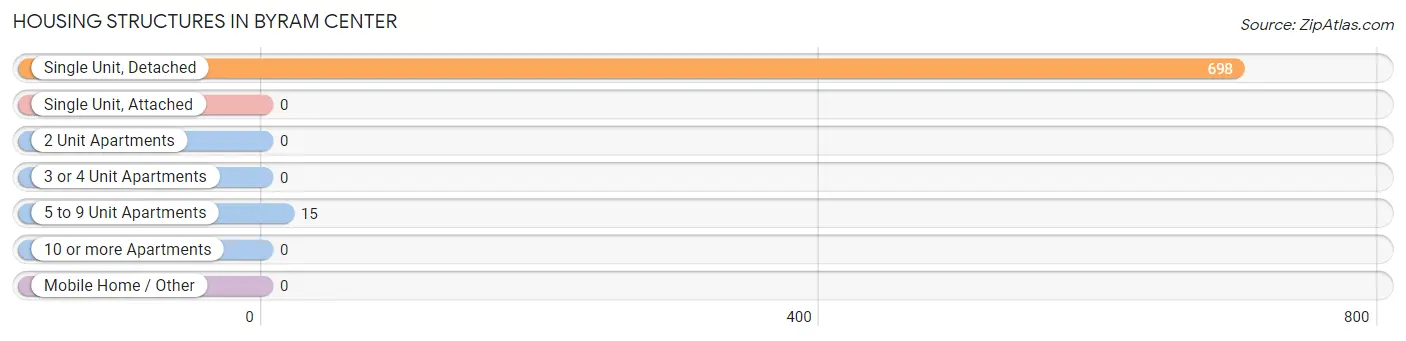
| Structure Type | # Housing Units | % Housing Units |
| Single Unit, Detached | 698 | 97.9% |
| Single Unit, Attached | 0 | 0.0% |
| 2 Unit Apartments | 0 | 0.0% |
| 3 or 4 Unit Apartments | 0 | 0.0% |
| 5 to 9 Unit Apartments | 15 | 2.1% |
| 10 or more Apartments | 0 | 0.0% |
| Mobile Home / Other | 0 | 0.0% |
| Total | 713 | 100.0% |
Housing Structures by Occupancy in Byram Center
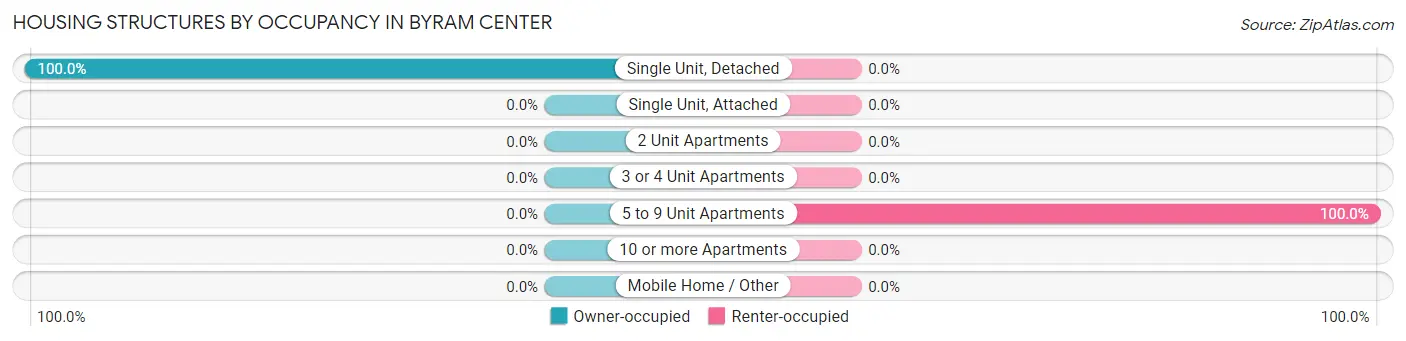
| Structure Type | Owner-occupied | Renter-occupied |
| Single Unit, Detached | 698 (100.0%) | 0 (0.0%) |
| Single Unit, Attached | 0 (0.0%) | 0 (0.0%) |
| 2 Unit Apartments | 0 (0.0%) | 0 (0.0%) |
| 3 or 4 Unit Apartments | 0 (0.0%) | 0 (0.0%) |
| 5 to 9 Unit Apartments | 0 (0.0%) | 15 (100.0%) |
| 10 or more Apartments | 0 (0.0%) | 0 (0.0%) |
| Mobile Home / Other | 0 (0.0%) | 0 (0.0%) |
| Total | 698 (97.9%) | 15 (2.1%) |
Housing Structures by Number of Rooms in Byram Center
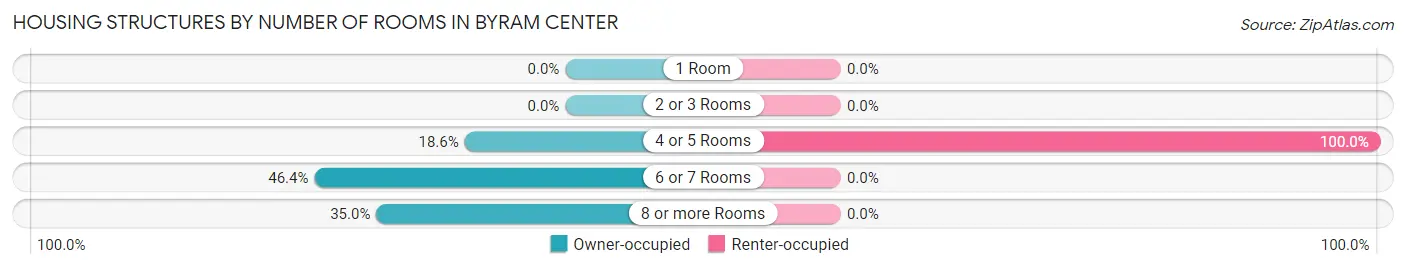
| Number of Rooms | Owner-occupied | Renter-occupied |
| 1 Room | 0 (0.0%) | 0 (0.0%) |
| 2 or 3 Rooms | 0 (0.0%) | 0 (0.0%) |
| 4 or 5 Rooms | 130 (18.6%) | 15 (100.0%) |
| 6 or 7 Rooms | 324 (46.4%) | 0 (0.0%) |
| 8 or more Rooms | 244 (35.0%) | 0 (0.0%) |
| Total | 698 (100.0%) | 15 (100.0%) |
Housing Structure by Heating Type in Byram Center
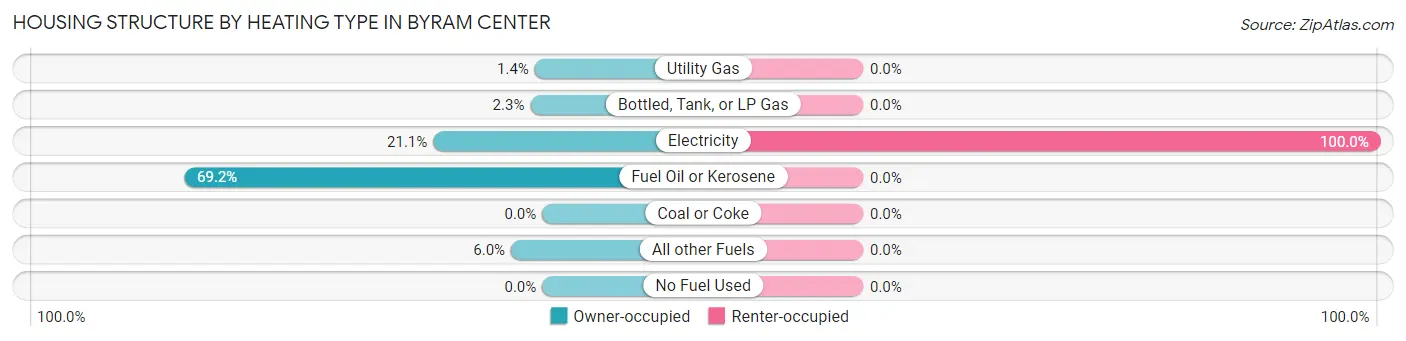
| Heating Type | Owner-occupied | Renter-occupied |
| Utility Gas | 10 (1.4%) | 0 (0.0%) |
| Bottled, Tank, or LP Gas | 16 (2.3%) | 0 (0.0%) |
| Electricity | 147 (21.1%) | 15 (100.0%) |
| Fuel Oil or Kerosene | 483 (69.2%) | 0 (0.0%) |
| Coal or Coke | 0 (0.0%) | 0 (0.0%) |
| All other Fuels | 42 (6.0%) | 0 (0.0%) |
| No Fuel Used | 0 (0.0%) | 0 (0.0%) |
| Total | 698 (100.0%) | 15 (100.0%) |
Household Vehicle Usage in Byram Center
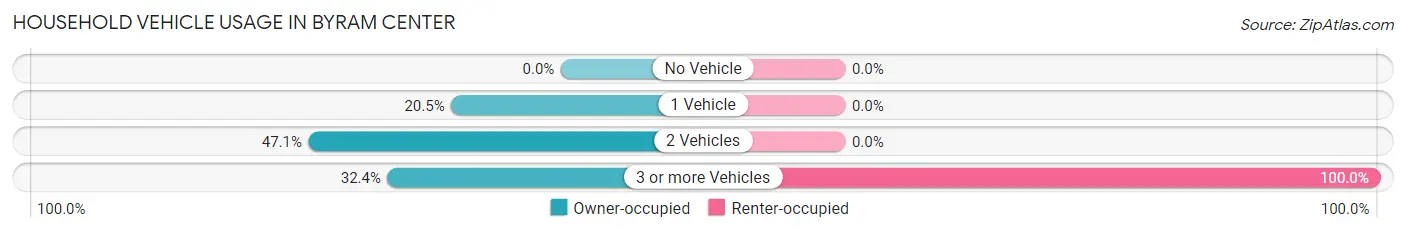
| Vehicles per Household | Owner-occupied | Renter-occupied |
| No Vehicle | 0 (0.0%) | 0 (0.0%) |
| 1 Vehicle | 143 (20.5%) | 0 (0.0%) |
| 2 Vehicles | 329 (47.1%) | 0 (0.0%) |
| 3 or more Vehicles | 226 (32.4%) | 15 (100.0%) |
| Total | 698 (100.0%) | 15 (100.0%) |
Real Estate & Mortgages in Byram Center
Real Estate and Mortgage Overview in Byram Center
| Characteristic | Without Mortgage | With Mortgage |
| Housing Units | 225 | 473 |
| Median Property Value | $365,900 | $327,700 |
| Median Household Income | $117,250 | $165 |
| Monthly Housing Costs | $1,133 | $96 |
| Real Estate Taxes | $9,572 | $0 |
Property Value by Mortgage Status in Byram Center
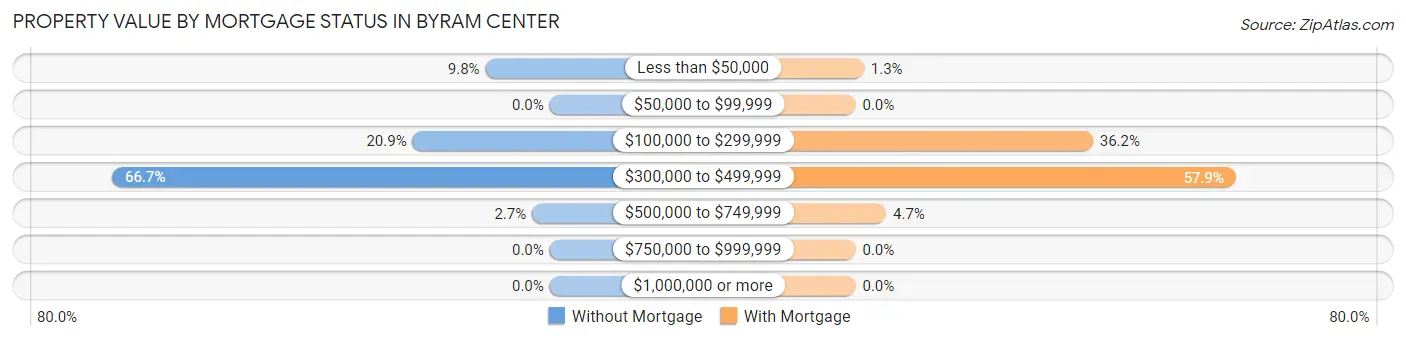
| Property Value | Without Mortgage | With Mortgage |
| Less than $50,000 | 22 (9.8%) | 6 (1.3%) |
| $50,000 to $99,999 | 0 (0.0%) | 0 (0.0%) |
| $100,000 to $299,999 | 47 (20.9%) | 171 (36.1%) |
| $300,000 to $499,999 | 150 (66.7%) | 274 (57.9%) |
| $500,000 to $749,999 | 6 (2.7%) | 22 (4.6%) |
| $750,000 to $999,999 | 0 (0.0%) | 0 (0.0%) |
| $1,000,000 or more | 0 (0.0%) | 0 (0.0%) |
| Total | 225 (100.0%) | 473 (100.0%) |
Household Income by Mortgage Status in Byram Center
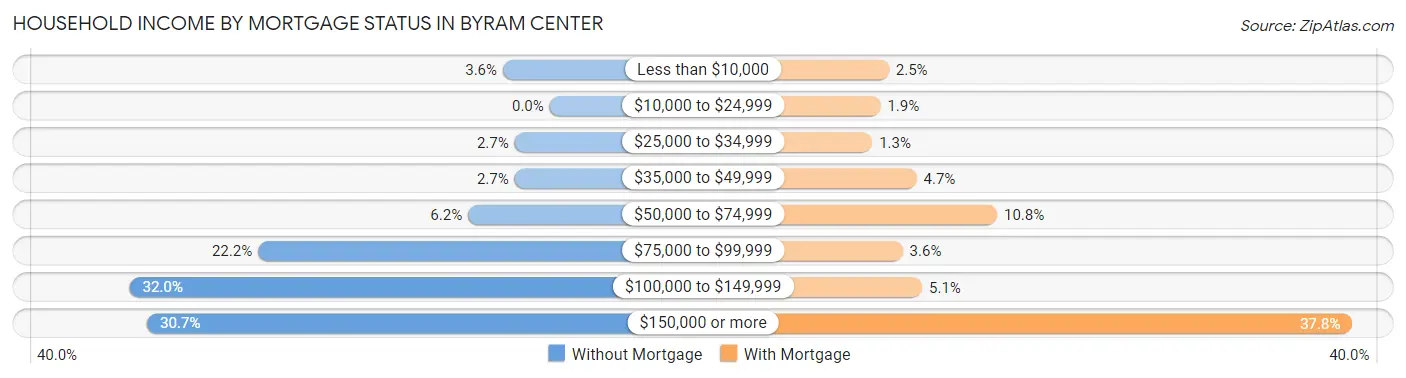
| Household Income | Without Mortgage | With Mortgage |
| Less than $10,000 | 8 (3.6%) | 12 (2.5%) |
| $10,000 to $24,999 | 0 (0.0%) | 9 (1.9%) |
| $25,000 to $34,999 | 6 (2.7%) | 6 (1.3%) |
| $35,000 to $49,999 | 6 (2.7%) | 22 (4.6%) |
| $50,000 to $74,999 | 14 (6.2%) | 51 (10.8%) |
| $75,000 to $99,999 | 50 (22.2%) | 17 (3.6%) |
| $100,000 to $149,999 | 72 (32.0%) | 24 (5.1%) |
| $150,000 or more | 69 (30.7%) | 179 (37.8%) |
| Total | 225 (100.0%) | 473 (100.0%) |
Property Value to Household Income Ratio in Byram Center
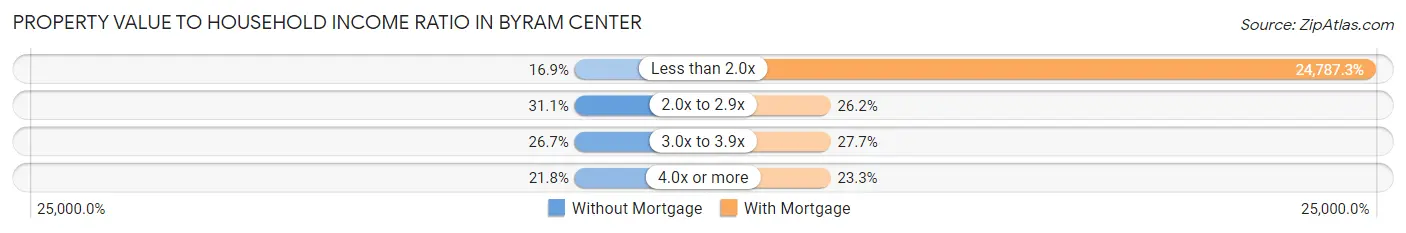
| Value-to-Income Ratio | Without Mortgage | With Mortgage |
| Less than 2.0x | 38 (16.9%) | 117,244 (24,787.3%) |
| 2.0x to 2.9x | 70 (31.1%) | 124 (26.2%) |
| 3.0x to 3.9x | 60 (26.7%) | 131 (27.7%) |
| 4.0x or more | 49 (21.8%) | 110 (23.3%) |
| Total | 225 (100.0%) | 473 (100.0%) |
Real Estate Taxes by Mortgage Status in Byram Center
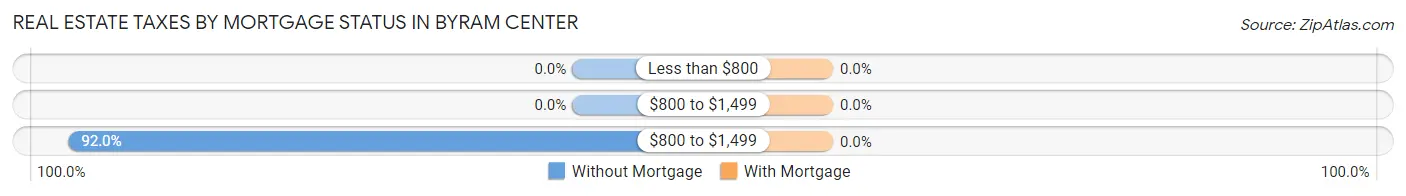
| Property Taxes | Without Mortgage | With Mortgage |
| Less than $800 | 0 (0.0%) | 0 (0.0%) |
| $800 to $1,499 | 0 (0.0%) | 0 (0.0%) |
| $800 to $1,499 | 207 (92.0%) | 0 (0.0%) |
| Total | 225 (100.0%) | 473 (100.0%) |
Health & Disability in Byram Center
Health Insurance Coverage by Age in Byram Center
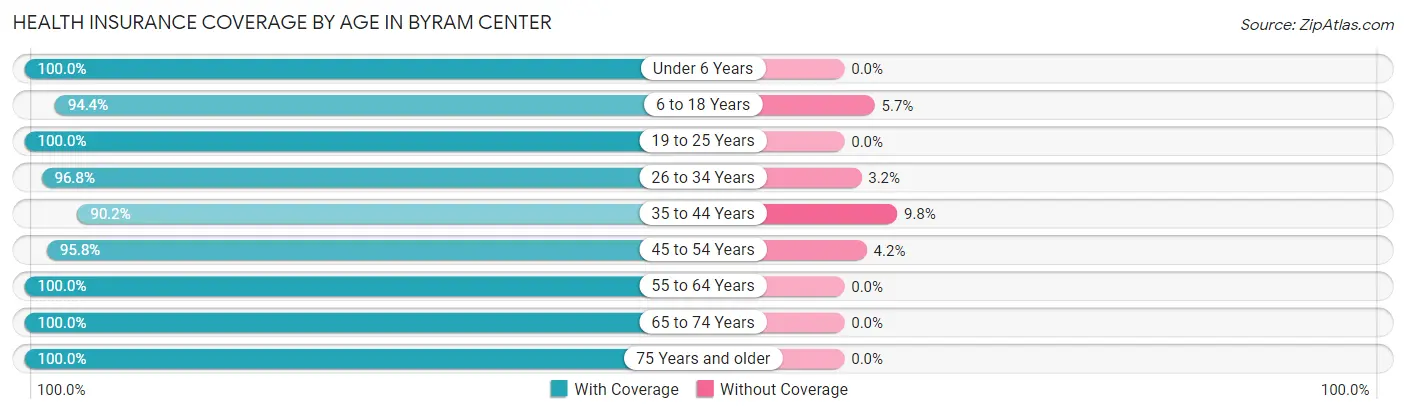
| Age Bracket | With Coverage | Without Coverage |
| Under 6 Years | 96 (100.0%) | 0 (0.0%) |
| 6 to 18 Years | 234 (94.4%) | 14 (5.7%) |
| 19 to 25 Years | 276 (100.0%) | 0 (0.0%) |
| 26 to 34 Years | 214 (96.8%) | 7 (3.2%) |
| 35 to 44 Years | 229 (90.2%) | 25 (9.8%) |
| 45 to 54 Years | 230 (95.8%) | 10 (4.2%) |
| 55 to 64 Years | 349 (100.0%) | 0 (0.0%) |
| 65 to 74 Years | 203 (100.0%) | 0 (0.0%) |
| 75 Years and older | 79 (100.0%) | 0 (0.0%) |
| Total | 1,910 (97.2%) | 56 (2.9%) |
Health Insurance Coverage by Citizenship Status in Byram Center
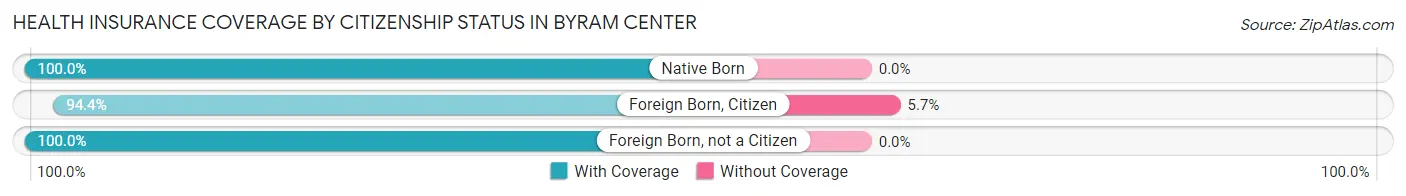
| Citizenship Status | With Coverage | Without Coverage |
| Native Born | 96 (100.0%) | 0 (0.0%) |
| Foreign Born, Citizen | 234 (94.4%) | 14 (5.7%) |
| Foreign Born, not a Citizen | 276 (100.0%) | 0 (0.0%) |
Health Insurance Coverage by Household Income in Byram Center
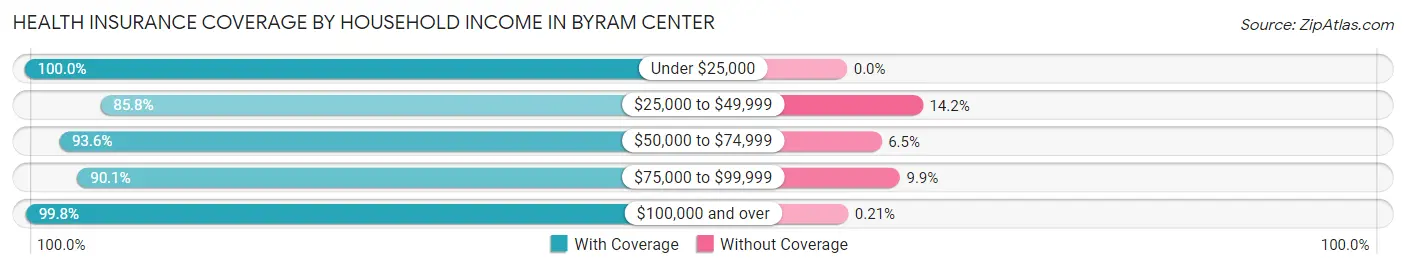
| Household Income | With Coverage | Without Coverage |
| Under $25,000 | 35 (100.0%) | 0 (0.0%) |
| $25,000 to $49,999 | 121 (85.8%) | 20 (14.2%) |
| $50,000 to $74,999 | 116 (93.5%) | 8 (6.5%) |
| $75,000 to $99,999 | 228 (90.1%) | 25 (9.9%) |
| $100,000 and over | 1,410 (99.8%) | 3 (0.2%) |
Public vs Private Health Insurance Coverage by Age in Byram Center
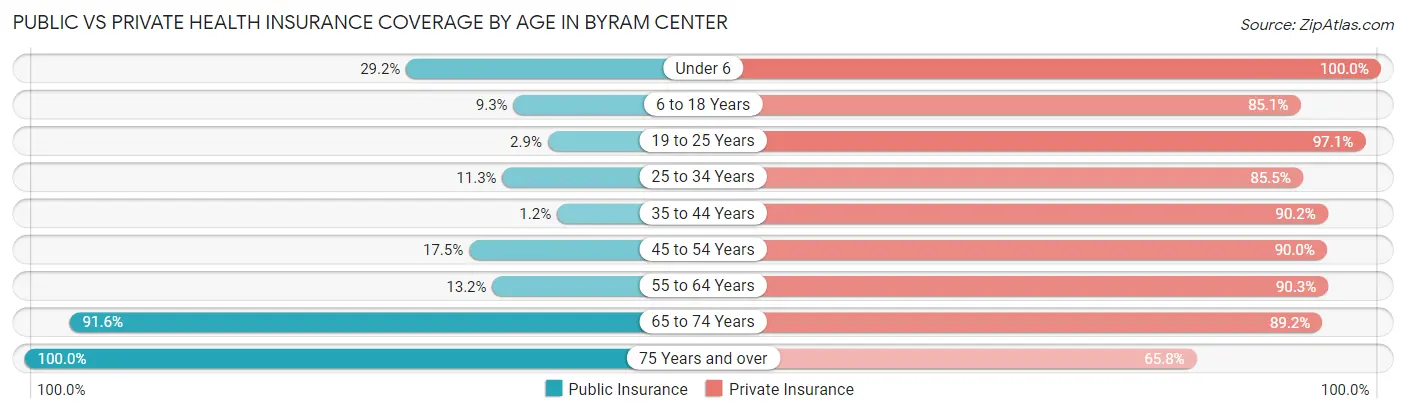
| Age Bracket | Public Insurance | Private Insurance |
| Under 6 | 28 (29.2%) | 96 (100.0%) |
| 6 to 18 Years | 23 (9.3%) | 211 (85.1%) |
| 19 to 25 Years | 8 (2.9%) | 268 (97.1%) |
| 25 to 34 Years | 25 (11.3%) | 189 (85.5%) |
| 35 to 44 Years | 3 (1.2%) | 229 (90.2%) |
| 45 to 54 Years | 42 (17.5%) | 216 (90.0%) |
| 55 to 64 Years | 46 (13.2%) | 315 (90.3%) |
| 65 to 74 Years | 186 (91.6%) | 181 (89.2%) |
| 75 Years and over | 79 (100.0%) | 52 (65.8%) |
| Total | 440 (22.4%) | 1,757 (89.4%) |
Disability Status by Sex by Age in Byram Center
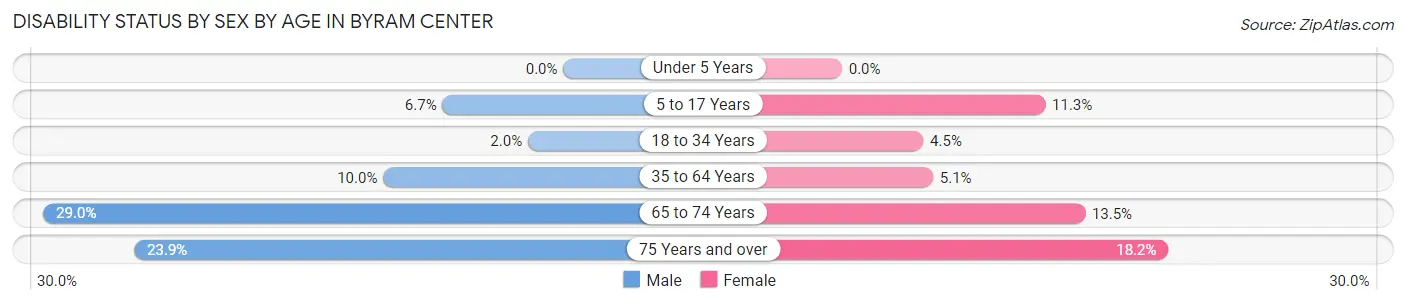
| Age Bracket | Male | Female |
| Under 5 Years | 0 (0.0%) | 0 (0.0%) |
| 5 to 17 Years | 7 (6.7%) | 12 (11.3%) |
| 18 to 34 Years | 5 (2.0%) | 13 (4.5%) |
| 35 to 64 Years | 39 (10.0%) | 23 (5.1%) |
| 65 to 74 Years | 31 (29.0%) | 13 (13.5%) |
| 75 Years and over | 11 (23.9%) | 6 (18.2%) |
Disability Class by Sex by Age in Byram Center
Disability Class: Hearing Difficulty
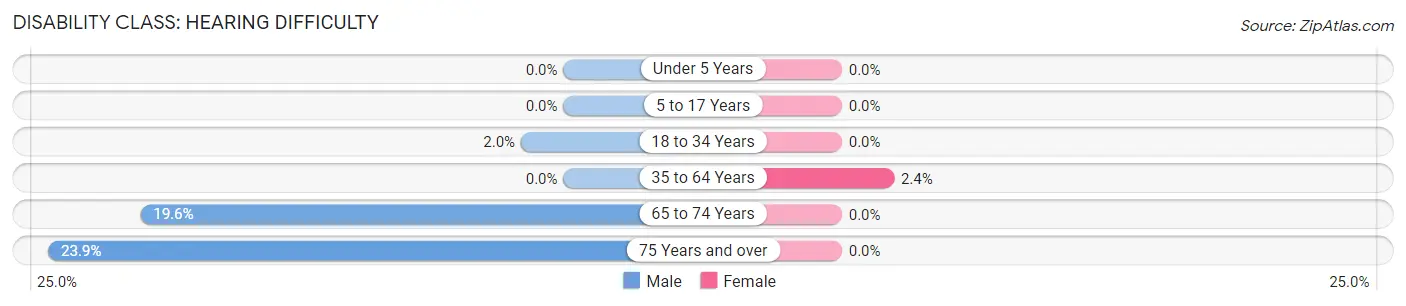
| Age Bracket | Male | Female |
| Under 5 Years | 0 (0.0%) | 0 (0.0%) |
| 5 to 17 Years | 0 (0.0%) | 0 (0.0%) |
| 18 to 34 Years | 5 (2.0%) | 0 (0.0%) |
| 35 to 64 Years | 0 (0.0%) | 11 (2.4%) |
| 65 to 74 Years | 21 (19.6%) | 0 (0.0%) |
| 75 Years and over | 11 (23.9%) | 0 (0.0%) |
Disability Class: Vision Difficulty
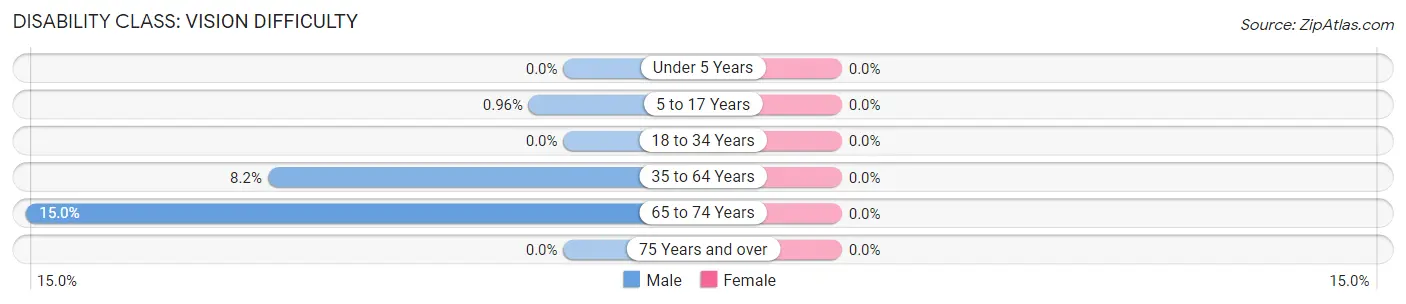
| Age Bracket | Male | Female |
| Under 5 Years | 0 (0.0%) | 0 (0.0%) |
| 5 to 17 Years | 1 (1.0%) | 0 (0.0%) |
| 18 to 34 Years | 0 (0.0%) | 0 (0.0%) |
| 35 to 64 Years | 32 (8.2%) | 0 (0.0%) |
| 65 to 74 Years | 16 (14.9%) | 0 (0.0%) |
| 75 Years and over | 0 (0.0%) | 0 (0.0%) |
Disability Class: Cognitive Difficulty
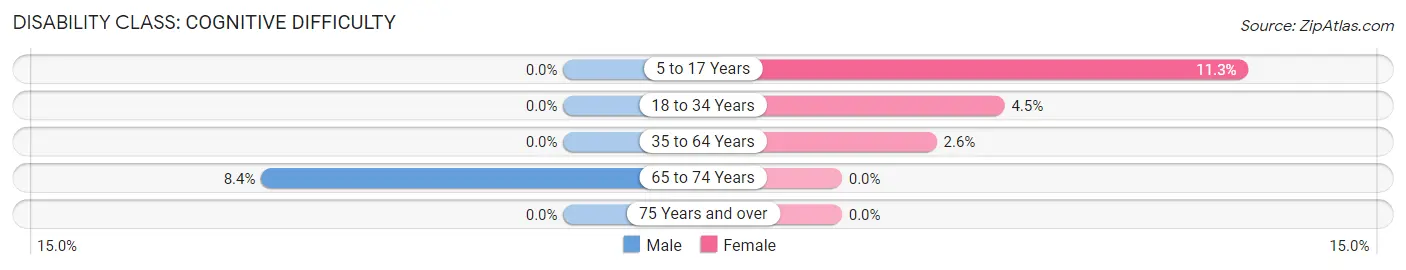
| Age Bracket | Male | Female |
| 5 to 17 Years | 0 (0.0%) | 12 (11.3%) |
| 18 to 34 Years | 0 (0.0%) | 13 (4.5%) |
| 35 to 64 Years | 0 (0.0%) | 12 (2.6%) |
| 65 to 74 Years | 9 (8.4%) | 0 (0.0%) |
| 75 Years and over | 0 (0.0%) | 0 (0.0%) |
Disability Class: Ambulatory Difficulty
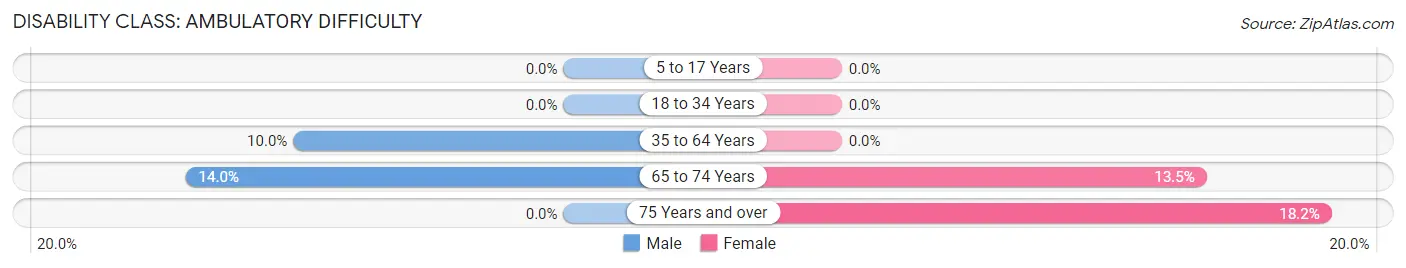
| Age Bracket | Male | Female |
| 5 to 17 Years | 0 (0.0%) | 0 (0.0%) |
| 18 to 34 Years | 0 (0.0%) | 0 (0.0%) |
| 35 to 64 Years | 39 (10.0%) | 0 (0.0%) |
| 65 to 74 Years | 15 (14.0%) | 13 (13.5%) |
| 75 Years and over | 0 (0.0%) | 6 (18.2%) |
Disability Class: Self-Care Difficulty
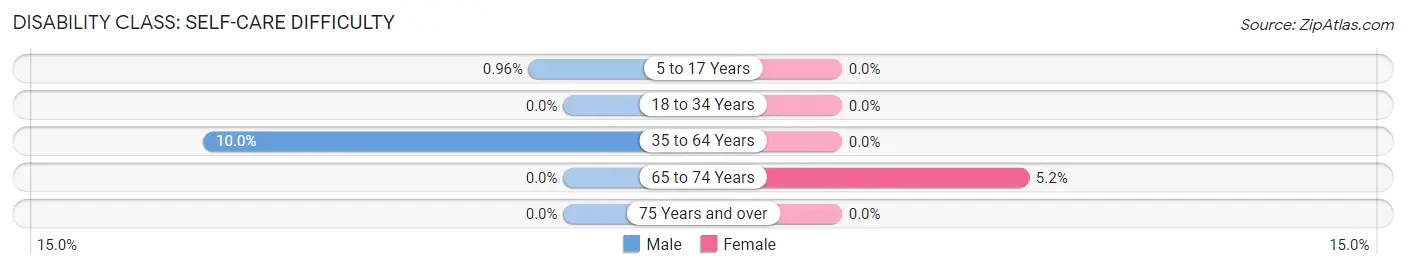
| Age Bracket | Male | Female |
| 5 to 17 Years | 1 (1.0%) | 0 (0.0%) |
| 18 to 34 Years | 0 (0.0%) | 0 (0.0%) |
| 35 to 64 Years | 39 (10.0%) | 0 (0.0%) |
| 65 to 74 Years | 0 (0.0%) | 5 (5.2%) |
| 75 Years and over | 0 (0.0%) | 0 (0.0%) |
Technology Access in Byram Center
Computing Device Access in Byram Center
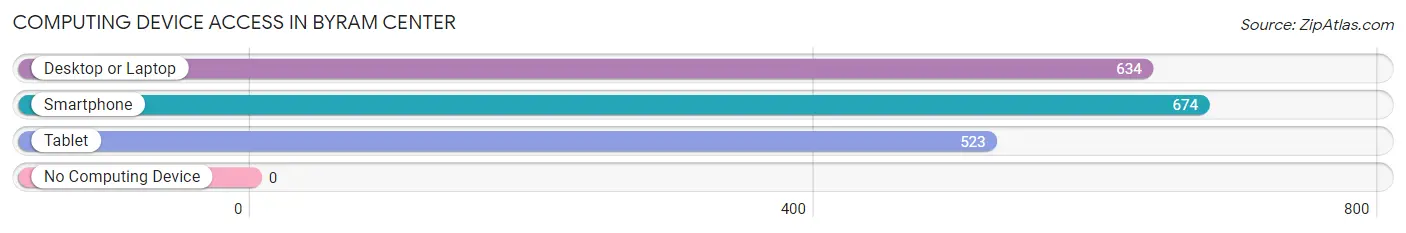
| Device Type | # Households | % Households |
| Desktop or Laptop | 634 | 88.9% |
| Smartphone | 674 | 94.5% |
| Tablet | 523 | 73.4% |
| No Computing Device | 0 | 0.0% |
| Total | 713 | 100.0% |
Internet Access in Byram Center
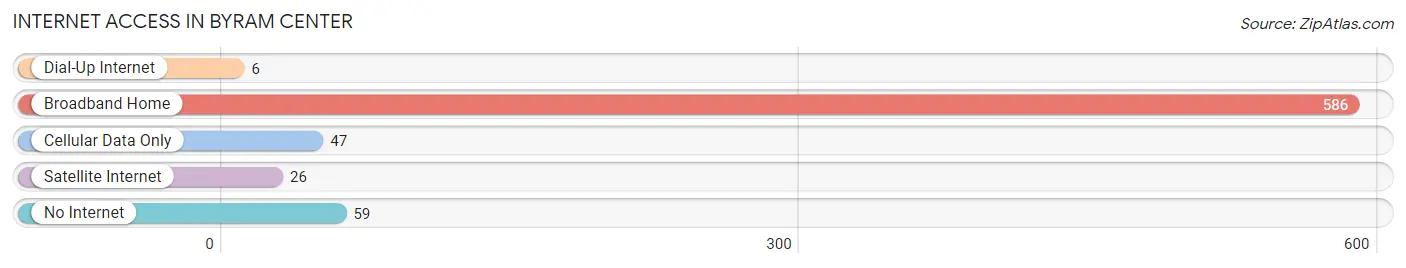
| Internet Type | # Households | % Households |
| Dial-Up Internet | 6 | 0.8% |
| Broadband Home | 586 | 82.2% |
| Cellular Data Only | 47 | 6.6% |
| Satellite Internet | 26 | 3.6% |
| No Internet | 59 | 8.3% |
| Total | 713 | 100.0% |
Byram Center Summary
Byram Center is a small unincorporated community located in Sussex County, New Jersey. It is situated in the northwest corner of the county, near the border with New York State. The community is located in the Kittatinny Valley, a region of the Appalachian Mountains. Byram Center is part of the Greater New York City metropolitan area and is located approximately 50 miles northwest of Manhattan.
History
Byram Center was first settled in the late 1700s by Dutch and German immigrants. The area was originally known as “Byram’s Corners” and was named after the Byram family, who were among the first settlers. The Byram family owned a large tract of land in the area and operated a sawmill and gristmill.
In the early 1800s, the area was home to a number of small farms and businesses. The community was also home to a number of churches, including the Byram Presbyterian Church, which was founded in 1820.
In the late 1800s, the area began to experience a period of growth and development. The Byram Center Post Office was established in 1887 and the Byram Center School was built in 1895. The community was also home to a number of small businesses, including a general store, a blacksmith shop, and a sawmill.
Geography
Byram Center is located in the Kittatinny Valley region of the Appalachian Mountains. The community is situated in the northwest corner of Sussex County, near the border with New York State. The area is characterized by rolling hills and valleys, with the highest point in the area being the summit of Kittatinny Mountain, which is located approximately two miles south of Byram Center.
The community is located approximately 50 miles northwest of Manhattan and is part of the Greater New York City metropolitan area. The nearest major cities are Newark, New Jersey, which is located approximately 40 miles to the south, and Scranton, Pennsylvania, which is located approximately 50 miles to the north.
Economy
Byram Center is a small, rural community with a population of approximately 1,000 people. The area is primarily agricultural, with the majority of the population employed in farming and related activities. The community is also home to a number of small businesses, including a general store, a blacksmith shop, and a sawmill.
Demographics
As of the 2010 census, the population of Byram Center was 1,039. The racial makeup of the community was 97.2% White, 0.9% African American, 0.3% Native American, 0.3% Asian, and 1.3% from other races. The median household income was $50,938, and the median family income was $60,000. The per capita income was $25,938.
Conclusion
Byram Center is a small, rural community located in the Kittatinny Valley region of the Appalachian Mountains. The area was first settled in the late 1700s by Dutch and German immigrants and has since grown to become a small agricultural community with a population of approximately 1,000 people. The community is part of the Greater New York City metropolitan area and is located approximately 50 miles northwest of Manhattan. The area is primarily agricultural, with the majority of the population employed in farming and related activities. The community is also home to a number of small businesses, including a general store, a blacksmith shop, and a sawmill.
Common Questions
What is Per Capita Income in Byram Center?
Per Capita income in Byram Center is $49,352.
What is the Median Family Income in Byram Center?
Median Family Income in Byram Center is $124,375.
What is the Median Household income in Byram Center?
Median Household Income in Byram Center is $116,862.
What is Income or Wage Gap in Byram Center?
Income or Wage Gap in Byram Center is 21.8%.
Women in Byram Center earn 78.2 cents for every dollar earned by a man.
What is Inequality or Gini Index in Byram Center?
Inequality or Gini Index in Byram Center is 0.32.
What is the Total Population of Byram Center?
Total Population of Byram Center is 1,969.
What is the Total Male Population of Byram Center?
Total Male Population of Byram Center is 955.
What is the Total Female Population of Byram Center?
Total Female Population of Byram Center is 1,014.
What is the Ratio of Males per 100 Females in Byram Center?
There are 94.18 Males per 100 Females in Byram Center.
What is the Ratio of Females per 100 Males in Byram Center?
There are 106.18 Females per 100 Males in Byram Center.
What is the Median Population Age in Byram Center?
Median Population Age in Byram Center is 40.9 Years.
What is the Average Family Size in Byram Center
Average Family Size in Byram Center is 2.9 People.
What is the Average Household Size in Byram Center
Average Household Size in Byram Center is 2.8 People.
How Large is the Labor Force in Byram Center?
There are 1,356 People in the Labor Forcein in Byram Center.
What is the Percentage of People in the Labor Force in Byram Center?
79.7% of People are in the Labor Force in Byram Center.
What is the Unemployment Rate in Byram Center?
Unemployment Rate in Byram Center is 5.3%.