Silver Lake CDP Warren County, NJ Map & Demographics
Silver Lake CDP Warren County Overview
$48,937
PER CAPITA INCOME
$115,313
AVG FAMILY INCOME
$88,295
AVG HOUSEHOLD INCOME
25.7%
WAGE / INCOME GAP [ % ]
74.3¢/ $1
WAGE / INCOME GAP [ $ ]
0.44
INEQUALITY / GINI INDEX
324
TOTAL POPULATION
166
MALE POPULATION
158
FEMALE POPULATION
105.06
MALES / 100 FEMALES
95.18
FEMALES / 100 MALES
55.5
MEDIAN AGE
2.5
AVG FAMILY SIZE
2.0
AVG HOUSEHOLD SIZE
179
LABOR FORCE [ PEOPLE ]
64.4%
PERCENT IN LABOR FORCE
7.8%
UNEMPLOYMENT RATE
Income in Silver Lake CDP Warren County
Income Overview in Silver Lake CDP Warren County
Per Capita Income in Silver Lake CDP Warren County is $48,937, while median incomes of families and households are $115,313 and $88,295 respectively.
| Characteristic | Number | Measure |
| Per Capita Income | 324 | $48,937 |
| Median Family Income | 95 | $115,313 |
| Mean Family Income | 95 | $129,414 |
| Median Household Income | 163 | $88,295 |
| Mean Household Income | 163 | $91,534 |
| Income Deficit | 95 | $0 |
| Wage / Income Gap (%) | 324 | 25.68% |
| Wage / Income Gap ($) | 324 | 74.32¢ per $1 |
| Gini / Inequality Index | 324 | 0.44 |
Earnings by Sex in Silver Lake CDP Warren County
Average Earnings in Silver Lake CDP Warren County are $49,625, $64,583 for men and $48,000 for women, a difference of 25.7%.
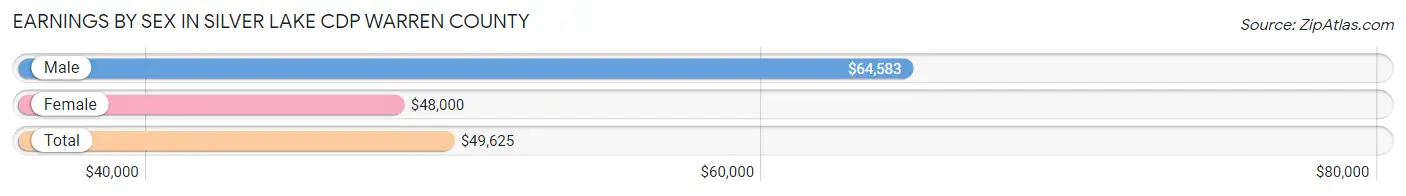
| Sex | Number | Average Earnings |
| Male | 99 (59.3%) | $64,583 |
| Female | 68 (40.7%) | $48,000 |
| Total | 167 (100.0%) | $49,625 |
Earnings by Sex by Income Bracket in Silver Lake CDP Warren County
The most common earnings brackets in Silver Lake CDP Warren County are $100,000+ for men (26 | 26.3%) and $45,000 to $49,999 for women (29 | 42.6%).
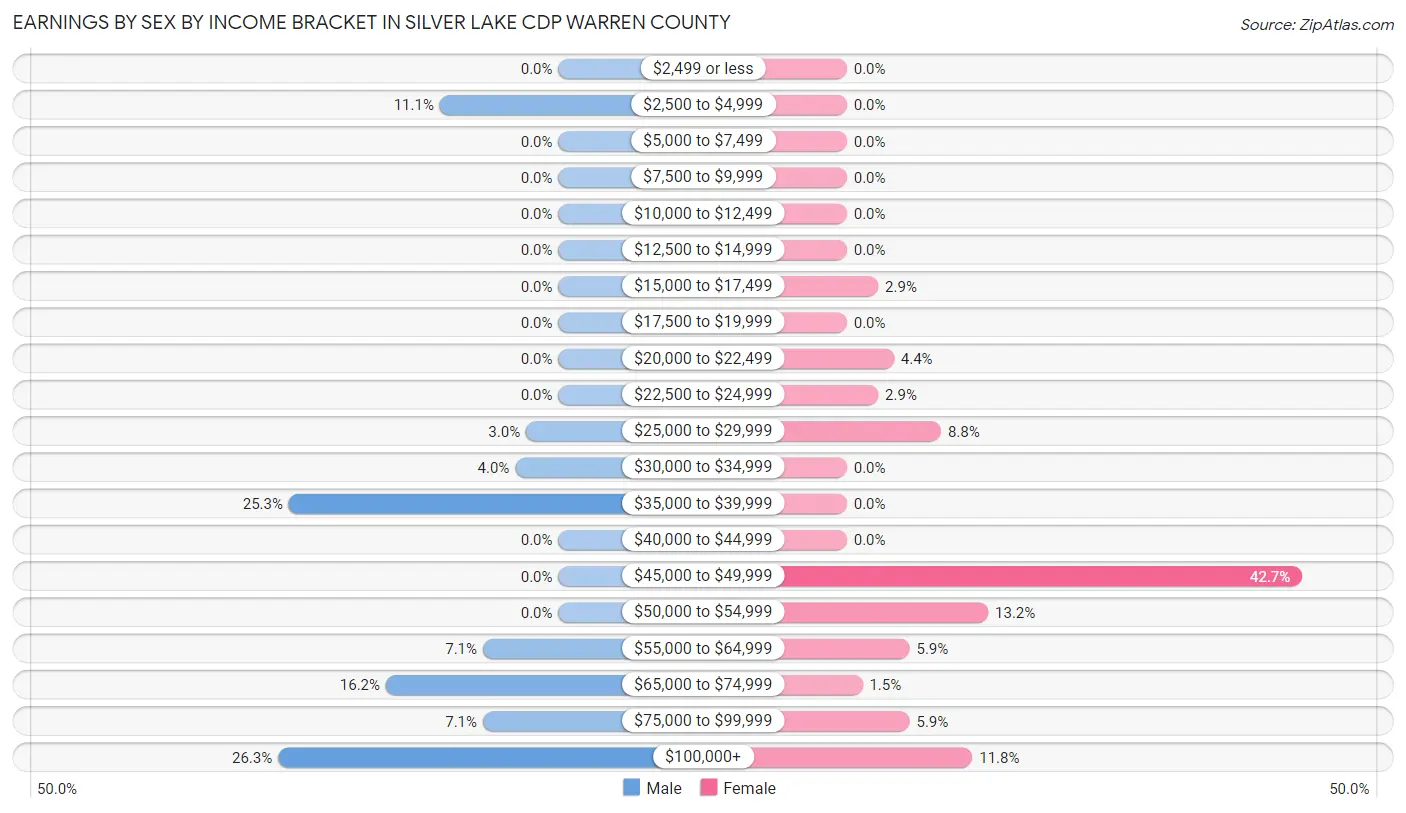
| Income | Male | Female |
| $2,499 or less | 0 (0.0%) | 0 (0.0%) |
| $2,500 to $4,999 | 11 (11.1%) | 0 (0.0%) |
| $5,000 to $7,499 | 0 (0.0%) | 0 (0.0%) |
| $7,500 to $9,999 | 0 (0.0%) | 0 (0.0%) |
| $10,000 to $12,499 | 0 (0.0%) | 0 (0.0%) |
| $12,500 to $14,999 | 0 (0.0%) | 0 (0.0%) |
| $15,000 to $17,499 | 0 (0.0%) | 2 (2.9%) |
| $17,500 to $19,999 | 0 (0.0%) | 0 (0.0%) |
| $20,000 to $22,499 | 0 (0.0%) | 3 (4.4%) |
| $22,500 to $24,999 | 0 (0.0%) | 2 (2.9%) |
| $25,000 to $29,999 | 3 (3.0%) | 6 (8.8%) |
| $30,000 to $34,999 | 4 (4.0%) | 0 (0.0%) |
| $35,000 to $39,999 | 25 (25.3%) | 0 (0.0%) |
| $40,000 to $44,999 | 0 (0.0%) | 0 (0.0%) |
| $45,000 to $49,999 | 0 (0.0%) | 29 (42.6%) |
| $50,000 to $54,999 | 0 (0.0%) | 9 (13.2%) |
| $55,000 to $64,999 | 7 (7.1%) | 4 (5.9%) |
| $65,000 to $74,999 | 16 (16.2%) | 1 (1.5%) |
| $75,000 to $99,999 | 7 (7.1%) | 4 (5.9%) |
| $100,000+ | 26 (26.3%) | 8 (11.8%) |
| Total | 99 (100.0%) | 68 (100.0%) |
Earnings by Sex by Educational Attainment in Silver Lake CDP Warren County
Average earnings in Silver Lake CDP Warren County are $69,643 for men and $48,000 for women, a difference of 31.1%. Men with an educational attainment of high school diploma enjoy the highest average annual earnings of $116,146, while those with college or associate's degree education earn the least with $56,250. Women with an educational attainment of bachelor's degree earn the most with the average annual earnings of $46,382, while those with bachelor's degree education have the smallest earnings of $46,382.
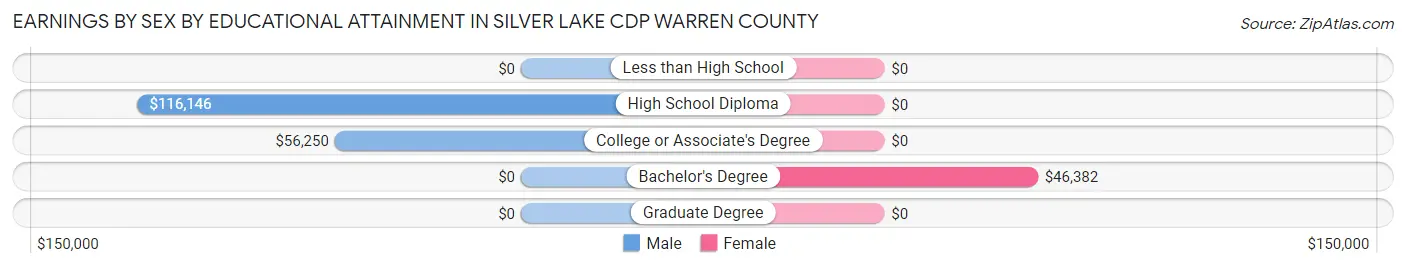
| Educational Attainment | Male Income | Female Income |
| Less than High School | - | - |
| High School Diploma | $116,146 | $0 |
| College or Associate's Degree | $56,250 | $0 |
| Bachelor's Degree | - | - |
| Graduate Degree | - | - |
| Total | $69,643 | $48,000 |
Family Income in Silver Lake CDP Warren County
Family Income Brackets in Silver Lake CDP Warren County
According to the Silver Lake CDP Warren County family income data, there are 49 families falling into the $100,000 to $149,999 income range, which is the most common income bracket and makes up 51.6% of all families.
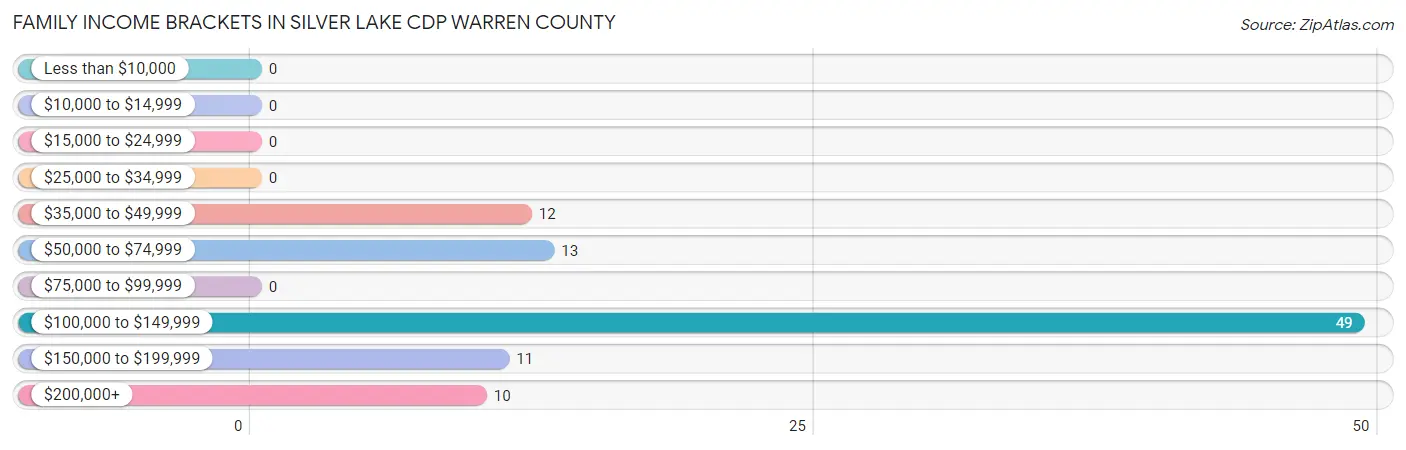
| Income Bracket | # Families | % Families |
| Less than $10,000 | 0 | 0.0% |
| $10,000 to $14,999 | 0 | 0.0% |
| $15,000 to $24,999 | 0 | 0.0% |
| $25,000 to $34,999 | 0 | 0.0% |
| $35,000 to $49,999 | 12 | 12.6% |
| $50,000 to $74,999 | 13 | 13.7% |
| $75,000 to $99,999 | 0 | 0.0% |
| $100,000 to $149,999 | 49 | 51.6% |
| $150,000 to $199,999 | 11 | 11.6% |
| $200,000+ | 10 | 10.5% |
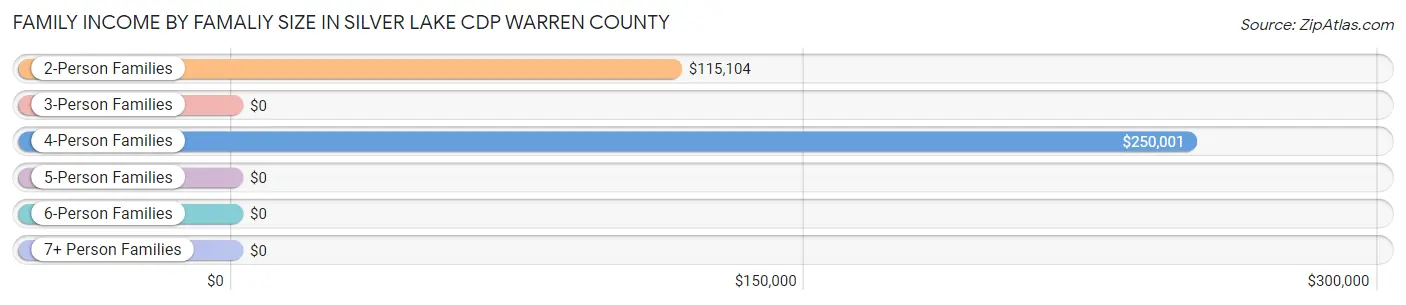
Family Income by Famaliy Size in Silver Lake CDP Warren County
4-person families (6 | 6.3%) account for the highest median family income in Silver Lake CDP Warren County with $250,001 per family, while 4-person families (6 | 6.3%) have the highest median income of $62,500 per family member.
| Income Bracket | # Families | Median Income |
| 2-Person Families | 73 (76.8%) | $115,104 |
| 3-Person Families | 16 (16.8%) | $0 |
| 4-Person Families | 6 (6.3%) | $250,001 |
| 5-Person Families | 0 (0.0%) | $0 |
| 6-Person Families | 0 (0.0%) | $0 |
| 7+ Person Families | 0 (0.0%) | $0 |
| Total | 95 (100.0%) | $115,313 |
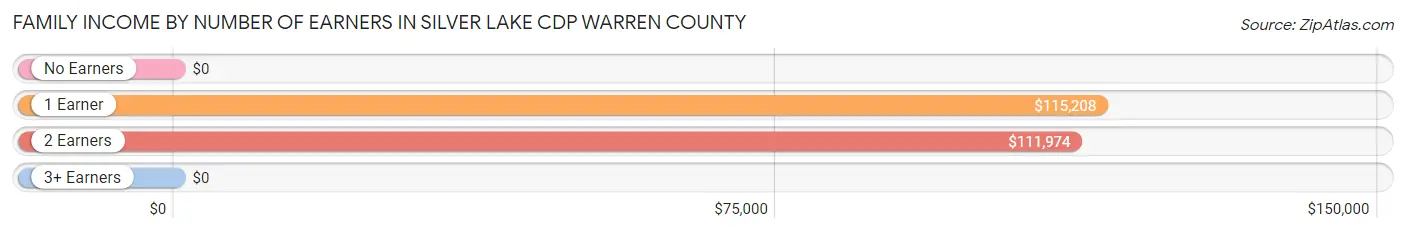
Family Income by Number of Earners in Silver Lake CDP Warren County
| Number of Earners | # Families | Median Income |
| No Earners | 7 (7.4%) | $0 |
| 1 Earner | 52 (54.7%) | $115,208 |
| 2 Earners | 34 (35.8%) | $111,974 |
| 3+ Earners | 2 (2.1%) | $0 |
| Total | 95 (100.0%) | $115,313 |
Household Income in Silver Lake CDP Warren County
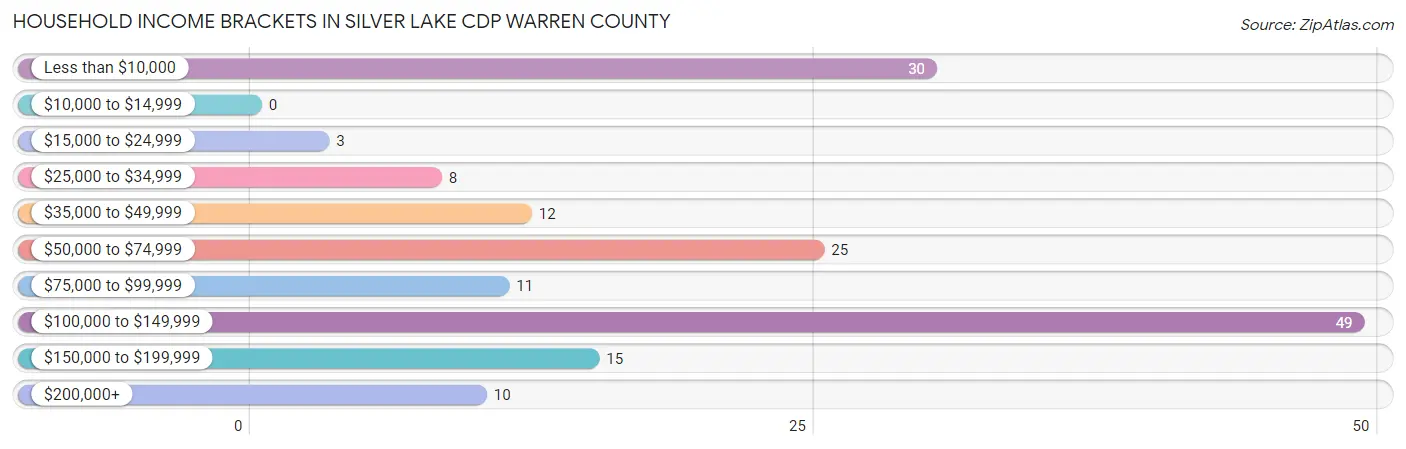
Household Income Brackets in Silver Lake CDP Warren County
With 49 households falling in the category, the $100,000 to $149,999 income range is the most frequent in Silver Lake CDP Warren County, accounting for 30.1% of all households.
| Income Bracket | # Households | % Households |
| Less than $10,000 | 30 | 18.4% |
| $10,000 to $14,999 | 0 | 0.0% |
| $15,000 to $24,999 | 3 | 1.8% |
| $25,000 to $34,999 | 8 | 4.9% |
| $35,000 to $49,999 | 12 | 7.4% |
| $50,000 to $74,999 | 25 | 15.3% |
| $75,000 to $99,999 | 11 | 6.7% |
| $100,000 to $149,999 | 49 | 30.1% |
| $150,000 to $199,999 | 15 | 9.2% |
| $200,000+ | 10 | 6.1% |
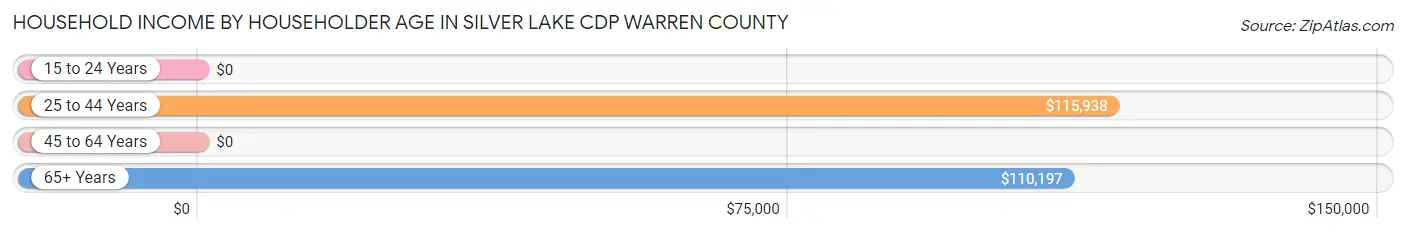
Household Income by Householder Age in Silver Lake CDP Warren County
The median household income in Silver Lake CDP Warren County is $88,295, with the highest median household income of $115,938 found in the 25 to 44 years age bracket for the primary householder. A total of 33 households (20.3%) fall into this category.
| Income Bracket | # Households | Median Income |
| 15 to 24 Years | 0 (0.0%) | $0 |
| 25 to 44 Years | 33 (20.3%) | $115,938 |
| 45 to 64 Years | 61 (37.4%) | $0 |
| 65+ Years | 69 (42.3%) | $110,197 |
| Total | 163 (100.0%) | $88,295 |
Poverty in Silver Lake CDP Warren County
Income Below Poverty by Sex and Age in Silver Lake CDP Warren County
With 7.2% poverty level for males and 19.0% for females among the residents of Silver Lake CDP Warren County, 35 to 44 year old males and 55 to 64 year old females are the most vulnerable to poverty, with 12 males (57.1%) and 30 females (73.2%) in their respective age groups living below the poverty level.
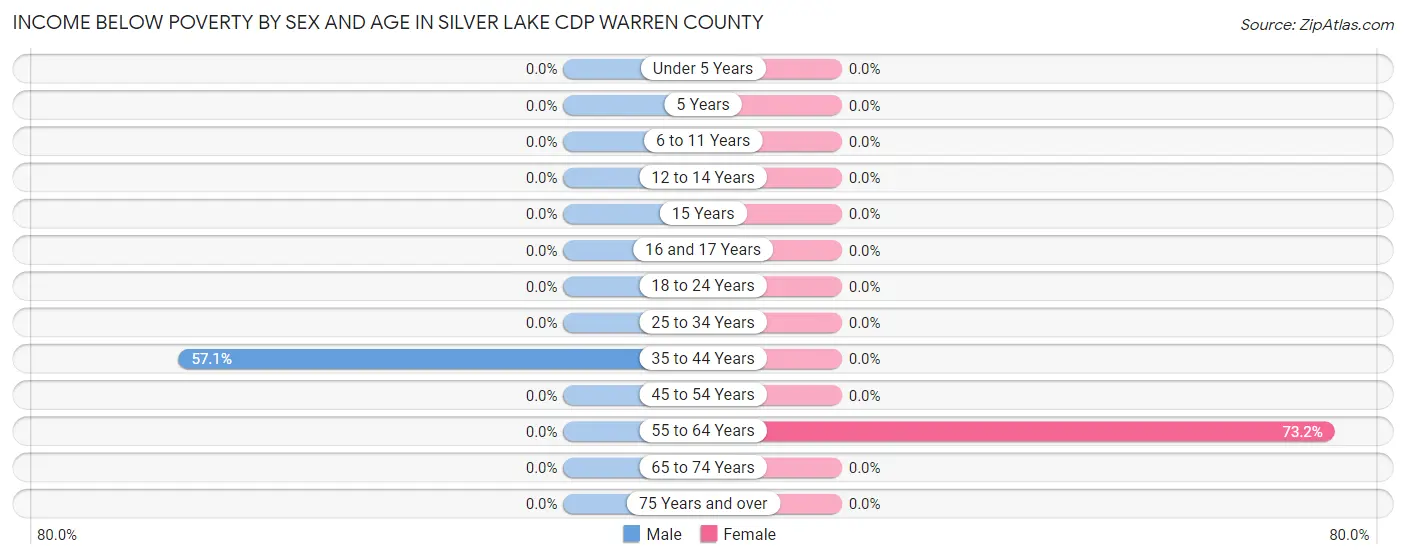
| Age Bracket | Male | Female |
| Under 5 Years | 0 (0.0%) | 0 (0.0%) |
| 5 Years | 0 (0.0%) | 0 (0.0%) |
| 6 to 11 Years | 0 (0.0%) | 0 (0.0%) |
| 12 to 14 Years | 0 (0.0%) | 0 (0.0%) |
| 15 Years | 0 (0.0%) | 0 (0.0%) |
| 16 and 17 Years | 0 (0.0%) | 0 (0.0%) |
| 18 to 24 Years | 0 (0.0%) | 0 (0.0%) |
| 25 to 34 Years | 0 (0.0%) | 0 (0.0%) |
| 35 to 44 Years | 12 (57.1%) | 0 (0.0%) |
| 45 to 54 Years | 0 (0.0%) | 0 (0.0%) |
| 55 to 64 Years | 0 (0.0%) | 30 (73.2%) |
| 65 to 74 Years | 0 (0.0%) | 0 (0.0%) |
| 75 Years and over | 0 (0.0%) | 0 (0.0%) |
| Total | 12 (7.2%) | 30 (19.0%) |
Income Above Poverty by Sex and Age in Silver Lake CDP Warren County
According to the poverty statistics in Silver Lake CDP Warren County, males aged under 5 years and females aged 6 to 11 years are the age groups that are most secure financially, with 100.0% of males and 100.0% of females in these age groups living above the poverty line.
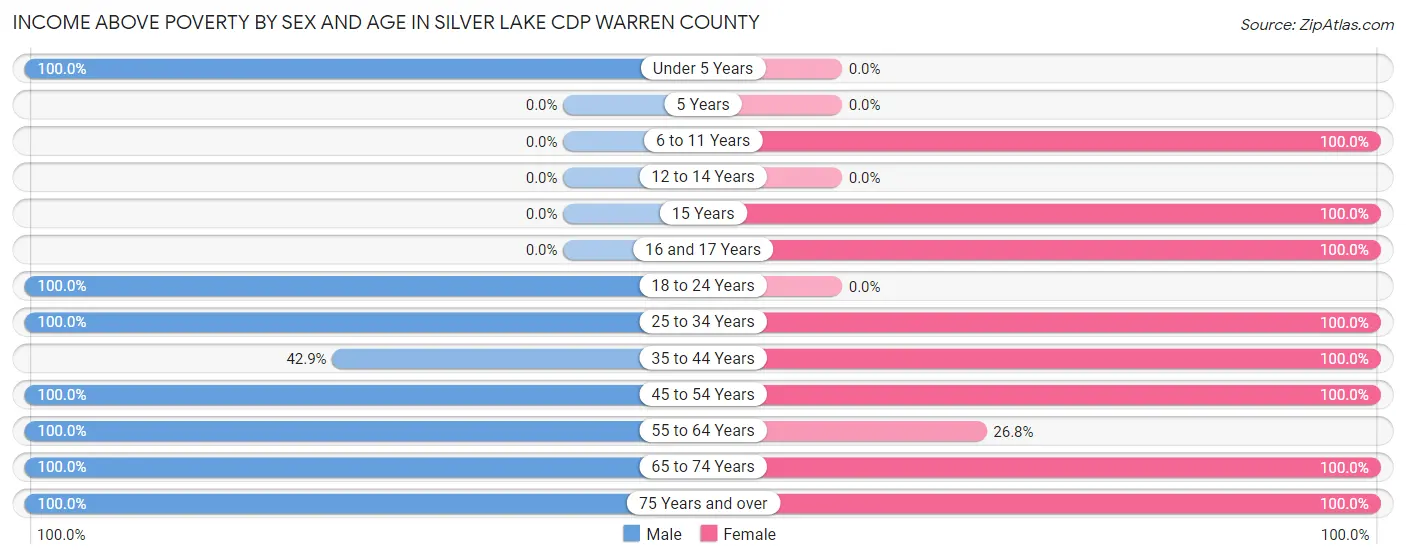
| Age Bracket | Male | Female |
| Under 5 Years | 19 (100.0%) | 0 (0.0%) |
| 5 Years | 0 (0.0%) | 0 (0.0%) |
| 6 to 11 Years | 0 (0.0%) | 12 (100.0%) |
| 12 to 14 Years | 0 (0.0%) | 0 (0.0%) |
| 15 Years | 0 (0.0%) | 15 (100.0%) |
| 16 and 17 Years | 0 (0.0%) | 4 (100.0%) |
| 18 to 24 Years | 13 (100.0%) | 0 (0.0%) |
| 25 to 34 Years | 31 (100.0%) | 6 (100.0%) |
| 35 to 44 Years | 9 (42.9%) | 15 (100.0%) |
| 45 to 54 Years | 7 (100.0%) | 17 (100.0%) |
| 55 to 64 Years | 15 (100.0%) | 11 (26.8%) |
| 65 to 74 Years | 51 (100.0%) | 45 (100.0%) |
| 75 Years and over | 9 (100.0%) | 3 (100.0%) |
| Total | 154 (92.8%) | 128 (81.0%) |
Income Below Poverty Among Married-Couple Families in Silver Lake CDP Warren County
| Children | Above Poverty | Below Poverty |
| No Children | 47 (100.0%) | 0 (0.0%) |
| 1 or 2 Children | 7 (100.0%) | 0 (0.0%) |
| 3 or 4 Children | 0 (0.0%) | 0 (0.0%) |
| 5 or more Children | 0 (0.0%) | 0 (0.0%) |
| Total | 54 (100.0%) | 0 (0.0%) |
Income Below Poverty Among Single-Parent Households in Silver Lake CDP Warren County
| Children | Single Father | Single Mother |
| No Children | 0 (0.0%) | 0 (0.0%) |
| 1 or 2 Children | 0 (0.0%) | 0 (0.0%) |
| 3 or 4 Children | 0 (0.0%) | 0 (0.0%) |
| 5 or more Children | 0 (0.0%) | 0 (0.0%) |
| Total | 0 (0.0%) | 0 (0.0%) |
Income Below Poverty Among Married-Couple vs Single-Parent Households in Silver Lake CDP Warren County
| Children | Married-Couple Families | Single-Parent Households |
| No Children | 0 (0.0%) | 0 (0.0%) |
| 1 or 2 Children | 0 (0.0%) | 0 (0.0%) |
| 3 or 4 Children | 0 (0.0%) | 0 (0.0%) |
| 5 or more Children | 0 (0.0%) | 0 (0.0%) |
| Total | 0 (0.0%) | 0 (0.0%) |
Race in Silver Lake CDP Warren County
The most populous races in Silver Lake CDP Warren County are White / Caucasian (309 | 95.4%), Asian (11 | 3.4%), and Two or more Races (4 | 1.2%).
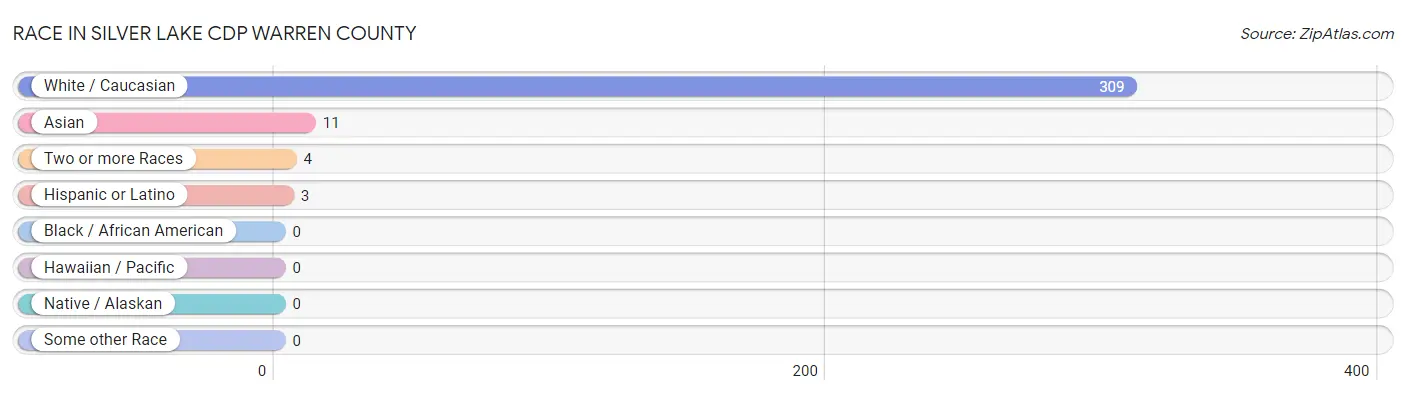
| Race | # Population | % Population |
| Asian | 11 | 3.4% |
| Black / African American | 0 | 0.0% |
| Hawaiian / Pacific | 0 | 0.0% |
| Hispanic or Latino | 3 | 0.9% |
| Native / Alaskan | 0 | 0.0% |
| White / Caucasian | 309 | 95.4% |
| Two or more Races | 4 | 1.2% |
| Some other Race | 0 | 0.0% |
| Total | 324 | 100.0% |
Ancestry in Silver Lake CDP Warren County
The most populous ancestries reported in Silver Lake CDP Warren County are German (112 | 34.6%), Irish (99 | 30.6%), European (41 | 12.7%), Italian (34 | 10.5%), and Polish (29 | 8.9%), together accounting for 97.2% of all Silver Lake CDP Warren County residents.
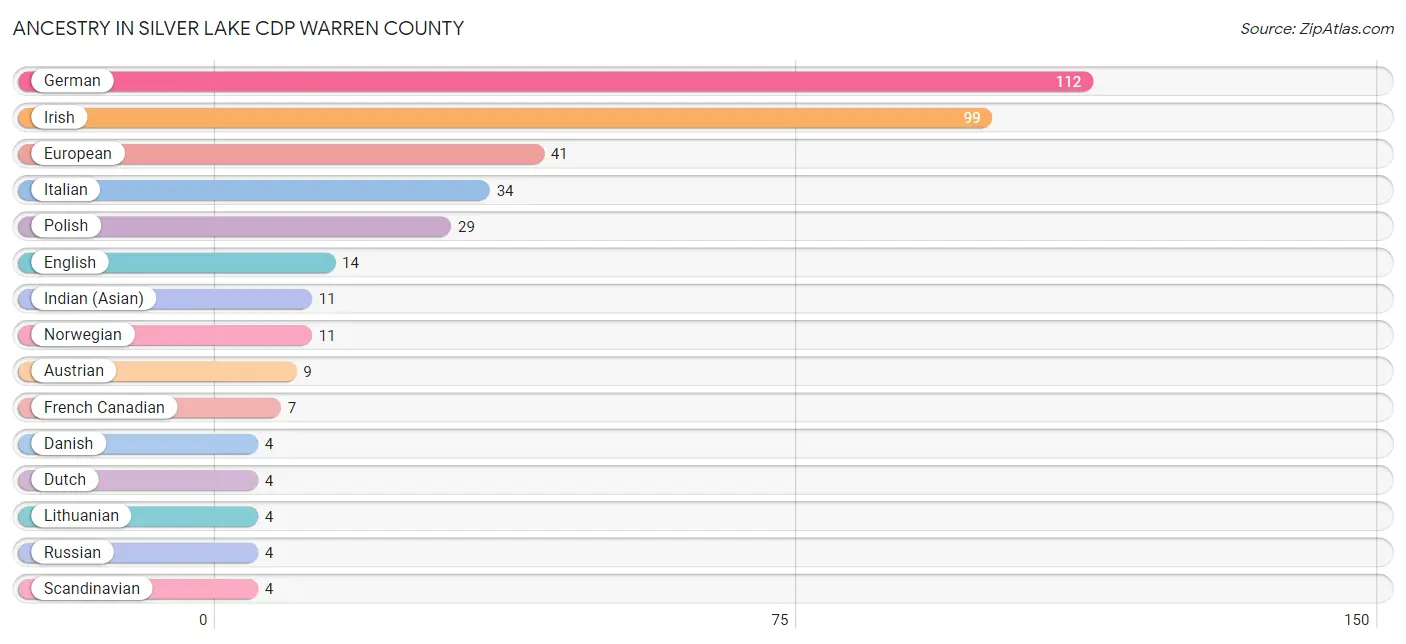
| Ancestry | # Population | % Population |
| American | 2 | 0.6% |
| Austrian | 9 | 2.8% |
| Central American | 3 | 0.9% |
| Costa Rican | 3 | 0.9% |
| Czechoslovakian | 2 | 0.6% |
| Danish | 4 | 1.2% |
| Dutch | 4 | 1.2% |
| Eastern European | 3 | 0.9% |
| English | 14 | 4.3% |
| European | 41 | 12.7% |
| French Canadian | 7 | 2.2% |
| German | 112 | 34.6% |
| Indian (Asian) | 11 | 3.4% |
| Irish | 99 | 30.6% |
| Italian | 34 | 10.5% |
| Lithuanian | 4 | 1.2% |
| Norwegian | 11 | 3.4% |
| Polish | 29 | 8.9% |
| Russian | 4 | 1.2% |
| Scandinavian | 4 | 1.2% | View All 20 Rows |
Immigrants in Silver Lake CDP Warren County

| Immigration Origin | # Population | % Population | View All 0 Rows |
Sex and Age in Silver Lake CDP Warren County
Sex and Age in Silver Lake CDP Warren County
The most populous age groups in Silver Lake CDP Warren County are 65 to 69 Years (38 | 22.9%) for men and 60 to 64 Years (30 | 19.0%) for women.
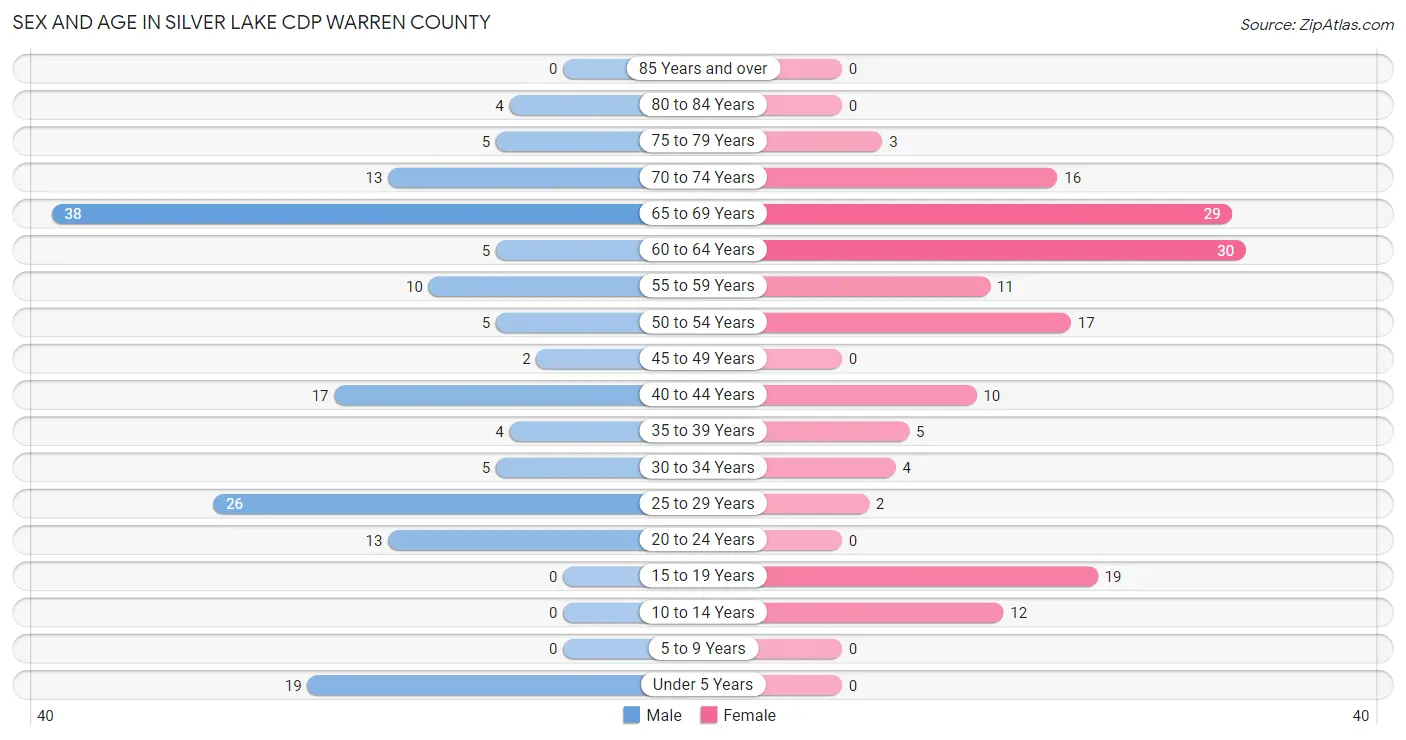
| Age Bracket | Male | Female |
| Under 5 Years | 19 (11.5%) | 0 (0.0%) |
| 5 to 9 Years | 0 (0.0%) | 0 (0.0%) |
| 10 to 14 Years | 0 (0.0%) | 12 (7.6%) |
| 15 to 19 Years | 0 (0.0%) | 19 (12.0%) |
| 20 to 24 Years | 13 (7.8%) | 0 (0.0%) |
| 25 to 29 Years | 26 (15.7%) | 2 (1.3%) |
| 30 to 34 Years | 5 (3.0%) | 4 (2.5%) |
| 35 to 39 Years | 4 (2.4%) | 5 (3.2%) |
| 40 to 44 Years | 17 (10.2%) | 10 (6.3%) |
| 45 to 49 Years | 2 (1.2%) | 0 (0.0%) |
| 50 to 54 Years | 5 (3.0%) | 17 (10.8%) |
| 55 to 59 Years | 10 (6.0%) | 11 (7.0%) |
| 60 to 64 Years | 5 (3.0%) | 30 (19.0%) |
| 65 to 69 Years | 38 (22.9%) | 29 (18.3%) |
| 70 to 74 Years | 13 (7.8%) | 16 (10.1%) |
| 75 to 79 Years | 5 (3.0%) | 3 (1.9%) |
| 80 to 84 Years | 4 (2.4%) | 0 (0.0%) |
| 85 Years and over | 0 (0.0%) | 0 (0.0%) |
| Total | 166 (100.0%) | 158 (100.0%) |
Families and Households in Silver Lake CDP Warren County
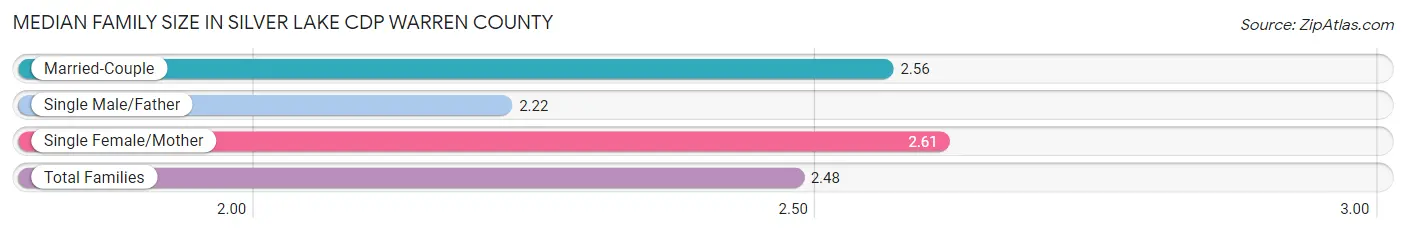
Median Family Size in Silver Lake CDP Warren County
The median family size in Silver Lake CDP Warren County is 2.48 persons per family, with single female/mother families (18 | 19.0%) accounting for the largest median family size of 2.61 persons per family. On the other hand, single male/father families (23 | 24.2%) represent the smallest median family size with 2.22 persons per family.
| Family Type | # Families | Family Size |
| Married-Couple | 54 (56.8%) | 2.56 |
| Single Male/Father | 23 (24.2%) | 2.22 |
| Single Female/Mother | 18 (19.0%) | 2.61 |
| Total Families | 95 (100.0%) | 2.48 |
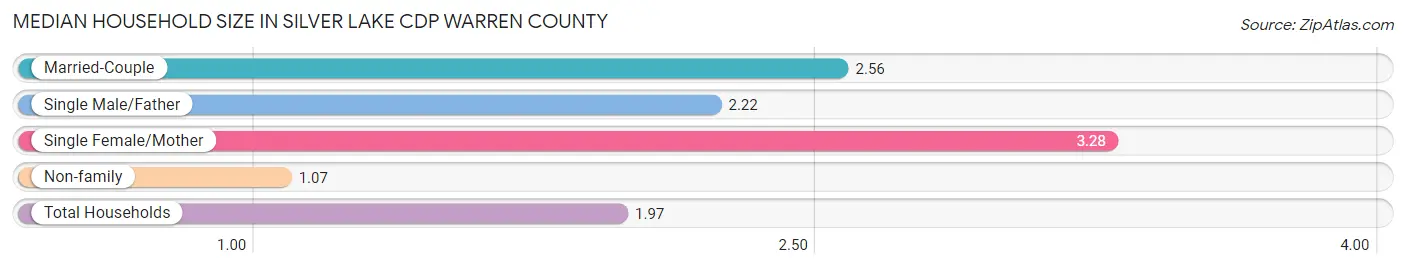
Median Household Size in Silver Lake CDP Warren County
The median household size in Silver Lake CDP Warren County is 1.97 persons per household, with single female/mother households (18 | 11.0%) accounting for the largest median household size of 3.28 persons per household. non-family households (68 | 41.7%) represent the smallest median household size with 1.07 persons per household.
| Household Type | # Households | Household Size |
| Married-Couple | 54 (33.1%) | 2.56 |
| Single Male/Father | 23 (14.1%) | 2.22 |
| Single Female/Mother | 18 (11.0%) | 3.28 |
| Non-family | 68 (41.7%) | 1.07 |
| Total Households | 163 (100.0%) | 1.97 |
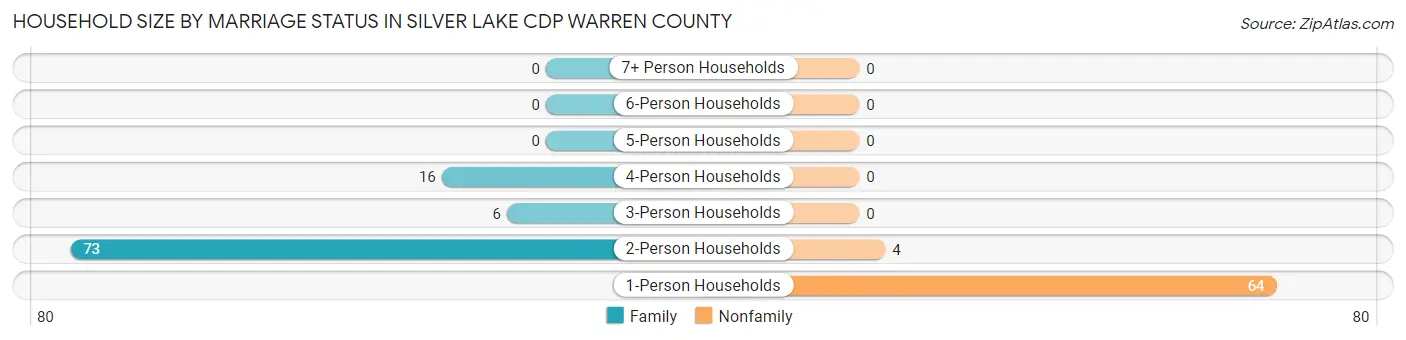
Household Size by Marriage Status in Silver Lake CDP Warren County
Out of a total of 163 households in Silver Lake CDP Warren County, 95 (58.3%) are family households, while 68 (41.7%) are nonfamily households. The most numerous type of family households are 2-person households, comprising 73, and the most common type of nonfamily households are 1-person households, comprising 64.
| Household Size | Family Households | Nonfamily Households |
| 1-Person Households | - | 64 (39.3%) |
| 2-Person Households | 73 (44.8%) | 4 (2.5%) |
| 3-Person Households | 6 (3.7%) | 0 (0.0%) |
| 4-Person Households | 16 (9.8%) | 0 (0.0%) |
| 5-Person Households | 0 (0.0%) | 0 (0.0%) |
| 6-Person Households | 0 (0.0%) | 0 (0.0%) |
| 7+ Person Households | 0 (0.0%) | 0 (0.0%) |
| Total | 95 (58.3%) | 68 (41.7%) |
Female Fertility in Silver Lake CDP Warren County
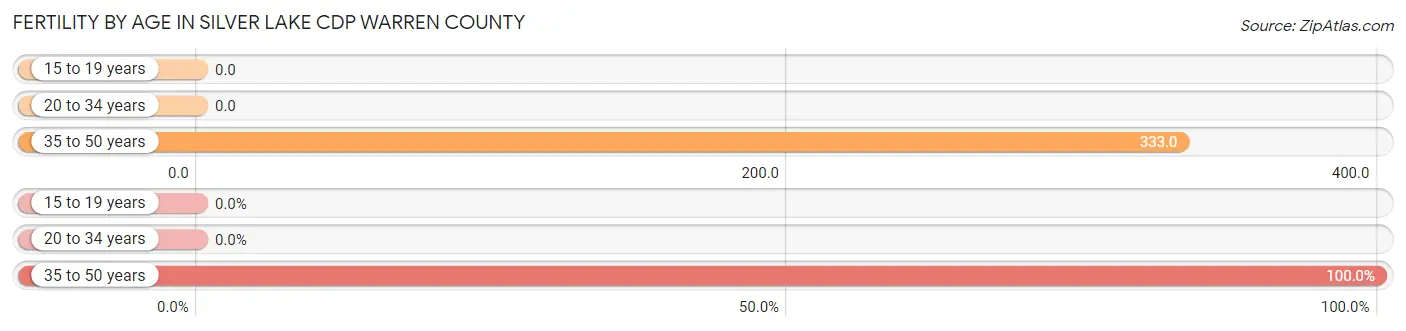
Fertility by Age in Silver Lake CDP Warren County
Average fertility rate in Silver Lake CDP Warren County is 125.0 births per 1,000 women. Women in the age bracket of 35 to 50 years have the highest fertility rate with 333.0 births per 1,000 women. Women in the age bracket of 35 to 50 years acount for 100.0% of all women with births.
| Age Bracket | Women with Births | Births / 1,000 Women |
| 15 to 19 years | 0 (0.0%) | 0.0 |
| 20 to 34 years | 0 (0.0%) | 0.0 |
| 35 to 50 years | 5 (100.0%) | 333.0 |
| Total | 5 (100.0%) | 125.0 |
Fertility by Age by Marriage Status in Silver Lake CDP Warren County
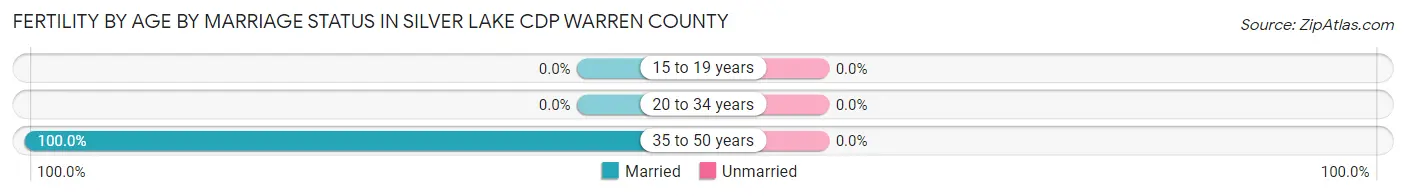
| Age Bracket | Married | Unmarried |
| 15 to 19 years | 0 (0.0%) | 0 (0.0%) |
| 20 to 34 years | 0 (0.0%) | 0 (0.0%) |
| 35 to 50 years | 5 (100.0%) | 0 (0.0%) |
| Total | 5 (100.0%) | 0 (0.0%) |
Fertility by Education in Silver Lake CDP Warren County
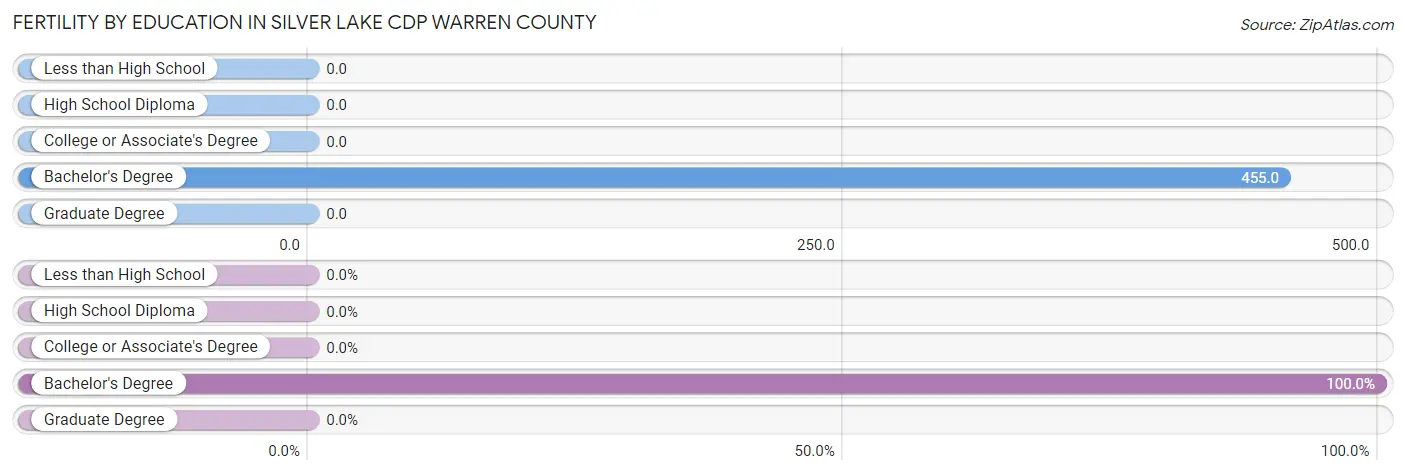
| Educational Attainment | Women with Births | Births / 1,000 Women |
| Less than High School | 0 (0.0%) | 0.0 |
| High School Diploma | 0 (0.0%) | 0.0 |
| College or Associate's Degree | 0 (0.0%) | 0.0 |
| Bachelor's Degree | 5 (100.0%) | 455.0 |
| Graduate Degree | 0 (0.0%) | 0.0 |
| Total | 5 (100.0%) | 125.0 |
Fertility by Education by Marriage Status in Silver Lake CDP Warren County
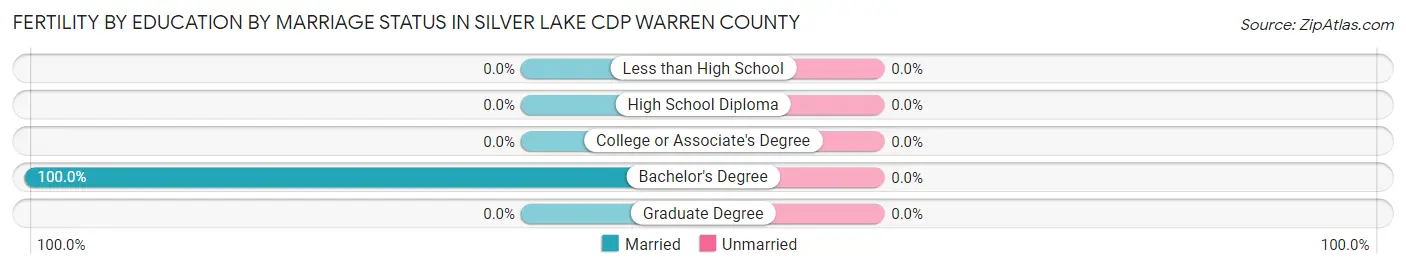
| Educational Attainment | Married | Unmarried |
| Less than High School | 0 (0.0%) | 0 (0.0%) |
| High School Diploma | 0 (0.0%) | 0 (0.0%) |
| College or Associate's Degree | 0 (0.0%) | 0 (0.0%) |
| Bachelor's Degree | 5 (100.0%) | 0 (0.0%) |
| Graduate Degree | 0 (0.0%) | 0 (0.0%) |
| Total | 5 (100.0%) | 0 (0.0%) |
Employment Characteristics in Silver Lake CDP Warren County
Employment by Class of Employer in Silver Lake CDP Warren County
Among the 161 employed individuals in Silver Lake CDP Warren County, private company employees (96 | 59.6%), self-employed (not incorporated) (30 | 18.6%), and local government employees (22 | 13.7%) make up the most common classes of employment.
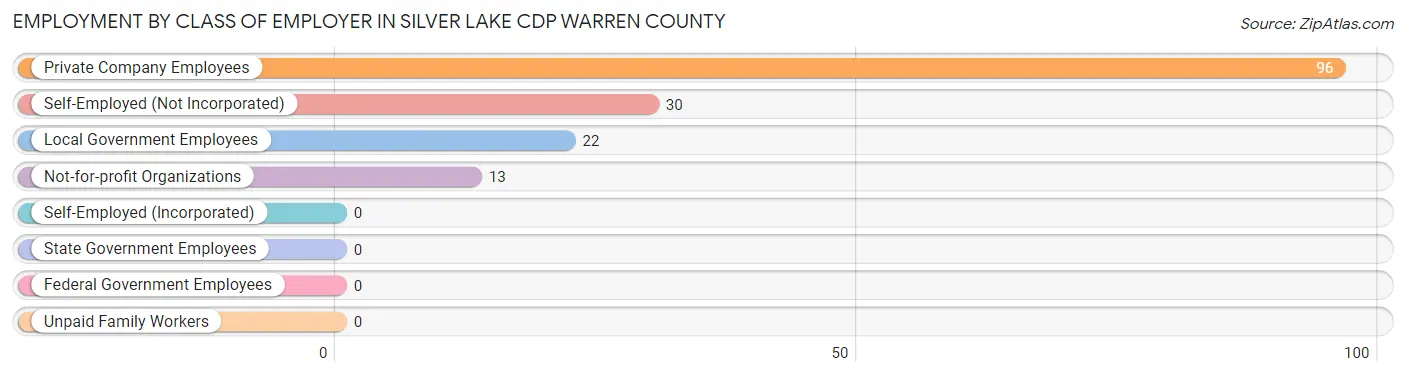
| Employer Class | # Employees | % Employees |
| Private Company Employees | 96 | 59.6% |
| Self-Employed (Incorporated) | 0 | 0.0% |
| Self-Employed (Not Incorporated) | 30 | 18.6% |
| Not-for-profit Organizations | 13 | 8.1% |
| Local Government Employees | 22 | 13.7% |
| State Government Employees | 0 | 0.0% |
| Federal Government Employees | 0 | 0.0% |
| Unpaid Family Workers | 0 | 0.0% |
| Total | 161 | 100.0% |
Employment Status by Age in Silver Lake CDP Warren County
According to the labor force statistics for Silver Lake CDP Warren County, out of the total population over 16 years of age (278), 64.4% or 179 individuals are in the labor force, with 7.8% or 14 of them unemployed. The age group with the highest labor force participation rate is 20 to 24 years, with 100.0% or 13 individuals in the labor force. Within the labor force, the 35 to 44 years age range has the highest percentage of unemployed individuals, with 33.3% or 12 of them being unemployed.
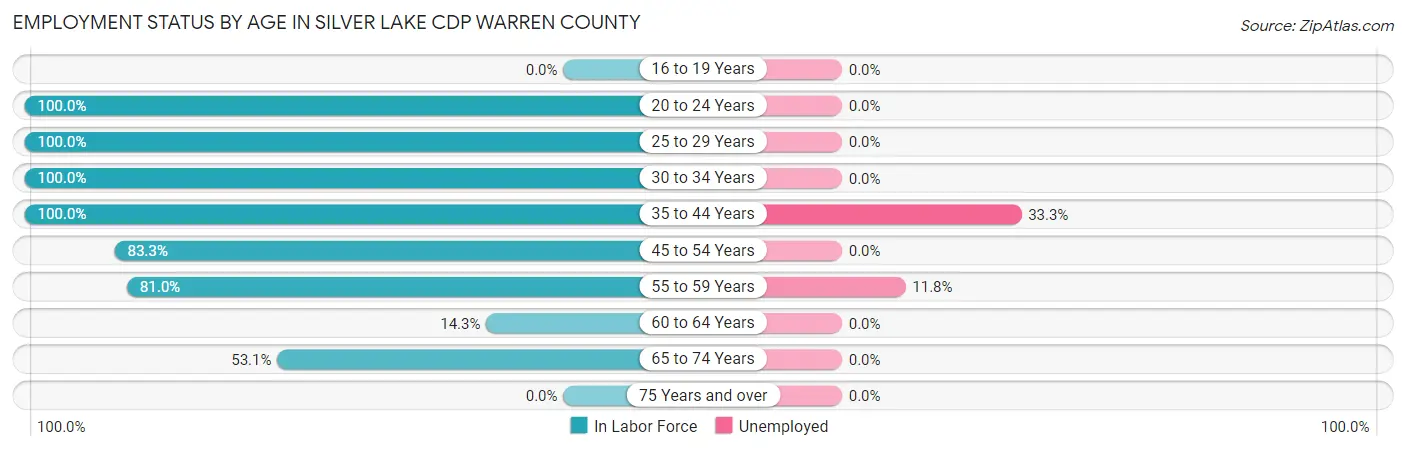
| Age Bracket | In Labor Force | Unemployed |
| 16 to 19 Years | 0 (0.0%) | 0 (0.0%) |
| 20 to 24 Years | 13 (100.0%) | 0 (0.0%) |
| 25 to 29 Years | 28 (100.0%) | 0 (0.0%) |
| 30 to 34 Years | 9 (100.0%) | 0 (0.0%) |
| 35 to 44 Years | 36 (100.0%) | 12 (33.3%) |
| 45 to 54 Years | 20 (83.3%) | 0 (0.0%) |
| 55 to 59 Years | 17 (81.0%) | 2 (11.8%) |
| 60 to 64 Years | 5 (14.3%) | 0 (0.0%) |
| 65 to 74 Years | 51 (53.1%) | 0 (0.0%) |
| 75 Years and over | 0 (0.0%) | 0 (0.0%) |
| Total | 179 (64.4%) | 14 (7.8%) |
Employment Status by Educational Attainment in Silver Lake CDP Warren County
According to labor force statistics for Silver Lake CDP Warren County, 75.2% of individuals (115) out of the total population between 25 and 64 years of age (153) are in the labor force, with 12.2% or 14 of them being unemployed. The group with the highest labor force participation rate are those with the educational attainment of bachelor's degree or higher, with 100.0% or 33 individuals in the labor force. Within the labor force, individuals with college / associate degree education have the highest percentage of unemployment, with 22.2% or 12 of them being unemployed.
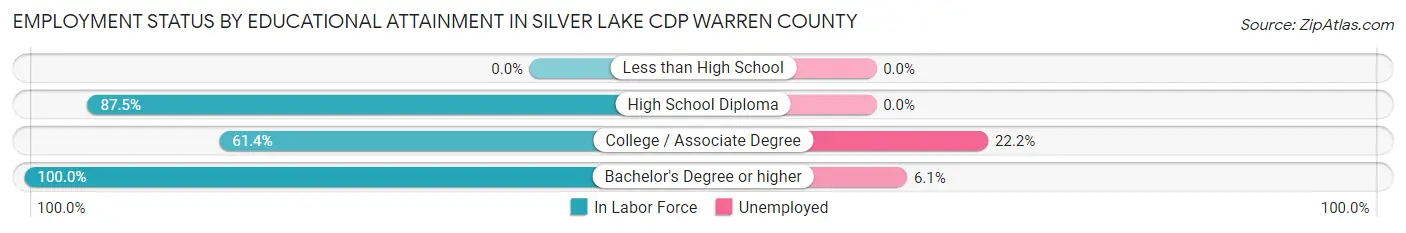
| Educational Attainment | In Labor Force | Unemployed |
| Less than High School | 0 (0.0%) | 0 (0.0%) |
| High School Diploma | 28 (87.5%) | 0 (0.0%) |
| College / Associate Degree | 54 (61.4%) | 20 (22.2%) |
| Bachelor's Degree or higher | 33 (100.0%) | 2 (6.1%) |
| Total | 115 (75.2%) | 19 (12.2%) |
Employment Occupations by Sex in Silver Lake CDP Warren County
Management, Business, Science and Arts Occupations
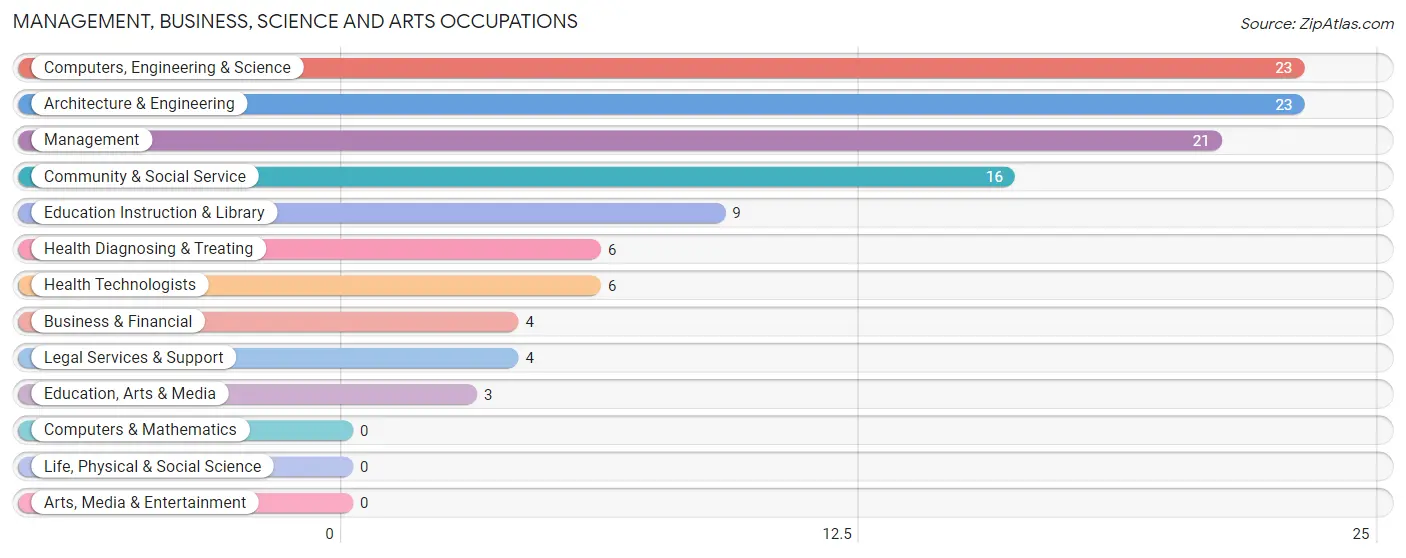
The most common Management, Business, Science and Arts occupations in Silver Lake CDP Warren County are Computers, Engineering & Science (23 | 13.9%), Architecture & Engineering (23 | 13.9%), Management (21 | 12.7%), Community & Social Service (16 | 9.7%), and Education Instruction & Library (9 | 5.4%).
Management, Business, Science and Arts Occupations by Sex
Within the Management, Business, Science and Arts occupations in Silver Lake CDP Warren County, the most male-oriented occupations are Computers, Engineering & Science (100.0%), Architecture & Engineering (100.0%), and Education, Arts & Media (100.0%), while the most female-oriented occupations are Business & Financial (100.0%), Legal Services & Support (100.0%), and Management (76.2%).
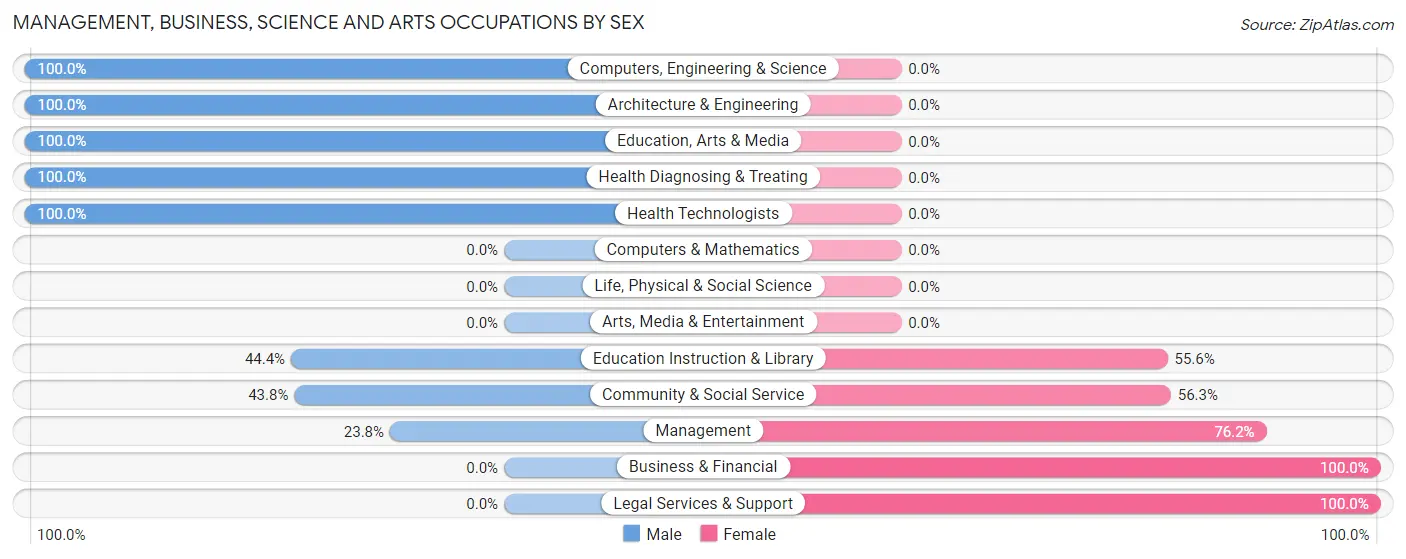
| Occupation | Male | Female |
| Management | 5 (23.8%) | 16 (76.2%) |
| Business & Financial | 0 (0.0%) | 4 (100.0%) |
| Computers, Engineering & Science | 23 (100.0%) | 0 (0.0%) |
| Computers & Mathematics | 0 (0.0%) | 0 (0.0%) |
| Architecture & Engineering | 23 (100.0%) | 0 (0.0%) |
| Life, Physical & Social Science | 0 (0.0%) | 0 (0.0%) |
| Community & Social Service | 7 (43.8%) | 9 (56.2%) |
| Education, Arts & Media | 3 (100.0%) | 0 (0.0%) |
| Legal Services & Support | 0 (0.0%) | 4 (100.0%) |
| Education Instruction & Library | 4 (44.4%) | 5 (55.6%) |
| Arts, Media & Entertainment | 0 (0.0%) | 0 (0.0%) |
| Health Diagnosing & Treating | 6 (100.0%) | 0 (0.0%) |
| Health Technologists | 6 (100.0%) | 0 (0.0%) |
| Total (Category) | 41 (58.6%) | 29 (41.4%) |
| Total (Overall) | 97 (58.8%) | 68 (41.2%) |
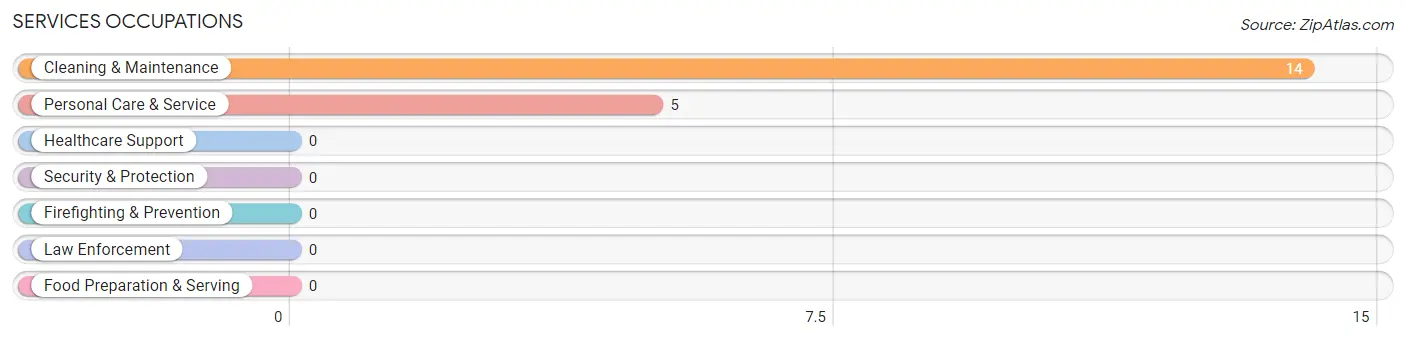
Services Occupations
The most common Services occupations in Silver Lake CDP Warren County are Cleaning & Maintenance (14 | 8.5%), and Personal Care & Service (5 | 3.0%).
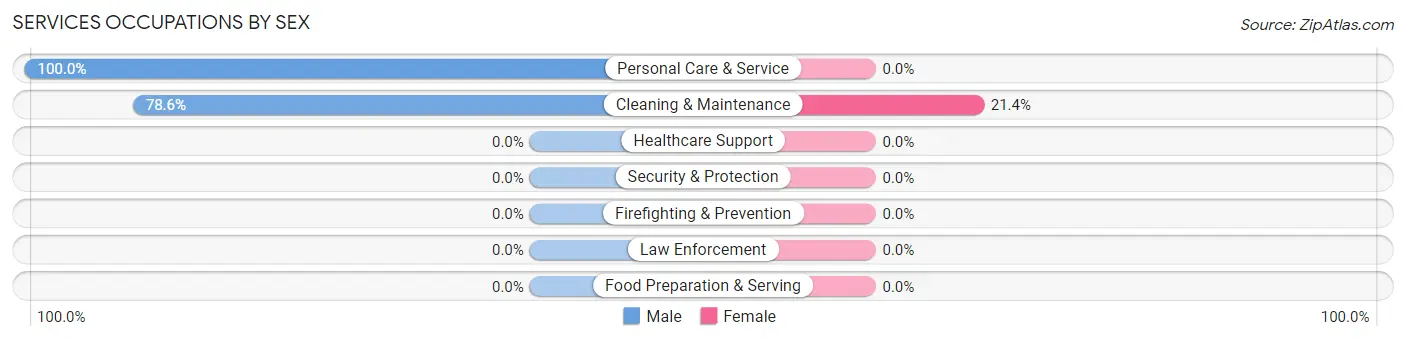
Services Occupations by Sex
| Occupation | Male | Female |
| Healthcare Support | 0 (0.0%) | 0 (0.0%) |
| Security & Protection | 0 (0.0%) | 0 (0.0%) |
| Firefighting & Prevention | 0 (0.0%) | 0 (0.0%) |
| Law Enforcement | 0 (0.0%) | 0 (0.0%) |
| Food Preparation & Serving | 0 (0.0%) | 0 (0.0%) |
| Cleaning & Maintenance | 11 (78.6%) | 3 (21.4%) |
| Personal Care & Service | 5 (100.0%) | 0 (0.0%) |
| Total (Category) | 16 (84.2%) | 3 (15.8%) |
| Total (Overall) | 97 (58.8%) | 68 (41.2%) |
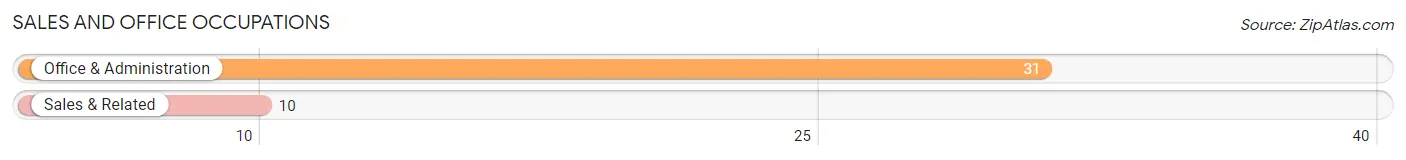
Sales and Office Occupations
The most common Sales and Office occupations in Silver Lake CDP Warren County are Office & Administration (31 | 18.8%), and Sales & Related (10 | 6.1%).
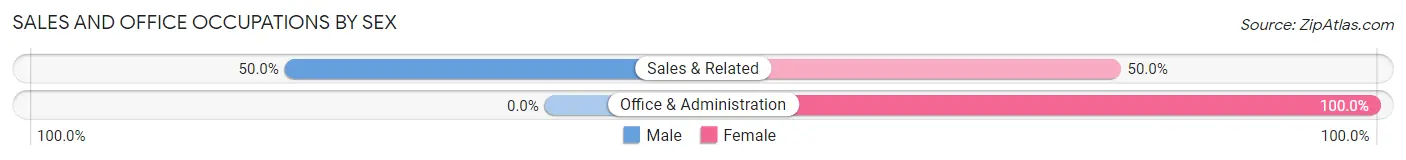
Sales and Office Occupations by Sex
| Occupation | Male | Female |
| Sales & Related | 5 (50.0%) | 5 (50.0%) |
| Office & Administration | 0 (0.0%) | 31 (100.0%) |
| Total (Category) | 5 (12.2%) | 36 (87.8%) |
| Total (Overall) | 97 (58.8%) | 68 (41.2%) |
Natural Resources, Construction and Maintenance Occupations
The most common Natural Resources, Construction and Maintenance occupations in Silver Lake CDP Warren County are Installation, Maintenance & Repair (12 | 7.3%), and Construction & Extraction (7 | 4.2%).
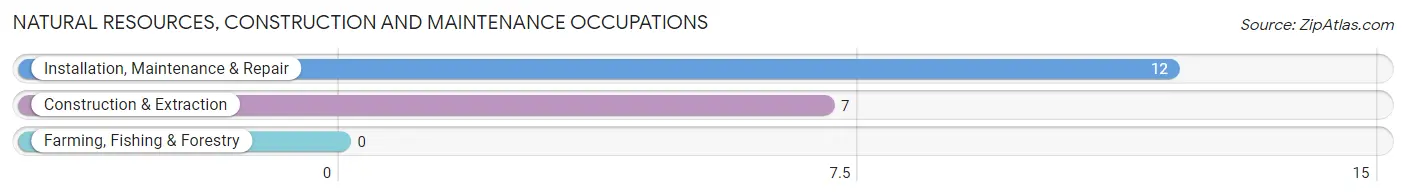
Natural Resources, Construction and Maintenance Occupations by Sex
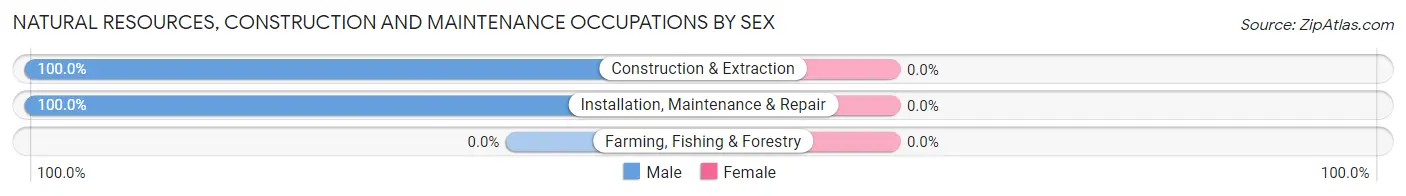
| Occupation | Male | Female |
| Farming, Fishing & Forestry | 0 (0.0%) | 0 (0.0%) |
| Construction & Extraction | 7 (100.0%) | 0 (0.0%) |
| Installation, Maintenance & Repair | 12 (100.0%) | 0 (0.0%) |
| Total (Category) | 19 (100.0%) | 0 (0.0%) |
| Total (Overall) | 97 (58.8%) | 68 (41.2%) |
Production, Transportation and Moving Occupations
The most common Production, Transportation and Moving occupations in Silver Lake CDP Warren County are Production (9 | 5.4%), and Material Moving (7 | 4.2%).
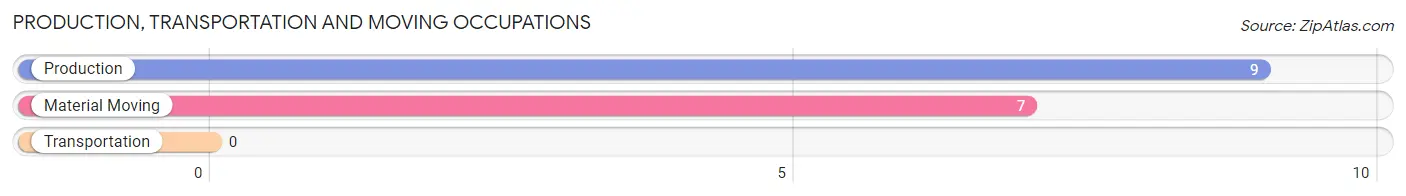
Production, Transportation and Moving Occupations by Sex
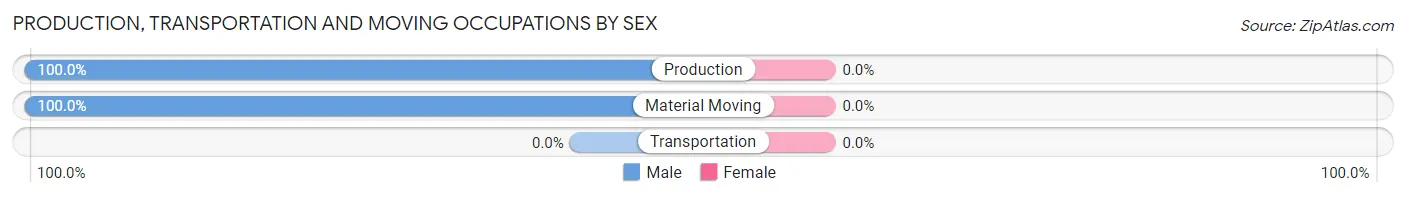
| Occupation | Male | Female |
| Production | 9 (100.0%) | 0 (0.0%) |
| Transportation | 0 (0.0%) | 0 (0.0%) |
| Material Moving | 7 (100.0%) | 0 (0.0%) |
| Total (Category) | 16 (100.0%) | 0 (0.0%) |
| Total (Overall) | 97 (58.8%) | 68 (41.2%) |
Employment Industries by Sex in Silver Lake CDP Warren County
Employment Industries in Silver Lake CDP Warren County
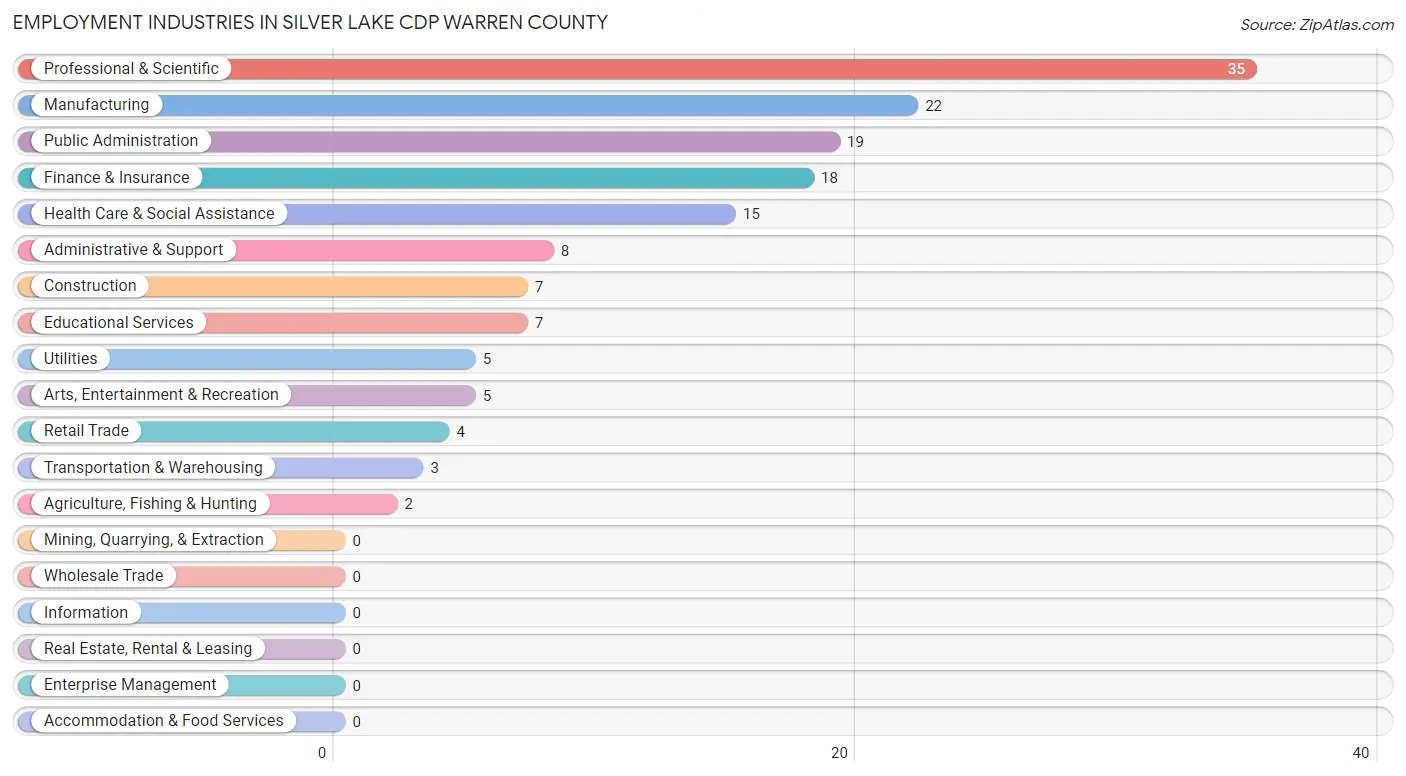
The major employment industries in Silver Lake CDP Warren County include Professional & Scientific (35 | 21.2%), Manufacturing (22 | 13.3%), Public Administration (19 | 11.5%), Finance & Insurance (18 | 10.9%), and Health Care & Social Assistance (15 | 9.1%).
Employment Industries by Sex in Silver Lake CDP Warren County
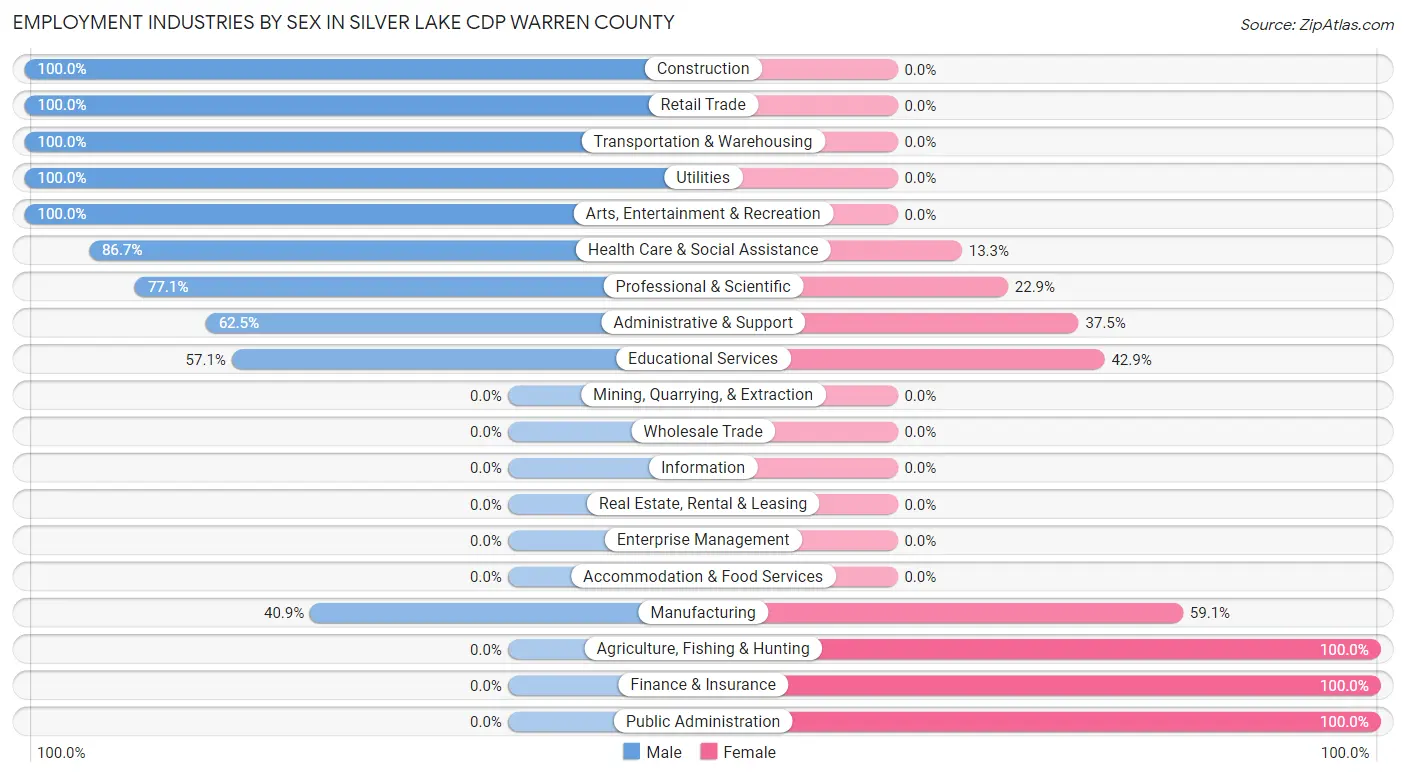
The Silver Lake CDP Warren County industries that see more men than women are Construction (100.0%), Retail Trade (100.0%), and Transportation & Warehousing (100.0%), whereas the industries that tend to have a higher number of women are Agriculture, Fishing & Hunting (100.0%), Finance & Insurance (100.0%), and Public Administration (100.0%).
| Industry | Male | Female |
| Agriculture, Fishing & Hunting | 0 (0.0%) | 2 (100.0%) |
| Mining, Quarrying, & Extraction | 0 (0.0%) | 0 (0.0%) |
| Construction | 7 (100.0%) | 0 (0.0%) |
| Manufacturing | 9 (40.9%) | 13 (59.1%) |
| Wholesale Trade | 0 (0.0%) | 0 (0.0%) |
| Retail Trade | 4 (100.0%) | 0 (0.0%) |
| Transportation & Warehousing | 3 (100.0%) | 0 (0.0%) |
| Utilities | 5 (100.0%) | 0 (0.0%) |
| Information | 0 (0.0%) | 0 (0.0%) |
| Finance & Insurance | 0 (0.0%) | 18 (100.0%) |
| Real Estate, Rental & Leasing | 0 (0.0%) | 0 (0.0%) |
| Professional & Scientific | 27 (77.1%) | 8 (22.9%) |
| Enterprise Management | 0 (0.0%) | 0 (0.0%) |
| Administrative & Support | 5 (62.5%) | 3 (37.5%) |
| Educational Services | 4 (57.1%) | 3 (42.9%) |
| Health Care & Social Assistance | 13 (86.7%) | 2 (13.3%) |
| Arts, Entertainment & Recreation | 5 (100.0%) | 0 (0.0%) |
| Accommodation & Food Services | 0 (0.0%) | 0 (0.0%) |
| Public Administration | 0 (0.0%) | 19 (100.0%) |
| Total | 97 (58.8%) | 68 (41.2%) |
Education in Silver Lake CDP Warren County
School Enrollment in Silver Lake CDP Warren County
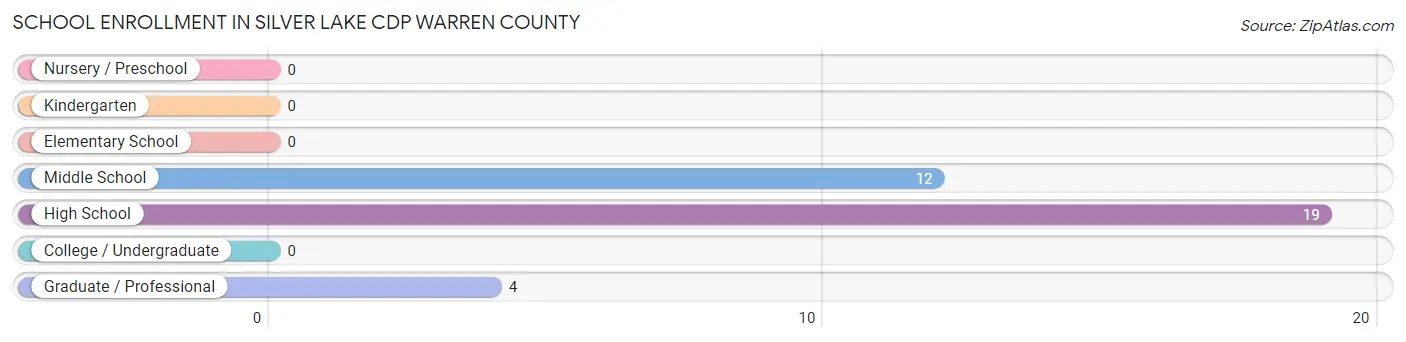
The most common levels of schooling among the 35 students in Silver Lake CDP Warren County are high school (19 | 54.3%), middle school (12 | 34.3%), and graduate / professional (4 | 11.4%).
| School Level | # Students | % Students |
| Nursery / Preschool | 0 | 0.0% |
| Kindergarten | 0 | 0.0% |
| Elementary School | 0 | 0.0% |
| Middle School | 12 | 34.3% |
| High School | 19 | 54.3% |
| College / Undergraduate | 0 | 0.0% |
| Graduate / Professional | 4 | 11.4% |
| Total | 35 | 100.0% |
School Enrollment by Age by Funding Source in Silver Lake CDP Warren County
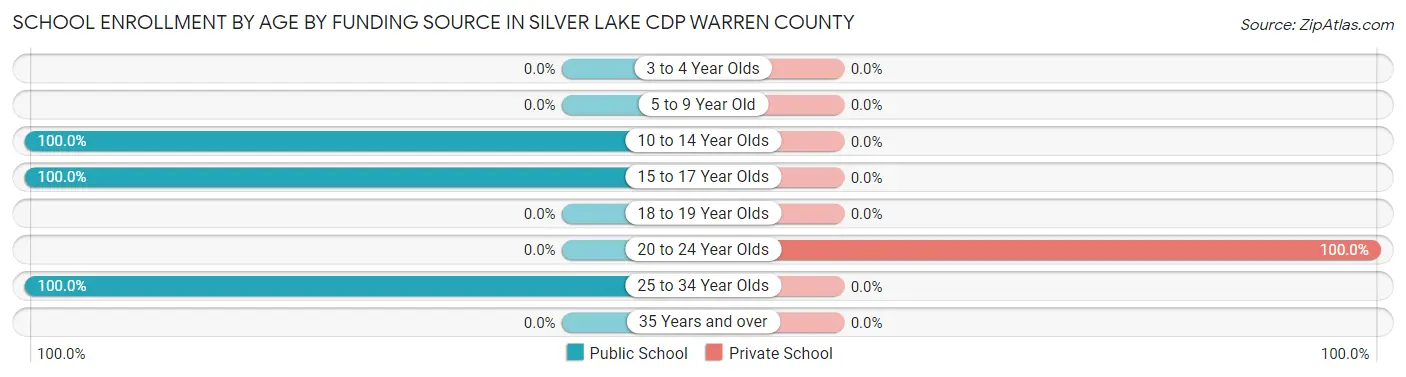
Out of a total of 35 students who are enrolled in schools in Silver Lake CDP Warren County, 2 (5.7%) attend a private institution, while the remaining 33 (94.3%) are enrolled in public schools. The age group of 20 to 24 year olds has the highest likelihood of being enrolled in private schools, with 2 (100.0% in the age bracket) enrolled. Conversely, the age group of 10 to 14 year olds has the lowest likelihood of being enrolled in a private school, with 12 (100.0% in the age bracket) attending a public institution.
| Age Bracket | Public School | Private School |
| 3 to 4 Year Olds | 0 (0.0%) | 0 (0.0%) |
| 5 to 9 Year Old | 0 (0.0%) | 0 (0.0%) |
| 10 to 14 Year Olds | 12 (100.0%) | 0 (0.0%) |
| 15 to 17 Year Olds | 19 (100.0%) | 0 (0.0%) |
| 18 to 19 Year Olds | 0 (0.0%) | 0 (0.0%) |
| 20 to 24 Year Olds | 0 (0.0%) | 2 (100.0%) |
| 25 to 34 Year Olds | 2 (100.0%) | 0 (0.0%) |
| 35 Years and over | 0 (0.0%) | 0 (0.0%) |
| Total | 33 (94.3%) | 2 (5.7%) |
Educational Attainment by Field of Study in Silver Lake CDP Warren County
Education (26 | 32.9%), engineering (17 | 21.5%), literature & languages (7 | 8.9%), liberal arts & history (7 | 8.9%), and psychology (6 | 7.6%) are the most common fields of study among 79 individuals in Silver Lake CDP Warren County who have obtained a bachelor's degree or higher.
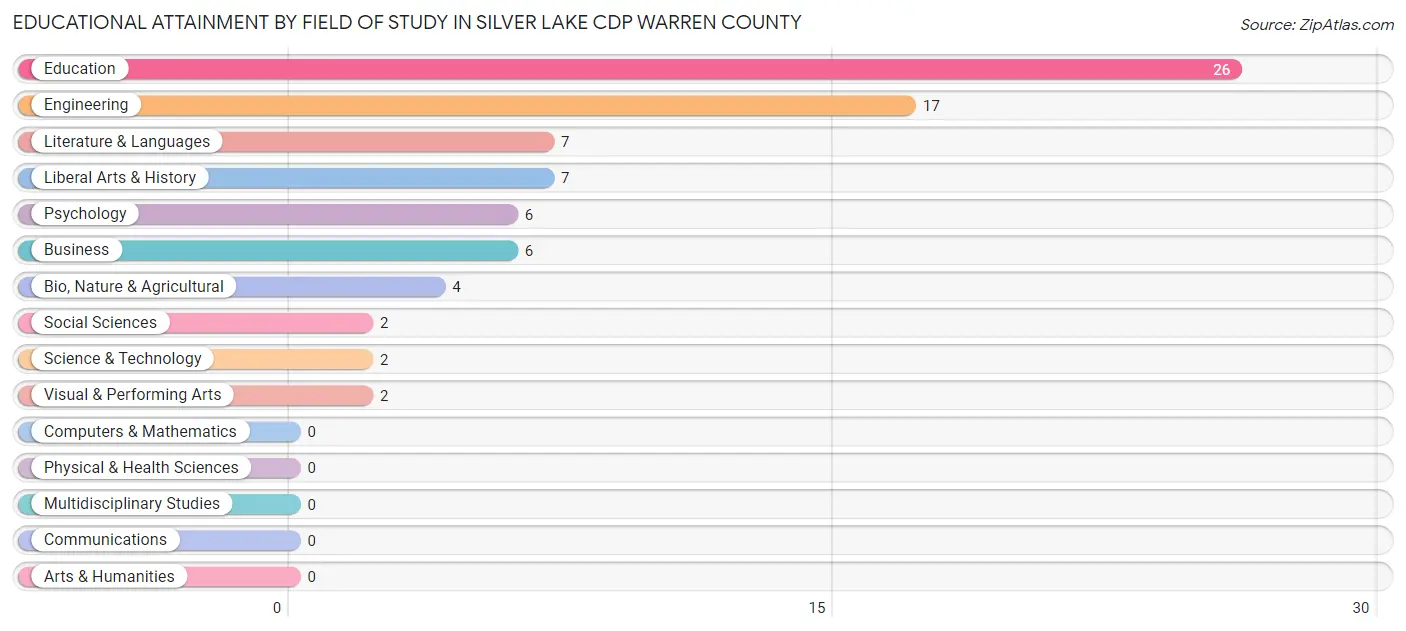
| Field of Study | # Graduates | % Graduates |
| Computers & Mathematics | 0 | 0.0% |
| Bio, Nature & Agricultural | 4 | 5.1% |
| Physical & Health Sciences | 0 | 0.0% |
| Psychology | 6 | 7.6% |
| Social Sciences | 2 | 2.5% |
| Engineering | 17 | 21.5% |
| Multidisciplinary Studies | 0 | 0.0% |
| Science & Technology | 2 | 2.5% |
| Business | 6 | 7.6% |
| Education | 26 | 32.9% |
| Literature & Languages | 7 | 8.9% |
| Liberal Arts & History | 7 | 8.9% |
| Visual & Performing Arts | 2 | 2.5% |
| Communications | 0 | 0.0% |
| Arts & Humanities | 0 | 0.0% |
| Total | 79 | 100.0% |
Transportation & Commute in Silver Lake CDP Warren County
Vehicle Availability by Sex in Silver Lake CDP Warren County
The most prevalent vehicle ownership categories in Silver Lake CDP Warren County are males with 2 vehicles (45, accounting for 47.9%) and females with 2 vehicles (22, making up 70.3%).
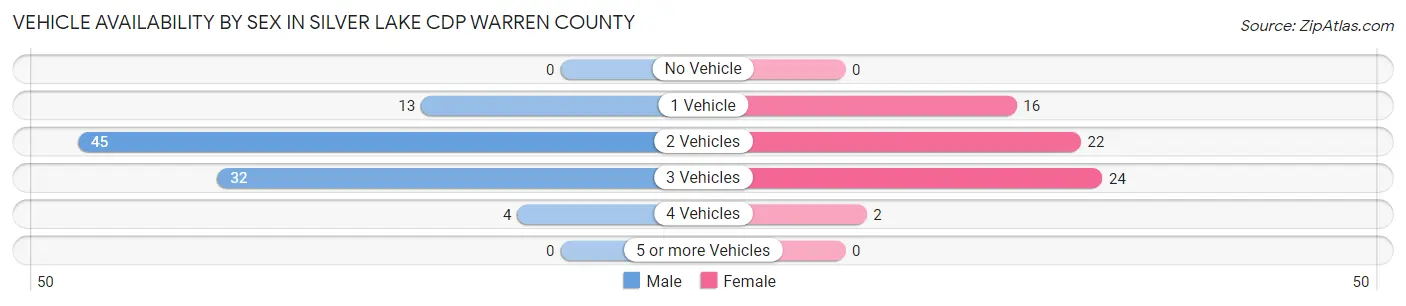
| Vehicles Available | Male | Female |
| No Vehicle | 0 (0.0%) | 0 (0.0%) |
| 1 Vehicle | 13 (13.8%) | 16 (25.0%) |
| 2 Vehicles | 45 (47.9%) | 22 (34.4%) |
| 3 Vehicles | 32 (34.0%) | 24 (37.5%) |
| 4 Vehicles | 4 (4.3%) | 2 (3.1%) |
| 5 or more Vehicles | 0 (0.0%) | 0 (0.0%) |
| Total | 94 (100.0%) | 64 (100.0%) |
Commute Time in Silver Lake CDP Warren County
The most frequently occuring commute durations in Silver Lake CDP Warren County are 20 to 24 minutes (48 commuters, 32.4%), 25 to 29 minutes (31 commuters, 20.9%), and 35 to 39 minutes (21 commuters, 14.2%).
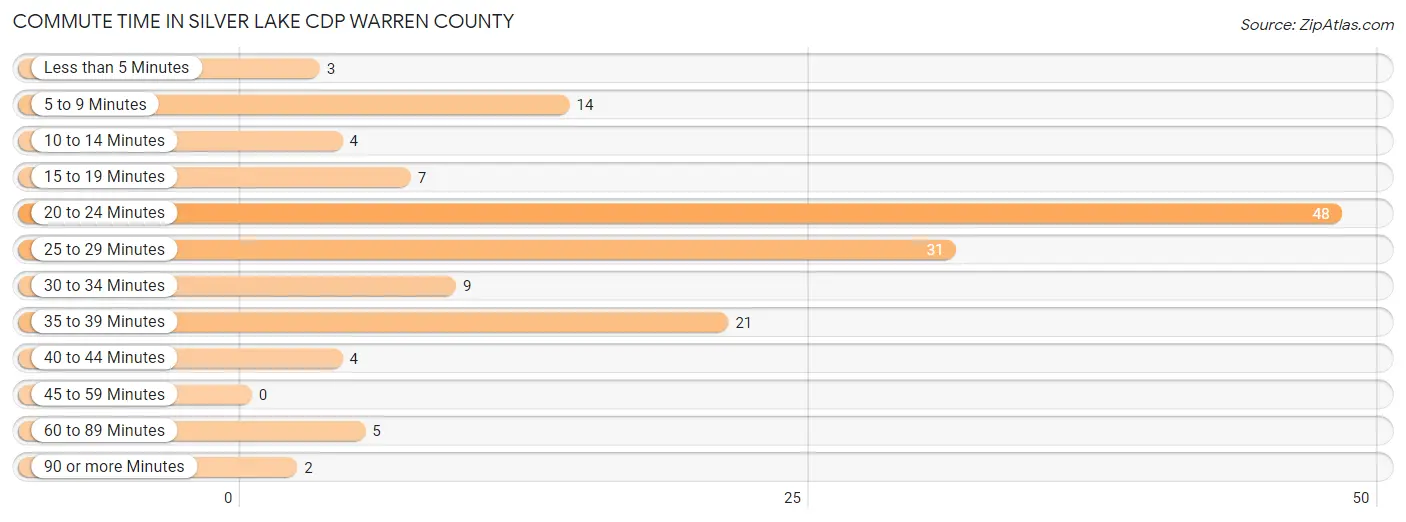
| Commute Time | # Commuters | % Commuters |
| Less than 5 Minutes | 3 | 2.0% |
| 5 to 9 Minutes | 14 | 9.5% |
| 10 to 14 Minutes | 4 | 2.7% |
| 15 to 19 Minutes | 7 | 4.7% |
| 20 to 24 Minutes | 48 | 32.4% |
| 25 to 29 Minutes | 31 | 20.9% |
| 30 to 34 Minutes | 9 | 6.1% |
| 35 to 39 Minutes | 21 | 14.2% |
| 40 to 44 Minutes | 4 | 2.7% |
| 45 to 59 Minutes | 0 | 0.0% |
| 60 to 89 Minutes | 5 | 3.4% |
| 90 or more Minutes | 2 | 1.3% |
Commute Time by Sex in Silver Lake CDP Warren County
The most common commute times in Silver Lake CDP Warren County are 20 to 24 minutes (44 commuters, 47.8%) for males and 35 to 39 minutes (19 commuters, 33.9%) for females.
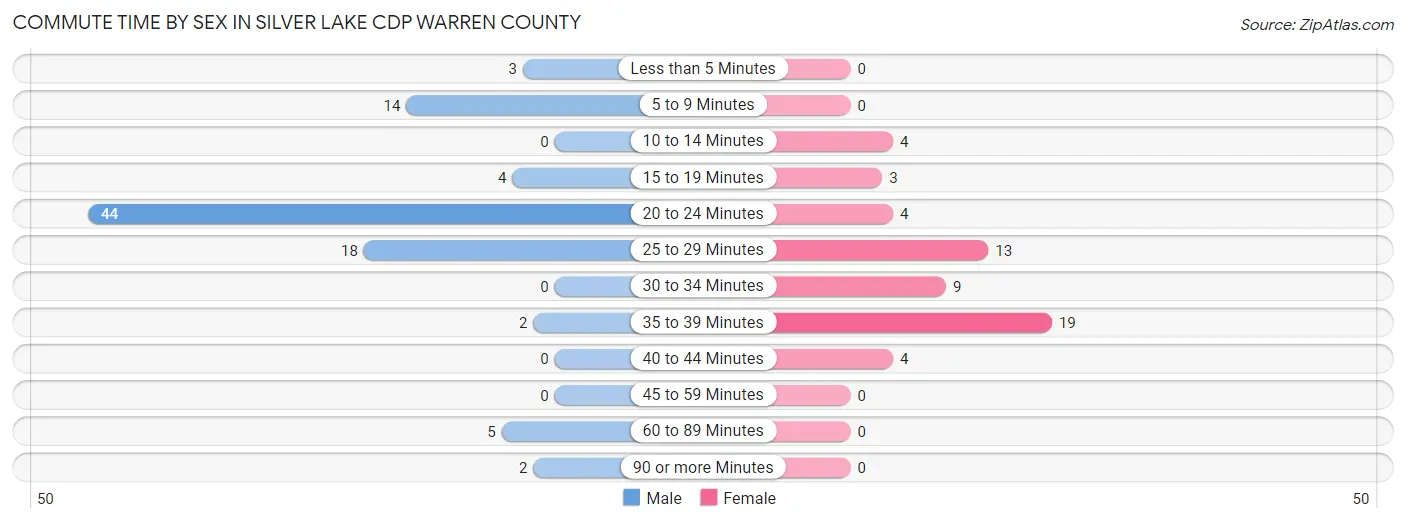
| Commute Time | Male | Female |
| Less than 5 Minutes | 3 (3.3%) | 0 (0.0%) |
| 5 to 9 Minutes | 14 (15.2%) | 0 (0.0%) |
| 10 to 14 Minutes | 0 (0.0%) | 4 (7.1%) |
| 15 to 19 Minutes | 4 (4.3%) | 3 (5.4%) |
| 20 to 24 Minutes | 44 (47.8%) | 4 (7.1%) |
| 25 to 29 Minutes | 18 (19.6%) | 13 (23.2%) |
| 30 to 34 Minutes | 0 (0.0%) | 9 (16.1%) |
| 35 to 39 Minutes | 2 (2.2%) | 19 (33.9%) |
| 40 to 44 Minutes | 0 (0.0%) | 4 (7.1%) |
| 45 to 59 Minutes | 0 (0.0%) | 0 (0.0%) |
| 60 to 89 Minutes | 5 (5.4%) | 0 (0.0%) |
| 90 or more Minutes | 2 (2.2%) | 0 (0.0%) |
Time of Departure to Work by Sex in Silver Lake CDP Warren County
The most frequent times of departure to work in Silver Lake CDP Warren County are 6:30 AM to 6:59 AM (27, 29.3%) for males and 7:30 AM to 7:59 AM (26, 46.4%) for females.
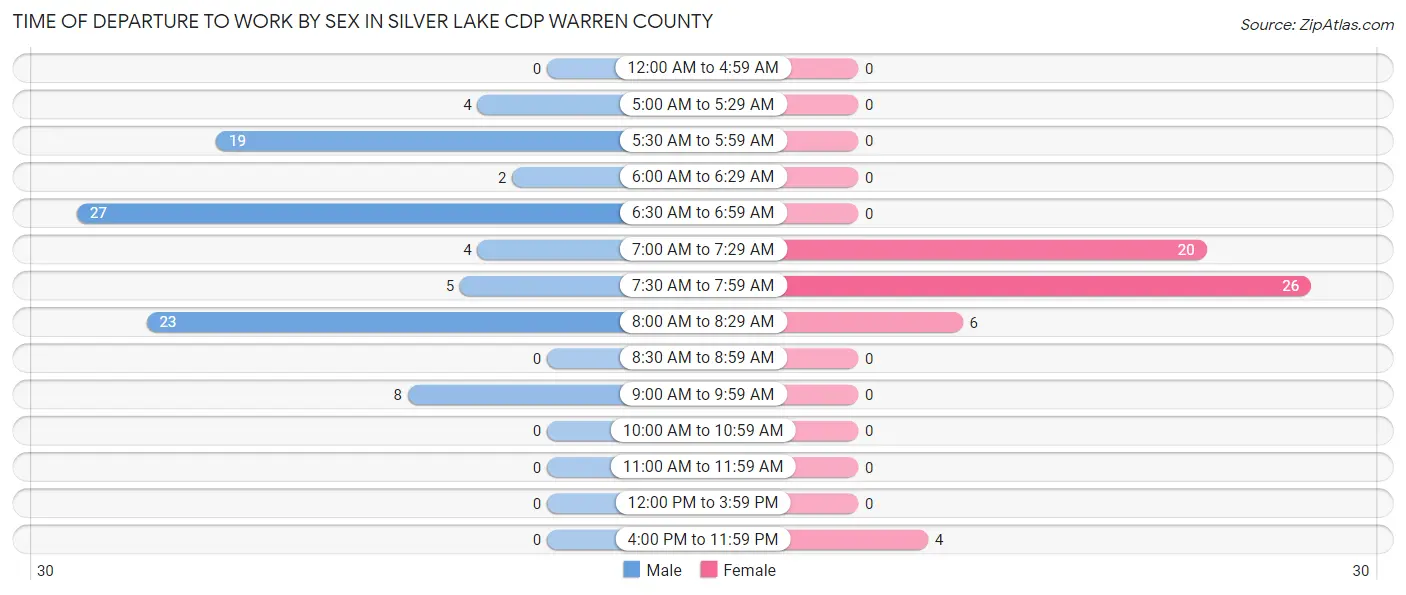
| Time of Departure | Male | Female |
| 12:00 AM to 4:59 AM | 0 (0.0%) | 0 (0.0%) |
| 5:00 AM to 5:29 AM | 4 (4.3%) | 0 (0.0%) |
| 5:30 AM to 5:59 AM | 19 (20.6%) | 0 (0.0%) |
| 6:00 AM to 6:29 AM | 2 (2.2%) | 0 (0.0%) |
| 6:30 AM to 6:59 AM | 27 (29.3%) | 0 (0.0%) |
| 7:00 AM to 7:29 AM | 4 (4.3%) | 20 (35.7%) |
| 7:30 AM to 7:59 AM | 5 (5.4%) | 26 (46.4%) |
| 8:00 AM to 8:29 AM | 23 (25.0%) | 6 (10.7%) |
| 8:30 AM to 8:59 AM | 0 (0.0%) | 0 (0.0%) |
| 9:00 AM to 9:59 AM | 8 (8.7%) | 0 (0.0%) |
| 10:00 AM to 10:59 AM | 0 (0.0%) | 0 (0.0%) |
| 11:00 AM to 11:59 AM | 0 (0.0%) | 0 (0.0%) |
| 12:00 PM to 3:59 PM | 0 (0.0%) | 0 (0.0%) |
| 4:00 PM to 11:59 PM | 0 (0.0%) | 4 (7.1%) |
| Total | 92 (100.0%) | 56 (100.0%) |
Housing Occupancy in Silver Lake CDP Warren County
Occupancy by Ownership in Silver Lake CDP Warren County
Of the total 163 dwellings in Silver Lake CDP Warren County, owner-occupied units account for 150 (92.0%), while renter-occupied units make up 13 (8.0%).
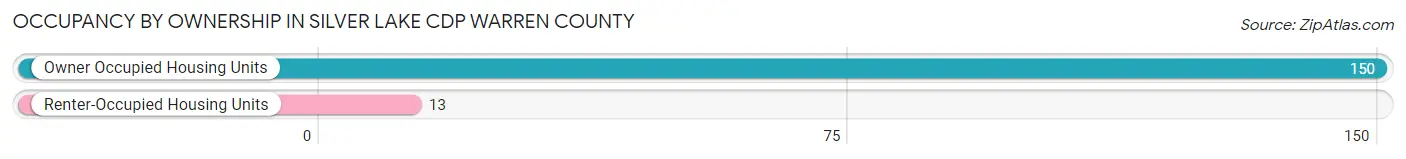
| Occupancy | # Housing Units | % Housing Units |
| Owner Occupied Housing Units | 150 | 92.0% |
| Renter-Occupied Housing Units | 13 | 8.0% |
| Total Occupied Housing Units | 163 | 100.0% |
Occupancy by Household Size in Silver Lake CDP Warren County
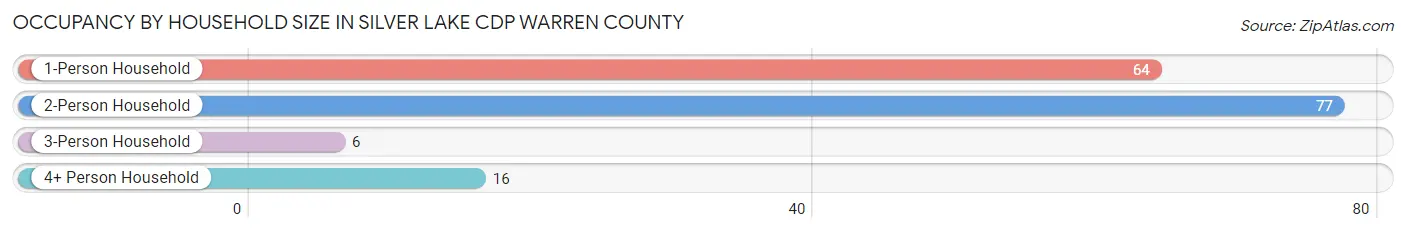
| Household Size | # Housing Units | % Housing Units |
| 1-Person Household | 64 | 39.3% |
| 2-Person Household | 77 | 47.2% |
| 3-Person Household | 6 | 3.7% |
| 4+ Person Household | 16 | 9.8% |
| Total Housing Units | 163 | 100.0% |
Occupancy by Ownership by Household Size in Silver Lake CDP Warren County
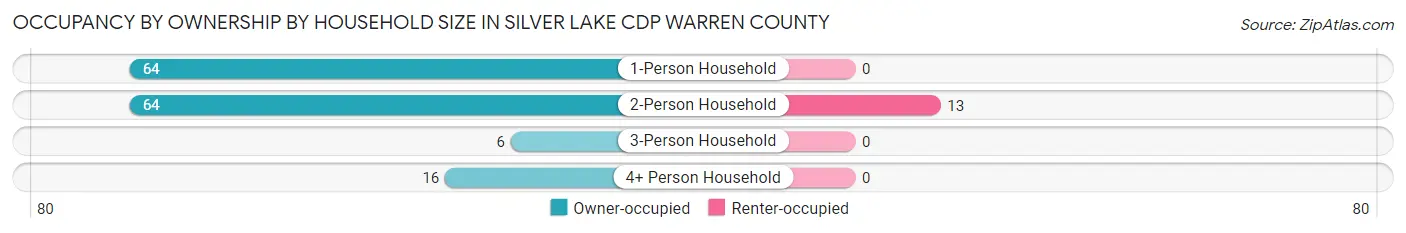
| Household Size | Owner-occupied | Renter-occupied |
| 1-Person Household | 64 (100.0%) | 0 (0.0%) |
| 2-Person Household | 64 (83.1%) | 13 (16.9%) |
| 3-Person Household | 6 (100.0%) | 0 (0.0%) |
| 4+ Person Household | 16 (100.0%) | 0 (0.0%) |
| Total Housing Units | 150 (92.0%) | 13 (8.0%) |
Occupancy by Educational Attainment in Silver Lake CDP Warren County
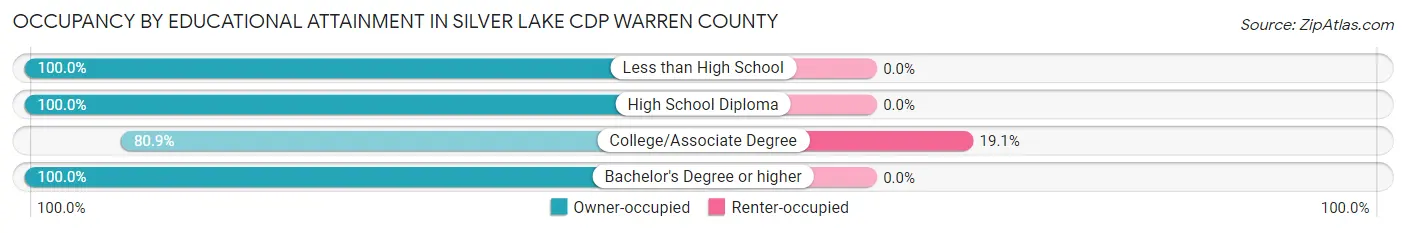
| Household Size | Owner-occupied | Renter-occupied |
| Less than High School | 4 (100.0%) | 0 (0.0%) |
| High School Diploma | 25 (100.0%) | 0 (0.0%) |
| College/Associate Degree | 55 (80.9%) | 13 (19.1%) |
| Bachelor's Degree or higher | 66 (100.0%) | 0 (0.0%) |
Occupancy by Age of Householder in Silver Lake CDP Warren County
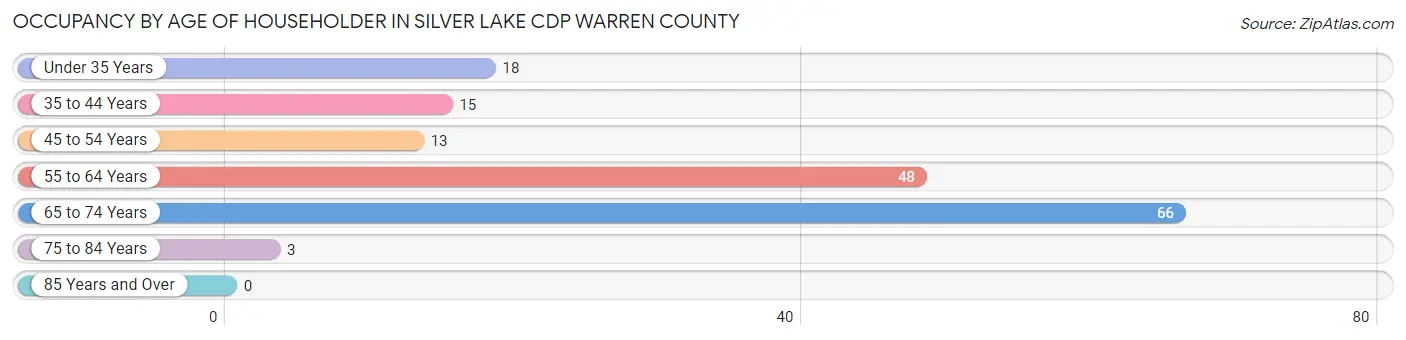
| Age Bracket | # Households | % Households |
| Under 35 Years | 18 | 11.0% |
| 35 to 44 Years | 15 | 9.2% |
| 45 to 54 Years | 13 | 8.0% |
| 55 to 64 Years | 48 | 29.4% |
| 65 to 74 Years | 66 | 40.5% |
| 75 to 84 Years | 3 | 1.8% |
| 85 Years and Over | 0 | 0.0% |
| Total | 163 | 100.0% |
Housing Finances in Silver Lake CDP Warren County
Median Income by Occupancy in Silver Lake CDP Warren County
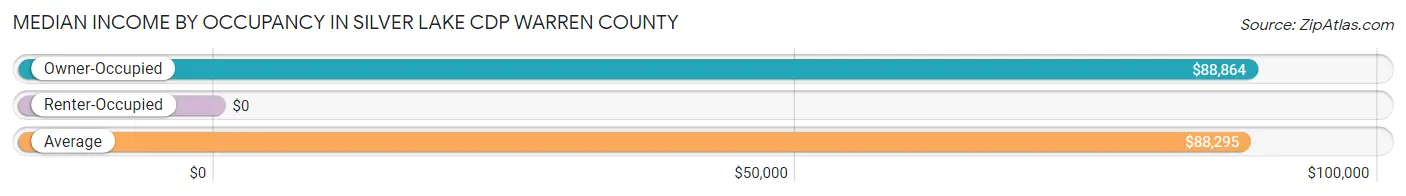
| Occupancy Type | # Households | Median Income |
| Owner-Occupied | 150 (92.0%) | $88,864 |
| Renter-Occupied | 13 (8.0%) | $0 |
| Average | 163 (100.0%) | $88,295 |
Occupancy by Householder Income Bracket in Silver Lake CDP Warren County
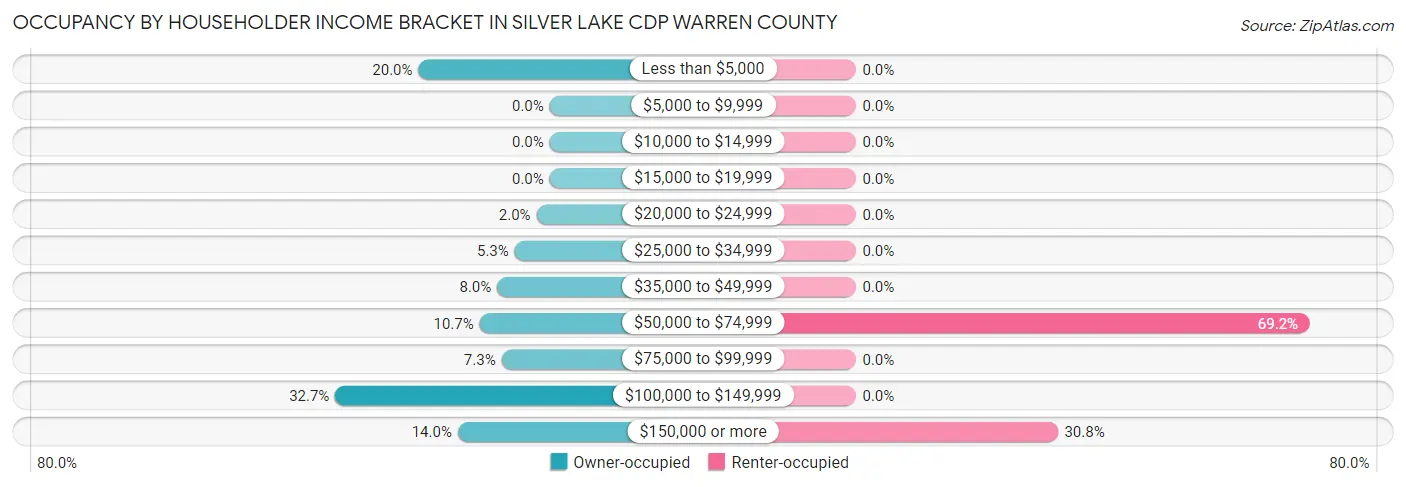
| Income Bracket | Owner-occupied | Renter-occupied |
| Less than $5,000 | 30 (20.0%) | 0 (0.0%) |
| $5,000 to $9,999 | 0 (0.0%) | 0 (0.0%) |
| $10,000 to $14,999 | 0 (0.0%) | 0 (0.0%) |
| $15,000 to $19,999 | 0 (0.0%) | 0 (0.0%) |
| $20,000 to $24,999 | 3 (2.0%) | 0 (0.0%) |
| $25,000 to $34,999 | 8 (5.3%) | 0 (0.0%) |
| $35,000 to $49,999 | 12 (8.0%) | 0 (0.0%) |
| $50,000 to $74,999 | 16 (10.7%) | 9 (69.2%) |
| $75,000 to $99,999 | 11 (7.3%) | 0 (0.0%) |
| $100,000 to $149,999 | 49 (32.7%) | 0 (0.0%) |
| $150,000 or more | 21 (14.0%) | 4 (30.8%) |
| Total | 150 (100.0%) | 13 (100.0%) |
Monthly Housing Cost Tiers in Silver Lake CDP Warren County
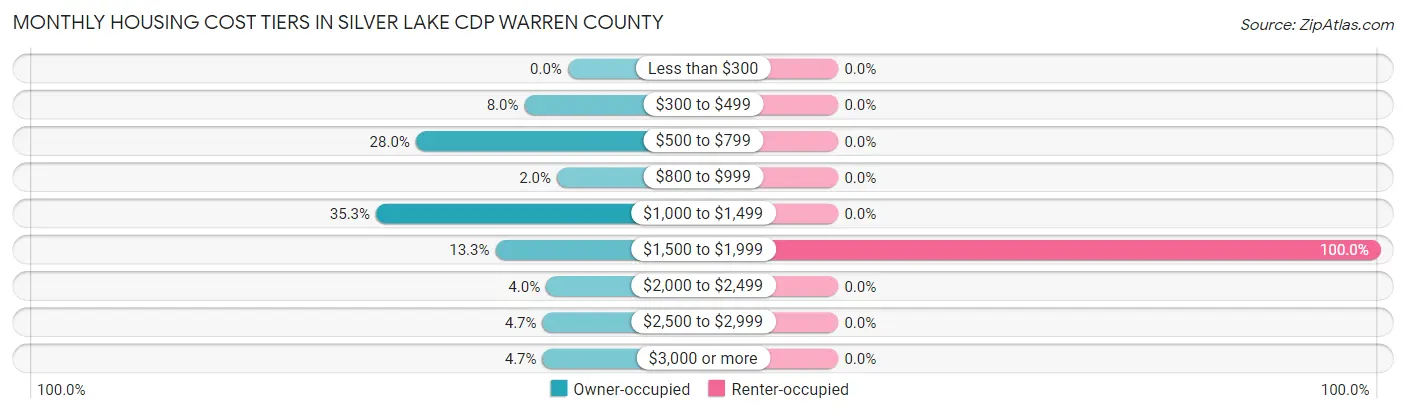
| Monthly Cost | Owner-occupied | Renter-occupied |
| Less than $300 | 0 (0.0%) | 0 (0.0%) |
| $300 to $499 | 12 (8.0%) | 0 (0.0%) |
| $500 to $799 | 42 (28.0%) | 0 (0.0%) |
| $800 to $999 | 3 (2.0%) | 0 (0.0%) |
| $1,000 to $1,499 | 53 (35.3%) | 0 (0.0%) |
| $1,500 to $1,999 | 20 (13.3%) | 13 (100.0%) |
| $2,000 to $2,499 | 6 (4.0%) | 0 (0.0%) |
| $2,500 to $2,999 | 7 (4.7%) | 0 (0.0%) |
| $3,000 or more | 7 (4.7%) | 0 (0.0%) |
| Total | 150 (100.0%) | 13 (100.0%) |
Physical Housing Characteristics in Silver Lake CDP Warren County
Housing Structures in Silver Lake CDP Warren County
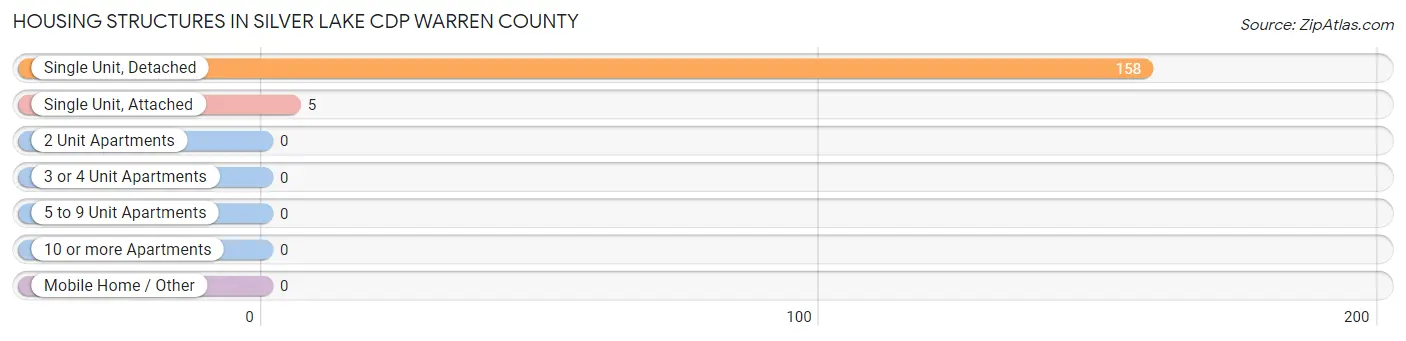
| Structure Type | # Housing Units | % Housing Units |
| Single Unit, Detached | 158 | 96.9% |
| Single Unit, Attached | 5 | 3.1% |
| 2 Unit Apartments | 0 | 0.0% |
| 3 or 4 Unit Apartments | 0 | 0.0% |
| 5 to 9 Unit Apartments | 0 | 0.0% |
| 10 or more Apartments | 0 | 0.0% |
| Mobile Home / Other | 0 | 0.0% |
| Total | 163 | 100.0% |
Housing Structures by Occupancy in Silver Lake CDP Warren County
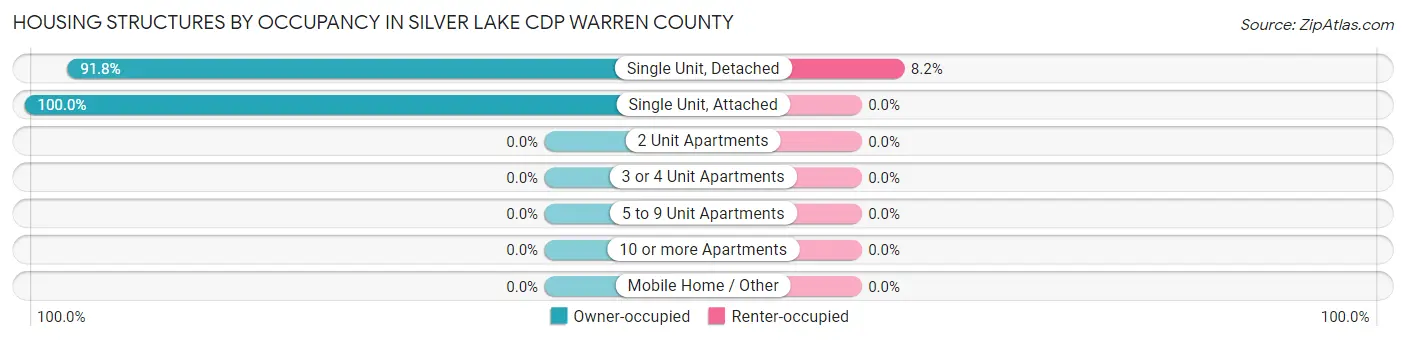
| Structure Type | Owner-occupied | Renter-occupied |
| Single Unit, Detached | 145 (91.8%) | 13 (8.2%) |
| Single Unit, Attached | 5 (100.0%) | 0 (0.0%) |
| 2 Unit Apartments | 0 (0.0%) | 0 (0.0%) |
| 3 or 4 Unit Apartments | 0 (0.0%) | 0 (0.0%) |
| 5 to 9 Unit Apartments | 0 (0.0%) | 0 (0.0%) |
| 10 or more Apartments | 0 (0.0%) | 0 (0.0%) |
| Mobile Home / Other | 0 (0.0%) | 0 (0.0%) |
| Total | 150 (92.0%) | 13 (8.0%) |
Housing Structures by Number of Rooms in Silver Lake CDP Warren County
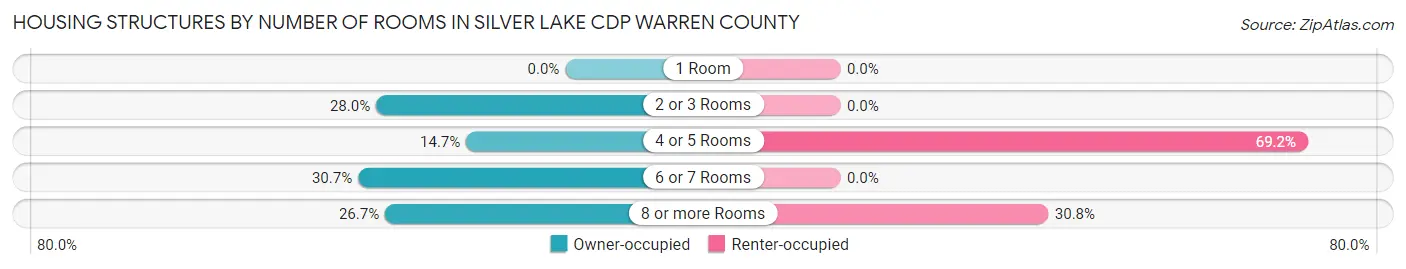
| Number of Rooms | Owner-occupied | Renter-occupied |
| 1 Room | 0 (0.0%) | 0 (0.0%) |
| 2 or 3 Rooms | 42 (28.0%) | 0 (0.0%) |
| 4 or 5 Rooms | 22 (14.7%) | 9 (69.2%) |
| 6 or 7 Rooms | 46 (30.7%) | 0 (0.0%) |
| 8 or more Rooms | 40 (26.7%) | 4 (30.8%) |
| Total | 150 (100.0%) | 13 (100.0%) |
Housing Structure by Heating Type in Silver Lake CDP Warren County
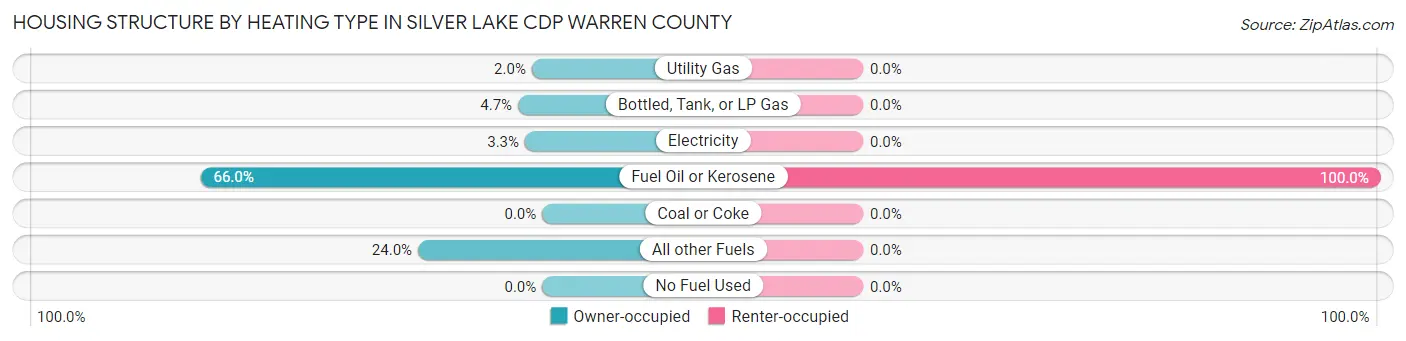
| Heating Type | Owner-occupied | Renter-occupied |
| Utility Gas | 3 (2.0%) | 0 (0.0%) |
| Bottled, Tank, or LP Gas | 7 (4.7%) | 0 (0.0%) |
| Electricity | 5 (3.3%) | 0 (0.0%) |
| Fuel Oil or Kerosene | 99 (66.0%) | 13 (100.0%) |
| Coal or Coke | 0 (0.0%) | 0 (0.0%) |
| All other Fuels | 36 (24.0%) | 0 (0.0%) |
| No Fuel Used | 0 (0.0%) | 0 (0.0%) |
| Total | 150 (100.0%) | 13 (100.0%) |
Household Vehicle Usage in Silver Lake CDP Warren County
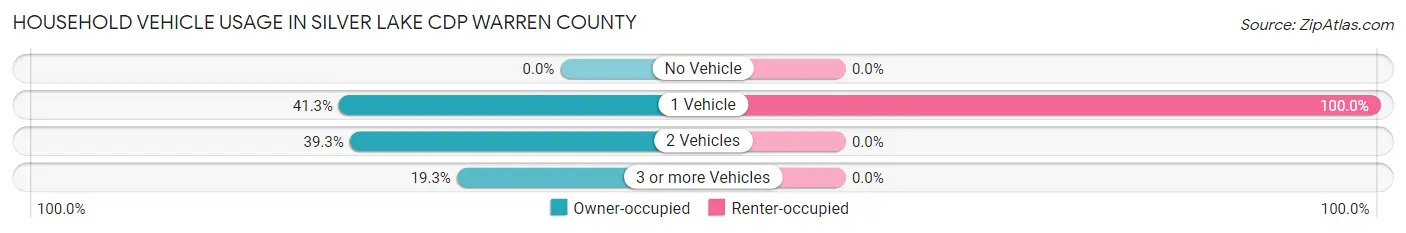
| Vehicles per Household | Owner-occupied | Renter-occupied |
| No Vehicle | 0 (0.0%) | 0 (0.0%) |
| 1 Vehicle | 62 (41.3%) | 13 (100.0%) |
| 2 Vehicles | 59 (39.3%) | 0 (0.0%) |
| 3 or more Vehicles | 29 (19.3%) | 0 (0.0%) |
| Total | 150 (100.0%) | 13 (100.0%) |
Real Estate & Mortgages in Silver Lake CDP Warren County
Real Estate and Mortgage Overview in Silver Lake CDP Warren County
| Characteristic | Without Mortgage | With Mortgage |
| Housing Units | 102 | 48 |
| Median Property Value | $221,400 | $275,000 |
| Median Household Income | $88,636 | $12 |
| Monthly Housing Costs | $725 | $7 |
| Real Estate Taxes | $4,500 | $0 |
Property Value by Mortgage Status in Silver Lake CDP Warren County
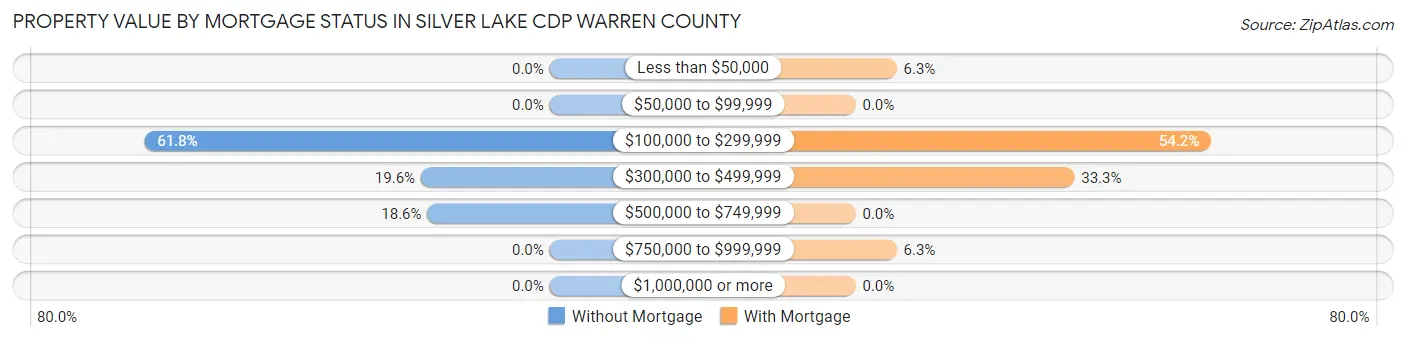
| Property Value | Without Mortgage | With Mortgage |
| Less than $50,000 | 0 (0.0%) | 3 (6.2%) |
| $50,000 to $99,999 | 0 (0.0%) | 0 (0.0%) |
| $100,000 to $299,999 | 63 (61.8%) | 26 (54.2%) |
| $300,000 to $499,999 | 20 (19.6%) | 16 (33.3%) |
| $500,000 to $749,999 | 19 (18.6%) | 0 (0.0%) |
| $750,000 to $999,999 | 0 (0.0%) | 3 (6.2%) |
| $1,000,000 or more | 0 (0.0%) | 0 (0.0%) |
| Total | 102 (100.0%) | 48 (100.0%) |
Household Income by Mortgage Status in Silver Lake CDP Warren County
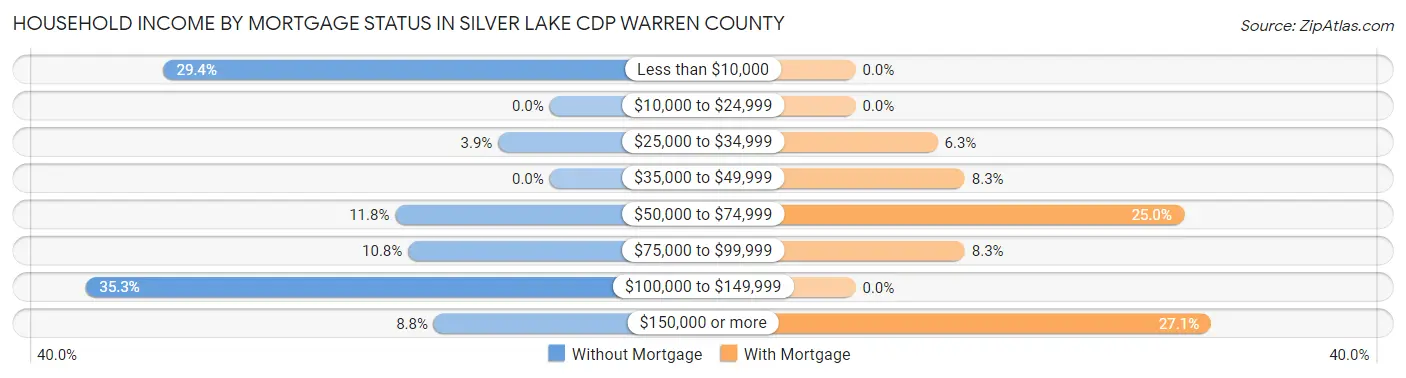
| Household Income | Without Mortgage | With Mortgage |
| Less than $10,000 | 30 (29.4%) | 0 (0.0%) |
| $10,000 to $24,999 | 0 (0.0%) | 0 (0.0%) |
| $25,000 to $34,999 | 4 (3.9%) | 3 (6.2%) |
| $35,000 to $49,999 | 0 (0.0%) | 4 (8.3%) |
| $50,000 to $74,999 | 12 (11.8%) | 12 (25.0%) |
| $75,000 to $99,999 | 11 (10.8%) | 4 (8.3%) |
| $100,000 to $149,999 | 36 (35.3%) | 0 (0.0%) |
| $150,000 or more | 9 (8.8%) | 13 (27.1%) |
| Total | 102 (100.0%) | 48 (100.0%) |
Property Value to Household Income Ratio in Silver Lake CDP Warren County
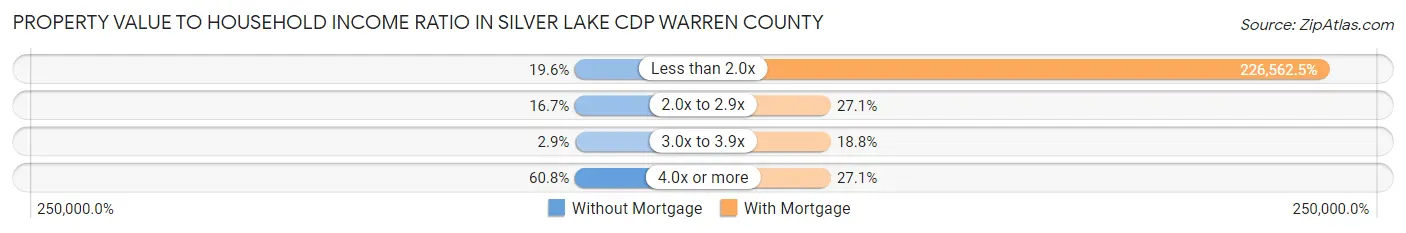
| Value-to-Income Ratio | Without Mortgage | With Mortgage |
| Less than 2.0x | 20 (19.6%) | 108,750 (226,562.5%) |
| 2.0x to 2.9x | 17 (16.7%) | 13 (27.1%) |
| 3.0x to 3.9x | 3 (2.9%) | 9 (18.8%) |
| 4.0x or more | 62 (60.8%) | 13 (27.1%) |
| Total | 102 (100.0%) | 48 (100.0%) |
Real Estate Taxes by Mortgage Status in Silver Lake CDP Warren County
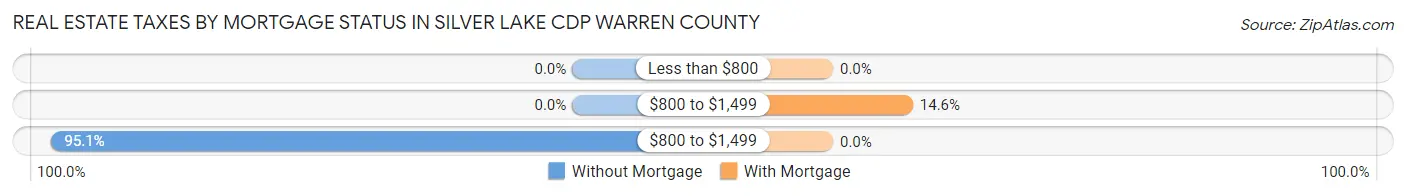
| Property Taxes | Without Mortgage | With Mortgage |
| Less than $800 | 0 (0.0%) | 0 (0.0%) |
| $800 to $1,499 | 0 (0.0%) | 7 (14.6%) |
| $800 to $1,499 | 97 (95.1%) | 0 (0.0%) |
| Total | 102 (100.0%) | 48 (100.0%) |
Health & Disability in Silver Lake CDP Warren County
Health Insurance Coverage by Age in Silver Lake CDP Warren County
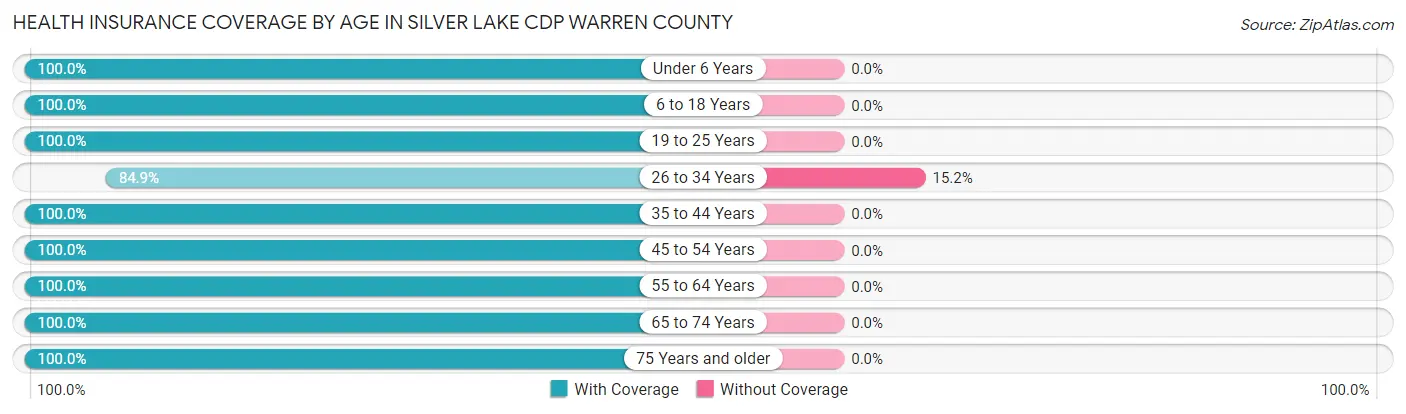
| Age Bracket | With Coverage | Without Coverage |
| Under 6 Years | 19 (100.0%) | 0 (0.0%) |
| 6 to 18 Years | 31 (100.0%) | 0 (0.0%) |
| 19 to 25 Years | 17 (100.0%) | 0 (0.0%) |
| 26 to 34 Years | 28 (84.9%) | 5 (15.1%) |
| 35 to 44 Years | 36 (100.0%) | 0 (0.0%) |
| 45 to 54 Years | 24 (100.0%) | 0 (0.0%) |
| 55 to 64 Years | 56 (100.0%) | 0 (0.0%) |
| 65 to 74 Years | 96 (100.0%) | 0 (0.0%) |
| 75 Years and older | 12 (100.0%) | 0 (0.0%) |
| Total | 319 (98.5%) | 5 (1.5%) |
Health Insurance Coverage by Citizenship Status in Silver Lake CDP Warren County
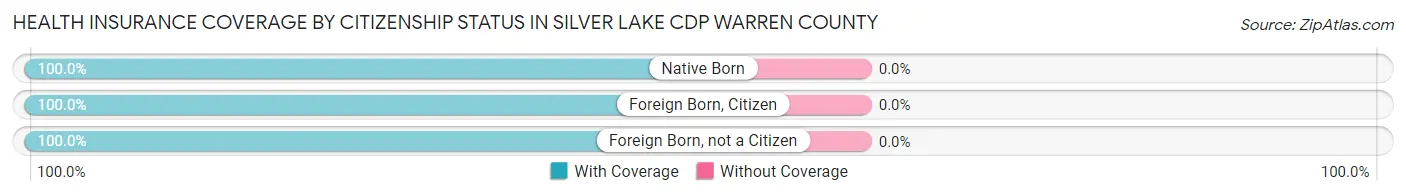
| Citizenship Status | With Coverage | Without Coverage |
| Native Born | 19 (100.0%) | 0 (0.0%) |
| Foreign Born, Citizen | 31 (100.0%) | 0 (0.0%) |
| Foreign Born, not a Citizen | 17 (100.0%) | 0 (0.0%) |
Health Insurance Coverage by Household Income in Silver Lake CDP Warren County
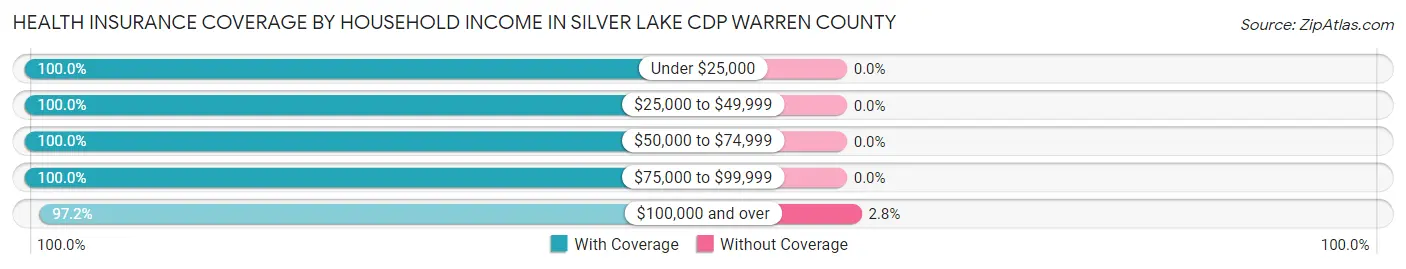
| Household Income | With Coverage | Without Coverage |
| Under $25,000 | 33 (100.0%) | 0 (0.0%) |
| $25,000 to $49,999 | 56 (100.0%) | 0 (0.0%) |
| $50,000 to $74,999 | 40 (100.0%) | 0 (0.0%) |
| $75,000 to $99,999 | 11 (100.0%) | 0 (0.0%) |
| $100,000 and over | 176 (97.2%) | 5 (2.8%) |
Public vs Private Health Insurance Coverage by Age in Silver Lake CDP Warren County
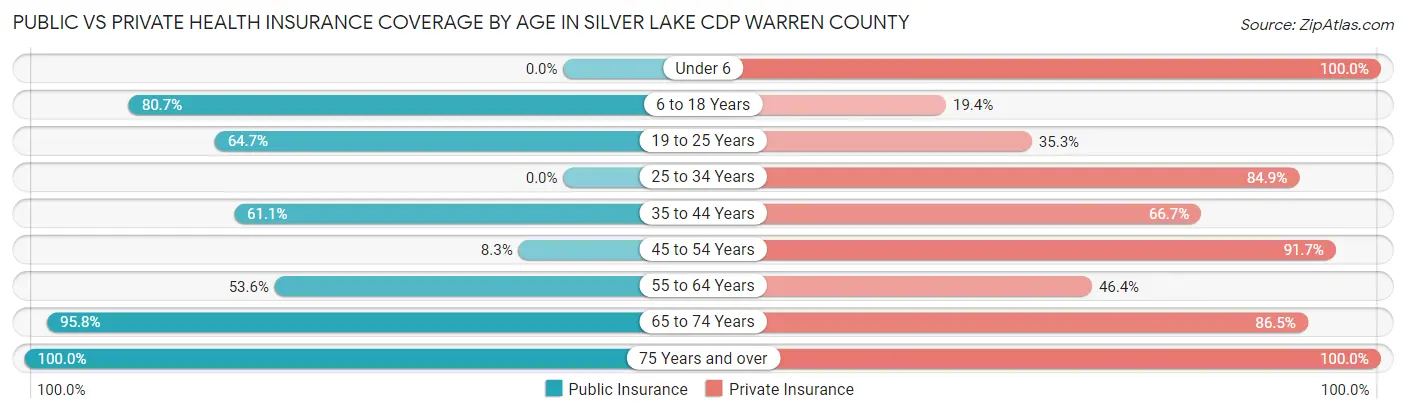
| Age Bracket | Public Insurance | Private Insurance |
| Under 6 | 0 (0.0%) | 19 (100.0%) |
| 6 to 18 Years | 25 (80.6%) | 6 (19.4%) |
| 19 to 25 Years | 11 (64.7%) | 6 (35.3%) |
| 25 to 34 Years | 0 (0.0%) | 28 (84.9%) |
| 35 to 44 Years | 22 (61.1%) | 24 (66.7%) |
| 45 to 54 Years | 2 (8.3%) | 22 (91.7%) |
| 55 to 64 Years | 30 (53.6%) | 26 (46.4%) |
| 65 to 74 Years | 92 (95.8%) | 83 (86.5%) |
| 75 Years and over | 12 (100.0%) | 12 (100.0%) |
| Total | 194 (59.9%) | 226 (69.8%) |
Disability Status by Sex by Age in Silver Lake CDP Warren County
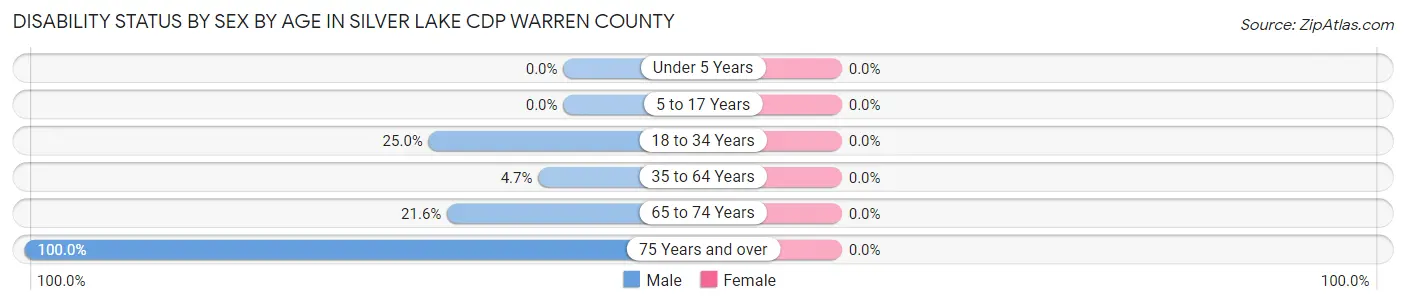
| Age Bracket | Male | Female |
| Under 5 Years | 0 (0.0%) | 0 (0.0%) |
| 5 to 17 Years | 0 (0.0%) | 0 (0.0%) |
| 18 to 34 Years | 11 (25.0%) | 0 (0.0%) |
| 35 to 64 Years | 2 (4.6%) | 0 (0.0%) |
| 65 to 74 Years | 11 (21.6%) | 0 (0.0%) |
| 75 Years and over | 9 (100.0%) | 0 (0.0%) |
Disability Class by Sex by Age in Silver Lake CDP Warren County
Disability Class: Hearing Difficulty
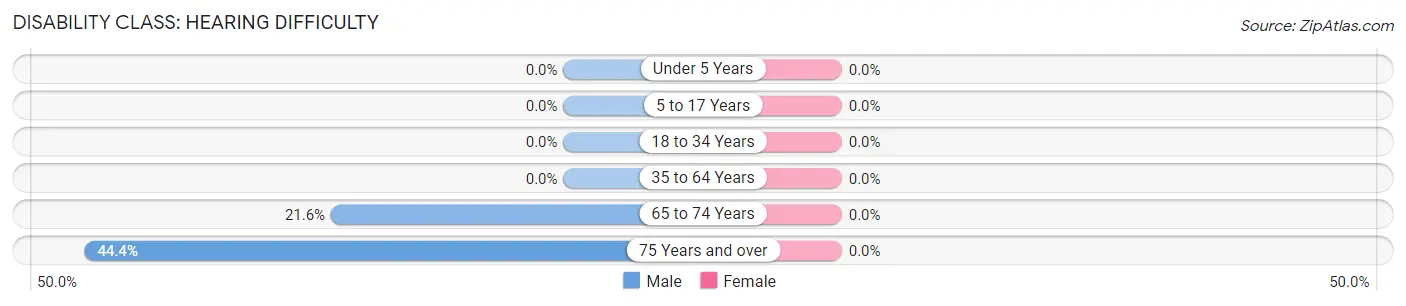
| Age Bracket | Male | Female |
| Under 5 Years | 0 (0.0%) | 0 (0.0%) |
| 5 to 17 Years | 0 (0.0%) | 0 (0.0%) |
| 18 to 34 Years | 0 (0.0%) | 0 (0.0%) |
| 35 to 64 Years | 0 (0.0%) | 0 (0.0%) |
| 65 to 74 Years | 11 (21.6%) | 0 (0.0%) |
| 75 Years and over | 4 (44.4%) | 0 (0.0%) |
Disability Class: Vision Difficulty
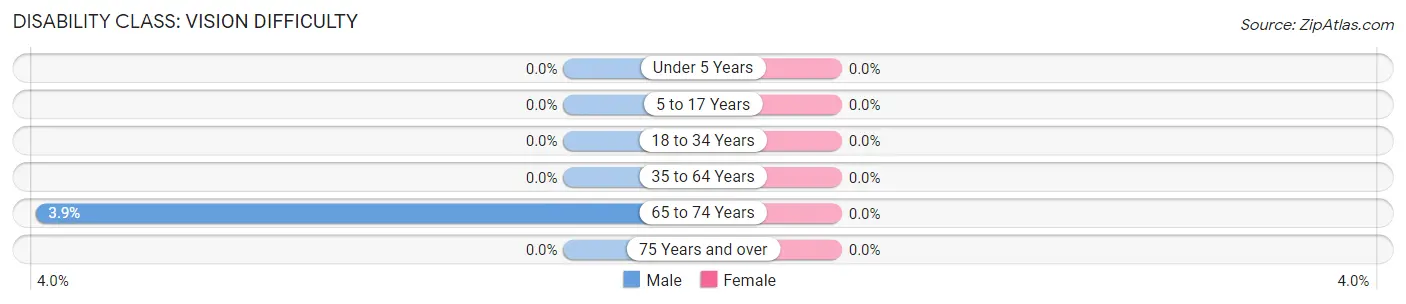
| Age Bracket | Male | Female |
| Under 5 Years | 0 (0.0%) | 0 (0.0%) |
| 5 to 17 Years | 0 (0.0%) | 0 (0.0%) |
| 18 to 34 Years | 0 (0.0%) | 0 (0.0%) |
| 35 to 64 Years | 0 (0.0%) | 0 (0.0%) |
| 65 to 74 Years | 2 (3.9%) | 0 (0.0%) |
| 75 Years and over | 0 (0.0%) | 0 (0.0%) |
Disability Class: Cognitive Difficulty
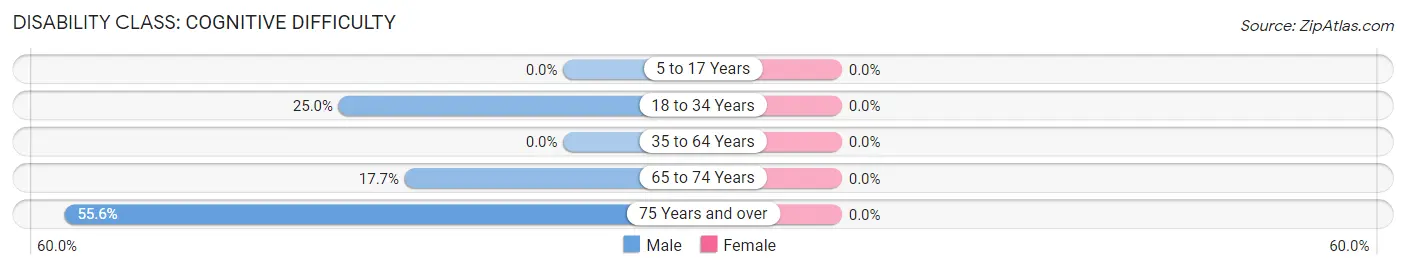
| Age Bracket | Male | Female |
| 5 to 17 Years | 0 (0.0%) | 0 (0.0%) |
| 18 to 34 Years | 11 (25.0%) | 0 (0.0%) |
| 35 to 64 Years | 0 (0.0%) | 0 (0.0%) |
| 65 to 74 Years | 9 (17.6%) | 0 (0.0%) |
| 75 Years and over | 5 (55.6%) | 0 (0.0%) |
Disability Class: Ambulatory Difficulty
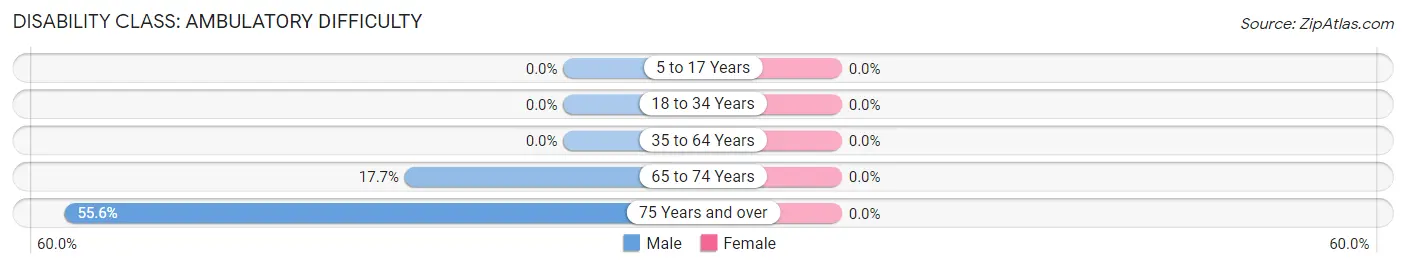
| Age Bracket | Male | Female |
| 5 to 17 Years | 0 (0.0%) | 0 (0.0%) |
| 18 to 34 Years | 0 (0.0%) | 0 (0.0%) |
| 35 to 64 Years | 0 (0.0%) | 0 (0.0%) |
| 65 to 74 Years | 9 (17.6%) | 0 (0.0%) |
| 75 Years and over | 5 (55.6%) | 0 (0.0%) |
Disability Class: Self-Care Difficulty
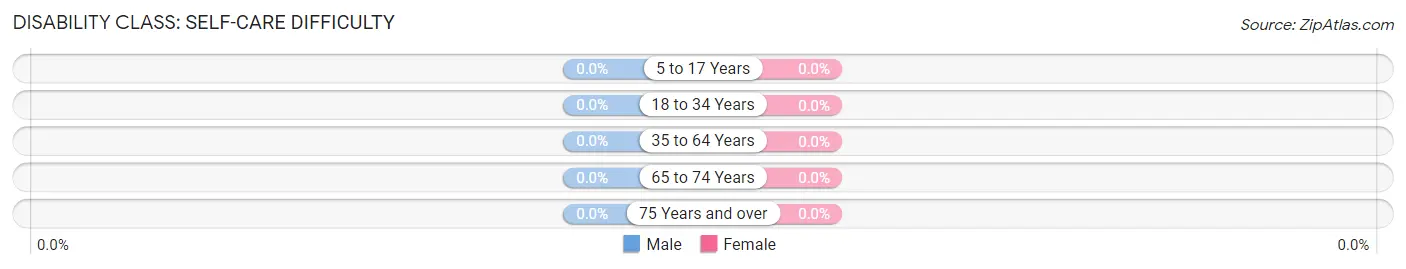
| Age Bracket | Male | Female |
| 5 to 17 Years | 0 (0.0%) | 0 (0.0%) |
| 18 to 34 Years | 0 (0.0%) | 0 (0.0%) |
| 35 to 64 Years | 0 (0.0%) | 0 (0.0%) |
| 65 to 74 Years | 0 (0.0%) | 0 (0.0%) |
| 75 Years and over | 0 (0.0%) | 0 (0.0%) |
Technology Access in Silver Lake CDP Warren County
Computing Device Access in Silver Lake CDP Warren County
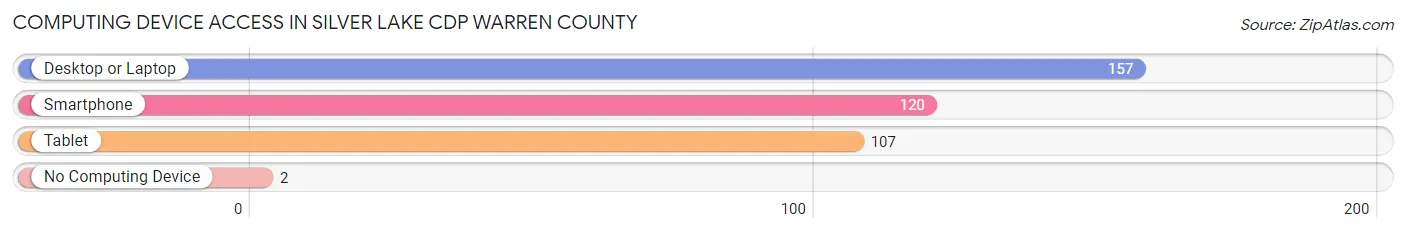
| Device Type | # Households | % Households |
| Desktop or Laptop | 157 | 96.3% |
| Smartphone | 120 | 73.6% |
| Tablet | 107 | 65.6% |
| No Computing Device | 2 | 1.2% |
| Total | 163 | 100.0% |
Internet Access in Silver Lake CDP Warren County
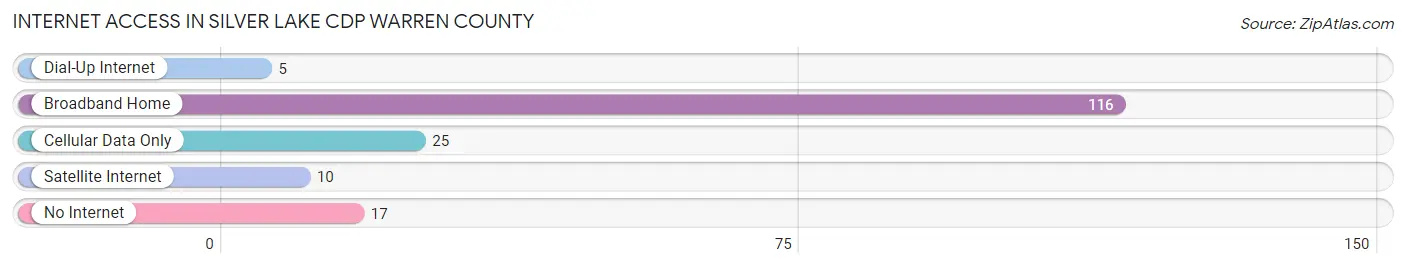
| Internet Type | # Households | % Households |
| Dial-Up Internet | 5 | 3.1% |
| Broadband Home | 116 | 71.2% |
| Cellular Data Only | 25 | 15.3% |
| Satellite Internet | 10 | 6.1% |
| No Internet | 17 | 10.4% |
| Total | 163 | 100.0% |
Silver Lake CDP Warren County Summary
Introduction
Silver Lake Cdp is a census-designated place (CDP) located in Warren County, New Jersey. It is located in the eastern part of the state, and is part of the larger New York metropolitan area. The CDP has a population of approximately 1,400 people, and is a small, rural community. The area is known for its natural beauty, and is home to a variety of outdoor activities.
History
Silver Lake Cdp was first settled in the late 1700s by Dutch and German immigrants. The area was originally known as “Silver Lake” due to the abundance of silver ore in the area. The area was primarily used for farming and logging, and the population remained relatively small until the mid-1800s. In the late 1800s, the area began to experience a population boom as more people moved to the area to take advantage of the area’s natural resources.
The area was officially incorporated as a CDP in 1950. Since then, the population has grown steadily, and the area has become a popular destination for outdoor recreation. The area is home to a variety of parks and trails, and is a popular destination for fishing, hunting, and camping.
Geography
Silver Lake Cdp is located in Warren County, New Jersey. It is located in the eastern part of the state, and is part of the larger New York metropolitan area. The CDP is situated in a rural area, and is surrounded by forests and rolling hills. The area is known for its natural beauty, and is home to a variety of outdoor activities.
The area is located near the Delaware River, and is home to a variety of wildlife. The area is also home to a variety of plant and animal species, including deer, foxes, and a variety of birds.
Economy
Silver Lake Cdp is a small, rural community, and the economy is largely based on agriculture and tourism. The area is home to a variety of farms, and the area is known for its production of dairy products, fruits, and vegetables. The area is also home to a variety of small businesses, including restaurants, shops, and other services.
The area is also a popular destination for outdoor recreation, and the area is home to a variety of parks and trails. The area is also home to a variety of fishing, hunting, and camping opportunities.
Demographics
As of the 2010 census, Silver Lake Cdp had a population of 1,400 people. The population is primarily white (94.3%), with a small percentage of African Americans (2.3%) and Hispanics (2.3%). The median household income is $50,000, and the median age is 44.
Conclusion
Silver Lake Cdp is a small, rural community located in Warren County, New Jersey. The area is known for its natural beauty, and is home to a variety of outdoor activities. The area is primarily white, and the median household income is $50,000. The area is home to a variety of farms, and is a popular destination for outdoor recreation.
Common Questions
What is Per Capita Income in Silver Lake CDP Warren County?
Per Capita income in Silver Lake CDP Warren County is $48,937.
What is the Median Family Income in Silver Lake CDP Warren County?
Median Family Income in Silver Lake CDP Warren County is $115,313.
What is the Median Household income in Silver Lake CDP Warren County?
Median Household Income in Silver Lake CDP Warren County is $88,295.
What is Income or Wage Gap in Silver Lake CDP Warren County?
Income or Wage Gap in Silver Lake CDP Warren County is 25.7%.
Women in Silver Lake CDP Warren County earn 74.3 cents for every dollar earned by a man.
What is Inequality or Gini Index in Silver Lake CDP Warren County?
Inequality or Gini Index in Silver Lake CDP Warren County is 0.44.
What is the Total Population of Silver Lake CDP Warren County?
Total Population of Silver Lake CDP Warren County is 324.
What is the Total Male Population of Silver Lake CDP Warren County?
Total Male Population of Silver Lake CDP Warren County is 166.
What is the Total Female Population of Silver Lake CDP Warren County?
Total Female Population of Silver Lake CDP Warren County is 158.
What is the Ratio of Males per 100 Females in Silver Lake CDP Warren County?
There are 105.06 Males per 100 Females in Silver Lake CDP Warren County.
What is the Ratio of Females per 100 Males in Silver Lake CDP Warren County?
There are 95.18 Females per 100 Males in Silver Lake CDP Warren County.
What is the Median Population Age in Silver Lake CDP Warren County?
Median Population Age in Silver Lake CDP Warren County is 55.5 Years.
What is the Average Family Size in Silver Lake CDP Warren County
Average Family Size in Silver Lake CDP Warren County is 2.5 People.
What is the Average Household Size in Silver Lake CDP Warren County
Average Household Size in Silver Lake CDP Warren County is 2.0 People.
How Large is the Labor Force in Silver Lake CDP Warren County?
There are 179 People in the Labor Forcein in Silver Lake CDP Warren County.
What is the Percentage of People in the Labor Force in Silver Lake CDP Warren County?
64.4% of People are in the Labor Force in Silver Lake CDP Warren County.
What is the Unemployment Rate in Silver Lake CDP Warren County?
Unemployment Rate in Silver Lake CDP Warren County is 7.8%.