Vernon Valley, NJ Map & Demographics
Vernon Valley Map

Vernon Valley Overview
$52,895
PER CAPITA INCOME
$127,679
AVG FAMILY INCOME
$126,250
AVG HOUSEHOLD INCOME
58.0%
WAGE / INCOME GAP [ % ]
42.0¢/ $1
WAGE / INCOME GAP [ $ ]
0.29
INEQUALITY / GINI INDEX
1,084
TOTAL POPULATION
518
MALE POPULATION
566
FEMALE POPULATION
91.52
MALES / 100 FEMALES
109.27
FEMALES / 100 MALES
57.6
MEDIAN AGE
2.5
AVG FAMILY SIZE
2.5
AVG HOUSEHOLD SIZE
713
LABOR FORCE [ PEOPLE ]
69.3%
PERCENT IN LABOR FORCE
3.5%
UNEMPLOYMENT RATE
Income in Vernon Valley
Income Overview in Vernon Valley
Per Capita Income in Vernon Valley is $52,895, while median incomes of families and households are $127,679 and $126,250 respectively.
| Characteristic | Number | Measure |
| Per Capita Income | 1,084 | $52,895 |
| Median Family Income | 402 | $127,679 |
| Mean Family Income | 402 | $135,449 |
| Median Household Income | 436 | $126,250 |
| Mean Household Income | 436 | $130,168 |
| Income Deficit | 402 | $0 |
| Wage / Income Gap (%) | 1,084 | 57.97% |
| Wage / Income Gap ($) | 1,084 | 42.03¢ per $1 |
| Gini / Inequality Index | 1,084 | 0.29 |
Earnings by Sex in Vernon Valley
Average Earnings in Vernon Valley are $64,674, $77,585 for men and $32,607 for women, a difference of 58.0%.
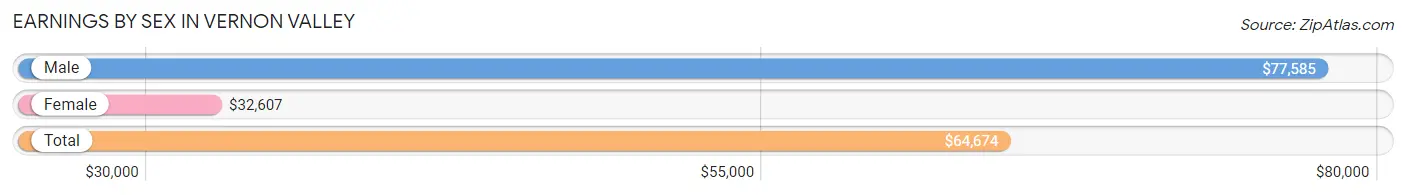
| Sex | Number | Average Earnings |
| Male | 381 (53.2%) | $77,585 |
| Female | 335 (46.8%) | $32,607 |
| Total | 716 (100.0%) | $64,674 |
Earnings by Sex by Income Bracket in Vernon Valley
The most common earnings brackets in Vernon Valley are $75,000 to $99,999 for men (126 | 33.1%) and $30,000 to $34,999 for women (66 | 19.7%).
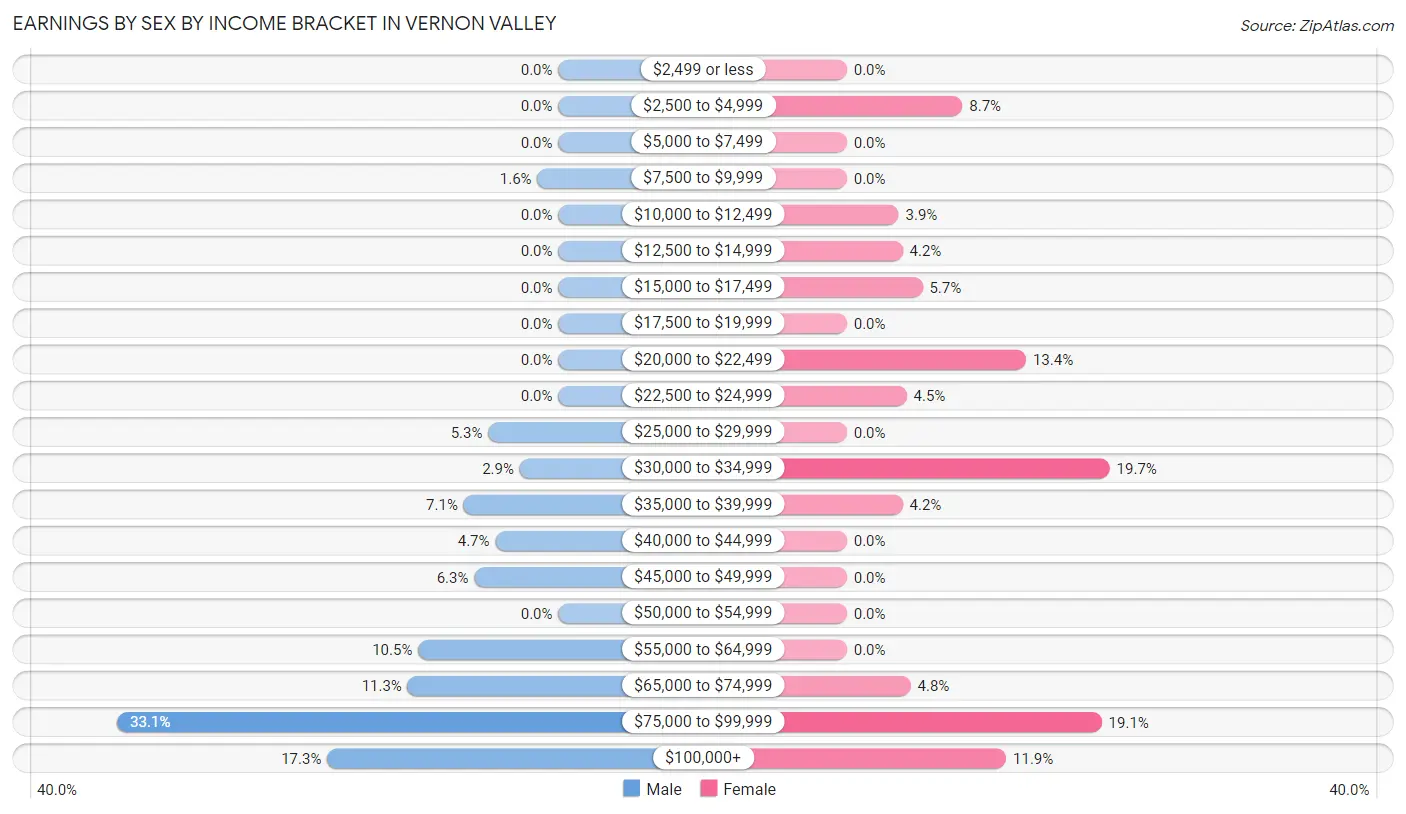
| Income | Male | Female |
| $2,499 or less | 0 (0.0%) | 0 (0.0%) |
| $2,500 to $4,999 | 0 (0.0%) | 29 (8.7%) |
| $5,000 to $7,499 | 0 (0.0%) | 0 (0.0%) |
| $7,500 to $9,999 | 6 (1.6%) | 0 (0.0%) |
| $10,000 to $12,499 | 0 (0.0%) | 13 (3.9%) |
| $12,500 to $14,999 | 0 (0.0%) | 14 (4.2%) |
| $15,000 to $17,499 | 0 (0.0%) | 19 (5.7%) |
| $17,500 to $19,999 | 0 (0.0%) | 0 (0.0%) |
| $20,000 to $22,499 | 0 (0.0%) | 45 (13.4%) |
| $22,500 to $24,999 | 0 (0.0%) | 15 (4.5%) |
| $25,000 to $29,999 | 20 (5.2%) | 0 (0.0%) |
| $30,000 to $34,999 | 11 (2.9%) | 66 (19.7%) |
| $35,000 to $39,999 | 27 (7.1%) | 14 (4.2%) |
| $40,000 to $44,999 | 18 (4.7%) | 0 (0.0%) |
| $45,000 to $49,999 | 24 (6.3%) | 0 (0.0%) |
| $50,000 to $54,999 | 0 (0.0%) | 0 (0.0%) |
| $55,000 to $64,999 | 40 (10.5%) | 0 (0.0%) |
| $65,000 to $74,999 | 43 (11.3%) | 16 (4.8%) |
| $75,000 to $99,999 | 126 (33.1%) | 64 (19.1%) |
| $100,000+ | 66 (17.3%) | 40 (11.9%) |
| Total | 381 (100.0%) | 335 (100.0%) |
Earnings by Sex by Educational Attainment in Vernon Valley
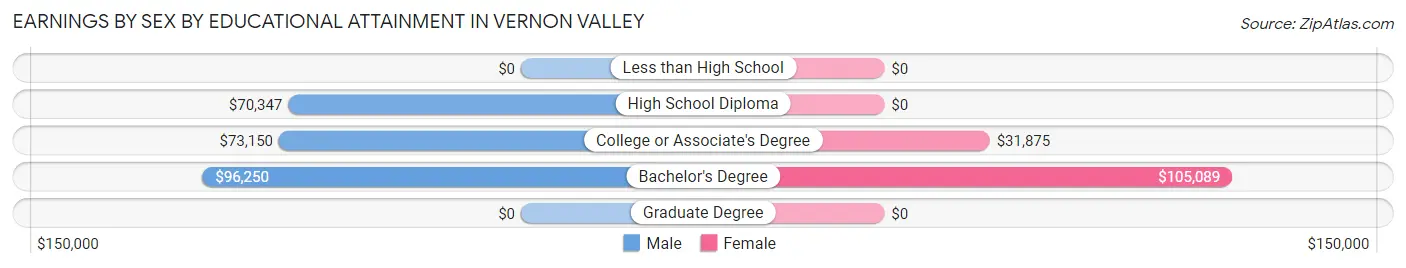
| Educational Attainment | Male Income | Female Income |
| Less than High School | - | - |
| High School Diploma | $70,347 | $0 |
| College or Associate's Degree | $73,150 | $31,875 |
| Bachelor's Degree | $96,250 | $105,089 |
| Graduate Degree | - | - |
| Total | $78,523 | $0 |
Family Income in Vernon Valley
Family Income Brackets in Vernon Valley
According to the Vernon Valley family income data, there are 99 families falling into the $50,000 to $74,999 income range, which is the most common income bracket and makes up 24.6% of all families.
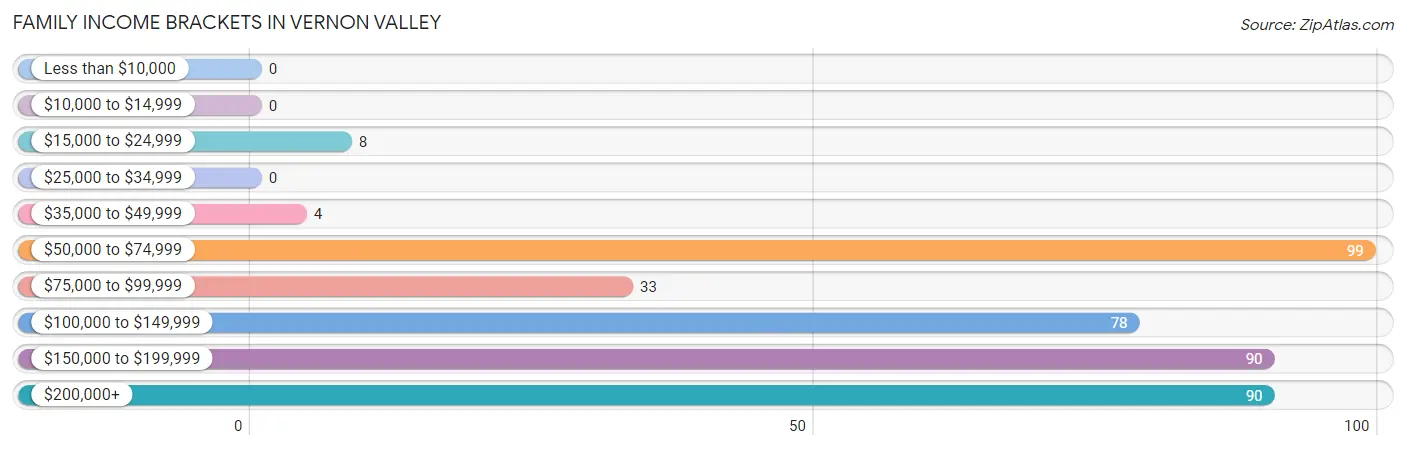
| Income Bracket | # Families | % Families |
| Less than $10,000 | 0 | 0.0% |
| $10,000 to $14,999 | 0 | 0.0% |
| $15,000 to $24,999 | 8 | 2.0% |
| $25,000 to $34,999 | 0 | 0.0% |
| $35,000 to $49,999 | 4 | 1.0% |
| $50,000 to $74,999 | 99 | 24.6% |
| $75,000 to $99,999 | 33 | 8.2% |
| $100,000 to $149,999 | 78 | 19.4% |
| $150,000 to $199,999 | 90 | 22.4% |
| $200,000+ | 90 | 22.4% |
Family Income by Famaliy Size in Vernon Valley
3-person families (27 | 6.7%) account for the highest median family income in Vernon Valley with $201,458 per family, while 3-person families (27 | 6.7%) have the highest median income of $67,153 per family member.
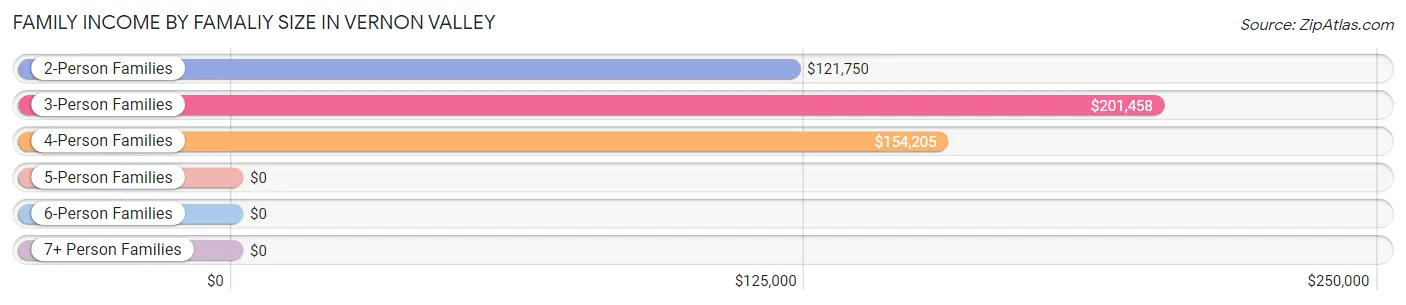
| Income Bracket | # Families | Median Income |
| 2-Person Families | 303 (75.4%) | $121,750 |
| 3-Person Families | 27 (6.7%) | $201,458 |
| 4-Person Families | 57 (14.2%) | $154,205 |
| 5-Person Families | 15 (3.7%) | $0 |
| 6-Person Families | 0 (0.0%) | $0 |
| 7+ Person Families | 0 (0.0%) | $0 |
| Total | 402 (100.0%) | $127,679 |
Family Income by Number of Earners in Vernon Valley
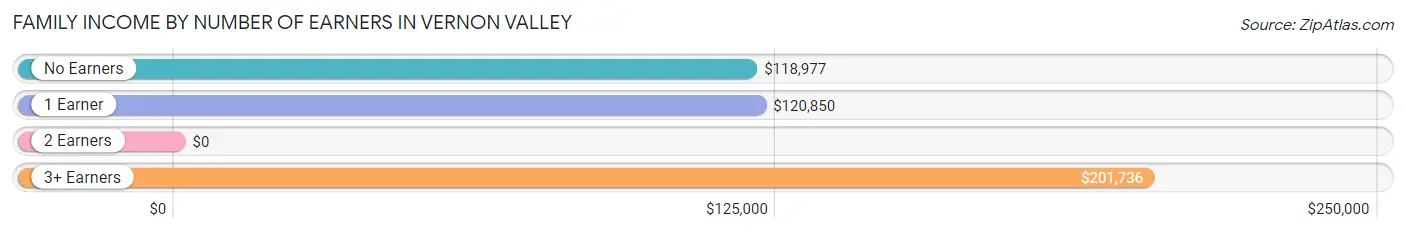
| Number of Earners | # Families | Median Income |
| No Earners | 75 (18.7%) | $118,977 |
| 1 Earner | 137 (34.1%) | $120,850 |
| 2 Earners | 115 (28.6%) | $0 |
| 3+ Earners | 75 (18.7%) | $201,736 |
| Total | 402 (100.0%) | $127,679 |
Household Income in Vernon Valley
Household Income Brackets in Vernon Valley
With 104 households falling in the category, the $100,000 to $149,999 income range is the most frequent in Vernon Valley, accounting for 23.8% of all households.
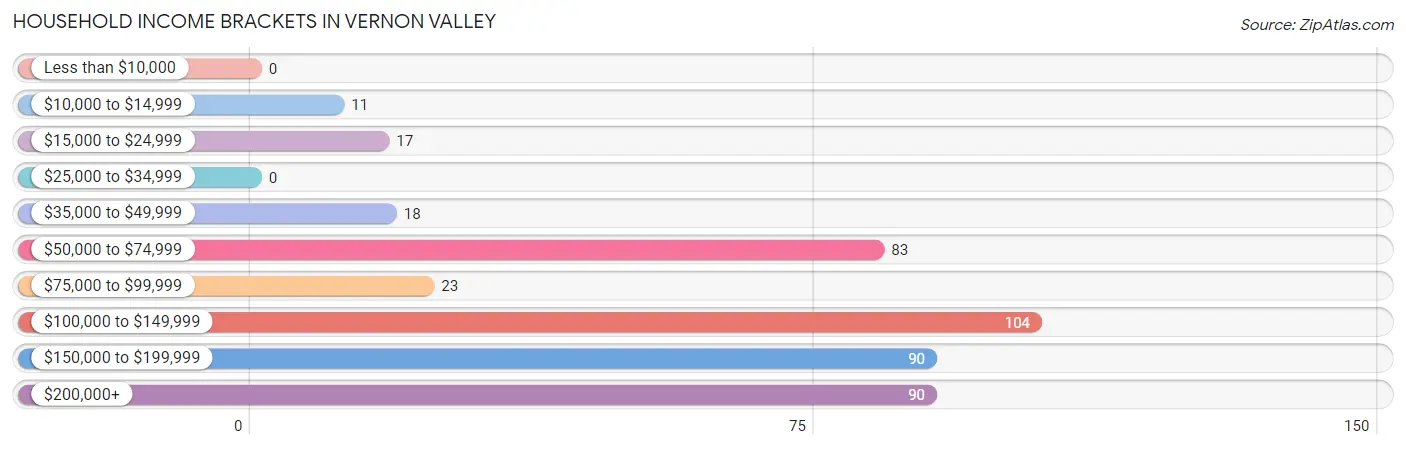
| Income Bracket | # Households | % Households |
| Less than $10,000 | 0 | 0.0% |
| $10,000 to $14,999 | 11 | 2.5% |
| $15,000 to $24,999 | 17 | 3.9% |
| $25,000 to $34,999 | 0 | 0.0% |
| $35,000 to $49,999 | 18 | 4.1% |
| $50,000 to $74,999 | 83 | 19.0% |
| $75,000 to $99,999 | 23 | 5.3% |
| $100,000 to $149,999 | 104 | 23.9% |
| $150,000 to $199,999 | 90 | 20.6% |
| $200,000+ | 90 | 20.6% |
Household Income by Householder Age in Vernon Valley
The median household income in Vernon Valley is $126,250, with the highest median household income of $124,875 found in the 45 to 64 years age bracket for the primary householder. A total of 252 households (57.8%) fall into this category.
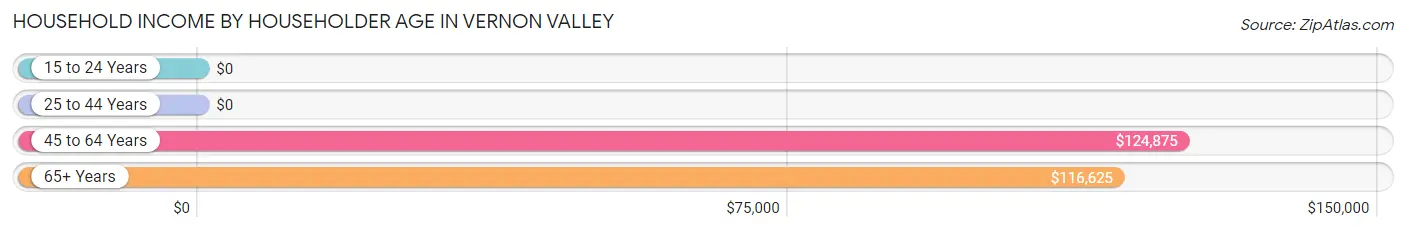
| Income Bracket | # Households | Median Income |
| 15 to 24 Years | 0 (0.0%) | $0 |
| 25 to 44 Years | 31 (7.1%) | $0 |
| 45 to 64 Years | 252 (57.8%) | $124,875 |
| 65+ Years | 153 (35.1%) | $116,625 |
| Total | 436 (100.0%) | $126,250 |
Poverty in Vernon Valley
Income Below Poverty by Sex and Age in Vernon Valley
With 1.2% poverty level for males and 3.3% for females among the residents of Vernon Valley, 18 to 24 year old males and 65 to 74 year old females are the most vulnerable to poverty, with 6 males (18.2%) and 11 females (10.1%) in their respective age groups living below the poverty level.
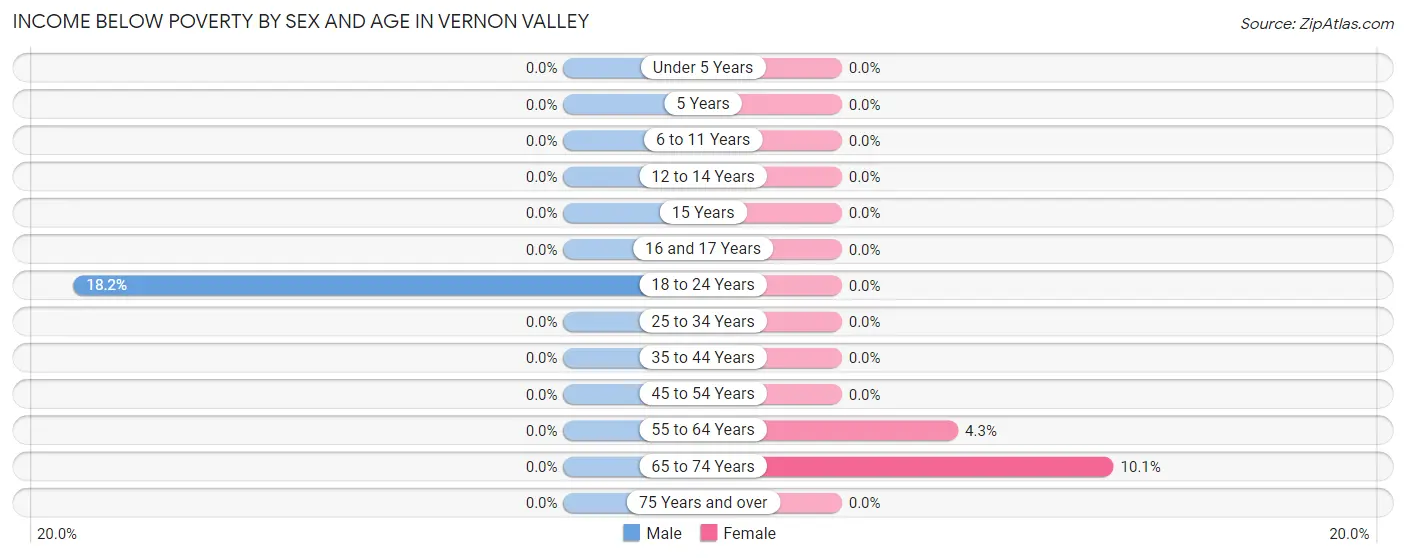
| Age Bracket | Male | Female |
| Under 5 Years | 0 (0.0%) | 0 (0.0%) |
| 5 Years | 0 (0.0%) | 0 (0.0%) |
| 6 to 11 Years | 0 (0.0%) | 0 (0.0%) |
| 12 to 14 Years | 0 (0.0%) | 0 (0.0%) |
| 15 Years | 0 (0.0%) | 0 (0.0%) |
| 16 and 17 Years | 0 (0.0%) | 0 (0.0%) |
| 18 to 24 Years | 6 (18.2%) | 0 (0.0%) |
| 25 to 34 Years | 0 (0.0%) | 0 (0.0%) |
| 35 to 44 Years | 0 (0.0%) | 0 (0.0%) |
| 45 to 54 Years | 0 (0.0%) | 0 (0.0%) |
| 55 to 64 Years | 0 (0.0%) | 7 (4.3%) |
| 65 to 74 Years | 0 (0.0%) | 11 (10.1%) |
| 75 Years and over | 0 (0.0%) | 0 (0.0%) |
| Total | 6 (1.2%) | 18 (3.3%) |
Income Above Poverty by Sex and Age in Vernon Valley
According to the poverty statistics in Vernon Valley, males aged 12 to 14 years and females aged under 5 years are the age groups that are most secure financially, with 100.0% of males and 100.0% of females in these age groups living above the poverty line.
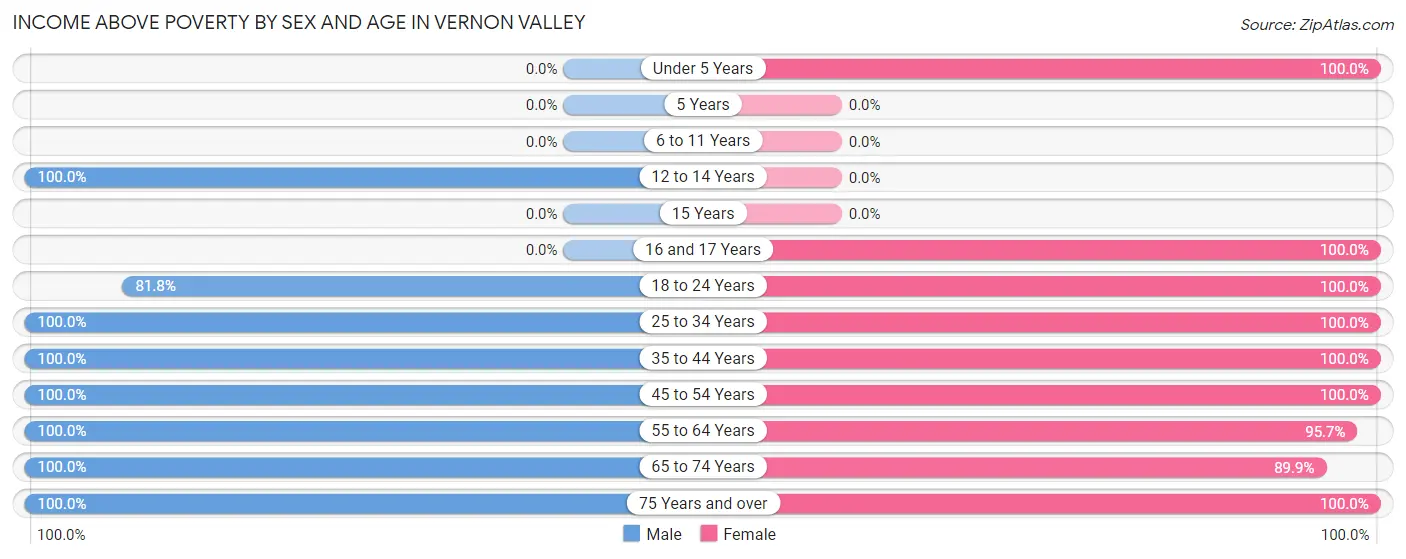
| Age Bracket | Male | Female |
| Under 5 Years | 0 (0.0%) | 19 (100.0%) |
| 5 Years | 0 (0.0%) | 0 (0.0%) |
| 6 to 11 Years | 0 (0.0%) | 0 (0.0%) |
| 12 to 14 Years | 24 (100.0%) | 0 (0.0%) |
| 15 Years | 0 (0.0%) | 0 (0.0%) |
| 16 and 17 Years | 0 (0.0%) | 21 (100.0%) |
| 18 to 24 Years | 27 (81.8%) | 79 (100.0%) |
| 25 to 34 Years | 66 (100.0%) | 79 (100.0%) |
| 35 to 44 Years | 20 (100.0%) | 14 (100.0%) |
| 45 to 54 Years | 88 (100.0%) | 41 (100.0%) |
| 55 to 64 Years | 150 (100.0%) | 155 (95.7%) |
| 65 to 74 Years | 99 (100.0%) | 98 (89.9%) |
| 75 Years and over | 38 (100.0%) | 30 (100.0%) |
| Total | 512 (98.8%) | 536 (96.8%) |
Income Below Poverty Among Married-Couple Families in Vernon Valley
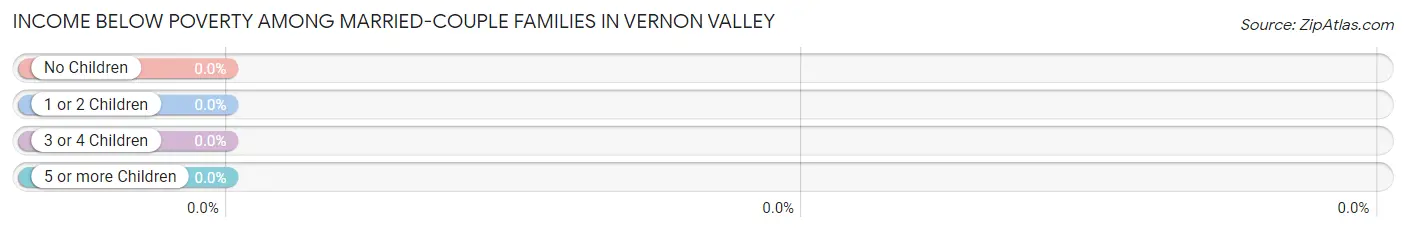
| Children | Above Poverty | Below Poverty |
| No Children | 282 (100.0%) | 0 (0.0%) |
| 1 or 2 Children | 0 (0.0%) | 0 (0.0%) |
| 3 or 4 Children | 0 (0.0%) | 0 (0.0%) |
| 5 or more Children | 0 (0.0%) | 0 (0.0%) |
| Total | 282 (100.0%) | 0 (0.0%) |
Income Below Poverty Among Single-Parent Households in Vernon Valley
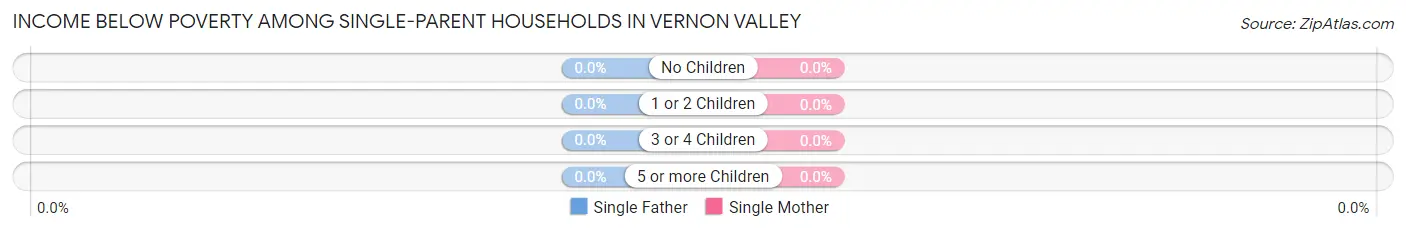
| Children | Single Father | Single Mother |
| No Children | 0 (0.0%) | 0 (0.0%) |
| 1 or 2 Children | 0 (0.0%) | 0 (0.0%) |
| 3 or 4 Children | 0 (0.0%) | 0 (0.0%) |
| 5 or more Children | 0 (0.0%) | 0 (0.0%) |
| Total | 0 (0.0%) | 0 (0.0%) |
Income Below Poverty Among Married-Couple vs Single-Parent Households in Vernon Valley
| Children | Married-Couple Families | Single-Parent Households |
| No Children | 0 (0.0%) | 0 (0.0%) |
| 1 or 2 Children | 0 (0.0%) | 0 (0.0%) |
| 3 or 4 Children | 0 (0.0%) | 0 (0.0%) |
| 5 or more Children | 0 (0.0%) | 0 (0.0%) |
| Total | 0 (0.0%) | 0 (0.0%) |
Race in Vernon Valley
The most populous races in Vernon Valley are White / Caucasian (1,038 | 95.8%), Hispanic or Latino (169 | 15.6%), and Two or more Races (27 | 2.5%).
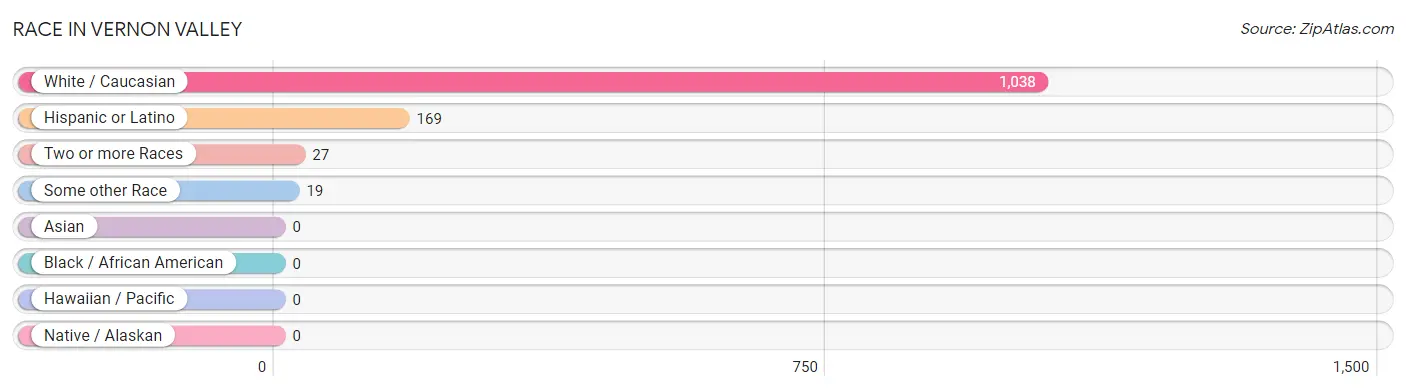
| Race | # Population | % Population |
| Asian | 0 | 0.0% |
| Black / African American | 0 | 0.0% |
| Hawaiian / Pacific | 0 | 0.0% |
| Hispanic or Latino | 169 | 15.6% |
| Native / Alaskan | 0 | 0.0% |
| White / Caucasian | 1,038 | 95.8% |
| Two or more Races | 27 | 2.5% |
| Some other Race | 19 | 1.8% |
| Total | 1,084 | 100.0% |
Ancestry in Vernon Valley
The most populous ancestries reported in Vernon Valley are Italian (370 | 34.1%), German (197 | 18.2%), Irish (193 | 17.8%), Dutch (86 | 7.9%), and Cuban (70 | 6.5%), together accounting for 84.5% of all Vernon Valley residents.
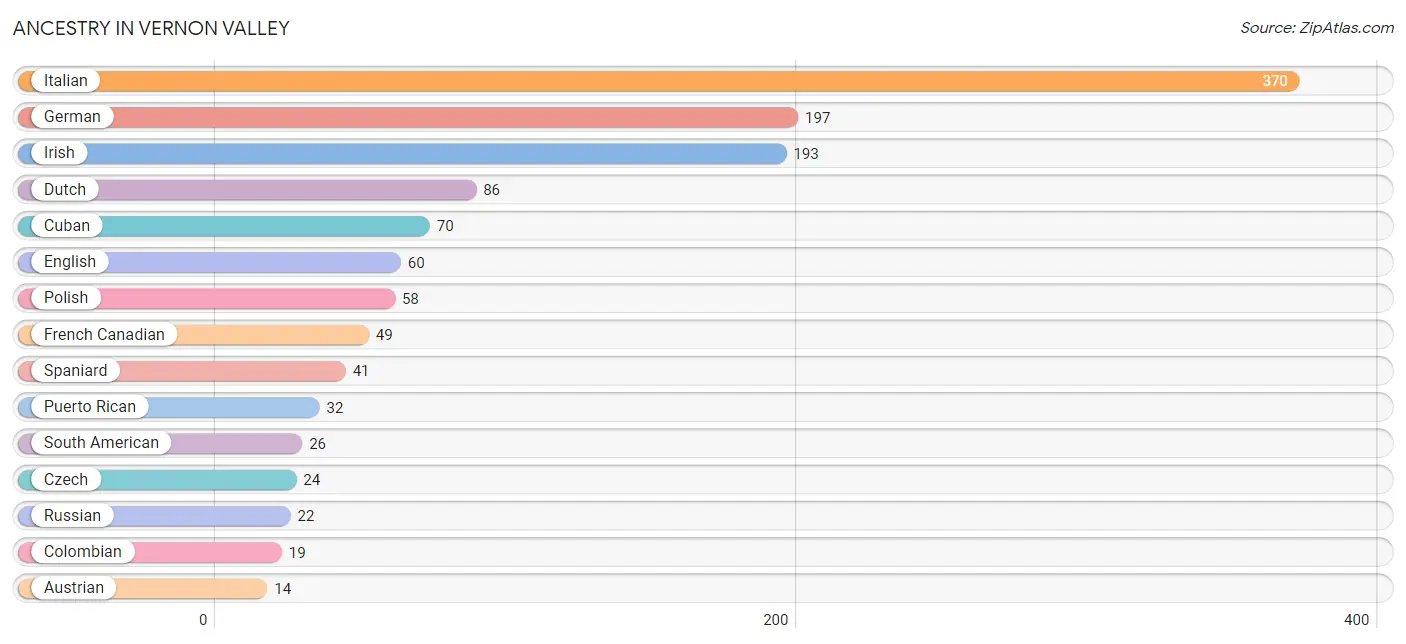
| Ancestry | # Population | % Population |
| Austrian | 14 | 1.3% |
| Colombian | 19 | 1.8% |
| Cuban | 70 | 6.5% |
| Czech | 24 | 2.2% |
| Dutch | 86 | 7.9% |
| Ecuadorian | 7 | 0.6% |
| English | 60 | 5.5% |
| French | 11 | 1.0% |
| French Canadian | 49 | 4.5% |
| German | 197 | 18.2% |
| Irish | 193 | 17.8% |
| Italian | 370 | 34.1% |
| Lithuanian | 12 | 1.1% |
| Polish | 58 | 5.3% |
| Puerto Rican | 32 | 2.9% |
| Russian | 22 | 2.0% |
| Scottish | 2 | 0.2% |
| South American | 26 | 2.4% |
| Spaniard | 41 | 3.8% | View All 19 Rows |
Immigrants in Vernon Valley
The most numerous immigrant groups reported in Vernon Valley came from Europe (50 | 4.6%), Latin America (41 | 3.8%), Germany (25 | 2.3%), Italy (25 | 2.3%), and Southern Europe (25 | 2.3%), together accounting for 15.3% of all Vernon Valley residents.
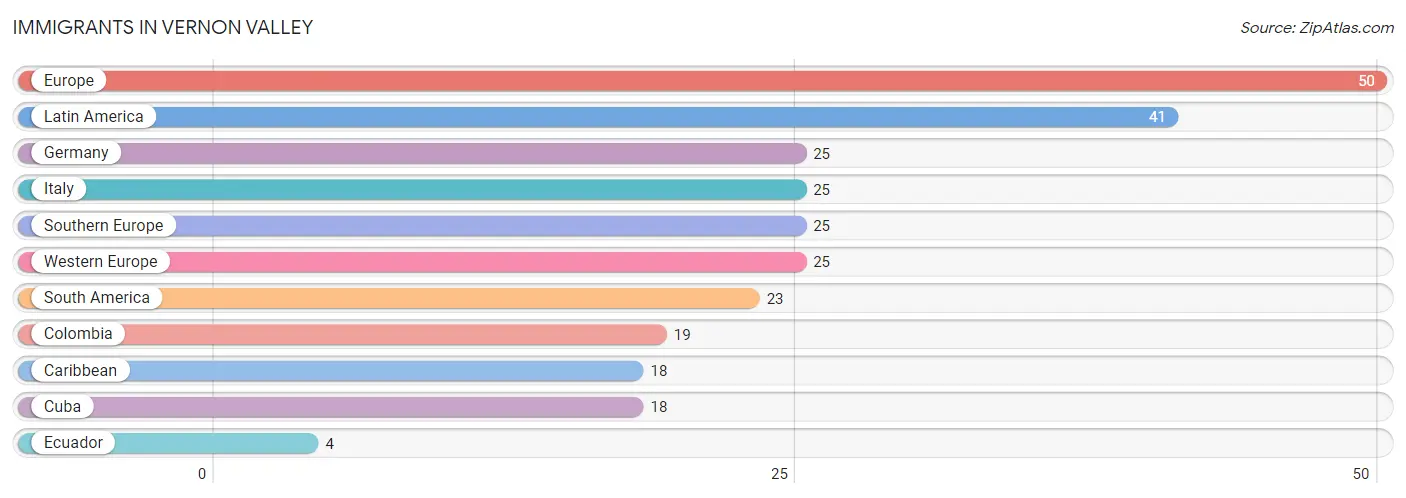
| Immigration Origin | # Population | % Population |
| Caribbean | 18 | 1.7% |
| Colombia | 19 | 1.8% |
| Cuba | 18 | 1.7% |
| Ecuador | 4 | 0.4% |
| Europe | 50 | 4.6% |
| Germany | 25 | 2.3% |
| Italy | 25 | 2.3% |
| Latin America | 41 | 3.8% |
| South America | 23 | 2.1% |
| Southern Europe | 25 | 2.3% |
| Western Europe | 25 | 2.3% | View All 11 Rows |
Sex and Age in Vernon Valley
Sex and Age in Vernon Valley
The most populous age groups in Vernon Valley are 55 to 59 Years (94 | 18.1%) for men and 55 to 59 Years (123 | 21.7%) for women.
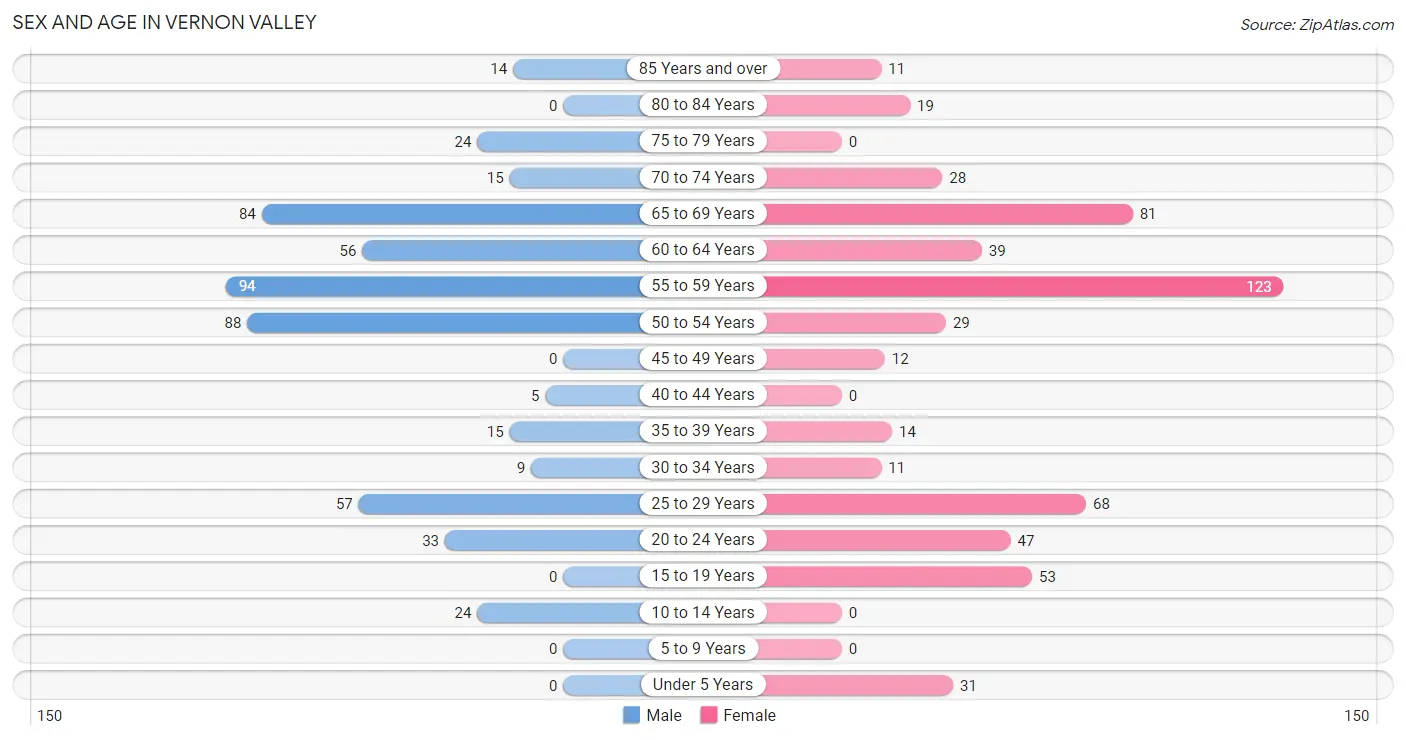
| Age Bracket | Male | Female |
| Under 5 Years | 0 (0.0%) | 31 (5.5%) |
| 5 to 9 Years | 0 (0.0%) | 0 (0.0%) |
| 10 to 14 Years | 24 (4.6%) | 0 (0.0%) |
| 15 to 19 Years | 0 (0.0%) | 53 (9.4%) |
| 20 to 24 Years | 33 (6.4%) | 47 (8.3%) |
| 25 to 29 Years | 57 (11.0%) | 68 (12.0%) |
| 30 to 34 Years | 9 (1.7%) | 11 (1.9%) |
| 35 to 39 Years | 15 (2.9%) | 14 (2.5%) |
| 40 to 44 Years | 5 (1.0%) | 0 (0.0%) |
| 45 to 49 Years | 0 (0.0%) | 12 (2.1%) |
| 50 to 54 Years | 88 (17.0%) | 29 (5.1%) |
| 55 to 59 Years | 94 (18.1%) | 123 (21.7%) |
| 60 to 64 Years | 56 (10.8%) | 39 (6.9%) |
| 65 to 69 Years | 84 (16.2%) | 81 (14.3%) |
| 70 to 74 Years | 15 (2.9%) | 28 (5.0%) |
| 75 to 79 Years | 24 (4.6%) | 0 (0.0%) |
| 80 to 84 Years | 0 (0.0%) | 19 (3.4%) |
| 85 Years and over | 14 (2.7%) | 11 (1.9%) |
| Total | 518 (100.0%) | 566 (100.0%) |
Families and Households in Vernon Valley
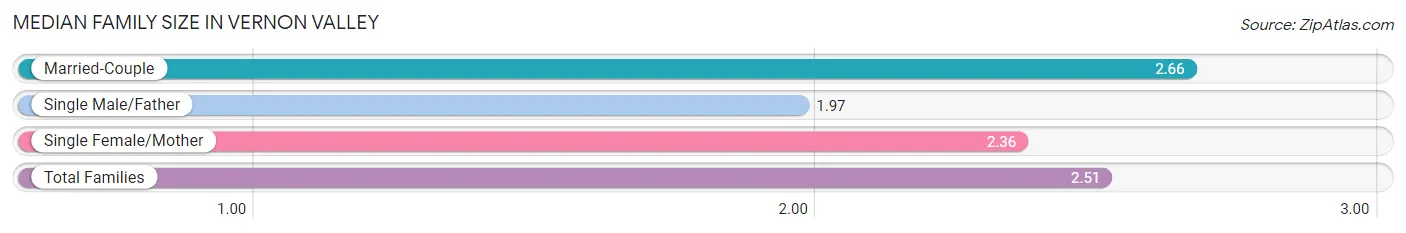
Median Family Size in Vernon Valley
The median family size in Vernon Valley is 2.51 persons per family, with married-couple families (282 | 70.2%) accounting for the largest median family size of 2.66 persons per family. On the other hand, single male/father families (64 | 15.9%) represent the smallest median family size with 1.97 persons per family.
| Family Type | # Families | Family Size |
| Married-Couple | 282 (70.2%) | 2.66 |
| Single Male/Father | 64 (15.9%) | 1.97 |
| Single Female/Mother | 56 (13.9%) | 2.36 |
| Total Families | 402 (100.0%) | 2.51 |
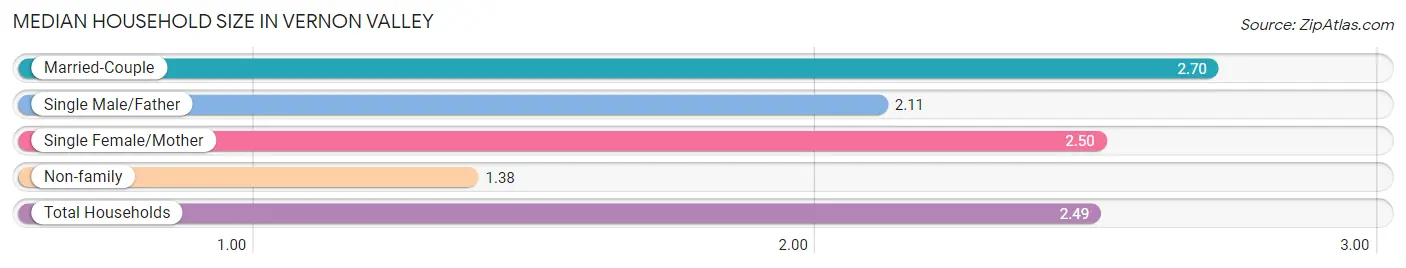
Median Household Size in Vernon Valley
The median household size in Vernon Valley is 2.49 persons per household, with married-couple households (282 | 64.7%) accounting for the largest median household size of 2.7 persons per household. non-family households (34 | 7.8%) represent the smallest median household size with 1.38 persons per household.
| Household Type | # Households | Household Size |
| Married-Couple | 282 (64.7%) | 2.70 |
| Single Male/Father | 64 (14.7%) | 2.11 |
| Single Female/Mother | 56 (12.8%) | 2.50 |
| Non-family | 34 (7.8%) | 1.38 |
| Total Households | 436 (100.0%) | 2.49 |
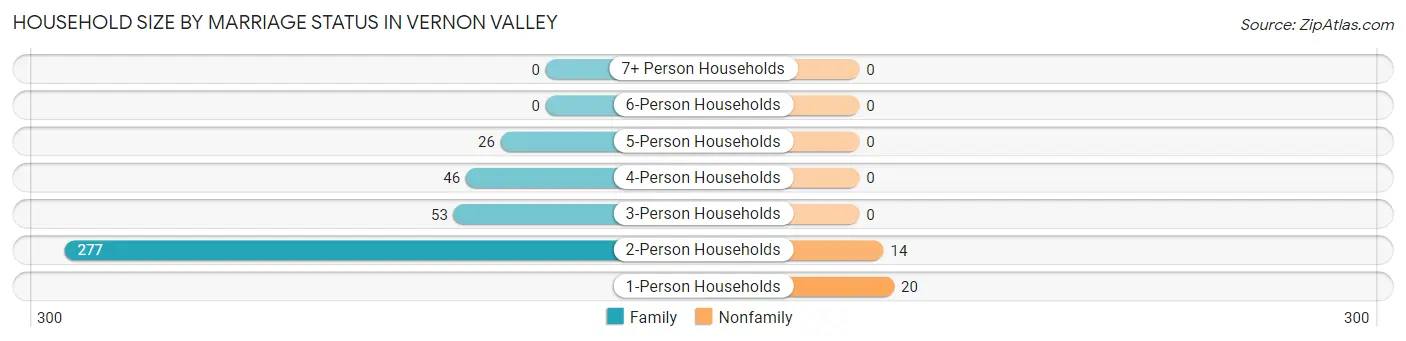
Household Size by Marriage Status in Vernon Valley
Out of a total of 436 households in Vernon Valley, 402 (92.2%) are family households, while 34 (7.8%) are nonfamily households. The most numerous type of family households are 2-person households, comprising 277, and the most common type of nonfamily households are 1-person households, comprising 20.
| Household Size | Family Households | Nonfamily Households |
| 1-Person Households | - | 20 (4.6%) |
| 2-Person Households | 277 (63.5%) | 14 (3.2%) |
| 3-Person Households | 53 (12.2%) | 0 (0.0%) |
| 4-Person Households | 46 (10.5%) | 0 (0.0%) |
| 5-Person Households | 26 (6.0%) | 0 (0.0%) |
| 6-Person Households | 0 (0.0%) | 0 (0.0%) |
| 7+ Person Households | 0 (0.0%) | 0 (0.0%) |
| Total | 402 (92.2%) | 34 (7.8%) |
Female Fertility in Vernon Valley
Fertility by Age in Vernon Valley
| Age Bracket | Women with Births | Births / 1,000 Women |
| 15 to 19 years | 0 (0.0%) | 0.0 |
| 20 to 34 years | 0 (0.0%) | 0.0 |
| 35 to 50 years | 0 (0.0%) | 0.0 |
| Total | 0 (0.0%) | 0.0 |
Fertility by Age by Marriage Status in Vernon Valley
| Age Bracket | Married | Unmarried |
| 15 to 19 years | 0 (0.0%) | 0 (0.0%) |
| 20 to 34 years | 0 (0.0%) | 0 (0.0%) |
| 35 to 50 years | 0 (0.0%) | 0 (0.0%) |
| Total | 0 (0.0%) | 0 (0.0%) |
Fertility by Education in Vernon Valley
| Educational Attainment | Women with Births | Births / 1,000 Women |
| Less than High School | 0 (0.0%) | 0.0 |
| High School Diploma | 0 (0.0%) | 0.0 |
| College or Associate's Degree | 0 (0.0%) | 0.0 |
| Bachelor's Degree | 0 (0.0%) | 0.0 |
| Graduate Degree | 0 (0.0%) | 0.0 |
| Total | 0 (0.0%) | 0.0 |
Fertility by Education by Marriage Status in Vernon Valley
| Educational Attainment | Married | Unmarried |
| Less than High School | 0 (0.0%) | 0 (0.0%) |
| High School Diploma | 0 (0.0%) | 0 (0.0%) |
| College or Associate's Degree | 0 (0.0%) | 0 (0.0%) |
| Bachelor's Degree | 0 (0.0%) | 0 (0.0%) |
| Graduate Degree | 0 (0.0%) | 0 (0.0%) |
| Total | 0 (0.0%) | 0 (0.0%) |
Employment Characteristics in Vernon Valley
Employment by Class of Employer in Vernon Valley
Among the 680 employed individuals in Vernon Valley, private company employees (549 | 80.7%), local government employees (48 | 7.1%), and not-for-profit organizations (37 | 5.4%) make up the most common classes of employment.
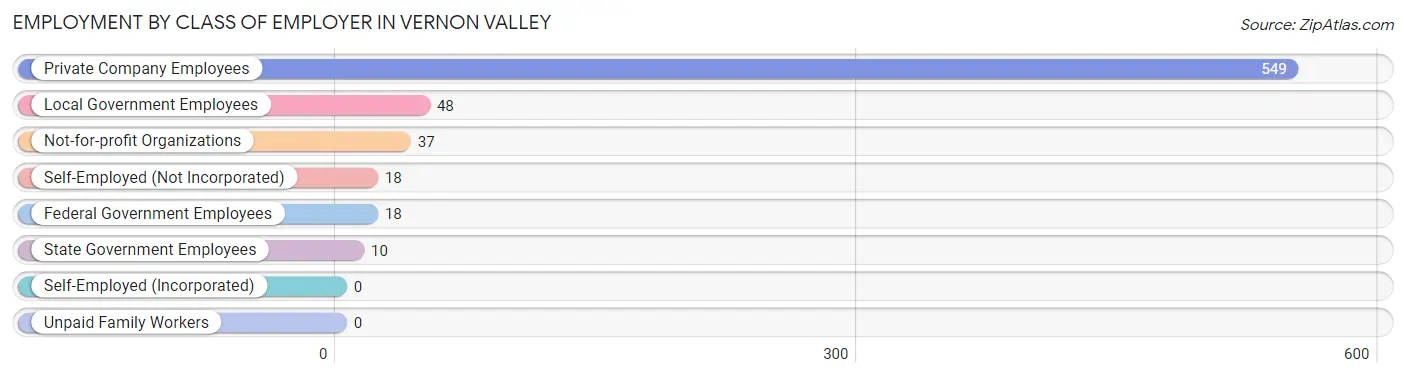
| Employer Class | # Employees | % Employees |
| Private Company Employees | 549 | 80.7% |
| Self-Employed (Incorporated) | 0 | 0.0% |
| Self-Employed (Not Incorporated) | 18 | 2.6% |
| Not-for-profit Organizations | 37 | 5.4% |
| Local Government Employees | 48 | 7.1% |
| State Government Employees | 10 | 1.5% |
| Federal Government Employees | 18 | 2.6% |
| Unpaid Family Workers | 0 | 0.0% |
| Total | 680 | 100.0% |
Employment Status by Age in Vernon Valley
According to the labor force statistics for Vernon Valley, out of the total population over 16 years of age (1,029), 69.3% or 713 individuals are in the labor force, with 3.5% or 25 of them unemployed. The age group with the highest labor force participation rate is 20 to 24 years, with 100.0% or 80 individuals in the labor force. Within the labor force, the 60 to 64 years age range has the highest percentage of unemployed individuals, with 8.1% or 7 of them being unemployed.
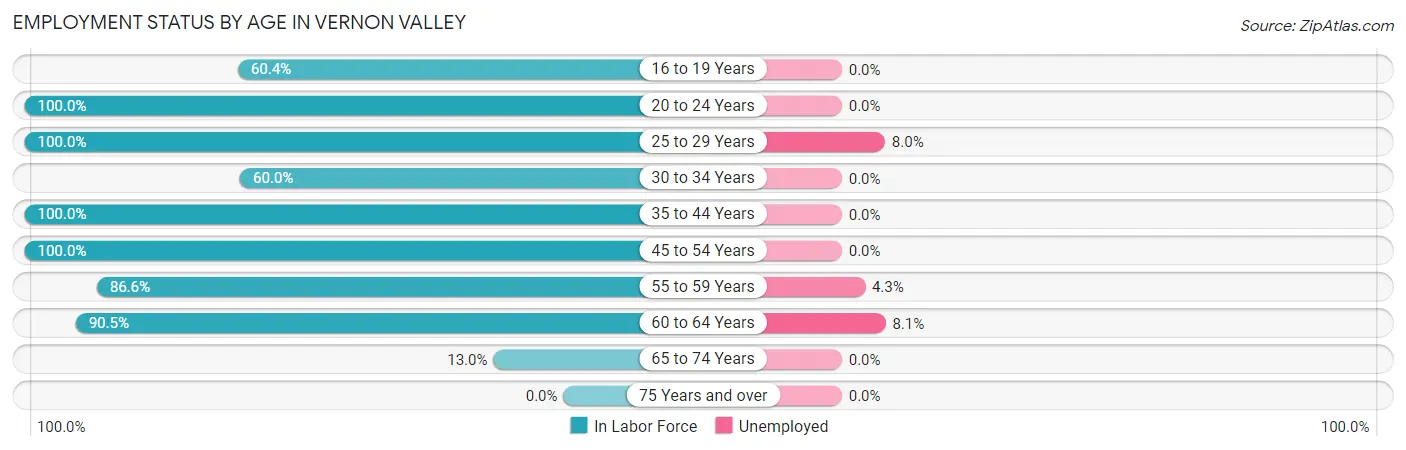
| Age Bracket | In Labor Force | Unemployed |
| 16 to 19 Years | 32 (60.4%) | 0 (0.0%) |
| 20 to 24 Years | 80 (100.0%) | 0 (0.0%) |
| 25 to 29 Years | 125 (100.0%) | 10 (8.0%) |
| 30 to 34 Years | 12 (60.0%) | 0 (0.0%) |
| 35 to 44 Years | 34 (100.0%) | 0 (0.0%) |
| 45 to 54 Years | 129 (100.0%) | 0 (0.0%) |
| 55 to 59 Years | 188 (86.6%) | 8 (4.3%) |
| 60 to 64 Years | 86 (90.5%) | 7 (8.1%) |
| 65 to 74 Years | 27 (13.0%) | 0 (0.0%) |
| 75 Years and over | 0 (0.0%) | 0 (0.0%) |
| Total | 713 (69.3%) | 25 (3.5%) |
Employment Status by Educational Attainment in Vernon Valley
According to labor force statistics for Vernon Valley, 92.6% of individuals (574) out of the total population between 25 and 64 years of age (620) are in the labor force, with 4.4% or 25 of them being unemployed. The group with the highest labor force participation rate are those with the educational attainment of less than high school, with 100.0% or 25 individuals in the labor force. Within the labor force, individuals with high school diploma education have the highest percentage of unemployment, with 8.7% or 15 of them being unemployed.
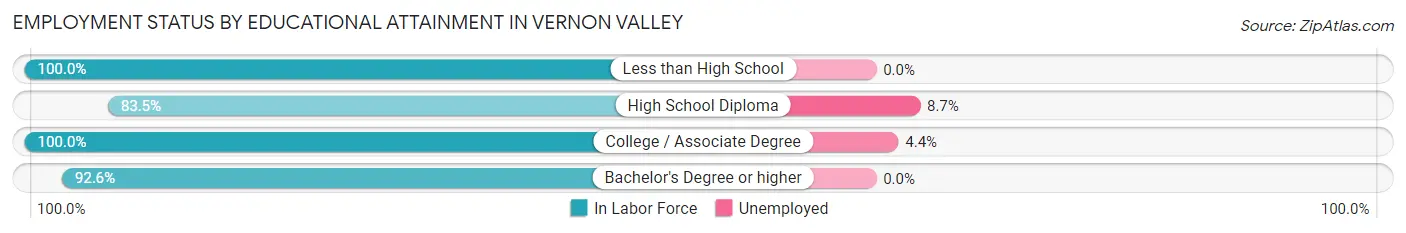
| Educational Attainment | In Labor Force | Unemployed |
| Less than High School | 25 (100.0%) | 0 (0.0%) |
| High School Diploma | 172 (83.5%) | 18 (8.7%) |
| College / Associate Degree | 226 (100.0%) | 10 (4.4%) |
| Bachelor's Degree or higher | 151 (92.6%) | 0 (0.0%) |
| Total | 574 (92.6%) | 27 (4.4%) |
Employment Occupations by Sex in Vernon Valley
Management, Business, Science and Arts Occupations
The most common Management, Business, Science and Arts occupations in Vernon Valley are Management (180 | 26.2%), Community & Social Service (41 | 6.0%), Health Diagnosing & Treating (37 | 5.4%), Computers, Engineering & Science (28 | 4.1%), and Architecture & Engineering (28 | 4.1%).
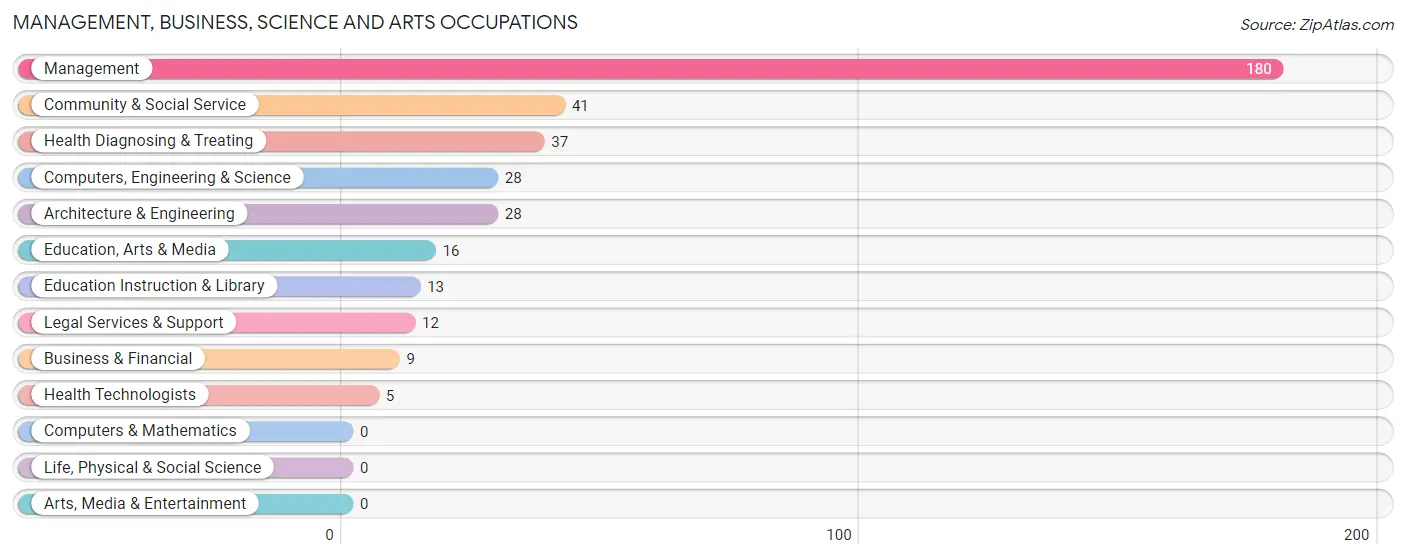
Management, Business, Science and Arts Occupations by Sex
Within the Management, Business, Science and Arts occupations in Vernon Valley, the most male-oriented occupations are Business & Financial (100.0%), Computers, Engineering & Science (100.0%), and Architecture & Engineering (100.0%), while the most female-oriented occupations are Community & Social Service (100.0%), Education, Arts & Media (100.0%), and Legal Services & Support (100.0%).
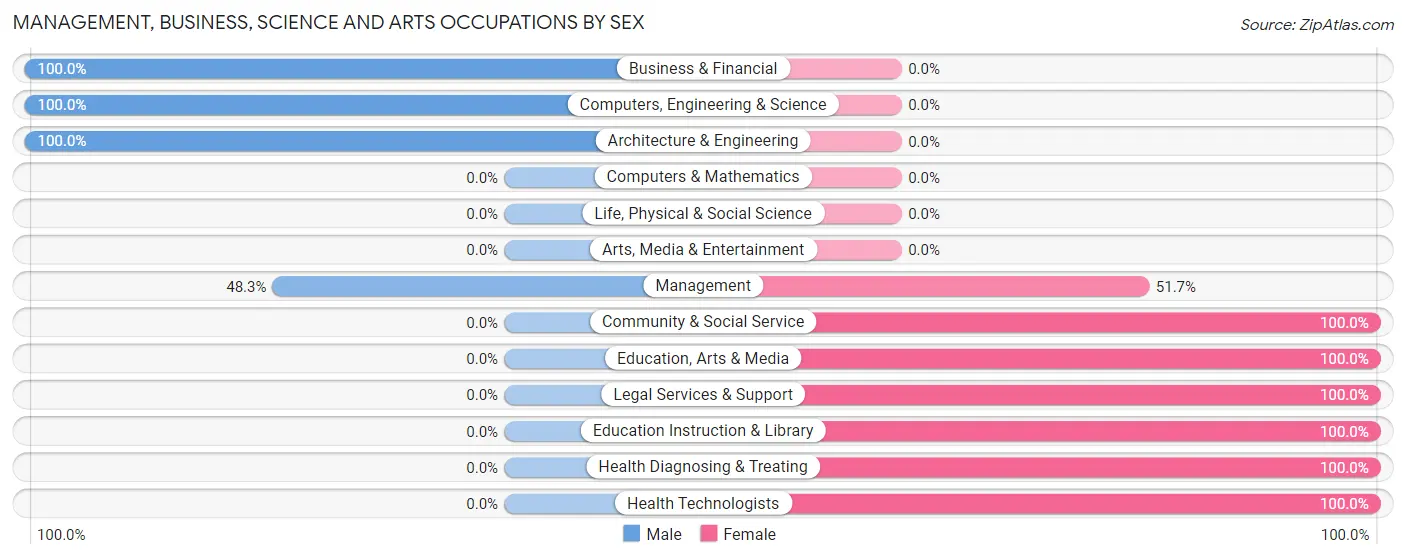
| Occupation | Male | Female |
| Management | 87 (48.3%) | 93 (51.7%) |
| Business & Financial | 9 (100.0%) | 0 (0.0%) |
| Computers, Engineering & Science | 28 (100.0%) | 0 (0.0%) |
| Computers & Mathematics | 0 (0.0%) | 0 (0.0%) |
| Architecture & Engineering | 28 (100.0%) | 0 (0.0%) |
| Life, Physical & Social Science | 0 (0.0%) | 0 (0.0%) |
| Community & Social Service | 0 (0.0%) | 41 (100.0%) |
| Education, Arts & Media | 0 (0.0%) | 16 (100.0%) |
| Legal Services & Support | 0 (0.0%) | 12 (100.0%) |
| Education Instruction & Library | 0 (0.0%) | 13 (100.0%) |
| Arts, Media & Entertainment | 0 (0.0%) | 0 (0.0%) |
| Health Diagnosing & Treating | 0 (0.0%) | 37 (100.0%) |
| Health Technologists | 0 (0.0%) | 5 (100.0%) |
| Total (Category) | 124 (42.0%) | 171 (58.0%) |
| Total (Overall) | 372 (54.1%) | 316 (45.9%) |
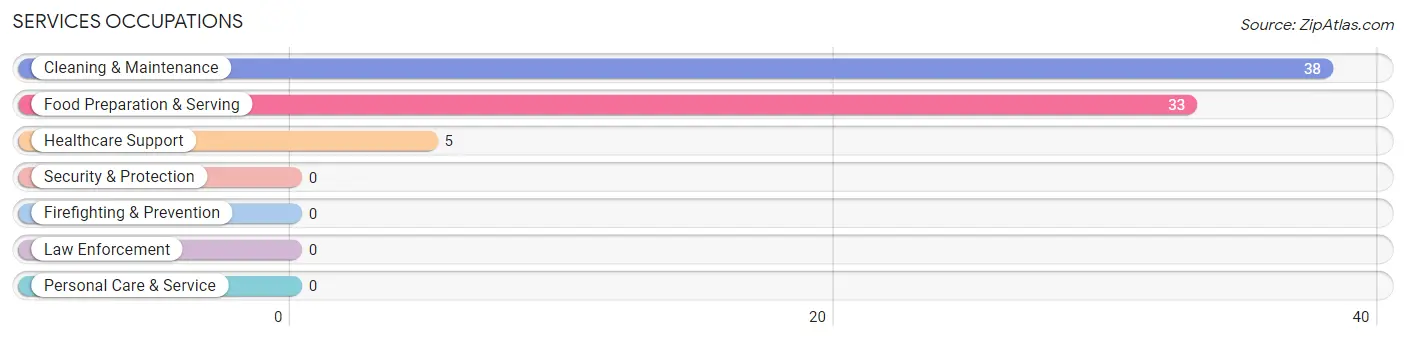
Services Occupations
The most common Services occupations in Vernon Valley are Cleaning & Maintenance (38 | 5.5%), Food Preparation & Serving (33 | 4.8%), and Healthcare Support (5 | 0.7%).
Services Occupations by Sex
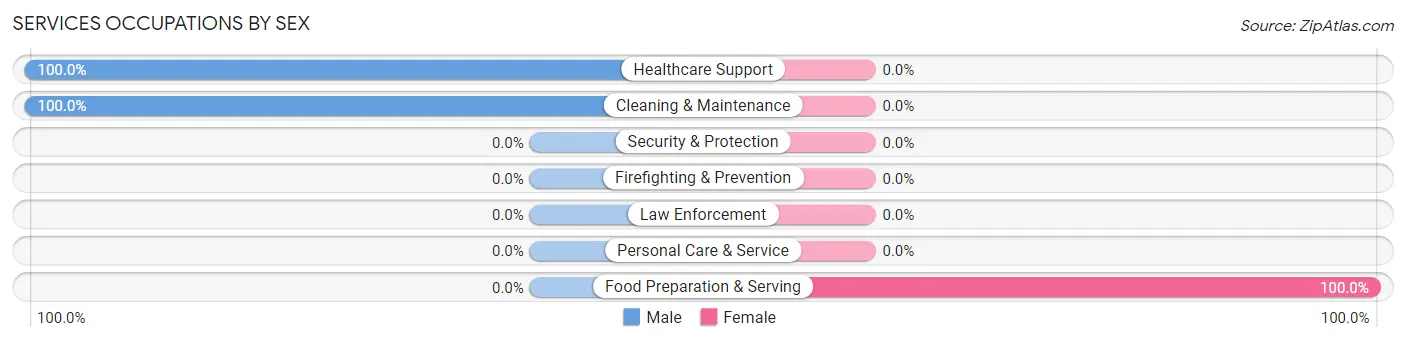
| Occupation | Male | Female |
| Healthcare Support | 5 (100.0%) | 0 (0.0%) |
| Security & Protection | 0 (0.0%) | 0 (0.0%) |
| Firefighting & Prevention | 0 (0.0%) | 0 (0.0%) |
| Law Enforcement | 0 (0.0%) | 0 (0.0%) |
| Food Preparation & Serving | 0 (0.0%) | 33 (100.0%) |
| Cleaning & Maintenance | 38 (100.0%) | 0 (0.0%) |
| Personal Care & Service | 0 (0.0%) | 0 (0.0%) |
| Total (Category) | 43 (56.6%) | 33 (43.4%) |
| Total (Overall) | 372 (54.1%) | 316 (45.9%) |
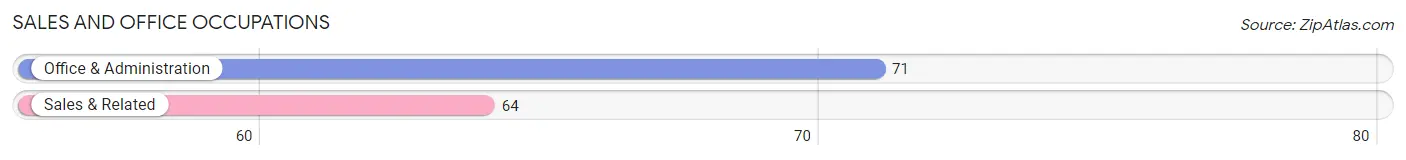
Sales and Office Occupations
The most common Sales and Office occupations in Vernon Valley are Office & Administration (71 | 10.3%), and Sales & Related (64 | 9.3%).
Sales and Office Occupations by Sex
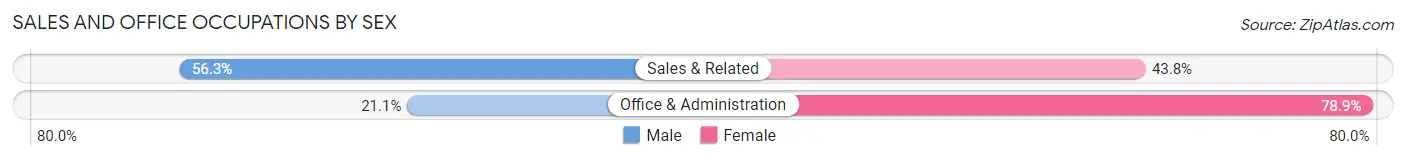
| Occupation | Male | Female |
| Sales & Related | 36 (56.2%) | 28 (43.8%) |
| Office & Administration | 15 (21.1%) | 56 (78.9%) |
| Total (Category) | 51 (37.8%) | 84 (62.2%) |
| Total (Overall) | 372 (54.1%) | 316 (45.9%) |
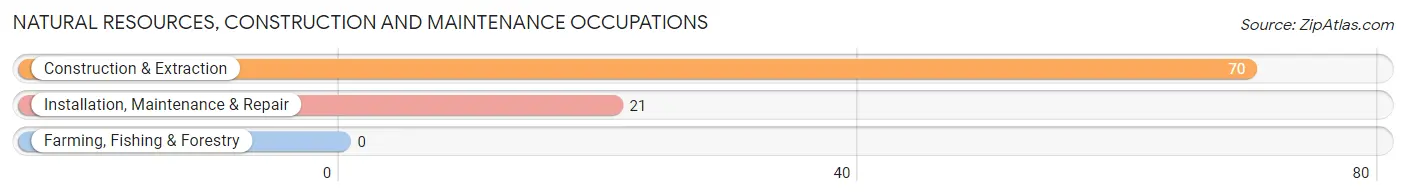
Natural Resources, Construction and Maintenance Occupations
The most common Natural Resources, Construction and Maintenance occupations in Vernon Valley are Construction & Extraction (70 | 10.2%), and Installation, Maintenance & Repair (21 | 3.0%).
Natural Resources, Construction and Maintenance Occupations by Sex
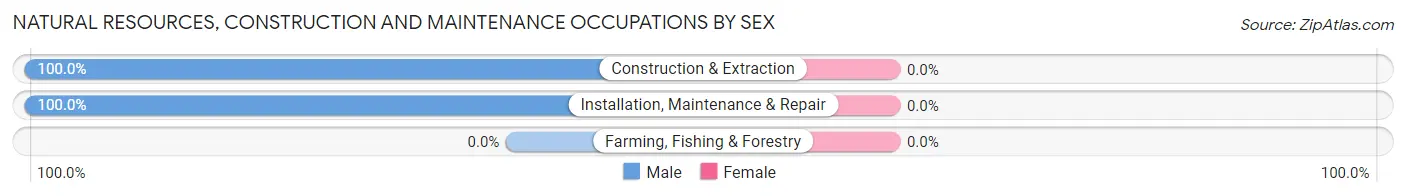
| Occupation | Male | Female |
| Farming, Fishing & Forestry | 0 (0.0%) | 0 (0.0%) |
| Construction & Extraction | 70 (100.0%) | 0 (0.0%) |
| Installation, Maintenance & Repair | 21 (100.0%) | 0 (0.0%) |
| Total (Category) | 91 (100.0%) | 0 (0.0%) |
| Total (Overall) | 372 (54.1%) | 316 (45.9%) |
Production, Transportation and Moving Occupations
The most common Production, Transportation and Moving occupations in Vernon Valley are Material Moving (70 | 10.2%), and Production (21 | 3.0%).
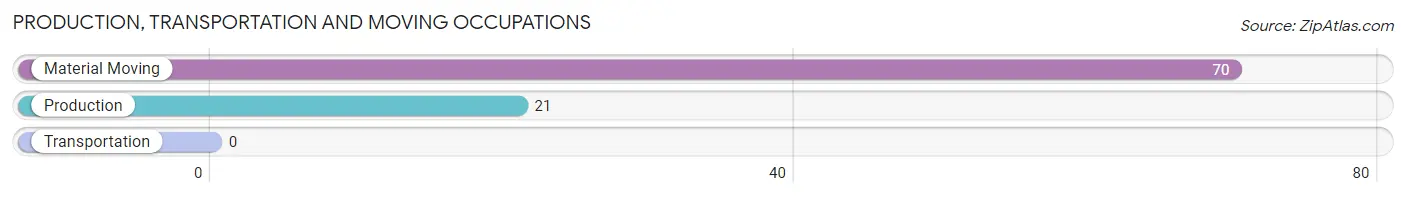
Production, Transportation and Moving Occupations by Sex
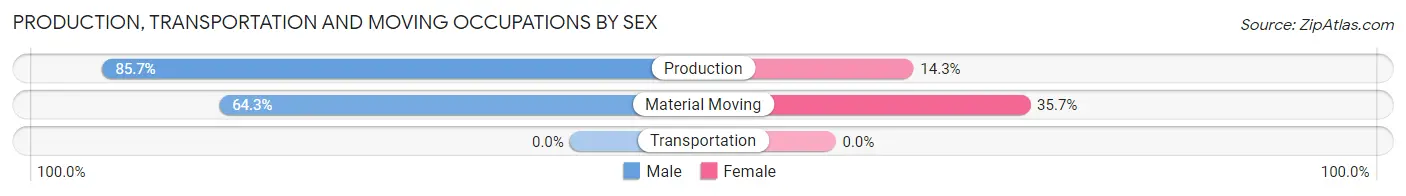
| Occupation | Male | Female |
| Production | 18 (85.7%) | 3 (14.3%) |
| Transportation | 0 (0.0%) | 0 (0.0%) |
| Material Moving | 45 (64.3%) | 25 (35.7%) |
| Total (Category) | 63 (69.2%) | 28 (30.8%) |
| Total (Overall) | 372 (54.1%) | 316 (45.9%) |
Employment Industries by Sex in Vernon Valley
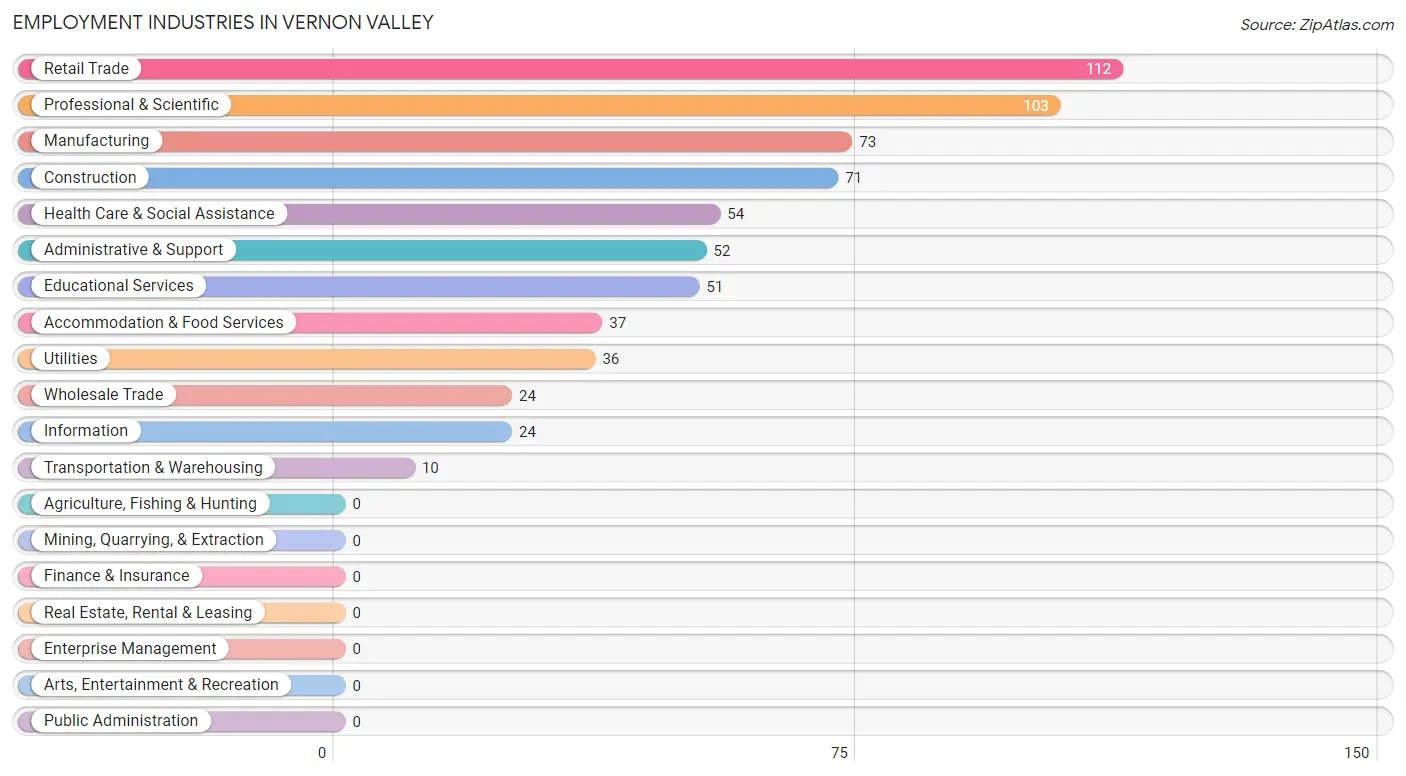
Employment Industries in Vernon Valley
The major employment industries in Vernon Valley include Retail Trade (112 | 16.3%), Professional & Scientific (103 | 15.0%), Manufacturing (73 | 10.6%), Construction (71 | 10.3%), and Health Care & Social Assistance (54 | 7.9%).
Employment Industries by Sex in Vernon Valley
The Vernon Valley industries that see more men than women are Construction (100.0%), Wholesale Trade (100.0%), and Transportation & Warehousing (100.0%), whereas the industries that tend to have a higher number of women are Information (100.0%), Educational Services (100.0%), and Health Care & Social Assistance (90.7%).

| Industry | Male | Female |
| Agriculture, Fishing & Hunting | 0 (0.0%) | 0 (0.0%) |
| Mining, Quarrying, & Extraction | 0 (0.0%) | 0 (0.0%) |
| Construction | 71 (100.0%) | 0 (0.0%) |
| Manufacturing | 65 (89.0%) | 8 (11.0%) |
| Wholesale Trade | 24 (100.0%) | 0 (0.0%) |
| Retail Trade | 25 (22.3%) | 87 (77.7%) |
| Transportation & Warehousing | 10 (100.0%) | 0 (0.0%) |
| Utilities | 18 (50.0%) | 18 (50.0%) |
| Information | 0 (0.0%) | 24 (100.0%) |
| Finance & Insurance | 0 (0.0%) | 0 (0.0%) |
| Real Estate, Rental & Leasing | 0 (0.0%) | 0 (0.0%) |
| Professional & Scientific | 77 (74.8%) | 26 (25.2%) |
| Enterprise Management | 0 (0.0%) | 0 (0.0%) |
| Administrative & Support | 38 (73.1%) | 14 (26.9%) |
| Educational Services | 0 (0.0%) | 51 (100.0%) |
| Health Care & Social Assistance | 5 (9.3%) | 49 (90.7%) |
| Arts, Entertainment & Recreation | 0 (0.0%) | 0 (0.0%) |
| Accommodation & Food Services | 18 (48.6%) | 19 (51.3%) |
| Public Administration | 0 (0.0%) | 0 (0.0%) |
| Total | 372 (54.1%) | 316 (45.9%) |
Education in Vernon Valley
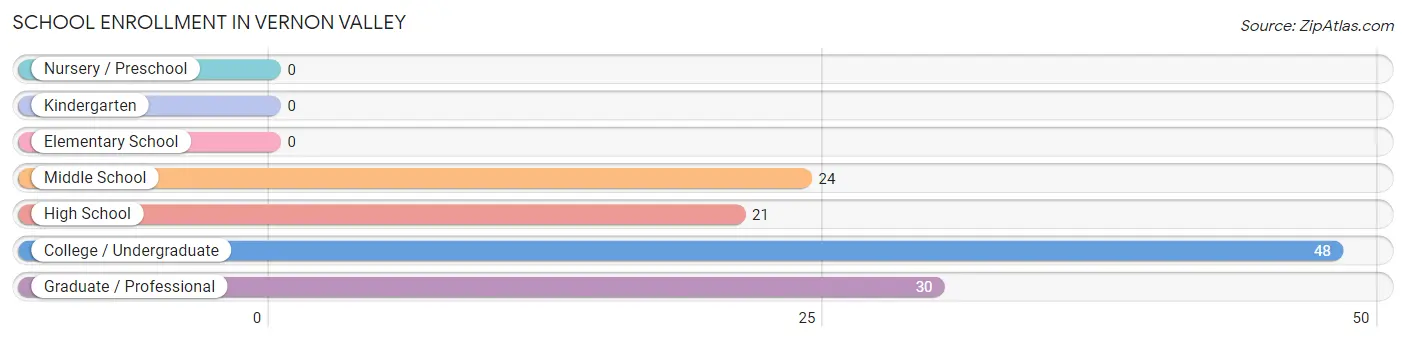
School Enrollment in Vernon Valley
The most common levels of schooling among the 123 students in Vernon Valley are college / undergraduate (48 | 39.0%), graduate / professional (30 | 24.4%), and middle school (24 | 19.5%).
| School Level | # Students | % Students |
| Nursery / Preschool | 0 | 0.0% |
| Kindergarten | 0 | 0.0% |
| Elementary School | 0 | 0.0% |
| Middle School | 24 | 19.5% |
| High School | 21 | 17.1% |
| College / Undergraduate | 48 | 39.0% |
| Graduate / Professional | 30 | 24.4% |
| Total | 123 | 100.0% |
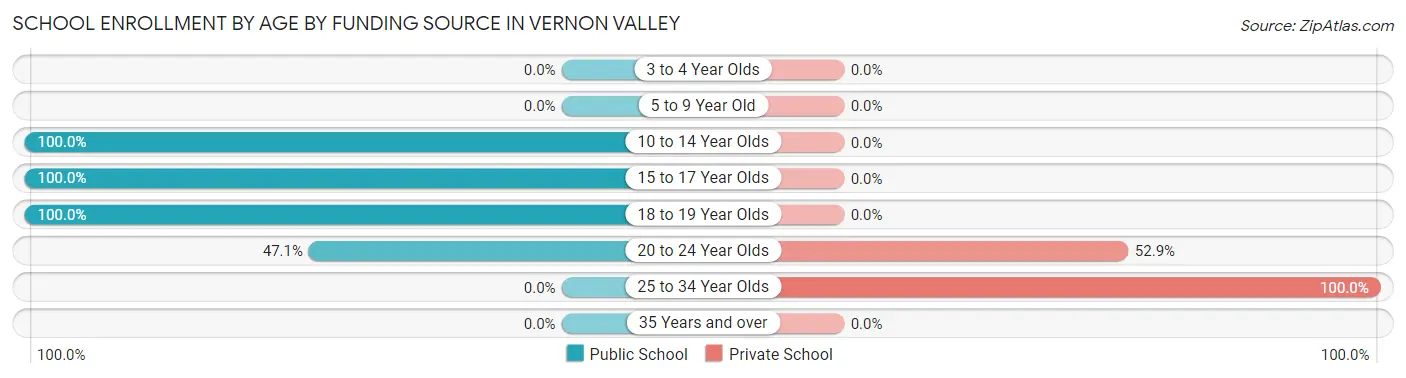
School Enrollment by Age by Funding Source in Vernon Valley
Out of a total of 123 students who are enrolled in schools in Vernon Valley, 30 (24.4%) attend a private institution, while the remaining 93 (75.6%) are enrolled in public schools. The age group of 25 to 34 year olds has the highest likelihood of being enrolled in private schools, with 12 (100.0% in the age bracket) enrolled. Conversely, the age group of 10 to 14 year olds has the lowest likelihood of being enrolled in a private school, with 24 (100.0% in the age bracket) attending a public institution.
| Age Bracket | Public School | Private School |
| 3 to 4 Year Olds | 0 (0.0%) | 0 (0.0%) |
| 5 to 9 Year Old | 0 (0.0%) | 0 (0.0%) |
| 10 to 14 Year Olds | 24 (100.0%) | 0 (0.0%) |
| 15 to 17 Year Olds | 21 (100.0%) | 0 (0.0%) |
| 18 to 19 Year Olds | 32 (100.0%) | 0 (0.0%) |
| 20 to 24 Year Olds | 16 (47.1%) | 18 (52.9%) |
| 25 to 34 Year Olds | 0 (0.0%) | 12 (100.0%) |
| 35 Years and over | 0 (0.0%) | 0 (0.0%) |
| Total | 93 (75.6%) | 30 (24.4%) |
Educational Attainment by Field of Study in Vernon Valley
Education (78 | 34.4%), literature & languages (39 | 17.2%), business (34 | 15.0%), engineering (20 | 8.8%), and psychology (16 | 7.0%) are the most common fields of study among 227 individuals in Vernon Valley who have obtained a bachelor's degree or higher.
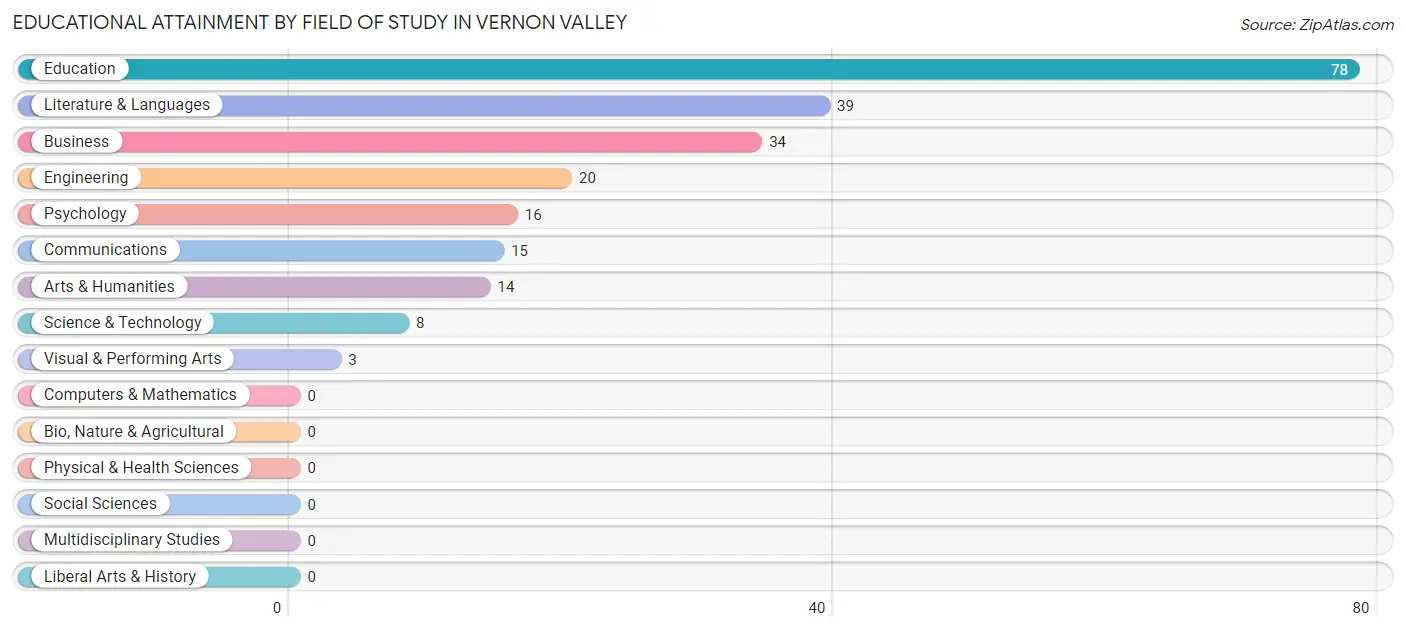
| Field of Study | # Graduates | % Graduates |
| Computers & Mathematics | 0 | 0.0% |
| Bio, Nature & Agricultural | 0 | 0.0% |
| Physical & Health Sciences | 0 | 0.0% |
| Psychology | 16 | 7.0% |
| Social Sciences | 0 | 0.0% |
| Engineering | 20 | 8.8% |
| Multidisciplinary Studies | 0 | 0.0% |
| Science & Technology | 8 | 3.5% |
| Business | 34 | 15.0% |
| Education | 78 | 34.4% |
| Literature & Languages | 39 | 17.2% |
| Liberal Arts & History | 0 | 0.0% |
| Visual & Performing Arts | 3 | 1.3% |
| Communications | 15 | 6.6% |
| Arts & Humanities | 14 | 6.2% |
| Total | 227 | 100.0% |
Transportation & Commute in Vernon Valley
Vehicle Availability by Sex in Vernon Valley
The most prevalent vehicle ownership categories in Vernon Valley are males with 4 vehicles (111, accounting for 30.3%) and females with 4 vehicles (75, making up 35.3%).
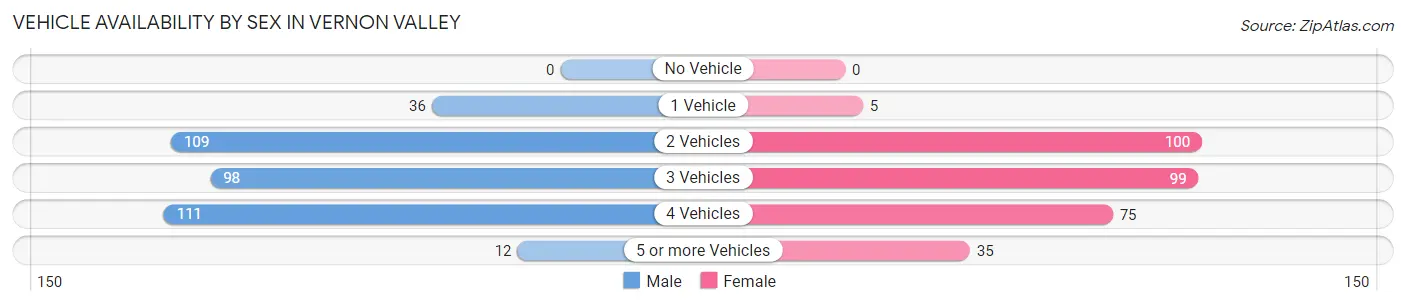
| Vehicles Available | Male | Female |
| No Vehicle | 0 (0.0%) | 0 (0.0%) |
| 1 Vehicle | 36 (9.8%) | 5 (1.6%) |
| 2 Vehicles | 109 (29.8%) | 100 (31.9%) |
| 3 Vehicles | 98 (26.8%) | 99 (31.5%) |
| 4 Vehicles | 111 (30.3%) | 75 (23.9%) |
| 5 or more Vehicles | 12 (3.3%) | 35 (11.2%) |
| Total | 366 (100.0%) | 314 (100.0%) |
Commute Time in Vernon Valley
The most frequently occuring commute durations in Vernon Valley are 60 to 89 minutes (195 commuters, 30.9%), 10 to 14 minutes (91 commuters, 14.4%), and 25 to 29 minutes (57 commuters, 9.0%).
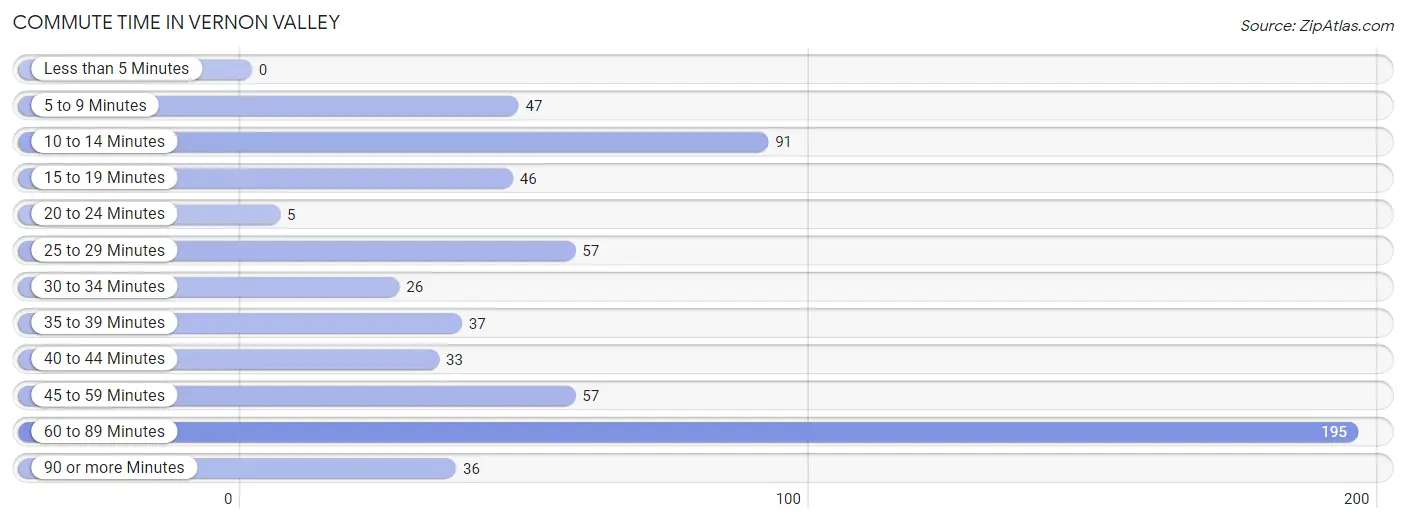
| Commute Time | # Commuters | % Commuters |
| Less than 5 Minutes | 0 | 0.0% |
| 5 to 9 Minutes | 47 | 7.5% |
| 10 to 14 Minutes | 91 | 14.4% |
| 15 to 19 Minutes | 46 | 7.3% |
| 20 to 24 Minutes | 5 | 0.8% |
| 25 to 29 Minutes | 57 | 9.0% |
| 30 to 34 Minutes | 26 | 4.1% |
| 35 to 39 Minutes | 37 | 5.9% |
| 40 to 44 Minutes | 33 | 5.2% |
| 45 to 59 Minutes | 57 | 9.0% |
| 60 to 89 Minutes | 195 | 30.9% |
| 90 or more Minutes | 36 | 5.7% |
Commute Time by Sex in Vernon Valley
The most common commute times in Vernon Valley are 60 to 89 minutes (171 commuters, 49.0%) for males and 10 to 14 minutes (48 commuters, 17.1%) for females.
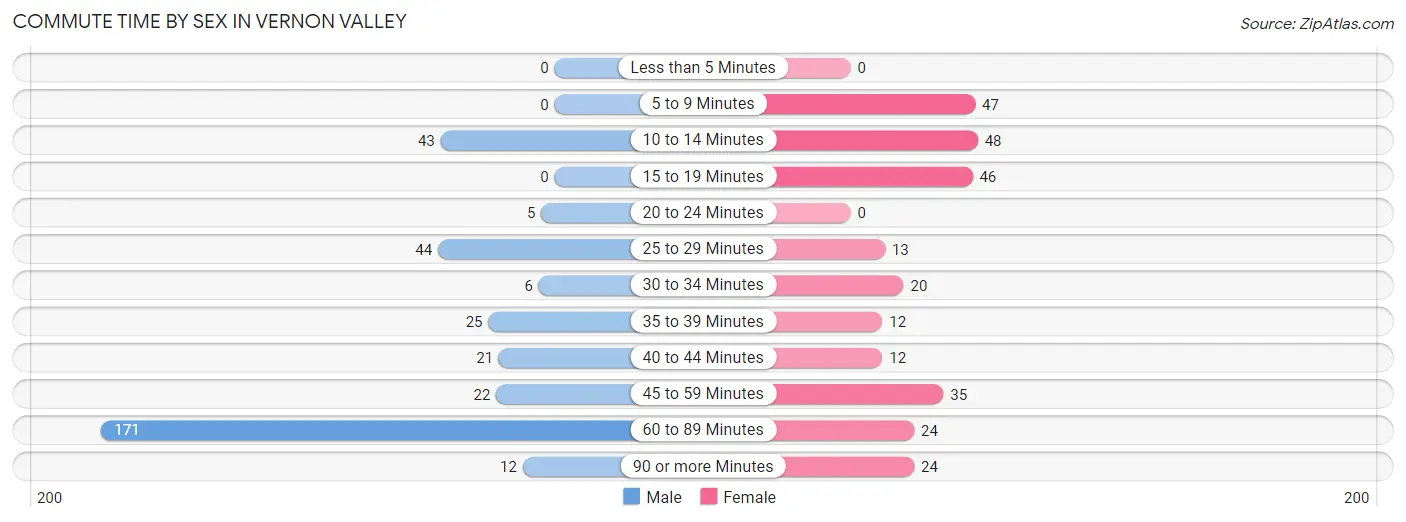
| Commute Time | Male | Female |
| Less than 5 Minutes | 0 (0.0%) | 0 (0.0%) |
| 5 to 9 Minutes | 0 (0.0%) | 47 (16.7%) |
| 10 to 14 Minutes | 43 (12.3%) | 48 (17.1%) |
| 15 to 19 Minutes | 0 (0.0%) | 46 (16.4%) |
| 20 to 24 Minutes | 5 (1.4%) | 0 (0.0%) |
| 25 to 29 Minutes | 44 (12.6%) | 13 (4.6%) |
| 30 to 34 Minutes | 6 (1.7%) | 20 (7.1%) |
| 35 to 39 Minutes | 25 (7.2%) | 12 (4.3%) |
| 40 to 44 Minutes | 21 (6.0%) | 12 (4.3%) |
| 45 to 59 Minutes | 22 (6.3%) | 35 (12.5%) |
| 60 to 89 Minutes | 171 (49.0%) | 24 (8.5%) |
| 90 or more Minutes | 12 (3.4%) | 24 (8.5%) |
Time of Departure to Work by Sex in Vernon Valley
The most frequent times of departure to work in Vernon Valley are 5:30 AM to 5:59 AM (66, 18.9%) for males and 7:00 AM to 7:29 AM (51, 18.1%) for females.
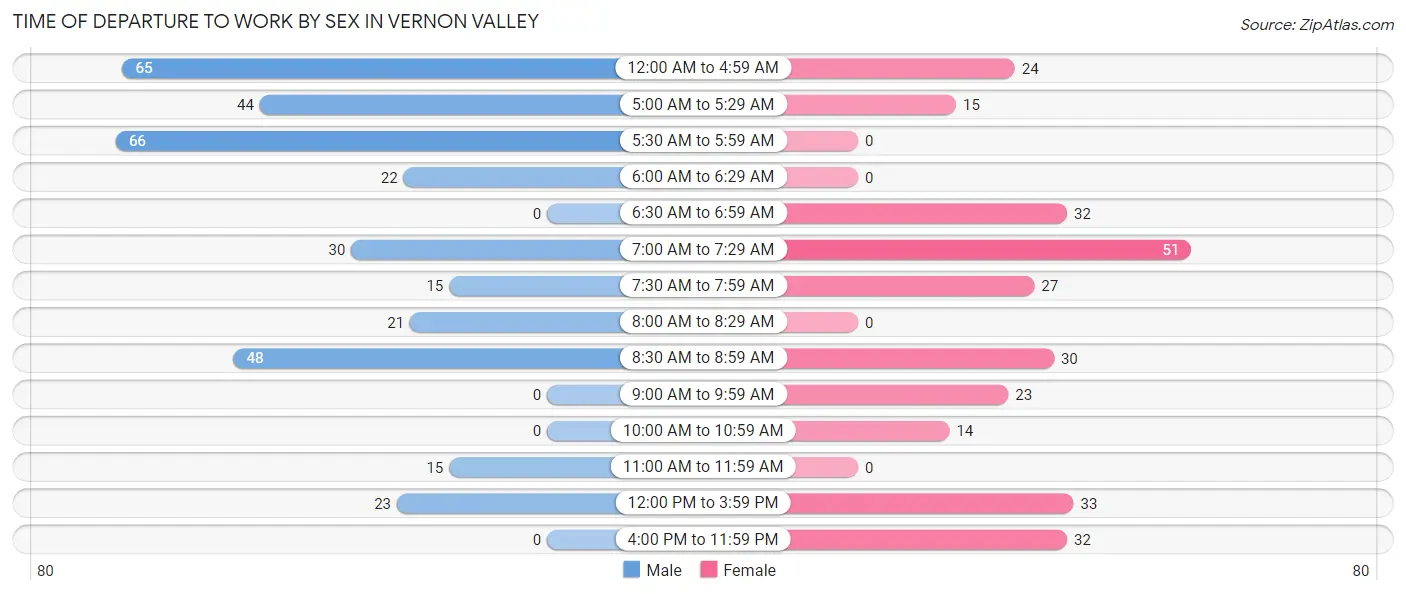
| Time of Departure | Male | Female |
| 12:00 AM to 4:59 AM | 65 (18.6%) | 24 (8.5%) |
| 5:00 AM to 5:29 AM | 44 (12.6%) | 15 (5.3%) |
| 5:30 AM to 5:59 AM | 66 (18.9%) | 0 (0.0%) |
| 6:00 AM to 6:29 AM | 22 (6.3%) | 0 (0.0%) |
| 6:30 AM to 6:59 AM | 0 (0.0%) | 32 (11.4%) |
| 7:00 AM to 7:29 AM | 30 (8.6%) | 51 (18.1%) |
| 7:30 AM to 7:59 AM | 15 (4.3%) | 27 (9.6%) |
| 8:00 AM to 8:29 AM | 21 (6.0%) | 0 (0.0%) |
| 8:30 AM to 8:59 AM | 48 (13.8%) | 30 (10.7%) |
| 9:00 AM to 9:59 AM | 0 (0.0%) | 23 (8.2%) |
| 10:00 AM to 10:59 AM | 0 (0.0%) | 14 (5.0%) |
| 11:00 AM to 11:59 AM | 15 (4.3%) | 0 (0.0%) |
| 12:00 PM to 3:59 PM | 23 (6.6%) | 33 (11.7%) |
| 4:00 PM to 11:59 PM | 0 (0.0%) | 32 (11.4%) |
| Total | 349 (100.0%) | 281 (100.0%) |
Housing Occupancy in Vernon Valley
Occupancy by Ownership in Vernon Valley
Of the total 436 dwellings in Vernon Valley, owner-occupied units account for 436 (100.0%), while renter-occupied units make up 0 (0.0%).
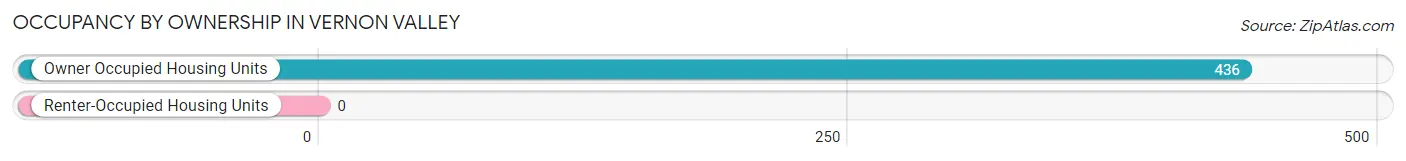
| Occupancy | # Housing Units | % Housing Units |
| Owner Occupied Housing Units | 436 | 100.0% |
| Renter-Occupied Housing Units | 0 | 0.0% |
| Total Occupied Housing Units | 436 | 100.0% |
Occupancy by Household Size in Vernon Valley
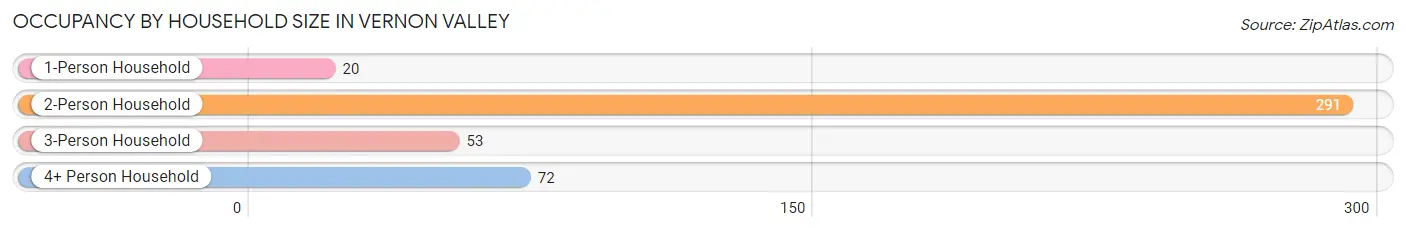
| Household Size | # Housing Units | % Housing Units |
| 1-Person Household | 20 | 4.6% |
| 2-Person Household | 291 | 66.7% |
| 3-Person Household | 53 | 12.2% |
| 4+ Person Household | 72 | 16.5% |
| Total Housing Units | 436 | 100.0% |
Occupancy by Ownership by Household Size in Vernon Valley
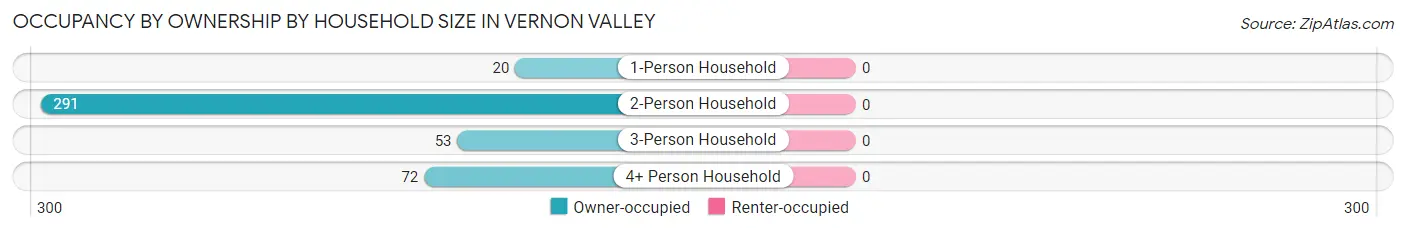
| Household Size | Owner-occupied | Renter-occupied |
| 1-Person Household | 20 (100.0%) | 0 (0.0%) |
| 2-Person Household | 291 (100.0%) | 0 (0.0%) |
| 3-Person Household | 53 (100.0%) | 0 (0.0%) |
| 4+ Person Household | 72 (100.0%) | 0 (0.0%) |
| Total Housing Units | 436 (100.0%) | 0 (0.0%) |
Occupancy by Educational Attainment in Vernon Valley
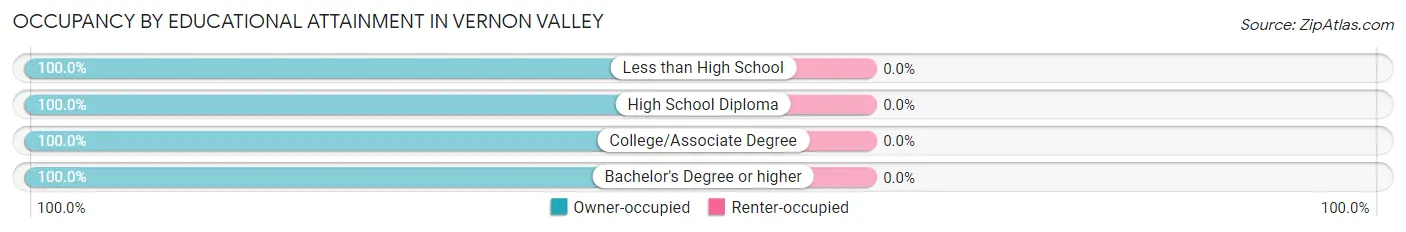
| Household Size | Owner-occupied | Renter-occupied |
| Less than High School | 25 (100.0%) | 0 (0.0%) |
| High School Diploma | 127 (100.0%) | 0 (0.0%) |
| College/Associate Degree | 147 (100.0%) | 0 (0.0%) |
| Bachelor's Degree or higher | 137 (100.0%) | 0 (0.0%) |
Occupancy by Age of Householder in Vernon Valley
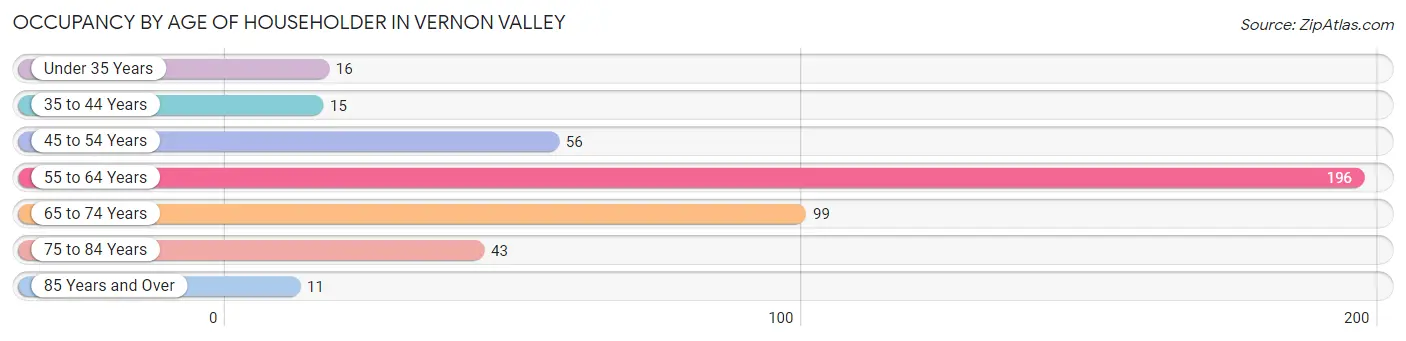
| Age Bracket | # Households | % Households |
| Under 35 Years | 16 | 3.7% |
| 35 to 44 Years | 15 | 3.4% |
| 45 to 54 Years | 56 | 12.8% |
| 55 to 64 Years | 196 | 45.0% |
| 65 to 74 Years | 99 | 22.7% |
| 75 to 84 Years | 43 | 9.9% |
| 85 Years and Over | 11 | 2.5% |
| Total | 436 | 100.0% |
Housing Finances in Vernon Valley
Median Income by Occupancy in Vernon Valley
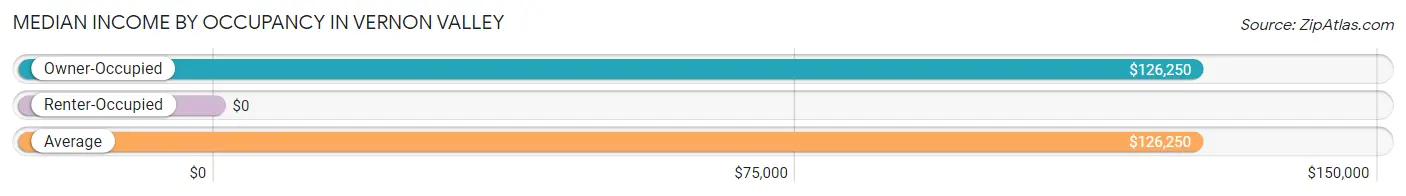
| Occupancy Type | # Households | Median Income |
| Owner-Occupied | 436 (100.0%) | $126,250 |
| Renter-Occupied | 0 (0.0%) | $0 |
| Average | 436 (100.0%) | $126,250 |
Occupancy by Householder Income Bracket in Vernon Valley
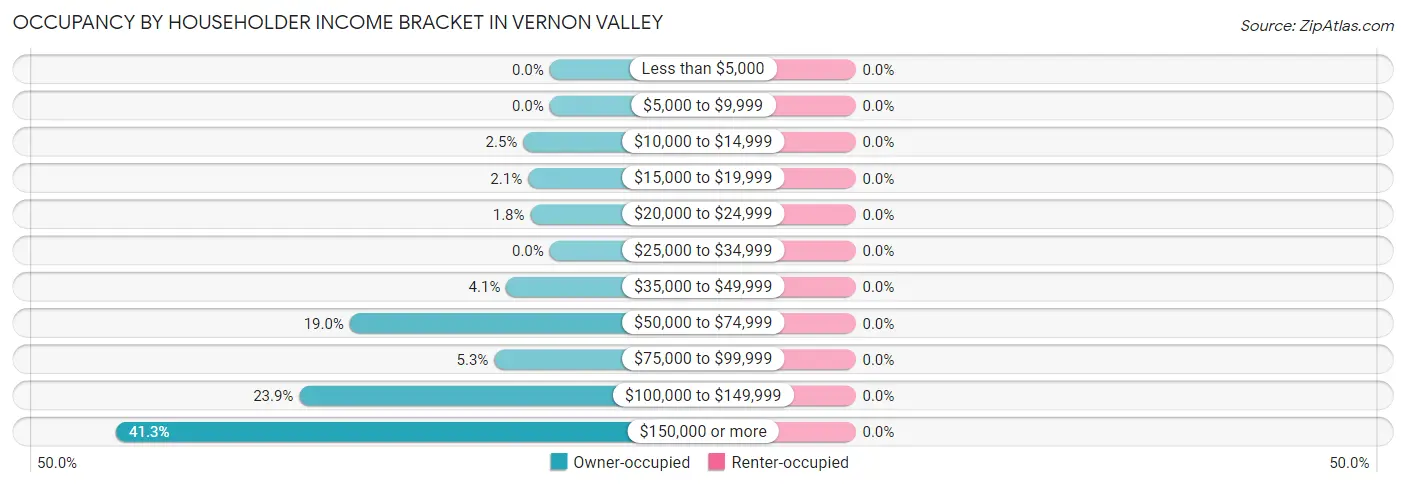
| Income Bracket | Owner-occupied | Renter-occupied |
| Less than $5,000 | 0 (0.0%) | 0 (0.0%) |
| $5,000 to $9,999 | 0 (0.0%) | 0 (0.0%) |
| $10,000 to $14,999 | 11 (2.5%) | 0 (0.0%) |
| $15,000 to $19,999 | 9 (2.1%) | 0 (0.0%) |
| $20,000 to $24,999 | 8 (1.8%) | 0 (0.0%) |
| $25,000 to $34,999 | 0 (0.0%) | 0 (0.0%) |
| $35,000 to $49,999 | 18 (4.1%) | 0 (0.0%) |
| $50,000 to $74,999 | 83 (19.0%) | 0 (0.0%) |
| $75,000 to $99,999 | 23 (5.3%) | 0 (0.0%) |
| $100,000 to $149,999 | 104 (23.8%) | 0 (0.0%) |
| $150,000 or more | 180 (41.3%) | 0 (0.0%) |
| Total | 436 (100.0%) | 0 (0.0%) |
Monthly Housing Cost Tiers in Vernon Valley
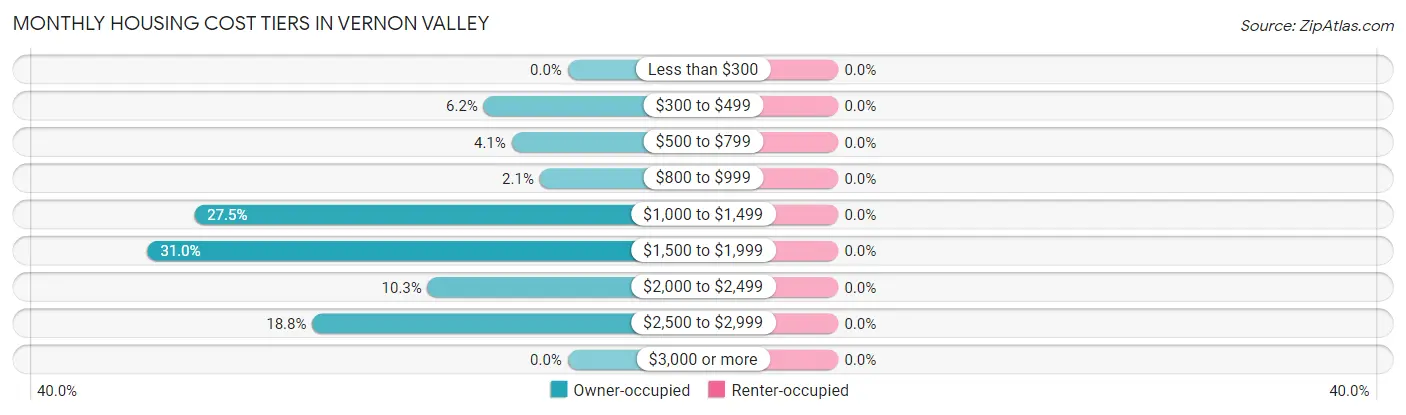
| Monthly Cost | Owner-occupied | Renter-occupied |
| Less than $300 | 0 (0.0%) | 0 (0.0%) |
| $300 to $499 | 27 (6.2%) | 0 (0.0%) |
| $500 to $799 | 18 (4.1%) | 0 (0.0%) |
| $800 to $999 | 9 (2.1%) | 0 (0.0%) |
| $1,000 to $1,499 | 120 (27.5%) | 0 (0.0%) |
| $1,500 to $1,999 | 135 (31.0%) | 0 (0.0%) |
| $2,000 to $2,499 | 45 (10.3%) | 0 (0.0%) |
| $2,500 to $2,999 | 82 (18.8%) | 0 (0.0%) |
| $3,000 or more | 0 (0.0%) | 0 (0.0%) |
| Total | 436 (100.0%) | 0 (0.0%) |
Physical Housing Characteristics in Vernon Valley
Housing Structures in Vernon Valley
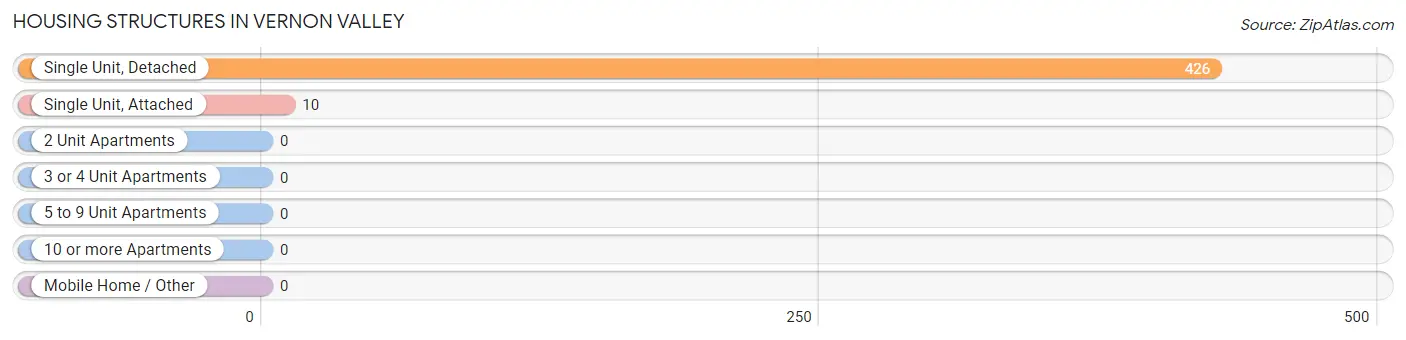
| Structure Type | # Housing Units | % Housing Units |
| Single Unit, Detached | 426 | 97.7% |
| Single Unit, Attached | 10 | 2.3% |
| 2 Unit Apartments | 0 | 0.0% |
| 3 or 4 Unit Apartments | 0 | 0.0% |
| 5 to 9 Unit Apartments | 0 | 0.0% |
| 10 or more Apartments | 0 | 0.0% |
| Mobile Home / Other | 0 | 0.0% |
| Total | 436 | 100.0% |
Housing Structures by Occupancy in Vernon Valley
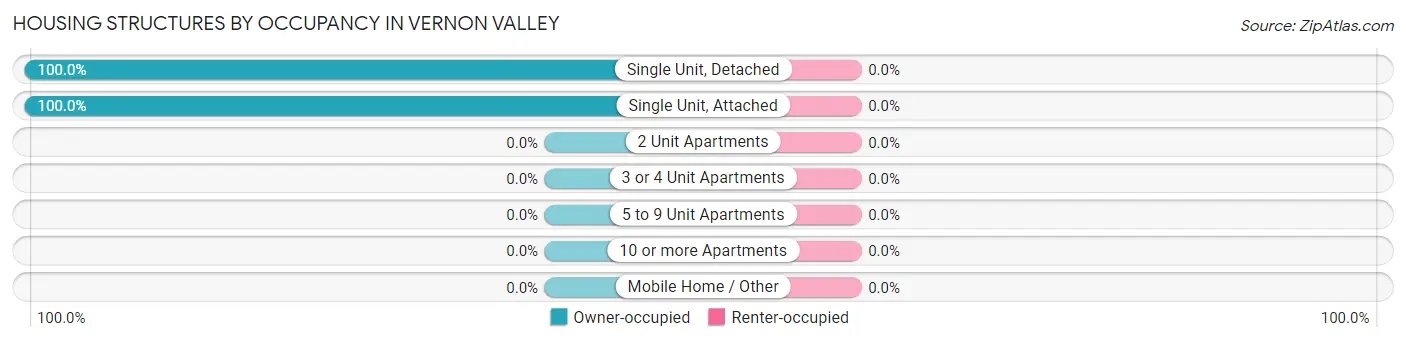
| Structure Type | Owner-occupied | Renter-occupied |
| Single Unit, Detached | 426 (100.0%) | 0 (0.0%) |
| Single Unit, Attached | 10 (100.0%) | 0 (0.0%) |
| 2 Unit Apartments | 0 (0.0%) | 0 (0.0%) |
| 3 or 4 Unit Apartments | 0 (0.0%) | 0 (0.0%) |
| 5 to 9 Unit Apartments | 0 (0.0%) | 0 (0.0%) |
| 10 or more Apartments | 0 (0.0%) | 0 (0.0%) |
| Mobile Home / Other | 0 (0.0%) | 0 (0.0%) |
| Total | 436 (100.0%) | 0 (0.0%) |
Housing Structures by Number of Rooms in Vernon Valley
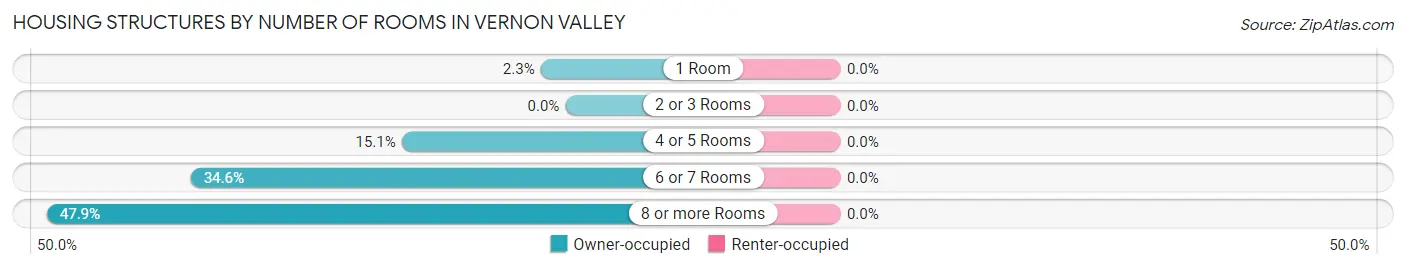
| Number of Rooms | Owner-occupied | Renter-occupied |
| 1 Room | 10 (2.3%) | 0 (0.0%) |
| 2 or 3 Rooms | 0 (0.0%) | 0 (0.0%) |
| 4 or 5 Rooms | 66 (15.1%) | 0 (0.0%) |
| 6 or 7 Rooms | 151 (34.6%) | 0 (0.0%) |
| 8 or more Rooms | 209 (47.9%) | 0 (0.0%) |
| Total | 436 (100.0%) | 0 (0.0%) |
Housing Structure by Heating Type in Vernon Valley
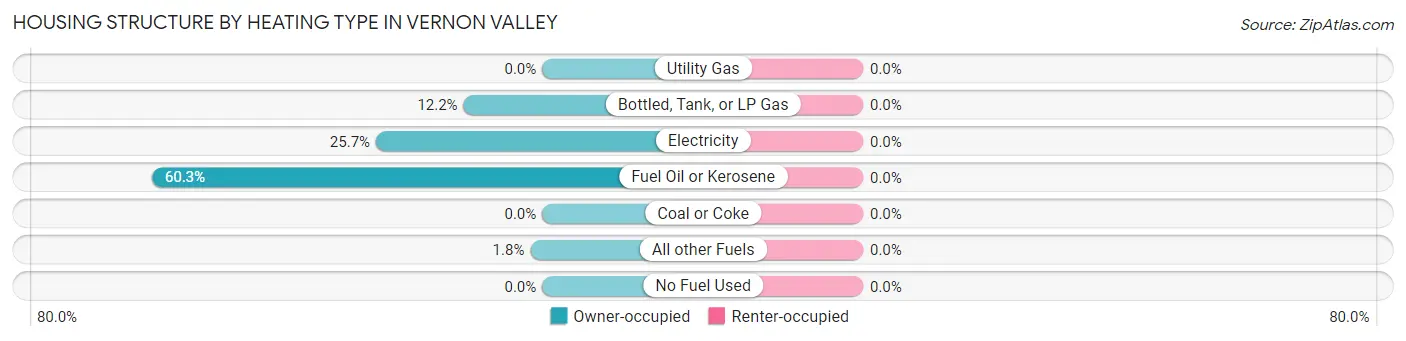
| Heating Type | Owner-occupied | Renter-occupied |
| Utility Gas | 0 (0.0%) | 0 (0.0%) |
| Bottled, Tank, or LP Gas | 53 (12.2%) | 0 (0.0%) |
| Electricity | 112 (25.7%) | 0 (0.0%) |
| Fuel Oil or Kerosene | 263 (60.3%) | 0 (0.0%) |
| Coal or Coke | 0 (0.0%) | 0 (0.0%) |
| All other Fuels | 8 (1.8%) | 0 (0.0%) |
| No Fuel Used | 0 (0.0%) | 0 (0.0%) |
| Total | 436 (100.0%) | 0 (0.0%) |
Household Vehicle Usage in Vernon Valley
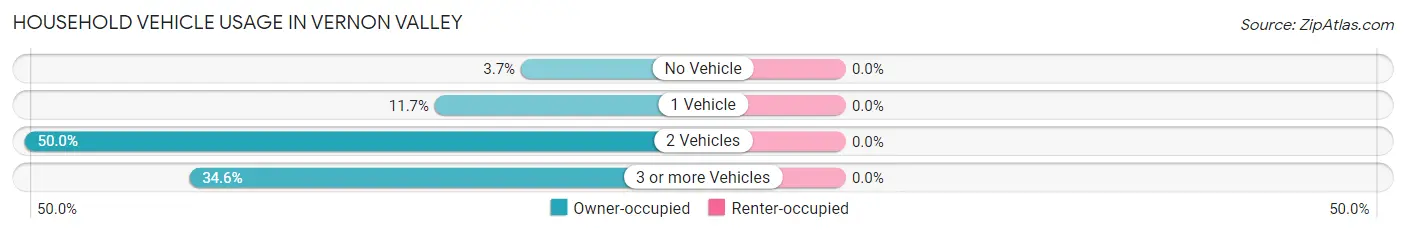
| Vehicles per Household | Owner-occupied | Renter-occupied |
| No Vehicle | 16 (3.7%) | 0 (0.0%) |
| 1 Vehicle | 51 (11.7%) | 0 (0.0%) |
| 2 Vehicles | 218 (50.0%) | 0 (0.0%) |
| 3 or more Vehicles | 151 (34.6%) | 0 (0.0%) |
| Total | 436 (100.0%) | 0 (0.0%) |
Real Estate & Mortgages in Vernon Valley
Real Estate and Mortgage Overview in Vernon Valley
| Characteristic | Without Mortgage | With Mortgage |
| Housing Units | 145 | 291 |
| Median Property Value | $300,900 | $284,300 |
| Median Household Income | $119,659 | $117 |
| Monthly Housing Costs | $1,060 | $0 |
| Real Estate Taxes | $7,873 | $0 |
Property Value by Mortgage Status in Vernon Valley
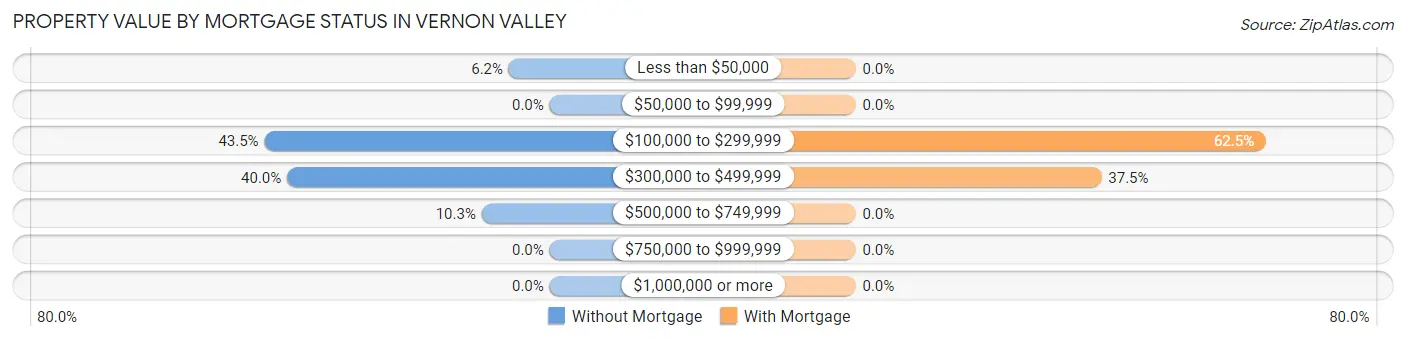
| Property Value | Without Mortgage | With Mortgage |
| Less than $50,000 | 9 (6.2%) | 0 (0.0%) |
| $50,000 to $99,999 | 0 (0.0%) | 0 (0.0%) |
| $100,000 to $299,999 | 63 (43.4%) | 182 (62.5%) |
| $300,000 to $499,999 | 58 (40.0%) | 109 (37.5%) |
| $500,000 to $749,999 | 15 (10.3%) | 0 (0.0%) |
| $750,000 to $999,999 | 0 (0.0%) | 0 (0.0%) |
| $1,000,000 or more | 0 (0.0%) | 0 (0.0%) |
| Total | 145 (100.0%) | 291 (100.0%) |
Household Income by Mortgage Status in Vernon Valley
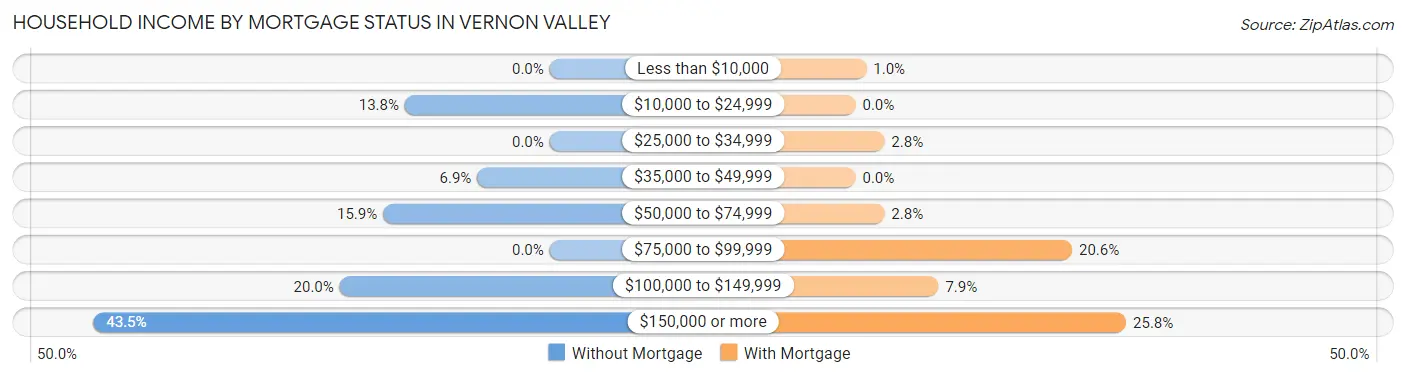
| Household Income | Without Mortgage | With Mortgage |
| Less than $10,000 | 0 (0.0%) | 3 (1.0%) |
| $10,000 to $24,999 | 20 (13.8%) | 0 (0.0%) |
| $25,000 to $34,999 | 0 (0.0%) | 8 (2.8%) |
| $35,000 to $49,999 | 10 (6.9%) | 0 (0.0%) |
| $50,000 to $74,999 | 23 (15.9%) | 8 (2.8%) |
| $75,000 to $99,999 | 0 (0.0%) | 60 (20.6%) |
| $100,000 to $149,999 | 29 (20.0%) | 23 (7.9%) |
| $150,000 or more | 63 (43.4%) | 75 (25.8%) |
| Total | 145 (100.0%) | 291 (100.0%) |
Property Value to Household Income Ratio in Vernon Valley
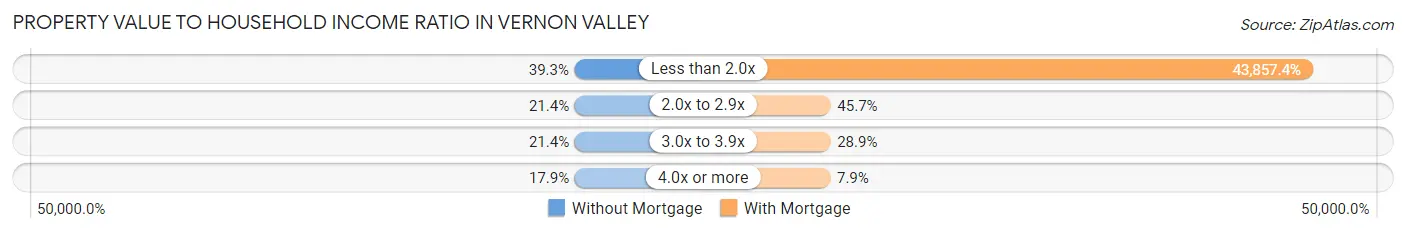
| Value-to-Income Ratio | Without Mortgage | With Mortgage |
| Less than 2.0x | 57 (39.3%) | 127,625 (43,857.4%) |
| 2.0x to 2.9x | 31 (21.4%) | 133 (45.7%) |
| 3.0x to 3.9x | 31 (21.4%) | 84 (28.9%) |
| 4.0x or more | 26 (17.9%) | 23 (7.9%) |
| Total | 145 (100.0%) | 291 (100.0%) |
Real Estate Taxes by Mortgage Status in Vernon Valley
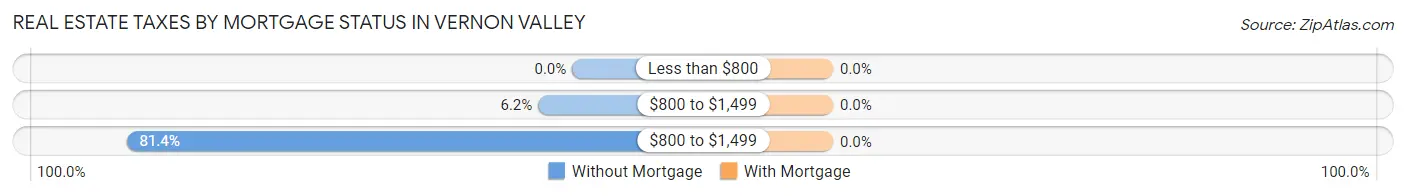
| Property Taxes | Without Mortgage | With Mortgage |
| Less than $800 | 0 (0.0%) | 0 (0.0%) |
| $800 to $1,499 | 9 (6.2%) | 0 (0.0%) |
| $800 to $1,499 | 118 (81.4%) | 0 (0.0%) |
| Total | 145 (100.0%) | 291 (100.0%) |
Health & Disability in Vernon Valley
Health Insurance Coverage by Age in Vernon Valley
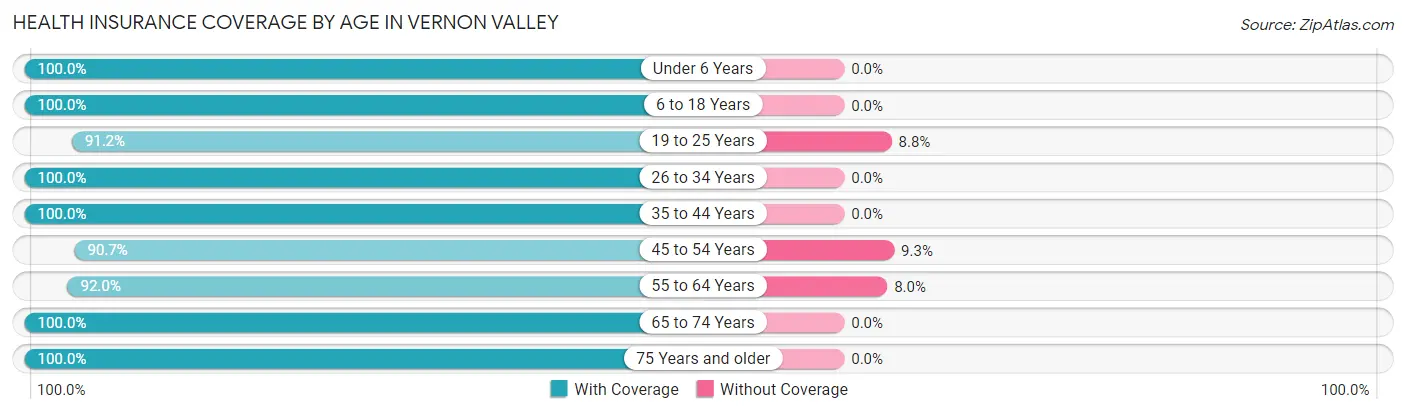
| Age Bracket | With Coverage | Without Coverage |
| Under 6 Years | 31 (100.0%) | 0 (0.0%) |
| 6 to 18 Years | 45 (100.0%) | 0 (0.0%) |
| 19 to 25 Years | 155 (91.2%) | 15 (8.8%) |
| 26 to 34 Years | 87 (100.0%) | 0 (0.0%) |
| 35 to 44 Years | 34 (100.0%) | 0 (0.0%) |
| 45 to 54 Years | 117 (90.7%) | 12 (9.3%) |
| 55 to 64 Years | 287 (92.0%) | 25 (8.0%) |
| 65 to 74 Years | 208 (100.0%) | 0 (0.0%) |
| 75 Years and older | 68 (100.0%) | 0 (0.0%) |
| Total | 1,032 (95.2%) | 52 (4.8%) |
Health Insurance Coverage by Citizenship Status in Vernon Valley
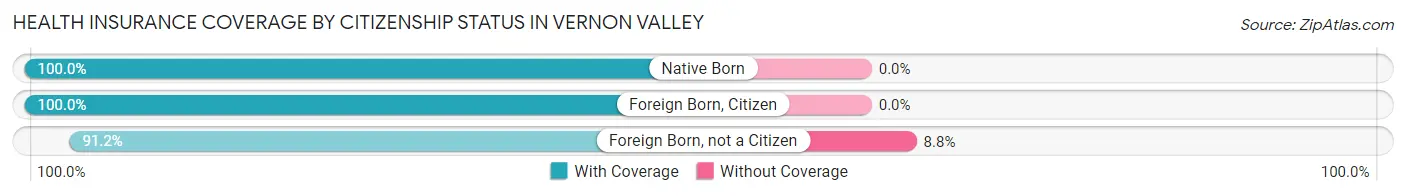
| Citizenship Status | With Coverage | Without Coverage |
| Native Born | 31 (100.0%) | 0 (0.0%) |
| Foreign Born, Citizen | 45 (100.0%) | 0 (0.0%) |
| Foreign Born, not a Citizen | 155 (91.2%) | 15 (8.8%) |
Health Insurance Coverage by Household Income in Vernon Valley
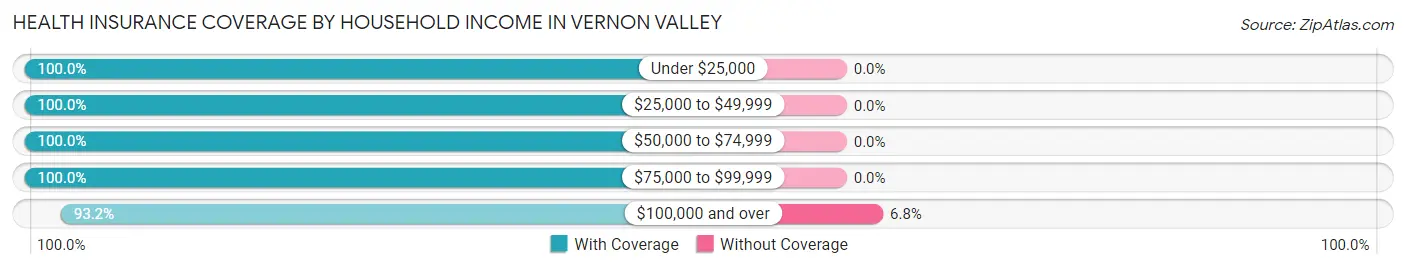
| Household Income | With Coverage | Without Coverage |
| Under $25,000 | 38 (100.0%) | 0 (0.0%) |
| $25,000 to $49,999 | 38 (100.0%) | 0 (0.0%) |
| $50,000 to $74,999 | 201 (100.0%) | 0 (0.0%) |
| $75,000 to $99,999 | 42 (100.0%) | 0 (0.0%) |
| $100,000 and over | 713 (93.2%) | 52 (6.8%) |
Public vs Private Health Insurance Coverage by Age in Vernon Valley
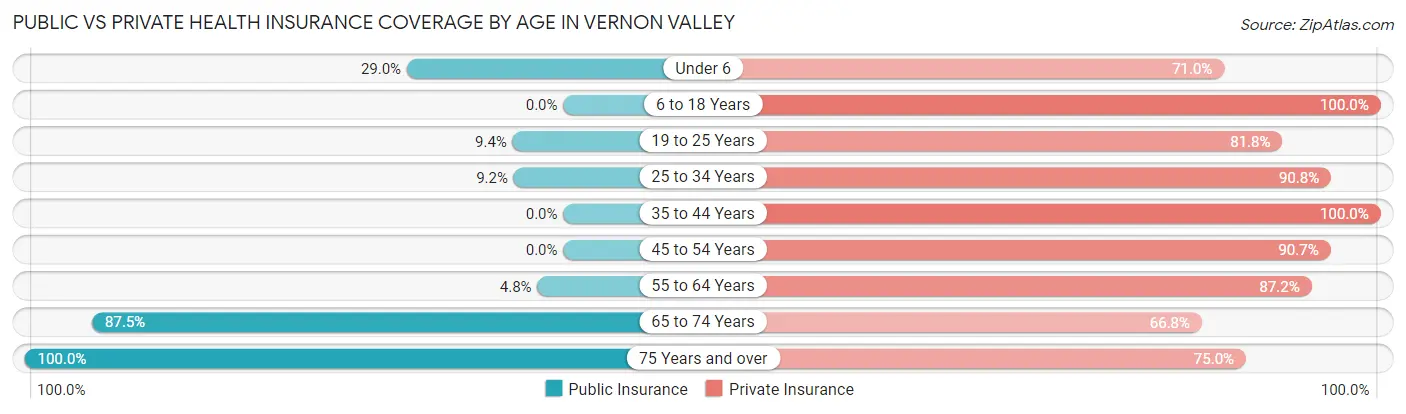
| Age Bracket | Public Insurance | Private Insurance |
| Under 6 | 9 (29.0%) | 22 (71.0%) |
| 6 to 18 Years | 0 (0.0%) | 45 (100.0%) |
| 19 to 25 Years | 16 (9.4%) | 139 (81.8%) |
| 25 to 34 Years | 8 (9.2%) | 79 (90.8%) |
| 35 to 44 Years | 0 (0.0%) | 34 (100.0%) |
| 45 to 54 Years | 0 (0.0%) | 117 (90.7%) |
| 55 to 64 Years | 15 (4.8%) | 272 (87.2%) |
| 65 to 74 Years | 182 (87.5%) | 139 (66.8%) |
| 75 Years and over | 68 (100.0%) | 51 (75.0%) |
| Total | 298 (27.5%) | 898 (82.8%) |
Disability Status by Sex by Age in Vernon Valley
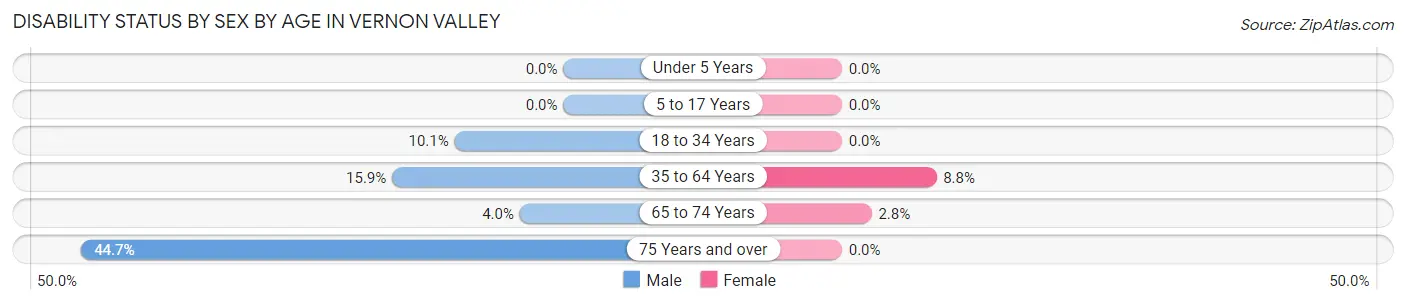
| Age Bracket | Male | Female |
| Under 5 Years | 0 (0.0%) | 0 (0.0%) |
| 5 to 17 Years | 0 (0.0%) | 0 (0.0%) |
| 18 to 34 Years | 10 (10.1%) | 0 (0.0%) |
| 35 to 64 Years | 41 (15.9%) | 19 (8.8%) |
| 65 to 74 Years | 4 (4.0%) | 3 (2.8%) |
| 75 Years and over | 17 (44.7%) | 0 (0.0%) |
Disability Class by Sex by Age in Vernon Valley
Disability Class: Hearing Difficulty
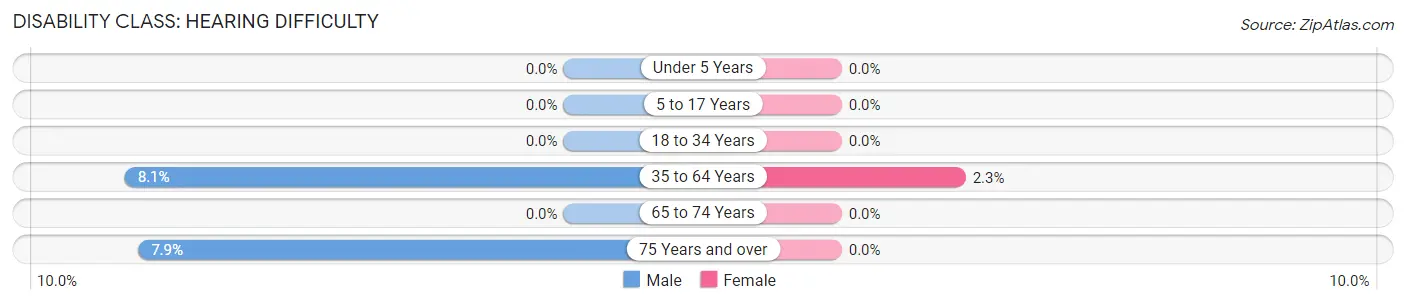
| Age Bracket | Male | Female |
| Under 5 Years | 0 (0.0%) | 0 (0.0%) |
| 5 to 17 Years | 0 (0.0%) | 0 (0.0%) |
| 18 to 34 Years | 0 (0.0%) | 0 (0.0%) |
| 35 to 64 Years | 21 (8.1%) | 5 (2.3%) |
| 65 to 74 Years | 0 (0.0%) | 0 (0.0%) |
| 75 Years and over | 3 (7.9%) | 0 (0.0%) |
Disability Class: Vision Difficulty
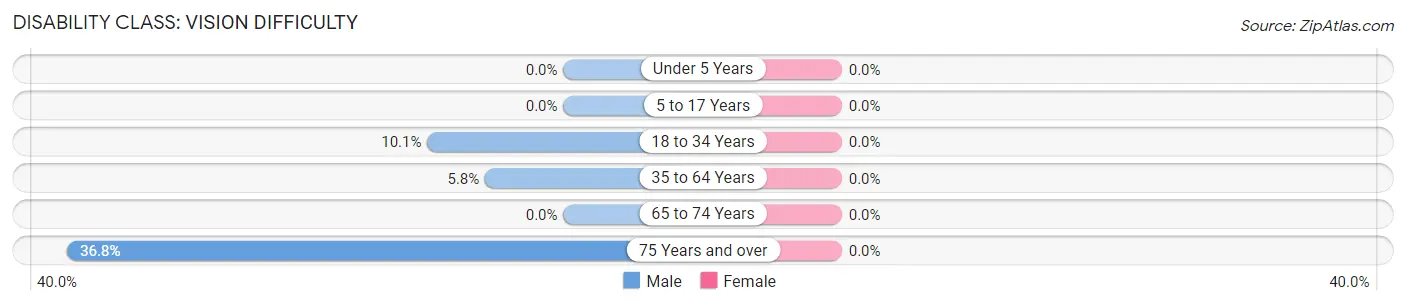
| Age Bracket | Male | Female |
| Under 5 Years | 0 (0.0%) | 0 (0.0%) |
| 5 to 17 Years | 0 (0.0%) | 0 (0.0%) |
| 18 to 34 Years | 10 (10.1%) | 0 (0.0%) |
| 35 to 64 Years | 15 (5.8%) | 0 (0.0%) |
| 65 to 74 Years | 0 (0.0%) | 0 (0.0%) |
| 75 Years and over | 14 (36.8%) | 0 (0.0%) |
Disability Class: Cognitive Difficulty
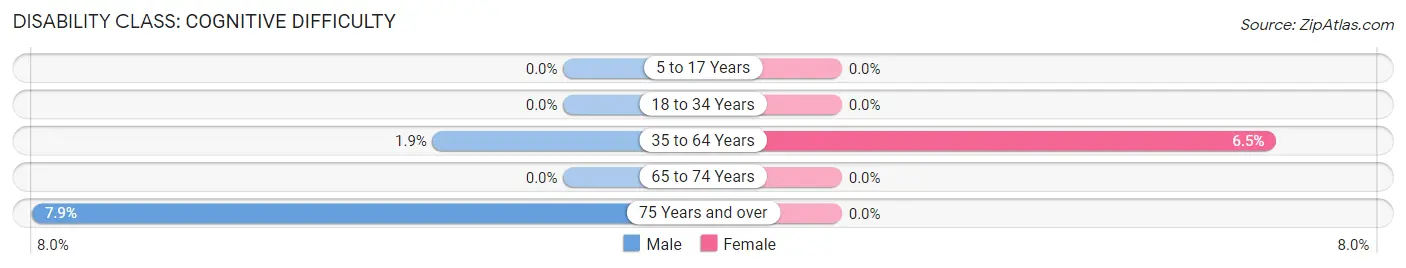
| Age Bracket | Male | Female |
| 5 to 17 Years | 0 (0.0%) | 0 (0.0%) |
| 18 to 34 Years | 0 (0.0%) | 0 (0.0%) |
| 35 to 64 Years | 5 (1.9%) | 14 (6.5%) |
| 65 to 74 Years | 0 (0.0%) | 0 (0.0%) |
| 75 Years and over | 3 (7.9%) | 0 (0.0%) |
Disability Class: Ambulatory Difficulty
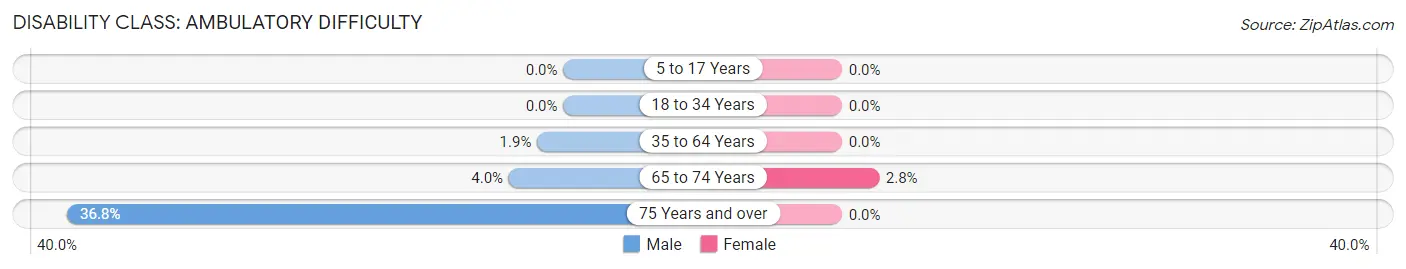
| Age Bracket | Male | Female |
| 5 to 17 Years | 0 (0.0%) | 0 (0.0%) |
| 18 to 34 Years | 0 (0.0%) | 0 (0.0%) |
| 35 to 64 Years | 5 (1.9%) | 0 (0.0%) |
| 65 to 74 Years | 4 (4.0%) | 3 (2.8%) |
| 75 Years and over | 14 (36.8%) | 0 (0.0%) |
Disability Class: Self-Care Difficulty
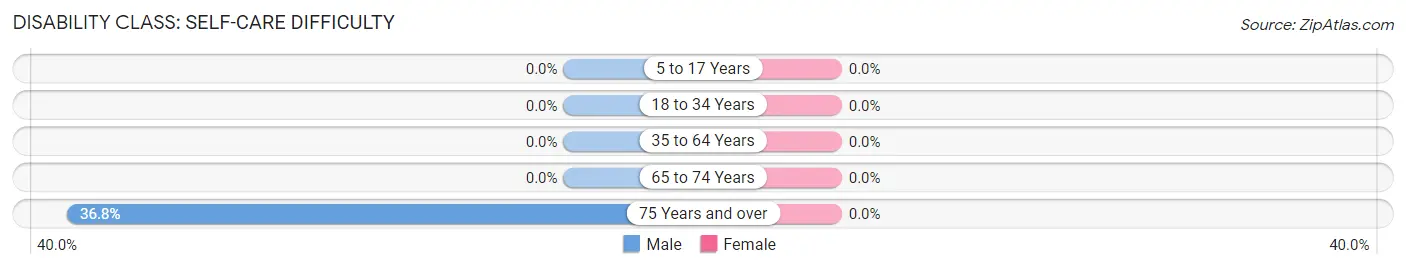
| Age Bracket | Male | Female |
| 5 to 17 Years | 0 (0.0%) | 0 (0.0%) |
| 18 to 34 Years | 0 (0.0%) | 0 (0.0%) |
| 35 to 64 Years | 0 (0.0%) | 0 (0.0%) |
| 65 to 74 Years | 0 (0.0%) | 0 (0.0%) |
| 75 Years and over | 14 (36.8%) | 0 (0.0%) |
Technology Access in Vernon Valley
Computing Device Access in Vernon Valley
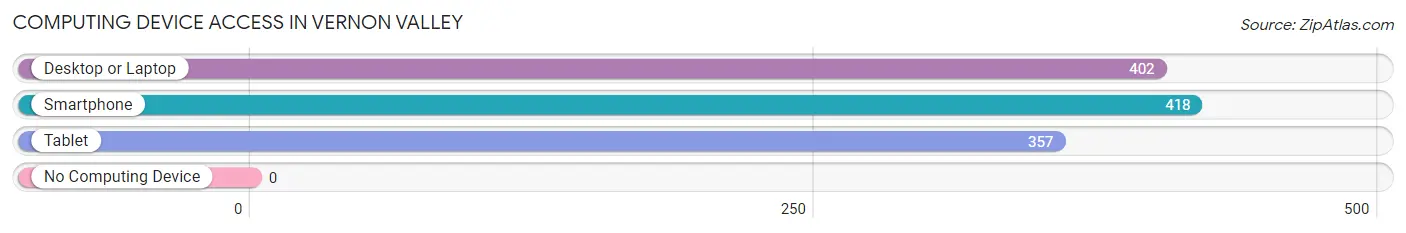
| Device Type | # Households | % Households |
| Desktop or Laptop | 402 | 92.2% |
| Smartphone | 418 | 95.9% |
| Tablet | 357 | 81.9% |
| No Computing Device | 0 | 0.0% |
| Total | 436 | 100.0% |
Internet Access in Vernon Valley
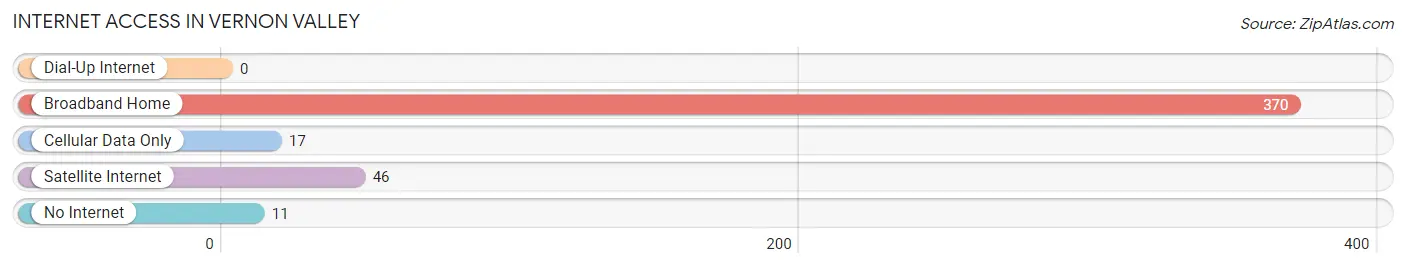
| Internet Type | # Households | % Households |
| Dial-Up Internet | 0 | 0.0% |
| Broadband Home | 370 | 84.9% |
| Cellular Data Only | 17 | 3.9% |
| Satellite Internet | 46 | 10.5% |
| No Internet | 11 | 2.5% |
| Total | 436 | 100.0% |
Vernon Valley Summary
Vernon Valley is a small town located in Sussex County, New Jersey. It is situated in the Kittatinny Valley, which is part of the Great Appalachian Valley. The town is bordered by the towns of Wantage, Hardyston, and Vernon. The population of Vernon Valley was 2,845 as of the 2010 census.
History
Vernon Valley was first settled in the late 1700s by Dutch and German immigrants. The town was originally known as "Vernon" and was part of the larger township of Wantage. In 1824, the town was officially incorporated as the Township of Vernon. In 1892, the name was changed to Vernon Valley to distinguish it from the other townships in the area.
Geography
Vernon Valley is located in the Kittatinny Valley, which is part of the Great Appalachian Valley. The town is bordered by the towns of Wantage, Hardyston, and Vernon. The town is located in the Kittatinny Mountains, which are part of the Appalachian Mountains. The highest point in the town is the summit of High Point Mountain, which is 1,803 feet (549 m) above sea level.
The town is located in the Kittatinny Valley, which is part of the Great Appalachian Valley. The valley is surrounded by the Kittatinny Mountains, which are part of the Appalachian Mountains. The valley is home to several rivers, including the Wallkill River, the Pequest River, and the Paulinskill River.
Economy
Vernon Valley is a small, rural town with a primarily agricultural economy. The town is home to several farms, including dairy farms, vegetable farms, and fruit farms. The town is also home to several small businesses, including restaurants, retail stores, and service providers.
Demographics
As of the 2010 census, the population of Vernon Valley was 2,845. The racial makeup of the town was 94.3% White, 2.2% African American, 0.3% Native American, 0.7% Asian, 0.1% Pacific Islander, 1.2% from other races, and 1.3% from two or more races. Hispanic or Latino of any race were 4.2% of the population.
The median income for a household in the town was $60,938, and the median income for a family was $68,750. The per capita income for the town was $25,945. About 4.2% of families and 5.3% of the population were below the poverty line, including 6.2% of those under age 18 and 4.2% of those age 65 or over.
Common Questions
What is Per Capita Income in Vernon Valley?
Per Capita income in Vernon Valley is $52,895.
What is the Median Family Income in Vernon Valley?
Median Family Income in Vernon Valley is $127,679.
What is the Median Household income in Vernon Valley?
Median Household Income in Vernon Valley is $126,250.
What is Income or Wage Gap in Vernon Valley?
Income or Wage Gap in Vernon Valley is 58.0%.
Women in Vernon Valley earn 42.0 cents for every dollar earned by a man.
What is Inequality or Gini Index in Vernon Valley?
Inequality or Gini Index in Vernon Valley is 0.29.
What is the Total Population of Vernon Valley?
Total Population of Vernon Valley is 1,084.
What is the Total Male Population of Vernon Valley?
Total Male Population of Vernon Valley is 518.
What is the Total Female Population of Vernon Valley?
Total Female Population of Vernon Valley is 566.
What is the Ratio of Males per 100 Females in Vernon Valley?
There are 91.52 Males per 100 Females in Vernon Valley.
What is the Ratio of Females per 100 Males in Vernon Valley?
There are 109.27 Females per 100 Males in Vernon Valley.
What is the Median Population Age in Vernon Valley?
Median Population Age in Vernon Valley is 57.6 Years.
What is the Average Family Size in Vernon Valley
Average Family Size in Vernon Valley is 2.5 People.
What is the Average Household Size in Vernon Valley
Average Household Size in Vernon Valley is 2.5 People.
How Large is the Labor Force in Vernon Valley?
There are 713 People in the Labor Forcein in Vernon Valley.
What is the Percentage of People in the Labor Force in Vernon Valley?
69.3% of People are in the Labor Force in Vernon Valley.
What is the Unemployment Rate in Vernon Valley?
Unemployment Rate in Vernon Valley is 3.5%.