Ellisburg, NJ Map & Demographics
Ellisburg Map
Ellisburg Overview
$42,828
PER CAPITA INCOME
$126,823
AVG FAMILY INCOME
$88,486
AVG HOUSEHOLD INCOME
28.8%
WAGE / INCOME GAP [ % ]
71.2¢/ $1
WAGE / INCOME GAP [ $ ]
0.47
INEQUALITY / GINI INDEX
5,476
TOTAL POPULATION
2,940
MALE POPULATION
2,536
FEMALE POPULATION
115.93
MALES / 100 FEMALES
86.26
FEMALES / 100 MALES
37.8
MEDIAN AGE
3.5
AVG FAMILY SIZE
2.7
AVG HOUSEHOLD SIZE
2,505
LABOR FORCE [ PEOPLE ]
59.2%
PERCENT IN LABOR FORCE
10.5%
UNEMPLOYMENT RATE
Income in Ellisburg
Income Overview in Ellisburg
Per Capita Income in Ellisburg is $42,828, while median incomes of families and households are $126,823 and $88,486 respectively.
| Characteristic | Number | Measure |
| Per Capita Income | 5,476 | $42,828 |
| Median Family Income | 1,249 | $126,823 |
| Mean Family Income | 1,249 | $155,157 |
| Median Household Income | 1,965 | $88,486 |
| Mean Household Income | 1,965 | $117,333 |
| Income Deficit | 1,249 | $0 |
| Wage / Income Gap (%) | 5,476 | 28.82% |
| Wage / Income Gap ($) | 5,476 | 71.18¢ per $1 |
| Gini / Inequality Index | 5,476 | 0.47 |
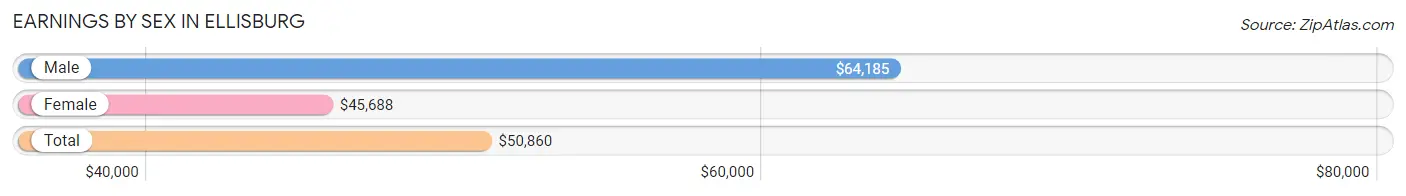
Earnings by Sex in Ellisburg
Average Earnings in Ellisburg are $50,860, $64,185 for men and $45,688 for women, a difference of 28.8%.
| Sex | Number | Average Earnings |
| Male | 1,209 (46.3%) | $64,185 |
| Female | 1,404 (53.7%) | $45,688 |
| Total | 2,613 (100.0%) | $50,860 |
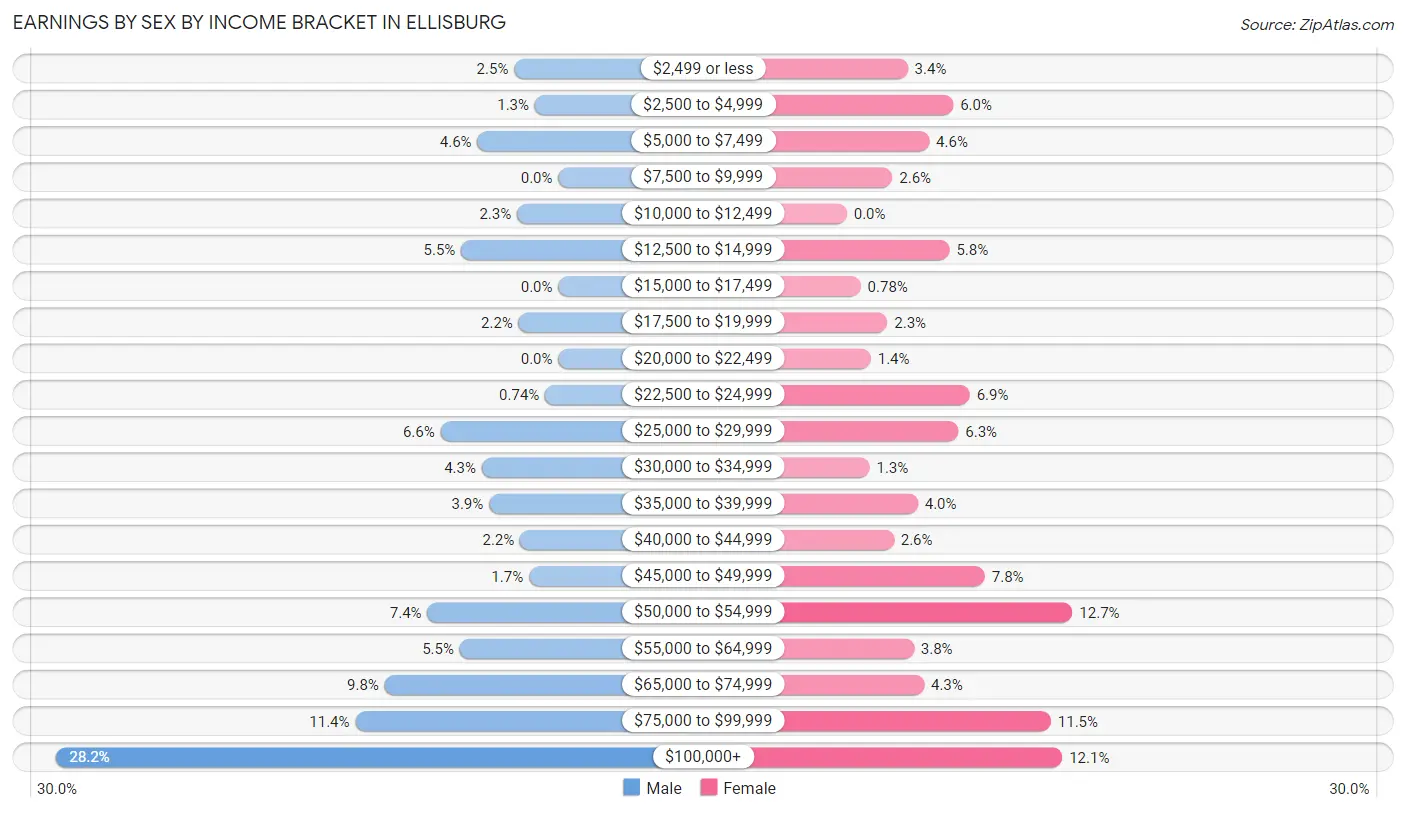
Earnings by Sex by Income Bracket in Ellisburg
The most common earnings brackets in Ellisburg are $100,000+ for men (341 | 28.2%) and $50,000 to $54,999 for women (178 | 12.7%).
| Income | Male | Female |
| $2,499 or less | 30 (2.5%) | 48 (3.4%) |
| $2,500 to $4,999 | 16 (1.3%) | 84 (6.0%) |
| $5,000 to $7,499 | 55 (4.5%) | 65 (4.6%) |
| $7,500 to $9,999 | 0 (0.0%) | 36 (2.6%) |
| $10,000 to $12,499 | 28 (2.3%) | 0 (0.0%) |
| $12,500 to $14,999 | 66 (5.5%) | 81 (5.8%) |
| $15,000 to $17,499 | 0 (0.0%) | 11 (0.8%) |
| $17,500 to $19,999 | 27 (2.2%) | 32 (2.3%) |
| $20,000 to $22,499 | 0 (0.0%) | 19 (1.3%) |
| $22,500 to $24,999 | 9 (0.7%) | 97 (6.9%) |
| $25,000 to $29,999 | 80 (6.6%) | 88 (6.3%) |
| $30,000 to $34,999 | 52 (4.3%) | 18 (1.3%) |
| $35,000 to $39,999 | 47 (3.9%) | 56 (4.0%) |
| $40,000 to $44,999 | 26 (2.1%) | 37 (2.6%) |
| $45,000 to $49,999 | 20 (1.7%) | 109 (7.8%) |
| $50,000 to $54,999 | 89 (7.4%) | 178 (12.7%) |
| $55,000 to $64,999 | 67 (5.5%) | 53 (3.8%) |
| $65,000 to $74,999 | 118 (9.8%) | 61 (4.3%) |
| $75,000 to $99,999 | 138 (11.4%) | 161 (11.5%) |
| $100,000+ | 341 (28.2%) | 170 (12.1%) |
| Total | 1,209 (100.0%) | 1,404 (100.0%) |
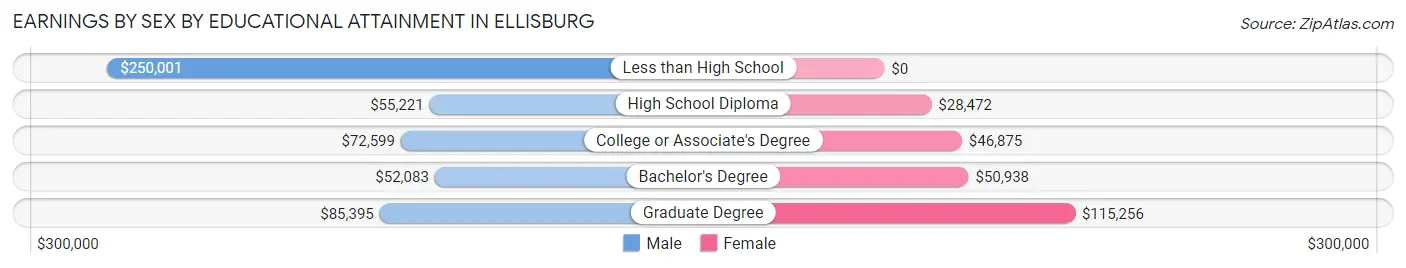
Earnings by Sex by Educational Attainment in Ellisburg
Average earnings in Ellisburg are $68,611 for men and $47,225 for women, a difference of 31.2%. Men with an educational attainment of less than high school enjoy the highest average annual earnings of $250,001, while those with bachelor's degree education earn the least with $52,083. Women with an educational attainment of graduate degree earn the most with the average annual earnings of $115,256, while those with high school diploma education have the smallest earnings of $28,472.
| Educational Attainment | Male Income | Female Income |
| Less than High School | $250,001 | $0 |
| High School Diploma | $55,221 | $28,472 |
| College or Associate's Degree | $72,599 | $46,875 |
| Bachelor's Degree | $52,083 | $50,938 |
| Graduate Degree | $85,395 | $115,256 |
| Total | $68,611 | $47,225 |
Family Income in Ellisburg
Family Income Brackets in Ellisburg
According to the Ellisburg family income data, there are 395 families falling into the $100,000 to $149,999 income range, which is the most common income bracket and makes up 31.6% of all families. Conversely, the less than $10,000 income bracket is the least frequent group with only 11 families (0.9%) belonging to this category.
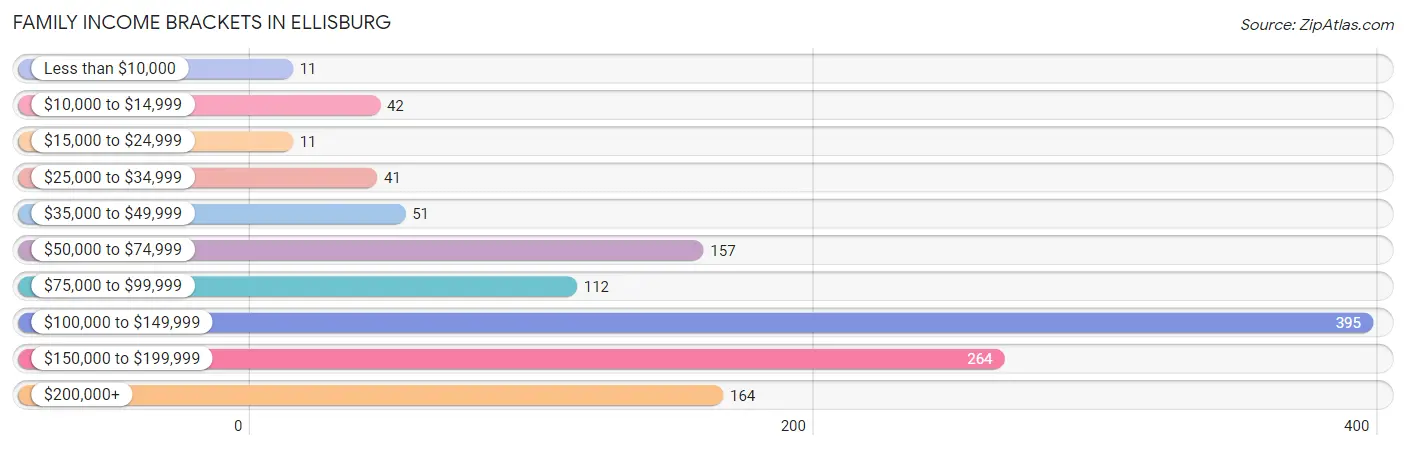
| Income Bracket | # Families | % Families |
| Less than $10,000 | 11 | 0.9% |
| $10,000 to $14,999 | 42 | 3.4% |
| $15,000 to $24,999 | 11 | 0.9% |
| $25,000 to $34,999 | 41 | 3.3% |
| $35,000 to $49,999 | 51 | 4.1% |
| $50,000 to $74,999 | 157 | 12.6% |
| $75,000 to $99,999 | 112 | 9.0% |
| $100,000 to $149,999 | 395 | 31.6% |
| $150,000 to $199,999 | 264 | 21.1% |
| $200,000+ | 164 | 13.1% |
Family Income by Famaliy Size in Ellisburg
5-person families (69 | 5.5%) account for the highest median family income in Ellisburg with $157,614 per family, while 3-person families (413 | 33.1%) have the highest median income of $45,592 per family member.
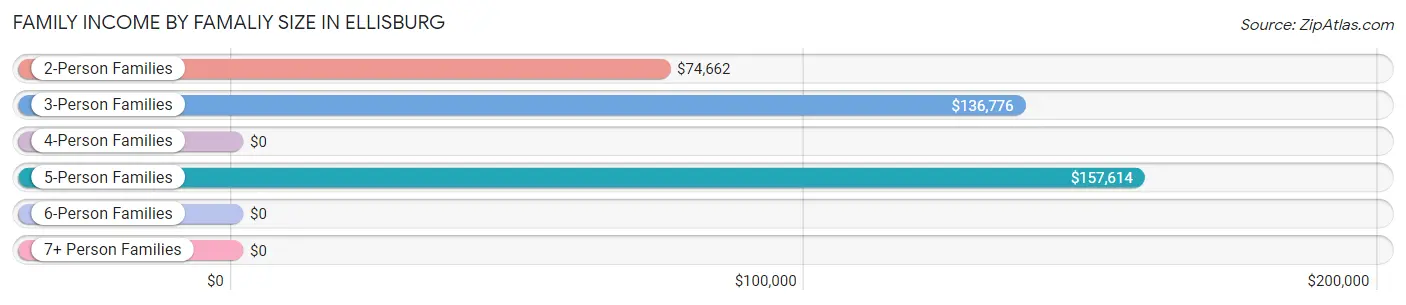
| Income Bracket | # Families | Median Income |
| 2-Person Families | 370 (29.6%) | $74,662 |
| 3-Person Families | 413 (33.1%) | $136,776 |
| 4-Person Families | 281 (22.5%) | $0 |
| 5-Person Families | 69 (5.5%) | $157,614 |
| 6-Person Families | 40 (3.2%) | $0 |
| 7+ Person Families | 76 (6.1%) | $0 |
| Total | 1,249 (100.0%) | $126,823 |
Family Income by Number of Earners in Ellisburg
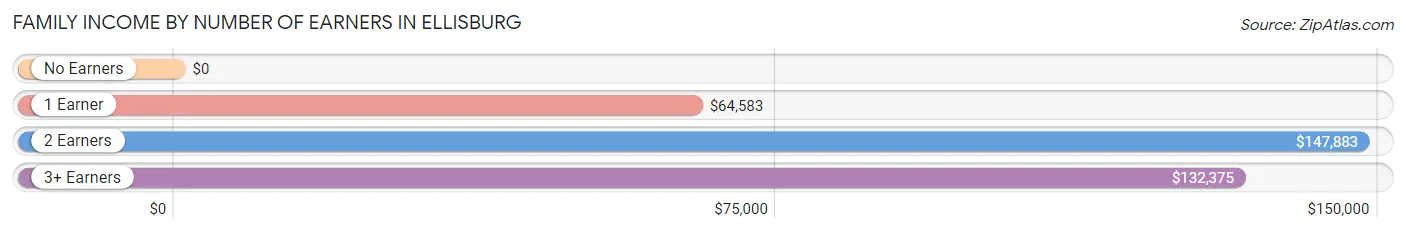
| Number of Earners | # Families | Median Income |
| No Earners | 134 (10.7%) | $0 |
| 1 Earner | 200 (16.0%) | $64,583 |
| 2 Earners | 693 (55.5%) | $147,883 |
| 3+ Earners | 222 (17.8%) | $132,375 |
| Total | 1,249 (100.0%) | $126,823 |
Household Income in Ellisburg
Household Income Brackets in Ellisburg
With 426 households falling in the category, the $100,000 to $149,999 income range is the most frequent in Ellisburg, accounting for 21.7% of all households. In contrast, only 63 households (3.2%) fall into the less than $10,000 income bracket, making it the least populous group.
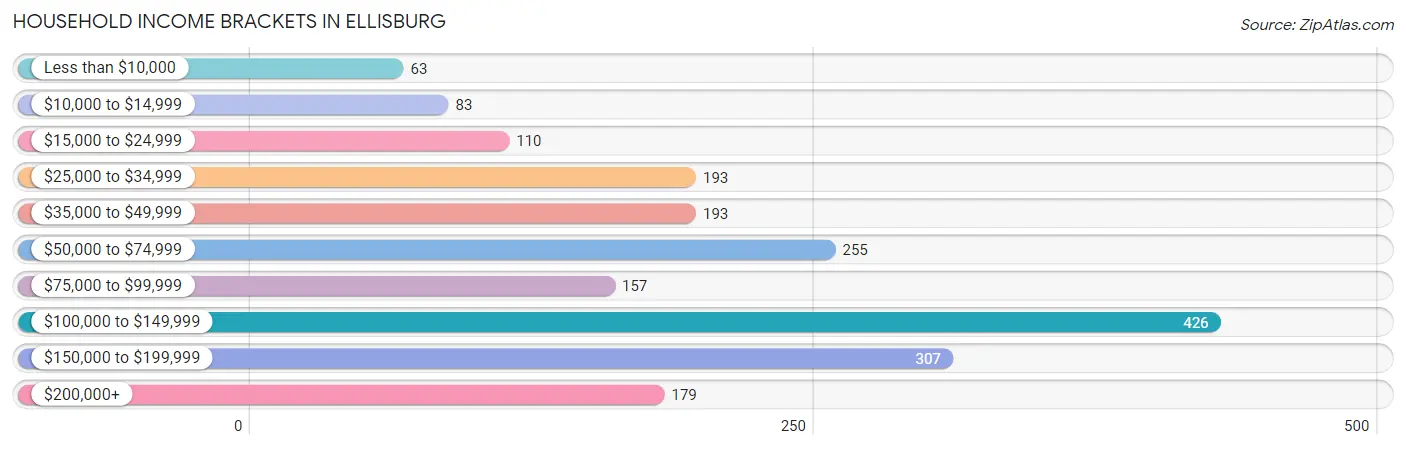
| Income Bracket | # Households | % Households |
| Less than $10,000 | 63 | 3.2% |
| $10,000 to $14,999 | 83 | 4.2% |
| $15,000 to $24,999 | 110 | 5.6% |
| $25,000 to $34,999 | 193 | 9.8% |
| $35,000 to $49,999 | 193 | 9.8% |
| $50,000 to $74,999 | 255 | 13.0% |
| $75,000 to $99,999 | 157 | 8.0% |
| $100,000 to $149,999 | 426 | 21.7% |
| $150,000 to $199,999 | 307 | 15.6% |
| $200,000+ | 179 | 9.1% |
Household Income by Householder Age in Ellisburg
The median household income in Ellisburg is $88,486, with the highest median household income of $125,192 found in the 25 to 44 years age bracket for the primary householder. A total of 662 households (33.7%) fall into this category.
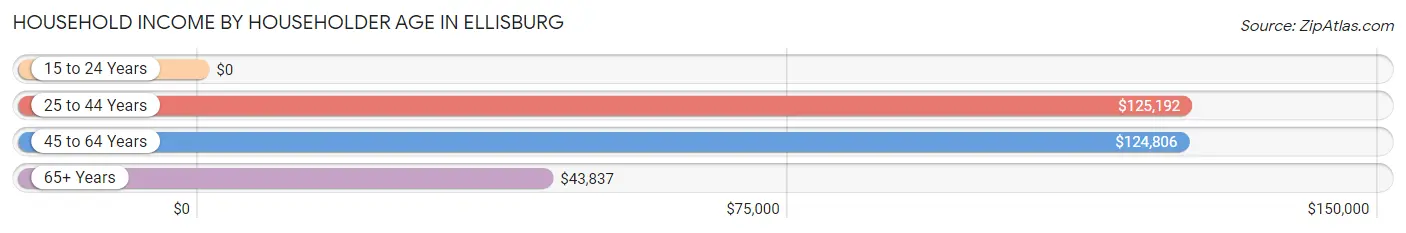
| Income Bracket | # Households | Median Income |
| 15 to 24 Years | 0 (0.0%) | $0 |
| 25 to 44 Years | 662 (33.7%) | $125,192 |
| 45 to 64 Years | 637 (32.4%) | $124,806 |
| 65+ Years | 666 (33.9%) | $43,837 |
| Total | 1,965 (100.0%) | $88,486 |
Poverty in Ellisburg
Income Below Poverty by Sex and Age in Ellisburg
With 5.5% poverty level for males and 11.8% for females among the residents of Ellisburg, 16 and 17 year old males and 6 to 11 year old females are the most vulnerable to poverty, with 11 males (28.2%) and 43 females (31.4%) in their respective age groups living below the poverty level.
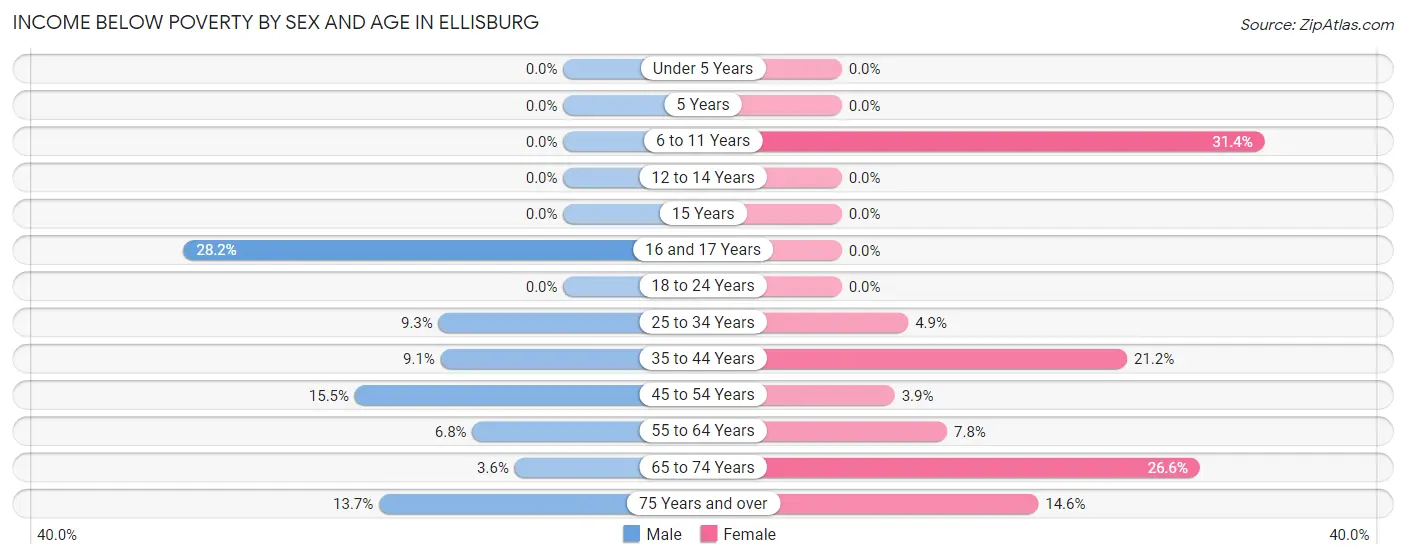
| Age Bracket | Male | Female |
| Under 5 Years | 0 (0.0%) | 0 (0.0%) |
| 5 Years | 0 (0.0%) | 0 (0.0%) |
| 6 to 11 Years | 0 (0.0%) | 43 (31.4%) |
| 12 to 14 Years | 0 (0.0%) | 0 (0.0%) |
| 15 Years | 0 (0.0%) | 0 (0.0%) |
| 16 and 17 Years | 11 (28.2%) | 0 (0.0%) |
| 18 to 24 Years | 0 (0.0%) | 0 (0.0%) |
| 25 to 34 Years | 39 (9.3%) | 20 (4.9%) |
| 35 to 44 Years | 36 (9.1%) | 79 (21.2%) |
| 45 to 54 Years | 13 (15.5%) | 13 (3.9%) |
| 55 to 64 Years | 33 (6.8%) | 23 (7.8%) |
| 65 to 74 Years | 11 (3.6%) | 63 (26.6%) |
| 75 Years and over | 16 (13.7%) | 48 (14.6%) |
| Total | 159 (5.5%) | 289 (11.8%) |
Income Above Poverty by Sex and Age in Ellisburg
According to the poverty statistics in Ellisburg, males aged under 5 years and females aged under 5 years are the age groups that are most secure financially, with 100.0% of males and 100.0% of females in these age groups living above the poverty line.
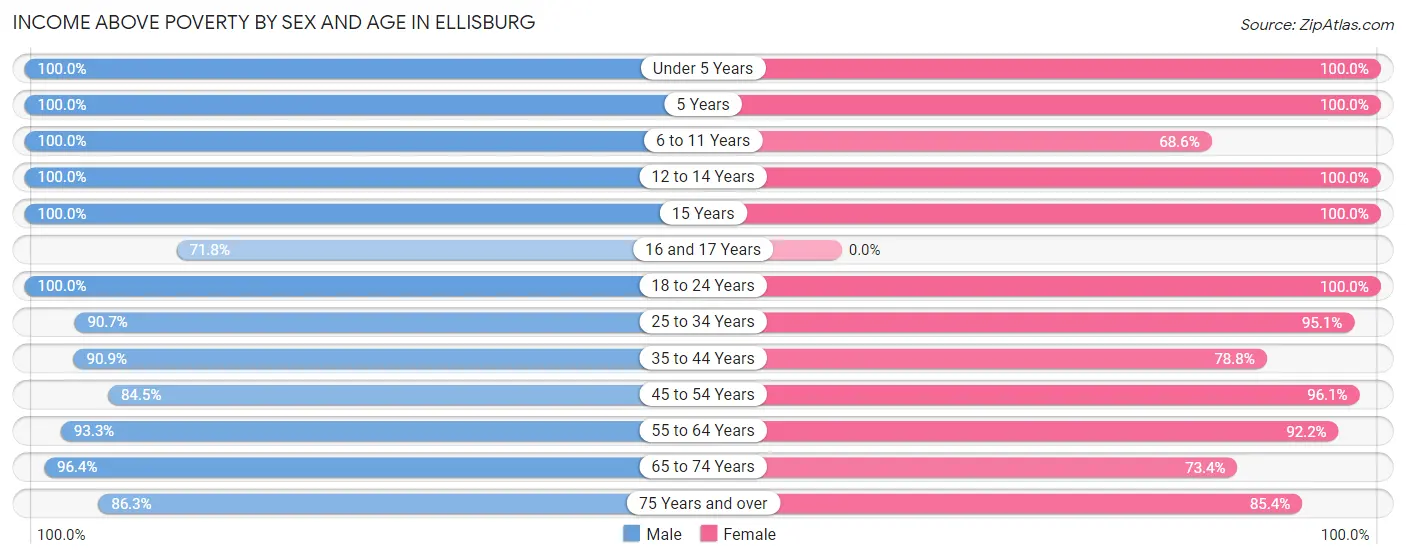
| Age Bracket | Male | Female |
| Under 5 Years | 412 (100.0%) | 95 (100.0%) |
| 5 Years | 9 (100.0%) | 18 (100.0%) |
| 6 to 11 Years | 402 (100.0%) | 94 (68.6%) |
| 12 to 14 Years | 62 (100.0%) | 56 (100.0%) |
| 15 Years | 17 (100.0%) | 37 (100.0%) |
| 16 and 17 Years | 28 (71.8%) | 0 (0.0%) |
| 18 to 24 Years | 154 (100.0%) | 139 (100.0%) |
| 25 to 34 Years | 382 (90.7%) | 386 (95.1%) |
| 35 to 44 Years | 359 (90.9%) | 294 (78.8%) |
| 45 to 54 Years | 71 (84.5%) | 318 (96.1%) |
| 55 to 64 Years | 456 (93.2%) | 271 (92.2%) |
| 65 to 74 Years | 294 (96.4%) | 174 (73.4%) |
| 75 Years and over | 101 (86.3%) | 281 (85.4%) |
| Total | 2,747 (94.5%) | 2,163 (88.2%) |
Income Below Poverty Among Married-Couple Families in Ellisburg
The poverty statistics for married-couple families in Ellisburg show that 4.7% or 49 of the total 1,052 families live below the poverty line. Families with no children have the highest poverty rate of 7.5%, comprising of 38 families. On the other hand, families with 3 or 4 children have the lowest poverty rate of 0.0%, which includes 0 families.
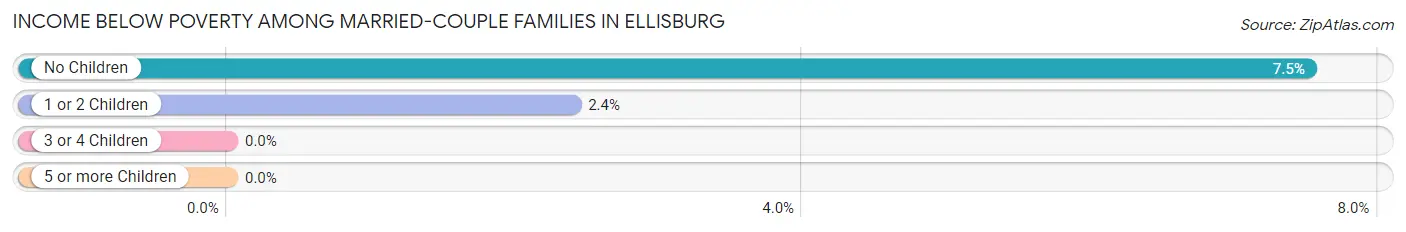
| Children | Above Poverty | Below Poverty |
| No Children | 468 (92.5%) | 38 (7.5%) |
| 1 or 2 Children | 449 (97.6%) | 11 (2.4%) |
| 3 or 4 Children | 86 (100.0%) | 0 (0.0%) |
| 5 or more Children | 0 (0.0%) | 0 (0.0%) |
| Total | 1,003 (95.3%) | 49 (4.7%) |
Income Below Poverty Among Single-Parent Households in Ellisburg
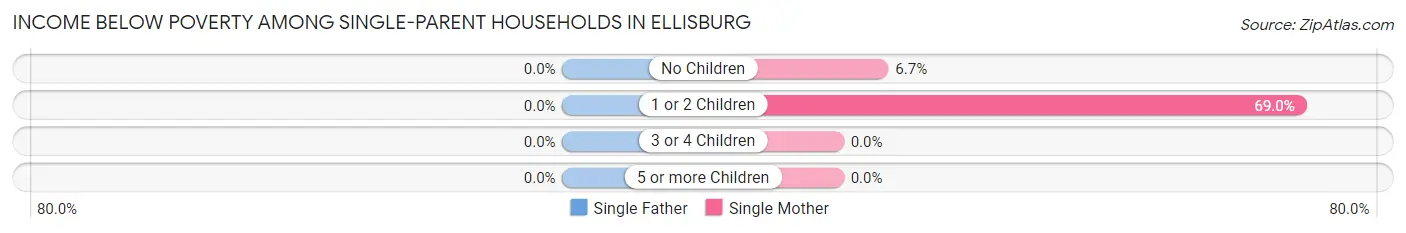
| Children | Single Father | Single Mother |
| No Children | 0 (0.0%) | 7 (6.7%) |
| 1 or 2 Children | 0 (0.0%) | 20 (69.0%) |
| 3 or 4 Children | 0 (0.0%) | 0 (0.0%) |
| 5 or more Children | 0 (0.0%) | 0 (0.0%) |
| Total | 0 (0.0%) | 27 (16.3%) |
Income Below Poverty Among Married-Couple vs Single-Parent Households in Ellisburg
The poverty data for Ellisburg shows that 49 of the married-couple family households (4.7%) and 27 of the single-parent households (13.7%) are living below the poverty level. Within the married-couple family households, those with no children have the highest poverty rate, with 38 households (7.5%) falling below the poverty line. Among the single-parent households, those with 1 or 2 children have the highest poverty rate, with 20 household (37.7%) living below poverty.
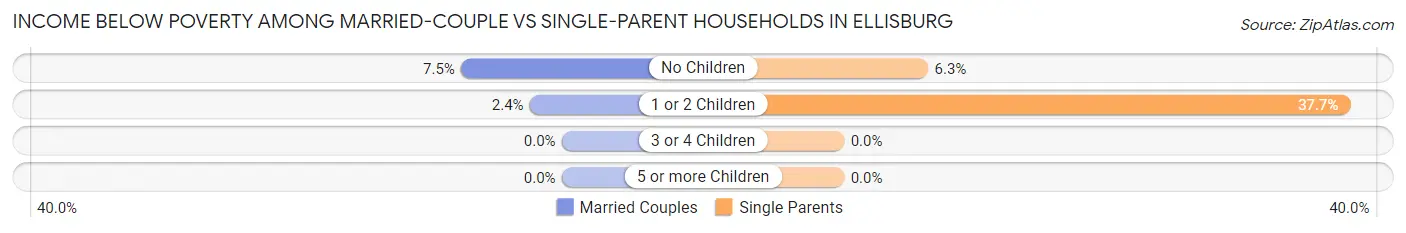
| Children | Married-Couple Families | Single-Parent Households |
| No Children | 38 (7.5%) | 7 (6.2%) |
| 1 or 2 Children | 11 (2.4%) | 20 (37.7%) |
| 3 or 4 Children | 0 (0.0%) | 0 (0.0%) |
| 5 or more Children | 0 (0.0%) | 0 (0.0%) |
| Total | 49 (4.7%) | 27 (13.7%) |
Race in Ellisburg
The most populous races in Ellisburg are White / Caucasian (4,084 | 74.6%), Asian (924 | 16.9%), and Hispanic or Latino (353 | 6.5%).
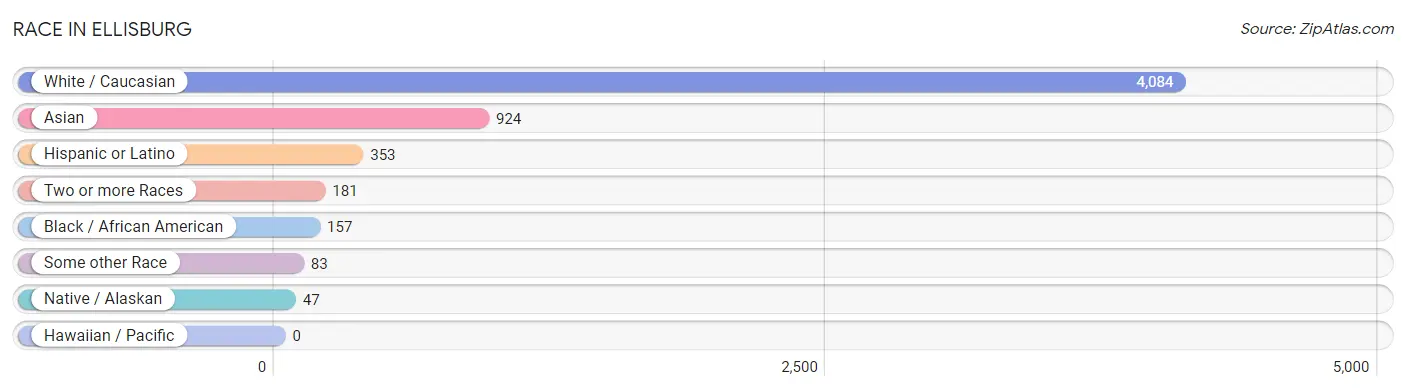
| Race | # Population | % Population |
| Asian | 924 | 16.9% |
| Black / African American | 157 | 2.9% |
| Hawaiian / Pacific | 0 | 0.0% |
| Hispanic or Latino | 353 | 6.5% |
| Native / Alaskan | 47 | 0.9% |
| White / Caucasian | 4,084 | 74.6% |
| Two or more Races | 181 | 3.3% |
| Some other Race | 83 | 1.5% |
| Total | 5,476 | 100.0% |
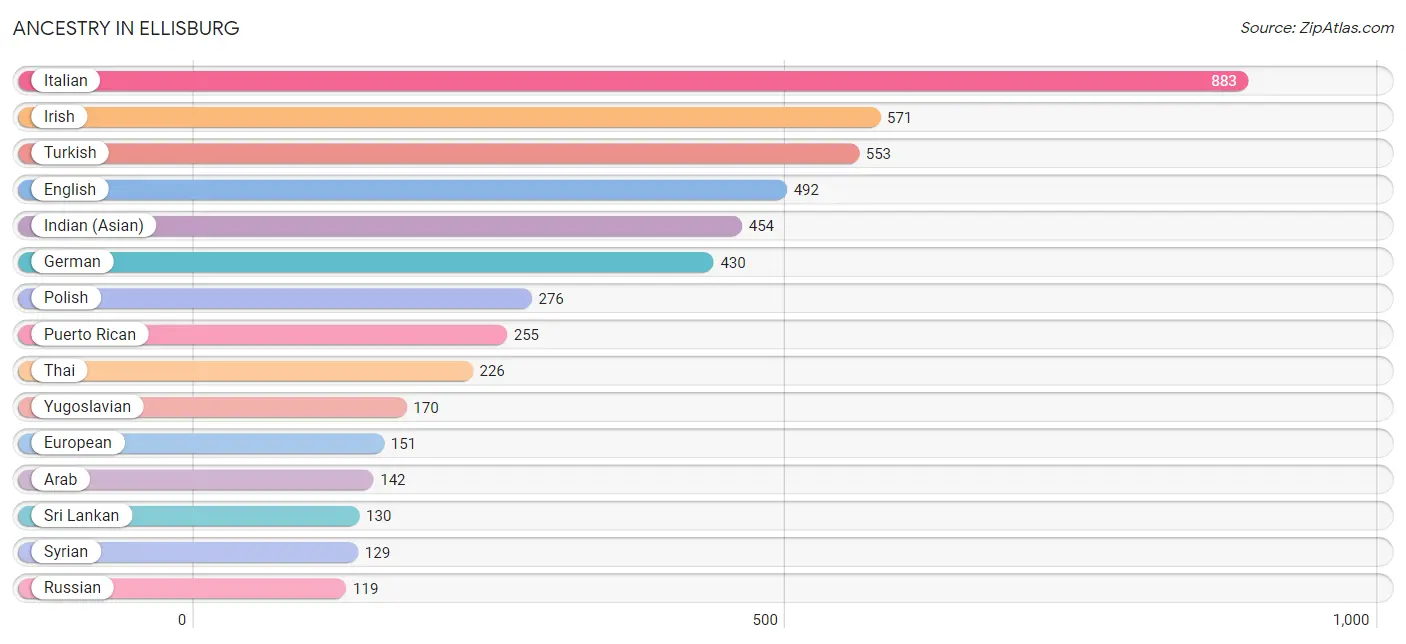
Ancestry in Ellisburg
The most populous ancestries reported in Ellisburg are Italian (883 | 16.1%), Irish (571 | 10.4%), Turkish (553 | 10.1%), English (492 | 9.0%), and Indian (Asian) (454 | 8.3%), together accounting for 53.9% of all Ellisburg residents.
| Ancestry | # Population | % Population |
| American | 43 | 0.8% |
| Arab | 142 | 2.6% |
| Argentinean | 14 | 0.3% |
| Austrian | 32 | 0.6% |
| Bhutanese | 15 | 0.3% |
| Brazilian | 14 | 0.3% |
| Burmese | 105 | 1.9% |
| Czech | 14 | 0.3% |
| Dominican | 16 | 0.3% |
| Eastern European | 115 | 2.1% |
| English | 492 | 9.0% |
| European | 151 | 2.8% |
| French | 104 | 1.9% |
| French Canadian | 10 | 0.2% |
| German | 430 | 7.9% |
| Greek | 45 | 0.8% |
| Indian (Asian) | 454 | 8.3% |
| Irish | 571 | 10.4% |
| Israeli | 5 | 0.1% |
| Italian | 883 | 16.1% |
| Jordanian | 13 | 0.2% |
| Korean | 116 | 2.1% |
| Lithuanian | 12 | 0.2% |
| Mexican | 55 | 1.0% |
| Polish | 276 | 5.0% |
| Puerto Rican | 255 | 4.7% |
| Russian | 119 | 2.2% |
| Scottish | 6 | 0.1% |
| Slovak | 20 | 0.4% |
| South American | 14 | 0.3% |
| Spaniard | 11 | 0.2% |
| Sri Lankan | 130 | 2.4% |
| Swedish | 7 | 0.1% |
| Syrian | 129 | 2.4% |
| Thai | 226 | 4.1% |
| Trinidadian and Tobagonian | 106 | 1.9% |
| Turkish | 553 | 10.1% |
| Ukrainian | 23 | 0.4% |
| Welsh | 22 | 0.4% |
| Yugoslavian | 170 | 3.1% | View All 40 Rows |
Immigrants in Ellisburg
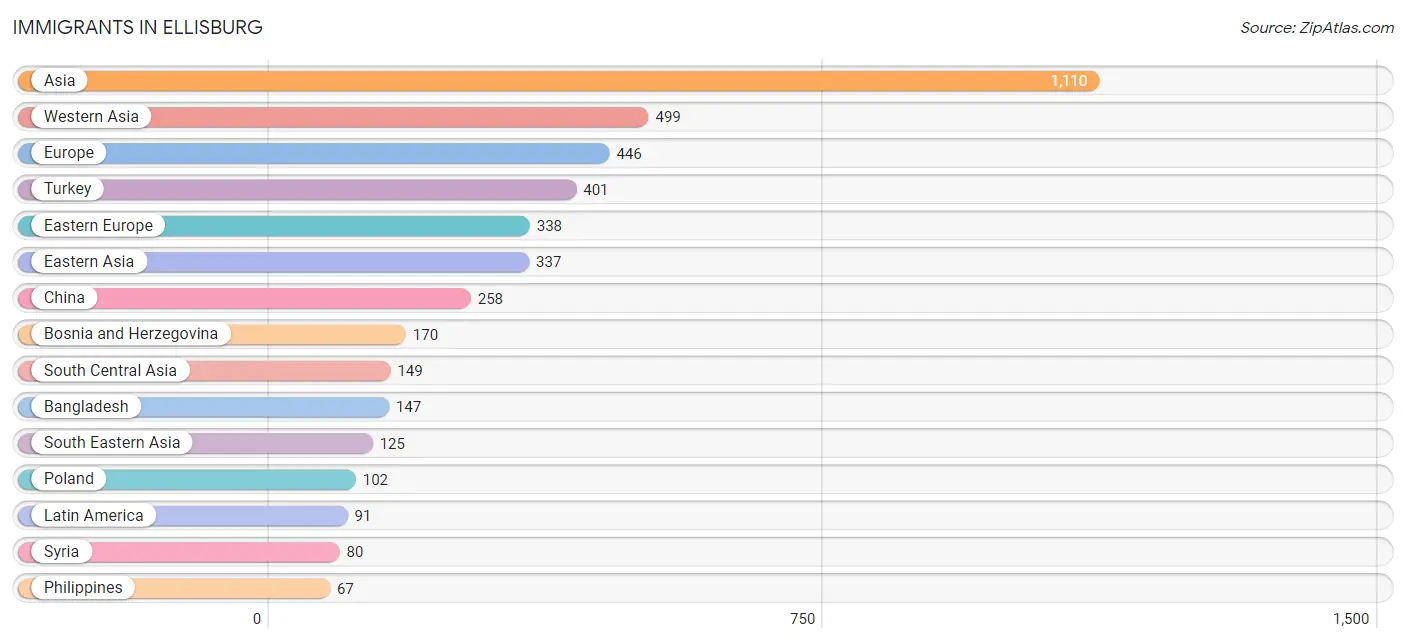
The most numerous immigrant groups reported in Ellisburg came from Asia (1,110 | 20.3%), Western Asia (499 | 9.1%), Europe (446 | 8.1%), Turkey (401 | 7.3%), and Eastern Europe (338 | 6.2%), together accounting for 51.0% of all Ellisburg residents.
| Immigration Origin | # Population | % Population |
| Argentina | 14 | 0.3% |
| Asia | 1,110 | 20.3% |
| Bangladesh | 147 | 2.7% |
| Bosnia and Herzegovina | 170 | 3.1% |
| Brazil | 14 | 0.3% |
| Canada | 7 | 0.1% |
| Caribbean | 16 | 0.3% |
| Central America | 47 | 0.9% |
| China | 258 | 4.7% |
| Czechoslovakia | 7 | 0.1% |
| Dominican Republic | 16 | 0.3% |
| Eastern Asia | 337 | 6.1% |
| Eastern Europe | 338 | 6.2% |
| England | 56 | 1.0% |
| Europe | 446 | 8.1% |
| Hong Kong | 24 | 0.4% |
| India | 2 | 0.0% |
| Israel | 5 | 0.1% |
| Italy | 41 | 0.7% |
| Japan | 15 | 0.3% |
| Jordan | 13 | 0.2% |
| Korea | 64 | 1.2% |
| Laos | 21 | 0.4% |
| Latin America | 91 | 1.7% |
| Latvia | 6 | 0.1% |
| Mexico | 47 | 0.9% |
| Northern Europe | 56 | 1.0% |
| Philippines | 67 | 1.2% |
| Poland | 102 | 1.9% |
| Russia | 23 | 0.4% |
| South America | 28 | 0.5% |
| South Central Asia | 149 | 2.7% |
| South Eastern Asia | 125 | 2.3% |
| Southern Europe | 52 | 0.9% |
| Spain | 11 | 0.2% |
| Syria | 80 | 1.5% |
| Turkey | 401 | 7.3% |
| Vietnam | 37 | 0.7% |
| Western Asia | 499 | 9.1% | View All 39 Rows |
Sex and Age in Ellisburg
Sex and Age in Ellisburg
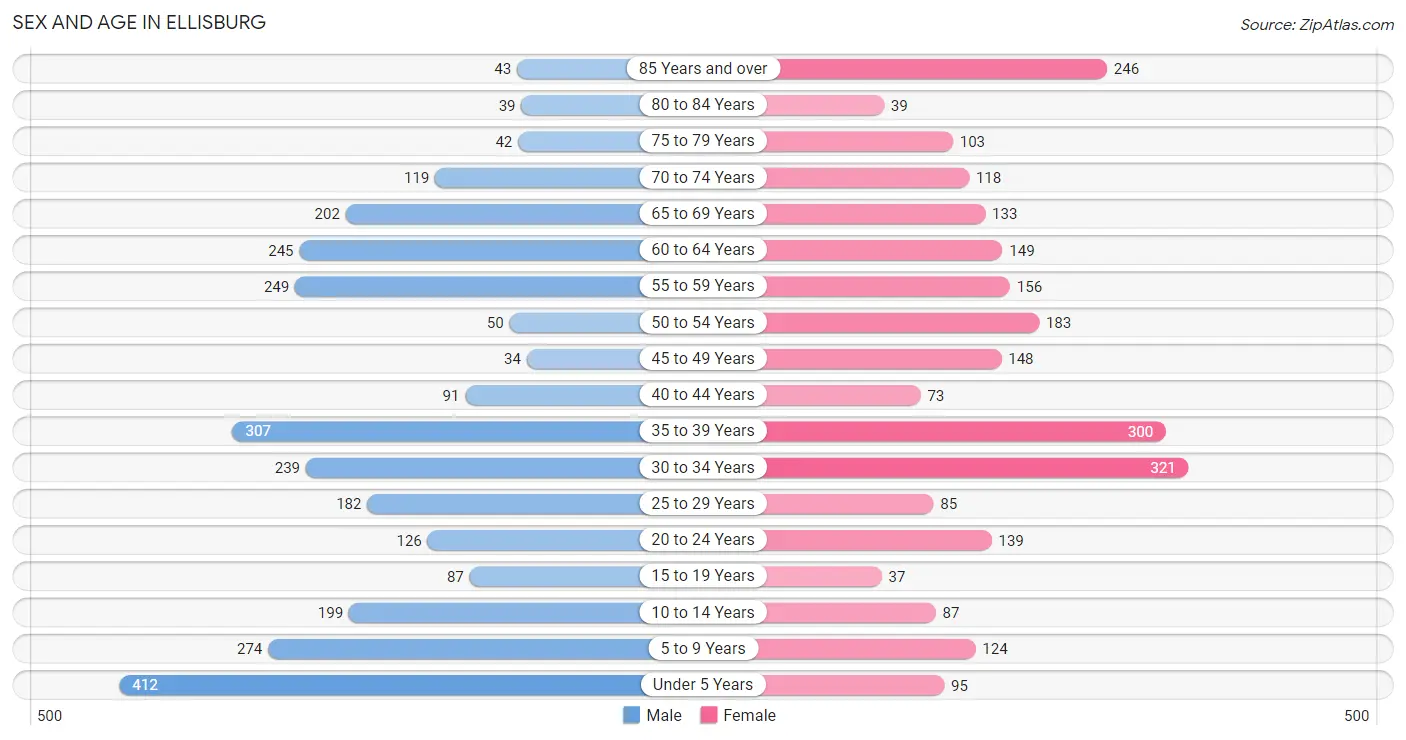
The most populous age groups in Ellisburg are Under 5 Years (412 | 14.0%) for men and 30 to 34 Years (321 | 12.7%) for women.
| Age Bracket | Male | Female |
| Under 5 Years | 412 (14.0%) | 95 (3.7%) |
| 5 to 9 Years | 274 (9.3%) | 124 (4.9%) |
| 10 to 14 Years | 199 (6.8%) | 87 (3.4%) |
| 15 to 19 Years | 87 (3.0%) | 37 (1.5%) |
| 20 to 24 Years | 126 (4.3%) | 139 (5.5%) |
| 25 to 29 Years | 182 (6.2%) | 85 (3.4%) |
| 30 to 34 Years | 239 (8.1%) | 321 (12.7%) |
| 35 to 39 Years | 307 (10.4%) | 300 (11.8%) |
| 40 to 44 Years | 91 (3.1%) | 73 (2.9%) |
| 45 to 49 Years | 34 (1.2%) | 148 (5.8%) |
| 50 to 54 Years | 50 (1.7%) | 183 (7.2%) |
| 55 to 59 Years | 249 (8.5%) | 156 (6.1%) |
| 60 to 64 Years | 245 (8.3%) | 149 (5.9%) |
| 65 to 69 Years | 202 (6.9%) | 133 (5.2%) |
| 70 to 74 Years | 119 (4.1%) | 118 (4.6%) |
| 75 to 79 Years | 42 (1.4%) | 103 (4.1%) |
| 80 to 84 Years | 39 (1.3%) | 39 (1.5%) |
| 85 Years and over | 43 (1.5%) | 246 (9.7%) |
| Total | 2,940 (100.0%) | 2,536 (100.0%) |
Families and Households in Ellisburg
Median Family Size in Ellisburg
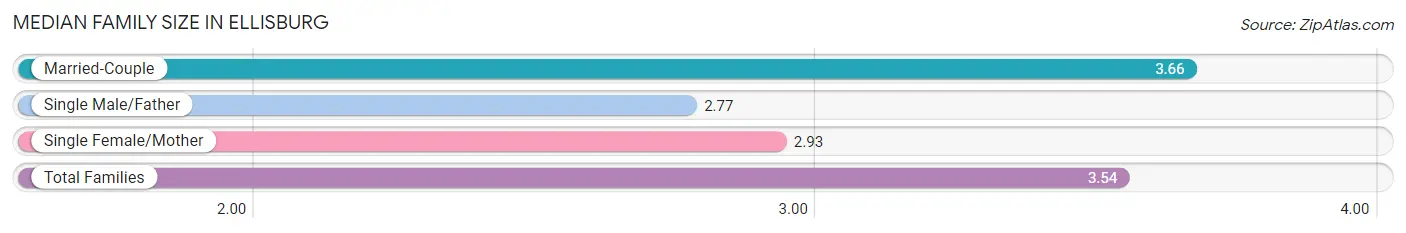
The median family size in Ellisburg is 3.54 persons per family, with married-couple families (1,052 | 84.2%) accounting for the largest median family size of 3.66 persons per family. On the other hand, single male/father families (31 | 2.5%) represent the smallest median family size with 2.77 persons per family.
| Family Type | # Families | Family Size |
| Married-Couple | 1,052 (84.2%) | 3.66 |
| Single Male/Father | 31 (2.5%) | 2.77 |
| Single Female/Mother | 166 (13.3%) | 2.93 |
| Total Families | 1,249 (100.0%) | 3.54 |
Median Household Size in Ellisburg
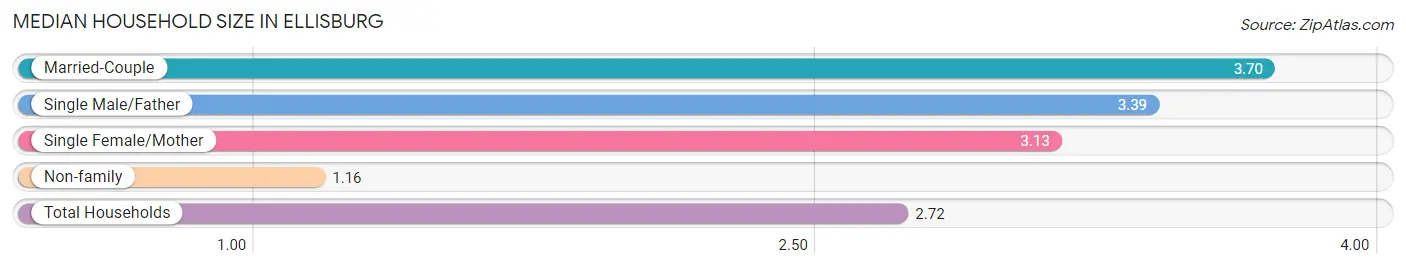
The median household size in Ellisburg is 2.72 persons per household, with married-couple households (1,052 | 53.5%) accounting for the largest median household size of 3.7 persons per household. non-family households (716 | 36.4%) represent the smallest median household size with 1.16 persons per household.
| Household Type | # Households | Household Size |
| Married-Couple | 1,052 (53.5%) | 3.70 |
| Single Male/Father | 31 (1.6%) | 3.39 |
| Single Female/Mother | 166 (8.5%) | 3.13 |
| Non-family | 716 (36.4%) | 1.16 |
| Total Households | 1,965 (100.0%) | 2.72 |
Household Size by Marriage Status in Ellisburg
Out of a total of 1,965 households in Ellisburg, 1,249 (63.6%) are family households, while 716 (36.4%) are nonfamily households. The most numerous type of family households are 3-person households, comprising 403, and the most common type of nonfamily households are 1-person households, comprising 623.
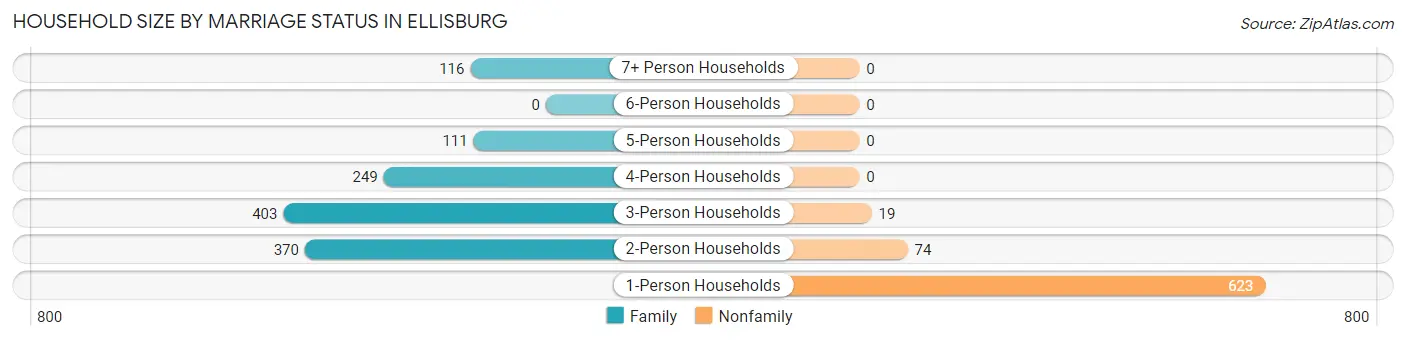
| Household Size | Family Households | Nonfamily Households |
| 1-Person Households | - | 623 (31.7%) |
| 2-Person Households | 370 (18.8%) | 74 (3.8%) |
| 3-Person Households | 403 (20.5%) | 19 (1.0%) |
| 4-Person Households | 249 (12.7%) | 0 (0.0%) |
| 5-Person Households | 111 (5.7%) | 0 (0.0%) |
| 6-Person Households | 0 (0.0%) | 0 (0.0%) |
| 7+ Person Households | 116 (5.9%) | 0 (0.0%) |
| Total | 1,249 (63.6%) | 716 (36.4%) |
Female Fertility in Ellisburg
Fertility by Age in Ellisburg
Average fertility rate in Ellisburg is 42.0 births per 1,000 women. Women in the age bracket of 35 to 50 years have the highest fertility rate with 54.0 births per 1,000 women. Women in the age bracket of 35 to 50 years acount for 65.3% of all women with births.
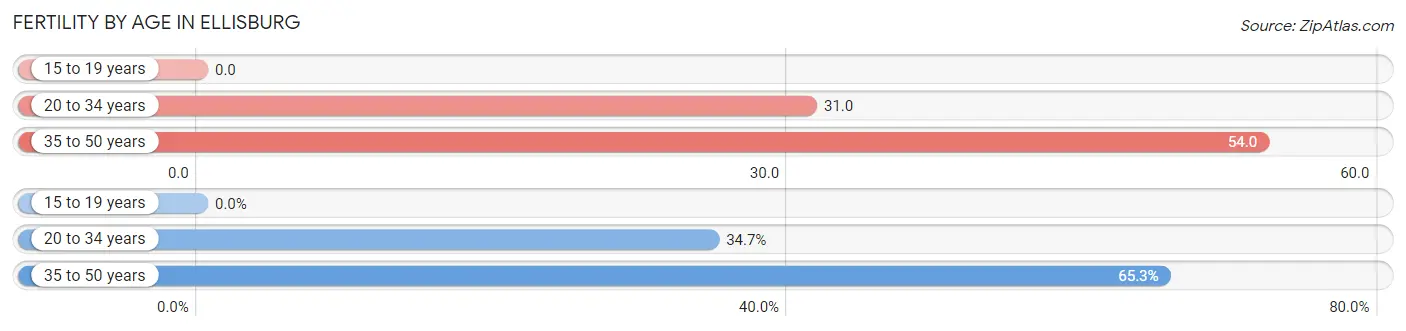
| Age Bracket | Women with Births | Births / 1,000 Women |
| 15 to 19 years | 0 (0.0%) | 0.0 |
| 20 to 34 years | 17 (34.7%) | 31.0 |
| 35 to 50 years | 32 (65.3%) | 54.0 |
| Total | 49 (100.0%) | 42.0 |
Fertility by Age by Marriage Status in Ellisburg
34.7% of women with births (49) in Ellisburg are married. The highest percentage of unmarried women with births falls into 35 to 50 years age bracket with 100.0% of them unmarried at the time of birth, while the lowest percentage of unmarried women with births belong to 20 to 34 years age bracket with 0.0% of them unmarried.
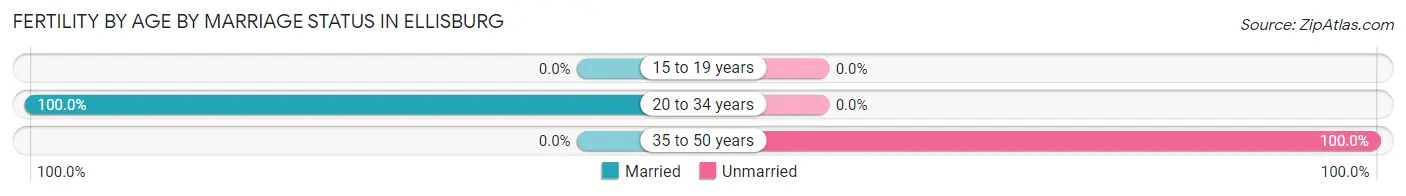
| Age Bracket | Married | Unmarried |
| 15 to 19 years | 0 (0.0%) | 0 (0.0%) |
| 20 to 34 years | 17 (100.0%) | 0 (0.0%) |
| 35 to 50 years | 0 (0.0%) | 32 (100.0%) |
| Total | 17 (34.7%) | 32 (65.3%) |
Fertility by Education in Ellisburg
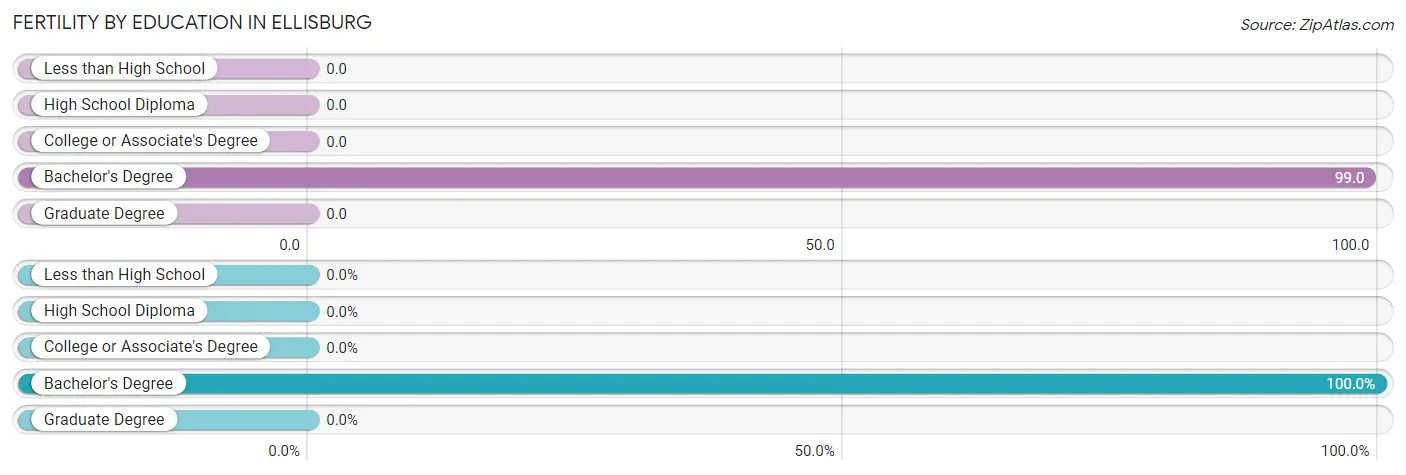
| Educational Attainment | Women with Births | Births / 1,000 Women |
| Less than High School | 0 (0.0%) | 0.0 |
| High School Diploma | 0 (0.0%) | 0.0 |
| College or Associate's Degree | 0 (0.0%) | 0.0 |
| Bachelor's Degree | 49 (100.0%) | 99.0 |
| Graduate Degree | 0 (0.0%) | 0.0 |
| Total | 49 (100.0%) | 42.0 |
Fertility by Education by Marriage Status in Ellisburg
65.3% of women with births in Ellisburg are unmarried. Women with the educational attainment of bachelor's degree are most likely to be married with 34.7% of them married at childbirth, while women with the educational attainment of bachelor's degree are least likely to be married with 65.3% of them unmarried at childbirth.
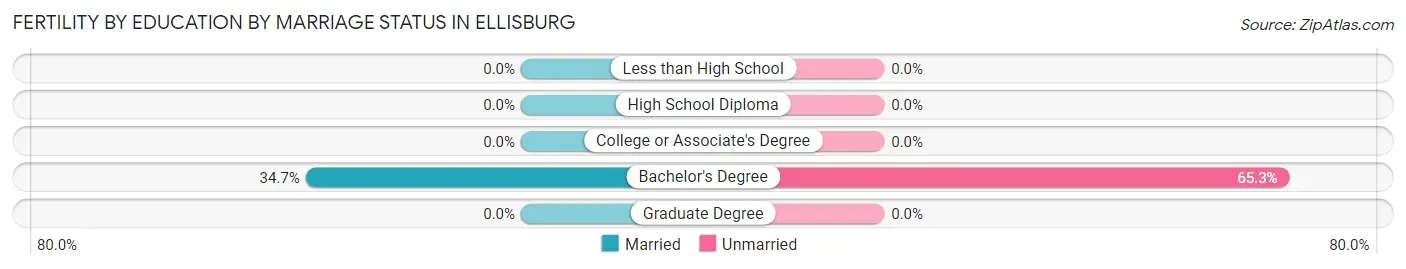
| Educational Attainment | Married | Unmarried |
| Less than High School | 0 (0.0%) | 0 (0.0%) |
| High School Diploma | 0 (0.0%) | 0 (0.0%) |
| College or Associate's Degree | 0 (0.0%) | 0 (0.0%) |
| Bachelor's Degree | 17 (34.7%) | 32 (65.3%) |
| Graduate Degree | 0 (0.0%) | 0 (0.0%) |
| Total | 17 (34.7%) | 32 (65.3%) |
Employment Characteristics in Ellisburg
Employment by Class of Employer in Ellisburg
Among the 2,182 employed individuals in Ellisburg, private company employees (1,354 | 62.1%), not-for-profit organizations (288 | 13.2%), and local government employees (180 | 8.3%) make up the most common classes of employment.
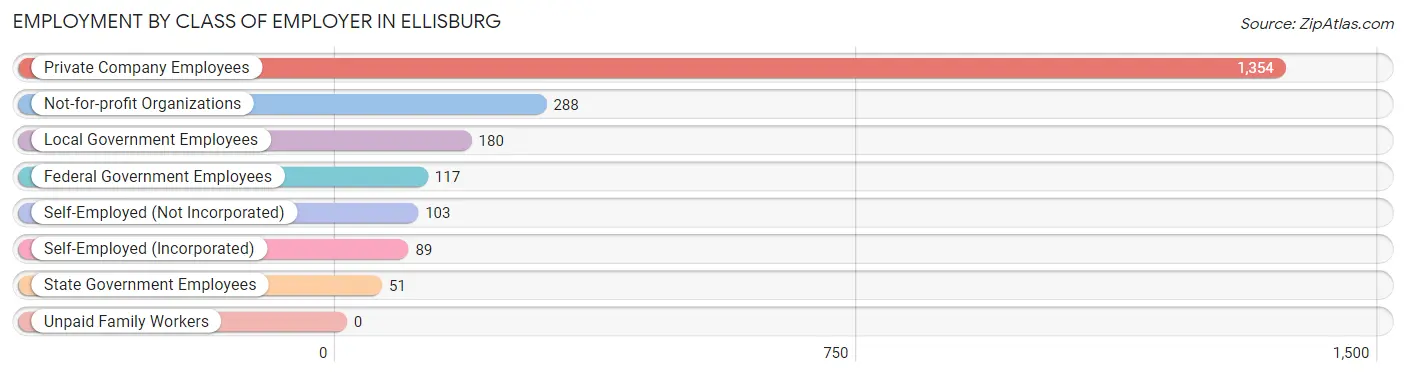
| Employer Class | # Employees | % Employees |
| Private Company Employees | 1,354 | 62.1% |
| Self-Employed (Incorporated) | 89 | 4.1% |
| Self-Employed (Not Incorporated) | 103 | 4.7% |
| Not-for-profit Organizations | 288 | 13.2% |
| Local Government Employees | 180 | 8.3% |
| State Government Employees | 51 | 2.3% |
| Federal Government Employees | 117 | 5.4% |
| Unpaid Family Workers | 0 | 0.0% |
| Total | 2,182 | 100.0% |
Employment Status by Age in Ellisburg
According to the labor force statistics for Ellisburg, out of the total population over 16 years of age (4,231), 59.2% or 2,505 individuals are in the labor force, with 10.5% or 263 of them unemployed. The age group with the highest labor force participation rate is 20 to 24 years, with 91.3% or 242 individuals in the labor force. Within the labor force, the 16 to 19 years age range has the highest percentage of unemployed individuals, with 35.5% or 11 of them being unemployed.
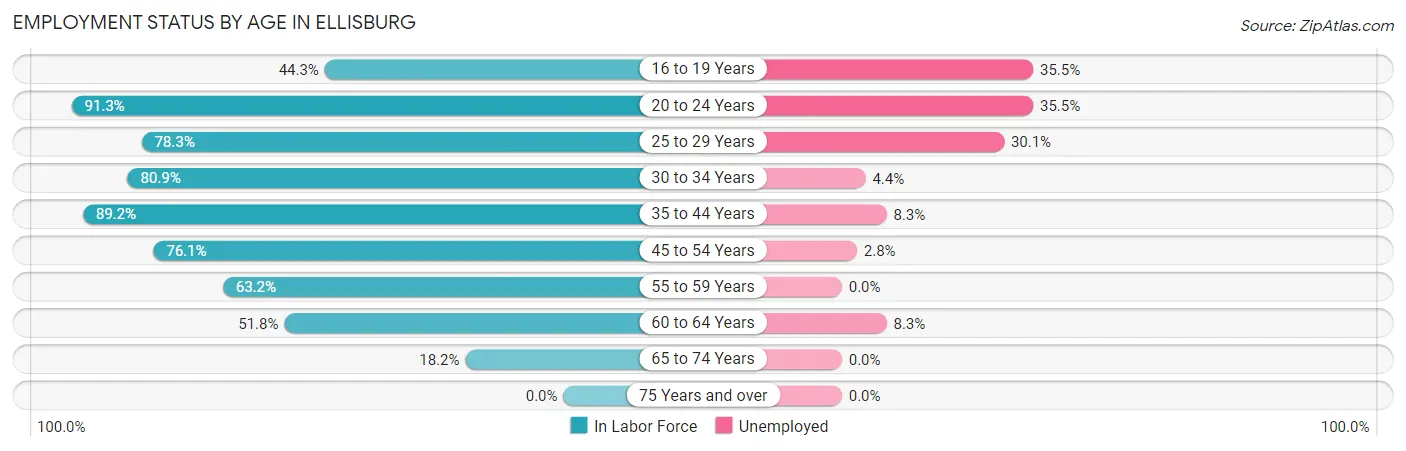
| Age Bracket | In Labor Force | Unemployed |
| 16 to 19 Years | 31 (44.3%) | 11 (35.5%) |
| 20 to 24 Years | 242 (91.3%) | 86 (35.5%) |
| 25 to 29 Years | 209 (78.3%) | 63 (30.1%) |
| 30 to 34 Years | 453 (80.9%) | 20 (4.4%) |
| 35 to 44 Years | 688 (89.2%) | 57 (8.3%) |
| 45 to 54 Years | 316 (76.1%) | 9 (2.8%) |
| 55 to 59 Years | 256 (63.2%) | 0 (0.0%) |
| 60 to 64 Years | 204 (51.8%) | 17 (8.3%) |
| 65 to 74 Years | 104 (18.2%) | 0 (0.0%) |
| 75 Years and over | 0 (0.0%) | 0 (0.0%) |
| Total | 2,505 (59.2%) | 263 (10.5%) |
Employment Status by Educational Attainment in Ellisburg
According to labor force statistics for Ellisburg, 75.6% of individuals (2,126) out of the total population between 25 and 64 years of age (2,812) are in the labor force, with 7.8% or 166 of them being unemployed. The group with the highest labor force participation rate are those with the educational attainment of bachelor's degree or higher, with 89.5% or 959 individuals in the labor force. Within the labor force, individuals with college / associate degree education have the highest percentage of unemployment, with 12.9% or 63 of them being unemployed.
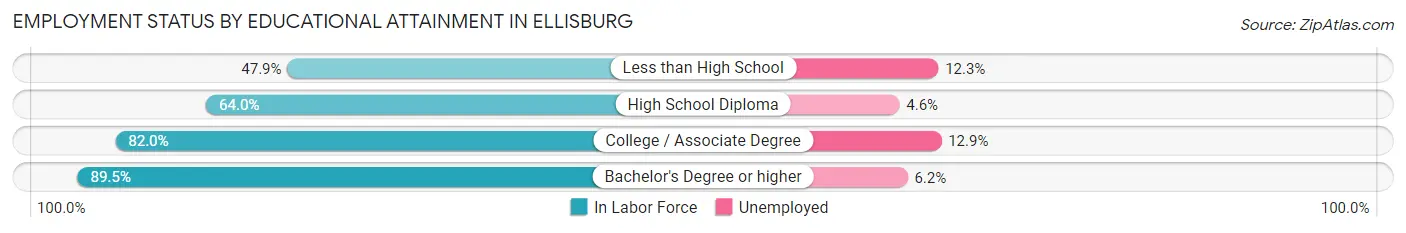
| Educational Attainment | In Labor Force | Unemployed |
| Less than High School | 162 (47.9%) | 42 (12.3%) |
| High School Diploma | 518 (64.0%) | 37 (4.6%) |
| College / Associate Degree | 487 (82.0%) | 77 (12.9%) |
| Bachelor's Degree or higher | 959 (89.5%) | 66 (6.2%) |
| Total | 2,126 (75.6%) | 219 (7.8%) |
Employment Occupations by Sex in Ellisburg
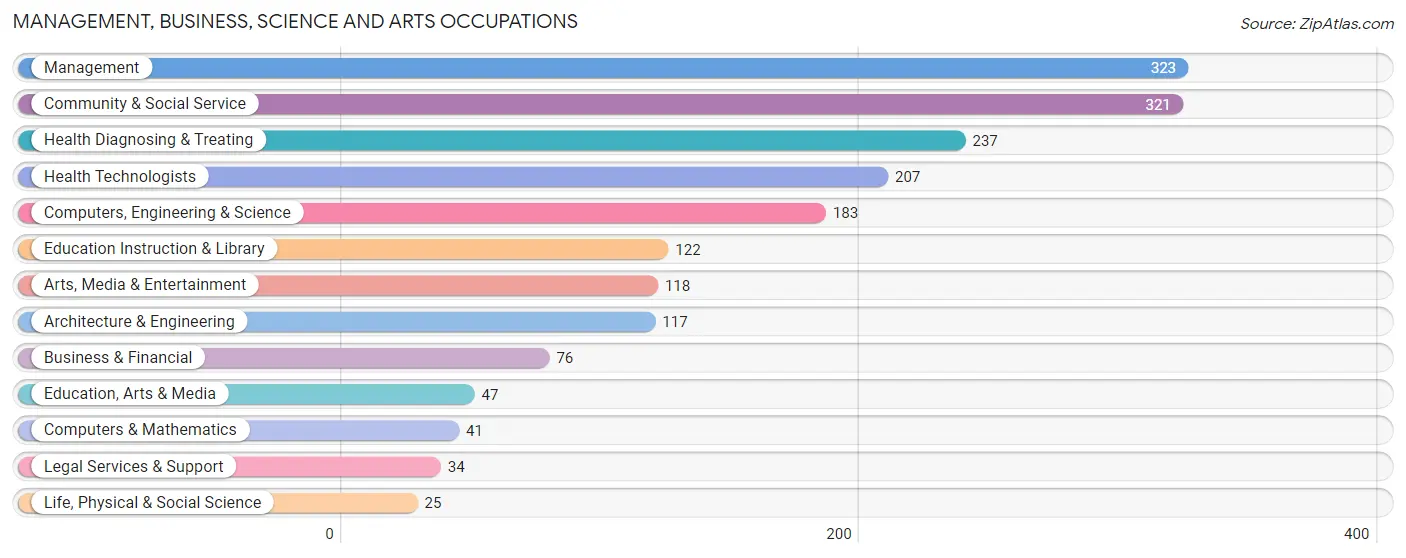
Management, Business, Science and Arts Occupations
The most common Management, Business, Science and Arts occupations in Ellisburg are Management (323 | 14.4%), Community & Social Service (321 | 14.3%), Health Diagnosing & Treating (237 | 10.6%), Health Technologists (207 | 9.2%), and Computers, Engineering & Science (183 | 8.2%).
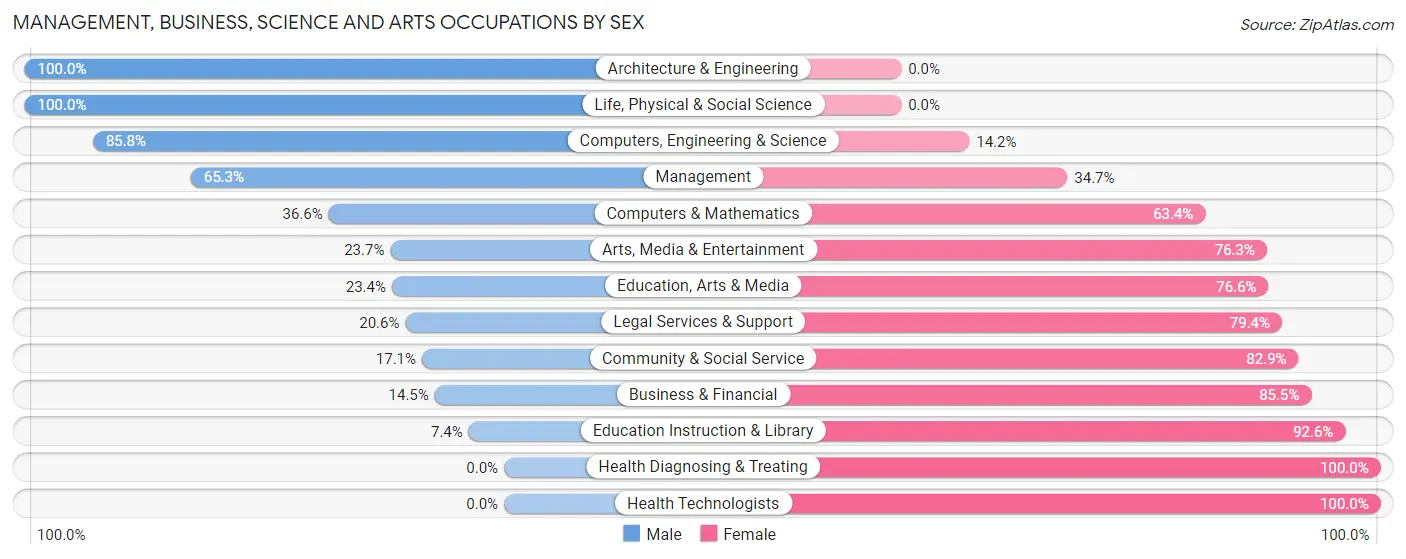
Management, Business, Science and Arts Occupations by Sex
Within the Management, Business, Science and Arts occupations in Ellisburg, the most male-oriented occupations are Architecture & Engineering (100.0%), Life, Physical & Social Science (100.0%), and Computers, Engineering & Science (85.8%), while the most female-oriented occupations are Health Diagnosing & Treating (100.0%), Health Technologists (100.0%), and Education Instruction & Library (92.6%).
| Occupation | Male | Female |
| Management | 211 (65.3%) | 112 (34.7%) |
| Business & Financial | 11 (14.5%) | 65 (85.5%) |
| Computers, Engineering & Science | 157 (85.8%) | 26 (14.2%) |
| Computers & Mathematics | 15 (36.6%) | 26 (63.4%) |
| Architecture & Engineering | 117 (100.0%) | 0 (0.0%) |
| Life, Physical & Social Science | 25 (100.0%) | 0 (0.0%) |
| Community & Social Service | 55 (17.1%) | 266 (82.9%) |
| Education, Arts & Media | 11 (23.4%) | 36 (76.6%) |
| Legal Services & Support | 7 (20.6%) | 27 (79.4%) |
| Education Instruction & Library | 9 (7.4%) | 113 (92.6%) |
| Arts, Media & Entertainment | 28 (23.7%) | 90 (76.3%) |
| Health Diagnosing & Treating | 0 (0.0%) | 237 (100.0%) |
| Health Technologists | 0 (0.0%) | 207 (100.0%) |
| Total (Category) | 434 (38.1%) | 706 (61.9%) |
| Total (Overall) | 1,034 (46.2%) | 1,206 (53.8%) |
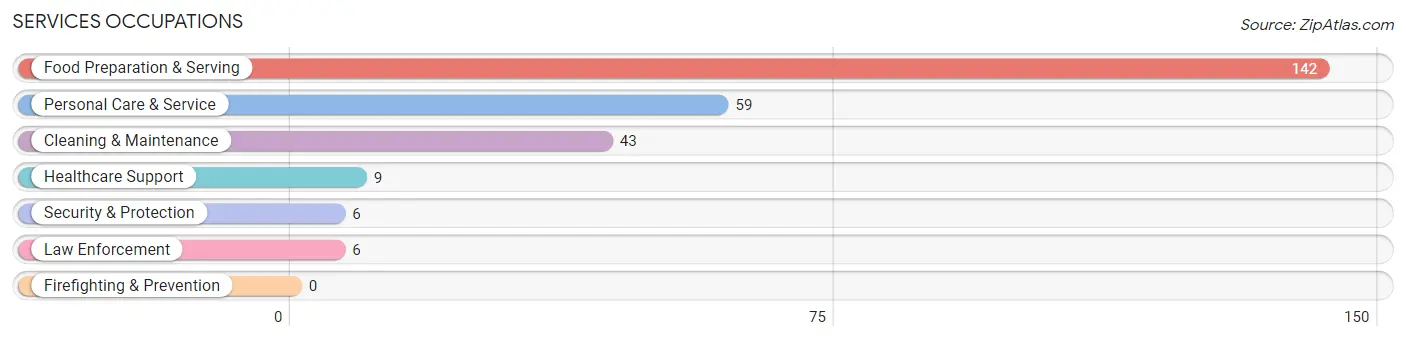
Services Occupations
The most common Services occupations in Ellisburg are Food Preparation & Serving (142 | 6.3%), Personal Care & Service (59 | 2.6%), Cleaning & Maintenance (43 | 1.9%), Healthcare Support (9 | 0.4%), and Security & Protection (6 | 0.3%).
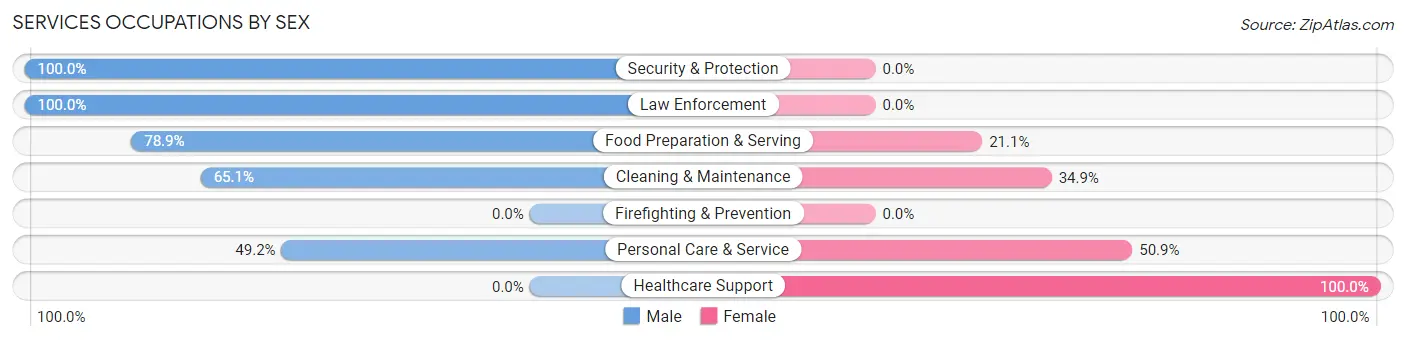
Services Occupations by Sex
Within the Services occupations in Ellisburg, the most male-oriented occupations are Security & Protection (100.0%), Law Enforcement (100.0%), and Food Preparation & Serving (78.9%), while the most female-oriented occupations are Healthcare Support (100.0%), Personal Care & Service (50.8%), and Cleaning & Maintenance (34.9%).
| Occupation | Male | Female |
| Healthcare Support | 0 (0.0%) | 9 (100.0%) |
| Security & Protection | 6 (100.0%) | 0 (0.0%) |
| Firefighting & Prevention | 0 (0.0%) | 0 (0.0%) |
| Law Enforcement | 6 (100.0%) | 0 (0.0%) |
| Food Preparation & Serving | 112 (78.9%) | 30 (21.1%) |
| Cleaning & Maintenance | 28 (65.1%) | 15 (34.9%) |
| Personal Care & Service | 29 (49.1%) | 30 (50.8%) |
| Total (Category) | 175 (67.6%) | 84 (32.4%) |
| Total (Overall) | 1,034 (46.2%) | 1,206 (53.8%) |
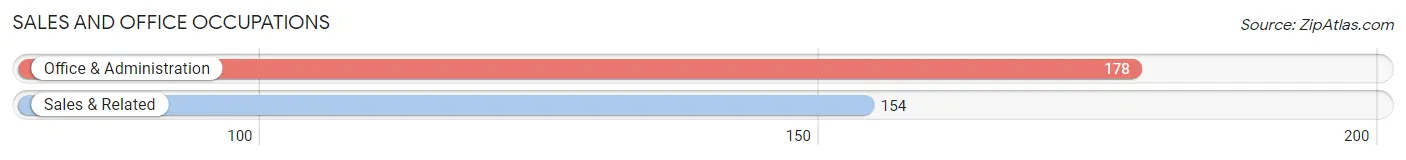
Sales and Office Occupations
The most common Sales and Office occupations in Ellisburg are Office & Administration (178 | 8.0%), and Sales & Related (154 | 6.9%).
Sales and Office Occupations by Sex
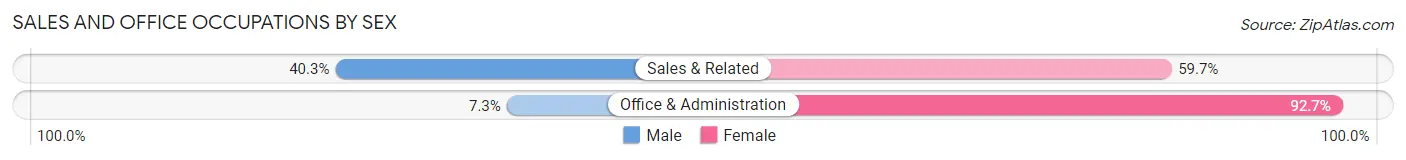
| Occupation | Male | Female |
| Sales & Related | 62 (40.3%) | 92 (59.7%) |
| Office & Administration | 13 (7.3%) | 165 (92.7%) |
| Total (Category) | 75 (22.6%) | 257 (77.4%) |
| Total (Overall) | 1,034 (46.2%) | 1,206 (53.8%) |
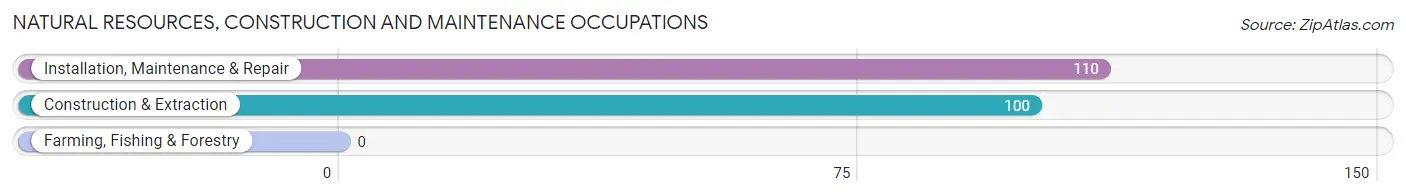
Natural Resources, Construction and Maintenance Occupations
The most common Natural Resources, Construction and Maintenance occupations in Ellisburg are Installation, Maintenance & Repair (110 | 4.9%), and Construction & Extraction (100 | 4.5%).
Natural Resources, Construction and Maintenance Occupations by Sex
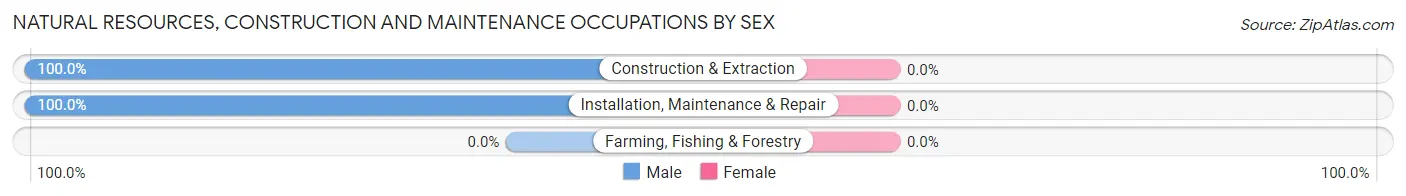
| Occupation | Male | Female |
| Farming, Fishing & Forestry | 0 (0.0%) | 0 (0.0%) |
| Construction & Extraction | 100 (100.0%) | 0 (0.0%) |
| Installation, Maintenance & Repair | 110 (100.0%) | 0 (0.0%) |
| Total (Category) | 210 (100.0%) | 0 (0.0%) |
| Total (Overall) | 1,034 (46.2%) | 1,206 (53.8%) |
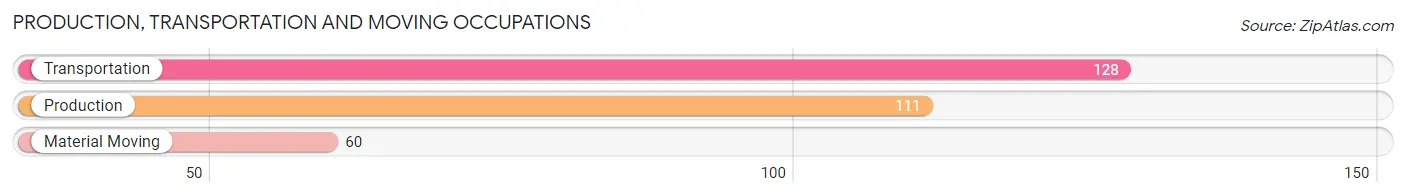
Production, Transportation and Moving Occupations
The most common Production, Transportation and Moving occupations in Ellisburg are Transportation (128 | 5.7%), Production (111 | 5.0%), and Material Moving (60 | 2.7%).
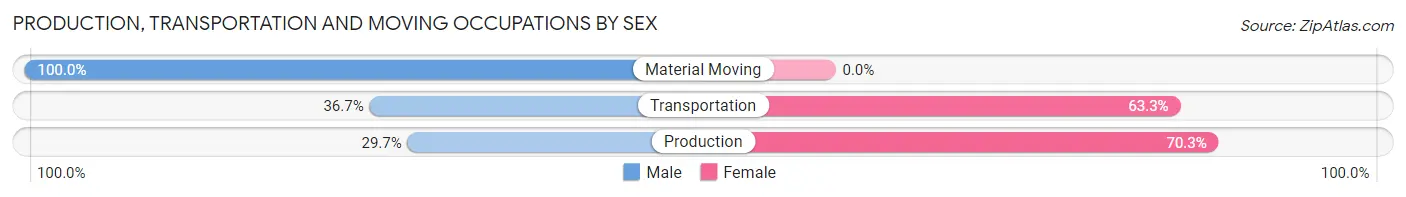
Production, Transportation and Moving Occupations by Sex
| Occupation | Male | Female |
| Production | 33 (29.7%) | 78 (70.3%) |
| Transportation | 47 (36.7%) | 81 (63.3%) |
| Material Moving | 60 (100.0%) | 0 (0.0%) |
| Total (Category) | 140 (46.8%) | 159 (53.2%) |
| Total (Overall) | 1,034 (46.2%) | 1,206 (53.8%) |
Employment Industries by Sex in Ellisburg
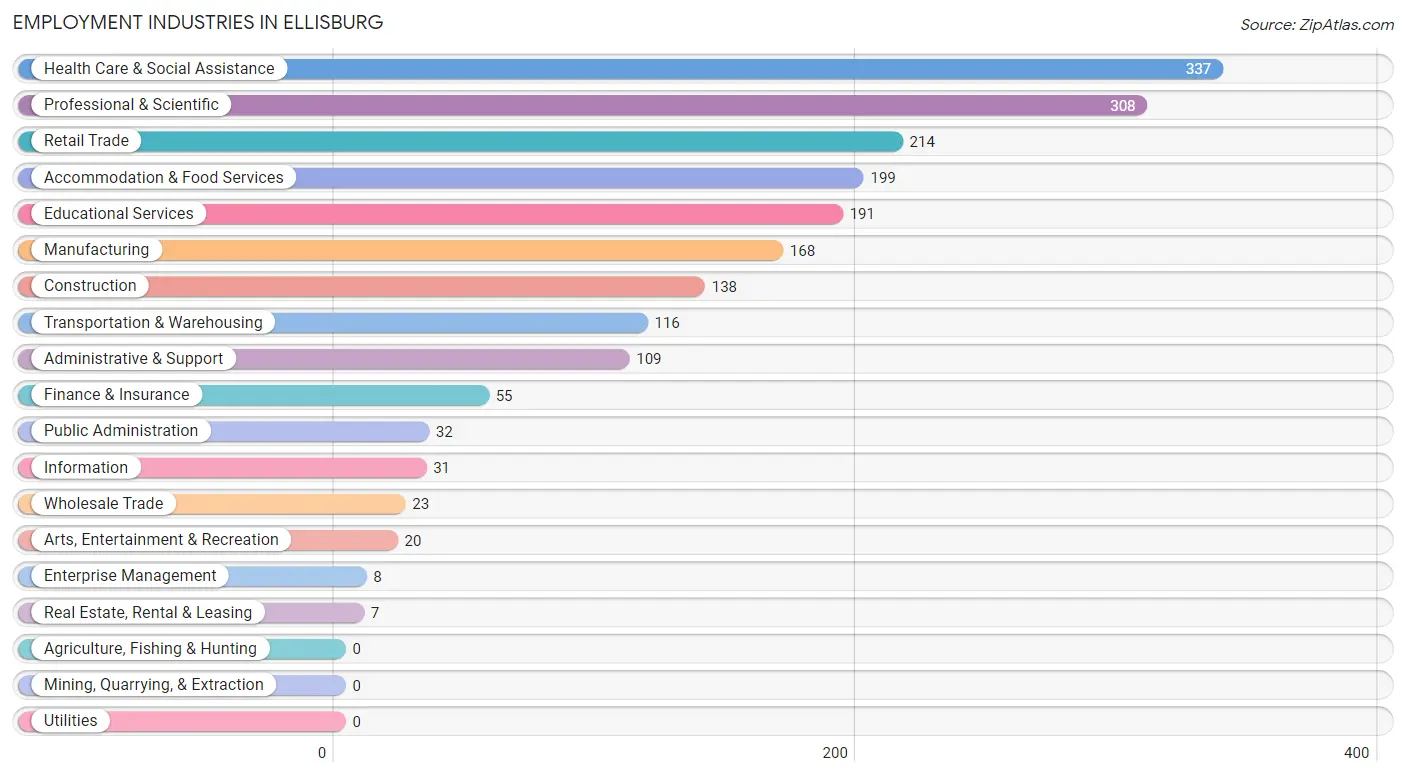
Employment Industries in Ellisburg
The major employment industries in Ellisburg include Health Care & Social Assistance (337 | 15.0%), Professional & Scientific (308 | 13.8%), Retail Trade (214 | 9.6%), Accommodation & Food Services (199 | 8.9%), and Educational Services (191 | 8.5%).
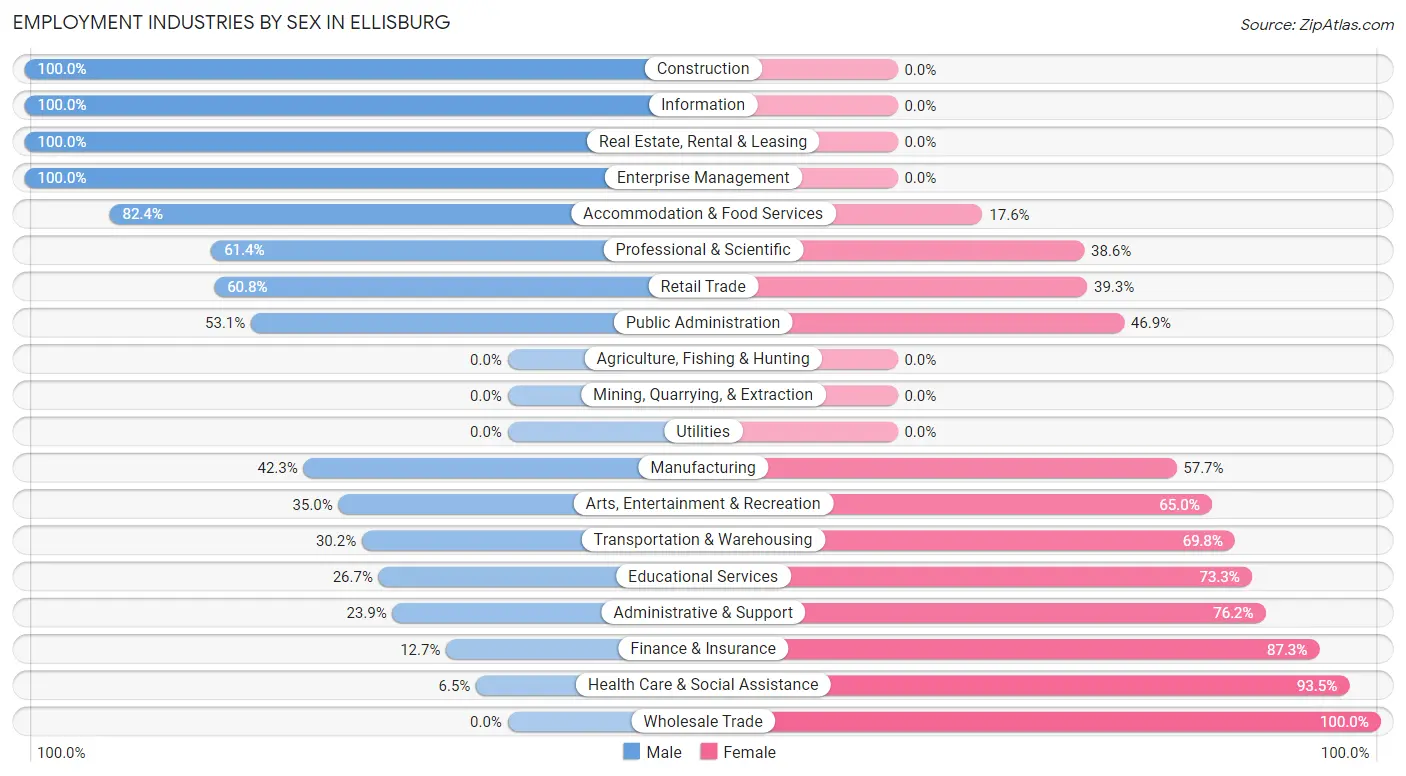
Employment Industries by Sex in Ellisburg
The Ellisburg industries that see more men than women are Construction (100.0%), Information (100.0%), and Real Estate, Rental & Leasing (100.0%), whereas the industries that tend to have a higher number of women are Wholesale Trade (100.0%), Health Care & Social Assistance (93.5%), and Finance & Insurance (87.3%).
| Industry | Male | Female |
| Agriculture, Fishing & Hunting | 0 (0.0%) | 0 (0.0%) |
| Mining, Quarrying, & Extraction | 0 (0.0%) | 0 (0.0%) |
| Construction | 138 (100.0%) | 0 (0.0%) |
| Manufacturing | 71 (42.3%) | 97 (57.7%) |
| Wholesale Trade | 0 (0.0%) | 23 (100.0%) |
| Retail Trade | 130 (60.8%) | 84 (39.3%) |
| Transportation & Warehousing | 35 (30.2%) | 81 (69.8%) |
| Utilities | 0 (0.0%) | 0 (0.0%) |
| Information | 31 (100.0%) | 0 (0.0%) |
| Finance & Insurance | 7 (12.7%) | 48 (87.3%) |
| Real Estate, Rental & Leasing | 7 (100.0%) | 0 (0.0%) |
| Professional & Scientific | 189 (61.4%) | 119 (38.6%) |
| Enterprise Management | 8 (100.0%) | 0 (0.0%) |
| Administrative & Support | 26 (23.8%) | 83 (76.1%) |
| Educational Services | 51 (26.7%) | 140 (73.3%) |
| Health Care & Social Assistance | 22 (6.5%) | 315 (93.5%) |
| Arts, Entertainment & Recreation | 7 (35.0%) | 13 (65.0%) |
| Accommodation & Food Services | 164 (82.4%) | 35 (17.6%) |
| Public Administration | 17 (53.1%) | 15 (46.9%) |
| Total | 1,034 (46.2%) | 1,206 (53.8%) |
Education in Ellisburg
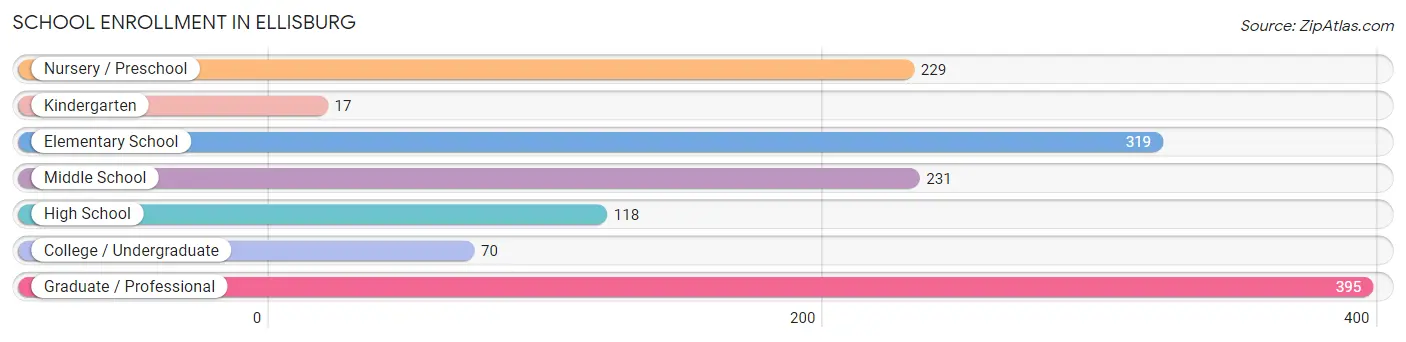
School Enrollment in Ellisburg
The most common levels of schooling among the 1,379 students in Ellisburg are graduate / professional (395 | 28.6%), elementary school (319 | 23.1%), and middle school (231 | 16.8%).
| School Level | # Students | % Students |
| Nursery / Preschool | 229 | 16.6% |
| Kindergarten | 17 | 1.2% |
| Elementary School | 319 | 23.1% |
| Middle School | 231 | 16.8% |
| High School | 118 | 8.6% |
| College / Undergraduate | 70 | 5.1% |
| Graduate / Professional | 395 | 28.6% |
| Total | 1,379 | 100.0% |
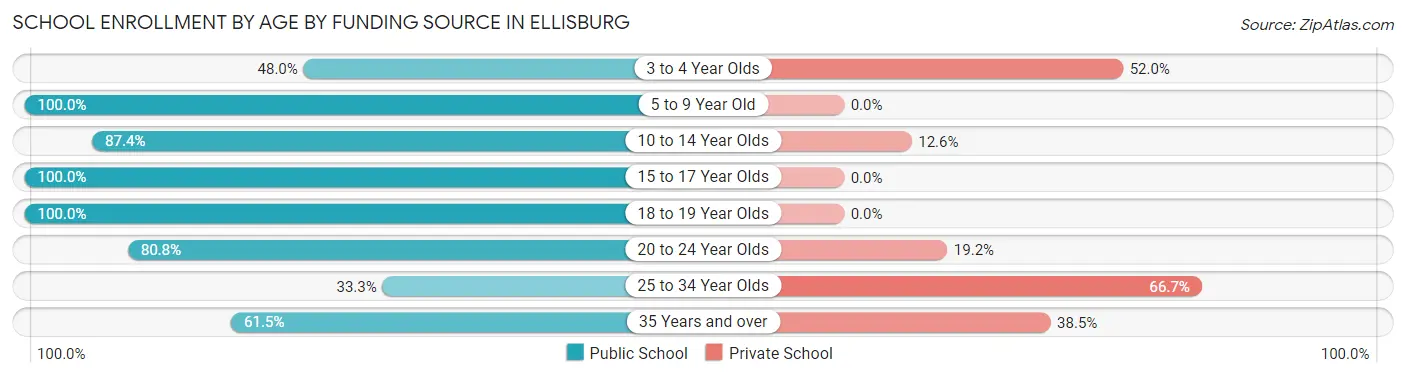
School Enrollment by Age by Funding Source in Ellisburg
Out of a total of 1,379 students who are enrolled in schools in Ellisburg, 376 (27.3%) attend a private institution, while the remaining 1,003 (72.7%) are enrolled in public schools. The age group of 25 to 34 year olds has the highest likelihood of being enrolled in private schools, with 166 (66.7% in the age bracket) enrolled. Conversely, the age group of 5 to 9 year old has the lowest likelihood of being enrolled in a private school, with 281 (100.0% in the age bracket) attending a public institution.
| Age Bracket | Public School | Private School |
| 3 to 4 Year Olds | 110 (48.0%) | 119 (52.0%) |
| 5 to 9 Year Old | 281 (100.0%) | 0 (0.0%) |
| 10 to 14 Year Olds | 250 (87.4%) | 36 (12.6%) |
| 15 to 17 Year Olds | 93 (100.0%) | 0 (0.0%) |
| 18 to 19 Year Olds | 20 (100.0%) | 0 (0.0%) |
| 20 to 24 Year Olds | 126 (80.8%) | 30 (19.2%) |
| 25 to 34 Year Olds | 83 (33.3%) | 166 (66.7%) |
| 35 Years and over | 40 (61.5%) | 25 (38.5%) |
| Total | 1,003 (72.7%) | 376 (27.3%) |
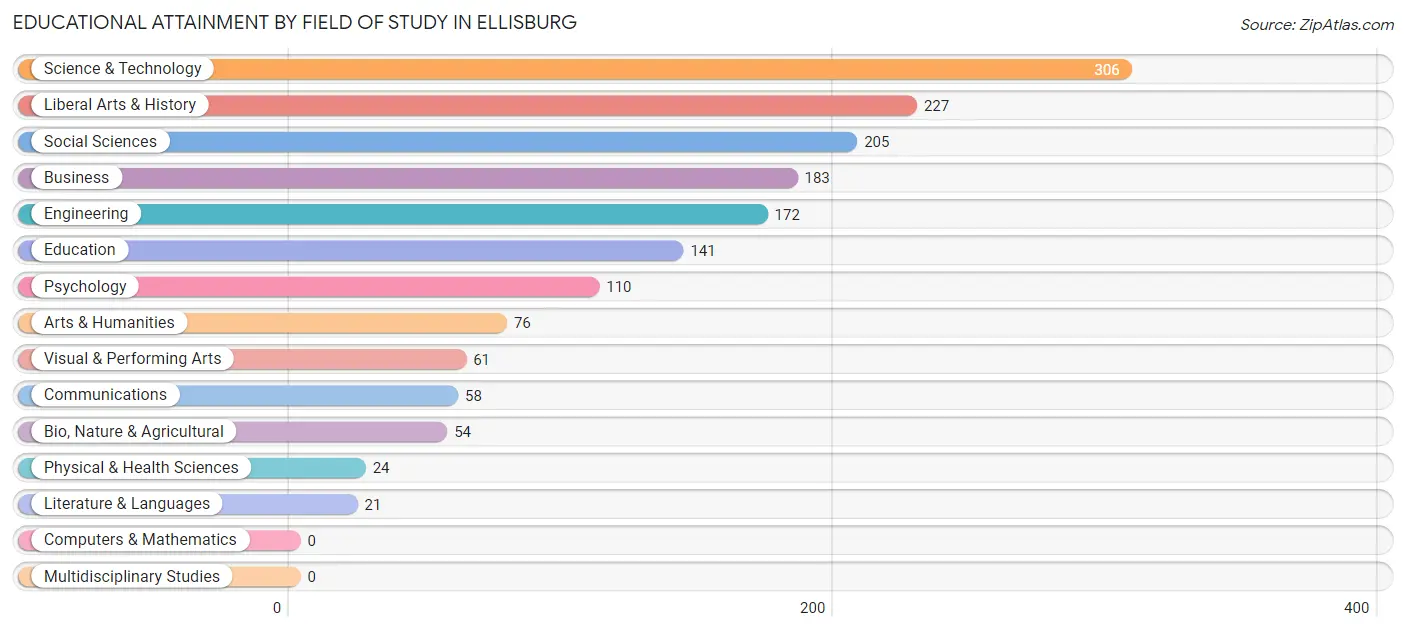
Educational Attainment by Field of Study in Ellisburg
Science & technology (306 | 18.7%), liberal arts & history (227 | 13.9%), social sciences (205 | 12.5%), business (183 | 11.2%), and engineering (172 | 10.5%) are the most common fields of study among 1,638 individuals in Ellisburg who have obtained a bachelor's degree or higher.
| Field of Study | # Graduates | % Graduates |
| Computers & Mathematics | 0 | 0.0% |
| Bio, Nature & Agricultural | 54 | 3.3% |
| Physical & Health Sciences | 24 | 1.5% |
| Psychology | 110 | 6.7% |
| Social Sciences | 205 | 12.5% |
| Engineering | 172 | 10.5% |
| Multidisciplinary Studies | 0 | 0.0% |
| Science & Technology | 306 | 18.7% |
| Business | 183 | 11.2% |
| Education | 141 | 8.6% |
| Literature & Languages | 21 | 1.3% |
| Liberal Arts & History | 227 | 13.9% |
| Visual & Performing Arts | 61 | 3.7% |
| Communications | 58 | 3.5% |
| Arts & Humanities | 76 | 4.6% |
| Total | 1,638 | 100.0% |
Transportation & Commute in Ellisburg
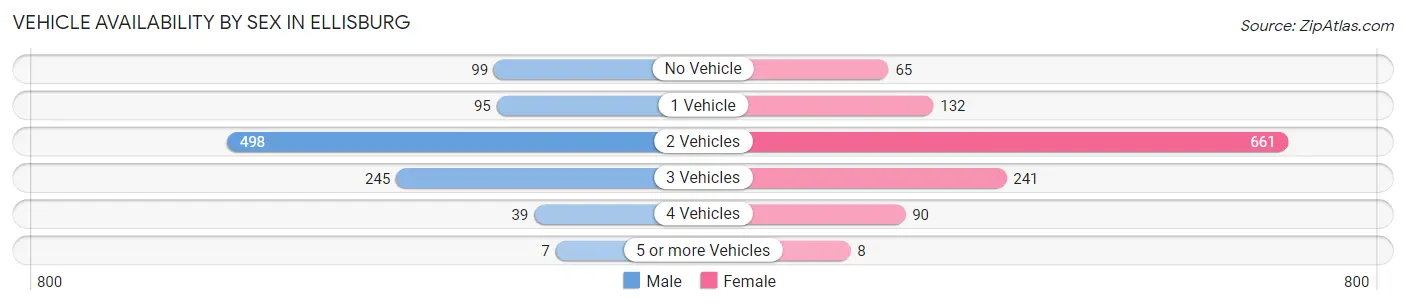
Vehicle Availability by Sex in Ellisburg
The most prevalent vehicle ownership categories in Ellisburg are males with 2 vehicles (498, accounting for 50.7%) and females with 2 vehicles (661, making up 41.6%).
| Vehicles Available | Male | Female |
| No Vehicle | 99 (10.1%) | 65 (5.4%) |
| 1 Vehicle | 95 (9.7%) | 132 (11.0%) |
| 2 Vehicles | 498 (50.7%) | 661 (55.2%) |
| 3 Vehicles | 245 (24.9%) | 241 (20.1%) |
| 4 Vehicles | 39 (4.0%) | 90 (7.5%) |
| 5 or more Vehicles | 7 (0.7%) | 8 (0.7%) |
| Total | 983 (100.0%) | 1,197 (100.0%) |
Commute Time in Ellisburg
The most frequently occuring commute durations in Ellisburg are 30 to 34 minutes (480 commuters, 23.8%), 15 to 19 minutes (334 commuters, 16.6%), and 20 to 24 minutes (327 commuters, 16.2%).
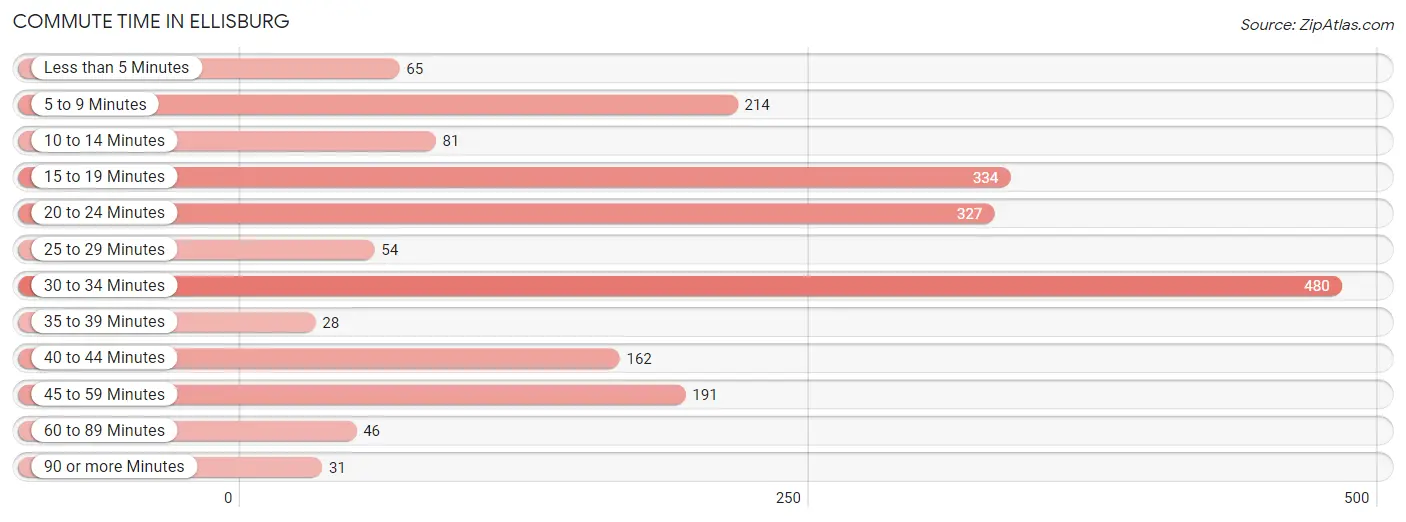
| Commute Time | # Commuters | % Commuters |
| Less than 5 Minutes | 65 | 3.2% |
| 5 to 9 Minutes | 214 | 10.6% |
| 10 to 14 Minutes | 81 | 4.0% |
| 15 to 19 Minutes | 334 | 16.6% |
| 20 to 24 Minutes | 327 | 16.2% |
| 25 to 29 Minutes | 54 | 2.7% |
| 30 to 34 Minutes | 480 | 23.8% |
| 35 to 39 Minutes | 28 | 1.4% |
| 40 to 44 Minutes | 162 | 8.1% |
| 45 to 59 Minutes | 191 | 9.5% |
| 60 to 89 Minutes | 46 | 2.3% |
| 90 or more Minutes | 31 | 1.5% |
Commute Time by Sex in Ellisburg
The most common commute times in Ellisburg are 30 to 34 minutes (244 commuters, 25.7%) for males and 20 to 24 minutes (259 commuters, 24.4%) for females.
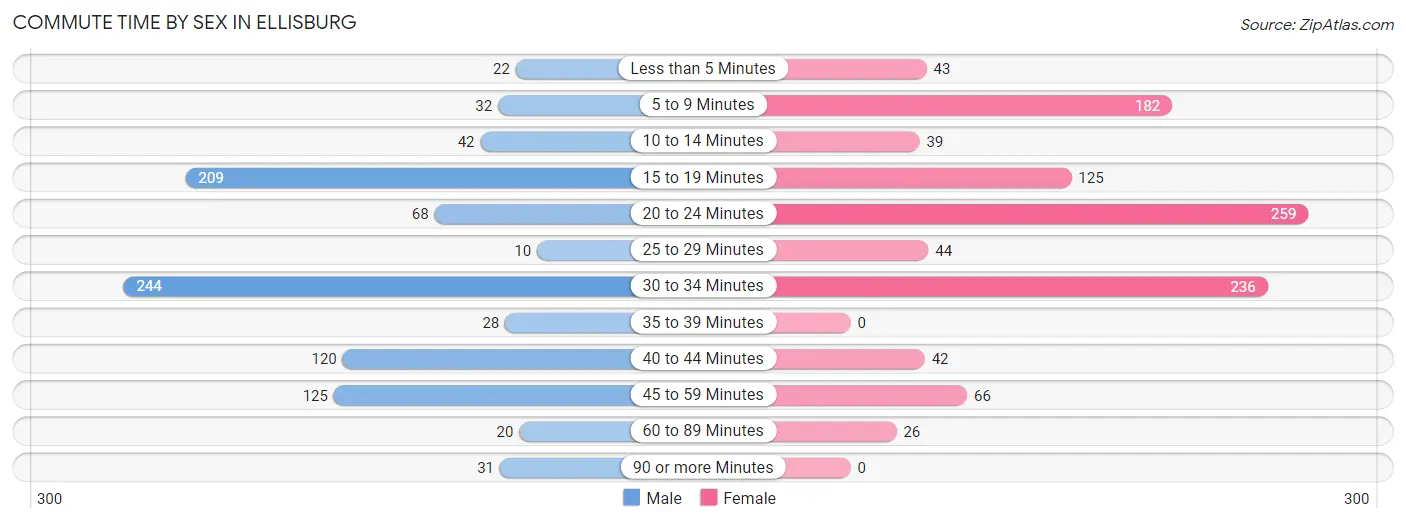
| Commute Time | Male | Female |
| Less than 5 Minutes | 22 (2.3%) | 43 (4.1%) |
| 5 to 9 Minutes | 32 (3.4%) | 182 (17.1%) |
| 10 to 14 Minutes | 42 (4.4%) | 39 (3.7%) |
| 15 to 19 Minutes | 209 (22.0%) | 125 (11.8%) |
| 20 to 24 Minutes | 68 (7.1%) | 259 (24.4%) |
| 25 to 29 Minutes | 10 (1.1%) | 44 (4.1%) |
| 30 to 34 Minutes | 244 (25.7%) | 236 (22.2%) |
| 35 to 39 Minutes | 28 (2.9%) | 0 (0.0%) |
| 40 to 44 Minutes | 120 (12.6%) | 42 (4.0%) |
| 45 to 59 Minutes | 125 (13.1%) | 66 (6.2%) |
| 60 to 89 Minutes | 20 (2.1%) | 26 (2.5%) |
| 90 or more Minutes | 31 (3.3%) | 0 (0.0%) |
Time of Departure to Work by Sex in Ellisburg
The most frequent times of departure to work in Ellisburg are 12:00 AM to 4:59 AM (210, 22.1%) for males and 7:30 AM to 7:59 AM (194, 18.3%) for females.
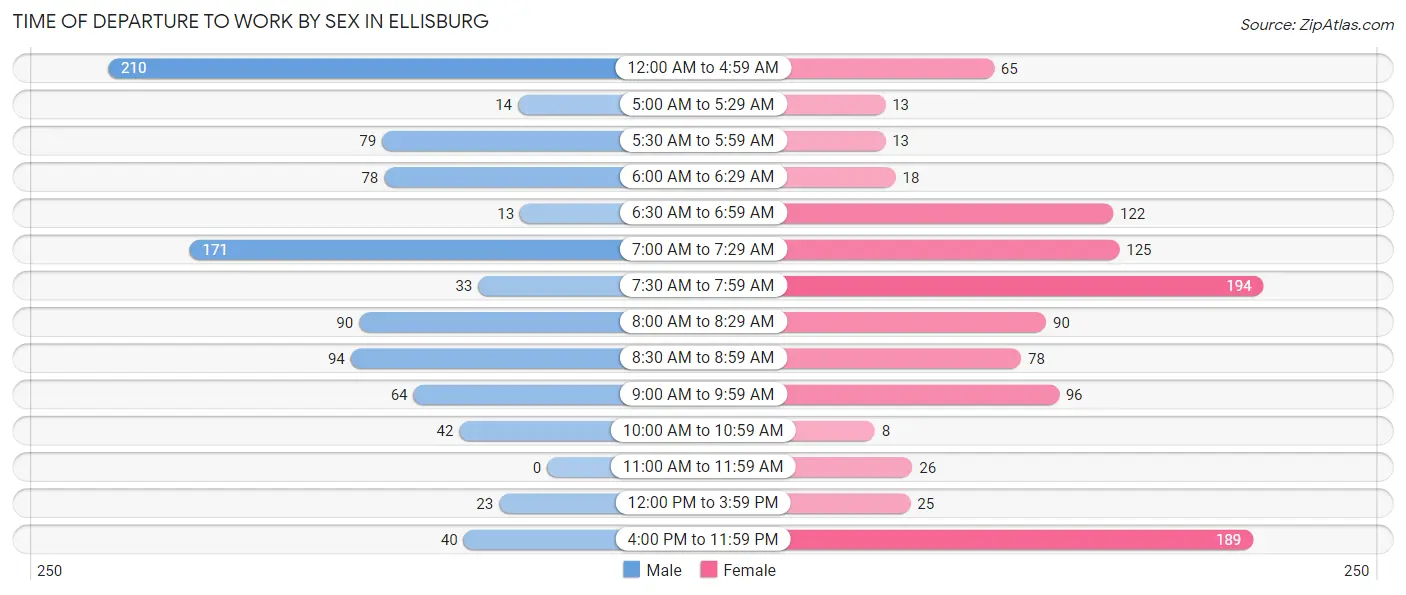
| Time of Departure | Male | Female |
| 12:00 AM to 4:59 AM | 210 (22.1%) | 65 (6.1%) |
| 5:00 AM to 5:29 AM | 14 (1.5%) | 13 (1.2%) |
| 5:30 AM to 5:59 AM | 79 (8.3%) | 13 (1.2%) |
| 6:00 AM to 6:29 AM | 78 (8.2%) | 18 (1.7%) |
| 6:30 AM to 6:59 AM | 13 (1.4%) | 122 (11.5%) |
| 7:00 AM to 7:29 AM | 171 (18.0%) | 125 (11.8%) |
| 7:30 AM to 7:59 AM | 33 (3.5%) | 194 (18.3%) |
| 8:00 AM to 8:29 AM | 90 (9.5%) | 90 (8.5%) |
| 8:30 AM to 8:59 AM | 94 (9.9%) | 78 (7.3%) |
| 9:00 AM to 9:59 AM | 64 (6.7%) | 96 (9.0%) |
| 10:00 AM to 10:59 AM | 42 (4.4%) | 8 (0.7%) |
| 11:00 AM to 11:59 AM | 0 (0.0%) | 26 (2.5%) |
| 12:00 PM to 3:59 PM | 23 (2.4%) | 25 (2.4%) |
| 4:00 PM to 11:59 PM | 40 (4.2%) | 189 (17.8%) |
| Total | 951 (100.0%) | 1,062 (100.0%) |
Housing Occupancy in Ellisburg
Occupancy by Ownership in Ellisburg
Of the total 1,965 dwellings in Ellisburg, owner-occupied units account for 1,319 (67.1%), while renter-occupied units make up 646 (32.9%).
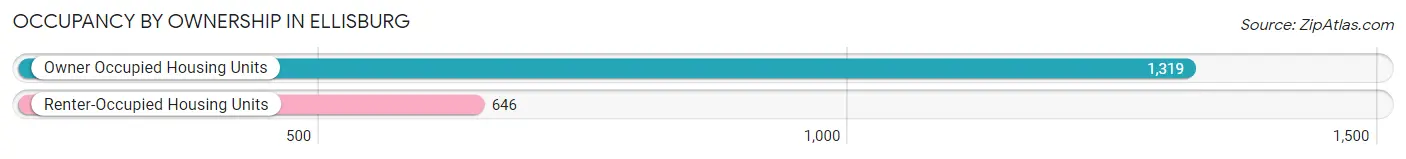
| Occupancy | # Housing Units | % Housing Units |
| Owner Occupied Housing Units | 1,319 | 67.1% |
| Renter-Occupied Housing Units | 646 | 32.9% |
| Total Occupied Housing Units | 1,965 | 100.0% |
Occupancy by Household Size in Ellisburg
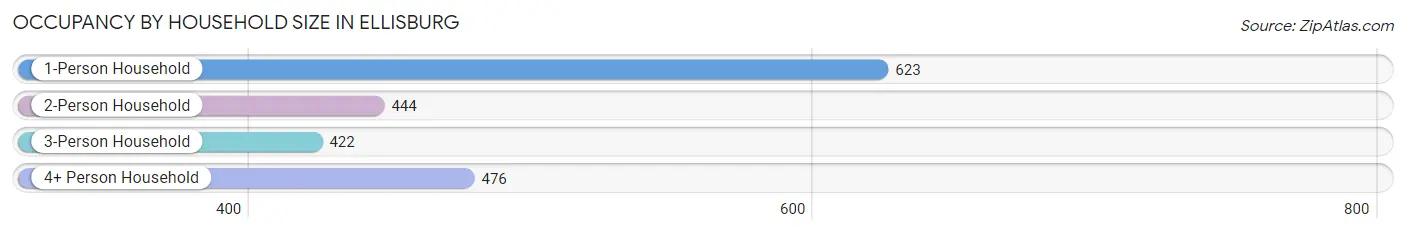
| Household Size | # Housing Units | % Housing Units |
| 1-Person Household | 623 | 31.7% |
| 2-Person Household | 444 | 22.6% |
| 3-Person Household | 422 | 21.5% |
| 4+ Person Household | 476 | 24.2% |
| Total Housing Units | 1,965 | 100.0% |
Occupancy by Ownership by Household Size in Ellisburg
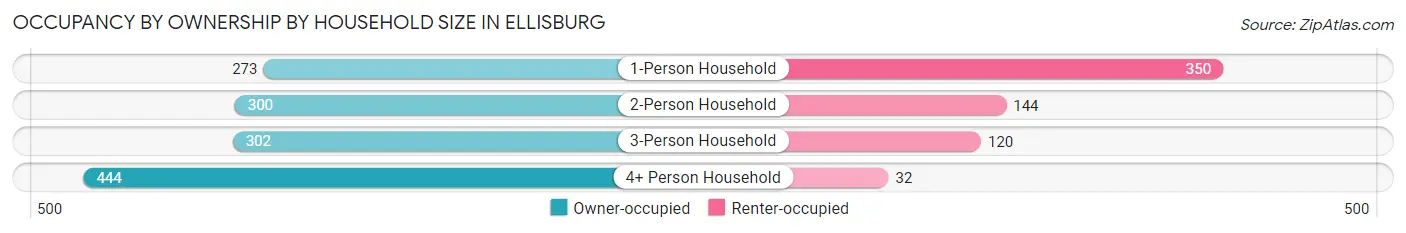
| Household Size | Owner-occupied | Renter-occupied |
| 1-Person Household | 273 (43.8%) | 350 (56.2%) |
| 2-Person Household | 300 (67.6%) | 144 (32.4%) |
| 3-Person Household | 302 (71.6%) | 120 (28.4%) |
| 4+ Person Household | 444 (93.3%) | 32 (6.7%) |
| Total Housing Units | 1,319 (67.1%) | 646 (32.9%) |
Occupancy by Educational Attainment in Ellisburg
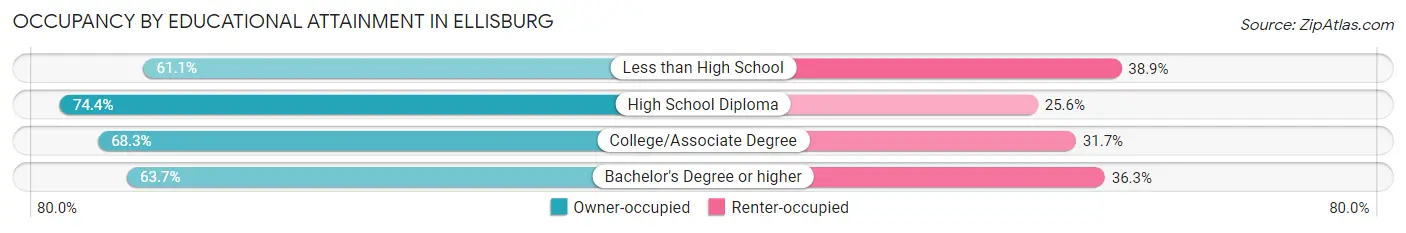
| Household Size | Owner-occupied | Renter-occupied |
| Less than High School | 143 (61.1%) | 91 (38.9%) |
| High School Diploma | 354 (74.4%) | 122 (25.6%) |
| College/Associate Degree | 330 (68.3%) | 153 (31.7%) |
| Bachelor's Degree or higher | 492 (63.7%) | 280 (36.3%) |
Occupancy by Age of Householder in Ellisburg
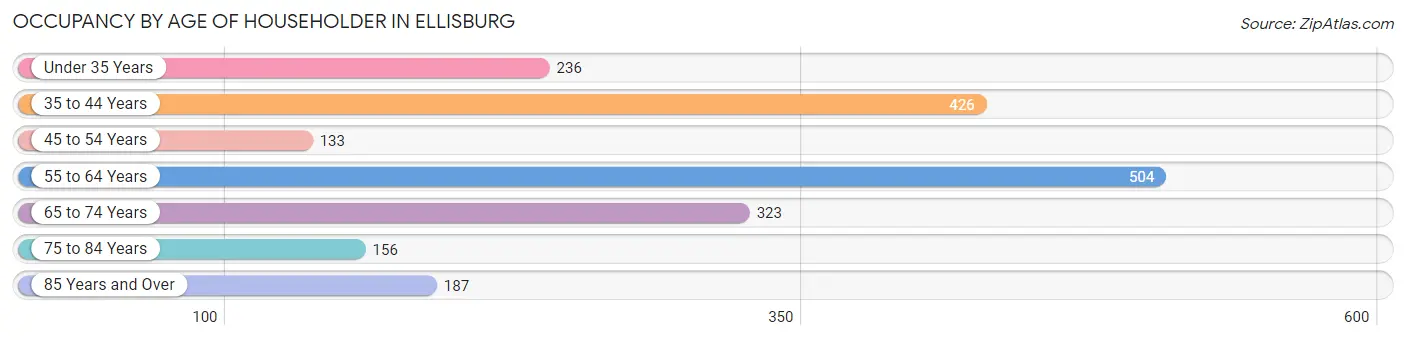
| Age Bracket | # Households | % Households |
| Under 35 Years | 236 | 12.0% |
| 35 to 44 Years | 426 | 21.7% |
| 45 to 54 Years | 133 | 6.8% |
| 55 to 64 Years | 504 | 25.7% |
| 65 to 74 Years | 323 | 16.4% |
| 75 to 84 Years | 156 | 7.9% |
| 85 Years and Over | 187 | 9.5% |
| Total | 1,965 | 100.0% |
Housing Finances in Ellisburg
Median Income by Occupancy in Ellisburg
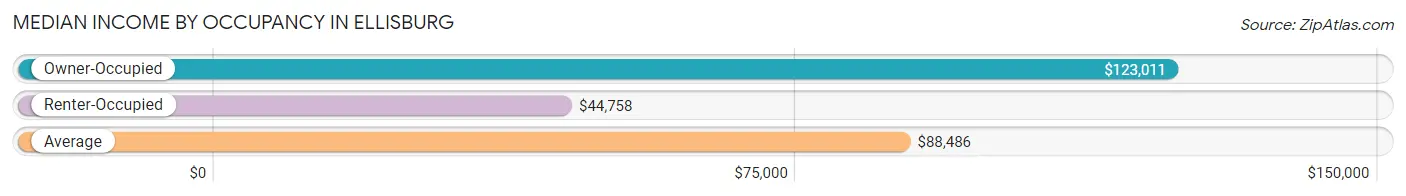
| Occupancy Type | # Households | Median Income |
| Owner-Occupied | 1,319 (67.1%) | $123,011 |
| Renter-Occupied | 646 (32.9%) | $44,758 |
| Average | 1,965 (100.0%) | $88,486 |
Occupancy by Householder Income Bracket in Ellisburg
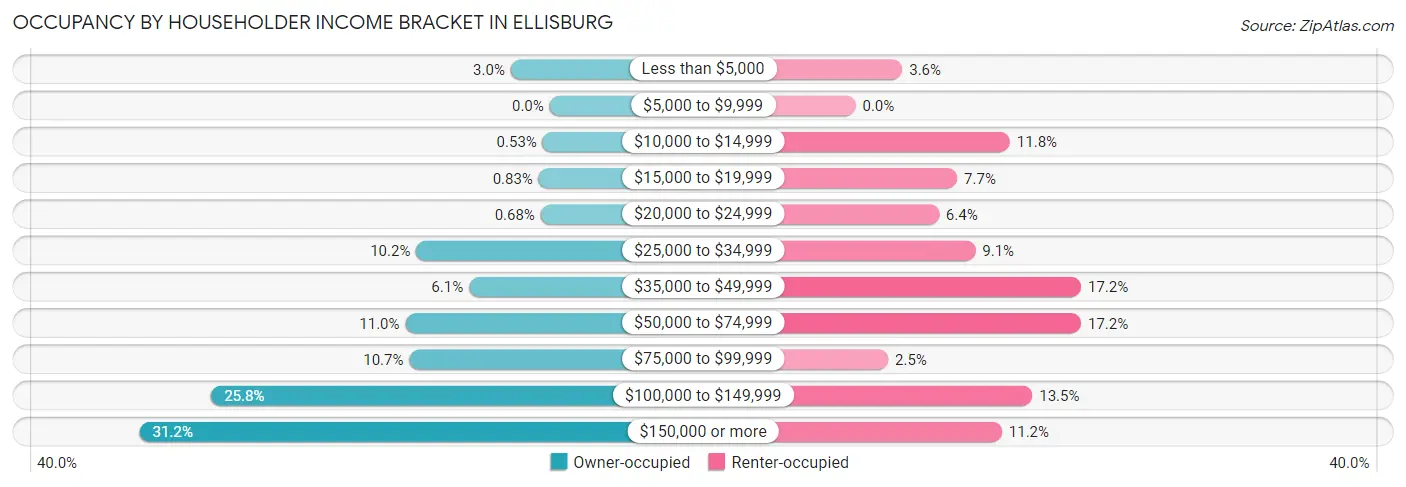
| Income Bracket | Owner-occupied | Renter-occupied |
| Less than $5,000 | 39 (3.0%) | 23 (3.6%) |
| $5,000 to $9,999 | 0 (0.0%) | 0 (0.0%) |
| $10,000 to $14,999 | 7 (0.5%) | 76 (11.8%) |
| $15,000 to $19,999 | 11 (0.8%) | 50 (7.7%) |
| $20,000 to $24,999 | 9 (0.7%) | 41 (6.4%) |
| $25,000 to $34,999 | 134 (10.2%) | 59 (9.1%) |
| $35,000 to $49,999 | 81 (6.1%) | 111 (17.2%) |
| $50,000 to $74,999 | 145 (11.0%) | 111 (17.2%) |
| $75,000 to $99,999 | 141 (10.7%) | 16 (2.5%) |
| $100,000 to $149,999 | 340 (25.8%) | 87 (13.5%) |
| $150,000 or more | 412 (31.2%) | 72 (11.2%) |
| Total | 1,319 (100.0%) | 646 (100.0%) |
Monthly Housing Cost Tiers in Ellisburg
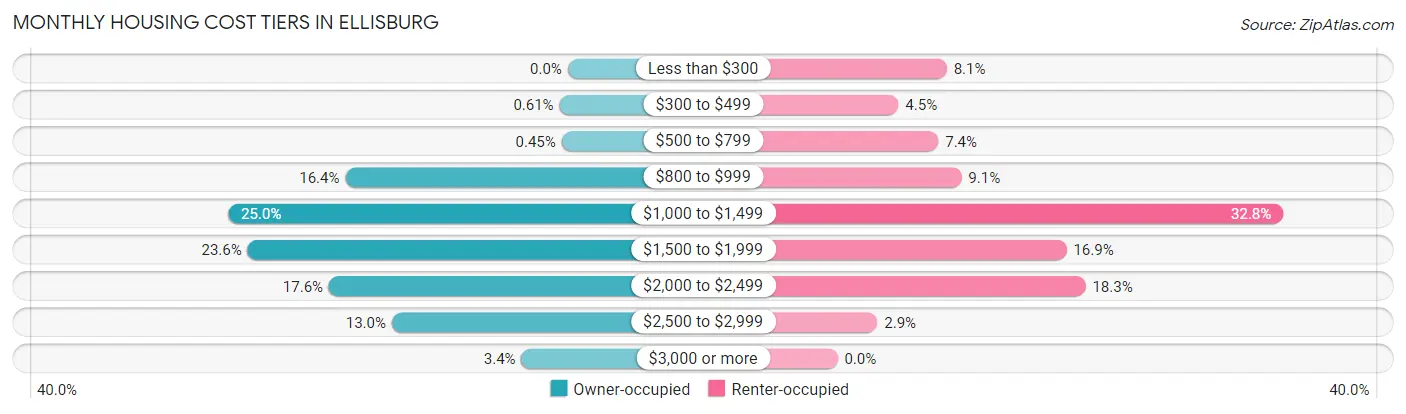
| Monthly Cost | Owner-occupied | Renter-occupied |
| Less than $300 | 0 (0.0%) | 52 (8.1%) |
| $300 to $499 | 8 (0.6%) | 29 (4.5%) |
| $500 to $799 | 6 (0.4%) | 48 (7.4%) |
| $800 to $999 | 216 (16.4%) | 59 (9.1%) |
| $1,000 to $1,499 | 330 (25.0%) | 212 (32.8%) |
| $1,500 to $1,999 | 311 (23.6%) | 109 (16.9%) |
| $2,000 to $2,499 | 232 (17.6%) | 118 (18.3%) |
| $2,500 to $2,999 | 171 (13.0%) | 19 (2.9%) |
| $3,000 or more | 45 (3.4%) | 0 (0.0%) |
| Total | 1,319 (100.0%) | 646 (100.0%) |
Physical Housing Characteristics in Ellisburg
Housing Structures in Ellisburg
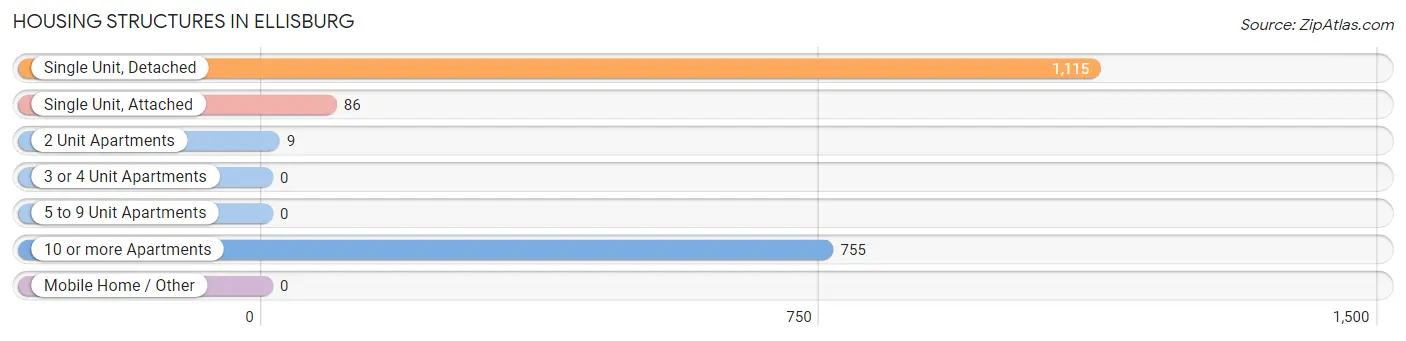
| Structure Type | # Housing Units | % Housing Units |
| Single Unit, Detached | 1,115 | 56.7% |
| Single Unit, Attached | 86 | 4.4% |
| 2 Unit Apartments | 9 | 0.5% |
| 3 or 4 Unit Apartments | 0 | 0.0% |
| 5 to 9 Unit Apartments | 0 | 0.0% |
| 10 or more Apartments | 755 | 38.4% |
| Mobile Home / Other | 0 | 0.0% |
| Total | 1,965 | 100.0% |
Housing Structures by Occupancy in Ellisburg
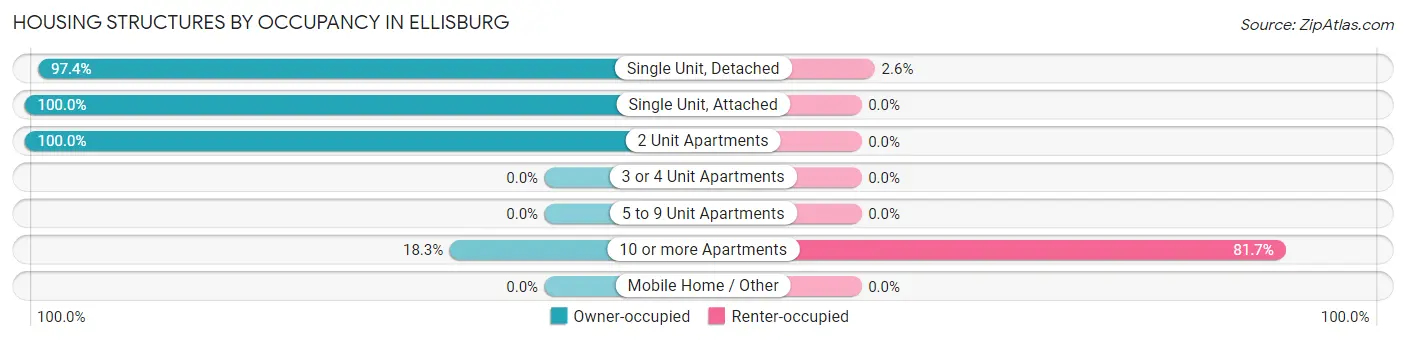
| Structure Type | Owner-occupied | Renter-occupied |
| Single Unit, Detached | 1,086 (97.4%) | 29 (2.6%) |
| Single Unit, Attached | 86 (100.0%) | 0 (0.0%) |
| 2 Unit Apartments | 9 (100.0%) | 0 (0.0%) |
| 3 or 4 Unit Apartments | 0 (0.0%) | 0 (0.0%) |
| 5 to 9 Unit Apartments | 0 (0.0%) | 0 (0.0%) |
| 10 or more Apartments | 138 (18.3%) | 617 (81.7%) |
| Mobile Home / Other | 0 (0.0%) | 0 (0.0%) |
| Total | 1,319 (67.1%) | 646 (32.9%) |
Housing Structures by Number of Rooms in Ellisburg
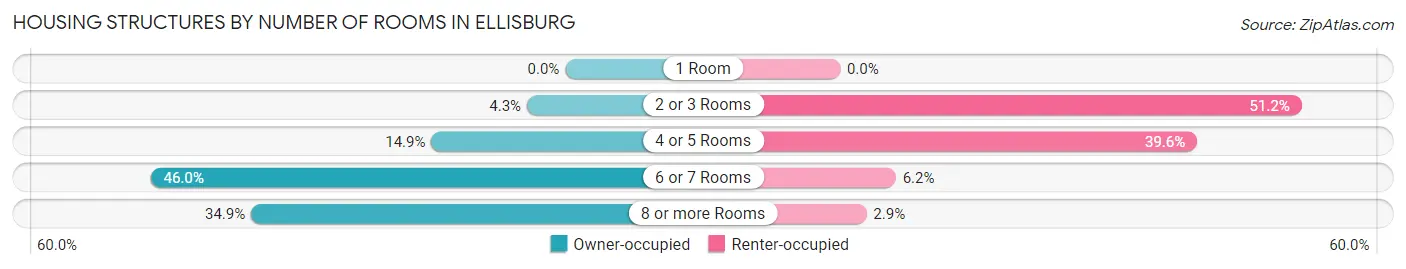
| Number of Rooms | Owner-occupied | Renter-occupied |
| 1 Room | 0 (0.0%) | 0 (0.0%) |
| 2 or 3 Rooms | 56 (4.3%) | 331 (51.2%) |
| 4 or 5 Rooms | 196 (14.9%) | 256 (39.6%) |
| 6 or 7 Rooms | 607 (46.0%) | 40 (6.2%) |
| 8 or more Rooms | 460 (34.9%) | 19 (2.9%) |
| Total | 1,319 (100.0%) | 646 (100.0%) |
Housing Structure by Heating Type in Ellisburg
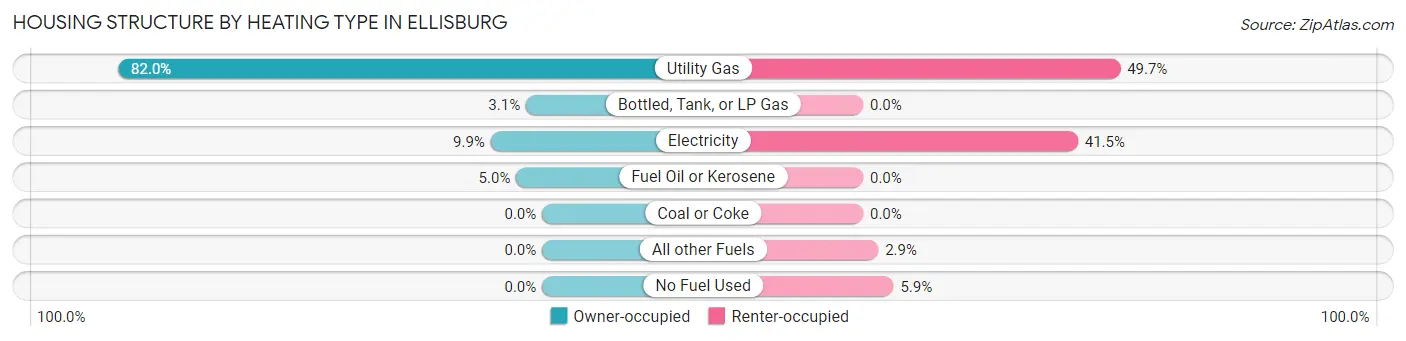
| Heating Type | Owner-occupied | Renter-occupied |
| Utility Gas | 1,081 (82.0%) | 321 (49.7%) |
| Bottled, Tank, or LP Gas | 41 (3.1%) | 0 (0.0%) |
| Electricity | 131 (9.9%) | 268 (41.5%) |
| Fuel Oil or Kerosene | 66 (5.0%) | 0 (0.0%) |
| Coal or Coke | 0 (0.0%) | 0 (0.0%) |
| All other Fuels | 0 (0.0%) | 19 (2.9%) |
| No Fuel Used | 0 (0.0%) | 38 (5.9%) |
| Total | 1,319 (100.0%) | 646 (100.0%) |
Household Vehicle Usage in Ellisburg
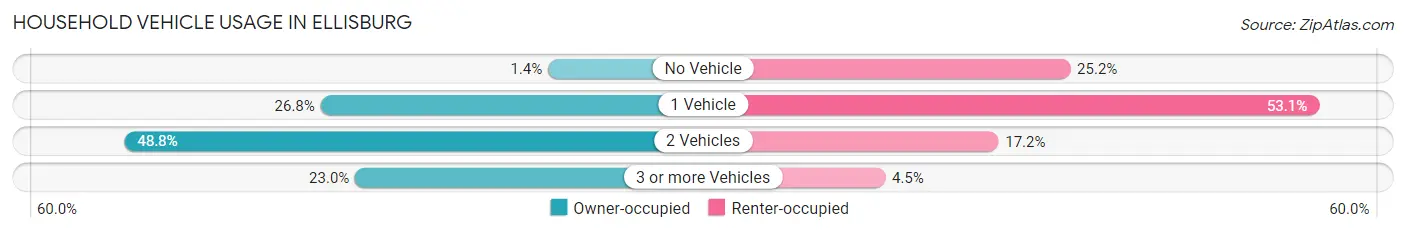
| Vehicles per Household | Owner-occupied | Renter-occupied |
| No Vehicle | 18 (1.4%) | 163 (25.2%) |
| 1 Vehicle | 354 (26.8%) | 343 (53.1%) |
| 2 Vehicles | 644 (48.8%) | 111 (17.2%) |
| 3 or more Vehicles | 303 (23.0%) | 29 (4.5%) |
| Total | 1,319 (100.0%) | 646 (100.0%) |
Real Estate & Mortgages in Ellisburg
Real Estate and Mortgage Overview in Ellisburg
| Characteristic | Without Mortgage | With Mortgage |
| Housing Units | 546 | 773 |
| Median Property Value | $272,900 | $280,200 |
| Median Household Income | $74,324 | $346 |
| Monthly Housing Costs | $1,049 | $45 |
| Real Estate Taxes | $7,488 | $0 |
Property Value by Mortgage Status in Ellisburg
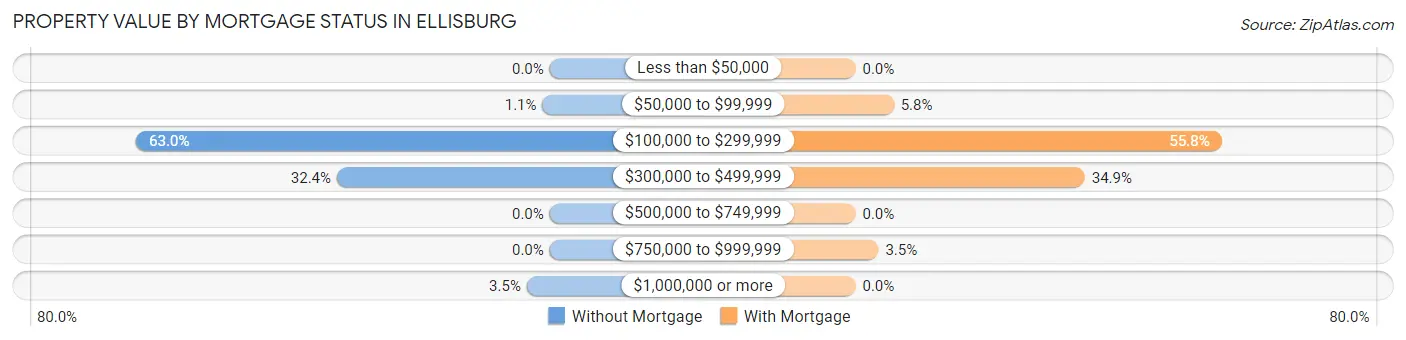
| Property Value | Without Mortgage | With Mortgage |
| Less than $50,000 | 0 (0.0%) | 0 (0.0%) |
| $50,000 to $99,999 | 6 (1.1%) | 45 (5.8%) |
| $100,000 to $299,999 | 344 (63.0%) | 431 (55.8%) |
| $300,000 to $499,999 | 177 (32.4%) | 270 (34.9%) |
| $500,000 to $749,999 | 0 (0.0%) | 0 (0.0%) |
| $750,000 to $999,999 | 0 (0.0%) | 27 (3.5%) |
| $1,000,000 or more | 19 (3.5%) | 0 (0.0%) |
| Total | 546 (100.0%) | 773 (100.0%) |
Household Income by Mortgage Status in Ellisburg
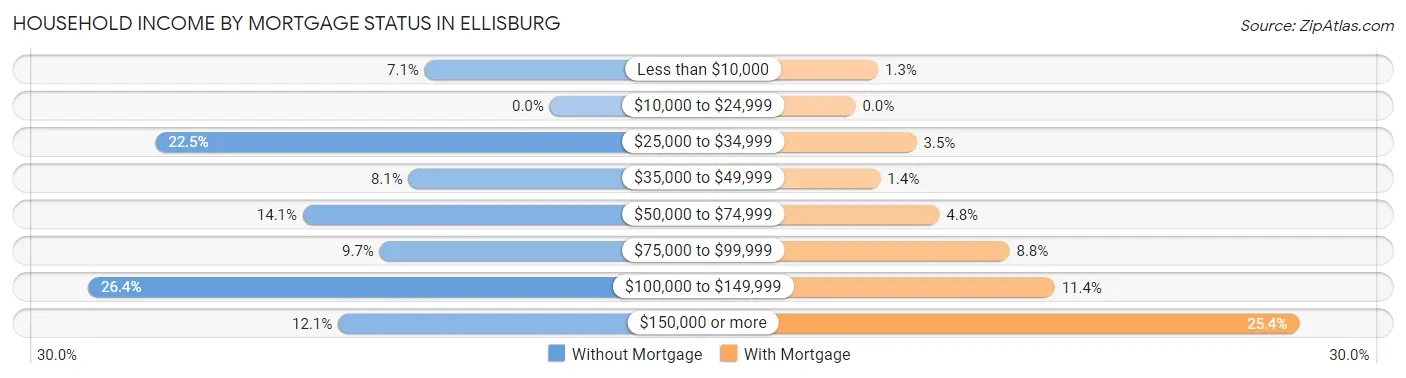
| Household Income | Without Mortgage | With Mortgage |
| Less than $10,000 | 39 (7.1%) | 10 (1.3%) |
| $10,000 to $24,999 | 0 (0.0%) | 0 (0.0%) |
| $25,000 to $34,999 | 123 (22.5%) | 27 (3.5%) |
| $35,000 to $49,999 | 44 (8.1%) | 11 (1.4%) |
| $50,000 to $74,999 | 77 (14.1%) | 37 (4.8%) |
| $75,000 to $99,999 | 53 (9.7%) | 68 (8.8%) |
| $100,000 to $149,999 | 144 (26.4%) | 88 (11.4%) |
| $150,000 or more | 66 (12.1%) | 196 (25.4%) |
| Total | 546 (100.0%) | 773 (100.0%) |
Property Value to Household Income Ratio in Ellisburg
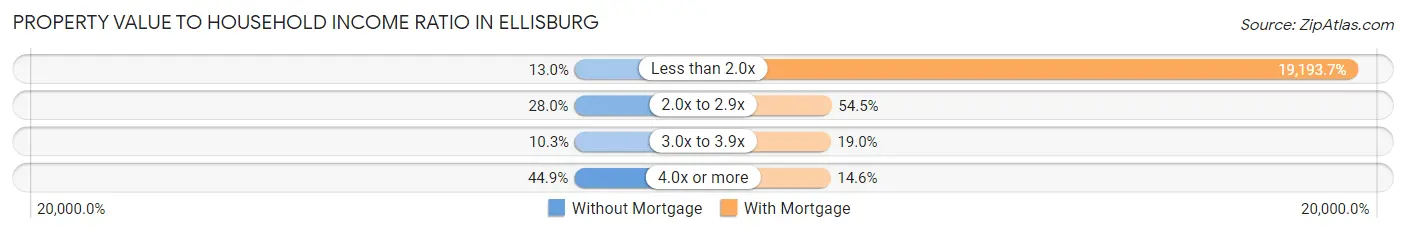
| Value-to-Income Ratio | Without Mortgage | With Mortgage |
| Less than 2.0x | 71 (13.0%) | 148,367 (19,193.7%) |
| 2.0x to 2.9x | 153 (28.0%) | 421 (54.5%) |
| 3.0x to 3.9x | 56 (10.3%) | 147 (19.0%) |
| 4.0x or more | 245 (44.9%) | 113 (14.6%) |
| Total | 546 (100.0%) | 773 (100.0%) |
Real Estate Taxes by Mortgage Status in Ellisburg
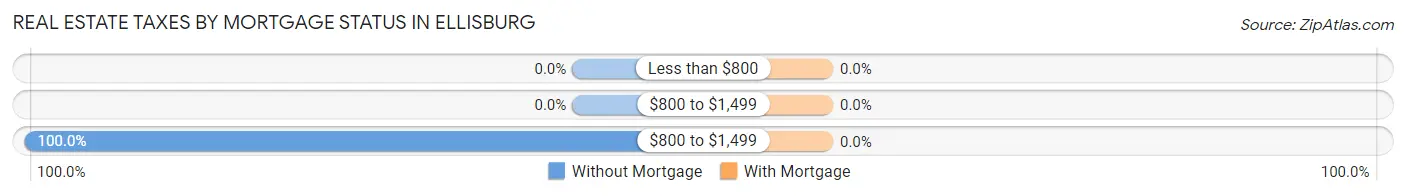
| Property Taxes | Without Mortgage | With Mortgage |
| Less than $800 | 0 (0.0%) | 0 (0.0%) |
| $800 to $1,499 | 0 (0.0%) | 0 (0.0%) |
| $800 to $1,499 | 546 (100.0%) | 0 (0.0%) |
| Total | 546 (100.0%) | 773 (100.0%) |
Health & Disability in Ellisburg
Health Insurance Coverage by Age in Ellisburg
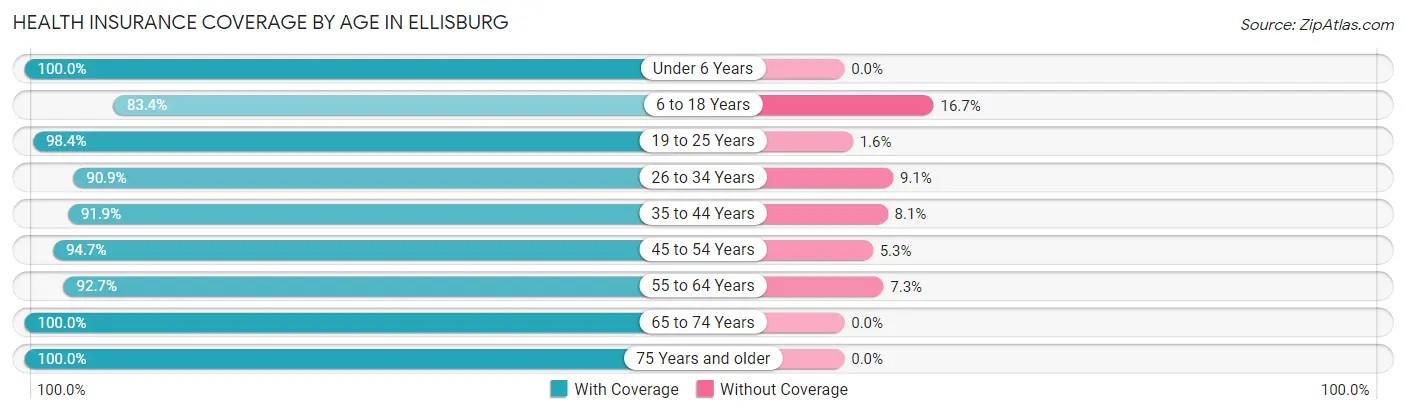
| Age Bracket | With Coverage | Without Coverage |
| Under 6 Years | 534 (100.0%) | 0 (0.0%) |
| 6 to 18 Years | 651 (83.4%) | 130 (16.7%) |
| 19 to 25 Years | 314 (98.4%) | 5 (1.6%) |
| 26 to 34 Years | 700 (90.9%) | 70 (9.1%) |
| 35 to 44 Years | 706 (91.9%) | 62 (8.1%) |
| 45 to 54 Years | 393 (94.7%) | 22 (5.3%) |
| 55 to 64 Years | 726 (92.7%) | 57 (7.3%) |
| 65 to 74 Years | 542 (100.0%) | 0 (0.0%) |
| 75 Years and older | 446 (100.0%) | 0 (0.0%) |
| Total | 5,012 (93.5%) | 346 (6.5%) |
Health Insurance Coverage by Citizenship Status in Ellisburg
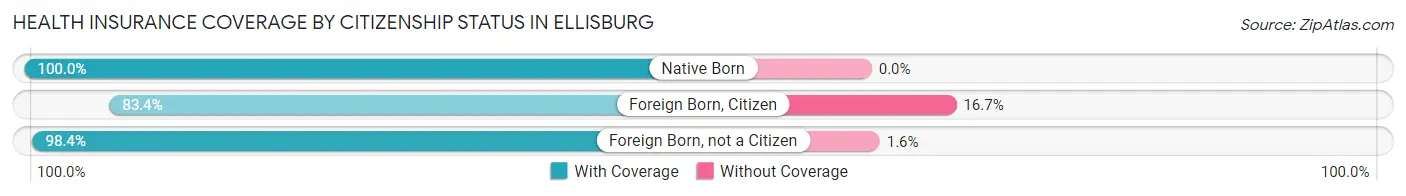
| Citizenship Status | With Coverage | Without Coverage |
| Native Born | 534 (100.0%) | 0 (0.0%) |
| Foreign Born, Citizen | 651 (83.4%) | 130 (16.7%) |
| Foreign Born, not a Citizen | 314 (98.4%) | 5 (1.6%) |
Health Insurance Coverage by Household Income in Ellisburg
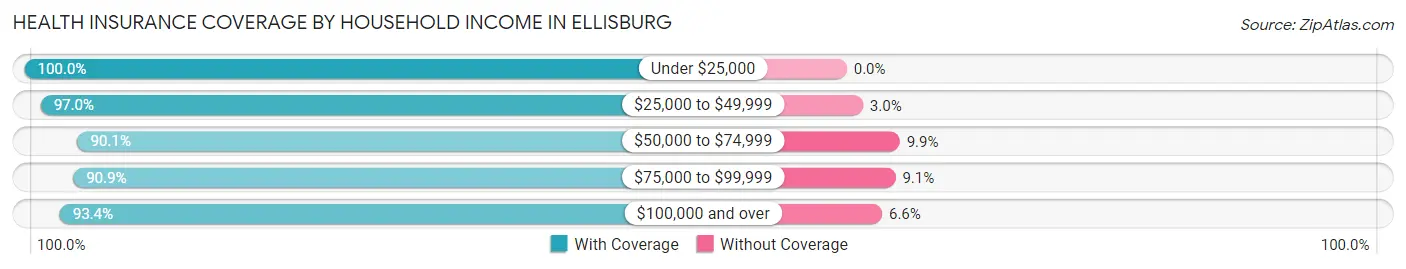
| Household Income | With Coverage | Without Coverage |
| Under $25,000 | 342 (100.0%) | 0 (0.0%) |
| $25,000 to $49,999 | 579 (97.0%) | 18 (3.0%) |
| $50,000 to $74,999 | 591 (90.1%) | 65 (9.9%) |
| $75,000 to $99,999 | 339 (90.9%) | 34 (9.1%) |
| $100,000 and over | 3,157 (93.4%) | 223 (6.6%) |
Public vs Private Health Insurance Coverage by Age in Ellisburg
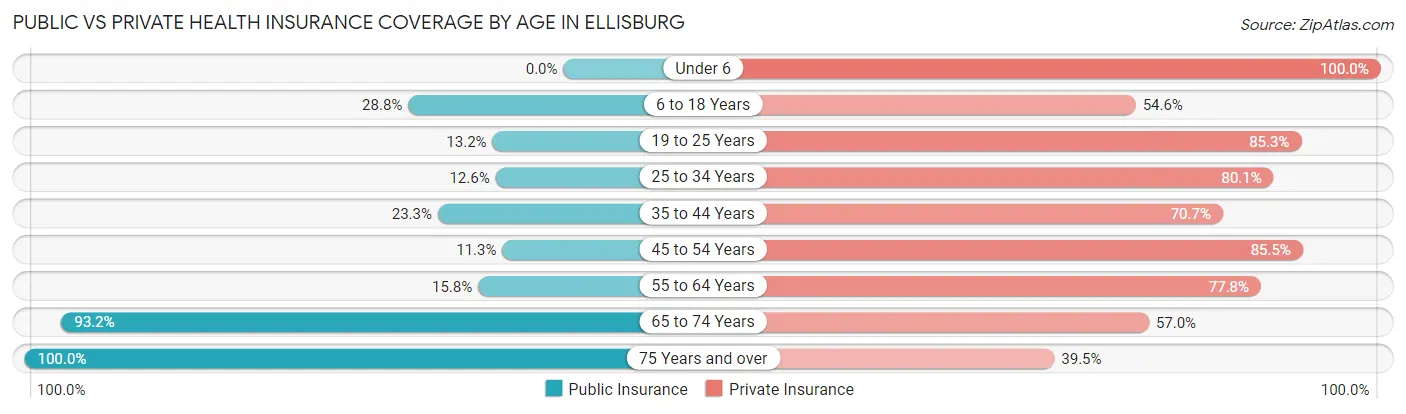
| Age Bracket | Public Insurance | Private Insurance |
| Under 6 | 0 (0.0%) | 534 (100.0%) |
| 6 to 18 Years | 225 (28.8%) | 426 (54.5%) |
| 19 to 25 Years | 42 (13.2%) | 272 (85.3%) |
| 25 to 34 Years | 97 (12.6%) | 617 (80.1%) |
| 35 to 44 Years | 179 (23.3%) | 543 (70.7%) |
| 45 to 54 Years | 47 (11.3%) | 355 (85.5%) |
| 55 to 64 Years | 124 (15.8%) | 609 (77.8%) |
| 65 to 74 Years | 505 (93.2%) | 309 (57.0%) |
| 75 Years and over | 446 (100.0%) | 176 (39.5%) |
| Total | 1,665 (31.1%) | 3,841 (71.7%) |
Disability Status by Sex by Age in Ellisburg
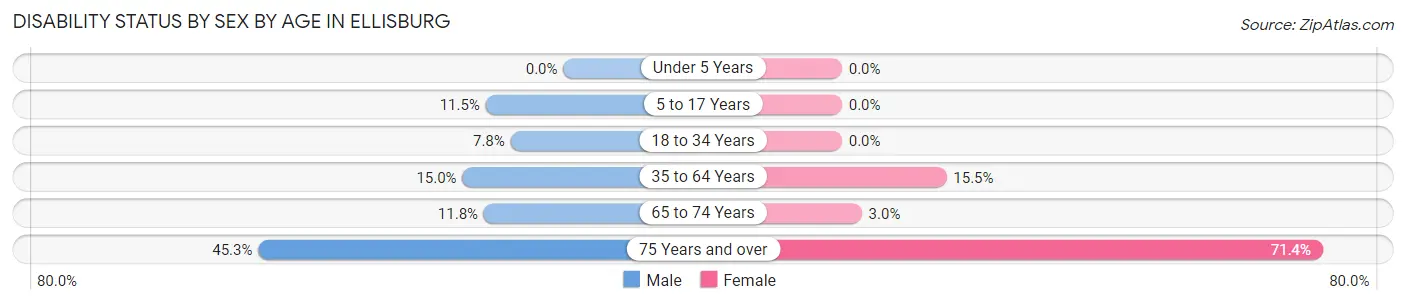
| Age Bracket | Male | Female |
| Under 5 Years | 0 (0.0%) | 0 (0.0%) |
| 5 to 17 Years | 61 (11.5%) | 0 (0.0%) |
| 18 to 34 Years | 45 (7.8%) | 0 (0.0%) |
| 35 to 64 Years | 145 (15.0%) | 155 (15.5%) |
| 65 to 74 Years | 36 (11.8%) | 7 (2.9%) |
| 75 Years and over | 53 (45.3%) | 235 (71.4%) |
Disability Class by Sex by Age in Ellisburg
Disability Class: Hearing Difficulty
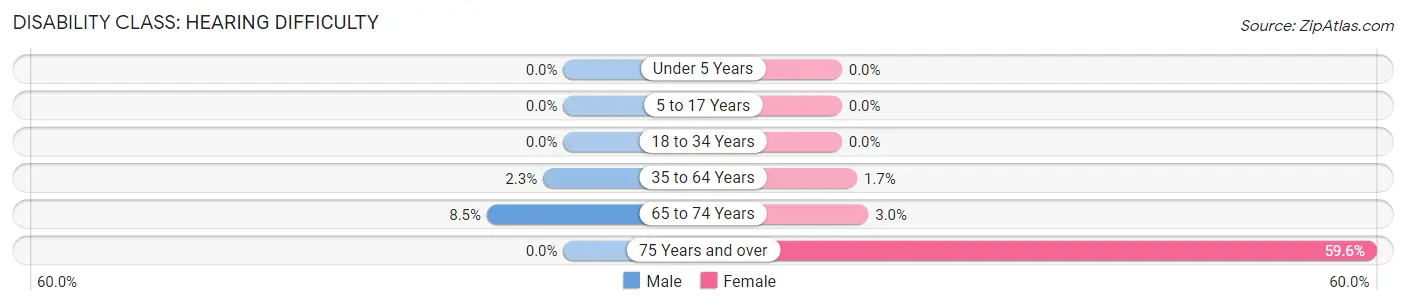
| Age Bracket | Male | Female |
| Under 5 Years | 0 (0.0%) | 0 (0.0%) |
| 5 to 17 Years | 0 (0.0%) | 0 (0.0%) |
| 18 to 34 Years | 0 (0.0%) | 0 (0.0%) |
| 35 to 64 Years | 22 (2.3%) | 17 (1.7%) |
| 65 to 74 Years | 26 (8.5%) | 7 (2.9%) |
| 75 Years and over | 0 (0.0%) | 196 (59.6%) |
Disability Class: Vision Difficulty
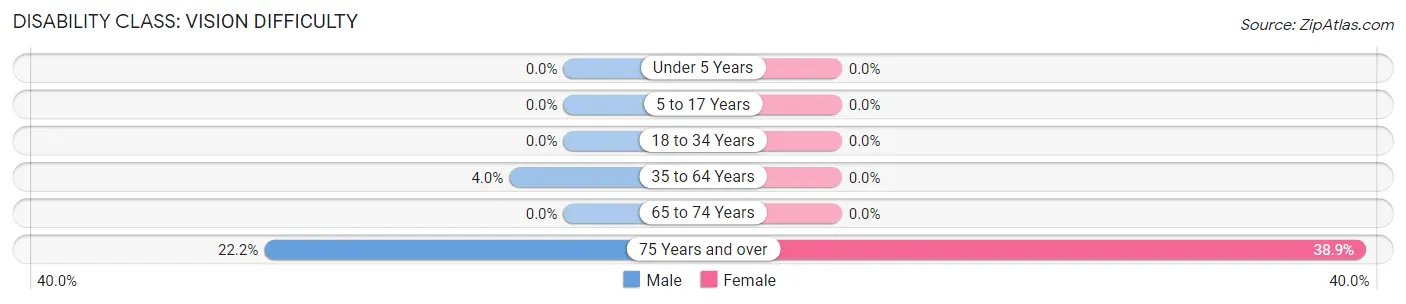
| Age Bracket | Male | Female |
| Under 5 Years | 0 (0.0%) | 0 (0.0%) |
| 5 to 17 Years | 0 (0.0%) | 0 (0.0%) |
| 18 to 34 Years | 0 (0.0%) | 0 (0.0%) |
| 35 to 64 Years | 39 (4.0%) | 0 (0.0%) |
| 65 to 74 Years | 0 (0.0%) | 0 (0.0%) |
| 75 Years and over | 26 (22.2%) | 128 (38.9%) |
Disability Class: Cognitive Difficulty
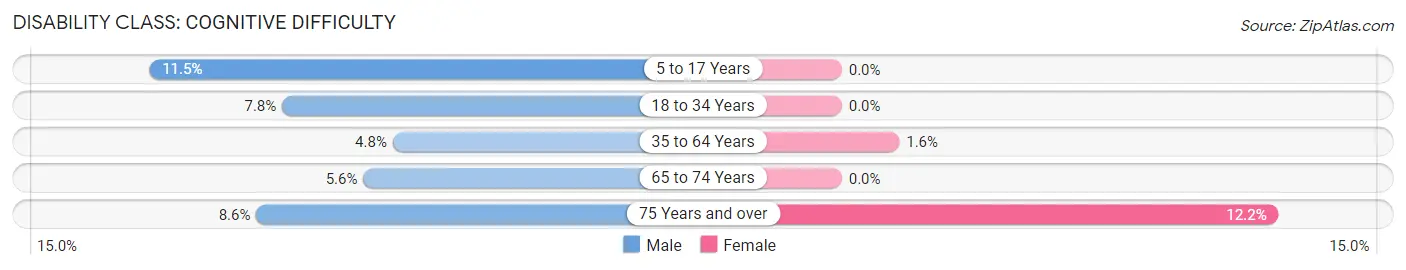
| Age Bracket | Male | Female |
| 5 to 17 Years | 61 (11.5%) | 0 (0.0%) |
| 18 to 34 Years | 45 (7.8%) | 0 (0.0%) |
| 35 to 64 Years | 46 (4.8%) | 16 (1.6%) |
| 65 to 74 Years | 17 (5.6%) | 0 (0.0%) |
| 75 Years and over | 10 (8.6%) | 40 (12.2%) |
Disability Class: Ambulatory Difficulty
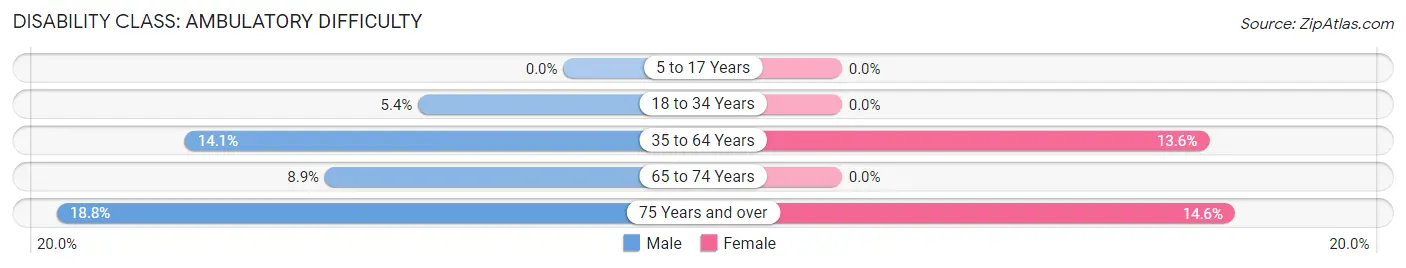
| Age Bracket | Male | Female |
| 5 to 17 Years | 0 (0.0%) | 0 (0.0%) |
| 18 to 34 Years | 31 (5.4%) | 0 (0.0%) |
| 35 to 64 Years | 136 (14.1%) | 136 (13.6%) |
| 65 to 74 Years | 27 (8.8%) | 0 (0.0%) |
| 75 Years and over | 22 (18.8%) | 48 (14.6%) |
Disability Class: Self-Care Difficulty
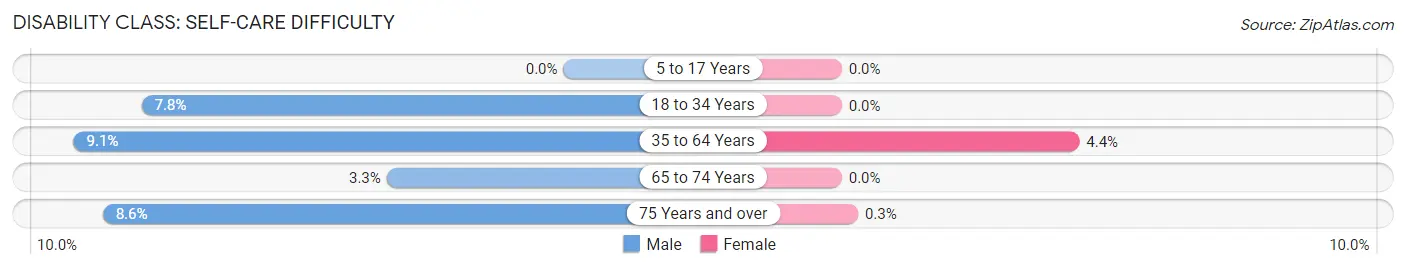
| Age Bracket | Male | Female |
| 5 to 17 Years | 0 (0.0%) | 0 (0.0%) |
| 18 to 34 Years | 45 (7.8%) | 0 (0.0%) |
| 35 to 64 Years | 88 (9.1%) | 44 (4.4%) |
| 65 to 74 Years | 10 (3.3%) | 0 (0.0%) |
| 75 Years and over | 10 (8.6%) | 1 (0.3%) |
Technology Access in Ellisburg
Computing Device Access in Ellisburg
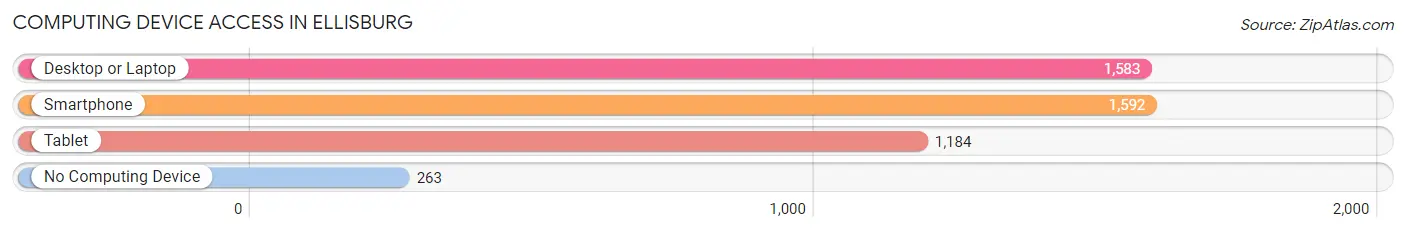
| Device Type | # Households | % Households |
| Desktop or Laptop | 1,583 | 80.6% |
| Smartphone | 1,592 | 81.0% |
| Tablet | 1,184 | 60.3% |
| No Computing Device | 263 | 13.4% |
| Total | 1,965 | 100.0% |
Internet Access in Ellisburg
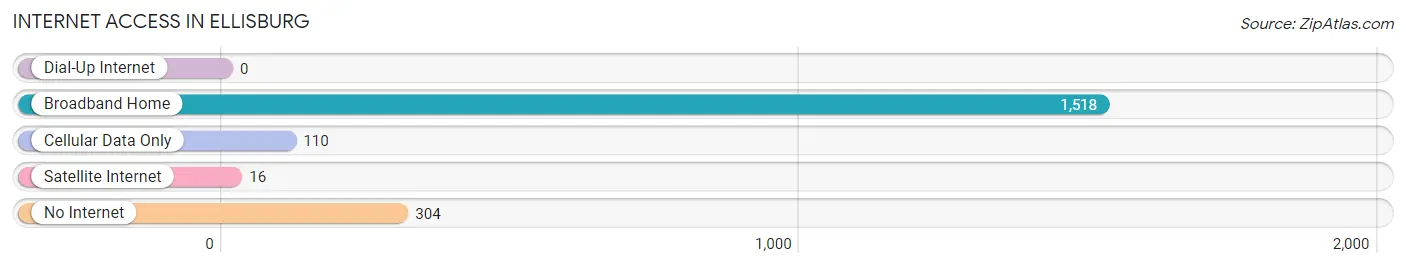
| Internet Type | # Households | % Households |
| Dial-Up Internet | 0 | 0.0% |
| Broadband Home | 1,518 | 77.2% |
| Cellular Data Only | 110 | 5.6% |
| Satellite Internet | 16 | 0.8% |
| No Internet | 304 | 15.5% |
| Total | 1,965 | 100.0% |
Ellisburg Summary
Ellisburg is a small unincorporated community located in the state of New Jersey. It is situated in the northern part of the state, in the county of Burlington. The community is located in the township of Chesterfield, and is bordered by the towns of Bordentown, Fieldsboro, and Crosswicks. The population of Ellisburg was estimated to be around 1,000 people in the year 2000.
History
The history of Ellisburg dates back to the late 1700s, when the area was first settled by European settlers. The community was originally known as “Ellis’s Town”, after the family of William Ellis, who was one of the first settlers in the area. The town was officially incorporated in 1845, and was named after the Ellis family.
In the late 1800s, Ellisburg was a thriving agricultural community, with many farms and orchards in the area. The town was also home to several small businesses, including a general store, a blacksmith shop, and a post office.
Geography
Ellisburg is located in the northern part of the state of New Jersey, in the county of Burlington. The community is situated in the township of Chesterfield, and is bordered by the towns of Bordentown, Fieldsboro, and Crosswicks.
The town is located in a rural area, and is surrounded by farmland and woodlands. The town is situated on the banks of the Rancocas Creek, which flows through the area. The town is also located near the Delaware River, which is a major waterway in the region.
Economy
The economy of Ellisburg is largely based on agriculture. The town is home to several farms and orchards, which produce a variety of fruits and vegetables. The town is also home to several small businesses, including a general store, a blacksmith shop, and a post office.
Demographics
The population of Ellisburg was estimated to be around 1,000 people in the year 2000. The town is predominantly white, with a small minority population. The median household income in the town is around $50,000, and the median home value is around $200,000. The town has a low unemployment rate, and a high rate of homeownership.
Common Questions
What is Per Capita Income in Ellisburg?
Per Capita income in Ellisburg is $42,828.
What is the Median Family Income in Ellisburg?
Median Family Income in Ellisburg is $126,823.
What is the Median Household income in Ellisburg?
Median Household Income in Ellisburg is $88,486.
What is Income or Wage Gap in Ellisburg?
Income or Wage Gap in Ellisburg is 28.8%.
Women in Ellisburg earn 71.2 cents for every dollar earned by a man.
What is Inequality or Gini Index in Ellisburg?
Inequality or Gini Index in Ellisburg is 0.47.
What is the Total Population of Ellisburg?
Total Population of Ellisburg is 5,476.
What is the Total Male Population of Ellisburg?
Total Male Population of Ellisburg is 2,940.
What is the Total Female Population of Ellisburg?
Total Female Population of Ellisburg is 2,536.
What is the Ratio of Males per 100 Females in Ellisburg?
There are 115.93 Males per 100 Females in Ellisburg.
What is the Ratio of Females per 100 Males in Ellisburg?
There are 86.26 Females per 100 Males in Ellisburg.
What is the Median Population Age in Ellisburg?
Median Population Age in Ellisburg is 37.8 Years.
What is the Average Family Size in Ellisburg
Average Family Size in Ellisburg is 3.5 People.
What is the Average Household Size in Ellisburg
Average Household Size in Ellisburg is 2.7 People.
How Large is the Labor Force in Ellisburg?
There are 2,505 People in the Labor Forcein in Ellisburg.
What is the Percentage of People in the Labor Force in Ellisburg?
59.2% of People are in the Labor Force in Ellisburg.
What is the Unemployment Rate in Ellisburg?
Unemployment Rate in Ellisburg is 10.5%.