Zip Codes with the Highest Percentage of Population Employed in Architecture & Engineering in East Orange, NJ
RELATED REPORTS & OPTIONS
Architecture & Engineering
East Orange
Compare Zip Codes
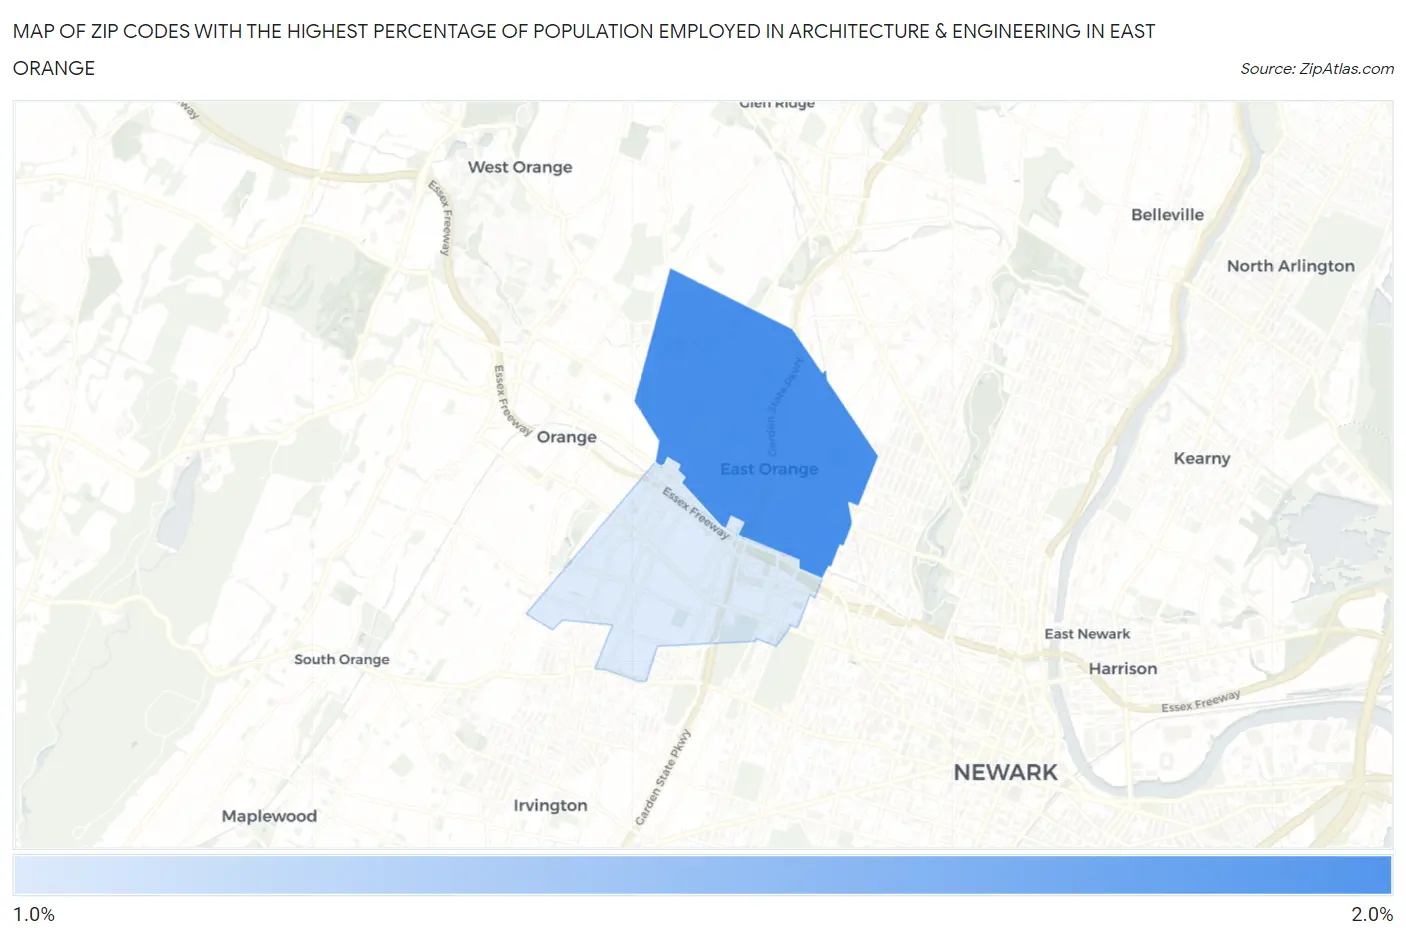
Map of Zip Codes with the Highest Percentage of Population Employed in Architecture & Engineering in East Orange
1.7%
1.7%
Zip Codes with the Highest Percentage of Population Employed in Architecture & Engineering in East Orange, NJ
| Zip Code | % Employed | vs State | vs National | |
| 1. | 07017 | 1.7% | 1.9%(-0.152)#287 | 2.1%(-0.408)#11,233 |
| 2. | 07018 | 1.7% | 1.9%(-0.242)#302 | 2.1%(-0.498)#11,816 |
1
Common Questions
What are the Top Zip Codes with the Highest Percentage of Population Employed in Architecture & Engineering in East Orange, NJ?
Top Zip Codes with the Highest Percentage of Population Employed in Architecture & Engineering in East Orange, NJ are:
What zip code has the Highest Percentage of Population Employed in Architecture & Engineering in East Orange, NJ?
07017 has the Highest Percentage of Population Employed in Architecture & Engineering in East Orange, NJ with 1.7%.
What is the Percentage of Population Employed in Architecture & Engineering in East Orange, NJ?
Percentage of Population Employed in Architecture & Engineering in East Orange is 1.7%.
What is the Percentage of Population Employed in Architecture & Engineering in New Jersey?
Percentage of Population Employed in Architecture & Engineering in New Jersey is 1.9%.
What is the Percentage of Population Employed in Architecture & Engineering in the United States?
Percentage of Population Employed in Architecture & Engineering in the United States is 2.1%.