Guttenberg, NJ Map & Demographics
Guttenberg Map
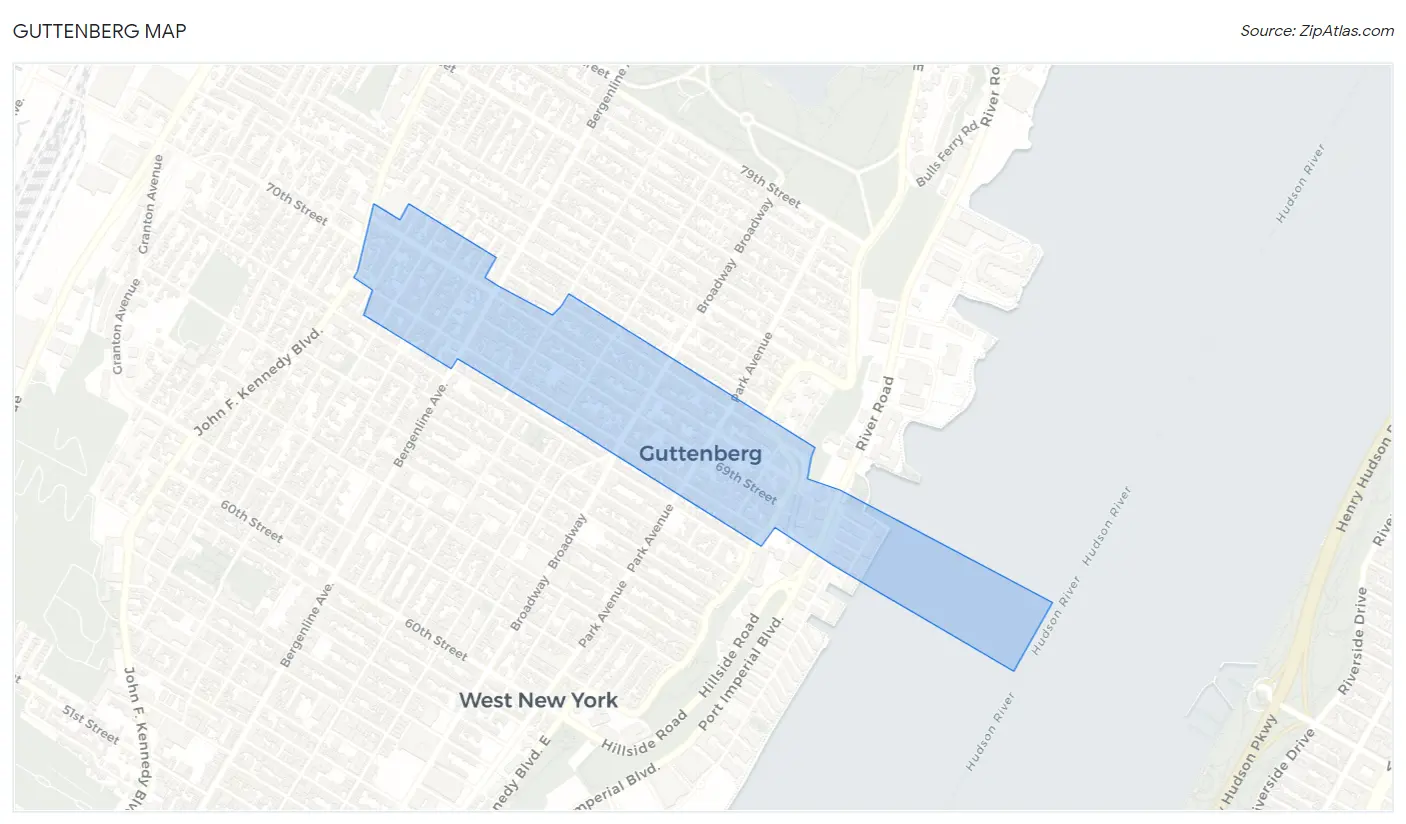
Guttenberg Overview
$43,016
PER CAPITA INCOME
$84,191
AVG FAMILY INCOME
$76,187
AVG HOUSEHOLD INCOME
2.9%
WAGE / INCOME GAP [ % ]
97.1¢/ $1
WAGE / INCOME GAP [ $ ]
$7,231
FAMILY INCOME DEFICIT
0.48
INEQUALITY / GINI INDEX
11,765
TOTAL POPULATION
5,341
MALE POPULATION
6,424
FEMALE POPULATION
83.14
MALES / 100 FEMALES
120.28
FEMALES / 100 MALES
37.5
MEDIAN AGE
3.0
AVG FAMILY SIZE
2.4
AVG HOUSEHOLD SIZE
6,768
LABOR FORCE [ PEOPLE ]
70.1%
PERCENT IN LABOR FORCE
8.2%
UNEMPLOYMENT RATE
Income in Guttenberg
Income Overview in Guttenberg
Per Capita Income in Guttenberg is $43,016, while median incomes of families and households are $84,191 and $76,187 respectively.
| Characteristic | Number | Measure |
| Per Capita Income | 11,765 | $43,016 |
| Median Family Income | 3,071 | $84,191 |
| Mean Family Income | 3,071 | $113,595 |
| Median Household Income | 4,973 | $76,187 |
| Mean Household Income | 4,973 | $103,910 |
| Income Deficit | 3,071 | $7,231 |
| Wage / Income Gap (%) | 11,765 | 2.94% |
| Wage / Income Gap ($) | 11,765 | 97.06¢ per $1 |
| Gini / Inequality Index | 11,765 | 0.48 |
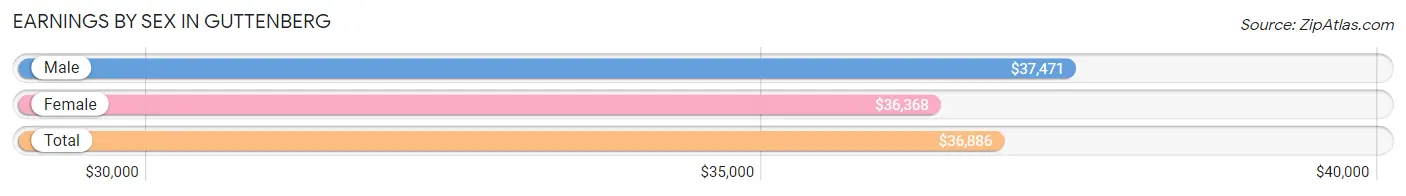
Earnings by Sex in Guttenberg
Average Earnings in Guttenberg are $36,886, $37,471 for men and $36,368 for women, a difference of 2.9%.
| Sex | Number | Average Earnings |
| Male | 3,315 (48.1%) | $37,471 |
| Female | 3,578 (51.9%) | $36,368 |
| Total | 6,893 (100.0%) | $36,886 |
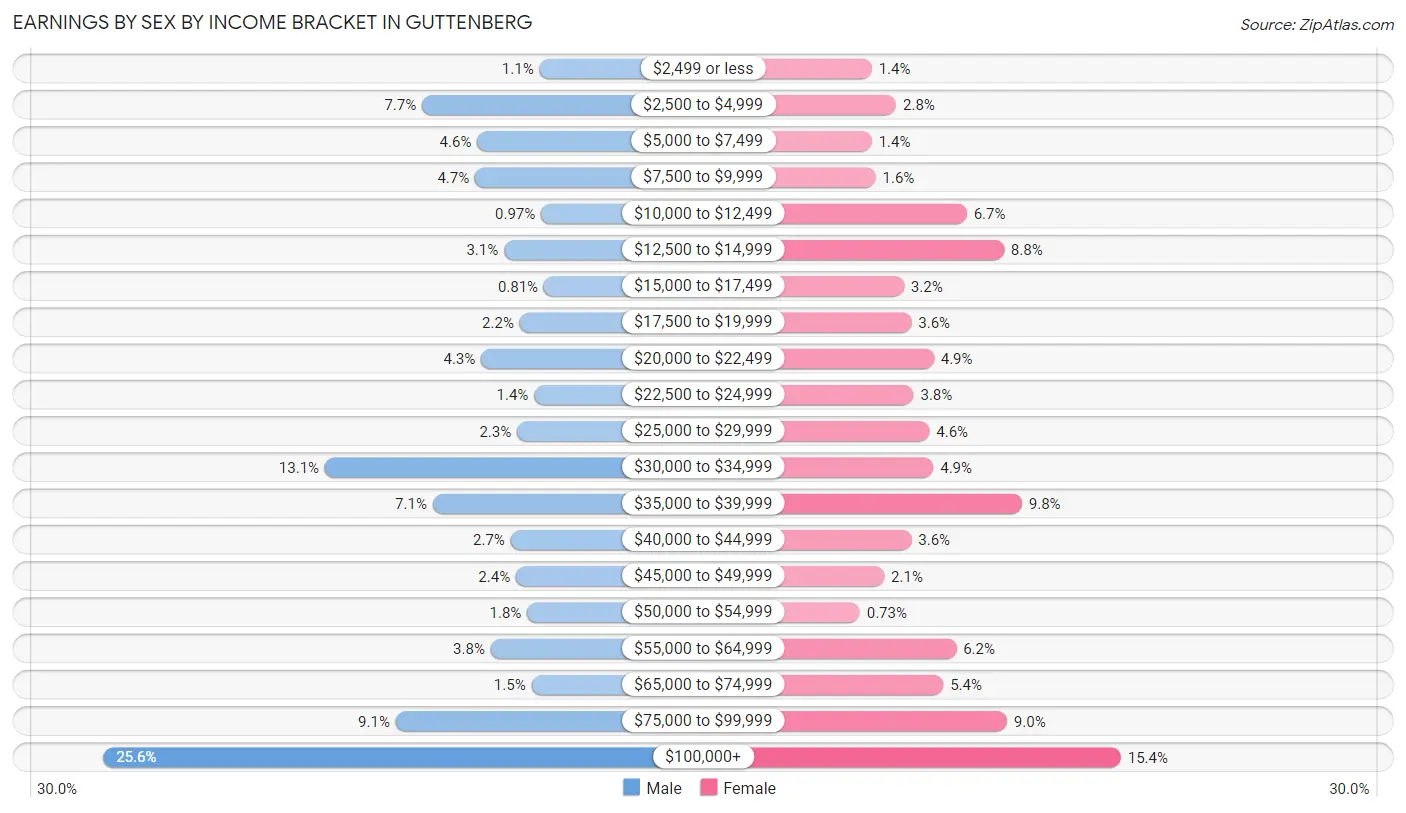
Earnings by Sex by Income Bracket in Guttenberg
The most common earnings brackets in Guttenberg are $100,000+ for men (848 | 25.6%) and $100,000+ for women (551 | 15.4%).
| Income | Male | Female |
| $2,499 or less | 35 (1.1%) | 50 (1.4%) |
| $2,500 to $4,999 | 254 (7.7%) | 99 (2.8%) |
| $5,000 to $7,499 | 151 (4.6%) | 50 (1.4%) |
| $7,500 to $9,999 | 155 (4.7%) | 58 (1.6%) |
| $10,000 to $12,499 | 32 (1.0%) | 241 (6.7%) |
| $12,500 to $14,999 | 101 (3.0%) | 316 (8.8%) |
| $15,000 to $17,499 | 27 (0.8%) | 115 (3.2%) |
| $17,500 to $19,999 | 72 (2.2%) | 130 (3.6%) |
| $20,000 to $22,499 | 144 (4.3%) | 175 (4.9%) |
| $22,500 to $24,999 | 45 (1.4%) | 134 (3.7%) |
| $25,000 to $29,999 | 77 (2.3%) | 166 (4.6%) |
| $30,000 to $34,999 | 435 (13.1%) | 174 (4.9%) |
| $35,000 to $39,999 | 234 (7.1%) | 352 (9.8%) |
| $40,000 to $44,999 | 89 (2.7%) | 130 (3.6%) |
| $45,000 to $49,999 | 79 (2.4%) | 75 (2.1%) |
| $50,000 to $54,999 | 58 (1.8%) | 26 (0.7%) |
| $55,000 to $64,999 | 126 (3.8%) | 220 (6.1%) |
| $65,000 to $74,999 | 50 (1.5%) | 194 (5.4%) |
| $75,000 to $99,999 | 303 (9.1%) | 322 (9.0%) |
| $100,000+ | 848 (25.6%) | 551 (15.4%) |
| Total | 3,315 (100.0%) | 3,578 (100.0%) |
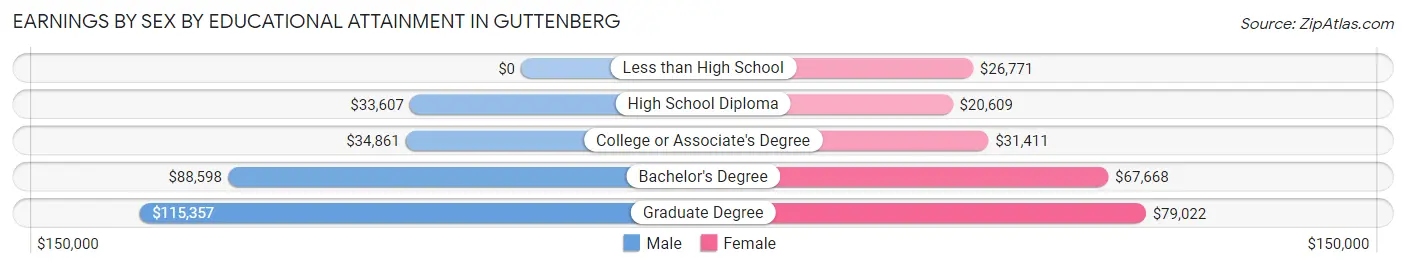
Earnings by Sex by Educational Attainment in Guttenberg
Average earnings in Guttenberg are $47,969 for men and $38,187 for women, a difference of 20.4%. Men with an educational attainment of graduate degree enjoy the highest average annual earnings of $115,357, while those with high school diploma education earn the least with $33,607. Women with an educational attainment of graduate degree earn the most with the average annual earnings of $79,022, while those with high school diploma education have the smallest earnings of $20,609.
| Educational Attainment | Male Income | Female Income |
| Less than High School | - | - |
| High School Diploma | $33,607 | $20,609 |
| College or Associate's Degree | $34,861 | $31,411 |
| Bachelor's Degree | $88,598 | $67,668 |
| Graduate Degree | $115,357 | $79,022 |
| Total | $47,969 | $38,187 |
Family Income in Guttenberg
Family Income Brackets in Guttenberg
According to the Guttenberg family income data, there are 611 families falling into the $200,000+ income range, which is the most common income bracket and makes up 19.9% of all families. Conversely, the less than $10,000 income bracket is the least frequent group with only 34 families (1.1%) belonging to this category.
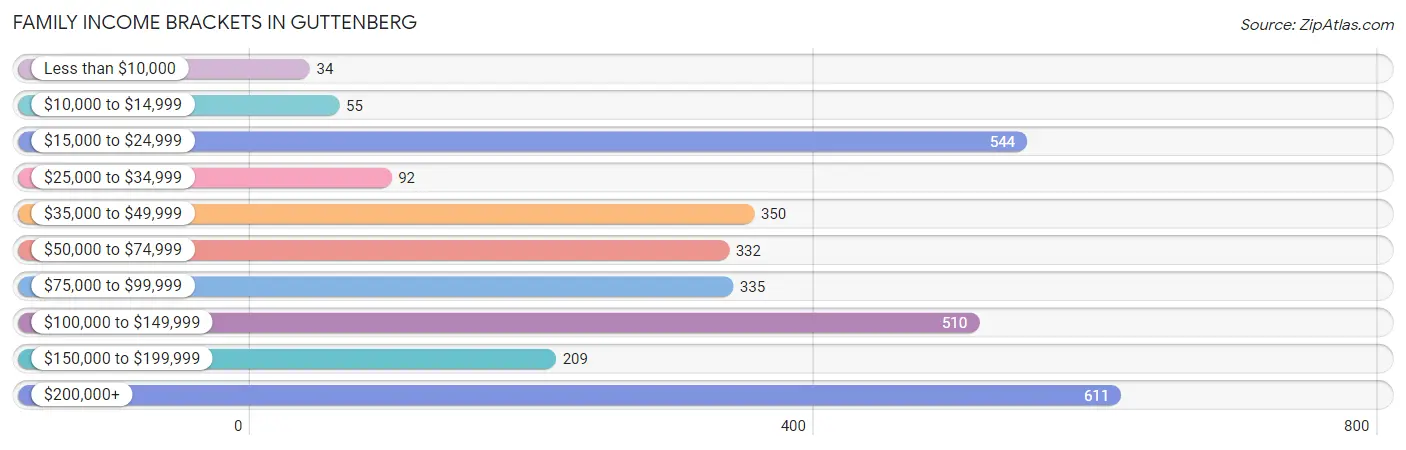
| Income Bracket | # Families | % Families |
| Less than $10,000 | 34 | 1.1% |
| $10,000 to $14,999 | 55 | 1.8% |
| $15,000 to $24,999 | 544 | 17.7% |
| $25,000 to $34,999 | 92 | 3.0% |
| $35,000 to $49,999 | 350 | 11.4% |
| $50,000 to $74,999 | 332 | 10.8% |
| $75,000 to $99,999 | 335 | 10.9% |
| $100,000 to $149,999 | 510 | 16.6% |
| $150,000 to $199,999 | 209 | 6.8% |
| $200,000+ | 611 | 19.9% |
Family Income by Famaliy Size in Guttenberg
3-person families (617 | 20.1%) account for the highest median family income in Guttenberg with $95,288 per family, while 2-person families (1,486 | 48.4%) have the highest median income of $33,805 per family member.
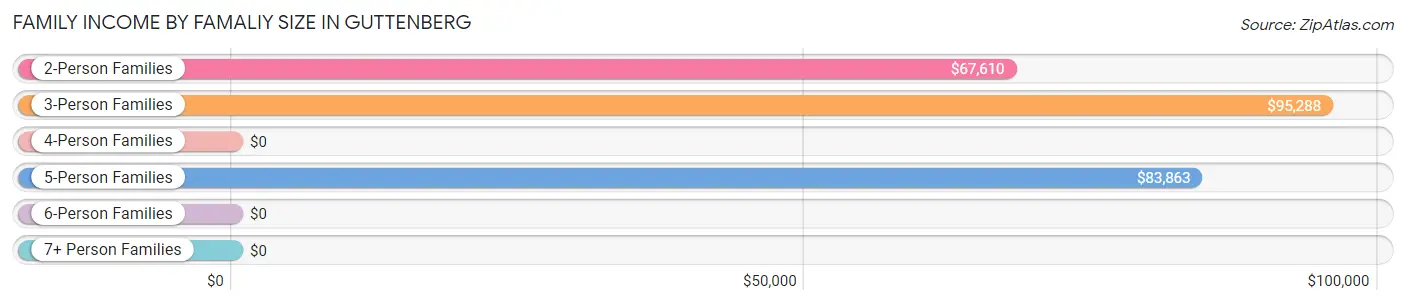
| Income Bracket | # Families | Median Income |
| 2-Person Families | 1,486 (48.4%) | $67,610 |
| 3-Person Families | 617 (20.1%) | $95,288 |
| 4-Person Families | 406 (13.2%) | $0 |
| 5-Person Families | 373 (12.1%) | $83,863 |
| 6-Person Families | 167 (5.4%) | $0 |
| 7+ Person Families | 22 (0.7%) | $0 |
| Total | 3,071 (100.0%) | $84,191 |
Family Income by Number of Earners in Guttenberg
The median family income in Guttenberg is $84,191, with families comprising 2 earners (992) having the highest median family income of $143,317, while families with 1 earner (1,266) have the lowest median family income of $41,204, accounting for 32.3% and 41.2% of families, respectively.
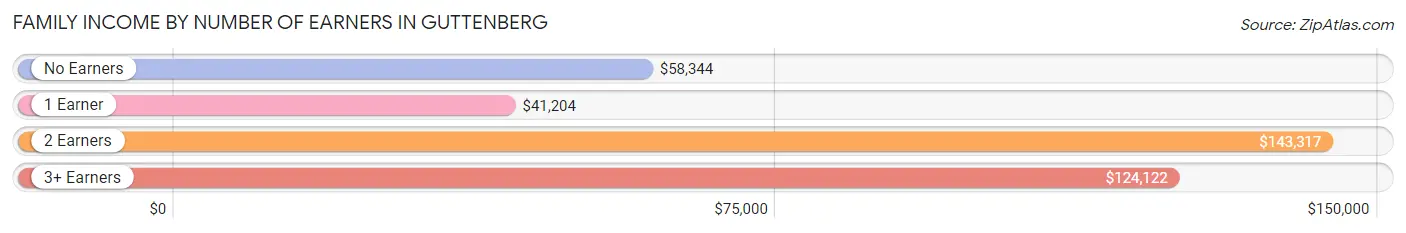
| Number of Earners | # Families | Median Income |
| No Earners | 253 (8.2%) | $58,344 |
| 1 Earner | 1,266 (41.2%) | $41,204 |
| 2 Earners | 992 (32.3%) | $143,317 |
| 3+ Earners | 560 (18.2%) | $124,122 |
| Total | 3,071 (100.0%) | $84,191 |
Household Income in Guttenberg
Household Income Brackets in Guttenberg
With 890 households falling in the category, the $100,000 to $149,999 income range is the most frequent in Guttenberg, accounting for 17.9% of all households. In contrast, only 224 households (4.5%) fall into the less than $10,000 income bracket, making it the least populous group.
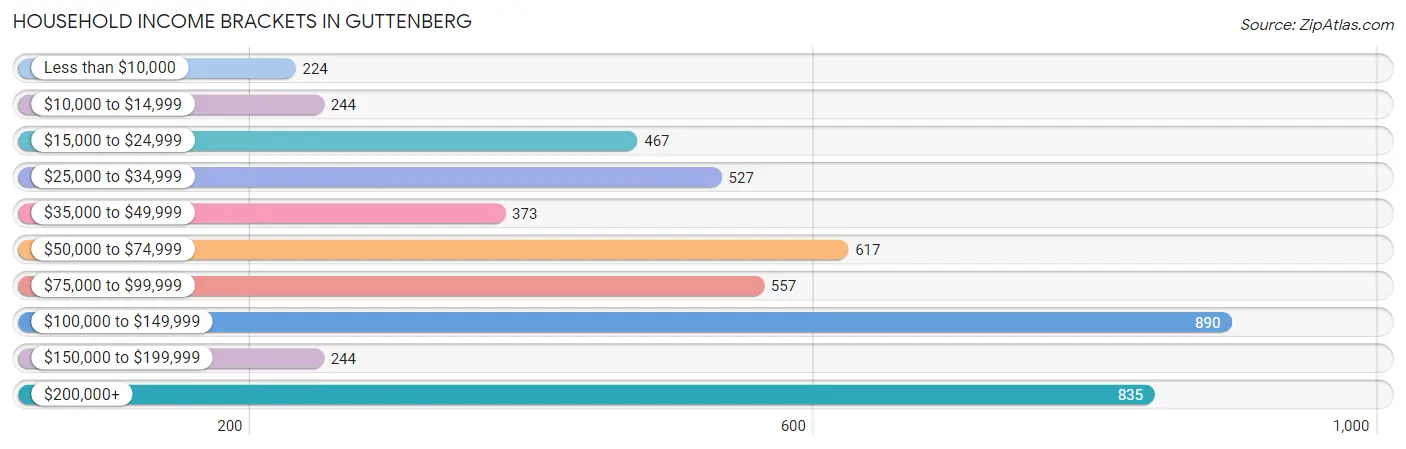
| Income Bracket | # Households | % Households |
| Less than $10,000 | 224 | 4.5% |
| $10,000 to $14,999 | 244 | 4.9% |
| $15,000 to $24,999 | 467 | 9.4% |
| $25,000 to $34,999 | 527 | 10.6% |
| $35,000 to $49,999 | 373 | 7.5% |
| $50,000 to $74,999 | 617 | 12.4% |
| $75,000 to $99,999 | 557 | 11.2% |
| $100,000 to $149,999 | 890 | 17.9% |
| $150,000 to $199,999 | 244 | 4.9% |
| $200,000+ | 835 | 16.8% |
Household Income by Householder Age in Guttenberg
The median household income in Guttenberg is $76,187, with the highest median household income of $85,907 found in the 45 to 64 years age bracket for the primary householder. A total of 1,861 households (37.4%) fall into this category. Meanwhile, the 15 to 24 years age bracket for the primary householder has the lowest median household income of $0, with 81 households (1.6%) in this group.
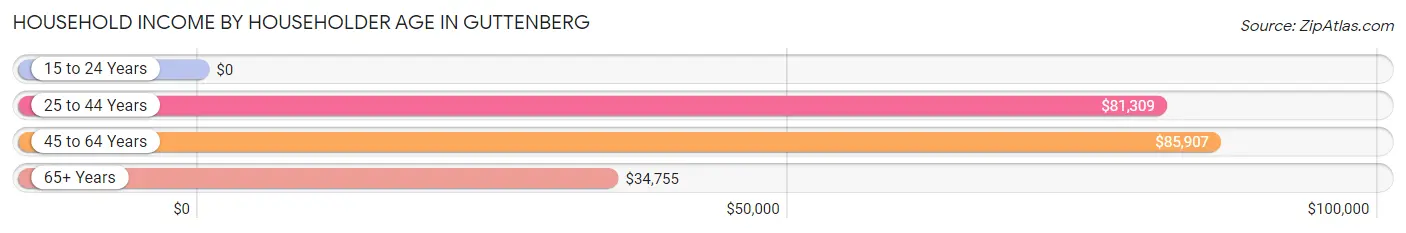
| Income Bracket | # Households | Median Income |
| 15 to 24 Years | 81 (1.6%) | $0 |
| 25 to 44 Years | 2,241 (45.1%) | $81,309 |
| 45 to 64 Years | 1,861 (37.4%) | $85,907 |
| 65+ Years | 790 (15.9%) | $34,755 |
| Total | 4,973 (100.0%) | $76,187 |
Poverty in Guttenberg
Income Below Poverty by Sex and Age in Guttenberg
With 15.5% poverty level for males and 16.4% for females among the residents of Guttenberg, 12 to 14 year old males and 75 year old and over females are the most vulnerable to poverty, with 89 males (80.9%) and 121 females (39.4%) in their respective age groups living below the poverty level.
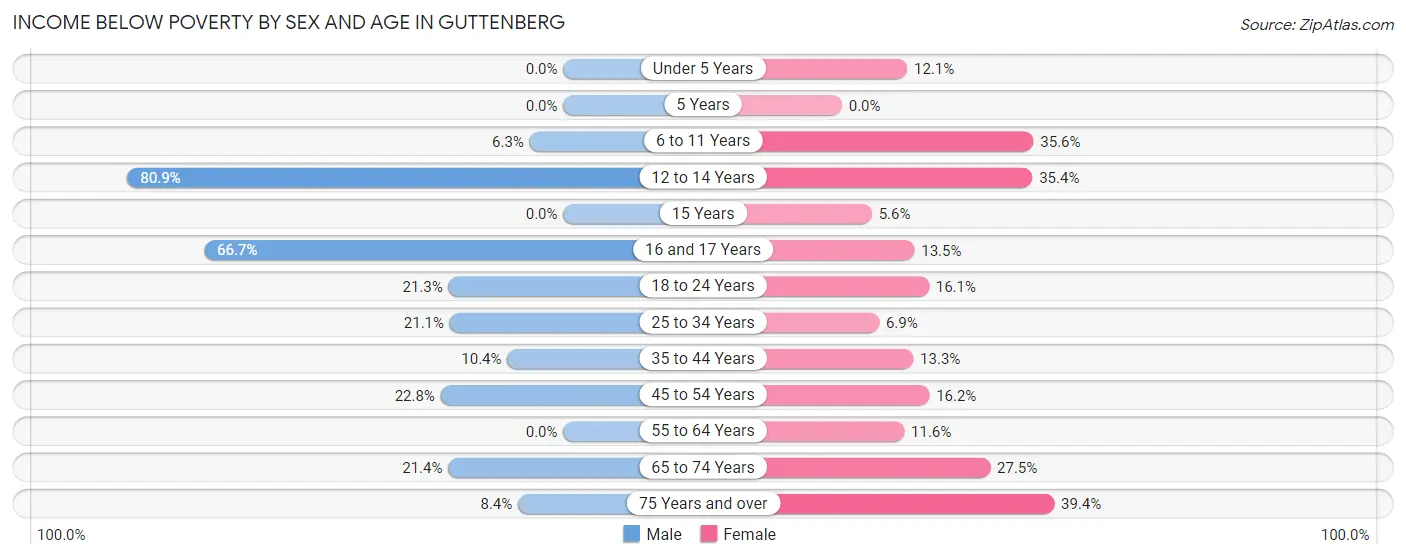
| Age Bracket | Male | Female |
| Under 5 Years | 0 (0.0%) | 58 (12.1%) |
| 5 Years | 0 (0.0%) | 0 (0.0%) |
| 6 to 11 Years | 32 (6.2%) | 48 (35.6%) |
| 12 to 14 Years | 89 (80.9%) | 117 (35.3%) |
| 15 Years | 0 (0.0%) | 5 (5.6%) |
| 16 and 17 Years | 70 (66.7%) | 21 (13.5%) |
| 18 to 24 Years | 117 (21.3%) | 51 (16.1%) |
| 25 to 34 Years | 204 (21.1%) | 74 (6.9%) |
| 35 to 44 Years | 114 (10.4%) | 135 (13.3%) |
| 45 to 54 Years | 92 (22.8%) | 122 (16.2%) |
| 55 to 64 Years | 0 (0.0%) | 116 (11.6%) |
| 65 to 74 Years | 88 (21.4%) | 182 (27.5%) |
| 75 Years and over | 20 (8.4%) | 121 (39.4%) |
| Total | 826 (15.5%) | 1,050 (16.4%) |
Income Above Poverty by Sex and Age in Guttenberg
According to the poverty statistics in Guttenberg, males aged under 5 years and females aged 5 years are the age groups that are most secure financially, with 100.0% of males and 100.0% of females in these age groups living above the poverty line.
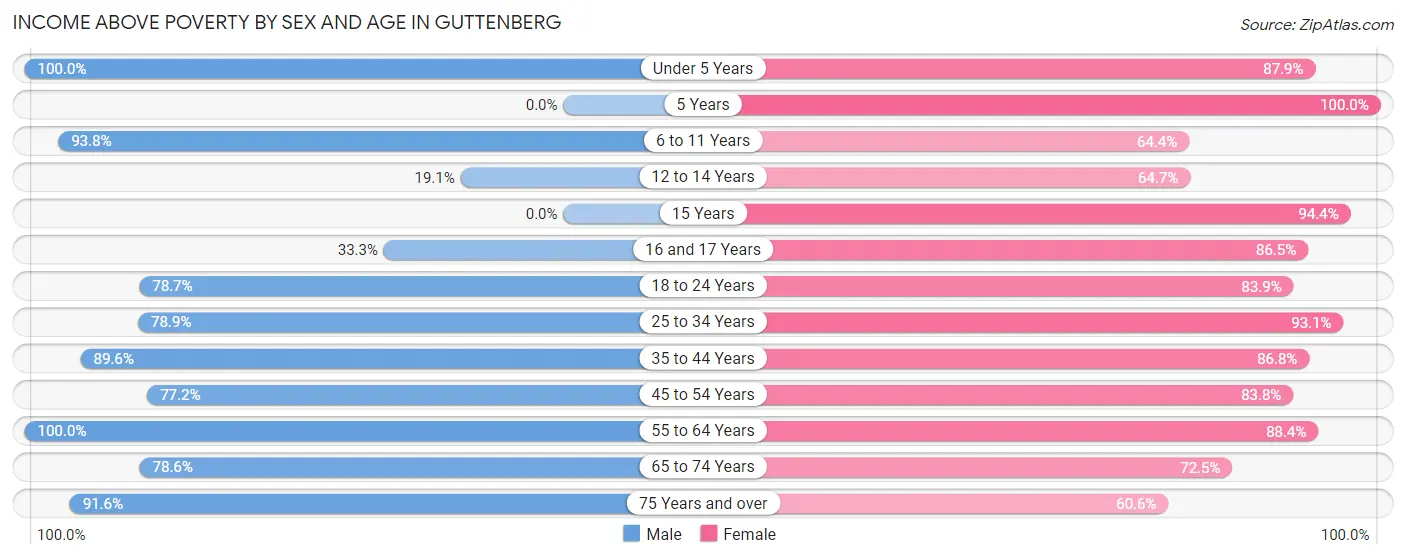
| Age Bracket | Male | Female |
| Under 5 Years | 332 (100.0%) | 421 (87.9%) |
| 5 Years | 0 (0.0%) | 86 (100.0%) |
| 6 to 11 Years | 480 (93.8%) | 87 (64.4%) |
| 12 to 14 Years | 21 (19.1%) | 214 (64.6%) |
| 15 Years | 0 (0.0%) | 85 (94.4%) |
| 16 and 17 Years | 35 (33.3%) | 135 (86.5%) |
| 18 to 24 Years | 432 (78.7%) | 265 (83.9%) |
| 25 to 34 Years | 764 (78.9%) | 998 (93.1%) |
| 35 to 44 Years | 983 (89.6%) | 884 (86.8%) |
| 45 to 54 Years | 312 (77.2%) | 630 (83.8%) |
| 55 to 64 Years | 596 (100.0%) | 887 (88.4%) |
| 65 to 74 Years | 324 (78.6%) | 479 (72.5%) |
| 75 Years and over | 218 (91.6%) | 186 (60.6%) |
| Total | 4,497 (84.5%) | 5,357 (83.6%) |
Income Below Poverty Among Married-Couple Families in Guttenberg
The poverty statistics for married-couple families in Guttenberg show that 8.8% or 151 of the total 1,717 families live below the poverty line. Families with 5 or more children have the highest poverty rate of 72.2%, comprising of 13 families. On the other hand, families with 3 or 4 children have the lowest poverty rate of 0.0%, which includes 0 families.
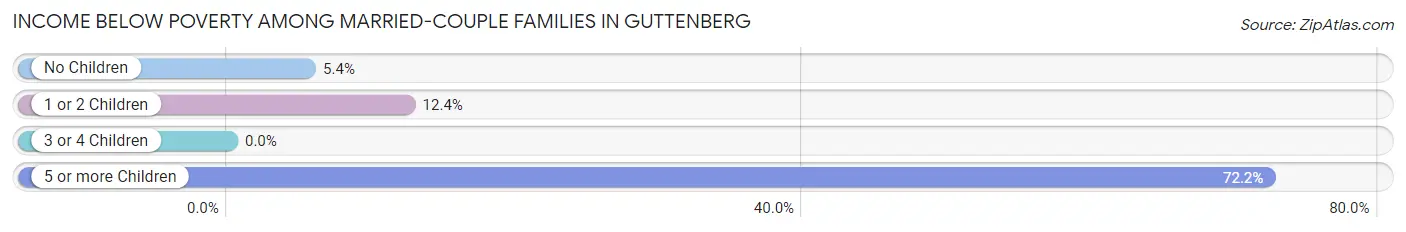
| Children | Above Poverty | Below Poverty |
| No Children | 921 (94.6%) | 53 (5.4%) |
| 1 or 2 Children | 602 (87.6%) | 85 (12.4%) |
| 3 or 4 Children | 38 (100.0%) | 0 (0.0%) |
| 5 or more Children | 5 (27.8%) | 13 (72.2%) |
| Total | 1,566 (91.2%) | 151 (8.8%) |
Income Below Poverty Among Single-Parent Households in Guttenberg
According to the poverty data in Guttenberg, 24.9% or 89 single-father households and 13.1% or 130 single-mother households are living below the poverty line. Among single-father households, those with 1 or 2 children have the highest poverty rate, with 72 households (42.3%) experiencing poverty. Likewise, among single-mother households, those with 5 or more children have the highest poverty rate, with 4 households (100.0%) falling below the poverty line.
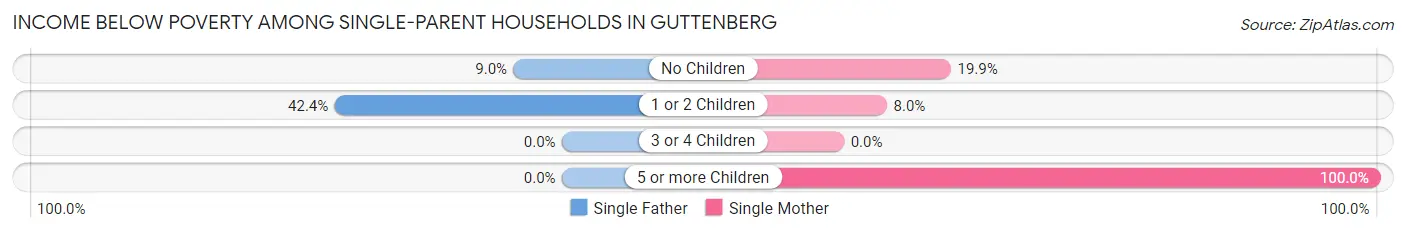
| Children | Single Father | Single Mother |
| No Children | 17 (9.0%) | 78 (19.9%) |
| 1 or 2 Children | 72 (42.3%) | 48 (8.0%) |
| 3 or 4 Children | 0 (0.0%) | 0 (0.0%) |
| 5 or more Children | 0 (0.0%) | 4 (100.0%) |
| Total | 89 (24.9%) | 130 (13.1%) |
Income Below Poverty Among Married-Couple vs Single-Parent Households in Guttenberg
The poverty data for Guttenberg shows that 151 of the married-couple family households (8.8%) and 219 of the single-parent households (16.2%) are living below the poverty level. Within the married-couple family households, those with 5 or more children have the highest poverty rate, with 13 households (72.2%) falling below the poverty line. Among the single-parent households, those with 5 or more children have the highest poverty rate, with 4 household (100.0%) living below poverty.
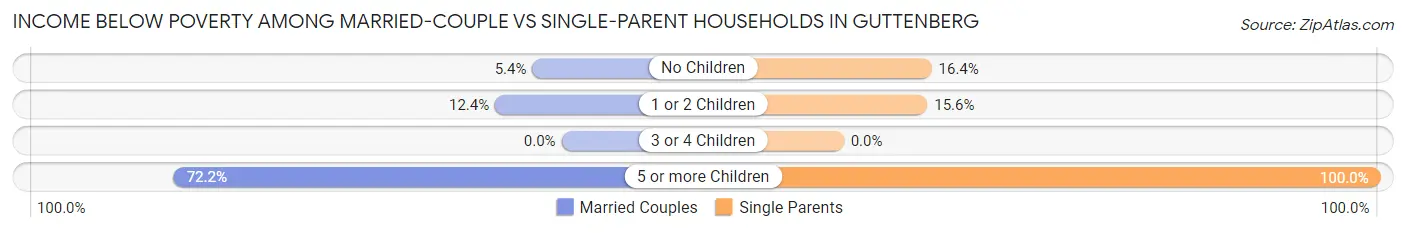
| Children | Married-Couple Families | Single-Parent Households |
| No Children | 53 (5.4%) | 95 (16.4%) |
| 1 or 2 Children | 85 (12.4%) | 120 (15.6%) |
| 3 or 4 Children | 0 (0.0%) | 0 (0.0%) |
| 5 or more Children | 13 (72.2%) | 4 (100.0%) |
| Total | 151 (8.8%) | 219 (16.2%) |
Race in Guttenberg
The most populous races in Guttenberg are Hispanic or Latino (7,917 | 67.3%), White / Caucasian (5,870 | 49.9%), and Some other Race (2,514 | 21.4%).
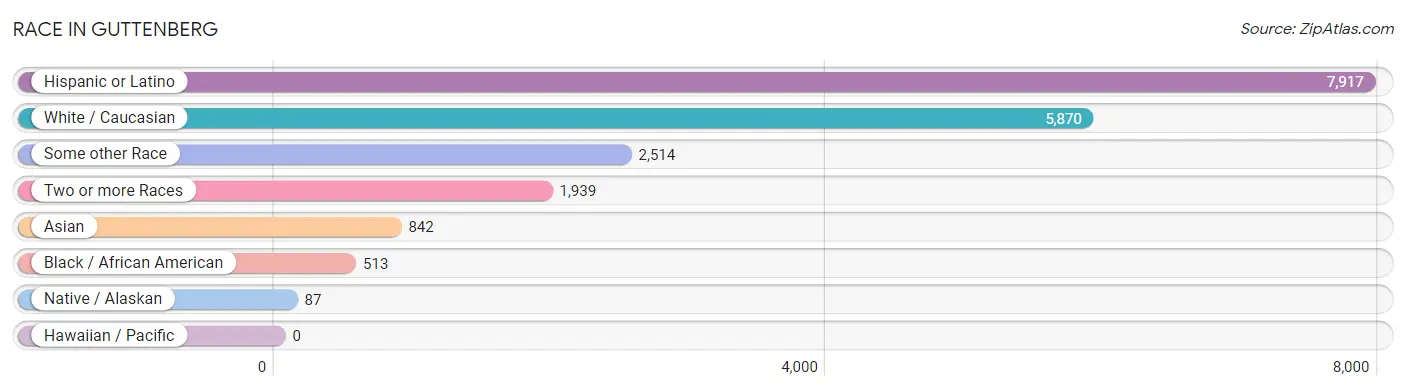
| Race | # Population | % Population |
| Asian | 842 | 7.2% |
| Black / African American | 513 | 4.4% |
| Hawaiian / Pacific | 0 | 0.0% |
| Hispanic or Latino | 7,917 | 67.3% |
| Native / Alaskan | 87 | 0.7% |
| White / Caucasian | 5,870 | 49.9% |
| Two or more Races | 1,939 | 16.5% |
| Some other Race | 2,514 | 21.4% |
| Total | 11,765 | 100.0% |
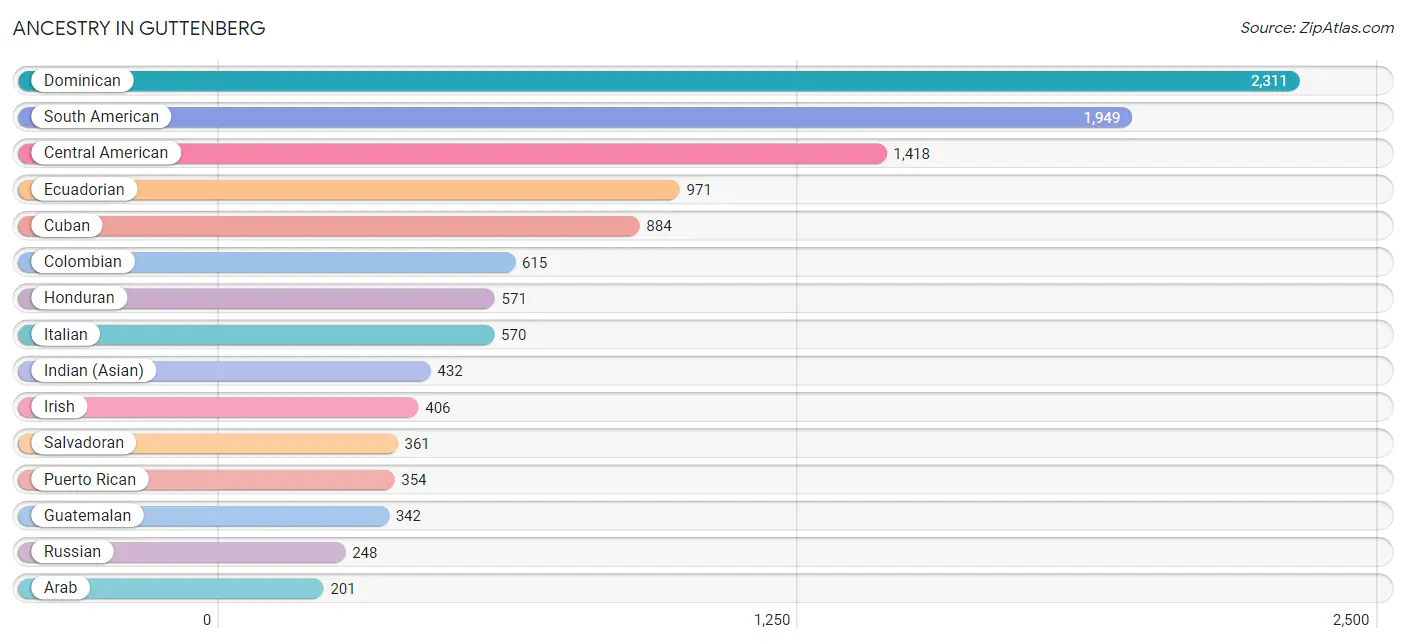
Ancestry in Guttenberg
The most populous ancestries reported in Guttenberg are Dominican (2,311 | 19.6%), South American (1,949 | 16.6%), Central American (1,418 | 12.0%), Ecuadorian (971 | 8.3%), and Cuban (884 | 7.5%), together accounting for 64.0% of all Guttenberg residents.
| Ancestry | # Population | % Population |
| African | 48 | 0.4% |
| Albanian | 27 | 0.2% |
| American | 176 | 1.5% |
| Arab | 201 | 1.7% |
| Argentinean | 61 | 0.5% |
| Austrian | 22 | 0.2% |
| Bhutanese | 103 | 0.9% |
| Blackfeet | 21 | 0.2% |
| British | 22 | 0.2% |
| Burmese | 165 | 1.4% |
| Canadian | 17 | 0.1% |
| Central American | 1,418 | 12.0% |
| Cherokee | 21 | 0.2% |
| Chilean | 27 | 0.2% |
| Colombian | 615 | 5.2% |
| Croatian | 11 | 0.1% |
| Cuban | 884 | 7.5% |
| Dominican | 2,311 | 19.6% |
| Dutch | 34 | 0.3% |
| Eastern European | 18 | 0.2% |
| Ecuadorian | 971 | 8.3% |
| Egyptian | 12 | 0.1% |
| English | 196 | 1.7% |
| European | 10 | 0.1% |
| French | 78 | 0.7% |
| French Canadian | 19 | 0.2% |
| German | 125 | 1.1% |
| Greek | 15 | 0.1% |
| Guatemalan | 342 | 2.9% |
| Honduran | 571 | 4.9% |
| Hungarian | 42 | 0.4% |
| Indian (Asian) | 432 | 3.7% |
| Indonesian | 6 | 0.1% |
| Iranian | 56 | 0.5% |
| Irish | 406 | 3.5% |
| Israeli | 70 | 0.6% |
| Italian | 570 | 4.8% |
| Jamaican | 57 | 0.5% |
| Korean | 42 | 0.4% |
| Lebanese | 45 | 0.4% |
| Mexican | 193 | 1.6% |
| Mexican American Indian | 13 | 0.1% |
| Moroccan | 34 | 0.3% |
| New Zealander | 16 | 0.1% |
| Nicaraguan | 144 | 1.2% |
| Norwegian | 16 | 0.1% |
| Peruvian | 160 | 1.4% |
| Polish | 122 | 1.0% |
| Portuguese | 5 | 0.0% |
| Puerto Rican | 354 | 3.0% |
| Romanian | 11 | 0.1% |
| Russian | 248 | 2.1% |
| Salvadoran | 361 | 3.1% |
| Scotch-Irish | 29 | 0.3% |
| Scottish | 143 | 1.2% |
| Slavic | 21 | 0.2% |
| South American | 1,949 | 16.6% |
| Spaniard | 192 | 1.6% |
| Sri Lankan | 28 | 0.2% |
| Subsaharan African | 48 | 0.4% |
| Swedish | 16 | 0.1% |
| Thai | 186 | 1.6% |
| Turkish | 82 | 0.7% |
| Ukrainian | 44 | 0.4% |
| Uruguayan | 29 | 0.3% |
| Venezuelan | 86 | 0.7% |
| Welsh | 21 | 0.2% | View All 67 Rows |
Immigrants in Guttenberg
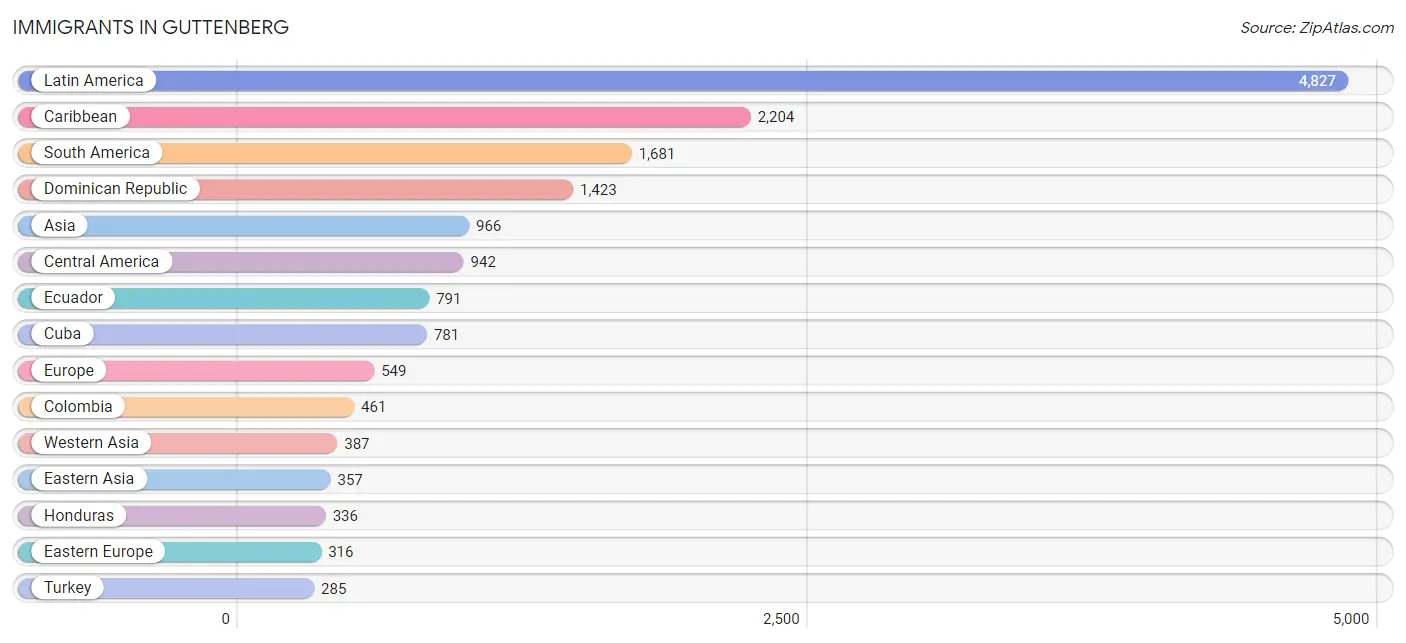
The most numerous immigrant groups reported in Guttenberg came from Latin America (4,827 | 41.0%), Caribbean (2,204 | 18.7%), South America (1,681 | 14.3%), Dominican Republic (1,423 | 12.1%), and Asia (966 | 8.2%), together accounting for 94.4% of all Guttenberg residents.
| Immigration Origin | # Population | % Population |
| Africa | 99 | 0.8% |
| Argentina | 61 | 0.5% |
| Asia | 966 | 8.2% |
| Belarus | 23 | 0.2% |
| Brazil | 25 | 0.2% |
| Caribbean | 2,204 | 18.7% |
| Central America | 942 | 8.0% |
| Chile | 154 | 1.3% |
| China | 232 | 2.0% |
| Colombia | 461 | 3.9% |
| Croatia | 11 | 0.1% |
| Cuba | 781 | 6.6% |
| Dominican Republic | 1,423 | 12.1% |
| Eastern Asia | 357 | 3.0% |
| Eastern Europe | 316 | 2.7% |
| Ecuador | 791 | 6.7% |
| Egypt | 7 | 0.1% |
| El Salvador | 206 | 1.8% |
| Europe | 549 | 4.7% |
| France | 21 | 0.2% |
| Germany | 56 | 0.5% |
| Guatemala | 252 | 2.1% |
| Honduras | 336 | 2.9% |
| Hong Kong | 36 | 0.3% |
| India | 170 | 1.4% |
| Iraq | 21 | 0.2% |
| Israel | 56 | 0.5% |
| Italy | 37 | 0.3% |
| Japan | 17 | 0.1% |
| Korea | 108 | 0.9% |
| Latin America | 4,827 | 41.0% |
| Mexico | 78 | 0.7% |
| Middle Africa | 34 | 0.3% |
| Morocco | 34 | 0.3% |
| Nicaragua | 70 | 0.6% |
| Northern Africa | 65 | 0.5% |
| Northern Europe | 63 | 0.5% |
| Oceania | 33 | 0.3% |
| Peru | 160 | 1.4% |
| Philippines | 34 | 0.3% |
| Poland | 24 | 0.2% |
| Romania | 3 | 0.0% |
| Russia | 227 | 1.9% |
| Scotland | 63 | 0.5% |
| South America | 1,681 | 14.3% |
| South Central Asia | 176 | 1.5% |
| South Eastern Asia | 46 | 0.4% |
| Southern Europe | 37 | 0.3% |
| Taiwan | 65 | 0.5% |
| Turkey | 285 | 2.4% |
| Ukraine | 14 | 0.1% |
| Uruguay | 29 | 0.3% |
| Uzbekistan | 6 | 0.1% |
| Vietnam | 6 | 0.1% |
| Western Asia | 387 | 3.3% |
| Western Europe | 77 | 0.6% |
| Yemen | 25 | 0.2% | View All 57 Rows |
Sex and Age in Guttenberg
Sex and Age in Guttenberg
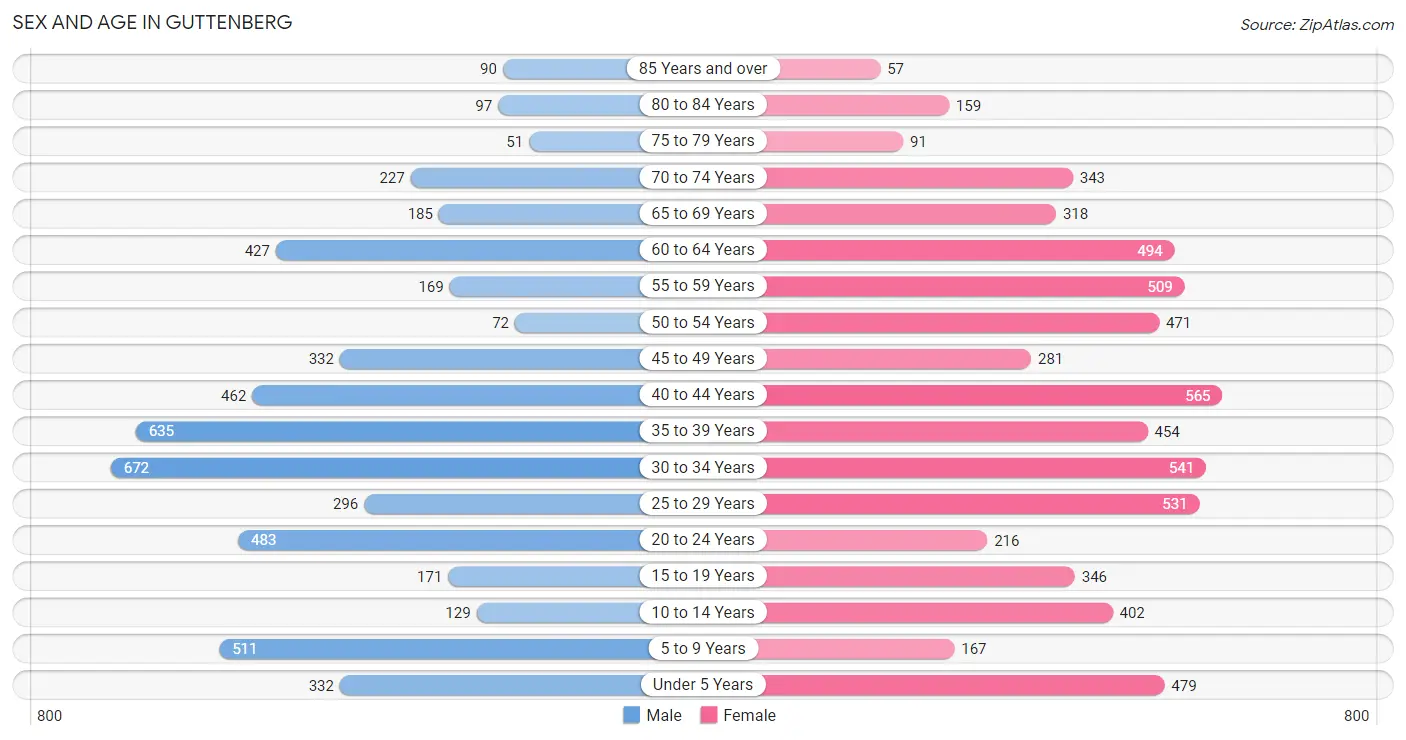
The most populous age groups in Guttenberg are 30 to 34 Years (672 | 12.6%) for men and 40 to 44 Years (565 | 8.8%) for women.
| Age Bracket | Male | Female |
| Under 5 Years | 332 (6.2%) | 479 (7.5%) |
| 5 to 9 Years | 511 (9.6%) | 167 (2.6%) |
| 10 to 14 Years | 129 (2.4%) | 402 (6.3%) |
| 15 to 19 Years | 171 (3.2%) | 346 (5.4%) |
| 20 to 24 Years | 483 (9.0%) | 216 (3.4%) |
| 25 to 29 Years | 296 (5.5%) | 531 (8.3%) |
| 30 to 34 Years | 672 (12.6%) | 541 (8.4%) |
| 35 to 39 Years | 635 (11.9%) | 454 (7.1%) |
| 40 to 44 Years | 462 (8.6%) | 565 (8.8%) |
| 45 to 49 Years | 332 (6.2%) | 281 (4.4%) |
| 50 to 54 Years | 72 (1.3%) | 471 (7.3%) |
| 55 to 59 Years | 169 (3.2%) | 509 (7.9%) |
| 60 to 64 Years | 427 (8.0%) | 494 (7.7%) |
| 65 to 69 Years | 185 (3.5%) | 318 (5.0%) |
| 70 to 74 Years | 227 (4.3%) | 343 (5.3%) |
| 75 to 79 Years | 51 (0.9%) | 91 (1.4%) |
| 80 to 84 Years | 97 (1.8%) | 159 (2.5%) |
| 85 Years and over | 90 (1.7%) | 57 (0.9%) |
| Total | 5,341 (100.0%) | 6,424 (100.0%) |
Families and Households in Guttenberg
Median Family Size in Guttenberg
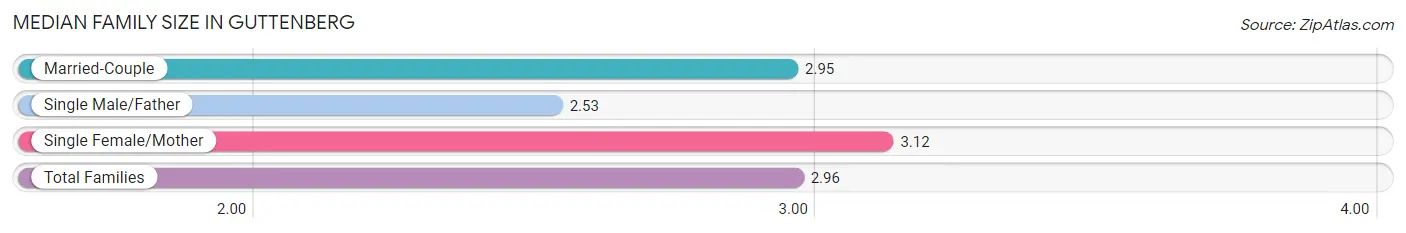
The median family size in Guttenberg is 2.96 persons per family, with single female/mother families (996 | 32.4%) accounting for the largest median family size of 3.12 persons per family. On the other hand, single male/father families (358 | 11.7%) represent the smallest median family size with 2.53 persons per family.
| Family Type | # Families | Family Size |
| Married-Couple | 1,717 (55.9%) | 2.95 |
| Single Male/Father | 358 (11.7%) | 2.53 |
| Single Female/Mother | 996 (32.4%) | 3.12 |
| Total Families | 3,071 (100.0%) | 2.96 |
Median Household Size in Guttenberg
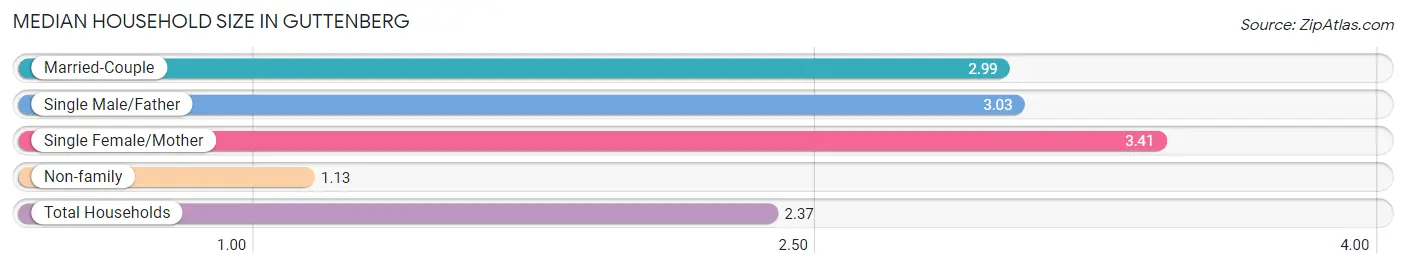
The median household size in Guttenberg is 2.37 persons per household, with single female/mother households (996 | 20.0%) accounting for the largest median household size of 3.41 persons per household. non-family households (1,902 | 38.3%) represent the smallest median household size with 1.13 persons per household.
| Household Type | # Households | Household Size |
| Married-Couple | 1,717 (34.5%) | 2.99 |
| Single Male/Father | 358 (7.2%) | 3.03 |
| Single Female/Mother | 996 (20.0%) | 3.41 |
| Non-family | 1,902 (38.3%) | 1.13 |
| Total Households | 4,973 (100.0%) | 2.37 |
Household Size by Marriage Status in Guttenberg
Out of a total of 4,973 households in Guttenberg, 3,071 (61.8%) are family households, while 1,902 (38.3%) are nonfamily households. The most numerous type of family households are 2-person households, comprising 1,196, and the most common type of nonfamily households are 1-person households, comprising 1,676.
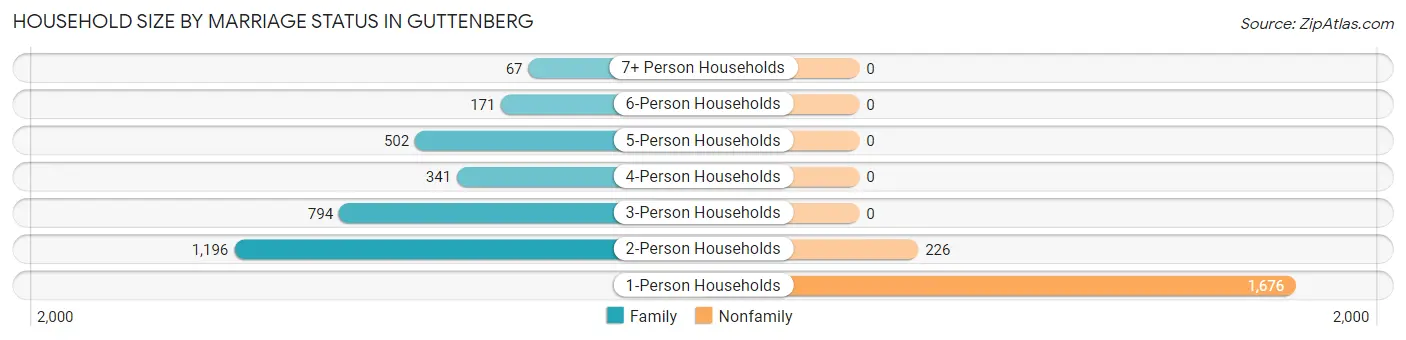
| Household Size | Family Households | Nonfamily Households |
| 1-Person Households | - | 1,676 (33.7%) |
| 2-Person Households | 1,196 (24.0%) | 226 (4.5%) |
| 3-Person Households | 794 (16.0%) | 0 (0.0%) |
| 4-Person Households | 341 (6.9%) | 0 (0.0%) |
| 5-Person Households | 502 (10.1%) | 0 (0.0%) |
| 6-Person Households | 171 (3.4%) | 0 (0.0%) |
| 7+ Person Households | 67 (1.3%) | 0 (0.0%) |
| Total | 3,071 (61.8%) | 1,902 (38.3%) |
Female Fertility in Guttenberg
Fertility by Age in Guttenberg
Average fertility rate in Guttenberg is 29.0 births per 1,000 women. Women in the age bracket of 35 to 50 years have the highest fertility rate with 49.0 births per 1,000 women. Women in the age bracket of 35 to 50 years acount for 76.5% of all women with births.
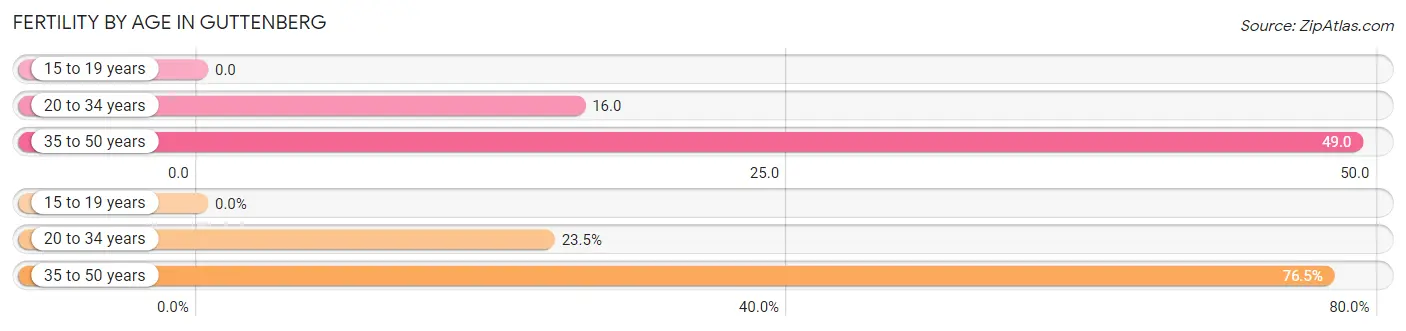
| Age Bracket | Women with Births | Births / 1,000 Women |
| 15 to 19 years | 0 (0.0%) | 0.0 |
| 20 to 34 years | 20 (23.5%) | 16.0 |
| 35 to 50 years | 65 (76.5%) | 49.0 |
| Total | 85 (100.0%) | 29.0 |
Fertility by Age by Marriage Status in Guttenberg
31.8% of women with births (85) in Guttenberg are married. The highest percentage of unmarried women with births falls into 35 to 50 years age bracket with 76.9% of them unmarried at the time of birth, while the lowest percentage of unmarried women with births belong to 20 to 34 years age bracket with 40.0% of them unmarried.
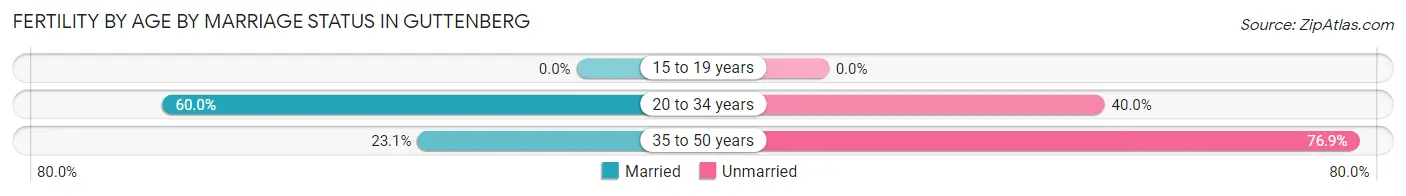
| Age Bracket | Married | Unmarried |
| 15 to 19 years | 0 (0.0%) | 0 (0.0%) |
| 20 to 34 years | 12 (60.0%) | 8 (40.0%) |
| 35 to 50 years | 15 (23.1%) | 50 (76.9%) |
| Total | 27 (31.8%) | 58 (68.2%) |
Fertility by Education in Guttenberg
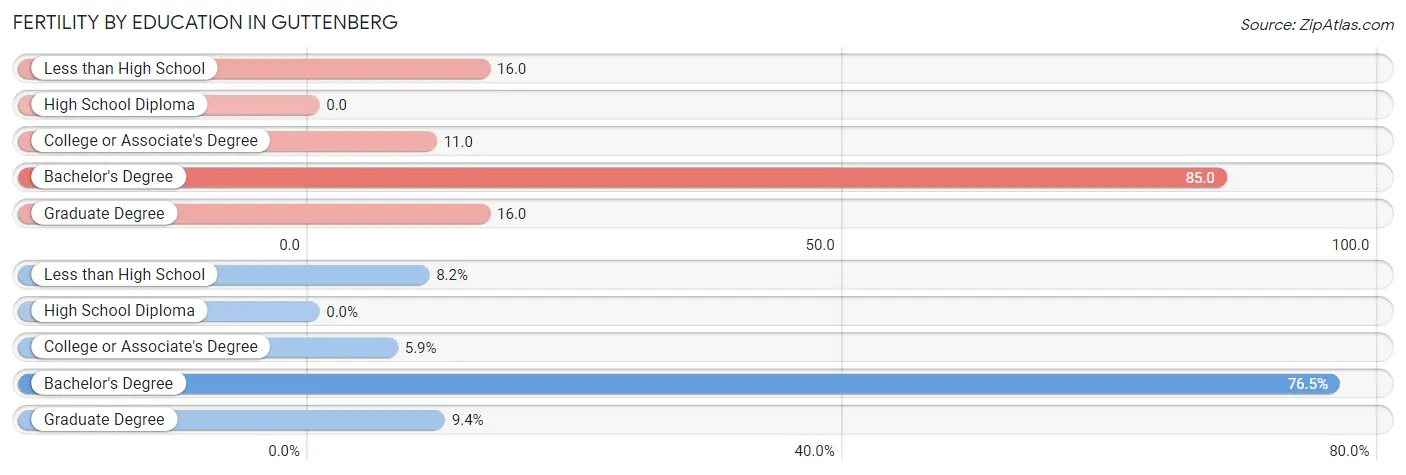
| Educational Attainment | Women with Births | Births / 1,000 Women |
| Less than High School | 7 (8.2%) | 16.0 |
| High School Diploma | 0 (0.0%) | 0.0 |
| College or Associate's Degree | 5 (5.9%) | 11.0 |
| Bachelor's Degree | 65 (76.5%) | 85.0 |
| Graduate Degree | 8 (9.4%) | 16.0 |
| Total | 85 (100.0%) | 29.0 |
Fertility by Education by Marriage Status in Guttenberg
68.2% of women with births in Guttenberg are unmarried. Women with the educational attainment of less than high school are most likely to be married with 100.0% of them married at childbirth, while women with the educational attainment of graduate degree are least likely to be married with 100.0% of them unmarried at childbirth.
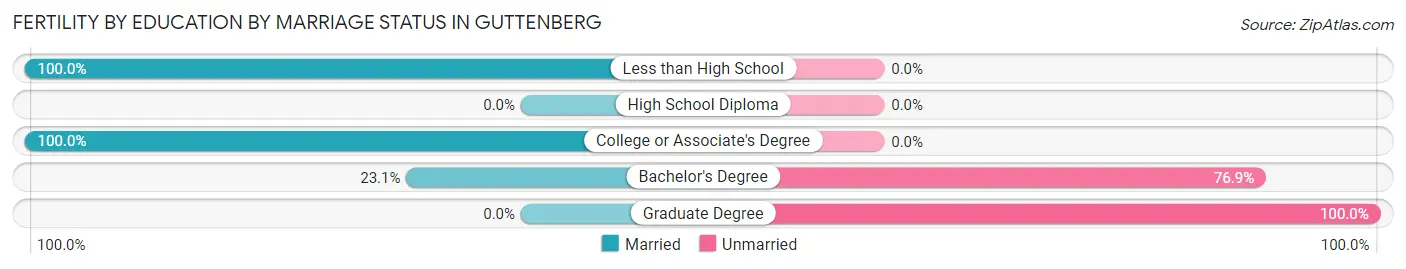
| Educational Attainment | Married | Unmarried |
| Less than High School | 7 (100.0%) | 0 (0.0%) |
| High School Diploma | 0 (0.0%) | 0 (0.0%) |
| College or Associate's Degree | 5 (100.0%) | 0 (0.0%) |
| Bachelor's Degree | 15 (23.1%) | 50 (76.9%) |
| Graduate Degree | 0 (0.0%) | 8 (100.0%) |
| Total | 27 (31.8%) | 58 (68.2%) |
Employment Characteristics in Guttenberg
Employment by Class of Employer in Guttenberg
Among the 6,151 employed individuals in Guttenberg, private company employees (4,399 | 71.5%), not-for-profit organizations (628 | 10.2%), and local government employees (373 | 6.1%) make up the most common classes of employment.
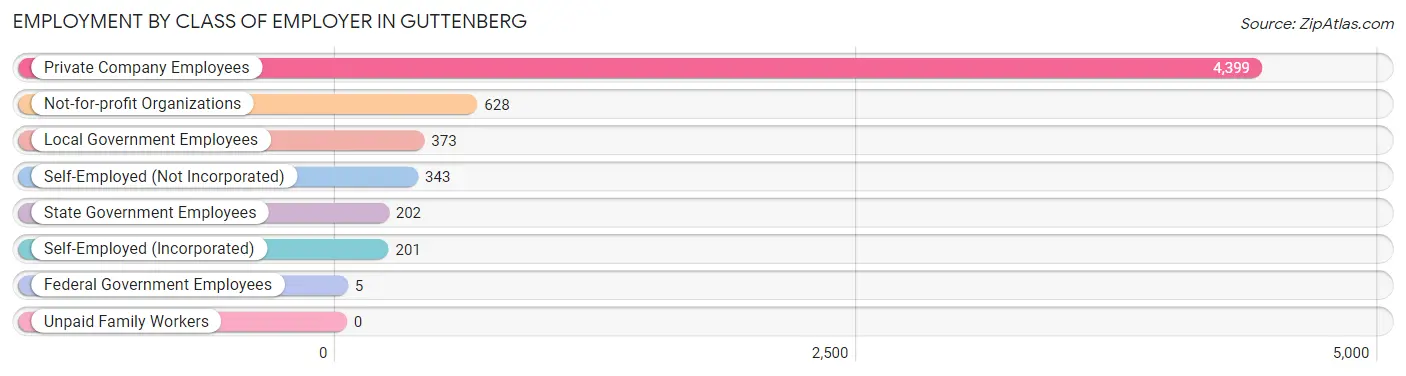
| Employer Class | # Employees | % Employees |
| Private Company Employees | 4,399 | 71.5% |
| Self-Employed (Incorporated) | 201 | 3.3% |
| Self-Employed (Not Incorporated) | 343 | 5.6% |
| Not-for-profit Organizations | 628 | 10.2% |
| Local Government Employees | 373 | 6.1% |
| State Government Employees | 202 | 3.3% |
| Federal Government Employees | 5 | 0.1% |
| Unpaid Family Workers | 0 | 0.0% |
| Total | 6,151 | 100.0% |
Employment Status by Age in Guttenberg
According to the labor force statistics for Guttenberg, out of the total population over 16 years of age (9,655), 70.1% or 6,768 individuals are in the labor force, with 8.2% or 555 of them unemployed. The age group with the highest labor force participation rate is 20 to 24 years, with 95.9% or 670 individuals in the labor force. Within the labor force, the 16 to 19 years age range has the highest percentage of unemployed individuals, with 37.2% or 35 of them being unemployed.
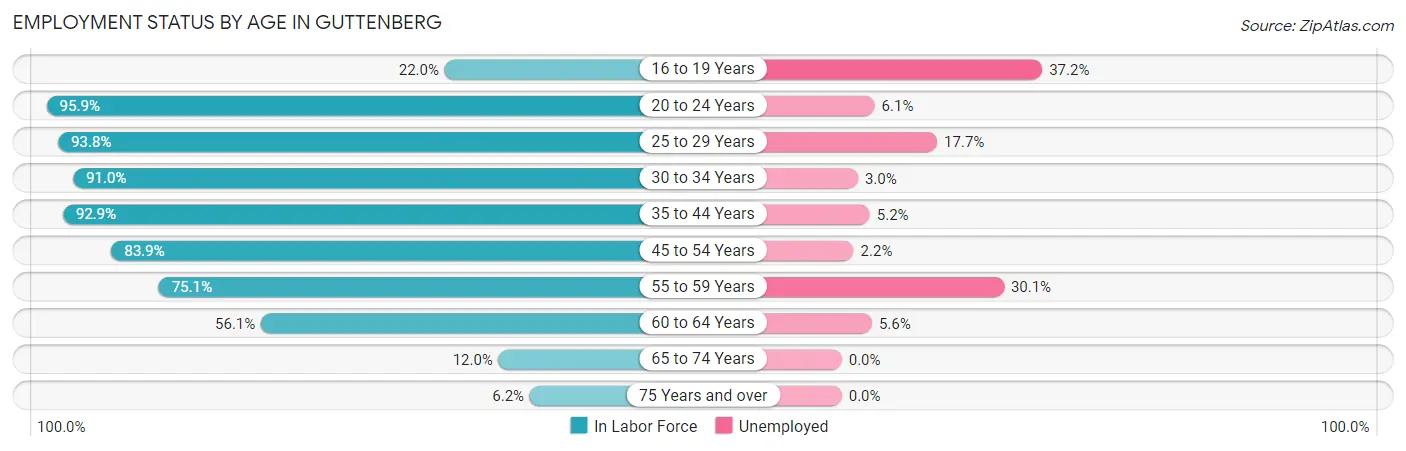
| Age Bracket | In Labor Force | Unemployed |
| 16 to 19 Years | 94 (22.0%) | 35 (37.2%) |
| 20 to 24 Years | 670 (95.9%) | 41 (6.1%) |
| 25 to 29 Years | 776 (93.8%) | 137 (17.7%) |
| 30 to 34 Years | 1,104 (91.0%) | 33 (3.0%) |
| 35 to 44 Years | 1,966 (92.9%) | 102 (5.2%) |
| 45 to 54 Years | 970 (83.9%) | 21 (2.2%) |
| 55 to 59 Years | 509 (75.1%) | 153 (30.1%) |
| 60 to 64 Years | 517 (56.1%) | 29 (5.6%) |
| 65 to 74 Years | 129 (12.0%) | 0 (0.0%) |
| 75 Years and over | 34 (6.2%) | 0 (0.0%) |
| Total | 6,768 (70.1%) | 555 (8.2%) |
Employment Status by Educational Attainment in Guttenberg
According to labor force statistics for Guttenberg, 84.5% of individuals (5,840) out of the total population between 25 and 64 years of age (6,911) are in the labor force, with 8.2% or 479 of them being unemployed. The group with the highest labor force participation rate are those with the educational attainment of bachelor's degree or higher, with 88.5% or 3,015 individuals in the labor force. Within the labor force, individuals with college / associate degree education have the highest percentage of unemployment, with 23.1% or 271 of them being unemployed.
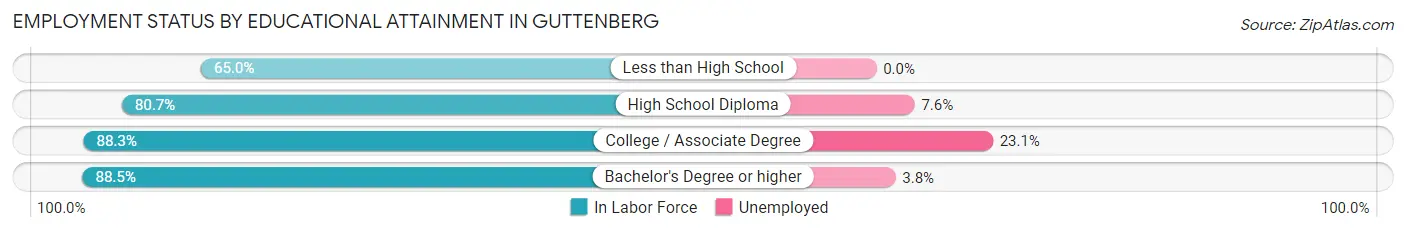
| Educational Attainment | In Labor Force | Unemployed |
| Less than High School | 427 (65.0%) | 0 (0.0%) |
| High School Diploma | 1,227 (80.7%) | 116 (7.6%) |
| College / Associate Degree | 1,171 (88.3%) | 306 (23.1%) |
| Bachelor's Degree or higher | 3,015 (88.5%) | 129 (3.8%) |
| Total | 5,840 (84.5%) | 567 (8.2%) |
Employment Occupations by Sex in Guttenberg
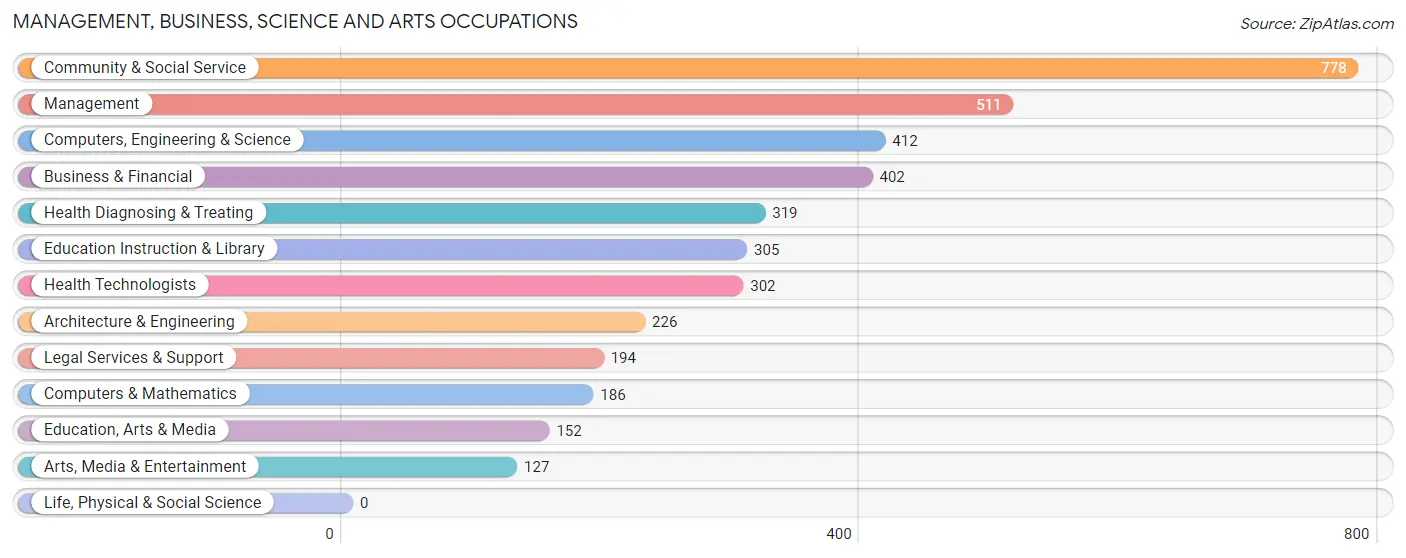
Management, Business, Science and Arts Occupations
The most common Management, Business, Science and Arts occupations in Guttenberg are Community & Social Service (778 | 12.5%), Management (511 | 8.2%), Computers, Engineering & Science (412 | 6.6%), Business & Financial (402 | 6.5%), and Health Diagnosing & Treating (319 | 5.1%).
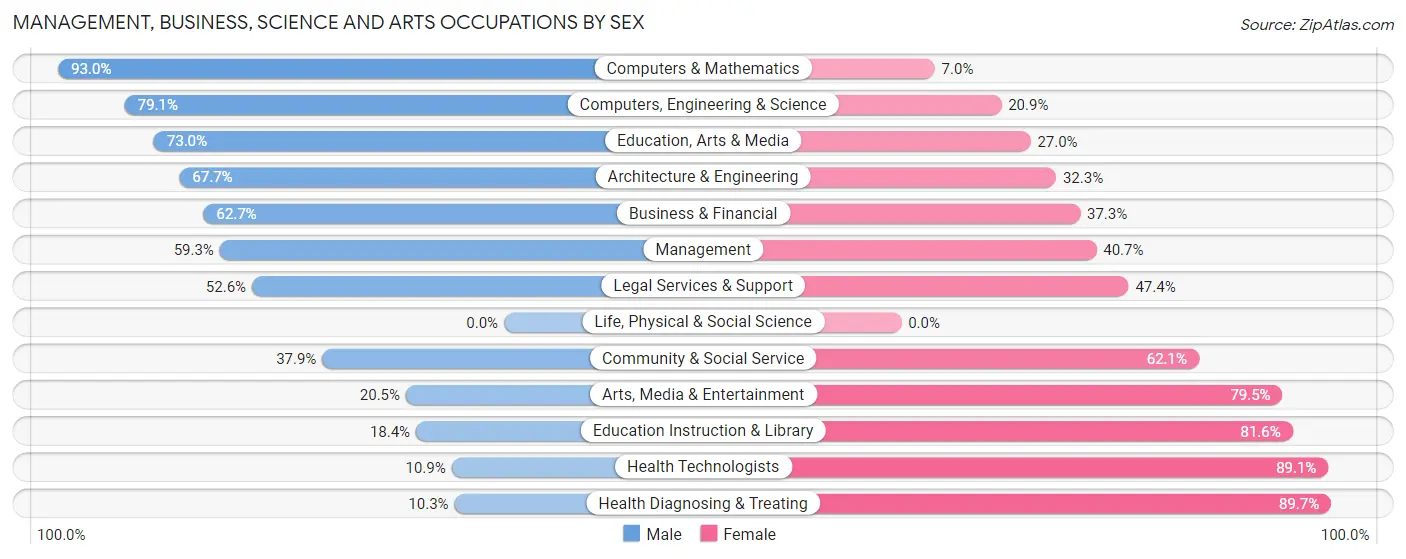
Management, Business, Science and Arts Occupations by Sex
Within the Management, Business, Science and Arts occupations in Guttenberg, the most male-oriented occupations are Computers & Mathematics (93.0%), Computers, Engineering & Science (79.1%), and Education, Arts & Media (73.0%), while the most female-oriented occupations are Health Diagnosing & Treating (89.7%), Health Technologists (89.1%), and Education Instruction & Library (81.6%).
| Occupation | Male | Female |
| Management | 303 (59.3%) | 208 (40.7%) |
| Business & Financial | 252 (62.7%) | 150 (37.3%) |
| Computers, Engineering & Science | 326 (79.1%) | 86 (20.9%) |
| Computers & Mathematics | 173 (93.0%) | 13 (7.0%) |
| Architecture & Engineering | 153 (67.7%) | 73 (32.3%) |
| Life, Physical & Social Science | 0 (0.0%) | 0 (0.0%) |
| Community & Social Service | 295 (37.9%) | 483 (62.1%) |
| Education, Arts & Media | 111 (73.0%) | 41 (27.0%) |
| Legal Services & Support | 102 (52.6%) | 92 (47.4%) |
| Education Instruction & Library | 56 (18.4%) | 249 (81.6%) |
| Arts, Media & Entertainment | 26 (20.5%) | 101 (79.5%) |
| Health Diagnosing & Treating | 33 (10.3%) | 286 (89.7%) |
| Health Technologists | 33 (10.9%) | 269 (89.1%) |
| Total (Category) | 1,209 (49.9%) | 1,213 (50.1%) |
| Total (Overall) | 2,911 (46.9%) | 3,301 (53.1%) |
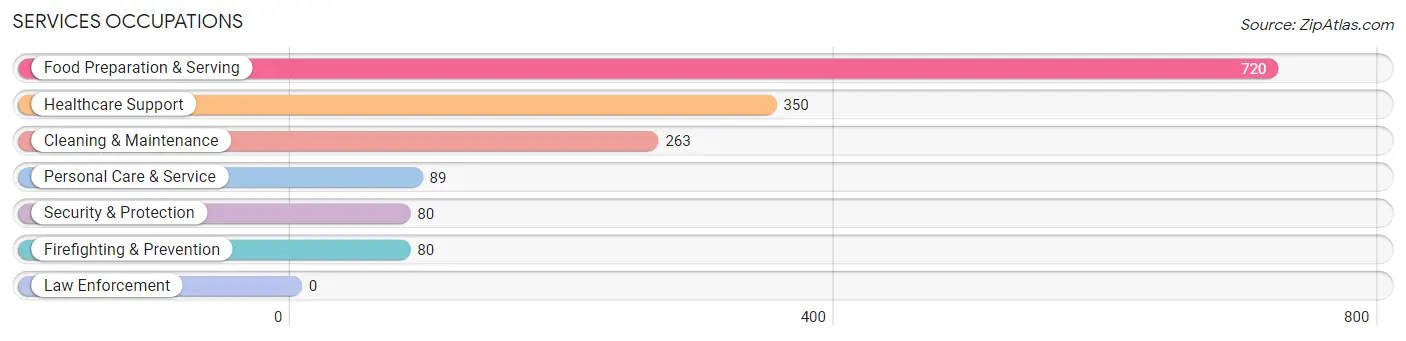
Services Occupations
The most common Services occupations in Guttenberg are Food Preparation & Serving (720 | 11.6%), Healthcare Support (350 | 5.6%), Cleaning & Maintenance (263 | 4.2%), Personal Care & Service (89 | 1.4%), and Security & Protection (80 | 1.3%).
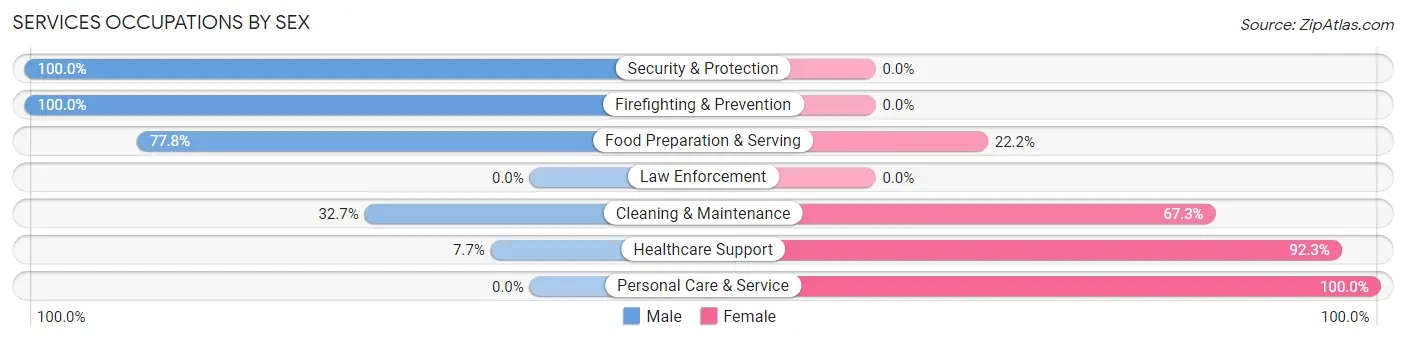
Services Occupations by Sex
Within the Services occupations in Guttenberg, the most male-oriented occupations are Security & Protection (100.0%), Firefighting & Prevention (100.0%), and Food Preparation & Serving (77.8%), while the most female-oriented occupations are Personal Care & Service (100.0%), Healthcare Support (92.3%), and Cleaning & Maintenance (67.3%).
| Occupation | Male | Female |
| Healthcare Support | 27 (7.7%) | 323 (92.3%) |
| Security & Protection | 80 (100.0%) | 0 (0.0%) |
| Firefighting & Prevention | 80 (100.0%) | 0 (0.0%) |
| Law Enforcement | 0 (0.0%) | 0 (0.0%) |
| Food Preparation & Serving | 560 (77.8%) | 160 (22.2%) |
| Cleaning & Maintenance | 86 (32.7%) | 177 (67.3%) |
| Personal Care & Service | 0 (0.0%) | 89 (100.0%) |
| Total (Category) | 753 (50.1%) | 749 (49.9%) |
| Total (Overall) | 2,911 (46.9%) | 3,301 (53.1%) |
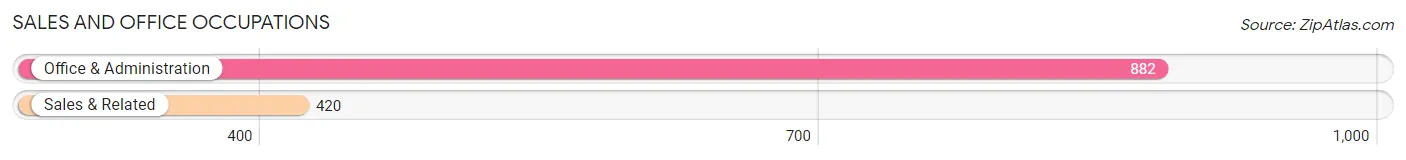
Sales and Office Occupations
The most common Sales and Office occupations in Guttenberg are Office & Administration (882 | 14.2%), and Sales & Related (420 | 6.8%).
Sales and Office Occupations by Sex
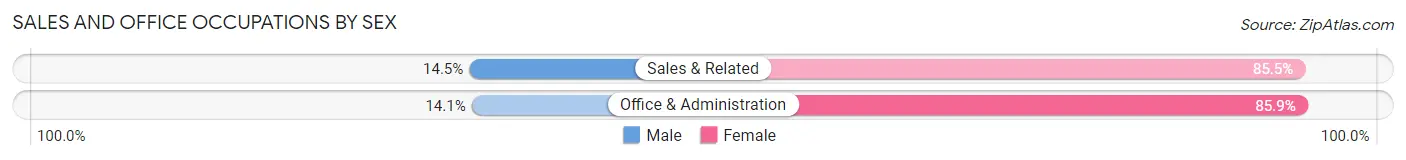
| Occupation | Male | Female |
| Sales & Related | 61 (14.5%) | 359 (85.5%) |
| Office & Administration | 124 (14.1%) | 758 (85.9%) |
| Total (Category) | 185 (14.2%) | 1,117 (85.8%) |
| Total (Overall) | 2,911 (46.9%) | 3,301 (53.1%) |
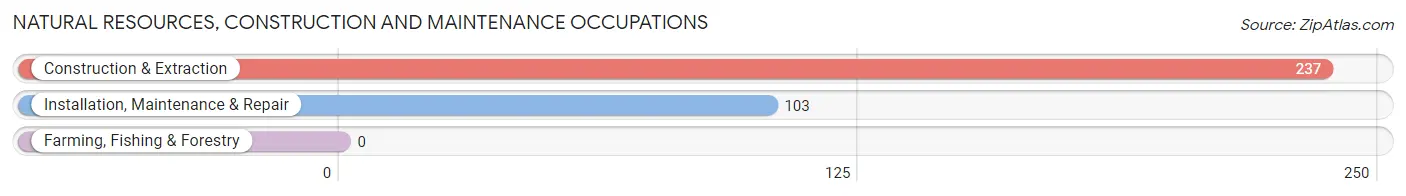
Natural Resources, Construction and Maintenance Occupations
The most common Natural Resources, Construction and Maintenance occupations in Guttenberg are Construction & Extraction (237 | 3.8%), and Installation, Maintenance & Repair (103 | 1.7%).
Natural Resources, Construction and Maintenance Occupations by Sex
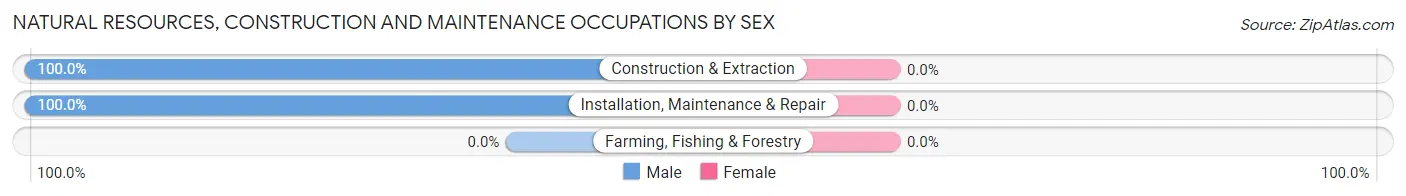
| Occupation | Male | Female |
| Farming, Fishing & Forestry | 0 (0.0%) | 0 (0.0%) |
| Construction & Extraction | 237 (100.0%) | 0 (0.0%) |
| Installation, Maintenance & Repair | 103 (100.0%) | 0 (0.0%) |
| Total (Category) | 340 (100.0%) | 0 (0.0%) |
| Total (Overall) | 2,911 (46.9%) | 3,301 (53.1%) |
Production, Transportation and Moving Occupations
The most common Production, Transportation and Moving occupations in Guttenberg are Material Moving (328 | 5.3%), Transportation (253 | 4.1%), and Production (65 | 1.1%).
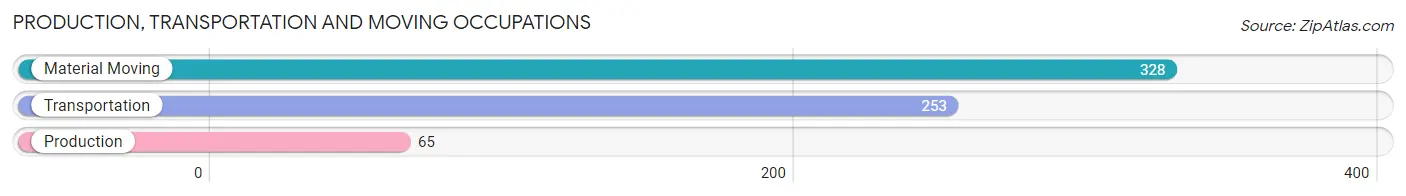
Production, Transportation and Moving Occupations by Sex
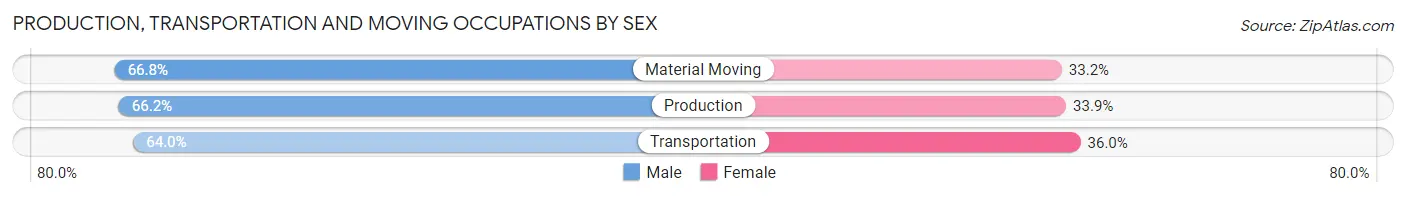
| Occupation | Male | Female |
| Production | 43 (66.1%) | 22 (33.9%) |
| Transportation | 162 (64.0%) | 91 (36.0%) |
| Material Moving | 219 (66.8%) | 109 (33.2%) |
| Total (Category) | 424 (65.6%) | 222 (34.4%) |
| Total (Overall) | 2,911 (46.9%) | 3,301 (53.1%) |
Employment Industries by Sex in Guttenberg
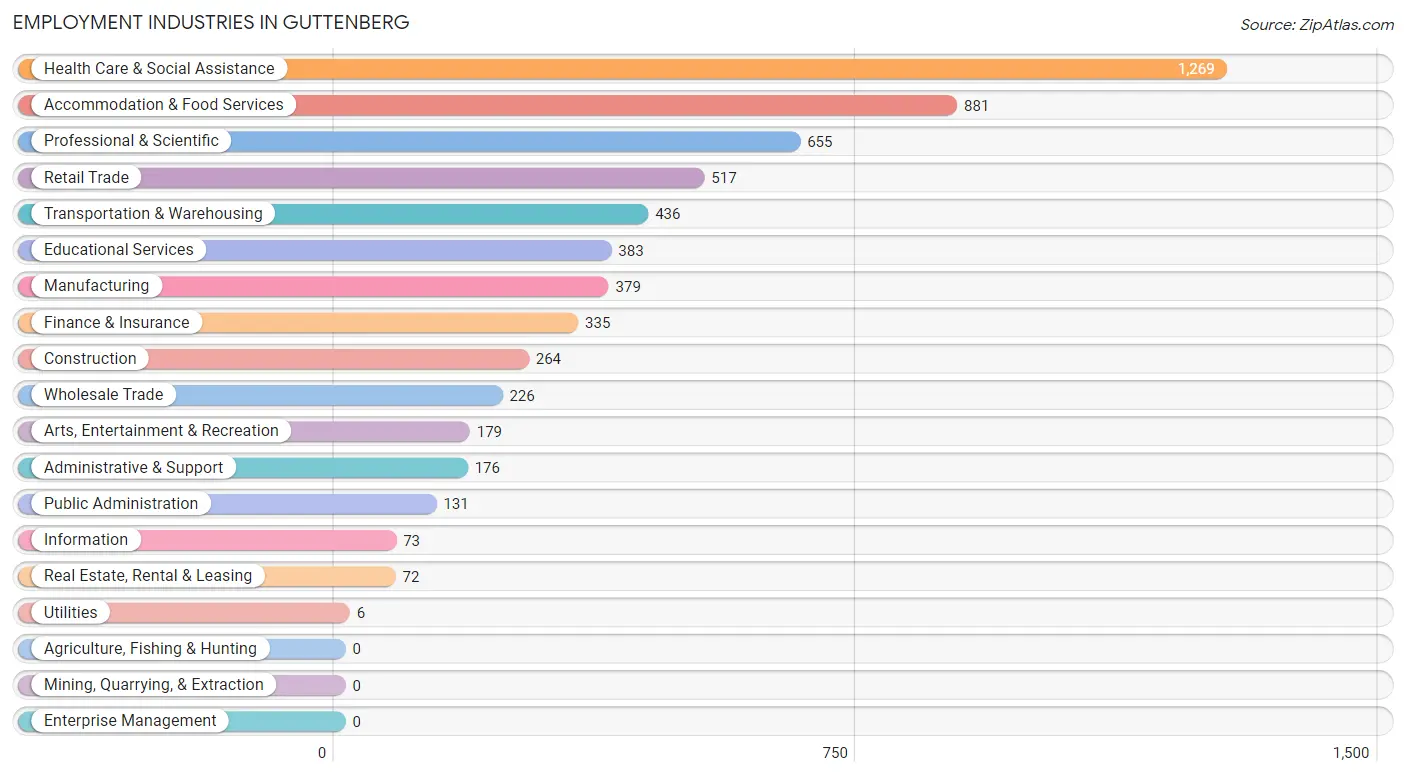
Employment Industries in Guttenberg
The major employment industries in Guttenberg include Health Care & Social Assistance (1,269 | 20.4%), Accommodation & Food Services (881 | 14.2%), Professional & Scientific (655 | 10.5%), Retail Trade (517 | 8.3%), and Transportation & Warehousing (436 | 7.0%).
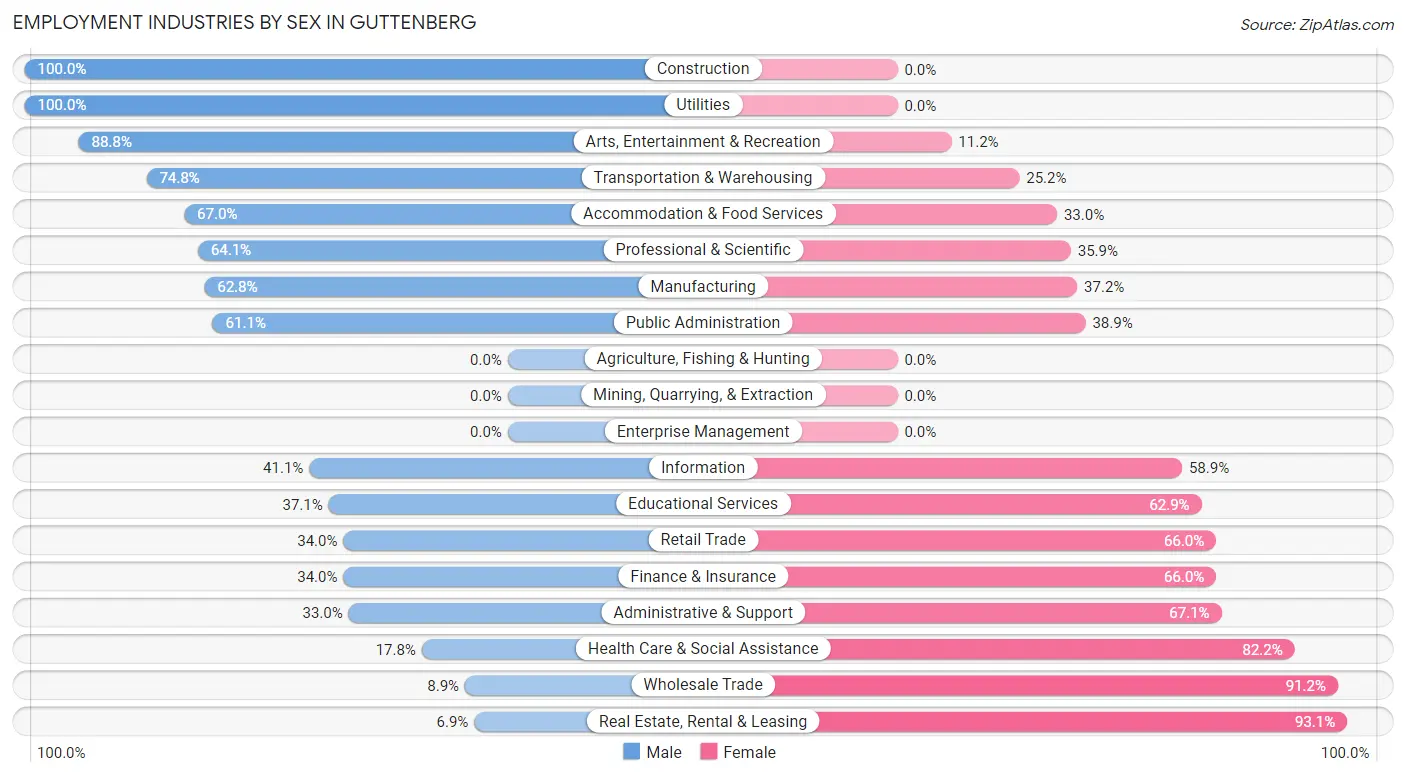
Employment Industries by Sex in Guttenberg
The Guttenberg industries that see more men than women are Construction (100.0%), Utilities (100.0%), and Arts, Entertainment & Recreation (88.8%), whereas the industries that tend to have a higher number of women are Real Estate, Rental & Leasing (93.1%), Wholesale Trade (91.1%), and Health Care & Social Assistance (82.2%).
| Industry | Male | Female |
| Agriculture, Fishing & Hunting | 0 (0.0%) | 0 (0.0%) |
| Mining, Quarrying, & Extraction | 0 (0.0%) | 0 (0.0%) |
| Construction | 264 (100.0%) | 0 (0.0%) |
| Manufacturing | 238 (62.8%) | 141 (37.2%) |
| Wholesale Trade | 20 (8.8%) | 206 (91.1%) |
| Retail Trade | 176 (34.0%) | 341 (66.0%) |
| Transportation & Warehousing | 326 (74.8%) | 110 (25.2%) |
| Utilities | 6 (100.0%) | 0 (0.0%) |
| Information | 30 (41.1%) | 43 (58.9%) |
| Finance & Insurance | 114 (34.0%) | 221 (66.0%) |
| Real Estate, Rental & Leasing | 5 (6.9%) | 67 (93.1%) |
| Professional & Scientific | 420 (64.1%) | 235 (35.9%) |
| Enterprise Management | 0 (0.0%) | 0 (0.0%) |
| Administrative & Support | 58 (33.0%) | 118 (67.0%) |
| Educational Services | 142 (37.1%) | 241 (62.9%) |
| Health Care & Social Assistance | 226 (17.8%) | 1,043 (82.2%) |
| Arts, Entertainment & Recreation | 159 (88.8%) | 20 (11.2%) |
| Accommodation & Food Services | 590 (67.0%) | 291 (33.0%) |
| Public Administration | 80 (61.1%) | 51 (38.9%) |
| Total | 2,911 (46.9%) | 3,301 (53.1%) |
Education in Guttenberg
School Enrollment in Guttenberg
The most common levels of schooling among the 2,069 students in Guttenberg are elementary school (542 | 26.2%), middle school (526 | 25.4%), and college / undergraduate (365 | 17.6%).
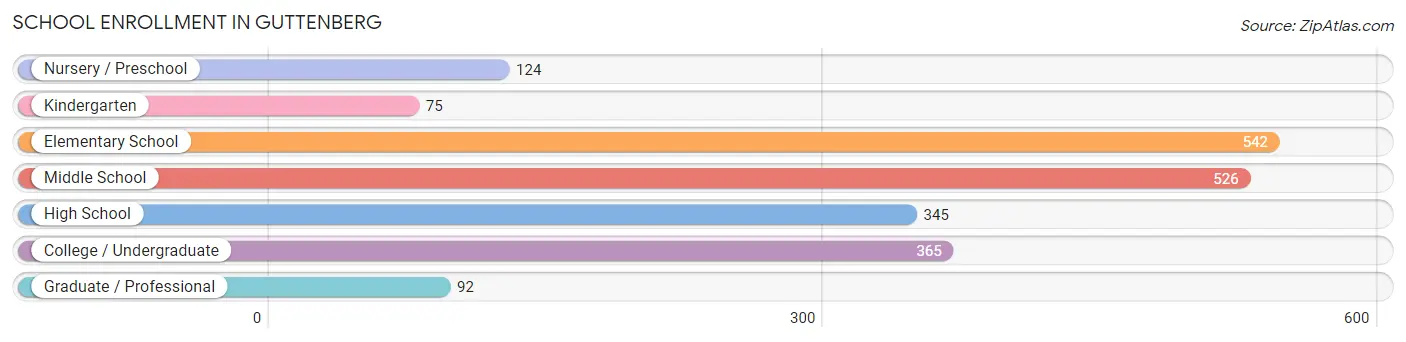
| School Level | # Students | % Students |
| Nursery / Preschool | 124 | 6.0% |
| Kindergarten | 75 | 3.6% |
| Elementary School | 542 | 26.2% |
| Middle School | 526 | 25.4% |
| High School | 345 | 16.7% |
| College / Undergraduate | 365 | 17.6% |
| Graduate / Professional | 92 | 4.4% |
| Total | 2,069 | 100.0% |
School Enrollment by Age by Funding Source in Guttenberg
Out of a total of 2,069 students who are enrolled in schools in Guttenberg, 242 (11.7%) attend a private institution, while the remaining 1,827 (88.3%) are enrolled in public schools. The age group of 35 years and over has the highest likelihood of being enrolled in private schools, with 37 (56.9% in the age bracket) enrolled. Conversely, the age group of 10 to 14 year olds has the lowest likelihood of being enrolled in a private school, with 513 (96.6% in the age bracket) attending a public institution.
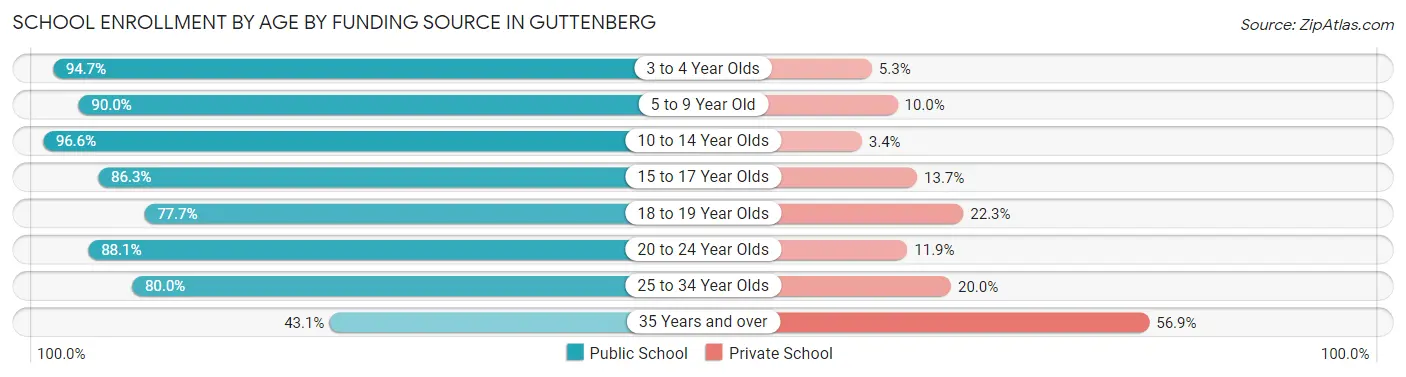
| Age Bracket | Public School | Private School |
| 3 to 4 Year Olds | 108 (94.7%) | 6 (5.3%) |
| 5 to 9 Year Old | 610 (90.0%) | 68 (10.0%) |
| 10 to 14 Year Olds | 513 (96.6%) | 18 (3.4%) |
| 15 to 17 Year Olds | 303 (86.3%) | 48 (13.7%) |
| 18 to 19 Year Olds | 129 (77.7%) | 37 (22.3%) |
| 20 to 24 Year Olds | 52 (88.1%) | 7 (11.9%) |
| 25 to 34 Year Olds | 84 (80.0%) | 21 (20.0%) |
| 35 Years and over | 28 (43.1%) | 37 (56.9%) |
| Total | 1,827 (88.3%) | 242 (11.7%) |
Educational Attainment by Field of Study in Guttenberg
Business (697 | 18.4%), engineering (517 | 13.6%), social sciences (415 | 10.9%), visual & performing arts (341 | 9.0%), and science & technology (326 | 8.6%) are the most common fields of study among 3,796 individuals in Guttenberg who have obtained a bachelor's degree or higher.
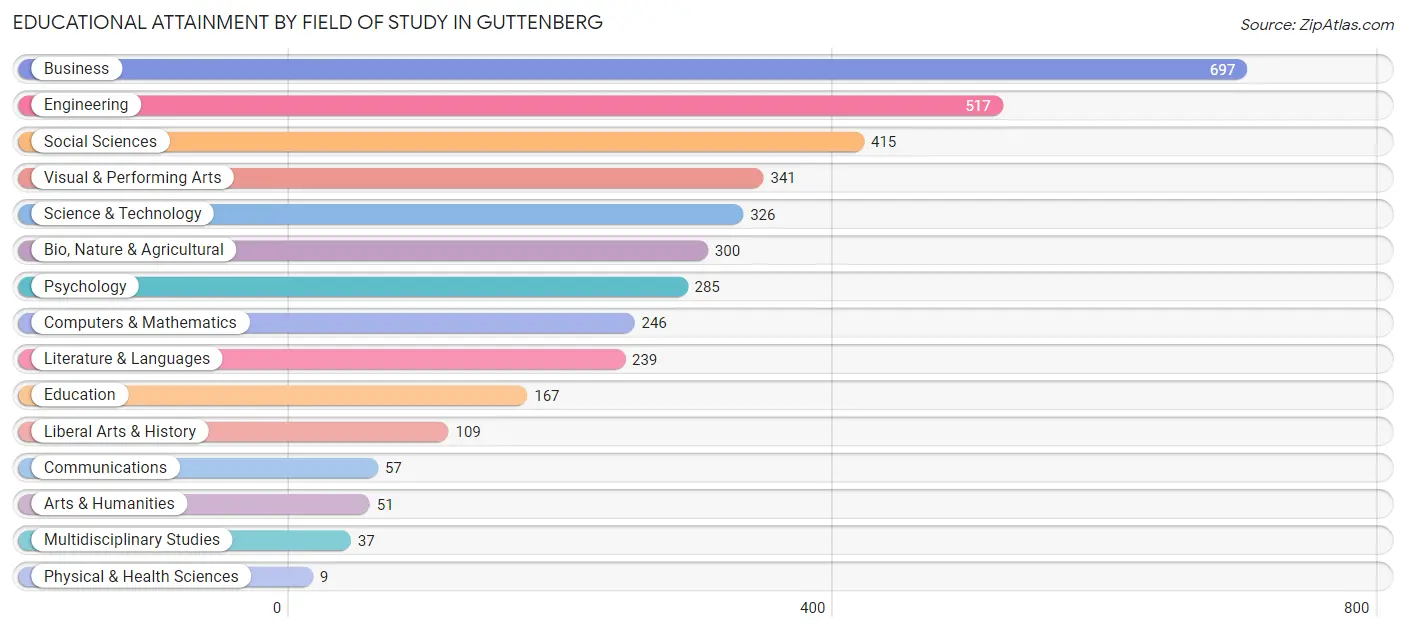
| Field of Study | # Graduates | % Graduates |
| Computers & Mathematics | 246 | 6.5% |
| Bio, Nature & Agricultural | 300 | 7.9% |
| Physical & Health Sciences | 9 | 0.2% |
| Psychology | 285 | 7.5% |
| Social Sciences | 415 | 10.9% |
| Engineering | 517 | 13.6% |
| Multidisciplinary Studies | 37 | 1.0% |
| Science & Technology | 326 | 8.6% |
| Business | 697 | 18.4% |
| Education | 167 | 4.4% |
| Literature & Languages | 239 | 6.3% |
| Liberal Arts & History | 109 | 2.9% |
| Visual & Performing Arts | 341 | 9.0% |
| Communications | 57 | 1.5% |
| Arts & Humanities | 51 | 1.3% |
| Total | 3,796 | 100.0% |
Transportation & Commute in Guttenberg
Vehicle Availability by Sex in Guttenberg
The most prevalent vehicle ownership categories in Guttenberg are males with 1 vehicle (1,186, accounting for 40.7%) and females with 1 vehicle (1,265, making up 36.6%).
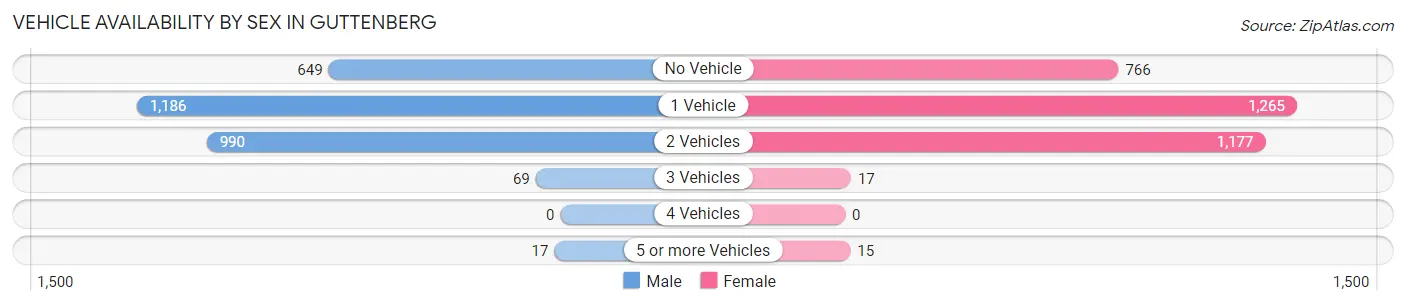
| Vehicles Available | Male | Female |
| No Vehicle | 649 (22.3%) | 766 (23.6%) |
| 1 Vehicle | 1,186 (40.7%) | 1,265 (39.0%) |
| 2 Vehicles | 990 (34.0%) | 1,177 (36.3%) |
| 3 Vehicles | 69 (2.4%) | 17 (0.5%) |
| 4 Vehicles | 0 (0.0%) | 0 (0.0%) |
| 5 or more Vehicles | 17 (0.6%) | 15 (0.5%) |
| Total | 2,911 (100.0%) | 3,240 (100.0%) |
Commute Time in Guttenberg
The most frequently occuring commute durations in Guttenberg are 30 to 34 minutes (1,113 commuters, 20.4%), 45 to 59 minutes (882 commuters, 16.2%), and 60 to 89 minutes (858 commuters, 15.7%).
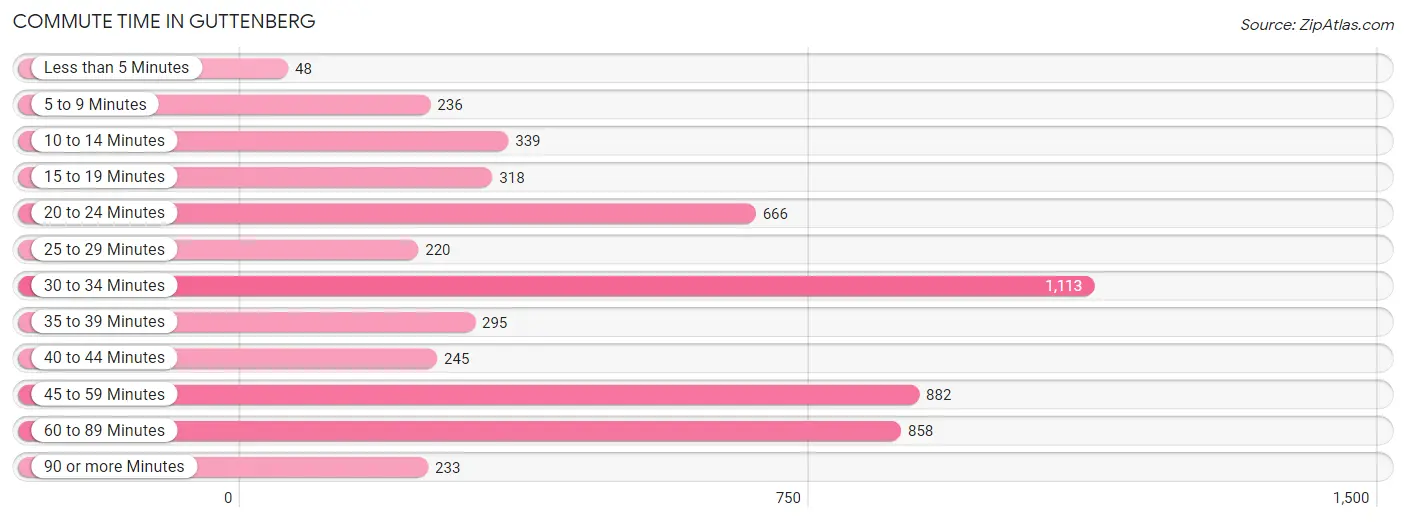
| Commute Time | # Commuters | % Commuters |
| Less than 5 Minutes | 48 | 0.9% |
| 5 to 9 Minutes | 236 | 4.3% |
| 10 to 14 Minutes | 339 | 6.2% |
| 15 to 19 Minutes | 318 | 5.8% |
| 20 to 24 Minutes | 666 | 12.2% |
| 25 to 29 Minutes | 220 | 4.0% |
| 30 to 34 Minutes | 1,113 | 20.4% |
| 35 to 39 Minutes | 295 | 5.4% |
| 40 to 44 Minutes | 245 | 4.5% |
| 45 to 59 Minutes | 882 | 16.2% |
| 60 to 89 Minutes | 858 | 15.7% |
| 90 or more Minutes | 233 | 4.3% |
Commute Time by Sex in Guttenberg
The most common commute times in Guttenberg are 45 to 59 minutes (562 commuters, 22.1%) for males and 30 to 34 minutes (659 commuters, 22.7%) for females.
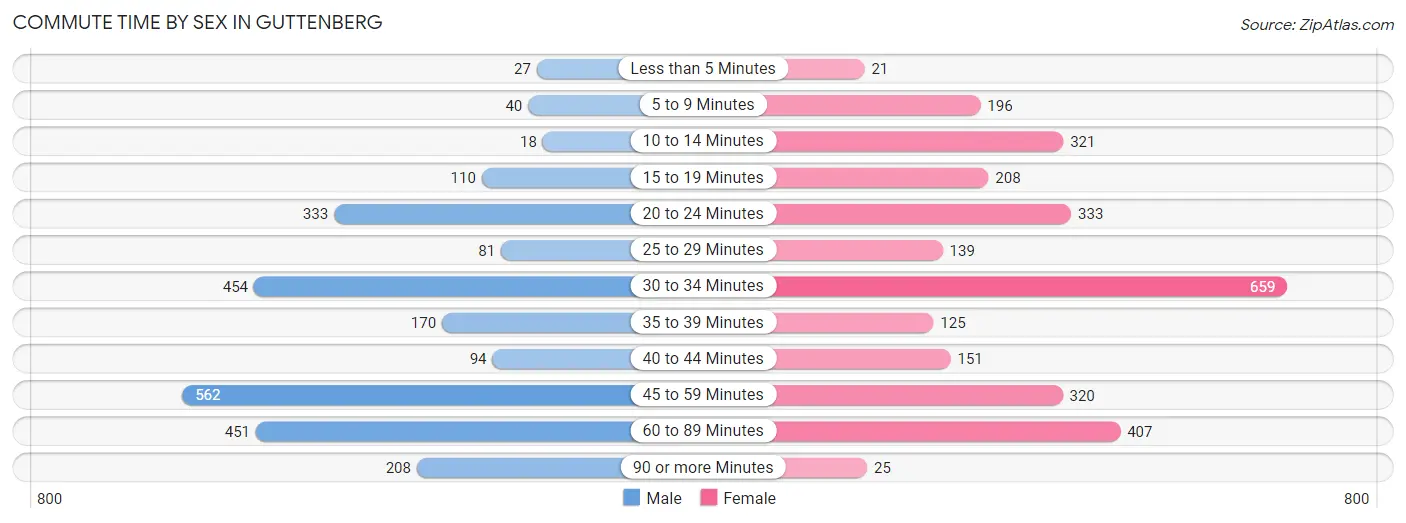
| Commute Time | Male | Female |
| Less than 5 Minutes | 27 (1.1%) | 21 (0.7%) |
| 5 to 9 Minutes | 40 (1.6%) | 196 (6.8%) |
| 10 to 14 Minutes | 18 (0.7%) | 321 (11.1%) |
| 15 to 19 Minutes | 110 (4.3%) | 208 (7.2%) |
| 20 to 24 Minutes | 333 (13.1%) | 333 (11.5%) |
| 25 to 29 Minutes | 81 (3.2%) | 139 (4.8%) |
| 30 to 34 Minutes | 454 (17.8%) | 659 (22.7%) |
| 35 to 39 Minutes | 170 (6.7%) | 125 (4.3%) |
| 40 to 44 Minutes | 94 (3.7%) | 151 (5.2%) |
| 45 to 59 Minutes | 562 (22.1%) | 320 (11.0%) |
| 60 to 89 Minutes | 451 (17.7%) | 407 (14.0%) |
| 90 or more Minutes | 208 (8.2%) | 25 (0.9%) |
Time of Departure to Work by Sex in Guttenberg
The most frequent times of departure to work in Guttenberg are 7:00 AM to 7:29 AM (543, 21.3%) for males and 8:00 AM to 8:29 AM (598, 20.6%) for females.
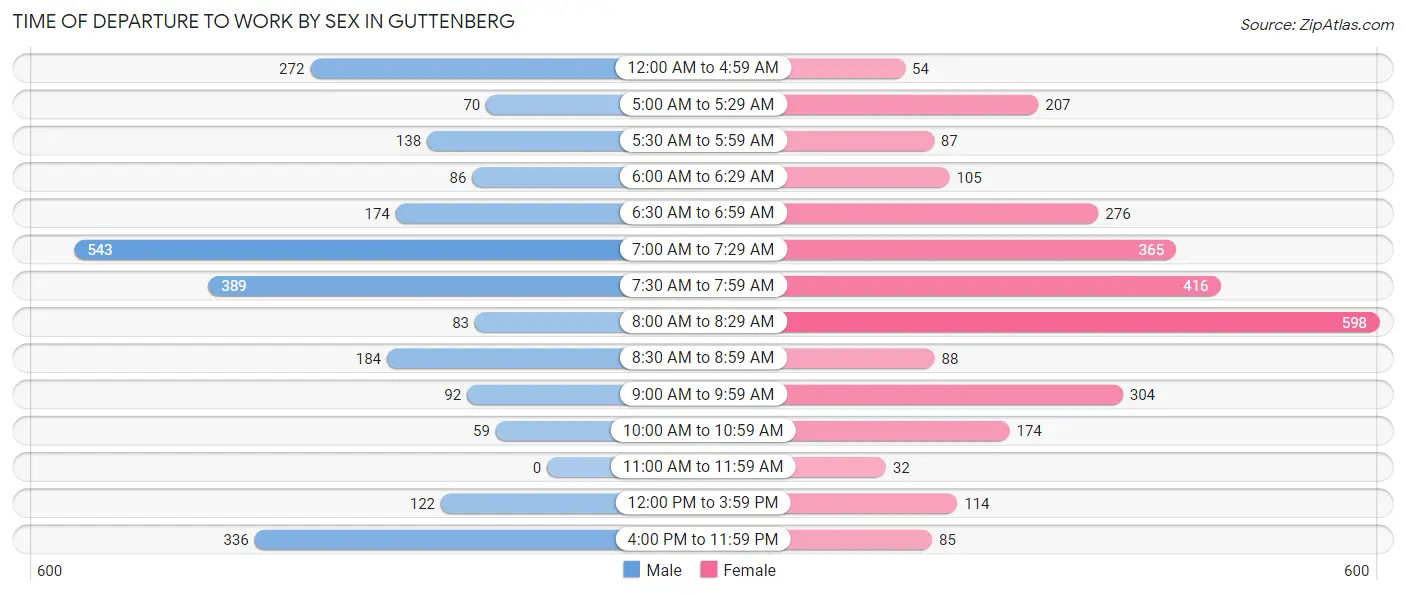
| Time of Departure | Male | Female |
| 12:00 AM to 4:59 AM | 272 (10.7%) | 54 (1.9%) |
| 5:00 AM to 5:29 AM | 70 (2.8%) | 207 (7.1%) |
| 5:30 AM to 5:59 AM | 138 (5.4%) | 87 (3.0%) |
| 6:00 AM to 6:29 AM | 86 (3.4%) | 105 (3.6%) |
| 6:30 AM to 6:59 AM | 174 (6.8%) | 276 (9.5%) |
| 7:00 AM to 7:29 AM | 543 (21.3%) | 365 (12.6%) |
| 7:30 AM to 7:59 AM | 389 (15.3%) | 416 (14.3%) |
| 8:00 AM to 8:29 AM | 83 (3.3%) | 598 (20.6%) |
| 8:30 AM to 8:59 AM | 184 (7.2%) | 88 (3.0%) |
| 9:00 AM to 9:59 AM | 92 (3.6%) | 304 (10.5%) |
| 10:00 AM to 10:59 AM | 59 (2.3%) | 174 (6.0%) |
| 11:00 AM to 11:59 AM | 0 (0.0%) | 32 (1.1%) |
| 12:00 PM to 3:59 PM | 122 (4.8%) | 114 (3.9%) |
| 4:00 PM to 11:59 PM | 336 (13.2%) | 85 (2.9%) |
| Total | 2,548 (100.0%) | 2,905 (100.0%) |
Housing Occupancy in Guttenberg
Occupancy by Ownership in Guttenberg
Of the total 4,973 dwellings in Guttenberg, owner-occupied units account for 2,045 (41.1%), while renter-occupied units make up 2,928 (58.9%).
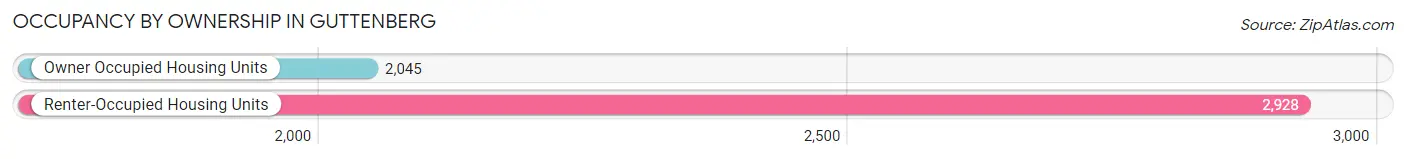
| Occupancy | # Housing Units | % Housing Units |
| Owner Occupied Housing Units | 2,045 | 41.1% |
| Renter-Occupied Housing Units | 2,928 | 58.9% |
| Total Occupied Housing Units | 4,973 | 100.0% |
Occupancy by Household Size in Guttenberg
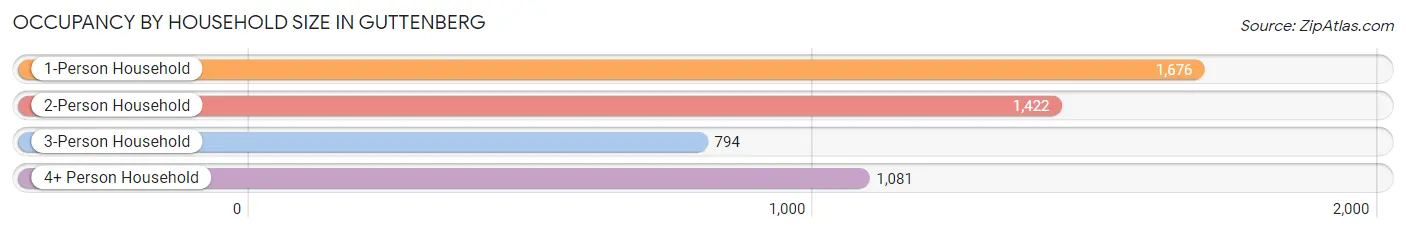
| Household Size | # Housing Units | % Housing Units |
| 1-Person Household | 1,676 | 33.7% |
| 2-Person Household | 1,422 | 28.6% |
| 3-Person Household | 794 | 16.0% |
| 4+ Person Household | 1,081 | 21.7% |
| Total Housing Units | 4,973 | 100.0% |
Occupancy by Ownership by Household Size in Guttenberg
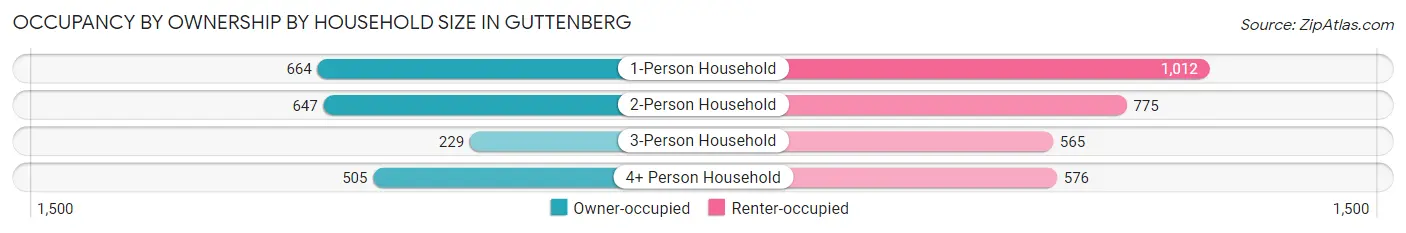
| Household Size | Owner-occupied | Renter-occupied |
| 1-Person Household | 664 (39.6%) | 1,012 (60.4%) |
| 2-Person Household | 647 (45.5%) | 775 (54.5%) |
| 3-Person Household | 229 (28.8%) | 565 (71.2%) |
| 4+ Person Household | 505 (46.7%) | 576 (53.3%) |
| Total Housing Units | 2,045 (41.1%) | 2,928 (58.9%) |
Occupancy by Educational Attainment in Guttenberg
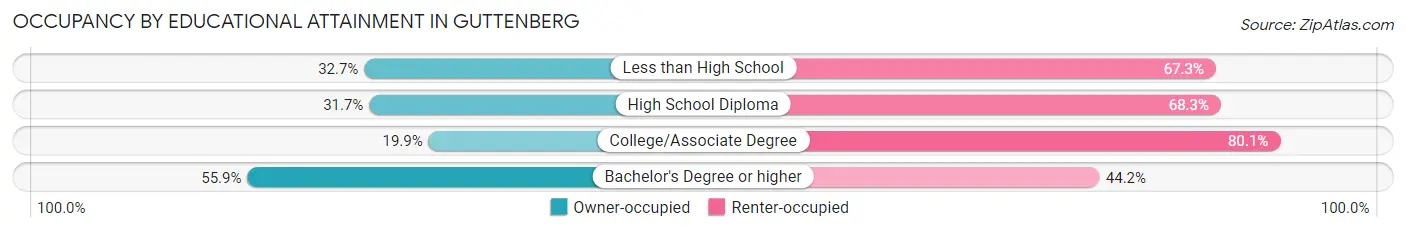
| Household Size | Owner-occupied | Renter-occupied |
| Less than High School | 196 (32.7%) | 404 (67.3%) |
| High School Diploma | 262 (31.7%) | 565 (68.3%) |
| College/Associate Degree | 218 (19.9%) | 877 (80.1%) |
| Bachelor's Degree or higher | 1,369 (55.8%) | 1,082 (44.2%) |
Occupancy by Age of Householder in Guttenberg
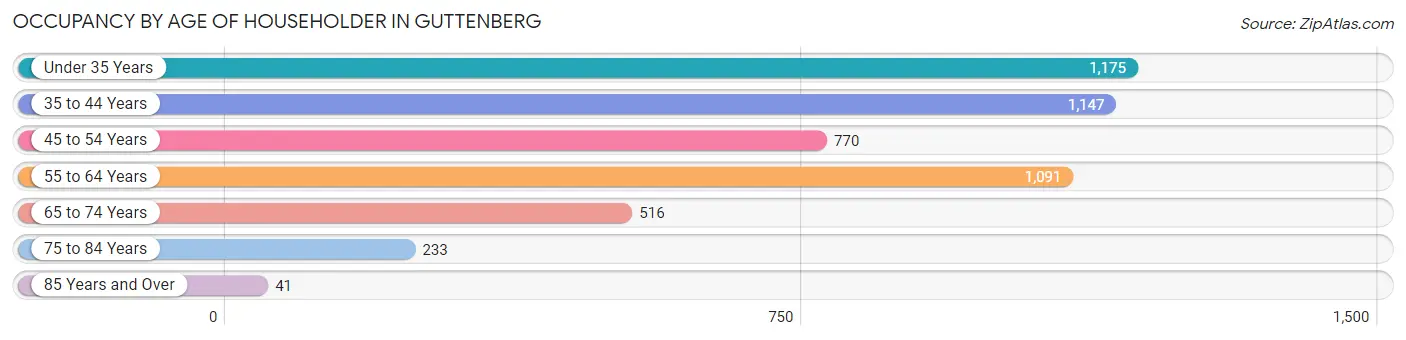
| Age Bracket | # Households | % Households |
| Under 35 Years | 1,175 | 23.6% |
| 35 to 44 Years | 1,147 | 23.1% |
| 45 to 54 Years | 770 | 15.5% |
| 55 to 64 Years | 1,091 | 21.9% |
| 65 to 74 Years | 516 | 10.4% |
| 75 to 84 Years | 233 | 4.7% |
| 85 Years and Over | 41 | 0.8% |
| Total | 4,973 | 100.0% |
Housing Finances in Guttenberg
Median Income by Occupancy in Guttenberg
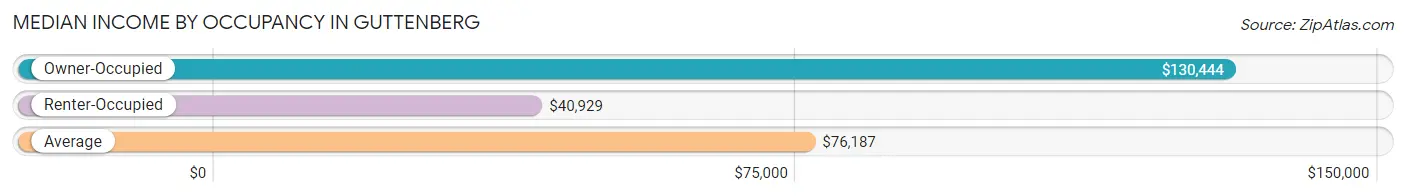
| Occupancy Type | # Households | Median Income |
| Owner-Occupied | 2,045 (41.1%) | $130,444 |
| Renter-Occupied | 2,928 (58.9%) | $40,929 |
| Average | 4,973 (100.0%) | $76,187 |
Occupancy by Householder Income Bracket in Guttenberg
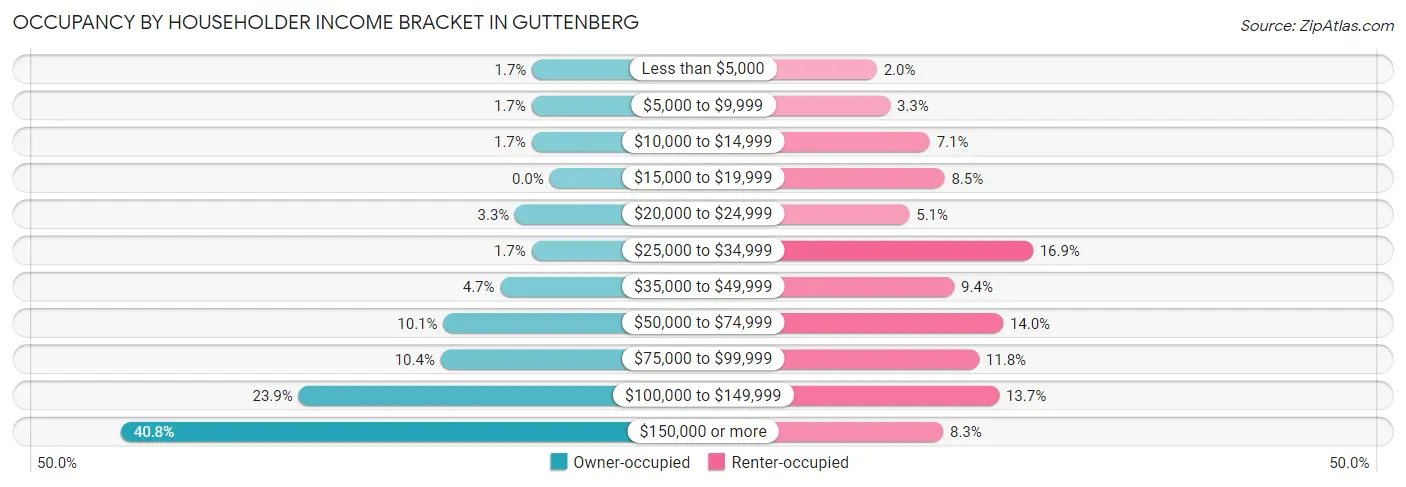
| Income Bracket | Owner-occupied | Renter-occupied |
| Less than $5,000 | 34 (1.7%) | 59 (2.0%) |
| $5,000 to $9,999 | 35 (1.7%) | 96 (3.3%) |
| $10,000 to $14,999 | 35 (1.7%) | 207 (7.1%) |
| $15,000 to $19,999 | 0 (0.0%) | 248 (8.5%) |
| $20,000 to $24,999 | 67 (3.3%) | 150 (5.1%) |
| $25,000 to $34,999 | 35 (1.7%) | 494 (16.9%) |
| $35,000 to $49,999 | 96 (4.7%) | 275 (9.4%) |
| $50,000 to $74,999 | 207 (10.1%) | 411 (14.0%) |
| $75,000 to $99,999 | 212 (10.4%) | 344 (11.7%) |
| $100,000 to $149,999 | 489 (23.9%) | 400 (13.7%) |
| $150,000 or more | 835 (40.8%) | 244 (8.3%) |
| Total | 2,045 (100.0%) | 2,928 (100.0%) |
Monthly Housing Cost Tiers in Guttenberg
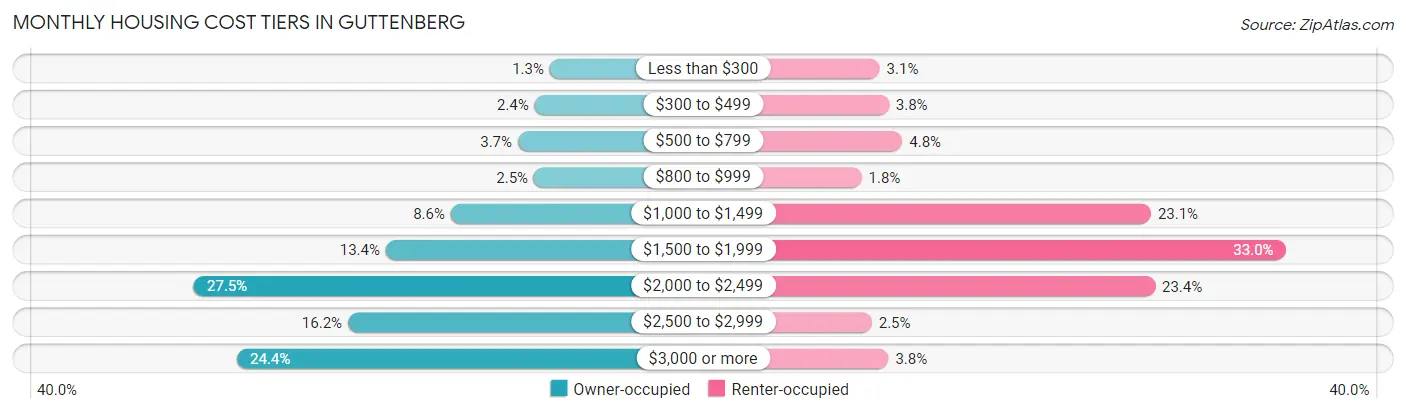
| Monthly Cost | Owner-occupied | Renter-occupied |
| Less than $300 | 27 (1.3%) | 91 (3.1%) |
| $300 to $499 | 50 (2.4%) | 111 (3.8%) |
| $500 to $799 | 75 (3.7%) | 140 (4.8%) |
| $800 to $999 | 51 (2.5%) | 52 (1.8%) |
| $1,000 to $1,499 | 176 (8.6%) | 676 (23.1%) |
| $1,500 to $1,999 | 274 (13.4%) | 966 (33.0%) |
| $2,000 to $2,499 | 563 (27.5%) | 685 (23.4%) |
| $2,500 to $2,999 | 331 (16.2%) | 74 (2.5%) |
| $3,000 or more | 498 (24.3%) | 110 (3.8%) |
| Total | 2,045 (100.0%) | 2,928 (100.0%) |
Physical Housing Characteristics in Guttenberg
Housing Structures in Guttenberg
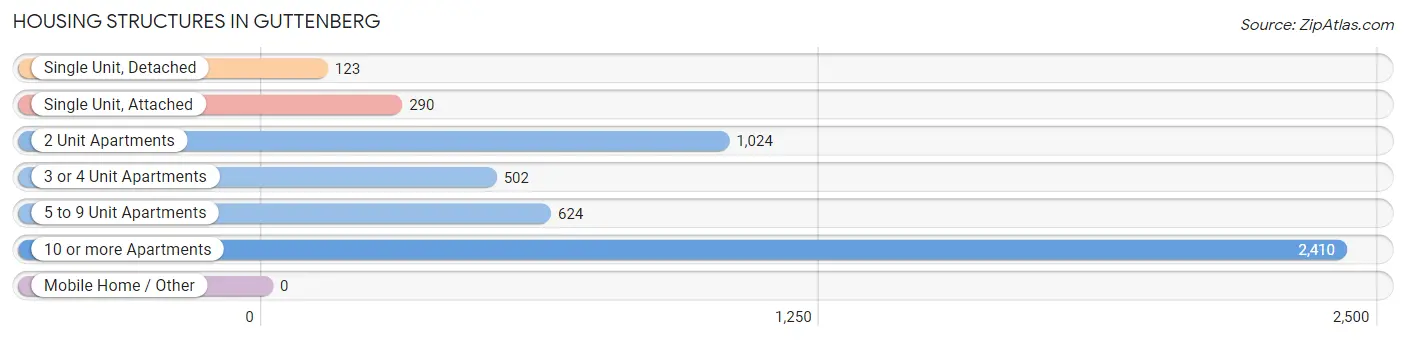
| Structure Type | # Housing Units | % Housing Units |
| Single Unit, Detached | 123 | 2.5% |
| Single Unit, Attached | 290 | 5.8% |
| 2 Unit Apartments | 1,024 | 20.6% |
| 3 or 4 Unit Apartments | 502 | 10.1% |
| 5 to 9 Unit Apartments | 624 | 12.6% |
| 10 or more Apartments | 2,410 | 48.5% |
| Mobile Home / Other | 0 | 0.0% |
| Total | 4,973 | 100.0% |
Housing Structures by Occupancy in Guttenberg
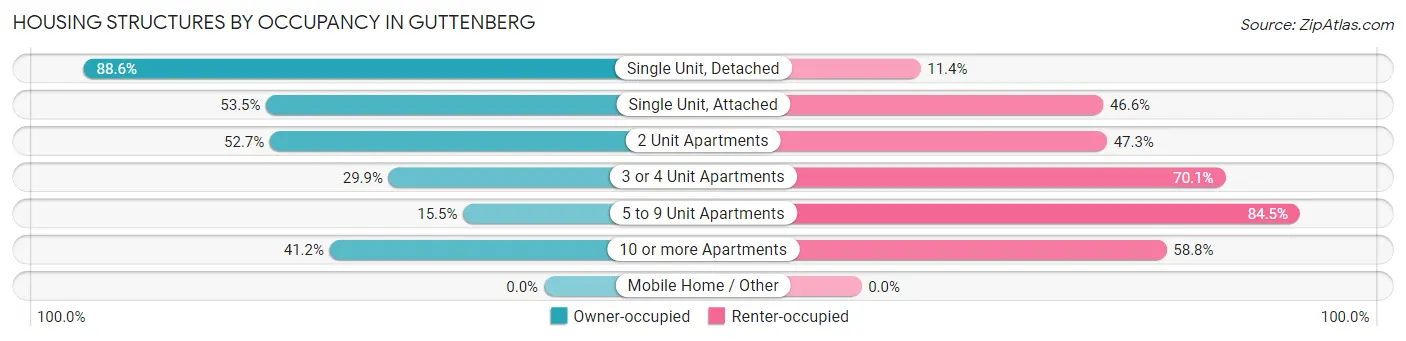
| Structure Type | Owner-occupied | Renter-occupied |
| Single Unit, Detached | 109 (88.6%) | 14 (11.4%) |
| Single Unit, Attached | 155 (53.4%) | 135 (46.6%) |
| 2 Unit Apartments | 540 (52.7%) | 484 (47.3%) |
| 3 or 4 Unit Apartments | 150 (29.9%) | 352 (70.1%) |
| 5 to 9 Unit Apartments | 97 (15.5%) | 527 (84.5%) |
| 10 or more Apartments | 994 (41.2%) | 1,416 (58.8%) |
| Mobile Home / Other | 0 (0.0%) | 0 (0.0%) |
| Total | 2,045 (41.1%) | 2,928 (58.9%) |
Housing Structures by Number of Rooms in Guttenberg
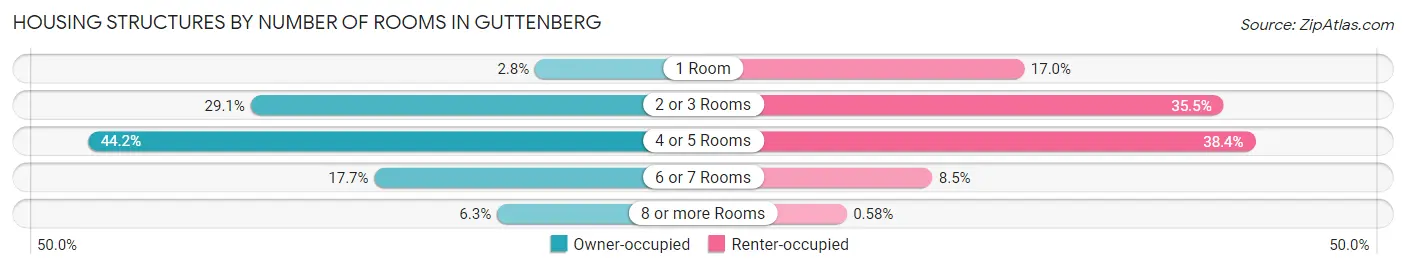
| Number of Rooms | Owner-occupied | Renter-occupied |
| 1 Room | 57 (2.8%) | 498 (17.0%) |
| 2 or 3 Rooms | 595 (29.1%) | 1,039 (35.5%) |
| 4 or 5 Rooms | 903 (44.2%) | 1,125 (38.4%) |
| 6 or 7 Rooms | 361 (17.6%) | 249 (8.5%) |
| 8 or more Rooms | 129 (6.3%) | 17 (0.6%) |
| Total | 2,045 (100.0%) | 2,928 (100.0%) |
Housing Structure by Heating Type in Guttenberg
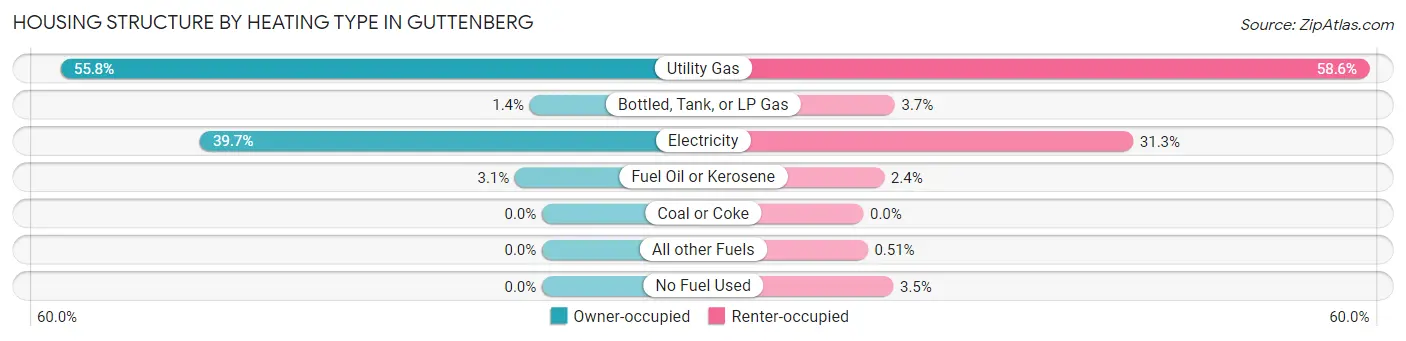
| Heating Type | Owner-occupied | Renter-occupied |
| Utility Gas | 1,141 (55.8%) | 1,717 (58.6%) |
| Bottled, Tank, or LP Gas | 29 (1.4%) | 107 (3.6%) |
| Electricity | 811 (39.7%) | 916 (31.3%) |
| Fuel Oil or Kerosene | 64 (3.1%) | 71 (2.4%) |
| Coal or Coke | 0 (0.0%) | 0 (0.0%) |
| All other Fuels | 0 (0.0%) | 15 (0.5%) |
| No Fuel Used | 0 (0.0%) | 102 (3.5%) |
| Total | 2,045 (100.0%) | 2,928 (100.0%) |
Household Vehicle Usage in Guttenberg
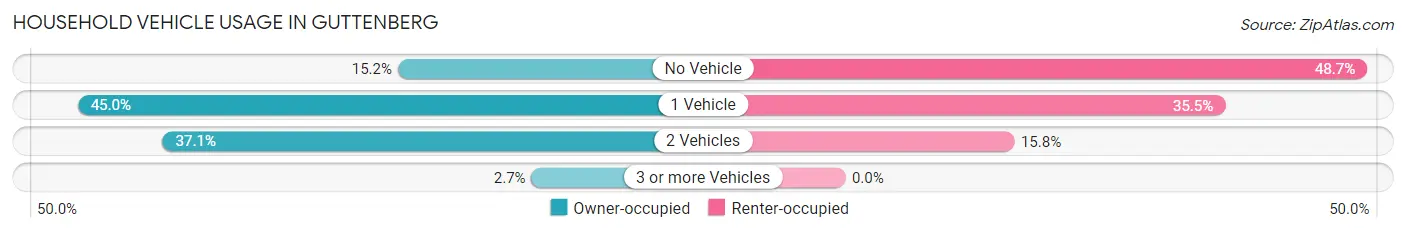
| Vehicles per Household | Owner-occupied | Renter-occupied |
| No Vehicle | 310 (15.2%) | 1,427 (48.7%) |
| 1 Vehicle | 921 (45.0%) | 1,039 (35.5%) |
| 2 Vehicles | 759 (37.1%) | 462 (15.8%) |
| 3 or more Vehicles | 55 (2.7%) | 0 (0.0%) |
| Total | 2,045 (100.0%) | 2,928 (100.0%) |
Real Estate & Mortgages in Guttenberg
Real Estate and Mortgage Overview in Guttenberg
| Characteristic | Without Mortgage | With Mortgage |
| Housing Units | 855 | 1,190 |
| Median Property Value | $357,500 | $368,900 |
| Median Household Income | $86,821 | $604 |
| Monthly Housing Costs | $1,501 | $466 |
| Real Estate Taxes | $10,001 | $50 |
Property Value by Mortgage Status in Guttenberg
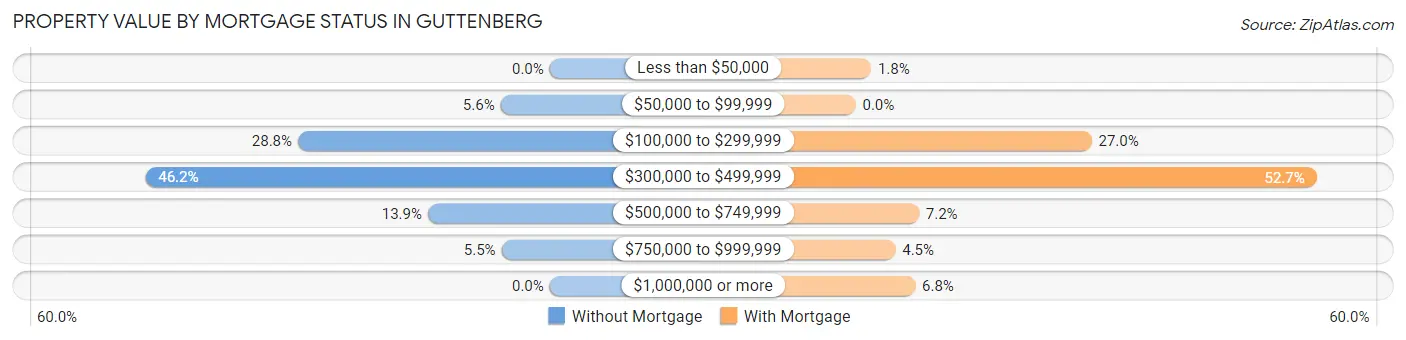
| Property Value | Without Mortgage | With Mortgage |
| Less than $50,000 | 0 (0.0%) | 21 (1.8%) |
| $50,000 to $99,999 | 48 (5.6%) | 0 (0.0%) |
| $100,000 to $299,999 | 246 (28.8%) | 321 (27.0%) |
| $300,000 to $499,999 | 395 (46.2%) | 627 (52.7%) |
| $500,000 to $749,999 | 119 (13.9%) | 86 (7.2%) |
| $750,000 to $999,999 | 47 (5.5%) | 54 (4.5%) |
| $1,000,000 or more | 0 (0.0%) | 81 (6.8%) |
| Total | 855 (100.0%) | 1,190 (100.0%) |
Household Income by Mortgage Status in Guttenberg
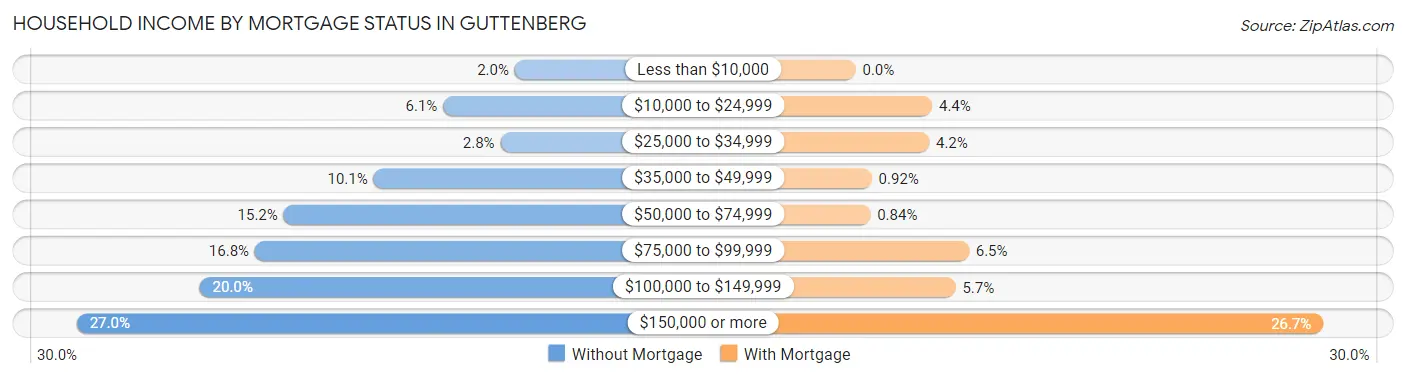
| Household Income | Without Mortgage | With Mortgage |
| Less than $10,000 | 17 (2.0%) | 0 (0.0%) |
| $10,000 to $24,999 | 52 (6.1%) | 52 (4.4%) |
| $25,000 to $34,999 | 24 (2.8%) | 50 (4.2%) |
| $35,000 to $49,999 | 86 (10.1%) | 11 (0.9%) |
| $50,000 to $74,999 | 130 (15.2%) | 10 (0.8%) |
| $75,000 to $99,999 | 144 (16.8%) | 77 (6.5%) |
| $100,000 to $149,999 | 171 (20.0%) | 68 (5.7%) |
| $150,000 or more | 231 (27.0%) | 318 (26.7%) |
| Total | 855 (100.0%) | 1,190 (100.0%) |
Property Value to Household Income Ratio in Guttenberg
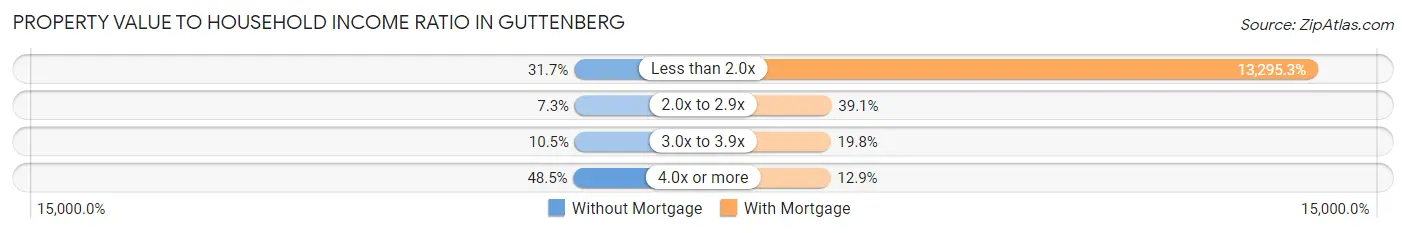
| Value-to-Income Ratio | Without Mortgage | With Mortgage |
| Less than 2.0x | 271 (31.7%) | 158,214 (13,295.3%) |
| 2.0x to 2.9x | 62 (7.2%) | 465 (39.1%) |
| 3.0x to 3.9x | 90 (10.5%) | 236 (19.8%) |
| 4.0x or more | 415 (48.5%) | 154 (12.9%) |
| Total | 855 (100.0%) | 1,190 (100.0%) |
Real Estate Taxes by Mortgage Status in Guttenberg
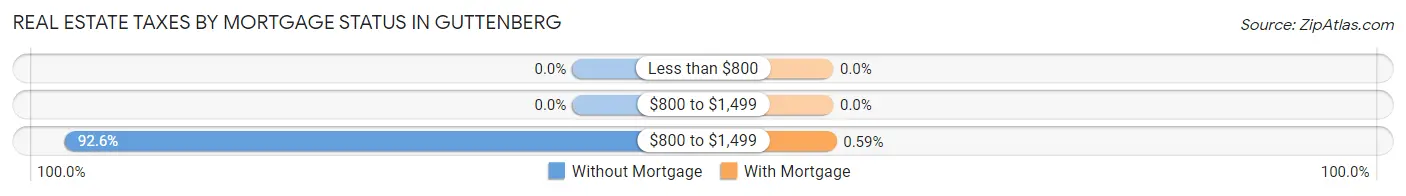
| Property Taxes | Without Mortgage | With Mortgage |
| Less than $800 | 0 (0.0%) | 0 (0.0%) |
| $800 to $1,499 | 0 (0.0%) | 0 (0.0%) |
| $800 to $1,499 | 792 (92.6%) | 7 (0.6%) |
| Total | 855 (100.0%) | 1,190 (100.0%) |
Health & Disability in Guttenberg
Health Insurance Coverage by Age in Guttenberg
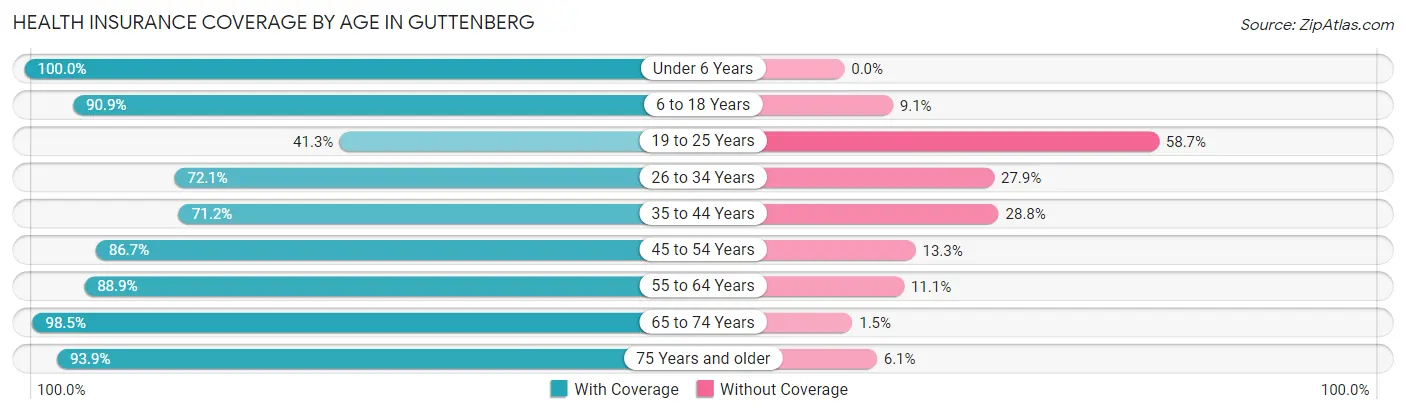
| Age Bracket | With Coverage | Without Coverage |
| Under 6 Years | 897 (100.0%) | 0 (0.0%) |
| 6 to 18 Years | 1,406 (90.9%) | 140 (9.1%) |
| 19 to 25 Years | 406 (41.3%) | 576 (58.7%) |
| 26 to 34 Years | 1,334 (72.1%) | 517 (27.9%) |
| 35 to 44 Years | 1,507 (71.2%) | 609 (28.8%) |
| 45 to 54 Years | 998 (86.7%) | 153 (13.3%) |
| 55 to 64 Years | 1,421 (88.9%) | 178 (11.1%) |
| 65 to 74 Years | 1,057 (98.5%) | 16 (1.5%) |
| 75 Years and older | 512 (93.9%) | 33 (6.1%) |
| Total | 9,538 (81.1%) | 2,222 (18.9%) |
Health Insurance Coverage by Citizenship Status in Guttenberg
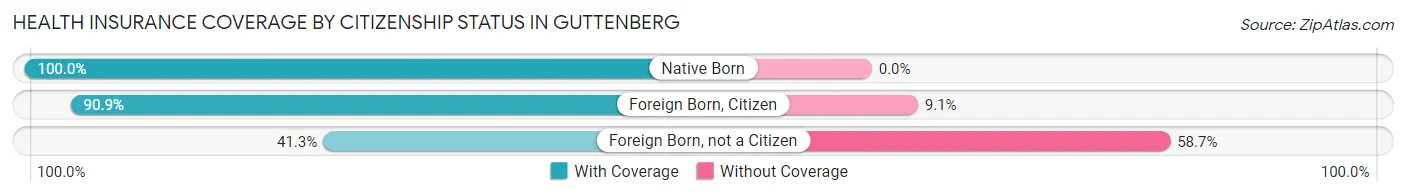
| Citizenship Status | With Coverage | Without Coverage |
| Native Born | 897 (100.0%) | 0 (0.0%) |
| Foreign Born, Citizen | 1,406 (90.9%) | 140 (9.1%) |
| Foreign Born, not a Citizen | 406 (41.3%) | 576 (58.7%) |
Health Insurance Coverage by Household Income in Guttenberg
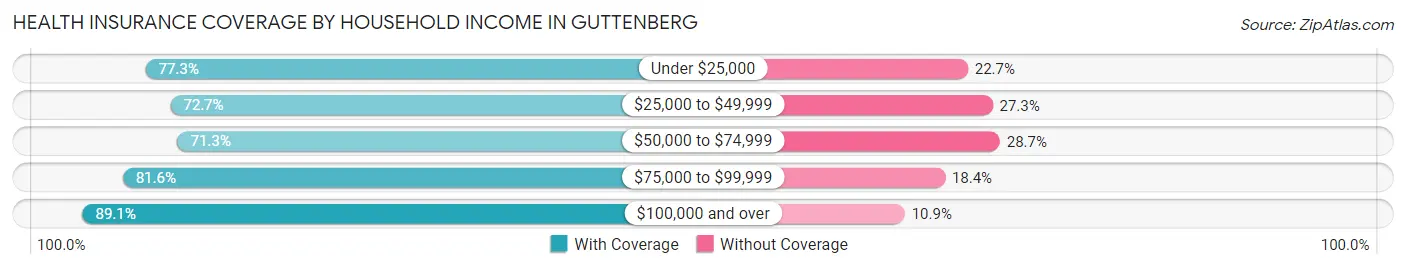
| Household Income | With Coverage | Without Coverage |
| Under $25,000 | 1,368 (77.3%) | 401 (22.7%) |
| $25,000 to $49,999 | 1,195 (72.7%) | 449 (27.3%) |
| $50,000 to $74,999 | 1,398 (71.3%) | 562 (28.7%) |
| $75,000 to $99,999 | 1,260 (81.6%) | 284 (18.4%) |
| $100,000 and over | 4,316 (89.1%) | 526 (10.9%) |
Public vs Private Health Insurance Coverage by Age in Guttenberg
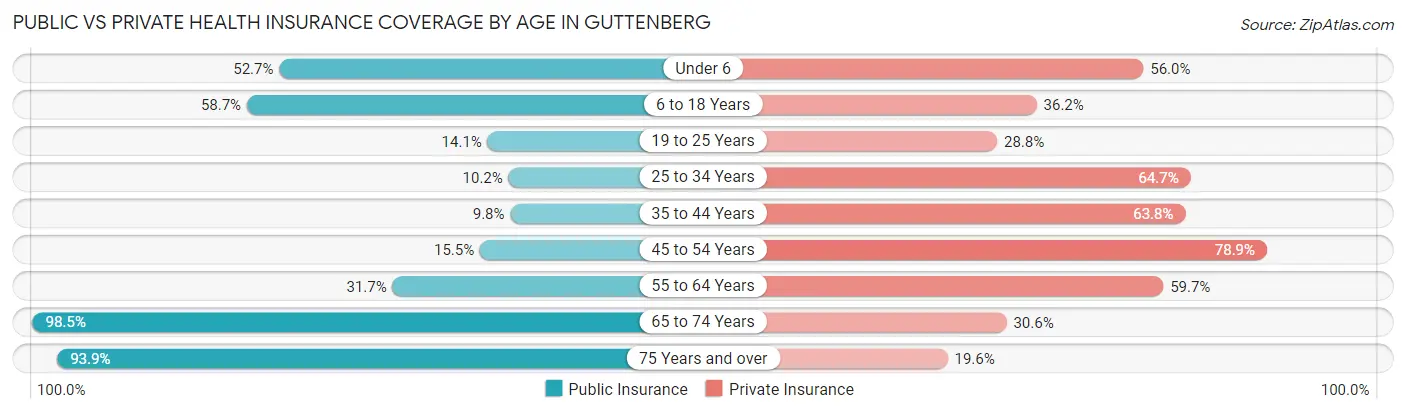
| Age Bracket | Public Insurance | Private Insurance |
| Under 6 | 473 (52.7%) | 502 (56.0%) |
| 6 to 18 Years | 908 (58.7%) | 559 (36.2%) |
| 19 to 25 Years | 138 (14.1%) | 283 (28.8%) |
| 25 to 34 Years | 188 (10.2%) | 1,198 (64.7%) |
| 35 to 44 Years | 208 (9.8%) | 1,349 (63.7%) |
| 45 to 54 Years | 178 (15.5%) | 908 (78.9%) |
| 55 to 64 Years | 507 (31.7%) | 954 (59.7%) |
| 65 to 74 Years | 1,057 (98.5%) | 328 (30.6%) |
| 75 Years and over | 512 (93.9%) | 107 (19.6%) |
| Total | 4,169 (35.4%) | 6,188 (52.6%) |
Disability Status by Sex by Age in Guttenberg
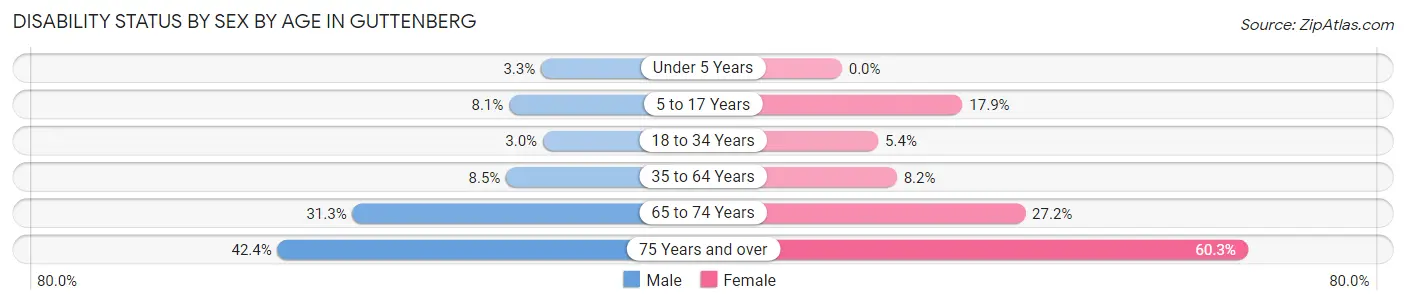
| Age Bracket | Male | Female |
| Under 5 Years | 11 (3.3%) | 0 (0.0%) |
| 5 to 17 Years | 60 (8.1%) | 146 (17.9%) |
| 18 to 34 Years | 46 (3.0%) | 75 (5.4%) |
| 35 to 64 Years | 178 (8.5%) | 226 (8.2%) |
| 65 to 74 Years | 129 (31.3%) | 180 (27.2%) |
| 75 Years and over | 101 (42.4%) | 185 (60.3%) |
Disability Class by Sex by Age in Guttenberg
Disability Class: Hearing Difficulty
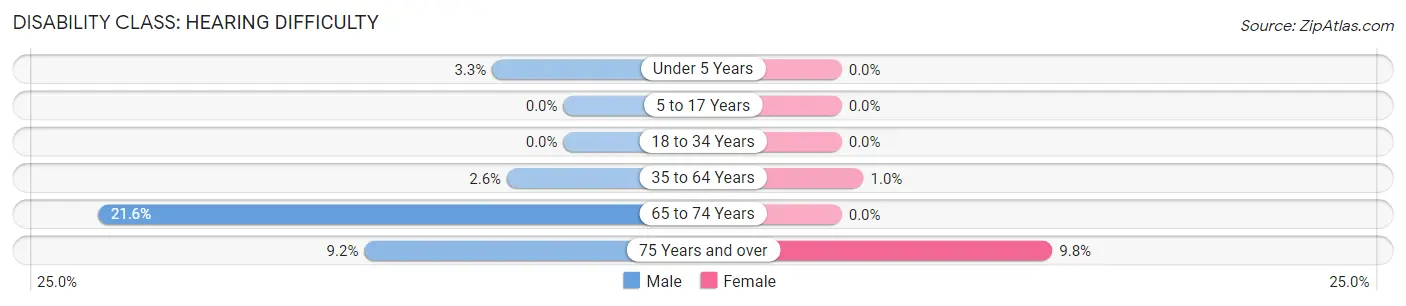
| Age Bracket | Male | Female |
| Under 5 Years | 11 (3.3%) | 0 (0.0%) |
| 5 to 17 Years | 0 (0.0%) | 0 (0.0%) |
| 18 to 34 Years | 0 (0.0%) | 0 (0.0%) |
| 35 to 64 Years | 55 (2.6%) | 28 (1.0%) |
| 65 to 74 Years | 89 (21.6%) | 0 (0.0%) |
| 75 Years and over | 22 (9.2%) | 30 (9.8%) |
Disability Class: Vision Difficulty
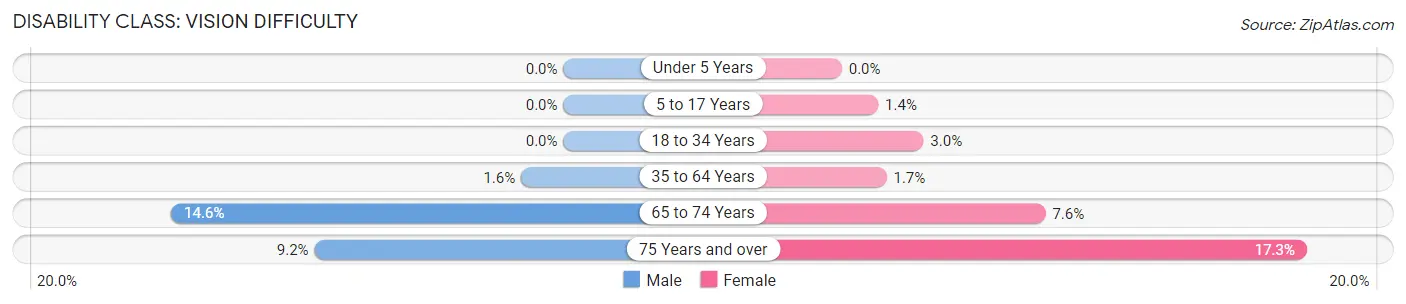
| Age Bracket | Male | Female |
| Under 5 Years | 0 (0.0%) | 0 (0.0%) |
| 5 to 17 Years | 0 (0.0%) | 11 (1.3%) |
| 18 to 34 Years | 0 (0.0%) | 42 (3.0%) |
| 35 to 64 Years | 33 (1.6%) | 46 (1.7%) |
| 65 to 74 Years | 60 (14.6%) | 50 (7.6%) |
| 75 Years and over | 22 (9.2%) | 53 (17.3%) |
Disability Class: Cognitive Difficulty
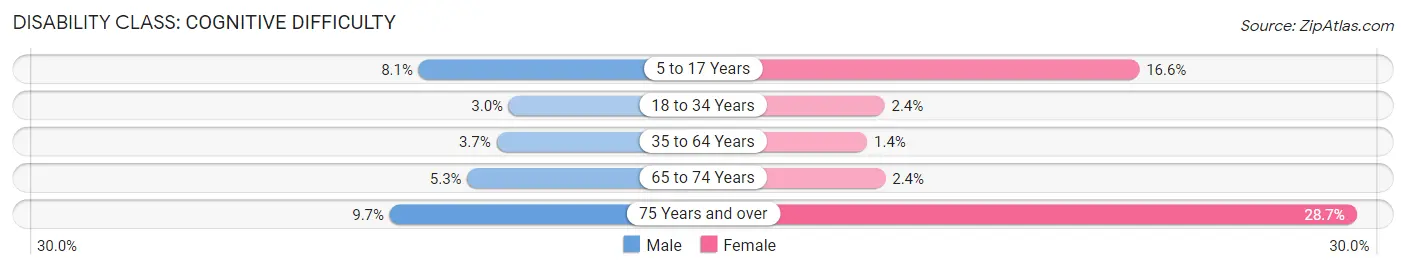
| Age Bracket | Male | Female |
| 5 to 17 Years | 60 (8.1%) | 135 (16.6%) |
| 18 to 34 Years | 46 (3.0%) | 33 (2.4%) |
| 35 to 64 Years | 78 (3.7%) | 39 (1.4%) |
| 65 to 74 Years | 22 (5.3%) | 16 (2.4%) |
| 75 Years and over | 23 (9.7%) | 88 (28.7%) |
Disability Class: Ambulatory Difficulty
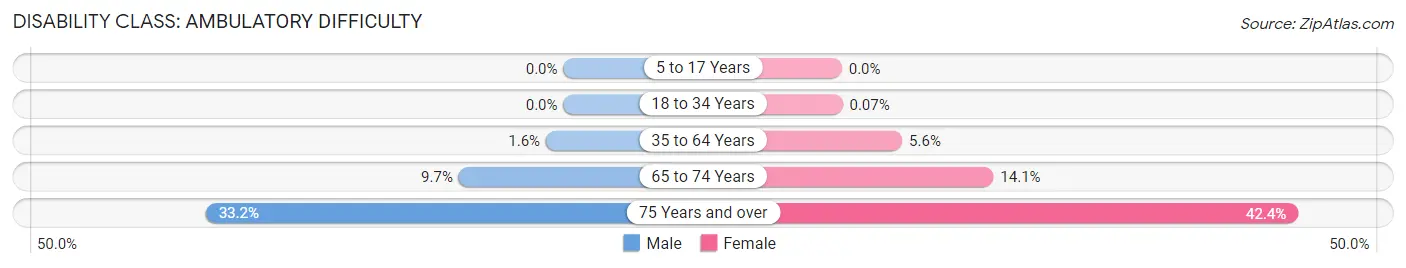
| Age Bracket | Male | Female |
| 5 to 17 Years | 0 (0.0%) | 0 (0.0%) |
| 18 to 34 Years | 0 (0.0%) | 1 (0.1%) |
| 35 to 64 Years | 34 (1.6%) | 155 (5.6%) |
| 65 to 74 Years | 40 (9.7%) | 93 (14.1%) |
| 75 Years and over | 79 (33.2%) | 130 (42.3%) |
Disability Class: Self-Care Difficulty
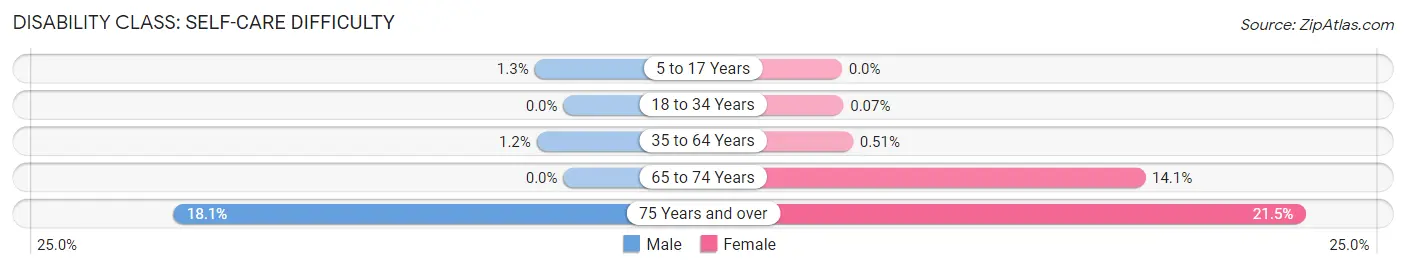
| Age Bracket | Male | Female |
| 5 to 17 Years | 10 (1.3%) | 0 (0.0%) |
| 18 to 34 Years | 0 (0.0%) | 1 (0.1%) |
| 35 to 64 Years | 26 (1.2%) | 14 (0.5%) |
| 65 to 74 Years | 0 (0.0%) | 93 (14.1%) |
| 75 Years and over | 43 (18.1%) | 66 (21.5%) |
Technology Access in Guttenberg
Computing Device Access in Guttenberg
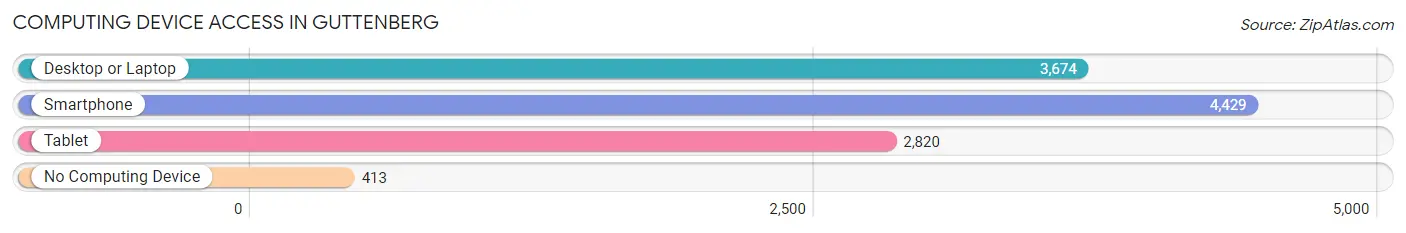
| Device Type | # Households | % Households |
| Desktop or Laptop | 3,674 | 73.9% |
| Smartphone | 4,429 | 89.1% |
| Tablet | 2,820 | 56.7% |
| No Computing Device | 413 | 8.3% |
| Total | 4,973 | 100.0% |
Internet Access in Guttenberg
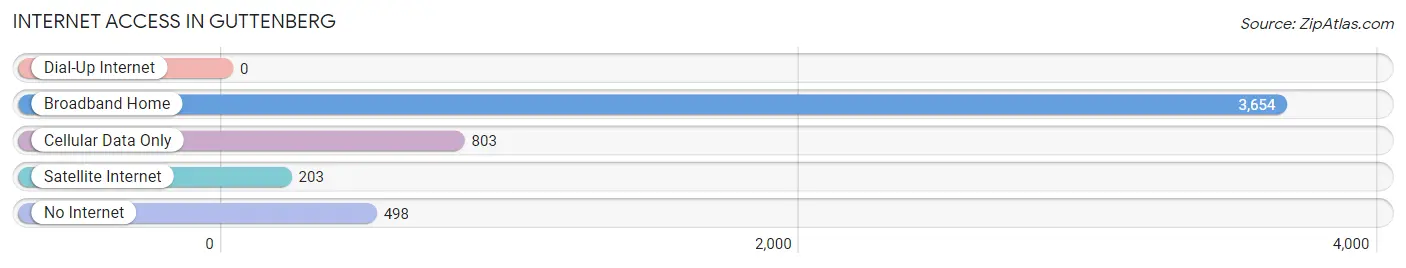
| Internet Type | # Households | % Households |
| Dial-Up Internet | 0 | 0.0% |
| Broadband Home | 3,654 | 73.5% |
| Cellular Data Only | 803 | 16.2% |
| Satellite Internet | 203 | 4.1% |
| No Internet | 498 | 10.0% |
| Total | 4,973 | 100.0% |
Guttenberg Summary
Guttenberg, NJ is a small town located in Hudson County, New Jersey. It is situated on the west bank of the Hudson River, directly across from Manhattan. The town is bordered by North Bergen to the east, West New York to the south, and the Hudson River to the west. Guttenberg is a densely populated town, with a population of 11,176 as of the 2010 census.
History
Guttenberg was originally inhabited by the Hackensack Indians, who were part of the Lenape tribe. The area was first settled by Dutch settlers in the early 1600s. The town was named after the Guttenberg family, who were among the first settlers. The town was officially incorporated in 1859.
Guttenberg was a popular summer resort destination in the late 19th and early 20th centuries. The town was known for its many resorts and hotels, which attracted visitors from all over the country. The town was also home to a number of amusement parks, including Palisades Amusement Park, which was located on the Hudson River.
Geography
Guttenberg is located at 40°47'14" North, 74°00'45" West (40.7872, -74.0125). The town has a total area of 0.9 square miles, all of which is land. The town is located on the west bank of the Hudson River, directly across from Manhattan.
Economy
Guttenberg is primarily a residential community, with most of its residents commuting to nearby cities for work. The town does have a few small businesses, including restaurants, retail stores, and professional services. The town is also home to a number of industrial and manufacturing businesses.
Demographics
As of the 2010 census, Guttenberg had a population of 11,176. The racial makeup of the town was 57.2% White, 15.2% African American, 0.4% Native American, 11.2% Asian, 0.1% Pacific Islander, and 15.9% from other races. Hispanic or Latino of any race were 44.2% of the population.
The median household income in Guttenberg was $50,945, and the median family income was $60,945. The per capita income for the town was $25,945. About 11.2% of families and 14.2% of the population were below the poverty line, including 19.2% of those under age 18 and 8.2% of those age 65 or over.
Guttenberg is a diverse community, with a variety of cultures and backgrounds represented. The town is home to a large Hispanic population, as well as a growing Asian population. The town is also home to a large number of immigrants from Central and South America.
Common Questions
What is Per Capita Income in Guttenberg?
Per Capita income in Guttenberg is $43,016.
What is the Median Family Income in Guttenberg?
Median Family Income in Guttenberg is $84,191.
What is the Median Household income in Guttenberg?
Median Household Income in Guttenberg is $76,187.
What is Income or Wage Gap in Guttenberg?
Income or Wage Gap in Guttenberg is 2.9%.
Women in Guttenberg earn 97.1 cents for every dollar earned by a man.
What is Family Income Deficit in Guttenberg?
Family Income Deficit in Guttenberg is $7,231.
Families that are below poverty line in Guttenberg earn $7,231 less on average than the poverty threshold level.
What is Inequality or Gini Index in Guttenberg?
Inequality or Gini Index in Guttenberg is 0.48.
What is the Total Population of Guttenberg?
Total Population of Guttenberg is 11,765.
What is the Total Male Population of Guttenberg?
Total Male Population of Guttenberg is 5,341.
What is the Total Female Population of Guttenberg?
Total Female Population of Guttenberg is 6,424.
What is the Ratio of Males per 100 Females in Guttenberg?
There are 83.14 Males per 100 Females in Guttenberg.
What is the Ratio of Females per 100 Males in Guttenberg?
There are 120.28 Females per 100 Males in Guttenberg.
What is the Median Population Age in Guttenberg?
Median Population Age in Guttenberg is 37.5 Years.
What is the Average Family Size in Guttenberg
Average Family Size in Guttenberg is 3.0 People.
What is the Average Household Size in Guttenberg
Average Household Size in Guttenberg is 2.4 People.
How Large is the Labor Force in Guttenberg?
There are 6,768 People in the Labor Forcein in Guttenberg.
What is the Percentage of People in the Labor Force in Guttenberg?
70.1% of People are in the Labor Force in Guttenberg.
What is the Unemployment Rate in Guttenberg?
Unemployment Rate in Guttenberg is 8.2%.