Princeton Junction, NJ Map & Demographics
Princeton Junction Map
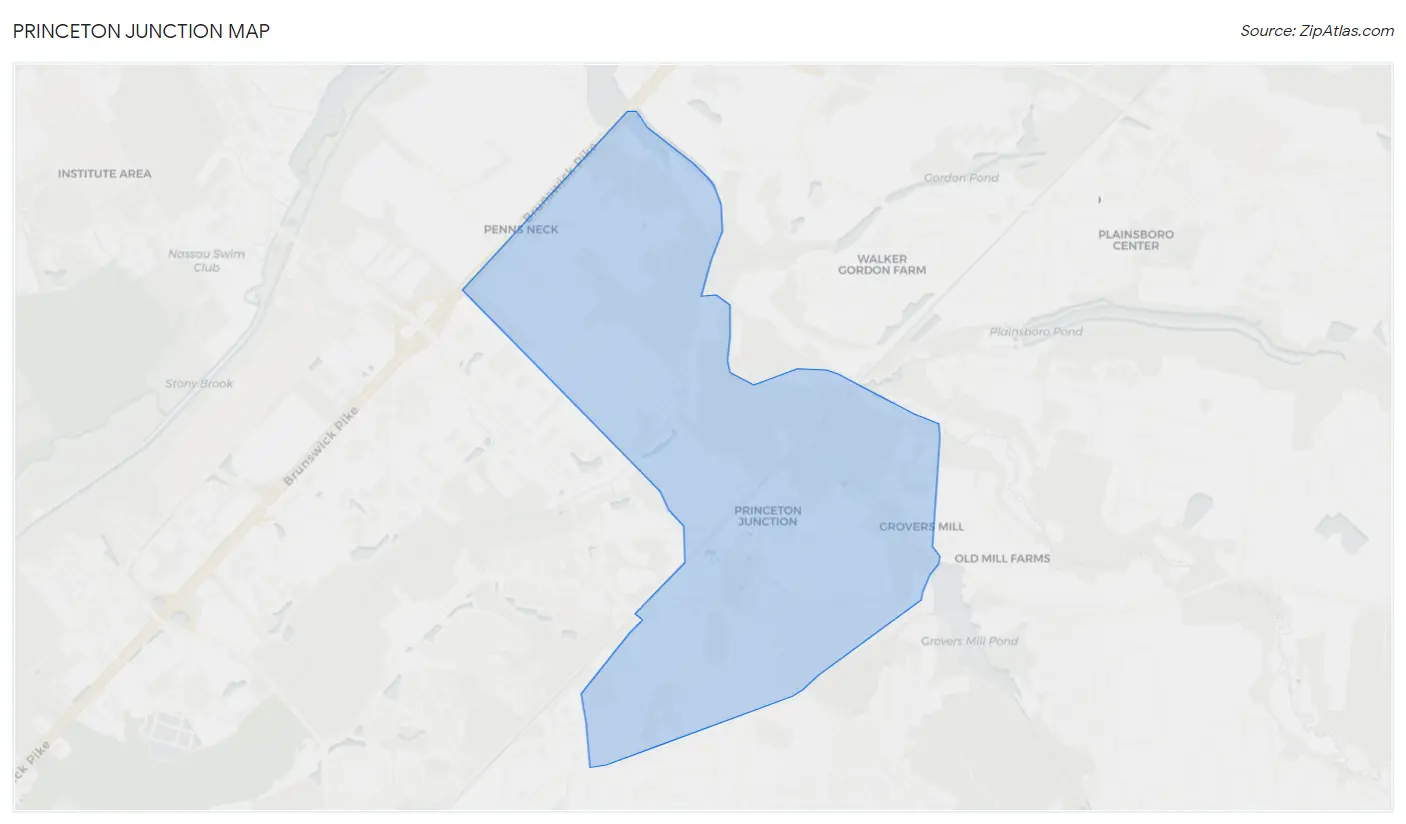
Princeton Junction Overview
$90,679
PER CAPITA INCOME
$250,001
AVG FAMILY INCOME
$209,554
AVG HOUSEHOLD INCOME
45.5%
WAGE / INCOME GAP [ % ]
54.5¢/ $1
WAGE / INCOME GAP [ $ ]
0.40
INEQUALITY / GINI INDEX
2,022
TOTAL POPULATION
1,083
MALE POPULATION
939
FEMALE POPULATION
115.34
MALES / 100 FEMALES
86.70
FEMALES / 100 MALES
51.0
MEDIAN AGE
2.8
AVG FAMILY SIZE
2.4
AVG HOUSEHOLD SIZE
1,246
LABOR FORCE [ PEOPLE ]
76.0%
PERCENT IN LABOR FORCE
7.8%
UNEMPLOYMENT RATE
Princeton Junction Zip Codes
Princeton Junction Area Codes
Income in Princeton Junction
Income Overview in Princeton Junction
Per Capita Income in Princeton Junction is $90,679, while median incomes of families and households are $250,001 and $209,554 respectively.
| Characteristic | Number | Measure |
| Per Capita Income | 2,022 | $90,679 |
| Median Family Income | 643 | $250,001 |
| Mean Family Income | 643 | $270,436 |
| Median Household Income | 841 | $209,554 |
| Mean Household Income | 841 | $217,030 |
| Income Deficit | 643 | $0 |
| Wage / Income Gap (%) | 2,022 | 45.50% |
| Wage / Income Gap ($) | 2,022 | 54.50¢ per $1 |
| Gini / Inequality Index | 2,022 | 0.40 |
Earnings by Sex in Princeton Junction
Average Earnings in Princeton Junction are $110,313, $150,575 for men and $82,065 for women, a difference of 45.5%.
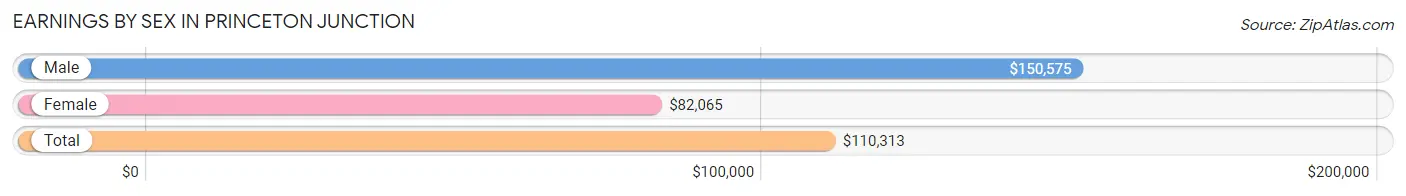
| Sex | Number | Average Earnings |
| Male | 679 (55.4%) | $150,575 |
| Female | 546 (44.6%) | $82,065 |
| Total | 1,225 (100.0%) | $110,313 |
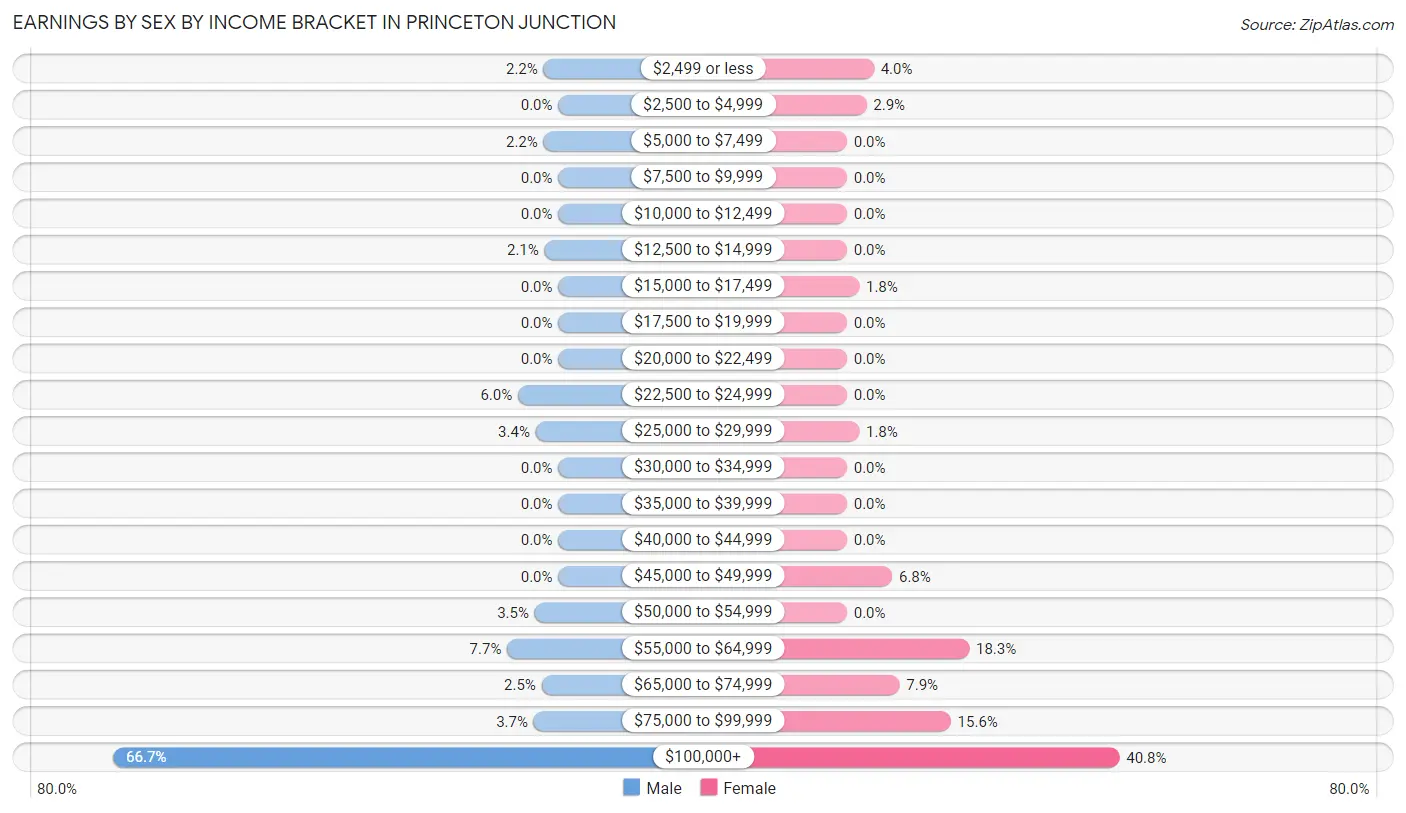
Earnings by Sex by Income Bracket in Princeton Junction
The most common earnings brackets in Princeton Junction are $100,000+ for men (453 | 66.7%) and $100,000+ for women (223 | 40.8%).
| Income | Male | Female |
| $2,499 or less | 15 (2.2%) | 22 (4.0%) |
| $2,500 to $4,999 | 0 (0.0%) | 16 (2.9%) |
| $5,000 to $7,499 | 15 (2.2%) | 0 (0.0%) |
| $7,500 to $9,999 | 0 (0.0%) | 0 (0.0%) |
| $10,000 to $12,499 | 0 (0.0%) | 0 (0.0%) |
| $12,500 to $14,999 | 14 (2.1%) | 0 (0.0%) |
| $15,000 to $17,499 | 0 (0.0%) | 10 (1.8%) |
| $17,500 to $19,999 | 0 (0.0%) | 0 (0.0%) |
| $20,000 to $22,499 | 0 (0.0%) | 0 (0.0%) |
| $22,500 to $24,999 | 41 (6.0%) | 0 (0.0%) |
| $25,000 to $29,999 | 23 (3.4%) | 10 (1.8%) |
| $30,000 to $34,999 | 0 (0.0%) | 0 (0.0%) |
| $35,000 to $39,999 | 0 (0.0%) | 0 (0.0%) |
| $40,000 to $44,999 | 0 (0.0%) | 0 (0.0%) |
| $45,000 to $49,999 | 0 (0.0%) | 37 (6.8%) |
| $50,000 to $54,999 | 24 (3.5%) | 0 (0.0%) |
| $55,000 to $64,999 | 52 (7.7%) | 100 (18.3%) |
| $65,000 to $74,999 | 17 (2.5%) | 43 (7.9%) |
| $75,000 to $99,999 | 25 (3.7%) | 85 (15.6%) |
| $100,000+ | 453 (66.7%) | 223 (40.8%) |
| Total | 679 (100.0%) | 546 (100.0%) |
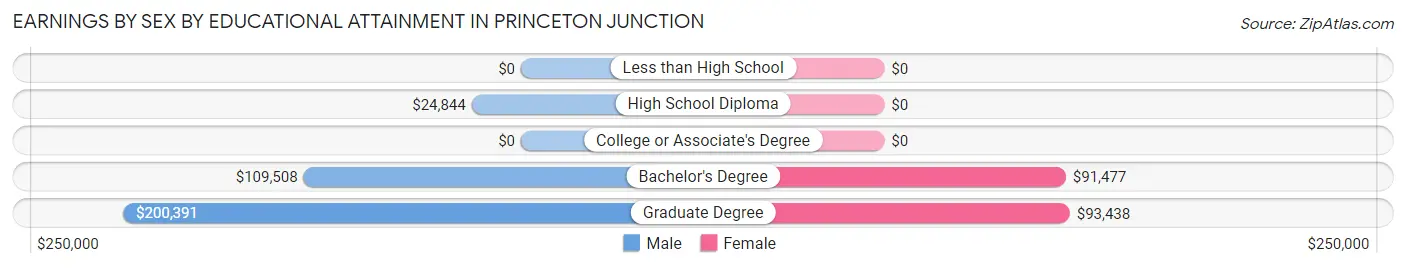
Earnings by Sex by Educational Attainment in Princeton Junction
Average earnings in Princeton Junction are $150,575 for men and $91,000 for women, a difference of 39.6%. Men with an educational attainment of graduate degree enjoy the highest average annual earnings of $200,391, while those with high school diploma education earn the least with $24,844. Women with an educational attainment of graduate degree earn the most with the average annual earnings of $93,438, while those with bachelor's degree education have the smallest earnings of $91,477.
| Educational Attainment | Male Income | Female Income |
| Less than High School | - | - |
| High School Diploma | $24,844 | $0 |
| College or Associate's Degree | - | - |
| Bachelor's Degree | $109,508 | $91,477 |
| Graduate Degree | $200,391 | $93,438 |
| Total | $150,575 | $91,000 |
Family Income in Princeton Junction
Family Income Brackets in Princeton Junction
According to the Princeton Junction family income data, there are 464 families falling into the $200,000+ income range, which is the most common income bracket and makes up 72.2% of all families.
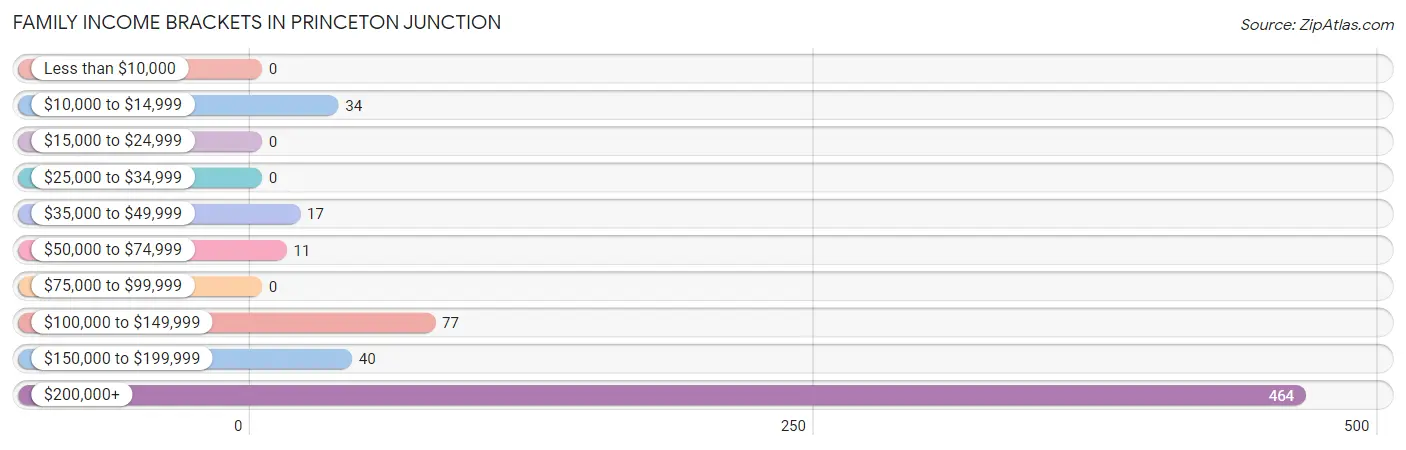
| Income Bracket | # Families | % Families |
| Less than $10,000 | 0 | 0.0% |
| $10,000 to $14,999 | 34 | 5.3% |
| $15,000 to $24,999 | 0 | 0.0% |
| $25,000 to $34,999 | 0 | 0.0% |
| $35,000 to $49,999 | 17 | 2.6% |
| $50,000 to $74,999 | 11 | 1.7% |
| $75,000 to $99,999 | 0 | 0.0% |
| $100,000 to $149,999 | 77 | 12.0% |
| $150,000 to $199,999 | 40 | 6.2% |
| $200,000+ | 464 | 72.2% |
Family Income by Famaliy Size in Princeton Junction
2-person families (333 | 51.8%) account for the highest median family income in Princeton Junction with $250,001 per family, while 2-person families (333 | 51.8%) have the highest median income of $125,000 per family member.
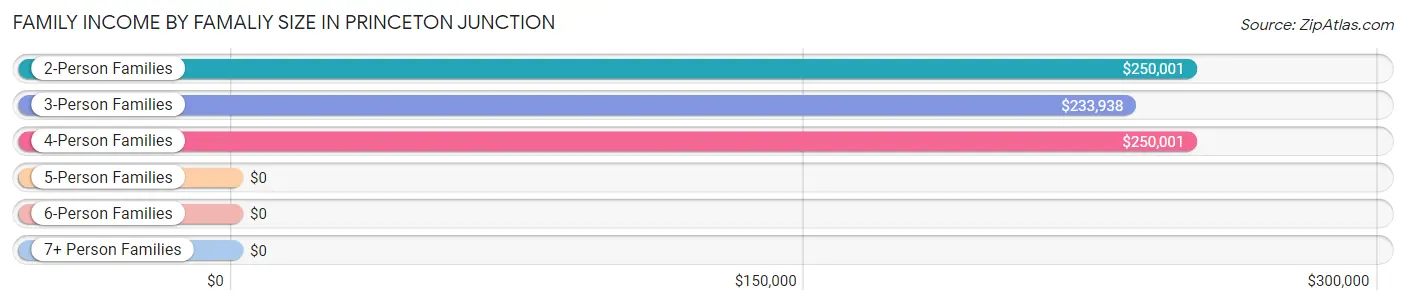
| Income Bracket | # Families | Median Income |
| 2-Person Families | 333 (51.8%) | $250,001 |
| 3-Person Families | 183 (28.5%) | $233,938 |
| 4-Person Families | 110 (17.1%) | $250,001 |
| 5-Person Families | 0 (0.0%) | $0 |
| 6-Person Families | 17 (2.6%) | $0 |
| 7+ Person Families | 0 (0.0%) | $0 |
| Total | 643 (100.0%) | $250,001 |
Family Income by Number of Earners in Princeton Junction
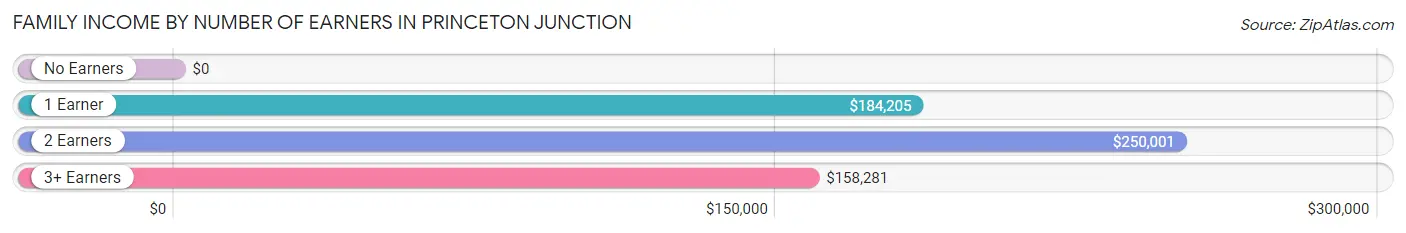
| Number of Earners | # Families | Median Income |
| No Earners | 51 (7.9%) | $0 |
| 1 Earner | 139 (21.6%) | $184,205 |
| 2 Earners | 391 (60.8%) | $250,001 |
| 3+ Earners | 62 (9.6%) | $158,281 |
| Total | 643 (100.0%) | $250,001 |
Household Income in Princeton Junction
Household Income Brackets in Princeton Junction
With 464 households falling in the category, the $200,000+ income range is the most frequent in Princeton Junction, accounting for 55.2% of all households.
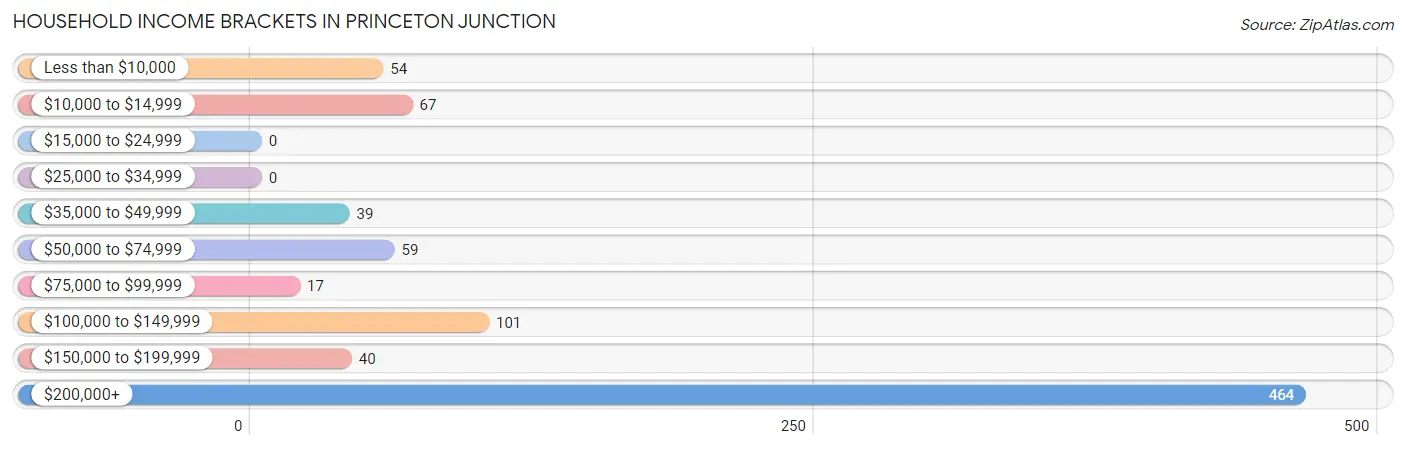
| Income Bracket | # Households | % Households |
| Less than $10,000 | 54 | 6.4% |
| $10,000 to $14,999 | 67 | 8.0% |
| $15,000 to $24,999 | 0 | 0.0% |
| $25,000 to $34,999 | 0 | 0.0% |
| $35,000 to $49,999 | 39 | 4.6% |
| $50,000 to $74,999 | 59 | 7.0% |
| $75,000 to $99,999 | 17 | 2.0% |
| $100,000 to $149,999 | 101 | 12.0% |
| $150,000 to $199,999 | 40 | 4.8% |
| $200,000+ | 464 | 55.2% |
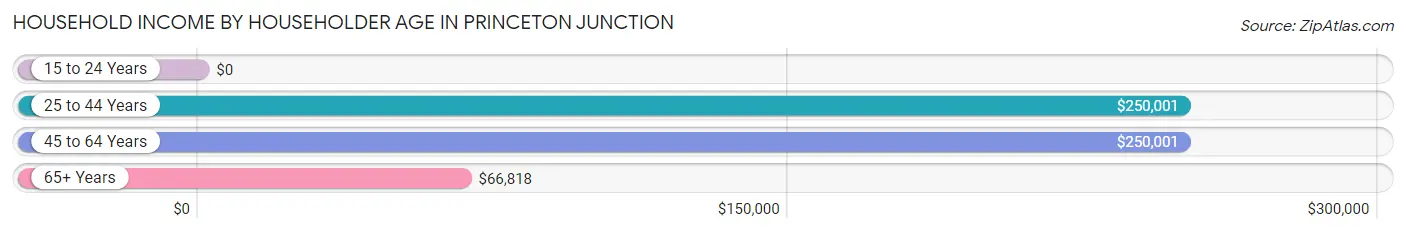
Household Income by Householder Age in Princeton Junction
The median household income in Princeton Junction is $209,554, with the highest median household income of $250,001 found in the 25 to 44 years age bracket for the primary householder. A total of 180 households (21.4%) fall into this category.
| Income Bracket | # Households | Median Income |
| 15 to 24 Years | 0 (0.0%) | $0 |
| 25 to 44 Years | 180 (21.4%) | $250,001 |
| 45 to 64 Years | 487 (57.9%) | $250,001 |
| 65+ Years | 174 (20.7%) | $66,818 |
| Total | 841 (100.0%) | $209,554 |
Poverty in Princeton Junction
Income Below Poverty by Sex and Age in Princeton Junction
With 11.4% poverty level for males and 5.6% for females among the residents of Princeton Junction, 75 year old and over males and 75 year old and over females are the most vulnerable to poverty, with 38 males (42.7%) and 15 females (23.8%) in their respective age groups living below the poverty level.
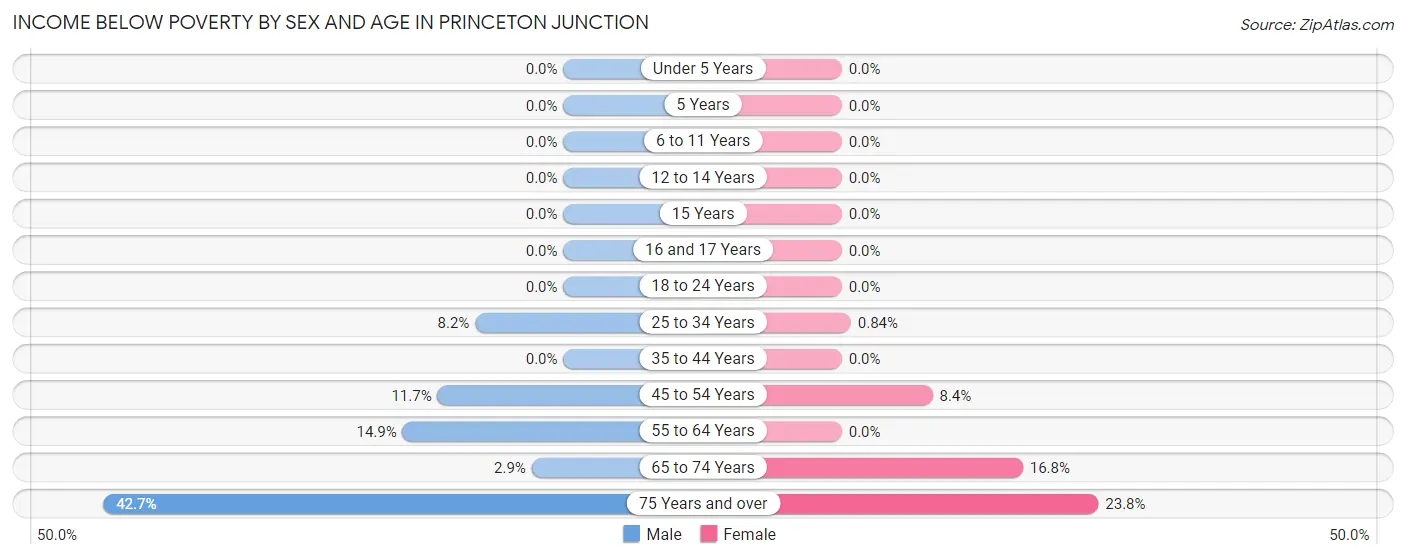
| Age Bracket | Male | Female |
| Under 5 Years | 0 (0.0%) | 0 (0.0%) |
| 5 Years | 0 (0.0%) | 0 (0.0%) |
| 6 to 11 Years | 0 (0.0%) | 0 (0.0%) |
| 12 to 14 Years | 0 (0.0%) | 0 (0.0%) |
| 15 Years | 0 (0.0%) | 0 (0.0%) |
| 16 and 17 Years | 0 (0.0%) | 0 (0.0%) |
| 18 to 24 Years | 0 (0.0%) | 0 (0.0%) |
| 25 to 34 Years | 13 (8.2%) | 1 (0.8%) |
| 35 to 44 Years | 0 (0.0%) | 0 (0.0%) |
| 45 to 54 Years | 16 (11.7%) | 16 (8.4%) |
| 55 to 64 Years | 54 (14.9%) | 0 (0.0%) |
| 65 to 74 Years | 2 (2.9%) | 21 (16.8%) |
| 75 Years and over | 38 (42.7%) | 15 (23.8%) |
| Total | 123 (11.4%) | 53 (5.6%) |
Income Above Poverty by Sex and Age in Princeton Junction
According to the poverty statistics in Princeton Junction, males aged under 5 years and females aged under 5 years are the age groups that are most secure financially, with 100.0% of males and 100.0% of females in these age groups living above the poverty line.
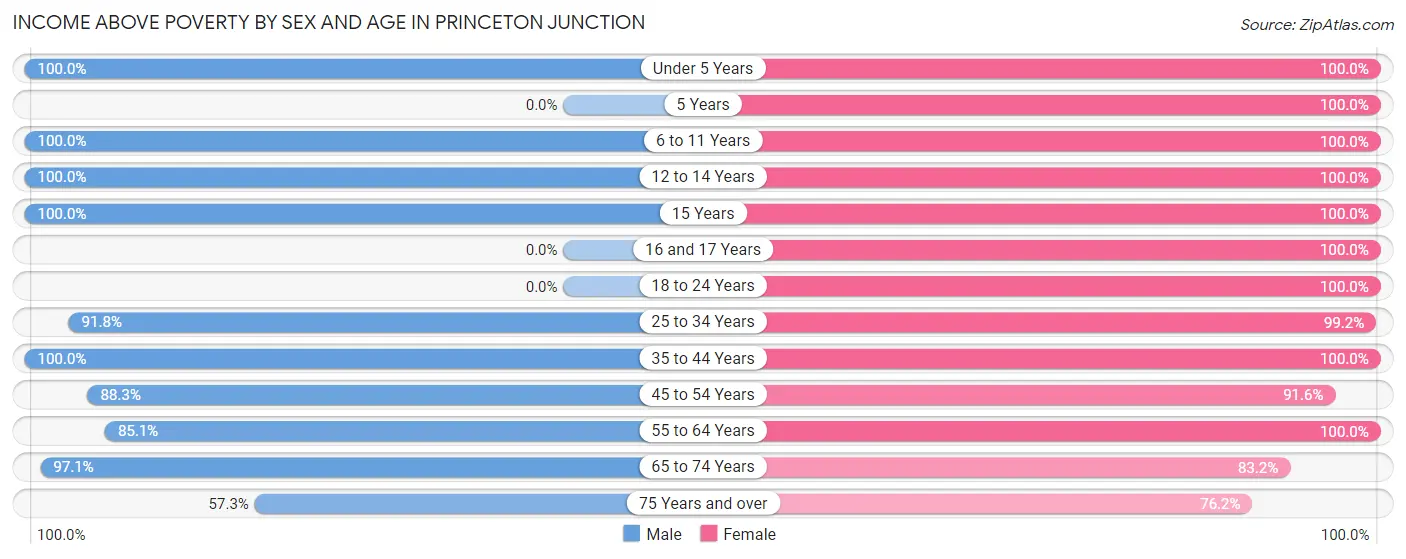
| Age Bracket | Male | Female |
| Under 5 Years | 46 (100.0%) | 40 (100.0%) |
| 5 Years | 0 (0.0%) | 15 (100.0%) |
| 6 to 11 Years | 60 (100.0%) | 43 (100.0%) |
| 12 to 14 Years | 94 (100.0%) | 55 (100.0%) |
| 15 Years | 20 (100.0%) | 10 (100.0%) |
| 16 and 17 Years | 0 (0.0%) | 22 (100.0%) |
| 18 to 24 Years | 0 (0.0%) | 10 (100.0%) |
| 25 to 34 Years | 146 (91.8%) | 118 (99.2%) |
| 35 to 44 Years | 48 (100.0%) | 109 (100.0%) |
| 45 to 54 Years | 121 (88.3%) | 174 (91.6%) |
| 55 to 64 Years | 308 (85.1%) | 138 (100.0%) |
| 65 to 74 Years | 66 (97.1%) | 104 (83.2%) |
| 75 Years and over | 51 (57.3%) | 48 (76.2%) |
| Total | 960 (88.6%) | 886 (94.4%) |
Income Below Poverty Among Married-Couple Families in Princeton Junction
The poverty statistics for married-couple families in Princeton Junction show that 3.4% or 20 of the total 595 families live below the poverty line. Families with no children have the highest poverty rate of 5.3%, comprising of 20 families. On the other hand, families with 1 or 2 children have the lowest poverty rate of 0.0%, which includes 0 families.
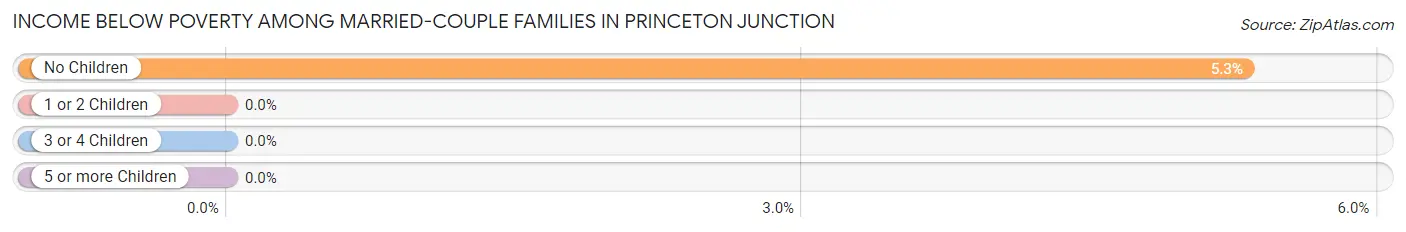
| Children | Above Poverty | Below Poverty |
| No Children | 357 (94.7%) | 20 (5.3%) |
| 1 or 2 Children | 218 (100.0%) | 0 (0.0%) |
| 3 or 4 Children | 0 (0.0%) | 0 (0.0%) |
| 5 or more Children | 0 (0.0%) | 0 (0.0%) |
| Total | 575 (96.6%) | 20 (3.4%) |
Income Below Poverty Among Single-Parent Households in Princeton Junction
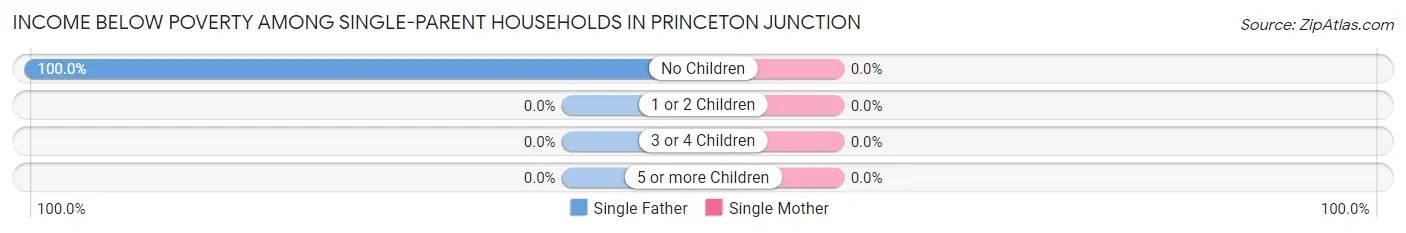
| Children | Single Father | Single Mother |
| No Children | 14 (100.0%) | 0 (0.0%) |
| 1 or 2 Children | 0 (0.0%) | 0 (0.0%) |
| 3 or 4 Children | 0 (0.0%) | 0 (0.0%) |
| 5 or more Children | 0 (0.0%) | 0 (0.0%) |
| Total | 14 (45.2%) | 0 (0.0%) |
Income Below Poverty Among Married-Couple vs Single-Parent Households in Princeton Junction
The poverty data for Princeton Junction shows that 20 of the married-couple family households (3.4%) and 14 of the single-parent households (29.2%) are living below the poverty level. Within the married-couple family households, those with no children have the highest poverty rate, with 20 households (5.3%) falling below the poverty line. Among the single-parent households, those with no children have the highest poverty rate, with 14 household (45.2%) living below poverty.
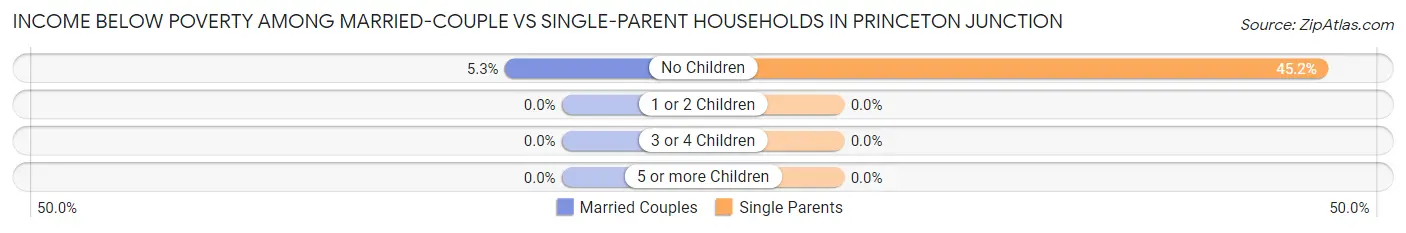
| Children | Married-Couple Families | Single-Parent Households |
| No Children | 20 (5.3%) | 14 (45.2%) |
| 1 or 2 Children | 0 (0.0%) | 0 (0.0%) |
| 3 or 4 Children | 0 (0.0%) | 0 (0.0%) |
| 5 or more Children | 0 (0.0%) | 0 (0.0%) |
| Total | 20 (3.4%) | 14 (29.2%) |
Race in Princeton Junction
The most populous races in Princeton Junction are White / Caucasian (1,277 | 63.2%), Asian (498 | 24.6%), and Two or more Races (156 | 7.7%).
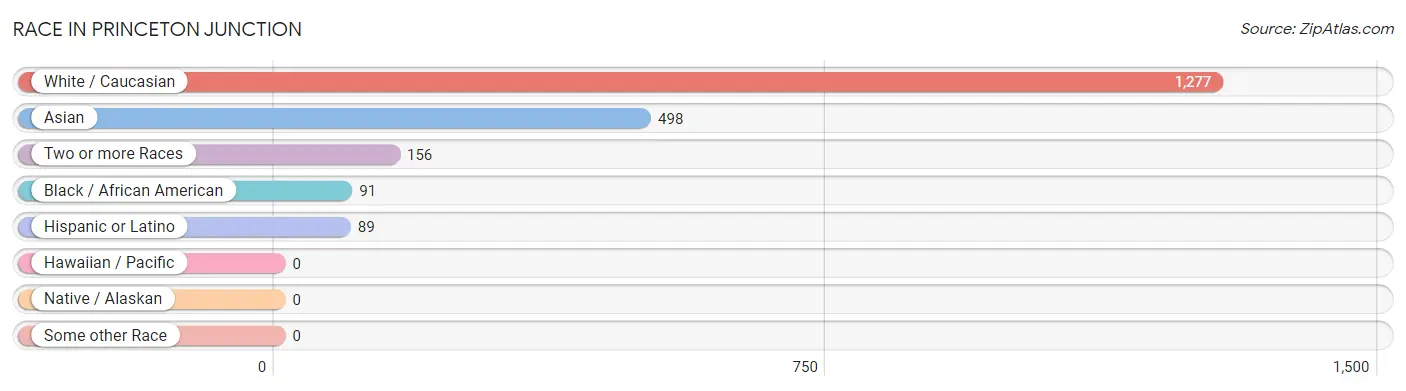
| Race | # Population | % Population |
| Asian | 498 | 24.6% |
| Black / African American | 91 | 4.5% |
| Hawaiian / Pacific | 0 | 0.0% |
| Hispanic or Latino | 89 | 4.4% |
| Native / Alaskan | 0 | 0.0% |
| White / Caucasian | 1,277 | 63.2% |
| Two or more Races | 156 | 7.7% |
| Some other Race | 0 | 0.0% |
| Total | 2,022 | 100.0% |
Ancestry in Princeton Junction
The most populous ancestries reported in Princeton Junction are Thai (361 | 17.8%), Irish (319 | 15.8%), German (202 | 10.0%), Italian (202 | 10.0%), and European (173 | 8.6%), together accounting for 62.2% of all Princeton Junction residents.
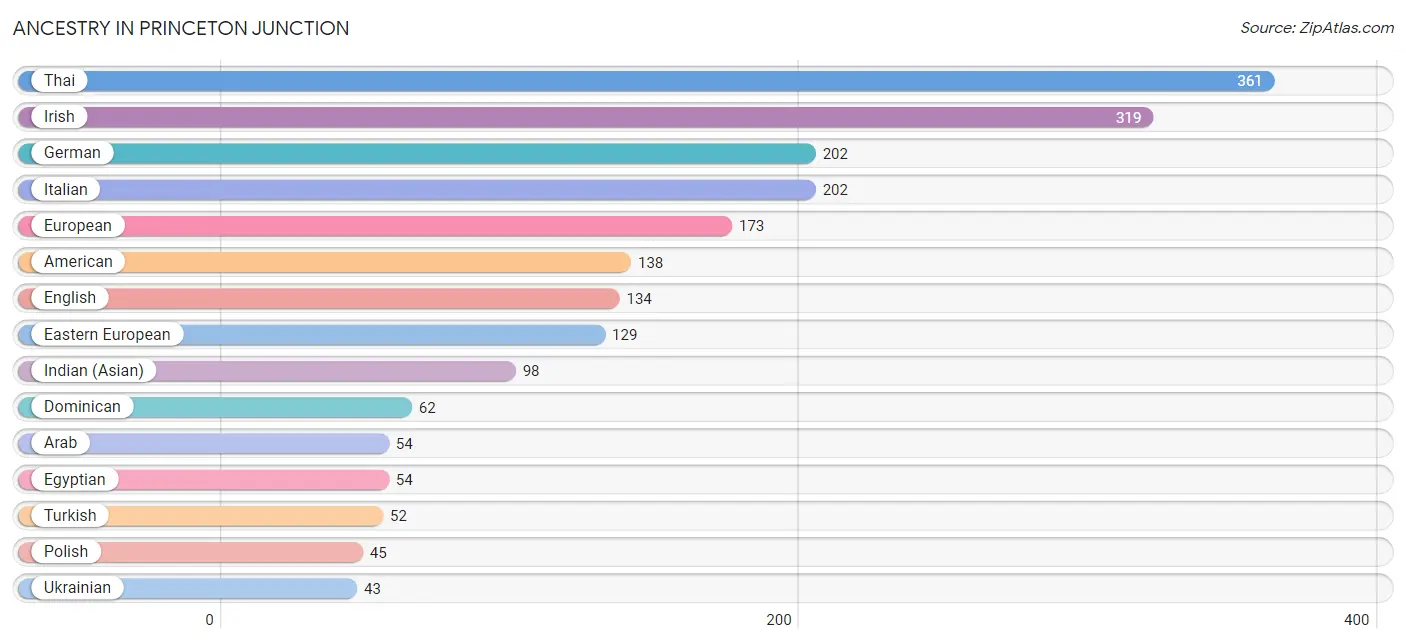
| Ancestry | # Population | % Population |
| American | 138 | 6.8% |
| Arab | 54 | 2.7% |
| Belizean | 27 | 1.3% |
| Burmese | 39 | 1.9% |
| Dominican | 62 | 3.1% |
| Dutch | 32 | 1.6% |
| Eastern European | 129 | 6.4% |
| Egyptian | 54 | 2.7% |
| English | 134 | 6.6% |
| European | 173 | 8.6% |
| French | 42 | 2.1% |
| French Canadian | 20 | 1.0% |
| German | 202 | 10.0% |
| Haitian | 17 | 0.8% |
| Hungarian | 9 | 0.4% |
| Indian (Asian) | 98 | 4.9% |
| Irish | 319 | 15.8% |
| Italian | 202 | 10.0% |
| Lithuanian | 13 | 0.6% |
| Mexican | 27 | 1.3% |
| Polish | 45 | 2.2% |
| Thai | 361 | 17.8% |
| Turkish | 52 | 2.6% |
| Ukrainian | 43 | 2.1% | View All 24 Rows |
Immigrants in Princeton Junction
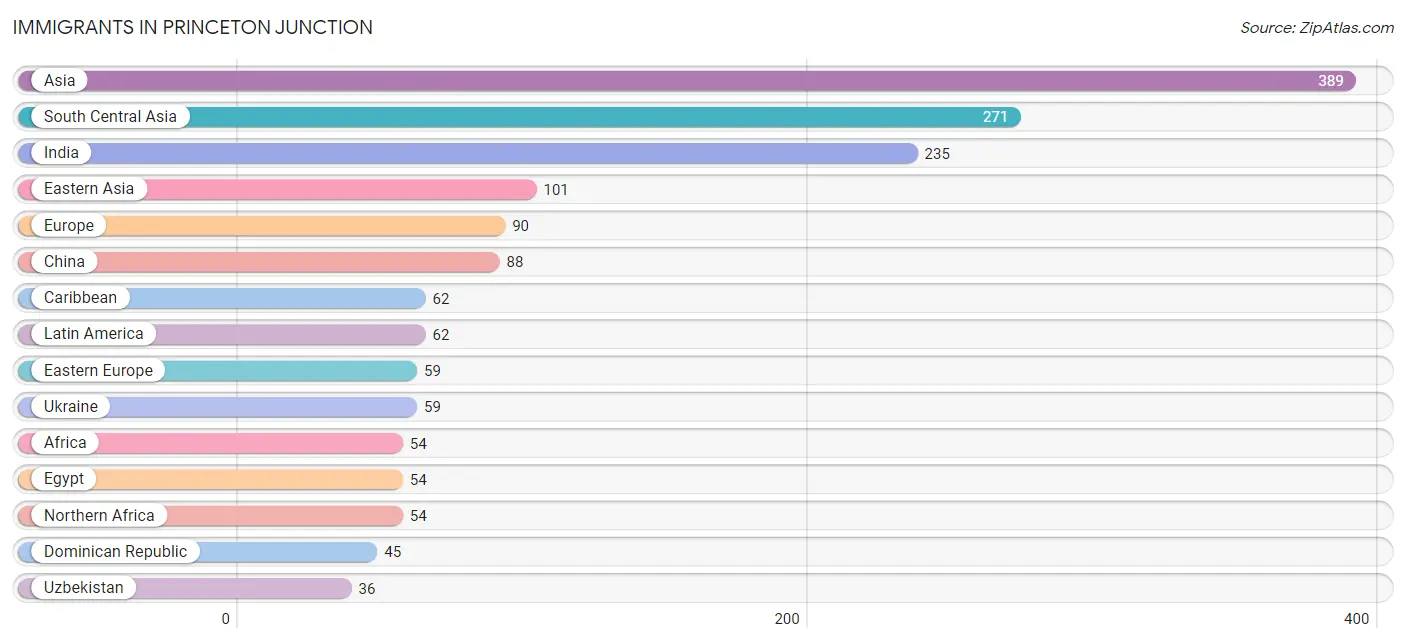
The most numerous immigrant groups reported in Princeton Junction came from Asia (389 | 19.2%), South Central Asia (271 | 13.4%), India (235 | 11.6%), Eastern Asia (101 | 5.0%), and Europe (90 | 4.4%), together accounting for 53.7% of all Princeton Junction residents.
| Immigration Origin | # Population | % Population |
| Africa | 54 | 2.7% |
| Asia | 389 | 19.2% |
| Caribbean | 62 | 3.1% |
| China | 88 | 4.3% |
| Dominican Republic | 45 | 2.2% |
| Eastern Asia | 101 | 5.0% |
| Eastern Europe | 59 | 2.9% |
| Egypt | 54 | 2.7% |
| Europe | 90 | 4.4% |
| Germany | 15 | 0.7% |
| Haiti | 17 | 0.8% |
| India | 235 | 11.6% |
| Korea | 13 | 0.6% |
| Latin America | 62 | 3.1% |
| Northern Africa | 54 | 2.7% |
| Northern Europe | 16 | 0.8% |
| South Central Asia | 271 | 13.4% |
| Taiwan | 18 | 0.9% |
| Turkey | 17 | 0.8% |
| Ukraine | 59 | 2.9% |
| Uzbekistan | 36 | 1.8% |
| Western Asia | 17 | 0.8% |
| Western Europe | 15 | 0.7% | View All 23 Rows |
Sex and Age in Princeton Junction
Sex and Age in Princeton Junction
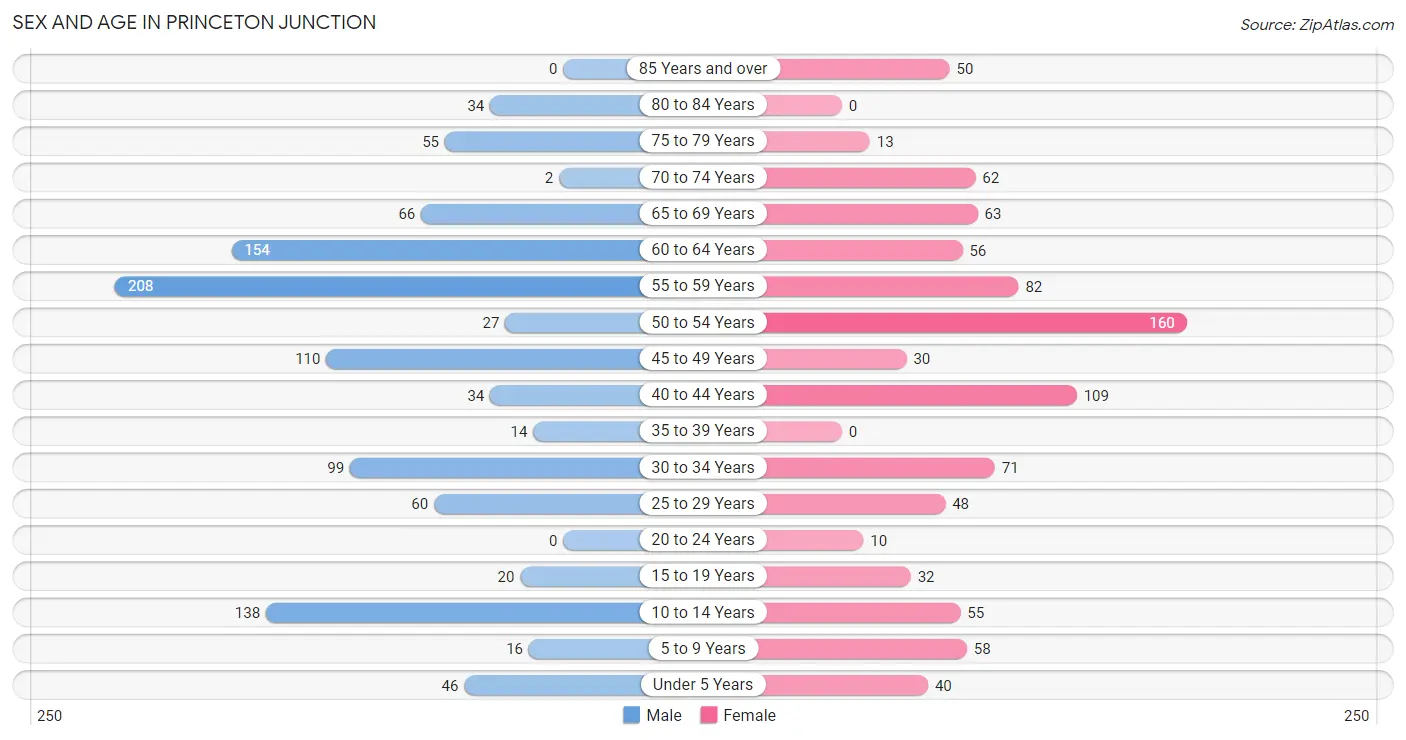
The most populous age groups in Princeton Junction are 55 to 59 Years (208 | 19.2%) for men and 50 to 54 Years (160 | 17.0%) for women.
| Age Bracket | Male | Female |
| Under 5 Years | 46 (4.3%) | 40 (4.3%) |
| 5 to 9 Years | 16 (1.5%) | 58 (6.2%) |
| 10 to 14 Years | 138 (12.7%) | 55 (5.9%) |
| 15 to 19 Years | 20 (1.8%) | 32 (3.4%) |
| 20 to 24 Years | 0 (0.0%) | 10 (1.1%) |
| 25 to 29 Years | 60 (5.5%) | 48 (5.1%) |
| 30 to 34 Years | 99 (9.1%) | 71 (7.6%) |
| 35 to 39 Years | 14 (1.3%) | 0 (0.0%) |
| 40 to 44 Years | 34 (3.1%) | 109 (11.6%) |
| 45 to 49 Years | 110 (10.2%) | 30 (3.2%) |
| 50 to 54 Years | 27 (2.5%) | 160 (17.0%) |
| 55 to 59 Years | 208 (19.2%) | 82 (8.7%) |
| 60 to 64 Years | 154 (14.2%) | 56 (6.0%) |
| 65 to 69 Years | 66 (6.1%) | 63 (6.7%) |
| 70 to 74 Years | 2 (0.2%) | 62 (6.6%) |
| 75 to 79 Years | 55 (5.1%) | 13 (1.4%) |
| 80 to 84 Years | 34 (3.1%) | 0 (0.0%) |
| 85 Years and over | 0 (0.0%) | 50 (5.3%) |
| Total | 1,083 (100.0%) | 939 (100.0%) |
Families and Households in Princeton Junction
Median Family Size in Princeton Junction
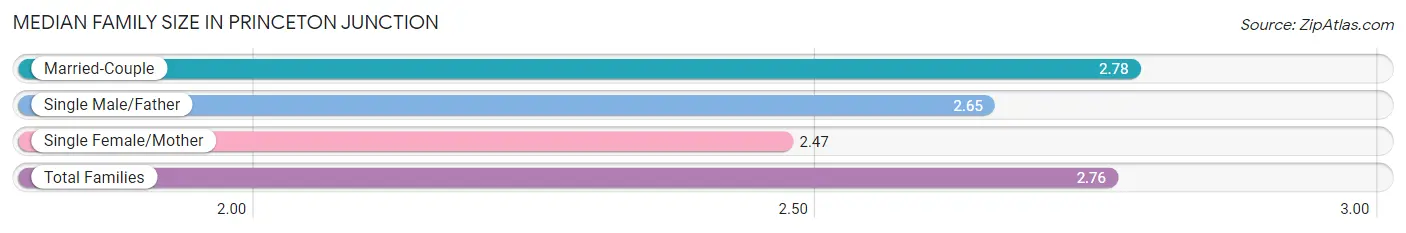
The median family size in Princeton Junction is 2.76 persons per family, with married-couple families (595 | 92.5%) accounting for the largest median family size of 2.78 persons per family. On the other hand, single female/mother families (17 | 2.6%) represent the smallest median family size with 2.47 persons per family.
| Family Type | # Families | Family Size |
| Married-Couple | 595 (92.5%) | 2.78 |
| Single Male/Father | 31 (4.8%) | 2.65 |
| Single Female/Mother | 17 (2.6%) | 2.47 |
| Total Families | 643 (100.0%) | 2.76 |
Median Household Size in Princeton Junction
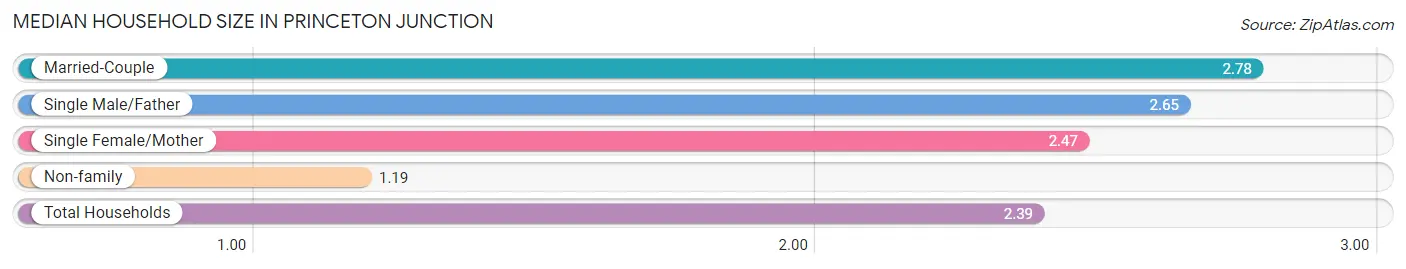
The median household size in Princeton Junction is 2.39 persons per household, with married-couple households (595 | 70.8%) accounting for the largest median household size of 2.78 persons per household. non-family households (198 | 23.5%) represent the smallest median household size with 1.19 persons per household.
| Household Type | # Households | Household Size |
| Married-Couple | 595 (70.8%) | 2.78 |
| Single Male/Father | 31 (3.7%) | 2.65 |
| Single Female/Mother | 17 (2.0%) | 2.47 |
| Non-family | 198 (23.5%) | 1.19 |
| Total Households | 841 (100.0%) | 2.39 |
Household Size by Marriage Status in Princeton Junction
Out of a total of 841 households in Princeton Junction, 643 (76.5%) are family households, while 198 (23.5%) are nonfamily households. The most numerous type of family households are 2-person households, comprising 333, and the most common type of nonfamily households are 1-person households, comprising 161.
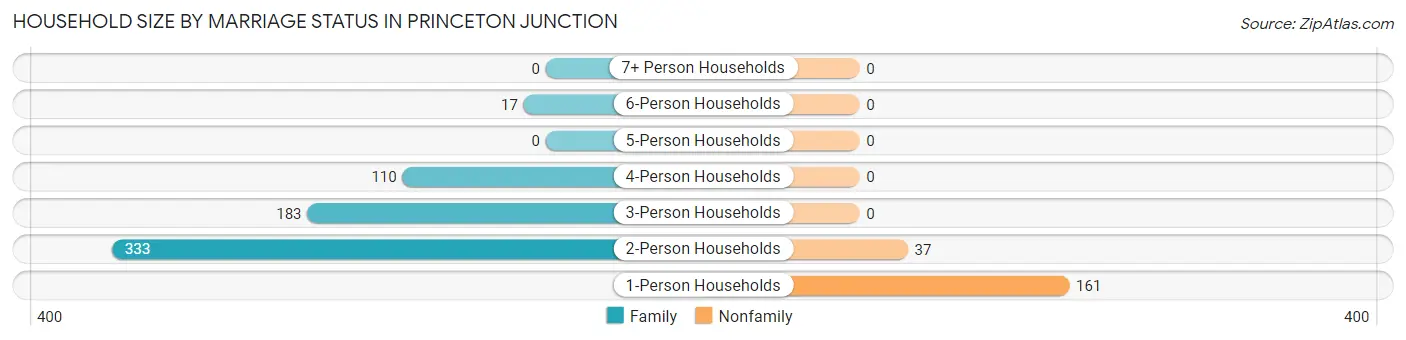
| Household Size | Family Households | Nonfamily Households |
| 1-Person Households | - | 161 (19.1%) |
| 2-Person Households | 333 (39.6%) | 37 (4.4%) |
| 3-Person Households | 183 (21.8%) | 0 (0.0%) |
| 4-Person Households | 110 (13.1%) | 0 (0.0%) |
| 5-Person Households | 0 (0.0%) | 0 (0.0%) |
| 6-Person Households | 17 (2.0%) | 0 (0.0%) |
| 7+ Person Households | 0 (0.0%) | 0 (0.0%) |
| Total | 643 (76.5%) | 198 (23.5%) |
Female Fertility in Princeton Junction
Fertility by Age in Princeton Junction
Average fertility rate in Princeton Junction is 48.0 births per 1,000 women. Women in the age bracket of 20 to 34 years have the highest fertility rate with 116.0 births per 1,000 women. Women in the age bracket of 20 to 34 years acount for 100.0% of all women with births.
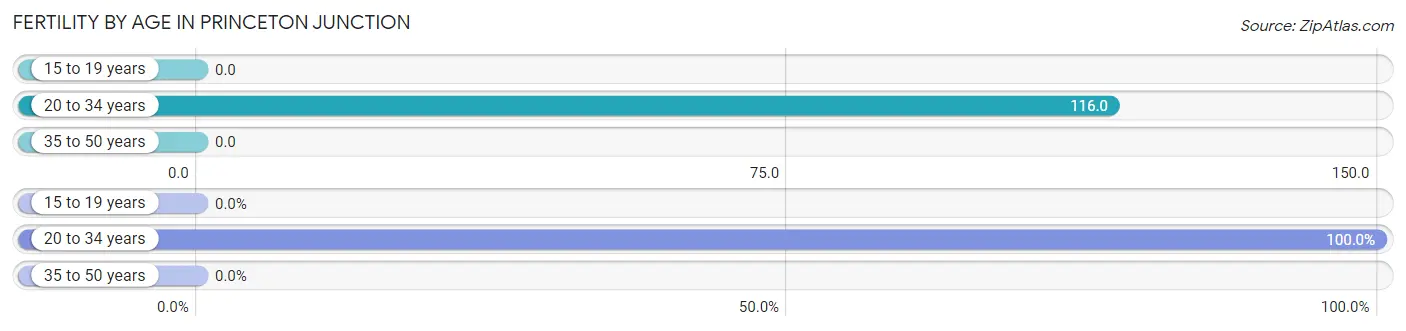
| Age Bracket | Women with Births | Births / 1,000 Women |
| 15 to 19 years | 0 (0.0%) | 0.0 |
| 20 to 34 years | 15 (100.0%) | 116.0 |
| 35 to 50 years | 0 (0.0%) | 0.0 |
| Total | 15 (100.0%) | 48.0 |
Fertility by Age by Marriage Status in Princeton Junction
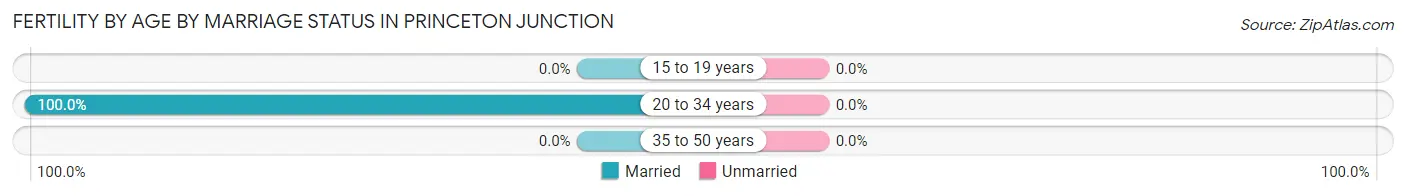
| Age Bracket | Married | Unmarried |
| 15 to 19 years | 0 (0.0%) | 0 (0.0%) |
| 20 to 34 years | 15 (100.0%) | 0 (0.0%) |
| 35 to 50 years | 0 (0.0%) | 0 (0.0%) |
| Total | 15 (100.0%) | 0 (0.0%) |
Fertility by Education in Princeton Junction
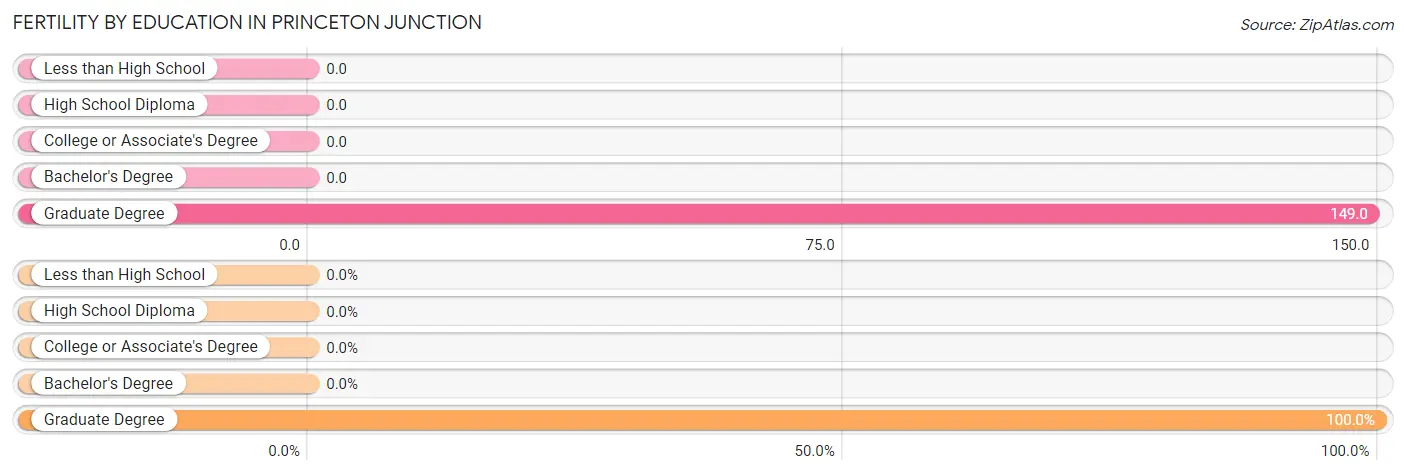
| Educational Attainment | Women with Births | Births / 1,000 Women |
| Less than High School | 0 (0.0%) | 0.0 |
| High School Diploma | 0 (0.0%) | 0.0 |
| College or Associate's Degree | 0 (0.0%) | 0.0 |
| Bachelor's Degree | 0 (0.0%) | 0.0 |
| Graduate Degree | 15 (100.0%) | 149.0 |
| Total | 15 (100.0%) | 48.0 |
Fertility by Education by Marriage Status in Princeton Junction
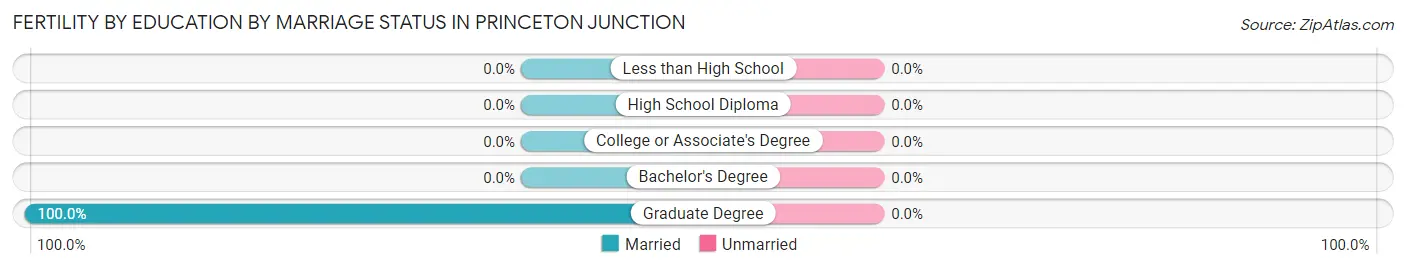
| Educational Attainment | Married | Unmarried |
| Less than High School | 0 (0.0%) | 0 (0.0%) |
| High School Diploma | 0 (0.0%) | 0 (0.0%) |
| College or Associate's Degree | 0 (0.0%) | 0 (0.0%) |
| Bachelor's Degree | 0 (0.0%) | 0 (0.0%) |
| Graduate Degree | 15 (100.0%) | 0 (0.0%) |
| Total | 15 (100.0%) | 0 (0.0%) |
Employment Characteristics in Princeton Junction
Employment by Class of Employer in Princeton Junction
Among the 1,148 employed individuals in Princeton Junction, private company employees (657 | 57.2%), not-for-profit organizations (340 | 29.6%), and self-employed (incorporated) (69 | 6.0%) make up the most common classes of employment.
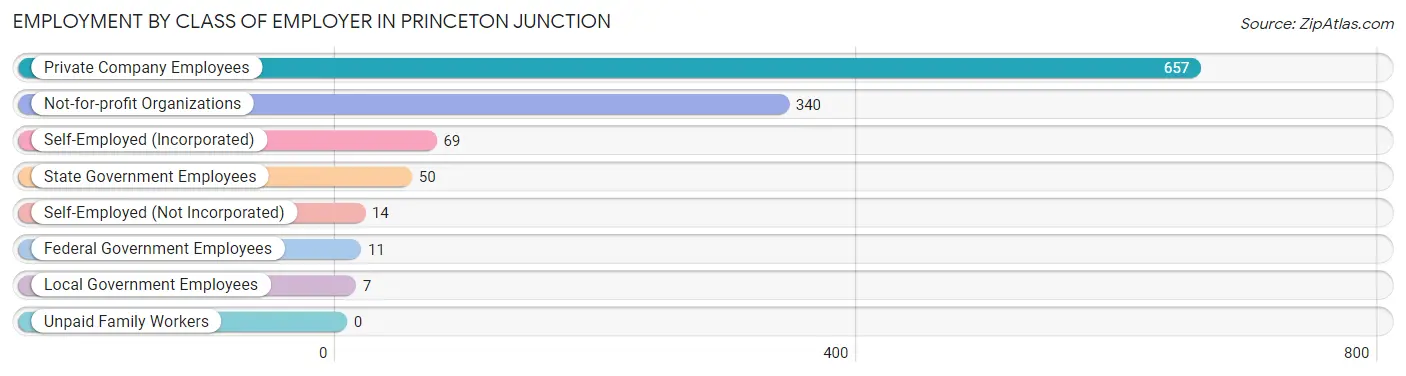
| Employer Class | # Employees | % Employees |
| Private Company Employees | 657 | 57.2% |
| Self-Employed (Incorporated) | 69 | 6.0% |
| Self-Employed (Not Incorporated) | 14 | 1.2% |
| Not-for-profit Organizations | 340 | 29.6% |
| Local Government Employees | 7 | 0.6% |
| State Government Employees | 50 | 4.4% |
| Federal Government Employees | 11 | 1.0% |
| Unpaid Family Workers | 0 | 0.0% |
| Total | 1,148 | 100.0% |
Employment Status by Age in Princeton Junction
According to the labor force statistics for Princeton Junction, out of the total population over 16 years of age (1,639), 76.0% or 1,246 individuals are in the labor force, with 7.8% or 97 of them unemployed. The age group with the highest labor force participation rate is 20 to 24 years, with 100.0% or 10 individuals in the labor force. Within the labor force, the 65 to 74 years age range has the highest percentage of unemployed individuals, with 36.1% or 26 of them being unemployed.
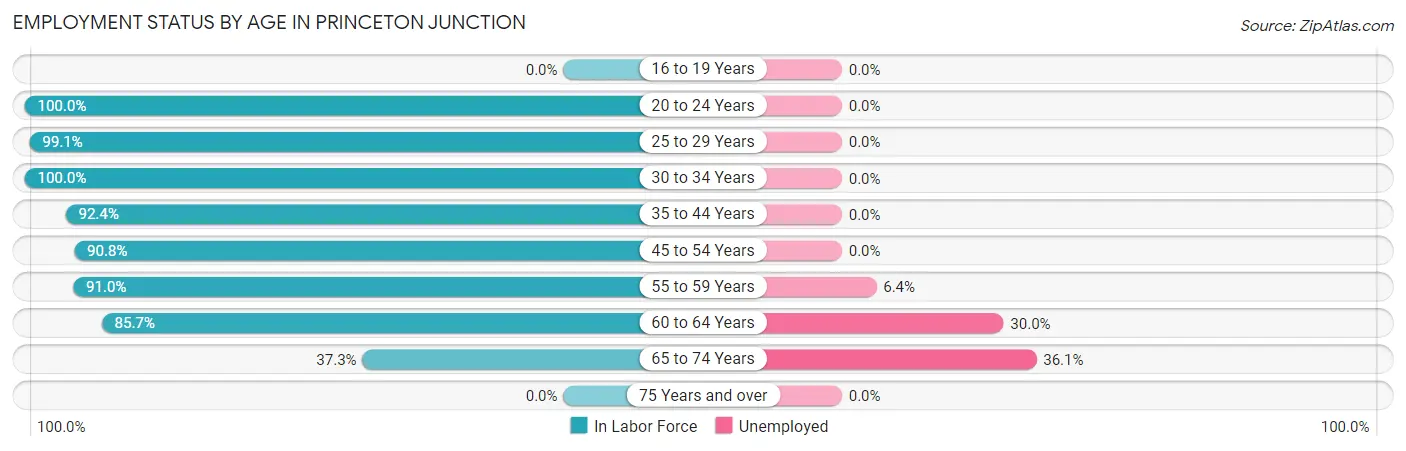
| Age Bracket | In Labor Force | Unemployed |
| 16 to 19 Years | 0 (0.0%) | 0 (0.0%) |
| 20 to 24 Years | 10 (100.0%) | 0 (0.0%) |
| 25 to 29 Years | 107 (99.1%) | 0 (0.0%) |
| 30 to 34 Years | 170 (100.0%) | 0 (0.0%) |
| 35 to 44 Years | 145 (92.4%) | 0 (0.0%) |
| 45 to 54 Years | 297 (90.8%) | 0 (0.0%) |
| 55 to 59 Years | 264 (91.0%) | 17 (6.4%) |
| 60 to 64 Years | 180 (85.7%) | 54 (30.0%) |
| 65 to 74 Years | 72 (37.3%) | 26 (36.1%) |
| 75 Years and over | 0 (0.0%) | 0 (0.0%) |
| Total | 1,246 (76.0%) | 97 (7.8%) |
Employment Status by Educational Attainment in Princeton Junction
According to labor force statistics for Princeton Junction, 92.2% of individuals (1,164) out of the total population between 25 and 64 years of age (1,262) are in the labor force, with 6.1% or 71 of them being unemployed. The group with the highest labor force participation rate are those with the educational attainment of bachelor's degree or higher, with 96.5% or 1,081 individuals in the labor force. Within the labor force, individuals with bachelor's degree or higher education have the highest percentage of unemployment, with 6.6% or 71 of them being unemployed.
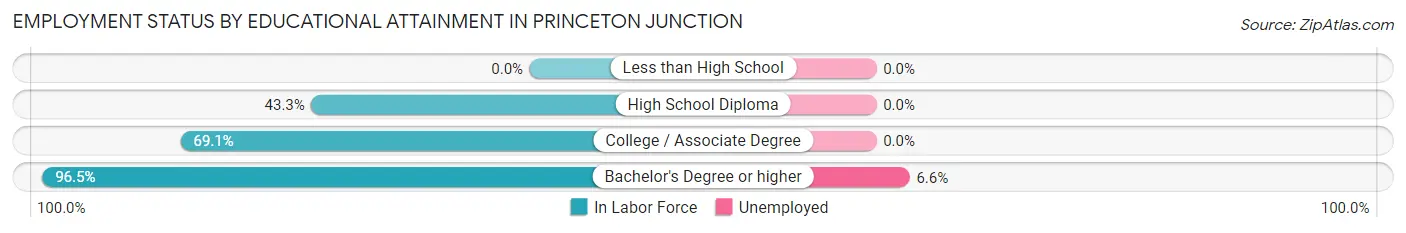
| Educational Attainment | In Labor Force | Unemployed |
| Less than High School | 0 (0.0%) | 0 (0.0%) |
| High School Diploma | 26 (43.3%) | 0 (0.0%) |
| College / Associate Degree | 56 (69.1%) | 0 (0.0%) |
| Bachelor's Degree or higher | 1,081 (96.5%) | 74 (6.6%) |
| Total | 1,164 (92.2%) | 77 (6.1%) |
Employment Occupations by Sex in Princeton Junction
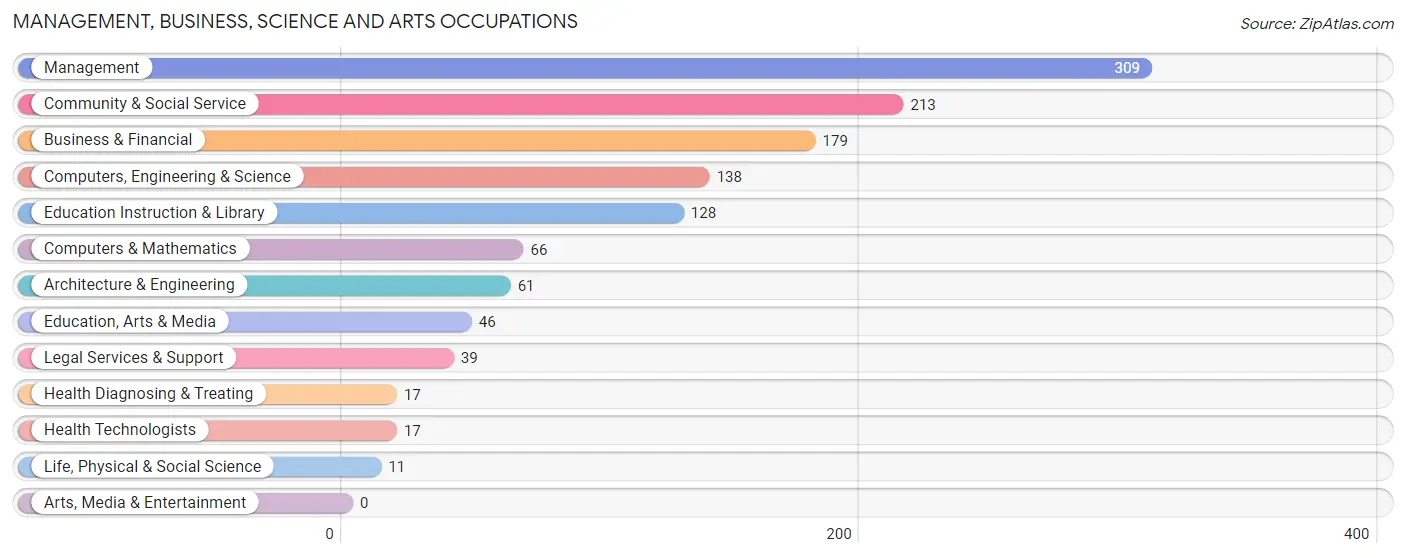
Management, Business, Science and Arts Occupations
The most common Management, Business, Science and Arts occupations in Princeton Junction are Management (309 | 26.9%), Community & Social Service (213 | 18.5%), Business & Financial (179 | 15.6%), Computers, Engineering & Science (138 | 12.0%), and Education Instruction & Library (128 | 11.2%).
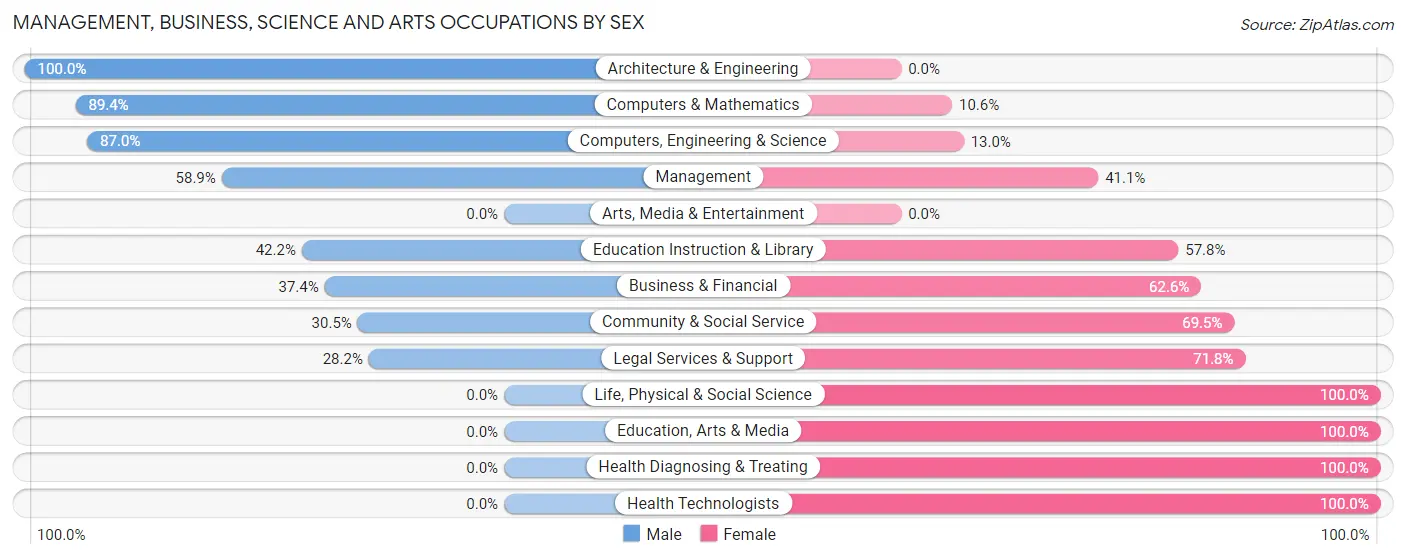
Management, Business, Science and Arts Occupations by Sex
Within the Management, Business, Science and Arts occupations in Princeton Junction, the most male-oriented occupations are Architecture & Engineering (100.0%), Computers & Mathematics (89.4%), and Computers, Engineering & Science (87.0%), while the most female-oriented occupations are Life, Physical & Social Science (100.0%), Education, Arts & Media (100.0%), and Health Diagnosing & Treating (100.0%).
| Occupation | Male | Female |
| Management | 182 (58.9%) | 127 (41.1%) |
| Business & Financial | 67 (37.4%) | 112 (62.6%) |
| Computers, Engineering & Science | 120 (87.0%) | 18 (13.0%) |
| Computers & Mathematics | 59 (89.4%) | 7 (10.6%) |
| Architecture & Engineering | 61 (100.0%) | 0 (0.0%) |
| Life, Physical & Social Science | 0 (0.0%) | 11 (100.0%) |
| Community & Social Service | 65 (30.5%) | 148 (69.5%) |
| Education, Arts & Media | 0 (0.0%) | 46 (100.0%) |
| Legal Services & Support | 11 (28.2%) | 28 (71.8%) |
| Education Instruction & Library | 54 (42.2%) | 74 (57.8%) |
| Arts, Media & Entertainment | 0 (0.0%) | 0 (0.0%) |
| Health Diagnosing & Treating | 0 (0.0%) | 17 (100.0%) |
| Health Technologists | 0 (0.0%) | 17 (100.0%) |
| Total (Category) | 434 (50.7%) | 422 (49.3%) |
| Total (Overall) | 624 (54.4%) | 524 (45.6%) |
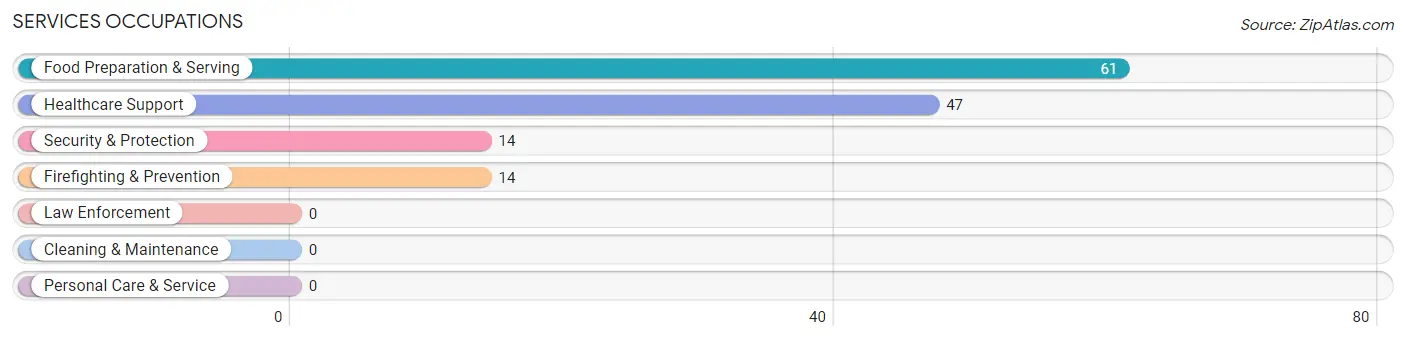
Services Occupations
The most common Services occupations in Princeton Junction are Food Preparation & Serving (61 | 5.3%), Healthcare Support (47 | 4.1%), Security & Protection (14 | 1.2%), and Firefighting & Prevention (14 | 1.2%).
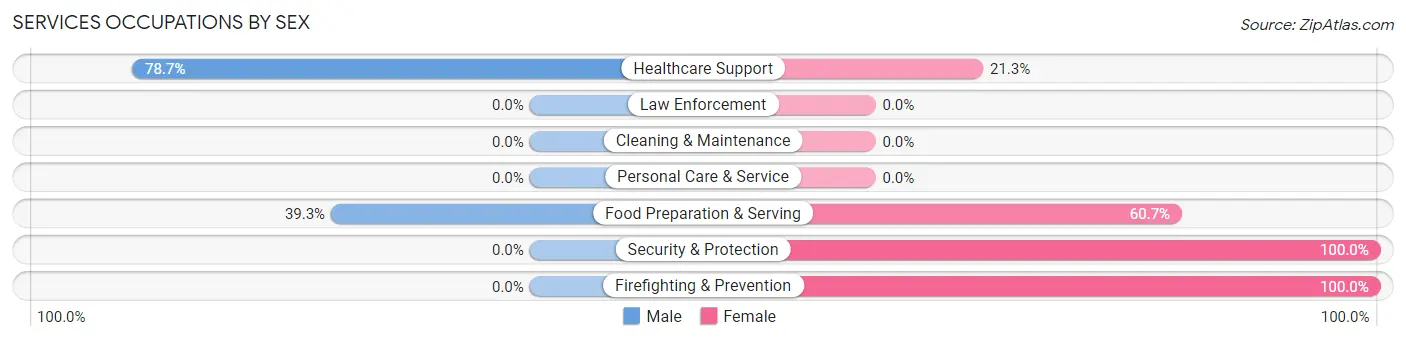
Services Occupations by Sex
Within the Services occupations in Princeton Junction, the most male-oriented occupations are Healthcare Support (78.7%), and Food Preparation & Serving (39.3%), while the most female-oriented occupations are Security & Protection (100.0%), Firefighting & Prevention (100.0%), and Food Preparation & Serving (60.7%).
| Occupation | Male | Female |
| Healthcare Support | 37 (78.7%) | 10 (21.3%) |
| Security & Protection | 0 (0.0%) | 14 (100.0%) |
| Firefighting & Prevention | 0 (0.0%) | 14 (100.0%) |
| Law Enforcement | 0 (0.0%) | 0 (0.0%) |
| Food Preparation & Serving | 24 (39.3%) | 37 (60.7%) |
| Cleaning & Maintenance | 0 (0.0%) | 0 (0.0%) |
| Personal Care & Service | 0 (0.0%) | 0 (0.0%) |
| Total (Category) | 61 (50.0%) | 61 (50.0%) |
| Total (Overall) | 624 (54.4%) | 524 (45.6%) |
Sales and Office Occupations
The most common Sales and Office occupations in Princeton Junction are Sales & Related (100 | 8.7%), and Office & Administration (35 | 3.0%).
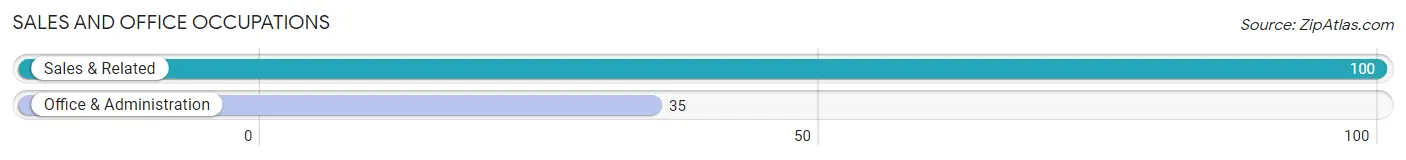
Sales and Office Occupations by Sex

| Occupation | Male | Female |
| Sales & Related | 100 (100.0%) | 0 (0.0%) |
| Office & Administration | 13 (37.1%) | 22 (62.9%) |
| Total (Category) | 113 (83.7%) | 22 (16.3%) |
| Total (Overall) | 624 (54.4%) | 524 (45.6%) |
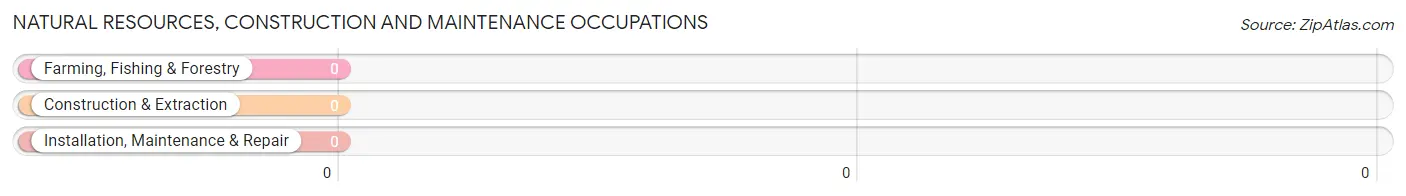
Natural Resources, Construction and Maintenance Occupations
Natural Resources, Construction and Maintenance Occupations by Sex
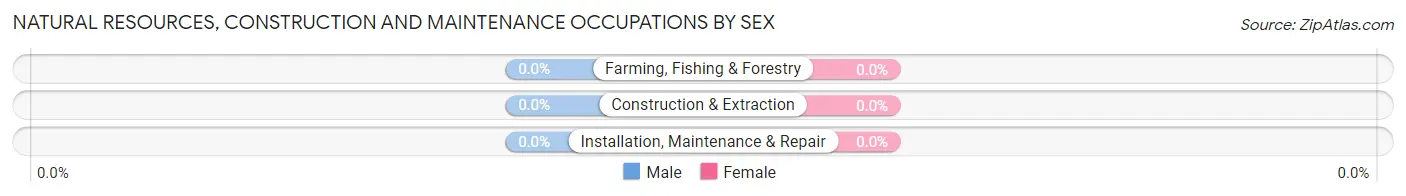
| Occupation | Male | Female |
| Farming, Fishing & Forestry | 0 (0.0%) | 0 (0.0%) |
| Construction & Extraction | 0 (0.0%) | 0 (0.0%) |
| Installation, Maintenance & Repair | 0 (0.0%) | 0 (0.0%) |
| Total (Category) | 0 (0.0%) | 0 (0.0%) |
| Total (Overall) | 624 (54.4%) | 524 (45.6%) |
Production, Transportation and Moving Occupations
The most common Production, Transportation and Moving occupations in Princeton Junction are , and Production (35 | 3.0%).
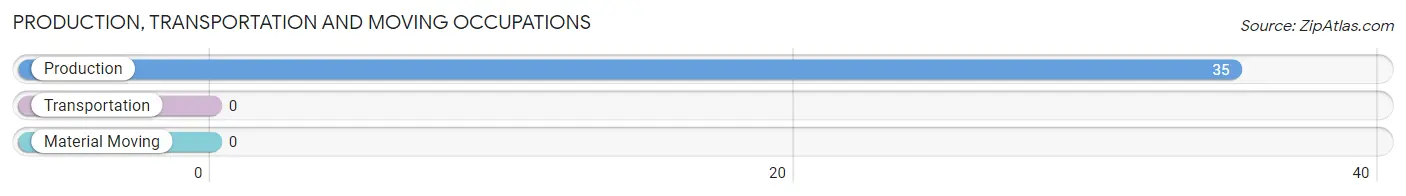
Production, Transportation and Moving Occupations by Sex
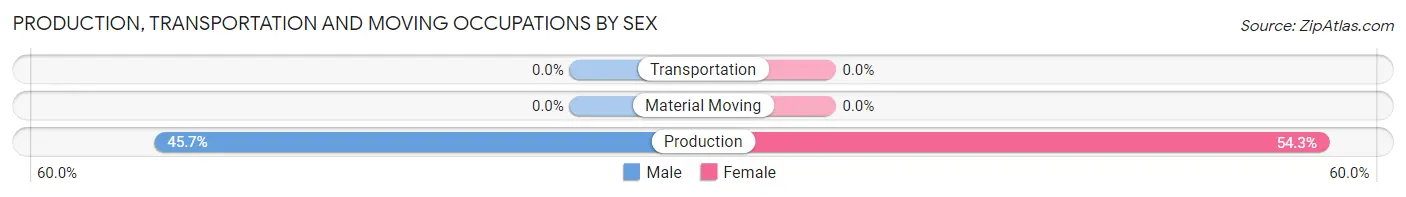
| Occupation | Male | Female |
| Production | 16 (45.7%) | 19 (54.3%) |
| Transportation | 0 (0.0%) | 0 (0.0%) |
| Material Moving | 0 (0.0%) | 0 (0.0%) |
| Total (Category) | 16 (45.7%) | 19 (54.3%) |
| Total (Overall) | 624 (54.4%) | 524 (45.6%) |
Employment Industries by Sex in Princeton Junction
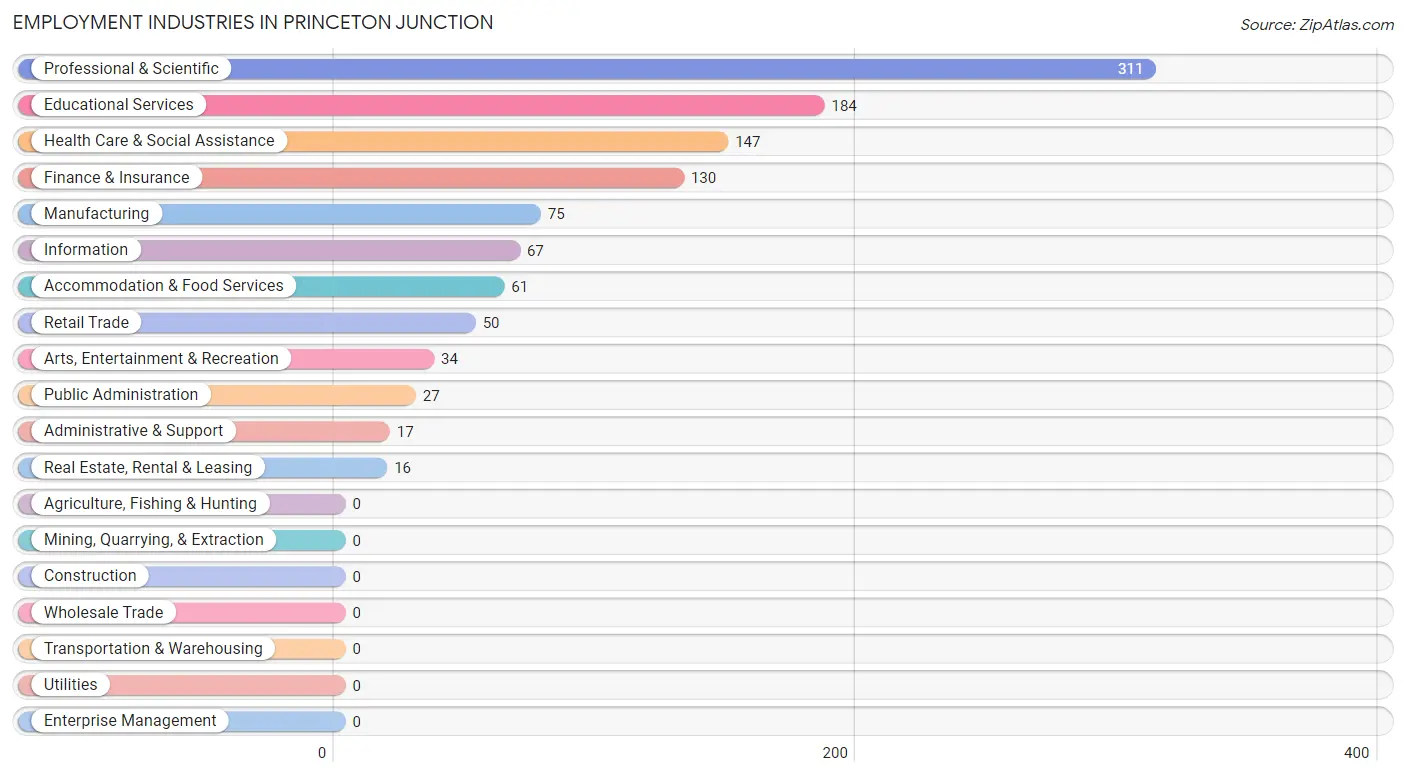
Employment Industries in Princeton Junction
The major employment industries in Princeton Junction include Professional & Scientific (311 | 27.1%), Educational Services (184 | 16.0%), Health Care & Social Assistance (147 | 12.8%), Finance & Insurance (130 | 11.3%), and Manufacturing (75 | 6.5%).
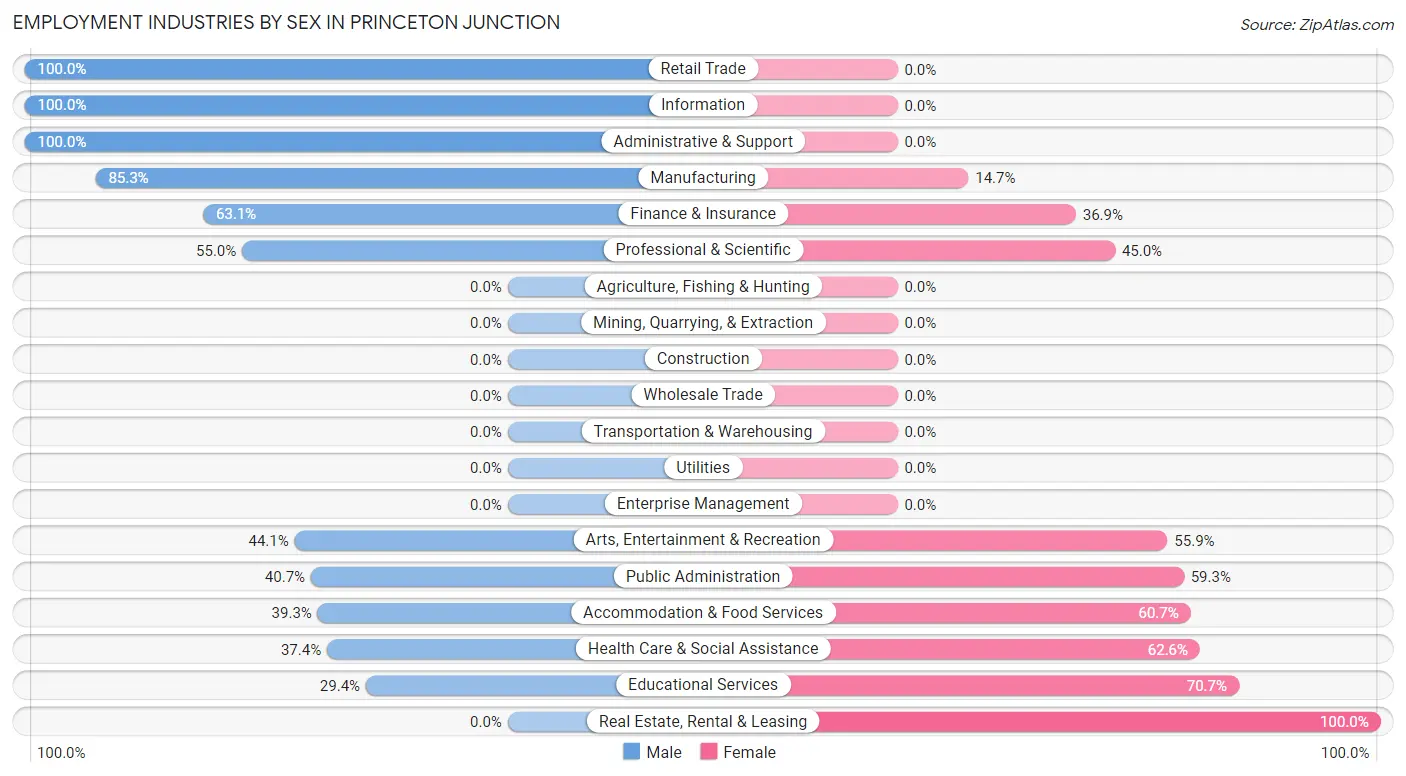
Employment Industries by Sex in Princeton Junction
The Princeton Junction industries that see more men than women are Retail Trade (100.0%), Information (100.0%), and Administrative & Support (100.0%), whereas the industries that tend to have a higher number of women are Real Estate, Rental & Leasing (100.0%), Educational Services (70.7%), and Health Care & Social Assistance (62.6%).
| Industry | Male | Female |
| Agriculture, Fishing & Hunting | 0 (0.0%) | 0 (0.0%) |
| Mining, Quarrying, & Extraction | 0 (0.0%) | 0 (0.0%) |
| Construction | 0 (0.0%) | 0 (0.0%) |
| Manufacturing | 64 (85.3%) | 11 (14.7%) |
| Wholesale Trade | 0 (0.0%) | 0 (0.0%) |
| Retail Trade | 50 (100.0%) | 0 (0.0%) |
| Transportation & Warehousing | 0 (0.0%) | 0 (0.0%) |
| Utilities | 0 (0.0%) | 0 (0.0%) |
| Information | 67 (100.0%) | 0 (0.0%) |
| Finance & Insurance | 82 (63.1%) | 48 (36.9%) |
| Real Estate, Rental & Leasing | 0 (0.0%) | 16 (100.0%) |
| Professional & Scientific | 171 (55.0%) | 140 (45.0%) |
| Enterprise Management | 0 (0.0%) | 0 (0.0%) |
| Administrative & Support | 17 (100.0%) | 0 (0.0%) |
| Educational Services | 54 (29.3%) | 130 (70.7%) |
| Health Care & Social Assistance | 55 (37.4%) | 92 (62.6%) |
| Arts, Entertainment & Recreation | 15 (44.1%) | 19 (55.9%) |
| Accommodation & Food Services | 24 (39.3%) | 37 (60.7%) |
| Public Administration | 11 (40.7%) | 16 (59.3%) |
| Total | 624 (54.4%) | 524 (45.6%) |
Education in Princeton Junction
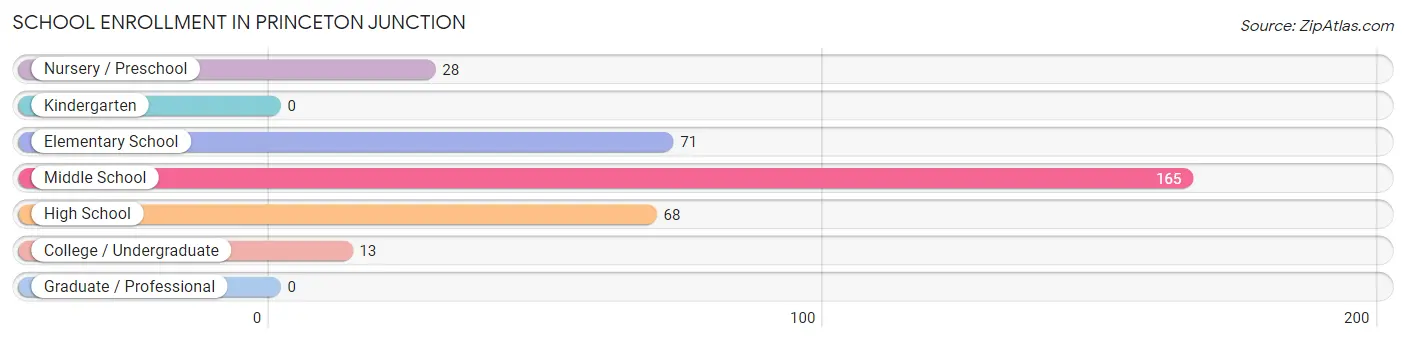
School Enrollment in Princeton Junction
The most common levels of schooling among the 345 students in Princeton Junction are middle school (165 | 47.8%), elementary school (71 | 20.6%), and high school (68 | 19.7%).
| School Level | # Students | % Students |
| Nursery / Preschool | 28 | 8.1% |
| Kindergarten | 0 | 0.0% |
| Elementary School | 71 | 20.6% |
| Middle School | 165 | 47.8% |
| High School | 68 | 19.7% |
| College / Undergraduate | 13 | 3.8% |
| Graduate / Professional | 0 | 0.0% |
| Total | 345 | 100.0% |
School Enrollment by Age by Funding Source in Princeton Junction
Out of a total of 345 students who are enrolled in schools in Princeton Junction, 13 (3.8%) attend a private institution, while the remaining 332 (96.2%) are enrolled in public schools. The age group of 3 to 4 year olds has the highest likelihood of being enrolled in private schools, with 13 (100.0% in the age bracket) enrolled. Conversely, the age group of 5 to 9 year old has the lowest likelihood of being enrolled in a private school, with 74 (100.0% in the age bracket) attending a public institution.
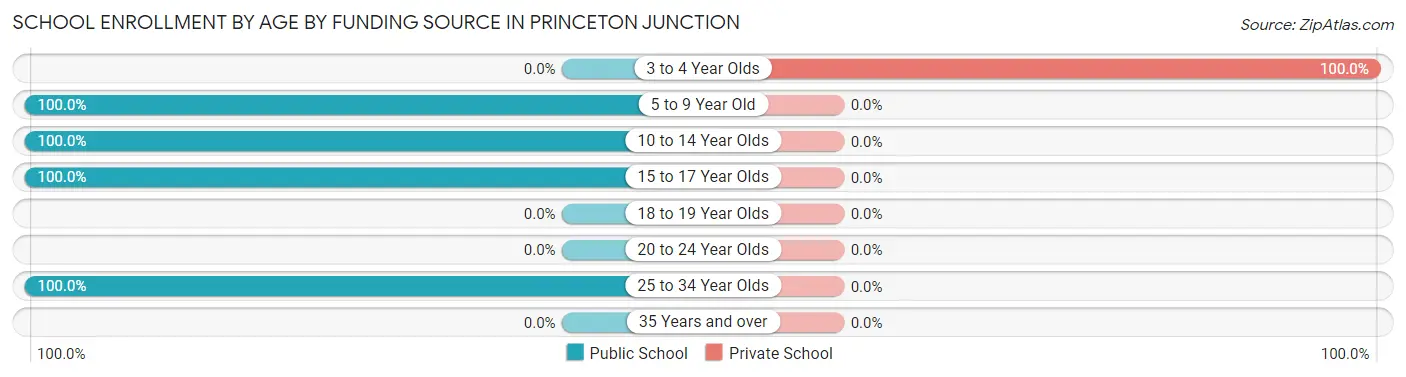
| Age Bracket | Public School | Private School |
| 3 to 4 Year Olds | 0 (0.0%) | 13 (100.0%) |
| 5 to 9 Year Old | 74 (100.0%) | 0 (0.0%) |
| 10 to 14 Year Olds | 193 (100.0%) | 0 (0.0%) |
| 15 to 17 Year Olds | 52 (100.0%) | 0 (0.0%) |
| 18 to 19 Year Olds | 0 (0.0%) | 0 (0.0%) |
| 20 to 24 Year Olds | 0 (0.0%) | 0 (0.0%) |
| 25 to 34 Year Olds | 13 (100.0%) | 0 (0.0%) |
| 35 Years and over | 0 (0.0%) | 0 (0.0%) |
| Total | 332 (96.2%) | 13 (3.8%) |
Educational Attainment by Field of Study in Princeton Junction
Business (236 | 17.2%), engineering (228 | 16.6%), social sciences (201 | 14.6%), communications (125 | 9.1%), and computers & mathematics (114 | 8.3%) are the most common fields of study among 1,376 individuals in Princeton Junction who have obtained a bachelor's degree or higher.
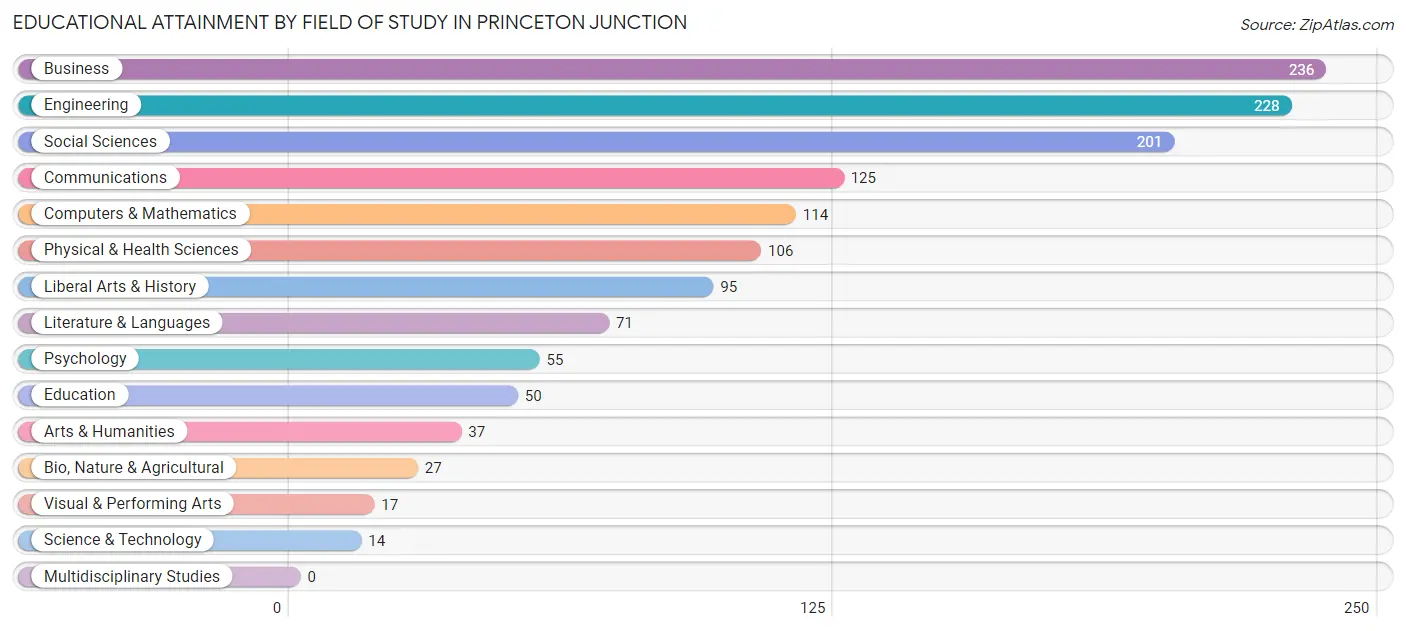
| Field of Study | # Graduates | % Graduates |
| Computers & Mathematics | 114 | 8.3% |
| Bio, Nature & Agricultural | 27 | 2.0% |
| Physical & Health Sciences | 106 | 7.7% |
| Psychology | 55 | 4.0% |
| Social Sciences | 201 | 14.6% |
| Engineering | 228 | 16.6% |
| Multidisciplinary Studies | 0 | 0.0% |
| Science & Technology | 14 | 1.0% |
| Business | 236 | 17.2% |
| Education | 50 | 3.6% |
| Literature & Languages | 71 | 5.2% |
| Liberal Arts & History | 95 | 6.9% |
| Visual & Performing Arts | 17 | 1.2% |
| Communications | 125 | 9.1% |
| Arts & Humanities | 37 | 2.7% |
| Total | 1,376 | 100.0% |
Transportation & Commute in Princeton Junction
Vehicle Availability by Sex in Princeton Junction
The most prevalent vehicle ownership categories in Princeton Junction are males with 2 vehicles (285, accounting for 45.8%) and females with 2 vehicles (277, making up 54.4%).
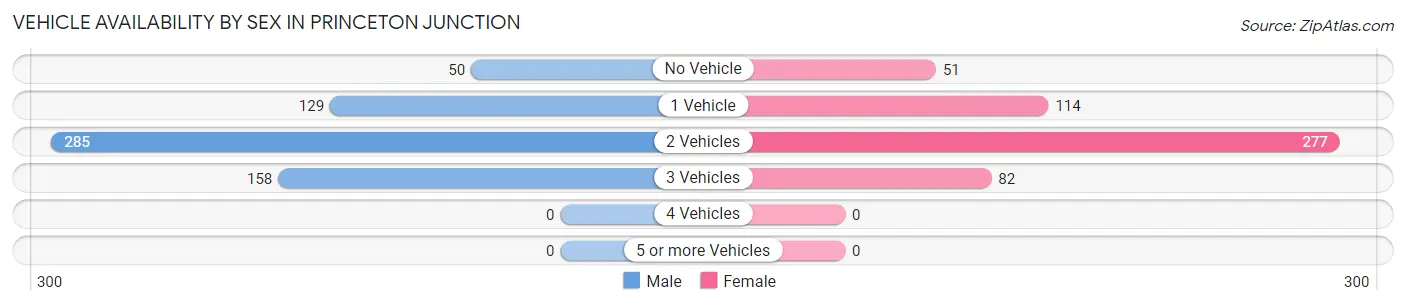
| Vehicles Available | Male | Female |
| No Vehicle | 50 (8.0%) | 51 (9.7%) |
| 1 Vehicle | 129 (20.7%) | 114 (21.8%) |
| 2 Vehicles | 285 (45.8%) | 277 (52.9%) |
| 3 Vehicles | 158 (25.4%) | 82 (15.7%) |
| 4 Vehicles | 0 (0.0%) | 0 (0.0%) |
| 5 or more Vehicles | 0 (0.0%) | 0 (0.0%) |
| Total | 622 (100.0%) | 524 (100.0%) |
Commute Time in Princeton Junction
The most frequently occuring commute durations in Princeton Junction are 60 to 89 minutes (144 commuters, 20.2%), 15 to 19 minutes (134 commuters, 18.8%), and 10 to 14 minutes (74 commuters, 10.4%).
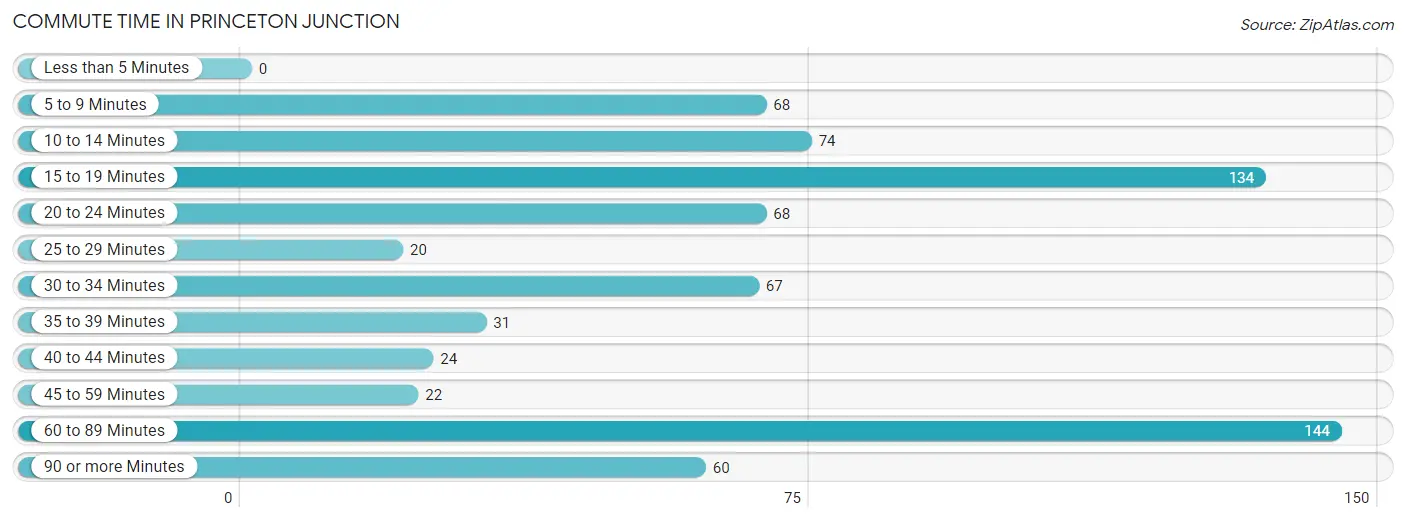
| Commute Time | # Commuters | % Commuters |
| Less than 5 Minutes | 0 | 0.0% |
| 5 to 9 Minutes | 68 | 9.6% |
| 10 to 14 Minutes | 74 | 10.4% |
| 15 to 19 Minutes | 134 | 18.8% |
| 20 to 24 Minutes | 68 | 9.6% |
| 25 to 29 Minutes | 20 | 2.8% |
| 30 to 34 Minutes | 67 | 9.4% |
| 35 to 39 Minutes | 31 | 4.3% |
| 40 to 44 Minutes | 24 | 3.4% |
| 45 to 59 Minutes | 22 | 3.1% |
| 60 to 89 Minutes | 144 | 20.2% |
| 90 or more Minutes | 60 | 8.4% |
Commute Time by Sex in Princeton Junction
The most common commute times in Princeton Junction are 60 to 89 minutes (125 commuters, 40.8%) for males and 15 to 19 minutes (108 commuters, 26.6%) for females.
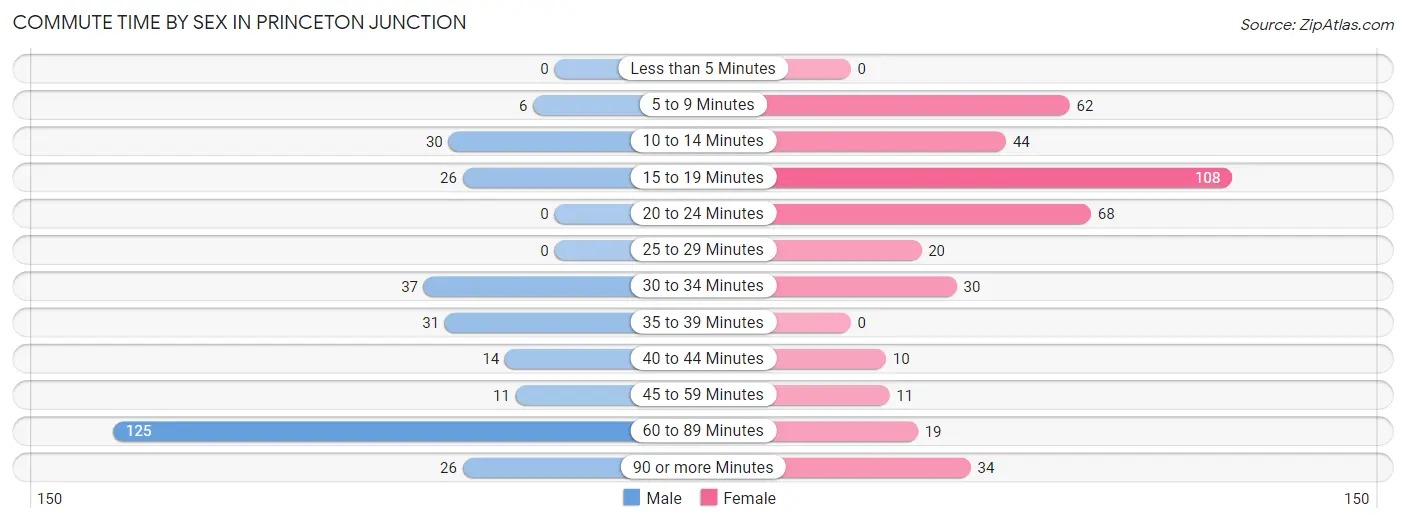
| Commute Time | Male | Female |
| Less than 5 Minutes | 0 (0.0%) | 0 (0.0%) |
| 5 to 9 Minutes | 6 (2.0%) | 62 (15.3%) |
| 10 to 14 Minutes | 30 (9.8%) | 44 (10.8%) |
| 15 to 19 Minutes | 26 (8.5%) | 108 (26.6%) |
| 20 to 24 Minutes | 0 (0.0%) | 68 (16.8%) |
| 25 to 29 Minutes | 0 (0.0%) | 20 (4.9%) |
| 30 to 34 Minutes | 37 (12.1%) | 30 (7.4%) |
| 35 to 39 Minutes | 31 (10.1%) | 0 (0.0%) |
| 40 to 44 Minutes | 14 (4.6%) | 10 (2.5%) |
| 45 to 59 Minutes | 11 (3.6%) | 11 (2.7%) |
| 60 to 89 Minutes | 125 (40.8%) | 19 (4.7%) |
| 90 or more Minutes | 26 (8.5%) | 34 (8.4%) |
Time of Departure to Work by Sex in Princeton Junction
The most frequent times of departure to work in Princeton Junction are 7:00 AM to 7:29 AM (73, 23.9%) for males and 7:30 AM to 7:59 AM (185, 45.6%) for females.
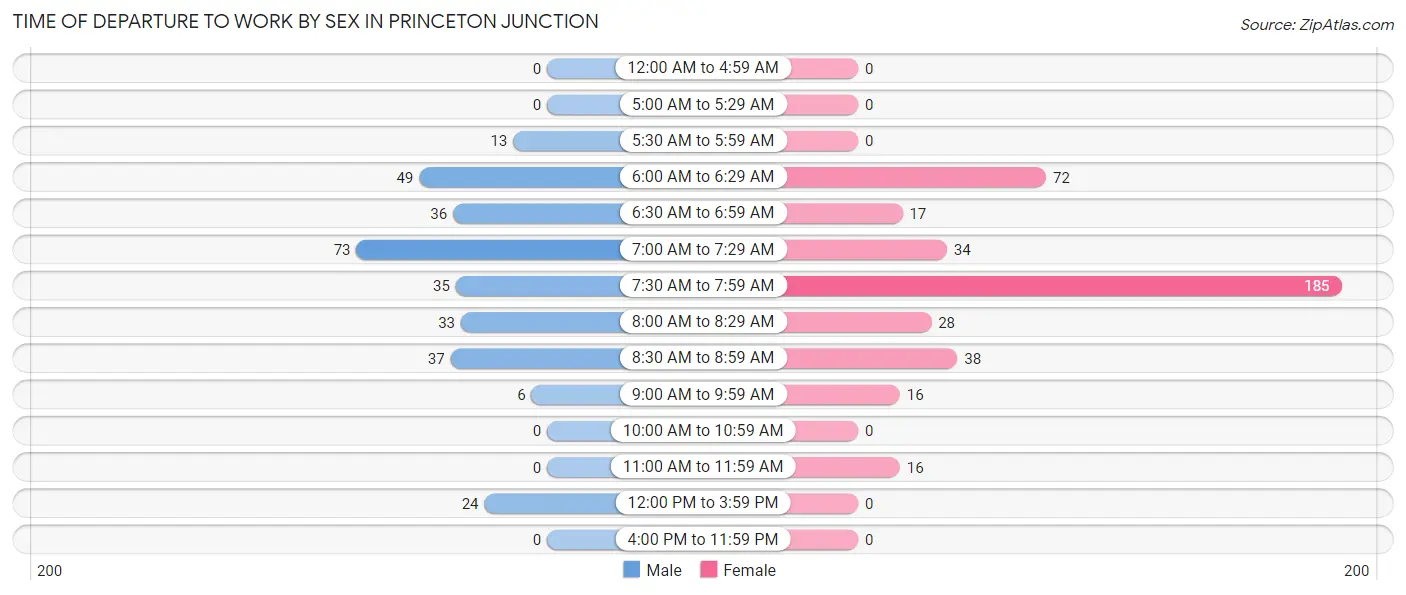
| Time of Departure | Male | Female |
| 12:00 AM to 4:59 AM | 0 (0.0%) | 0 (0.0%) |
| 5:00 AM to 5:29 AM | 0 (0.0%) | 0 (0.0%) |
| 5:30 AM to 5:59 AM | 13 (4.3%) | 0 (0.0%) |
| 6:00 AM to 6:29 AM | 49 (16.0%) | 72 (17.7%) |
| 6:30 AM to 6:59 AM | 36 (11.8%) | 17 (4.2%) |
| 7:00 AM to 7:29 AM | 73 (23.9%) | 34 (8.4%) |
| 7:30 AM to 7:59 AM | 35 (11.4%) | 185 (45.6%) |
| 8:00 AM to 8:29 AM | 33 (10.8%) | 28 (6.9%) |
| 8:30 AM to 8:59 AM | 37 (12.1%) | 38 (9.4%) |
| 9:00 AM to 9:59 AM | 6 (2.0%) | 16 (3.9%) |
| 10:00 AM to 10:59 AM | 0 (0.0%) | 0 (0.0%) |
| 11:00 AM to 11:59 AM | 0 (0.0%) | 16 (3.9%) |
| 12:00 PM to 3:59 PM | 24 (7.8%) | 0 (0.0%) |
| 4:00 PM to 11:59 PM | 0 (0.0%) | 0 (0.0%) |
| Total | 306 (100.0%) | 406 (100.0%) |
Housing Occupancy in Princeton Junction
Occupancy by Ownership in Princeton Junction
Of the total 841 dwellings in Princeton Junction, owner-occupied units account for 663 (78.8%), while renter-occupied units make up 178 (21.2%).
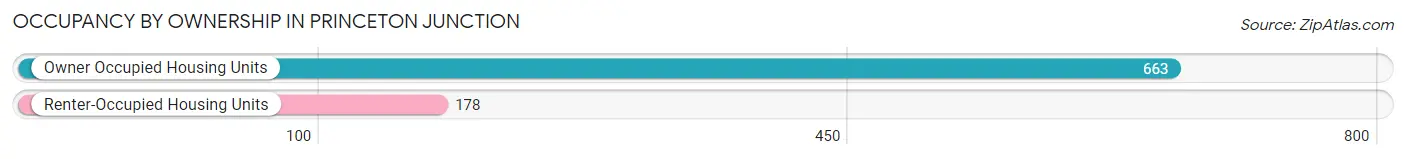
| Occupancy | # Housing Units | % Housing Units |
| Owner Occupied Housing Units | 663 | 78.8% |
| Renter-Occupied Housing Units | 178 | 21.2% |
| Total Occupied Housing Units | 841 | 100.0% |
Occupancy by Household Size in Princeton Junction
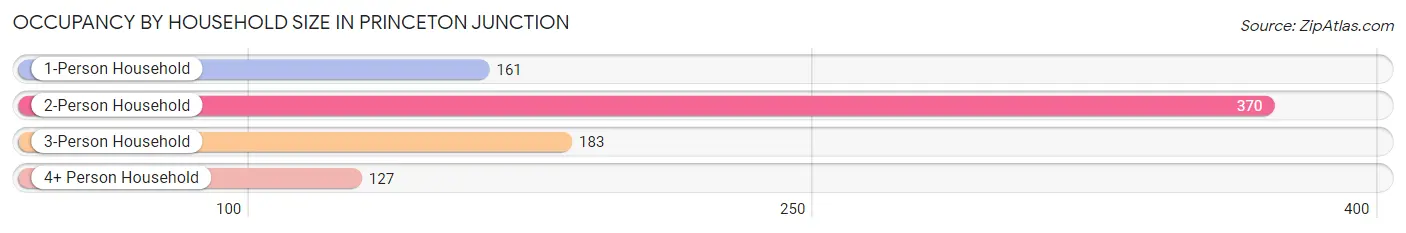
| Household Size | # Housing Units | % Housing Units |
| 1-Person Household | 161 | 19.1% |
| 2-Person Household | 370 | 44.0% |
| 3-Person Household | 183 | 21.8% |
| 4+ Person Household | 127 | 15.1% |
| Total Housing Units | 841 | 100.0% |
Occupancy by Ownership by Household Size in Princeton Junction
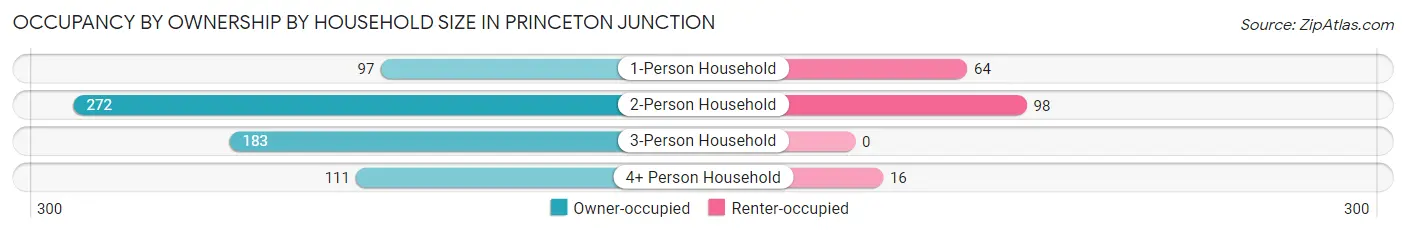
| Household Size | Owner-occupied | Renter-occupied |
| 1-Person Household | 97 (60.3%) | 64 (39.8%) |
| 2-Person Household | 272 (73.5%) | 98 (26.5%) |
| 3-Person Household | 183 (100.0%) | 0 (0.0%) |
| 4+ Person Household | 111 (87.4%) | 16 (12.6%) |
| Total Housing Units | 663 (78.8%) | 178 (21.2%) |
Occupancy by Educational Attainment in Princeton Junction
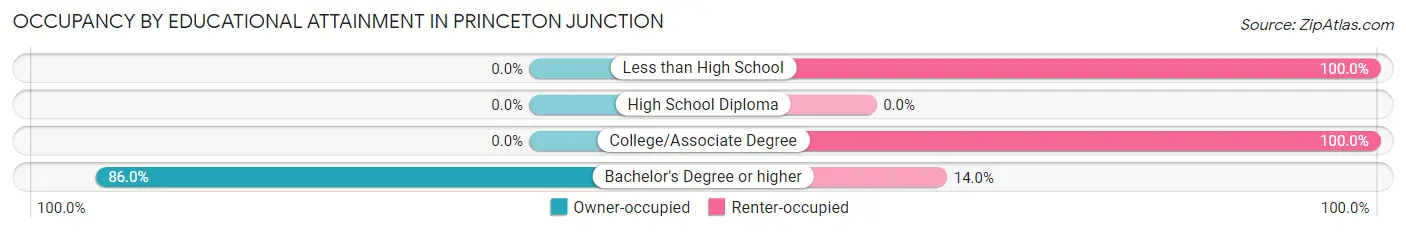
| Household Size | Owner-occupied | Renter-occupied |
| Less than High School | 0 (0.0%) | 50 (100.0%) |
| High School Diploma | 0 (0.0%) | 0 (0.0%) |
| College/Associate Degree | 0 (0.0%) | 20 (100.0%) |
| Bachelor's Degree or higher | 663 (86.0%) | 108 (14.0%) |
Occupancy by Age of Householder in Princeton Junction
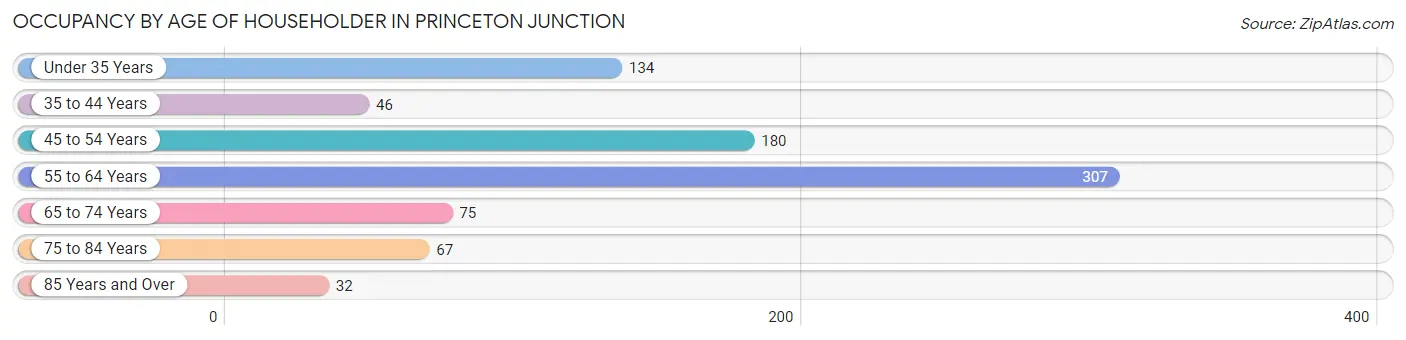
| Age Bracket | # Households | % Households |
| Under 35 Years | 134 | 15.9% |
| 35 to 44 Years | 46 | 5.5% |
| 45 to 54 Years | 180 | 21.4% |
| 55 to 64 Years | 307 | 36.5% |
| 65 to 74 Years | 75 | 8.9% |
| 75 to 84 Years | 67 | 8.0% |
| 85 Years and Over | 32 | 3.8% |
| Total | 841 | 100.0% |
Housing Finances in Princeton Junction
Median Income by Occupancy in Princeton Junction
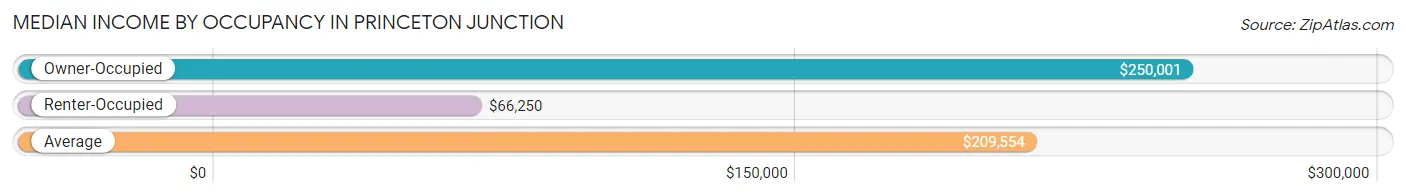
| Occupancy Type | # Households | Median Income |
| Owner-Occupied | 663 (78.8%) | $250,001 |
| Renter-Occupied | 178 (21.2%) | $66,250 |
| Average | 841 (100.0%) | $209,554 |
Occupancy by Householder Income Bracket in Princeton Junction
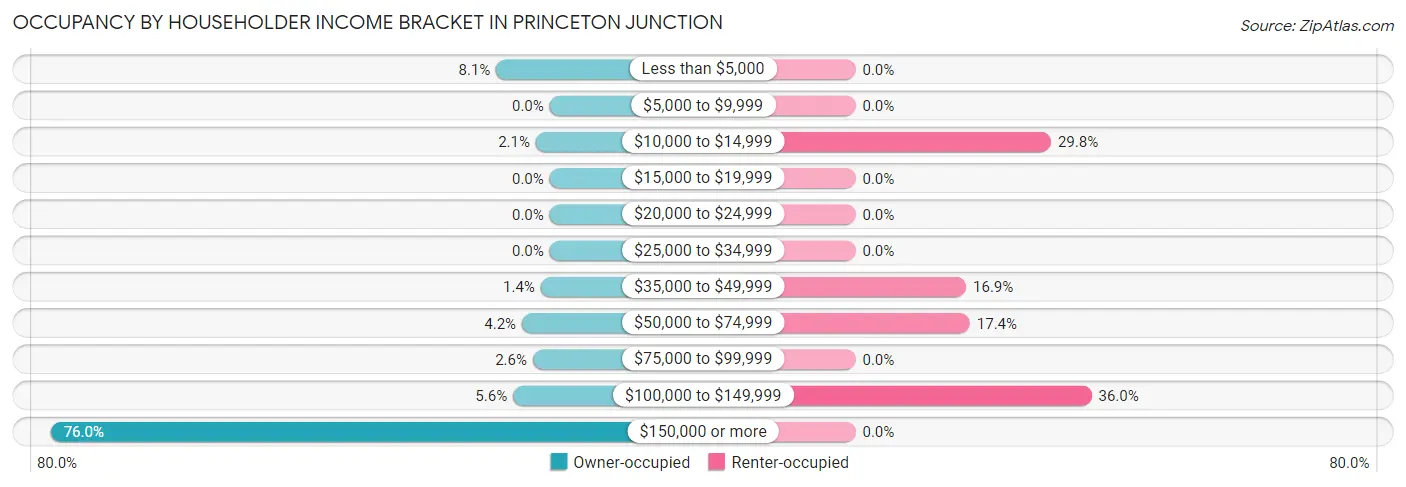
| Income Bracket | Owner-occupied | Renter-occupied |
| Less than $5,000 | 54 (8.1%) | 0 (0.0%) |
| $5,000 to $9,999 | 0 (0.0%) | 0 (0.0%) |
| $10,000 to $14,999 | 14 (2.1%) | 53 (29.8%) |
| $15,000 to $19,999 | 0 (0.0%) | 0 (0.0%) |
| $20,000 to $24,999 | 0 (0.0%) | 0 (0.0%) |
| $25,000 to $34,999 | 0 (0.0%) | 0 (0.0%) |
| $35,000 to $49,999 | 9 (1.4%) | 30 (16.9%) |
| $50,000 to $74,999 | 28 (4.2%) | 31 (17.4%) |
| $75,000 to $99,999 | 17 (2.6%) | 0 (0.0%) |
| $100,000 to $149,999 | 37 (5.6%) | 64 (36.0%) |
| $150,000 or more | 504 (76.0%) | 0 (0.0%) |
| Total | 663 (100.0%) | 178 (100.0%) |
Monthly Housing Cost Tiers in Princeton Junction
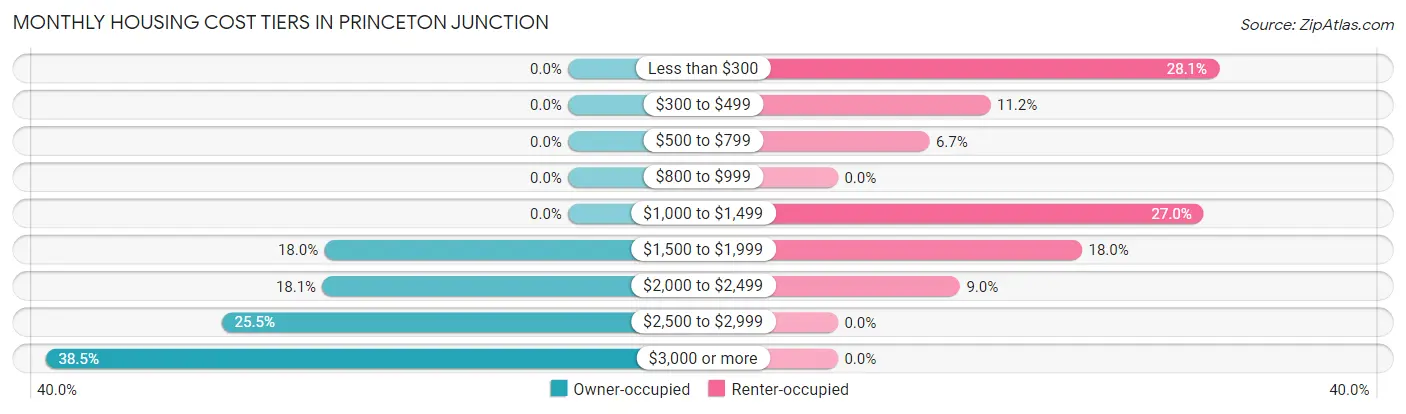
| Monthly Cost | Owner-occupied | Renter-occupied |
| Less than $300 | 0 (0.0%) | 50 (28.1%) |
| $300 to $499 | 0 (0.0%) | 20 (11.2%) |
| $500 to $799 | 0 (0.0%) | 12 (6.7%) |
| $800 to $999 | 0 (0.0%) | 0 (0.0%) |
| $1,000 to $1,499 | 0 (0.0%) | 48 (27.0%) |
| $1,500 to $1,999 | 119 (17.9%) | 32 (18.0%) |
| $2,000 to $2,499 | 120 (18.1%) | 16 (9.0%) |
| $2,500 to $2,999 | 169 (25.5%) | 0 (0.0%) |
| $3,000 or more | 255 (38.5%) | 0 (0.0%) |
| Total | 663 (100.0%) | 178 (100.0%) |
Physical Housing Characteristics in Princeton Junction
Housing Structures in Princeton Junction
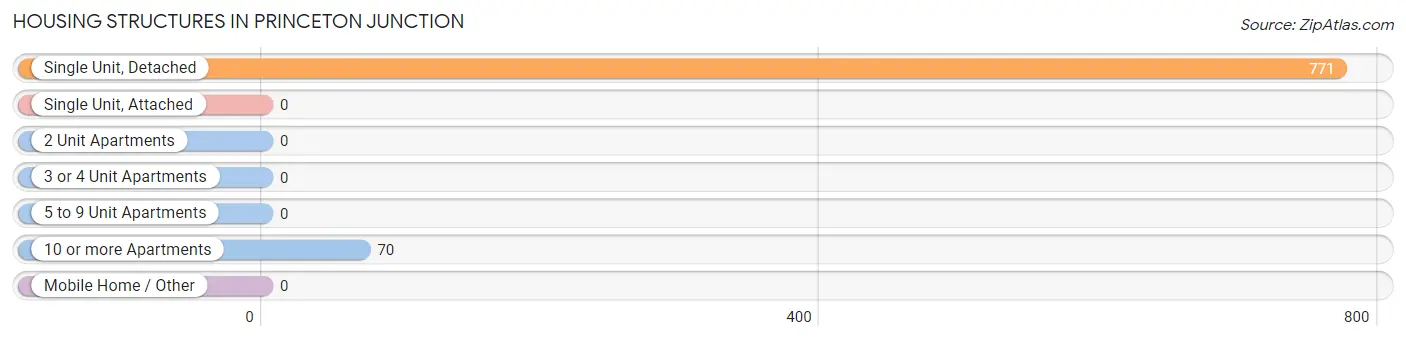
| Structure Type | # Housing Units | % Housing Units |
| Single Unit, Detached | 771 | 91.7% |
| Single Unit, Attached | 0 | 0.0% |
| 2 Unit Apartments | 0 | 0.0% |
| 3 or 4 Unit Apartments | 0 | 0.0% |
| 5 to 9 Unit Apartments | 0 | 0.0% |
| 10 or more Apartments | 70 | 8.3% |
| Mobile Home / Other | 0 | 0.0% |
| Total | 841 | 100.0% |
Housing Structures by Occupancy in Princeton Junction
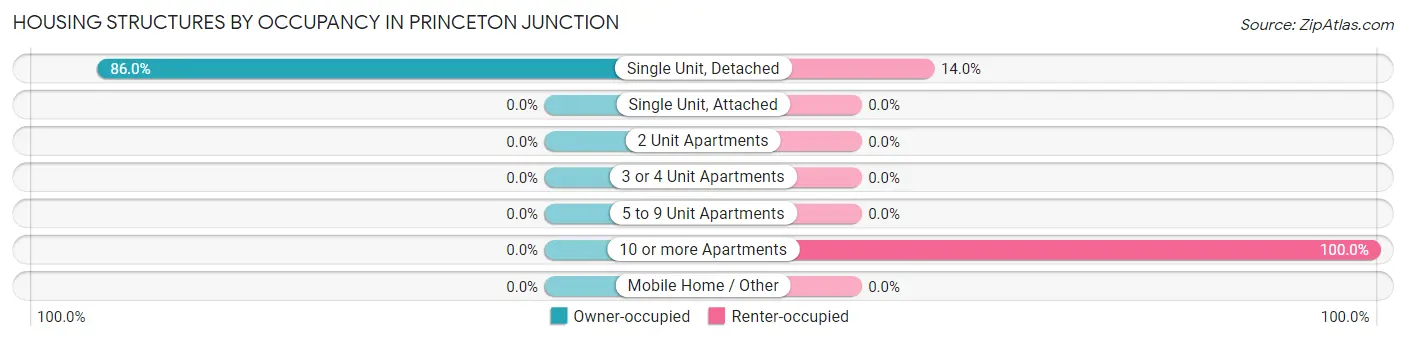
| Structure Type | Owner-occupied | Renter-occupied |
| Single Unit, Detached | 663 (86.0%) | 108 (14.0%) |
| Single Unit, Attached | 0 (0.0%) | 0 (0.0%) |
| 2 Unit Apartments | 0 (0.0%) | 0 (0.0%) |
| 3 or 4 Unit Apartments | 0 (0.0%) | 0 (0.0%) |
| 5 to 9 Unit Apartments | 0 (0.0%) | 0 (0.0%) |
| 10 or more Apartments | 0 (0.0%) | 70 (100.0%) |
| Mobile Home / Other | 0 (0.0%) | 0 (0.0%) |
| Total | 663 (78.8%) | 178 (21.2%) |
Housing Structures by Number of Rooms in Princeton Junction
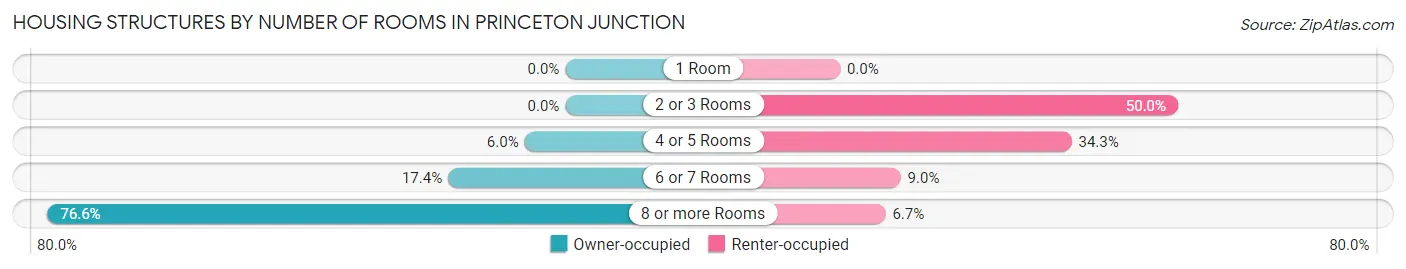
| Number of Rooms | Owner-occupied | Renter-occupied |
| 1 Room | 0 (0.0%) | 0 (0.0%) |
| 2 or 3 Rooms | 0 (0.0%) | 89 (50.0%) |
| 4 or 5 Rooms | 40 (6.0%) | 61 (34.3%) |
| 6 or 7 Rooms | 115 (17.3%) | 16 (9.0%) |
| 8 or more Rooms | 508 (76.6%) | 12 (6.7%) |
| Total | 663 (100.0%) | 178 (100.0%) |
Housing Structure by Heating Type in Princeton Junction
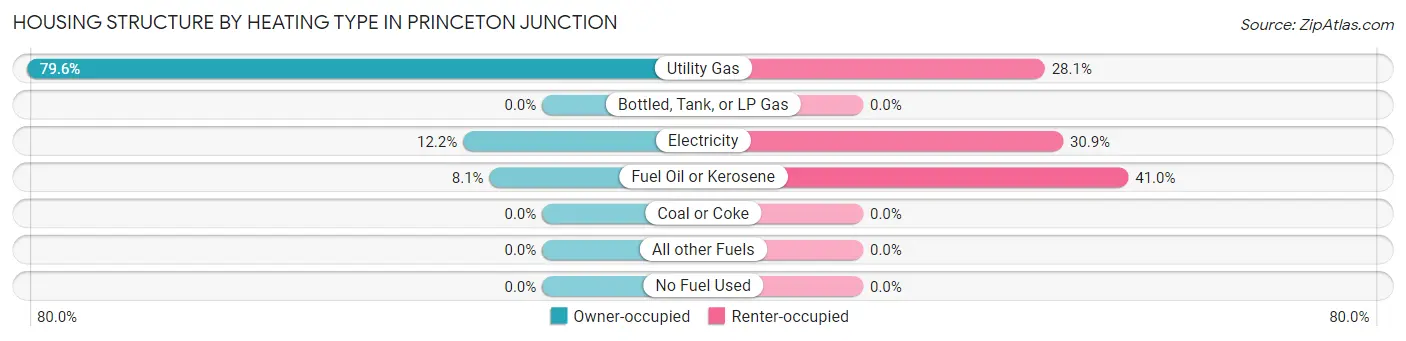
| Heating Type | Owner-occupied | Renter-occupied |
| Utility Gas | 528 (79.6%) | 50 (28.1%) |
| Bottled, Tank, or LP Gas | 0 (0.0%) | 0 (0.0%) |
| Electricity | 81 (12.2%) | 55 (30.9%) |
| Fuel Oil or Kerosene | 54 (8.1%) | 73 (41.0%) |
| Coal or Coke | 0 (0.0%) | 0 (0.0%) |
| All other Fuels | 0 (0.0%) | 0 (0.0%) |
| No Fuel Used | 0 (0.0%) | 0 (0.0%) |
| Total | 663 (100.0%) | 178 (100.0%) |
Household Vehicle Usage in Princeton Junction
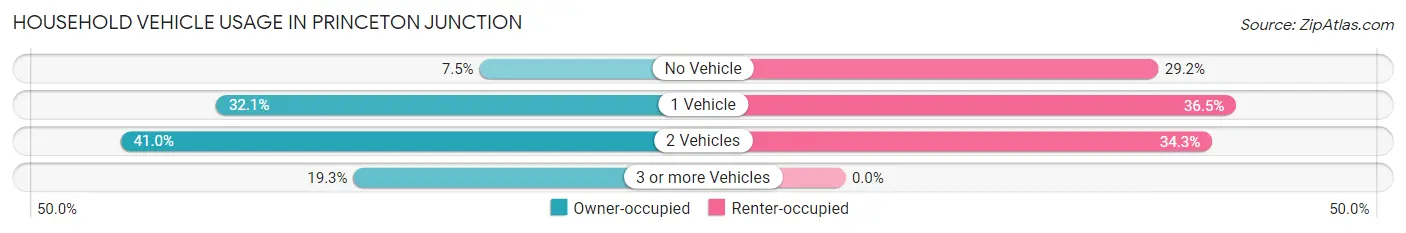
| Vehicles per Household | Owner-occupied | Renter-occupied |
| No Vehicle | 50 (7.5%) | 52 (29.2%) |
| 1 Vehicle | 213 (32.1%) | 65 (36.5%) |
| 2 Vehicles | 272 (41.0%) | 61 (34.3%) |
| 3 or more Vehicles | 128 (19.3%) | 0 (0.0%) |
| Total | 663 (100.0%) | 178 (100.0%) |
Real Estate & Mortgages in Princeton Junction
Real Estate and Mortgage Overview in Princeton Junction
| Characteristic | Without Mortgage | With Mortgage |
| Housing Units | 222 | 441 |
| Median Property Value | $778,000 | $590,600 |
| Median Household Income | $250,001 | $296 |
| Monthly Housing Costs | $1,501 | $255 |
| Real Estate Taxes | $10,001 | $0 |
Property Value by Mortgage Status in Princeton Junction
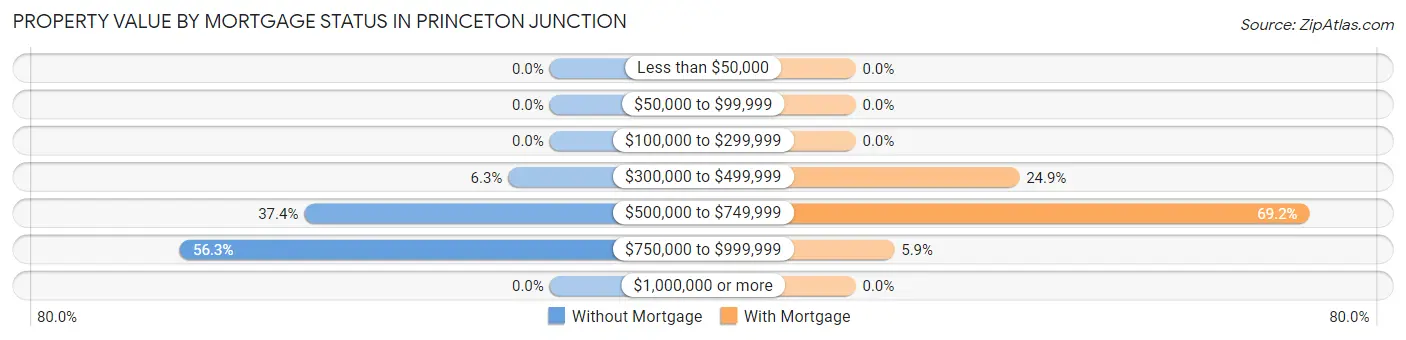
| Property Value | Without Mortgage | With Mortgage |
| Less than $50,000 | 0 (0.0%) | 0 (0.0%) |
| $50,000 to $99,999 | 0 (0.0%) | 0 (0.0%) |
| $100,000 to $299,999 | 0 (0.0%) | 0 (0.0%) |
| $300,000 to $499,999 | 14 (6.3%) | 110 (24.9%) |
| $500,000 to $749,999 | 83 (37.4%) | 305 (69.2%) |
| $750,000 to $999,999 | 125 (56.3%) | 26 (5.9%) |
| $1,000,000 or more | 0 (0.0%) | 0 (0.0%) |
| Total | 222 (100.0%) | 441 (100.0%) |
Household Income by Mortgage Status in Princeton Junction
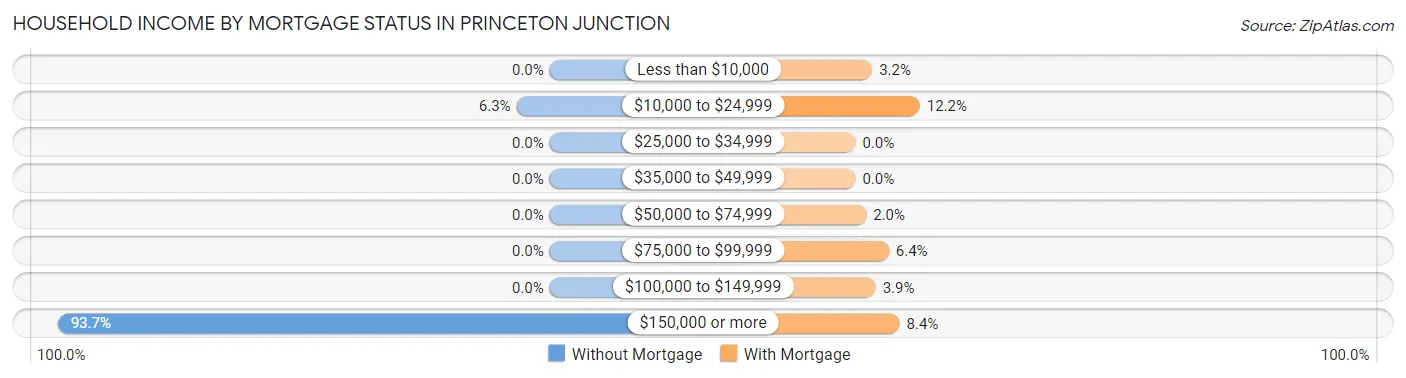
| Household Income | Without Mortgage | With Mortgage |
| Less than $10,000 | 0 (0.0%) | 14 (3.2%) |
| $10,000 to $24,999 | 14 (6.3%) | 54 (12.2%) |
| $25,000 to $34,999 | 0 (0.0%) | 0 (0.0%) |
| $35,000 to $49,999 | 0 (0.0%) | 0 (0.0%) |
| $50,000 to $74,999 | 0 (0.0%) | 9 (2.0%) |
| $75,000 to $99,999 | 0 (0.0%) | 28 (6.4%) |
| $100,000 to $149,999 | 0 (0.0%) | 17 (3.8%) |
| $150,000 or more | 208 (93.7%) | 37 (8.4%) |
| Total | 222 (100.0%) | 441 (100.0%) |
Property Value to Household Income Ratio in Princeton Junction
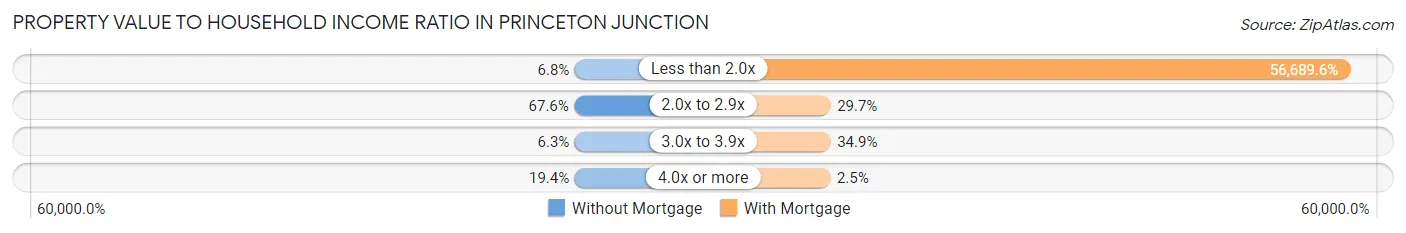
| Value-to-Income Ratio | Without Mortgage | With Mortgage |
| Less than 2.0x | 15 (6.8%) | 250,001 (56,689.6%) |
| 2.0x to 2.9x | 150 (67.6%) | 131 (29.7%) |
| 3.0x to 3.9x | 14 (6.3%) | 154 (34.9%) |
| 4.0x or more | 43 (19.4%) | 11 (2.5%) |
| Total | 222 (100.0%) | 441 (100.0%) |
Real Estate Taxes by Mortgage Status in Princeton Junction
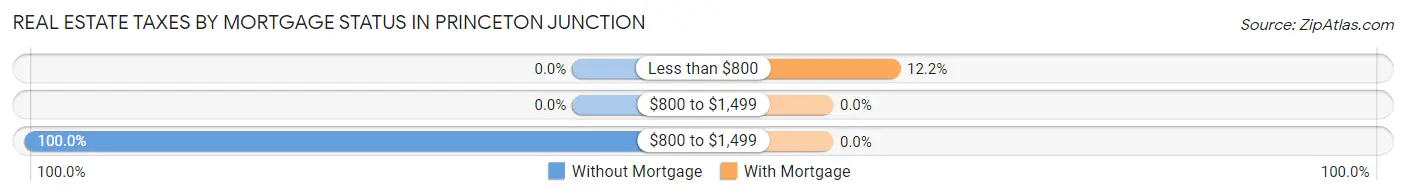
| Property Taxes | Without Mortgage | With Mortgage |
| Less than $800 | 0 (0.0%) | 54 (12.2%) |
| $800 to $1,499 | 0 (0.0%) | 0 (0.0%) |
| $800 to $1,499 | 222 (100.0%) | 0 (0.0%) |
| Total | 222 (100.0%) | 441 (100.0%) |
Health & Disability in Princeton Junction
Health Insurance Coverage by Age in Princeton Junction
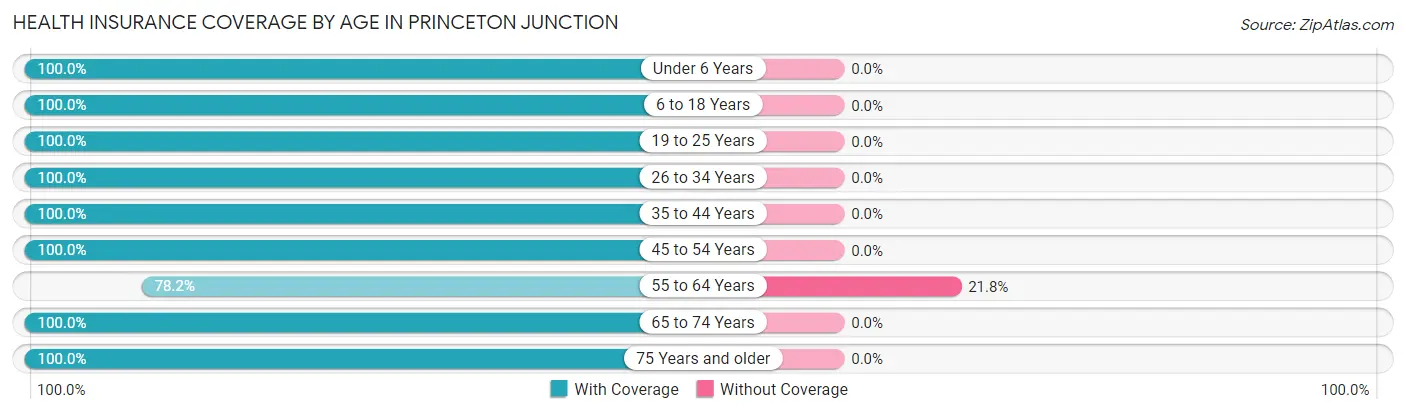
| Age Bracket | With Coverage | Without Coverage |
| Under 6 Years | 101 (100.0%) | 0 (0.0%) |
| 6 to 18 Years | 304 (100.0%) | 0 (0.0%) |
| 19 to 25 Years | 10 (100.0%) | 0 (0.0%) |
| 26 to 34 Years | 278 (100.0%) | 0 (0.0%) |
| 35 to 44 Years | 157 (100.0%) | 0 (0.0%) |
| 45 to 54 Years | 327 (100.0%) | 0 (0.0%) |
| 55 to 64 Years | 391 (78.2%) | 109 (21.8%) |
| 65 to 74 Years | 193 (100.0%) | 0 (0.0%) |
| 75 Years and older | 152 (100.0%) | 0 (0.0%) |
| Total | 1,913 (94.6%) | 109 (5.4%) |
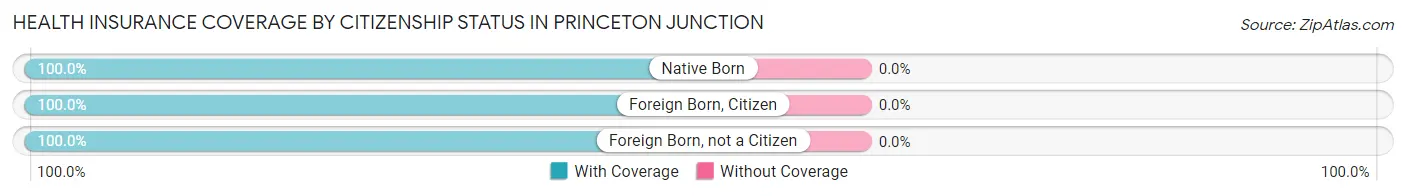
Health Insurance Coverage by Citizenship Status in Princeton Junction
| Citizenship Status | With Coverage | Without Coverage |
| Native Born | 101 (100.0%) | 0 (0.0%) |
| Foreign Born, Citizen | 304 (100.0%) | 0 (0.0%) |
| Foreign Born, not a Citizen | 10 (100.0%) | 0 (0.0%) |
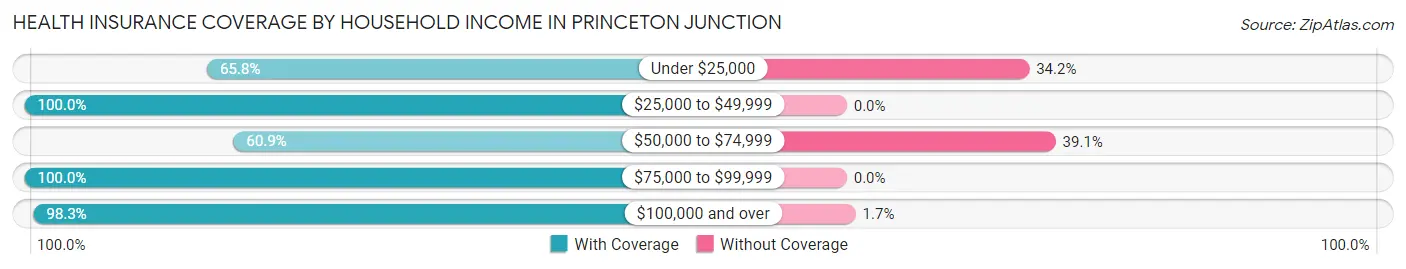
Health Insurance Coverage by Household Income in Princeton Junction
| Household Income | With Coverage | Without Coverage |
| Under $25,000 | 104 (65.8%) | 54 (34.2%) |
| $25,000 to $49,999 | 80 (100.0%) | 0 (0.0%) |
| $50,000 to $74,999 | 42 (60.9%) | 27 (39.1%) |
| $75,000 to $99,999 | 17 (100.0%) | 0 (0.0%) |
| $100,000 and over | 1,660 (98.3%) | 28 (1.7%) |
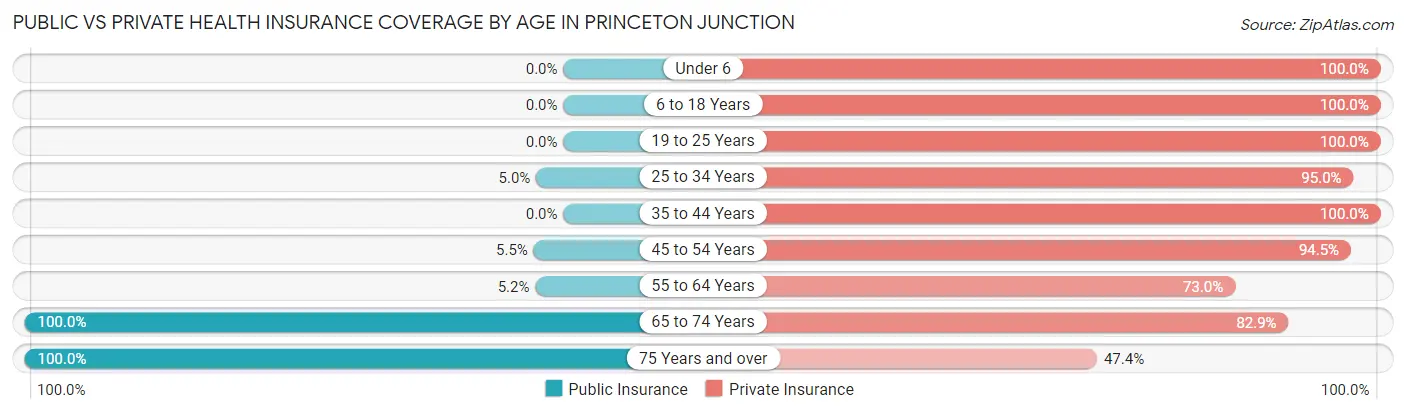
Public vs Private Health Insurance Coverage by Age in Princeton Junction
| Age Bracket | Public Insurance | Private Insurance |
| Under 6 | 0 (0.0%) | 101 (100.0%) |
| 6 to 18 Years | 0 (0.0%) | 304 (100.0%) |
| 19 to 25 Years | 0 (0.0%) | 10 (100.0%) |
| 25 to 34 Years | 14 (5.0%) | 264 (95.0%) |
| 35 to 44 Years | 0 (0.0%) | 157 (100.0%) |
| 45 to 54 Years | 18 (5.5%) | 309 (94.5%) |
| 55 to 64 Years | 26 (5.2%) | 365 (73.0%) |
| 65 to 74 Years | 193 (100.0%) | 160 (82.9%) |
| 75 Years and over | 152 (100.0%) | 72 (47.4%) |
| Total | 403 (19.9%) | 1,742 (86.2%) |
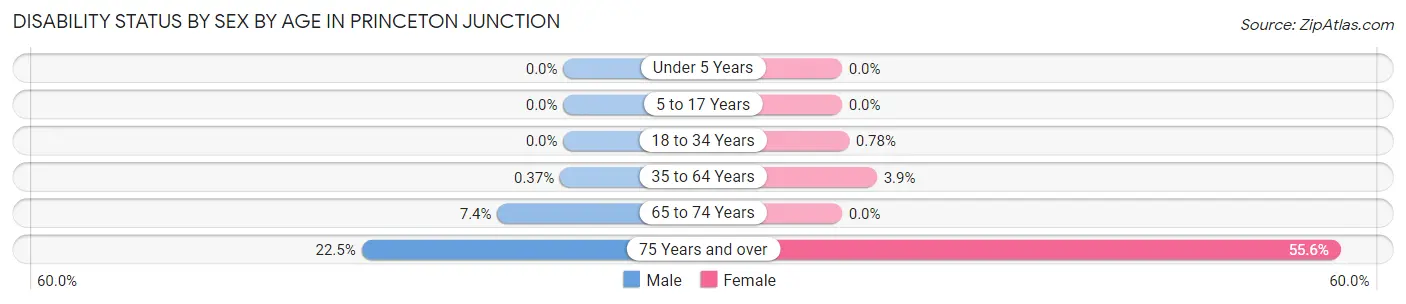
Disability Status by Sex by Age in Princeton Junction
| Age Bracket | Male | Female |
| Under 5 Years | 0 (0.0%) | 0 (0.0%) |
| 5 to 17 Years | 0 (0.0%) | 0 (0.0%) |
| 18 to 34 Years | 0 (0.0%) | 1 (0.8%) |
| 35 to 64 Years | 2 (0.4%) | 17 (3.9%) |
| 65 to 74 Years | 5 (7.3%) | 0 (0.0%) |
| 75 Years and over | 20 (22.5%) | 35 (55.6%) |
Disability Class by Sex by Age in Princeton Junction
Disability Class: Hearing Difficulty
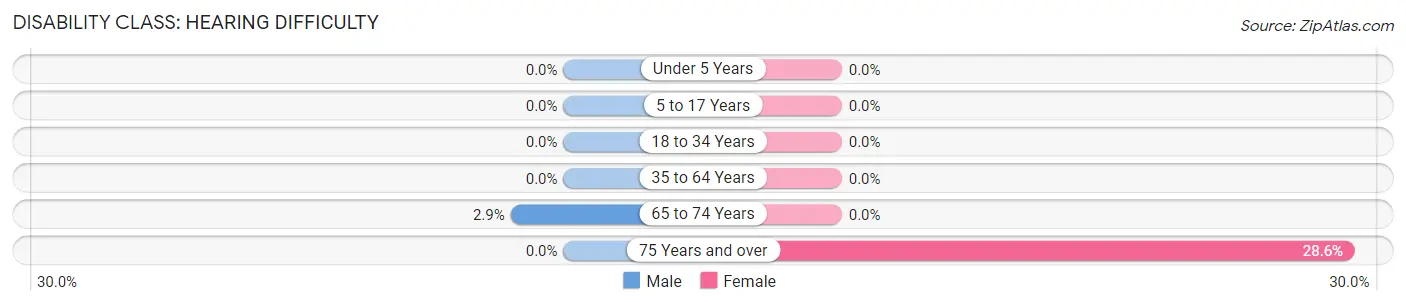
| Age Bracket | Male | Female |
| Under 5 Years | 0 (0.0%) | 0 (0.0%) |
| 5 to 17 Years | 0 (0.0%) | 0 (0.0%) |
| 18 to 34 Years | 0 (0.0%) | 0 (0.0%) |
| 35 to 64 Years | 0 (0.0%) | 0 (0.0%) |
| 65 to 74 Years | 2 (2.9%) | 0 (0.0%) |
| 75 Years and over | 0 (0.0%) | 18 (28.6%) |
Disability Class: Vision Difficulty
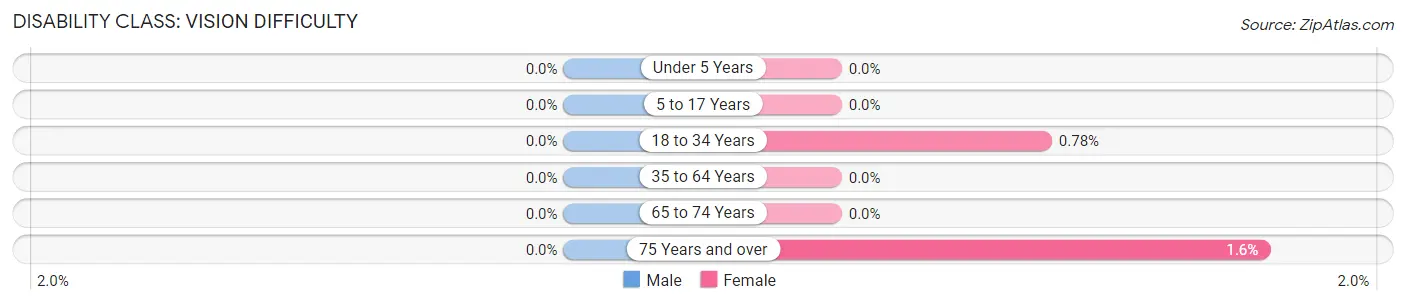
| Age Bracket | Male | Female |
| Under 5 Years | 0 (0.0%) | 0 (0.0%) |
| 5 to 17 Years | 0 (0.0%) | 0 (0.0%) |
| 18 to 34 Years | 0 (0.0%) | 1 (0.8%) |
| 35 to 64 Years | 0 (0.0%) | 0 (0.0%) |
| 65 to 74 Years | 0 (0.0%) | 0 (0.0%) |
| 75 Years and over | 0 (0.0%) | 1 (1.6%) |
Disability Class: Cognitive Difficulty

| Age Bracket | Male | Female |
| 5 to 17 Years | 0 (0.0%) | 0 (0.0%) |
| 18 to 34 Years | 0 (0.0%) | 1 (0.8%) |
| 35 to 64 Years | 2 (0.4%) | 1 (0.2%) |
| 65 to 74 Years | 5 (7.3%) | 0 (0.0%) |
| 75 Years and over | 0 (0.0%) | 35 (55.6%) |
Disability Class: Ambulatory Difficulty
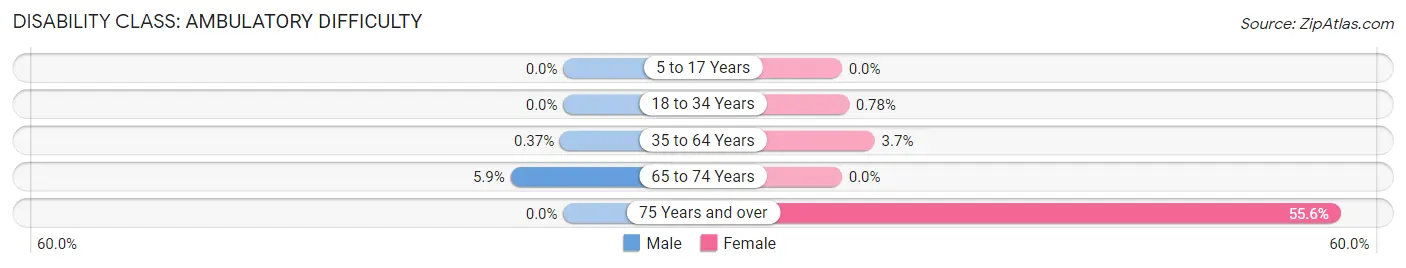
| Age Bracket | Male | Female |
| 5 to 17 Years | 0 (0.0%) | 0 (0.0%) |
| 18 to 34 Years | 0 (0.0%) | 1 (0.8%) |
| 35 to 64 Years | 2 (0.4%) | 16 (3.7%) |
| 65 to 74 Years | 4 (5.9%) | 0 (0.0%) |
| 75 Years and over | 0 (0.0%) | 35 (55.6%) |
Disability Class: Self-Care Difficulty

| Age Bracket | Male | Female |
| 5 to 17 Years | 0 (0.0%) | 0 (0.0%) |
| 18 to 34 Years | 0 (0.0%) | 1 (0.8%) |
| 35 to 64 Years | 2 (0.4%) | 1 (0.2%) |
| 65 to 74 Years | 3 (4.4%) | 0 (0.0%) |
| 75 Years and over | 0 (0.0%) | 35 (55.6%) |
Technology Access in Princeton Junction
Computing Device Access in Princeton Junction
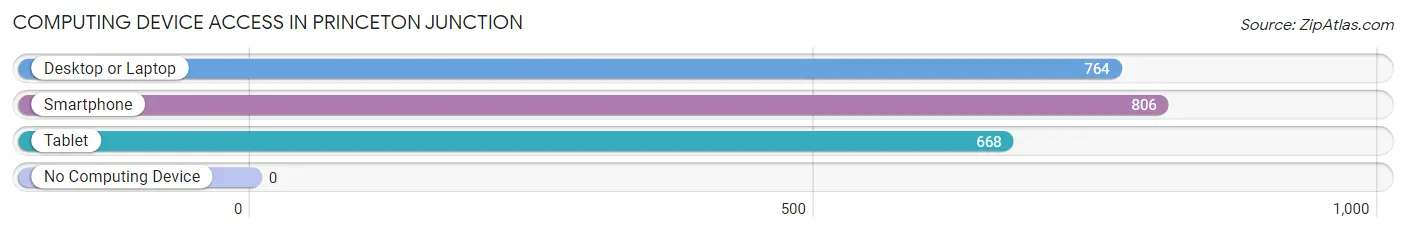
| Device Type | # Households | % Households |
| Desktop or Laptop | 764 | 90.8% |
| Smartphone | 806 | 95.8% |
| Tablet | 668 | 79.4% |
| No Computing Device | 0 | 0.0% |
| Total | 841 | 100.0% |
Internet Access in Princeton Junction
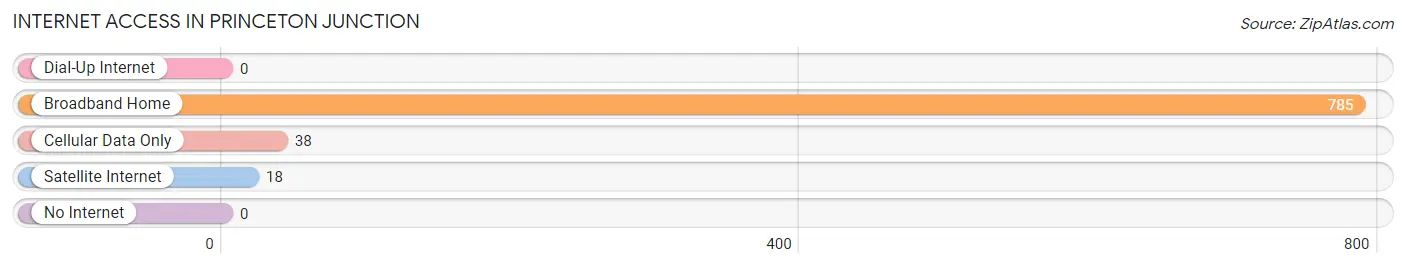
| Internet Type | # Households | % Households |
| Dial-Up Internet | 0 | 0.0% |
| Broadband Home | 785 | 93.3% |
| Cellular Data Only | 38 | 4.5% |
| Satellite Internet | 18 | 2.1% |
| No Internet | 0 | 0.0% |
| Total | 841 | 100.0% |
Princeton Junction Summary
Princeton Junction is a census-designated place (CDP) located in West Windsor Township, in Mercer County, New Jersey. It is located within the New York metropolitan area and is part of the larger Princeton-Trenton-Ewing metropolitan area. As of the 2010 United States Census, the CDP's population was 2,465.
History
The area now known as Princeton Junction was originally inhabited by the Lenni Lenape Native Americans. The first European settlers arrived in the area in the late 17th century. The area was part of the original boundaries of West Windsor Township, which was established in 1797.
The area was known as "Princeton Station" until the early 20th century, when it was renamed "Princeton Junction" to distinguish it from the nearby Princeton Borough. The name was derived from the fact that the area was the junction of two railroads, the Pennsylvania Railroad and the Camden and Amboy Railroad.
The area was largely rural until the 1950s, when the construction of the New Jersey Turnpike and Interstate 95 spurred development. The area experienced rapid growth in the 1960s and 1970s, and by the 1980s, it had become a suburban bedroom community.
Geography
Princeton Junction is located at 40°18'45" North, 74°40'45" West (40.312500, -74.679167). It is situated in the central part of West Windsor Township, in Mercer County, New Jersey.
The CDP has a total area of 2.2 square miles, all of which is land. It is bordered to the north by the Borough of Princeton, to the east by the Borough of Hightstown, to the south by the Borough of Cranbury, and to the west by the Township of Plainsboro.
Economy
Princeton Junction is a primarily residential community, with no major employers located within its boundaries. However, it is close to several major employers in the surrounding area, including Princeton University, Princeton Medical Center, and the New Jersey Turnpike Authority.
Demographics
As of the 2010 United States Census, there were 2,465 people, 945 households, and 690 families residing in the CDP. The population density was 1,118.2 people per square mile. The racial makeup of the CDP was 74.2% White, 11.2% African American, 0.2% Native American, 10.2% Asian, 0.1% Pacific Islander, 1.7% from other races, and 2.6% from two or more races. Hispanic or Latino of any race were 5.2% of the population.
There were 945 households, out of which 33.2% had children under the age of 18 living with them, 59.2% were married couples living together, 8.2% had a female householder with no husband present, and 28.7% were non-families. 22.7% of all households were made up of individuals, and 8.2% had someone living alone who was 65 years of age or older. The average household size was 2.61 and the average family size was 3.09.
In the CDP, the population was spread out, with 24.2% under the age of 18, 5.2% from 18 to 24, 28.2% from 25 to 44, 28.7% from 45 to 64, and 13.7% who were 65 years of age or older. The median age was 40 years. For every 100 females, there were 94.2 males. For every 100 females age 18 and over, there were 91.2 males.
The median income for a household in the CDP was $90,972, and the median income for a family was $103,972. Males had a median income of $71,250 versus $50,000 for females. The per capita income for the CDP was $41,945. About 1.7% of families and 2.7% of the population were below the poverty line, including 2.2% of those under age 18 and 3.2% of those age 65 or over.
Common Questions
What is Per Capita Income in Princeton Junction?
Per Capita income in Princeton Junction is $90,679.
What is the Median Family Income in Princeton Junction?
Median Family Income in Princeton Junction is $250,001.
What is the Median Household income in Princeton Junction?
Median Household Income in Princeton Junction is $209,554.
What is Income or Wage Gap in Princeton Junction?
Income or Wage Gap in Princeton Junction is 45.5%.
Women in Princeton Junction earn 54.5 cents for every dollar earned by a man.
What is Inequality or Gini Index in Princeton Junction?
Inequality or Gini Index in Princeton Junction is 0.40.
What is the Total Population of Princeton Junction?
Total Population of Princeton Junction is 2,022.
What is the Total Male Population of Princeton Junction?
Total Male Population of Princeton Junction is 1,083.
What is the Total Female Population of Princeton Junction?
Total Female Population of Princeton Junction is 939.
What is the Ratio of Males per 100 Females in Princeton Junction?
There are 115.34 Males per 100 Females in Princeton Junction.
What is the Ratio of Females per 100 Males in Princeton Junction?
There are 86.70 Females per 100 Males in Princeton Junction.
What is the Median Population Age in Princeton Junction?
Median Population Age in Princeton Junction is 51.0 Years.
What is the Average Family Size in Princeton Junction
Average Family Size in Princeton Junction is 2.8 People.
What is the Average Household Size in Princeton Junction
Average Household Size in Princeton Junction is 2.4 People.
How Large is the Labor Force in Princeton Junction?
There are 1,246 People in the Labor Forcein in Princeton Junction.
What is the Percentage of People in the Labor Force in Princeton Junction?
76.0% of People are in the Labor Force in Princeton Junction.
What is the Unemployment Rate in Princeton Junction?
Unemployment Rate in Princeton Junction is 7.8%.