Griggstown, NJ Map & Demographics
Griggstown Map
Griggstown Overview
$60,540
PER CAPITA INCOME
$201,900
AVG FAMILY INCOME
$167,656
AVG HOUSEHOLD INCOME
0.33
INEQUALITY / GINI INDEX
1,102
TOTAL POPULATION
459
MALE POPULATION
643
FEMALE POPULATION
71.38
MALES / 100 FEMALES
140.09
FEMALES / 100 MALES
55.2
MEDIAN AGE
3.1
AVG FAMILY SIZE
2.8
AVG HOUSEHOLD SIZE
675
LABOR FORCE [ PEOPLE ]
67.9%
PERCENT IN LABOR FORCE
8.4%
UNEMPLOYMENT RATE
Income in Griggstown
Income Overview in Griggstown
Per Capita Income in Griggstown is $60,540, while median incomes of families and households are $201,900 and $167,656 respectively.
| Characteristic | Number | Measure |
| Per Capita Income | 1,102 | $60,540 |
| Median Family Income | 310 | $201,900 |
| Mean Family Income | 310 | $198,014 |
| Median Household Income | 397 | $167,656 |
| Mean Household Income | 397 | $178,178 |
| Income Deficit | 310 | $0 |
| Wage / Income Gap (%) | 1,102 | 0.00% |
| Wage / Income Gap ($) | 1,102 | 100.00¢ per $1 |
| Gini / Inequality Index | 1,102 | 0.33 |
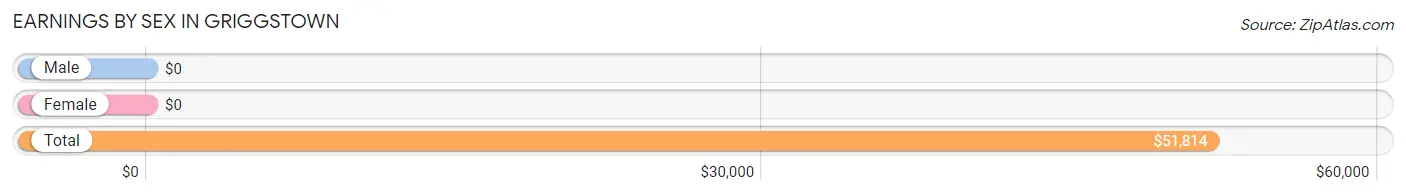
Earnings by Sex in Griggstown
| Sex | Number | Average Earnings |
| Male | 304 (43.8%) | $0 |
| Female | 390 (56.2%) | $0 |
| Total | 694 (100.0%) | $51,814 |
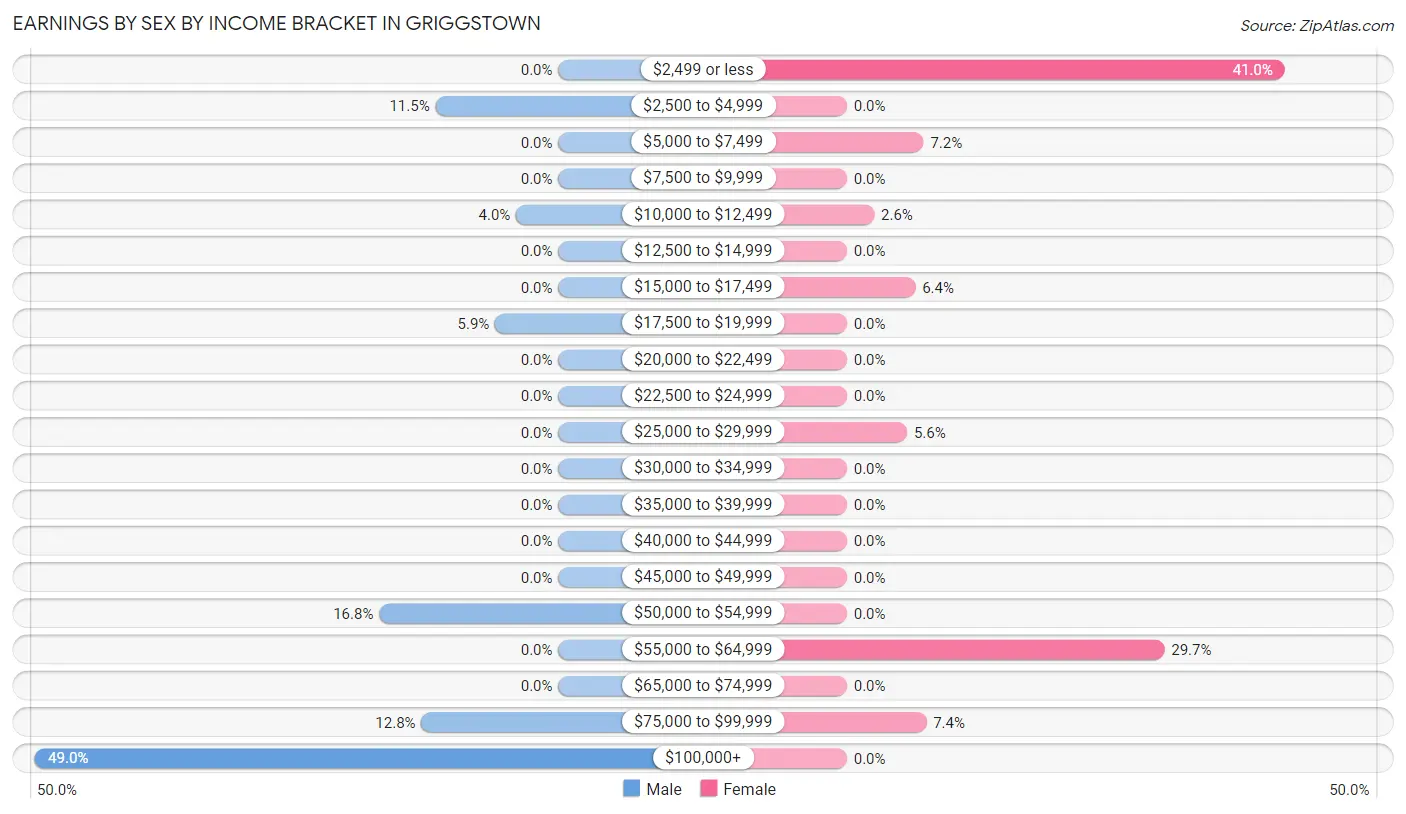
Earnings by Sex by Income Bracket in Griggstown
The most common earnings brackets in Griggstown are $100,000+ for men (149 | 49.0%) and $2,499 or less for women (160 | 41.0%).
| Income | Male | Female |
| $2,499 or less | 0 (0.0%) | 160 (41.0%) |
| $2,500 to $4,999 | 35 (11.5%) | 0 (0.0%) |
| $5,000 to $7,499 | 0 (0.0%) | 28 (7.2%) |
| $7,500 to $9,999 | 0 (0.0%) | 0 (0.0%) |
| $10,000 to $12,499 | 12 (4.0%) | 10 (2.6%) |
| $12,500 to $14,999 | 0 (0.0%) | 0 (0.0%) |
| $15,000 to $17,499 | 0 (0.0%) | 25 (6.4%) |
| $17,500 to $19,999 | 18 (5.9%) | 0 (0.0%) |
| $20,000 to $22,499 | 0 (0.0%) | 0 (0.0%) |
| $22,500 to $24,999 | 0 (0.0%) | 0 (0.0%) |
| $25,000 to $29,999 | 0 (0.0%) | 22 (5.6%) |
| $30,000 to $34,999 | 0 (0.0%) | 0 (0.0%) |
| $35,000 to $39,999 | 0 (0.0%) | 0 (0.0%) |
| $40,000 to $44,999 | 0 (0.0%) | 0 (0.0%) |
| $45,000 to $49,999 | 0 (0.0%) | 0 (0.0%) |
| $50,000 to $54,999 | 51 (16.8%) | 0 (0.0%) |
| $55,000 to $64,999 | 0 (0.0%) | 116 (29.7%) |
| $65,000 to $74,999 | 0 (0.0%) | 0 (0.0%) |
| $75,000 to $99,999 | 39 (12.8%) | 29 (7.4%) |
| $100,000+ | 149 (49.0%) | 0 (0.0%) |
| Total | 304 (100.0%) | 390 (100.0%) |
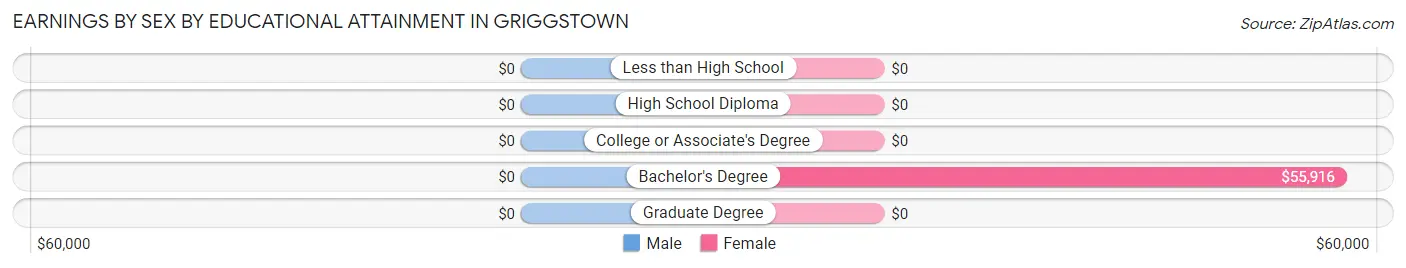
Earnings by Sex by Educational Attainment in Griggstown
| Educational Attainment | Male Income | Female Income |
| Less than High School | - | - |
| High School Diploma | - | - |
| College or Associate's Degree | - | - |
| Bachelor's Degree | - | - |
| Graduate Degree | - | - |
| Total | - | - |
Family Income in Griggstown
Family Income Brackets in Griggstown
According to the Griggstown family income data, there are 174 families falling into the $200,000+ income range, which is the most common income bracket and makes up 56.1% of all families.
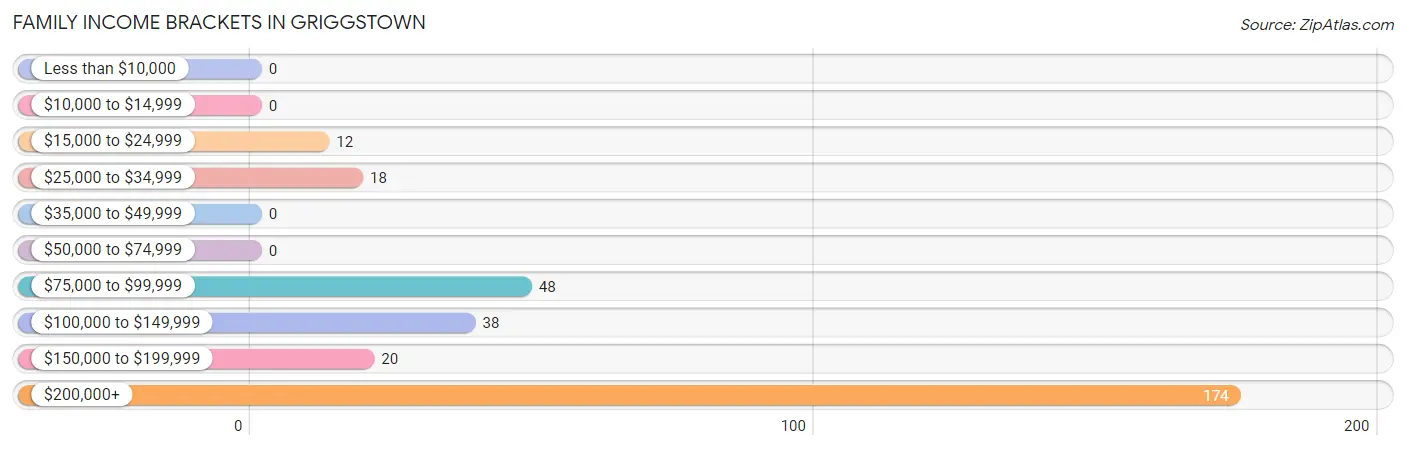
| Income Bracket | # Families | % Families |
| Less than $10,000 | 0 | 0.0% |
| $10,000 to $14,999 | 0 | 0.0% |
| $15,000 to $24,999 | 12 | 3.9% |
| $25,000 to $34,999 | 18 | 5.8% |
| $35,000 to $49,999 | 0 | 0.0% |
| $50,000 to $74,999 | 0 | 0.0% |
| $75,000 to $99,999 | 48 | 15.5% |
| $100,000 to $149,999 | 38 | 12.3% |
| $150,000 to $199,999 | 20 | 6.5% |
| $200,000+ | 174 | 56.1% |
Family Income by Famaliy Size in Griggstown
3-person families (147 | 47.4%) account for the highest median family income in Griggstown with $250,001 per family, while 3-person families (147 | 47.4%) have the highest median income of $83,334 per family member.
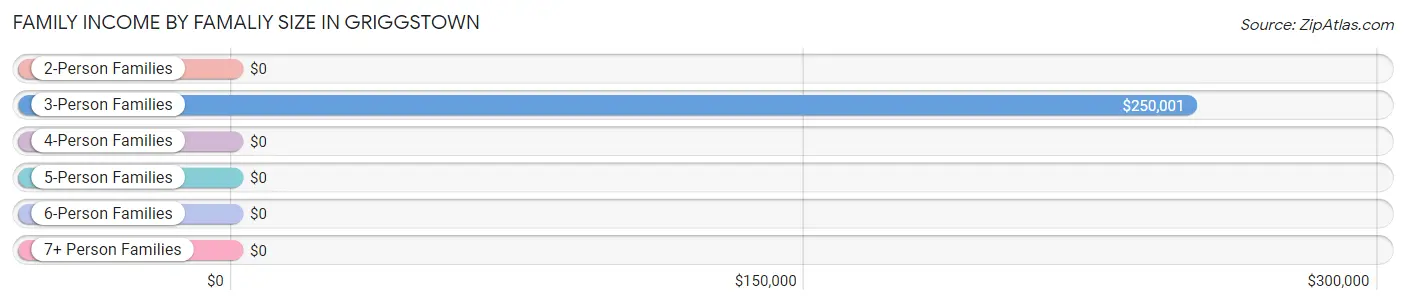
| Income Bracket | # Families | Median Income |
| 2-Person Families | 108 (34.8%) | $0 |
| 3-Person Families | 147 (47.4%) | $250,001 |
| 4-Person Families | 40 (12.9%) | $0 |
| 5-Person Families | 0 (0.0%) | $0 |
| 6-Person Families | 15 (4.8%) | $0 |
| 7+ Person Families | 0 (0.0%) | $0 |
| Total | 310 (100.0%) | $201,900 |
Family Income by Number of Earners in Griggstown
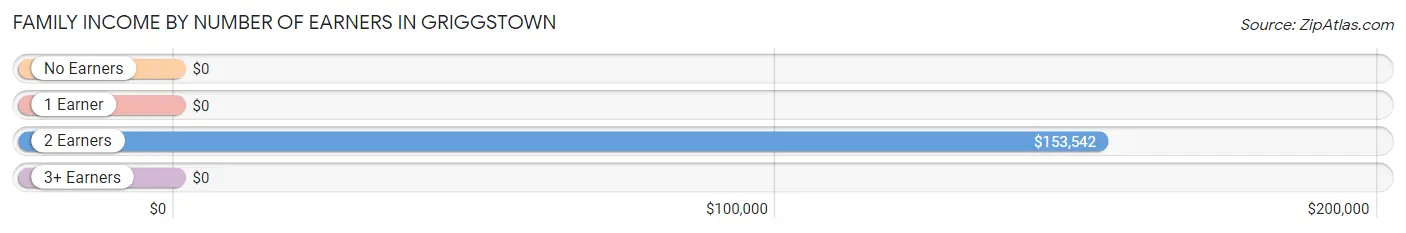
| Number of Earners | # Families | Median Income |
| No Earners | 19 (6.1%) | $0 |
| 1 Earner | 72 (23.2%) | $0 |
| 2 Earners | 110 (35.5%) | $153,542 |
| 3+ Earners | 109 (35.2%) | $0 |
| Total | 310 (100.0%) | $201,900 |
Household Income in Griggstown
Household Income Brackets in Griggstown
With 174 households falling in the category, the $200,000+ income range is the most frequent in Griggstown, accounting for 43.8% of all households.
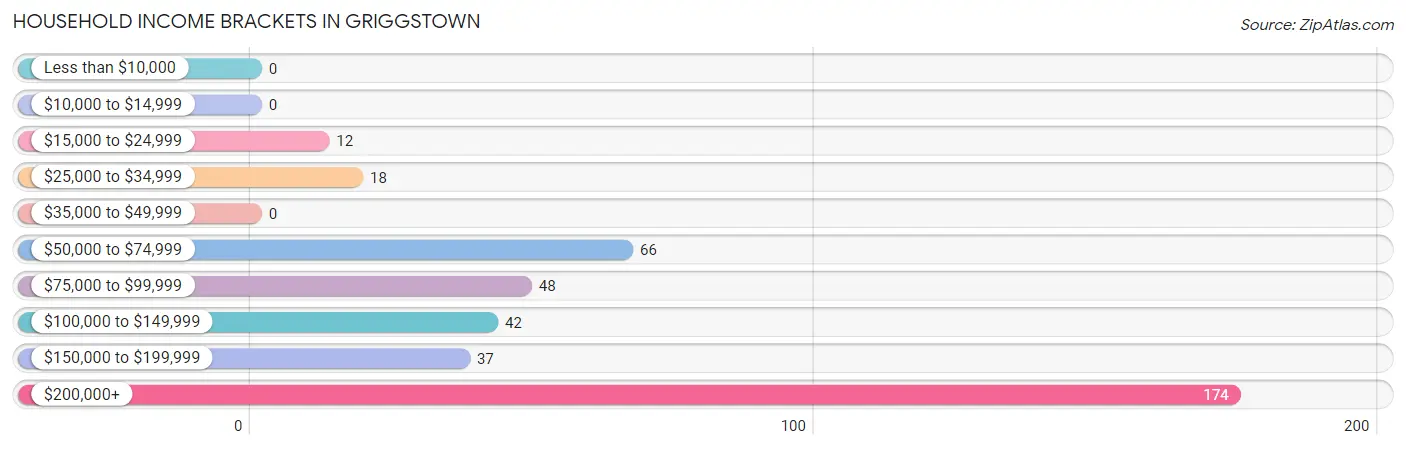
| Income Bracket | # Households | % Households |
| Less than $10,000 | 0 | 0.0% |
| $10,000 to $14,999 | 0 | 0.0% |
| $15,000 to $24,999 | 12 | 3.0% |
| $25,000 to $34,999 | 18 | 4.5% |
| $35,000 to $49,999 | 0 | 0.0% |
| $50,000 to $74,999 | 66 | 16.6% |
| $75,000 to $99,999 | 48 | 12.1% |
| $100,000 to $149,999 | 42 | 10.6% |
| $150,000 to $199,999 | 37 | 9.3% |
| $200,000+ | 174 | 43.8% |
Household Income by Householder Age in Griggstown
The median household income in Griggstown is $167,656, with the highest median household income of $250,001 found in the 45 to 64 years age bracket for the primary householder. A total of 210 households (52.9%) fall into this category.
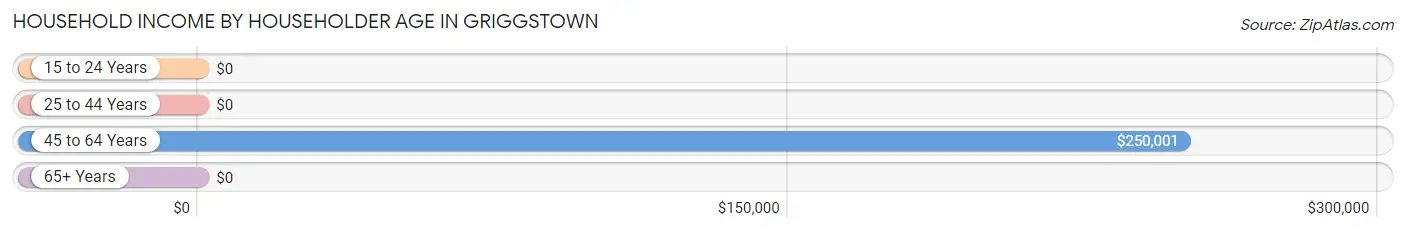
| Income Bracket | # Households | Median Income |
| 15 to 24 Years | 0 (0.0%) | $0 |
| 25 to 44 Years | 36 (9.1%) | $0 |
| 45 to 64 Years | 210 (52.9%) | $250,001 |
| 65+ Years | 151 (38.0%) | $0 |
| Total | 397 (100.0%) | $167,656 |
Poverty in Griggstown
Income Below Poverty by Sex and Age in Griggstown
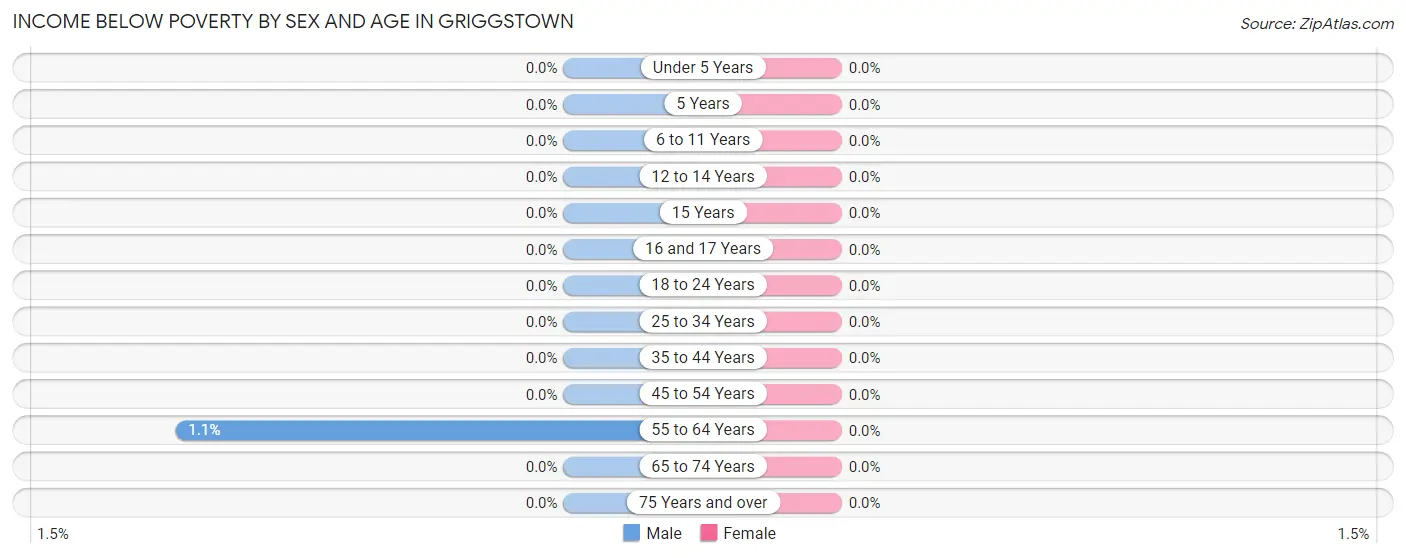
| Age Bracket | Male | Female |
| Under 5 Years | 0 (0.0%) | 0 (0.0%) |
| 5 Years | 0 (0.0%) | 0 (0.0%) |
| 6 to 11 Years | 0 (0.0%) | 0 (0.0%) |
| 12 to 14 Years | 0 (0.0%) | 0 (0.0%) |
| 15 Years | 0 (0.0%) | 0 (0.0%) |
| 16 and 17 Years | 0 (0.0%) | 0 (0.0%) |
| 18 to 24 Years | 0 (0.0%) | 0 (0.0%) |
| 25 to 34 Years | 0 (0.0%) | 0 (0.0%) |
| 35 to 44 Years | 0 (0.0%) | 0 (0.0%) |
| 45 to 54 Years | 0 (0.0%) | 0 (0.0%) |
| 55 to 64 Years | 2 (1.1%) | 0 (0.0%) |
| 65 to 74 Years | 0 (0.0%) | 0 (0.0%) |
| 75 Years and over | 0 (0.0%) | 0 (0.0%) |
| Total | 2 (0.4%) | 0 (0.0%) |
Income Above Poverty by Sex and Age in Griggstown
According to the poverty statistics in Griggstown, males aged under 5 years and females aged 6 to 11 years are the age groups that are most secure financially, with 100.0% of males and 100.0% of females in these age groups living above the poverty line.
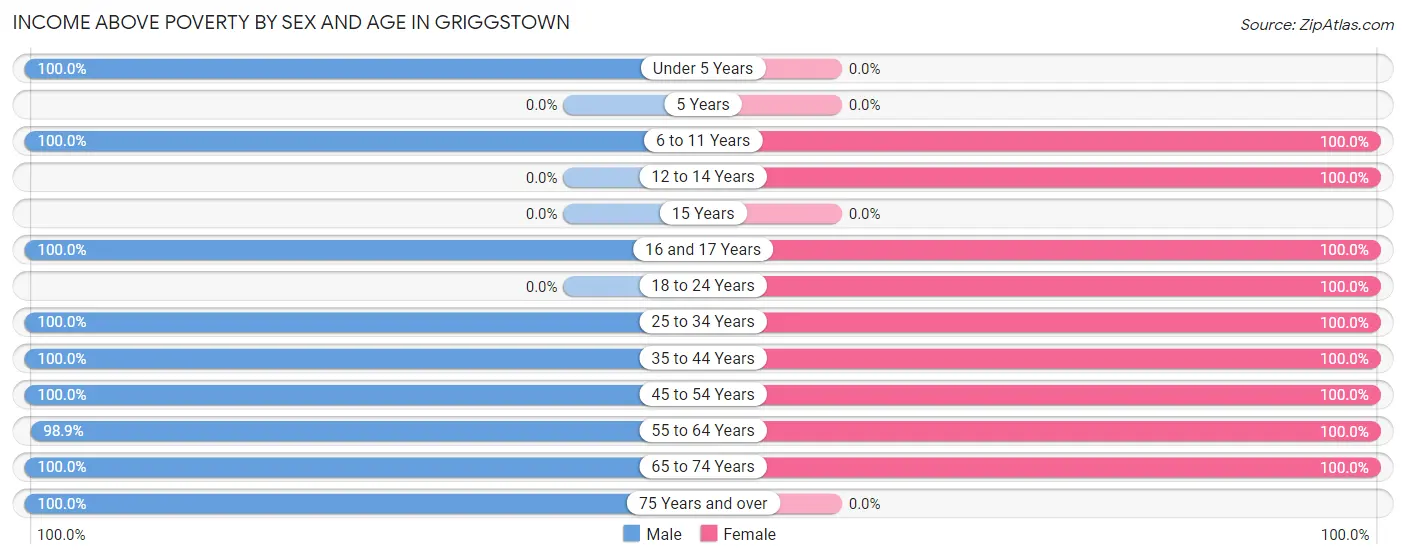
| Age Bracket | Male | Female |
| Under 5 Years | 36 (100.0%) | 0 (0.0%) |
| 5 Years | 0 (0.0%) | 0 (0.0%) |
| 6 to 11 Years | 14 (100.0%) | 18 (100.0%) |
| 12 to 14 Years | 0 (0.0%) | 40 (100.0%) |
| 15 Years | 0 (0.0%) | 0 (0.0%) |
| 16 and 17 Years | 21 (100.0%) | 43 (100.0%) |
| 18 to 24 Years | 0 (0.0%) | 150 (100.0%) |
| 25 to 34 Years | 27 (100.0%) | 30 (100.0%) |
| 35 to 44 Years | 36 (100.0%) | 36 (100.0%) |
| 45 to 54 Years | 39 (100.0%) | 41 (100.0%) |
| 55 to 64 Years | 183 (98.9%) | 172 (100.0%) |
| 65 to 74 Years | 38 (100.0%) | 113 (100.0%) |
| 75 Years and over | 63 (100.0%) | 0 (0.0%) |
| Total | 457 (99.6%) | 643 (100.0%) |
Income Below Poverty Among Married-Couple Families in Griggstown
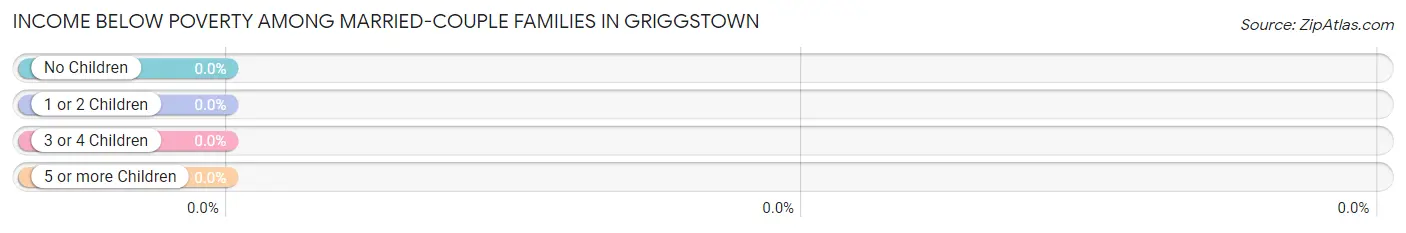
| Children | Above Poverty | Below Poverty |
| No Children | 188 (100.0%) | 0 (0.0%) |
| 1 or 2 Children | 93 (100.0%) | 0 (0.0%) |
| 3 or 4 Children | 0 (0.0%) | 0 (0.0%) |
| 5 or more Children | 0 (0.0%) | 0 (0.0%) |
| Total | 281 (100.0%) | 0 (0.0%) |
Income Below Poverty Among Single-Parent Households in Griggstown
| Children | Single Father | Single Mother |
| No Children | 0 (0.0%) | 0 (0.0%) |
| 1 or 2 Children | 0 (0.0%) | 0 (0.0%) |
| 3 or 4 Children | 0 (0.0%) | 0 (0.0%) |
| 5 or more Children | 0 (0.0%) | 0 (0.0%) |
| Total | 0 (0.0%) | 0 (0.0%) |
Income Below Poverty Among Married-Couple vs Single-Parent Households in Griggstown
| Children | Married-Couple Families | Single-Parent Households |
| No Children | 0 (0.0%) | 0 (0.0%) |
| 1 or 2 Children | 0 (0.0%) | 0 (0.0%) |
| 3 or 4 Children | 0 (0.0%) | 0 (0.0%) |
| 5 or more Children | 0 (0.0%) | 0 (0.0%) |
| Total | 0 (0.0%) | 0 (0.0%) |
Race in Griggstown
The most populous races in Griggstown are White / Caucasian (879 | 79.8%), Asian (134 | 12.2%), and Two or more Races (70 | 6.4%).
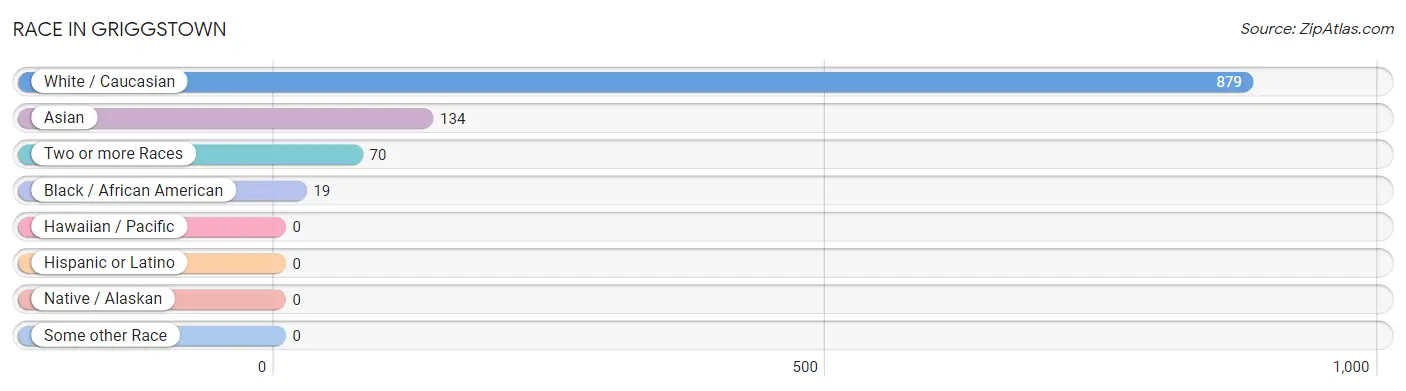
| Race | # Population | % Population |
| Asian | 134 | 12.2% |
| Black / African American | 19 | 1.7% |
| Hawaiian / Pacific | 0 | 0.0% |
| Hispanic or Latino | 0 | 0.0% |
| Native / Alaskan | 0 | 0.0% |
| White / Caucasian | 879 | 79.8% |
| Two or more Races | 70 | 6.4% |
| Some other Race | 0 | 0.0% |
| Total | 1,102 | 100.0% |
Ancestry in Griggstown
The most populous ancestries reported in Griggstown are Norwegian (179 | 16.2%), German (166 | 15.1%), Russian (162 | 14.7%), English (154 | 14.0%), and Thai (134 | 12.2%), together accounting for 72.1% of all Griggstown residents.
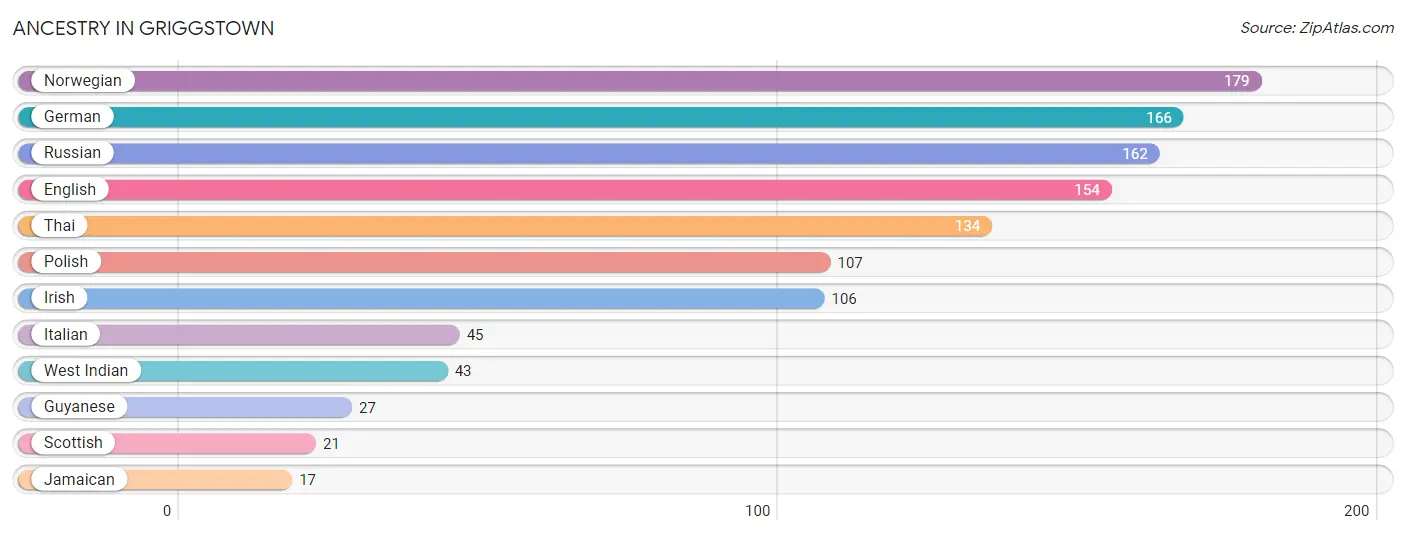
| Ancestry | # Population | % Population |
| English | 154 | 14.0% |
| German | 166 | 15.1% |
| Guyanese | 27 | 2.5% |
| Irish | 106 | 9.6% |
| Italian | 45 | 4.1% |
| Jamaican | 17 | 1.5% |
| Norwegian | 179 | 16.2% |
| Polish | 107 | 9.7% |
| Russian | 162 | 14.7% |
| Scottish | 21 | 1.9% |
| Thai | 134 | 12.2% |
| West Indian | 43 | 3.9% | View All 12 Rows |
Immigrants in Griggstown
The most numerous immigrant groups reported in Griggstown came from Europe (191 | 17.3%), Eastern Europe (150 | 13.6%), Russia (150 | 13.6%), Asia (103 | 9.3%), and South Central Asia (103 | 9.3%), together accounting for 63.3% of all Griggstown residents.
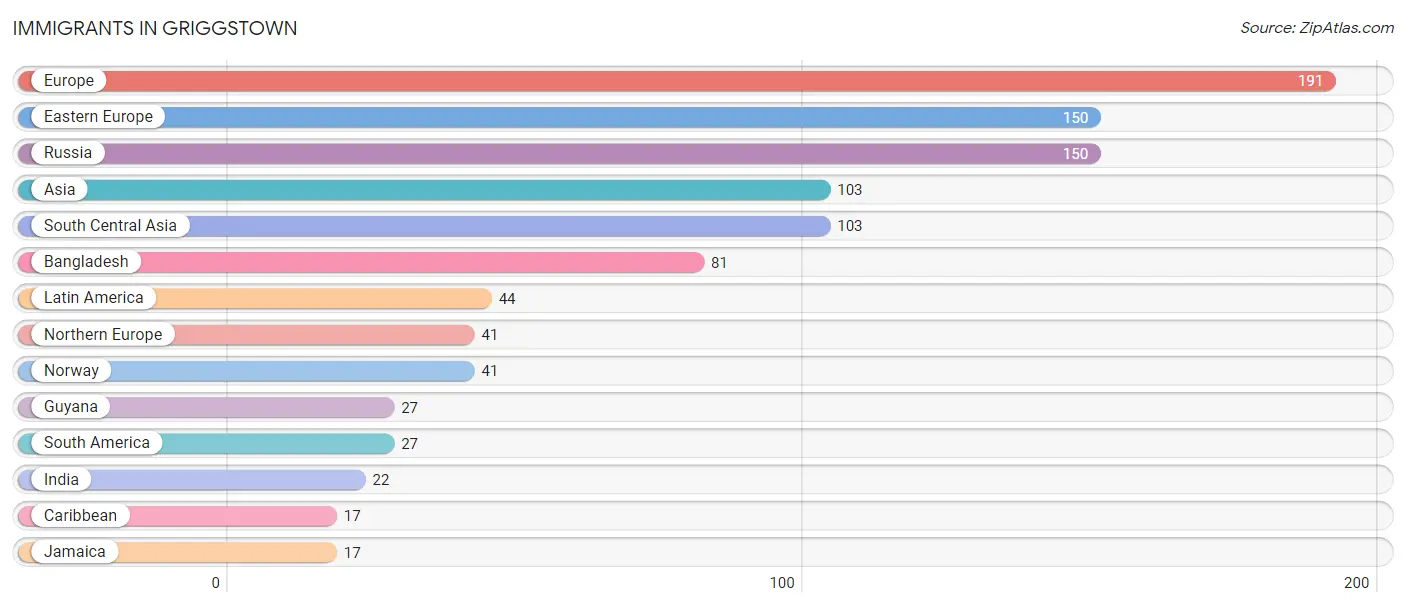
| Immigration Origin | # Population | % Population |
| Asia | 103 | 9.3% |
| Bangladesh | 81 | 7.3% |
| Caribbean | 17 | 1.5% |
| Eastern Europe | 150 | 13.6% |
| Europe | 191 | 17.3% |
| Guyana | 27 | 2.5% |
| India | 22 | 2.0% |
| Jamaica | 17 | 1.5% |
| Latin America | 44 | 4.0% |
| Northern Europe | 41 | 3.7% |
| Norway | 41 | 3.7% |
| Russia | 150 | 13.6% |
| South America | 27 | 2.5% |
| South Central Asia | 103 | 9.3% | View All 14 Rows |
Sex and Age in Griggstown
Sex and Age in Griggstown
The most populous age groups in Griggstown are 55 to 59 Years (143 | 31.1%) for men and 15 to 19 Years (193 | 30.0%) for women.
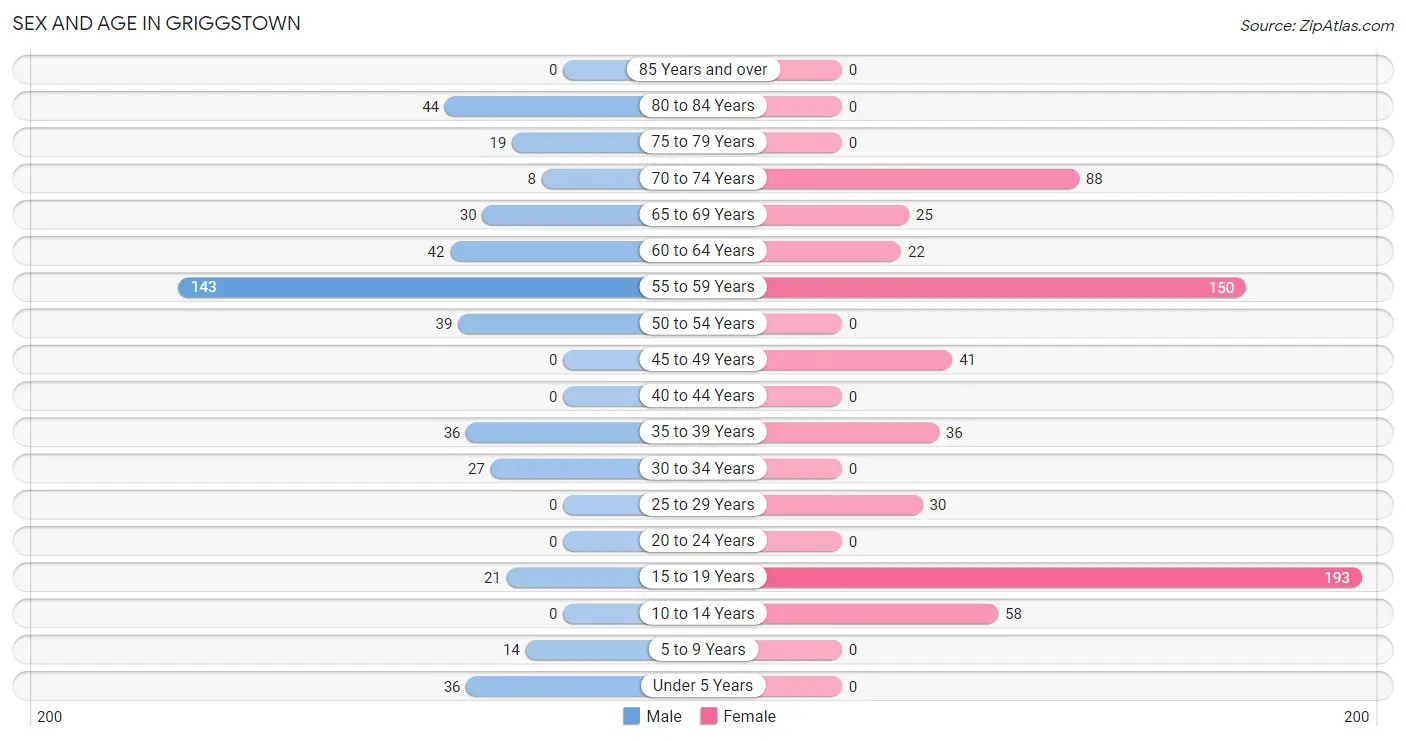
| Age Bracket | Male | Female |
| Under 5 Years | 36 (7.8%) | 0 (0.0%) |
| 5 to 9 Years | 14 (3.0%) | 0 (0.0%) |
| 10 to 14 Years | 0 (0.0%) | 58 (9.0%) |
| 15 to 19 Years | 21 (4.6%) | 193 (30.0%) |
| 20 to 24 Years | 0 (0.0%) | 0 (0.0%) |
| 25 to 29 Years | 0 (0.0%) | 30 (4.7%) |
| 30 to 34 Years | 27 (5.9%) | 0 (0.0%) |
| 35 to 39 Years | 36 (7.8%) | 36 (5.6%) |
| 40 to 44 Years | 0 (0.0%) | 0 (0.0%) |
| 45 to 49 Years | 0 (0.0%) | 41 (6.4%) |
| 50 to 54 Years | 39 (8.5%) | 0 (0.0%) |
| 55 to 59 Years | 143 (31.1%) | 150 (23.3%) |
| 60 to 64 Years | 42 (9.1%) | 22 (3.4%) |
| 65 to 69 Years | 30 (6.5%) | 25 (3.9%) |
| 70 to 74 Years | 8 (1.7%) | 88 (13.7%) |
| 75 to 79 Years | 19 (4.1%) | 0 (0.0%) |
| 80 to 84 Years | 44 (9.6%) | 0 (0.0%) |
| 85 Years and over | 0 (0.0%) | 0 (0.0%) |
| Total | 459 (100.0%) | 643 (100.0%) |
Families and Households in Griggstown
Median Family Size in Griggstown
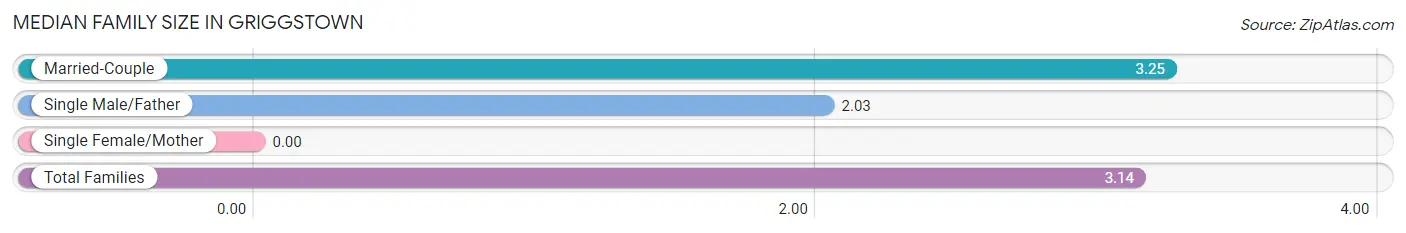
| Family Type | # Families | Family Size |
| Married-Couple | 281 (90.6%) | 3.25 |
| Single Male/Father | 29 (9.3%) | 2.03 |
| Single Female/Mother | 0 (0.0%) | - |
| Total Families | 310 (100.0%) | 3.14 |
Median Household Size in Griggstown
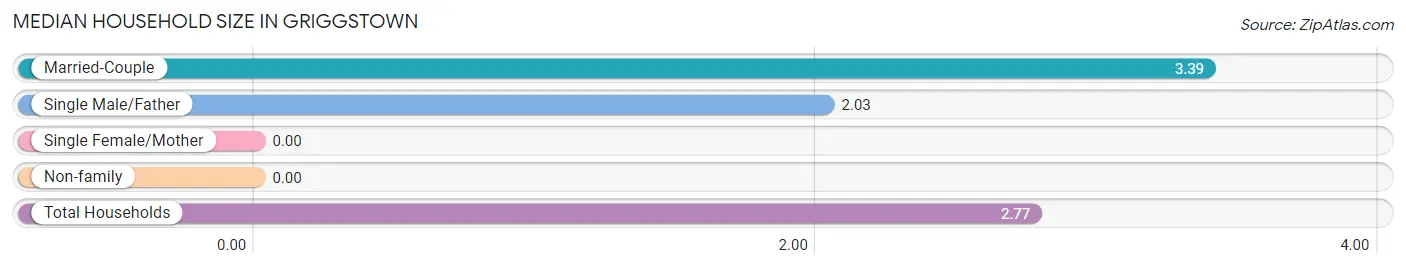
| Household Type | # Households | Household Size |
| Married-Couple | 281 (70.8%) | 3.39 |
| Single Male/Father | 29 (7.3%) | 2.03 |
| Single Female/Mother | 0 (0.0%) | - |
| Non-family | 87 (21.9%) | - |
| Total Households | 397 (100.0%) | 2.77 |
Household Size by Marriage Status in Griggstown
Out of a total of 397 households in Griggstown, 310 (78.1%) are family households, while 87 (21.9%) are nonfamily households. The most numerous type of family households are 3-person households, comprising 130, and the most common type of nonfamily households are 1-person households, comprising 87.
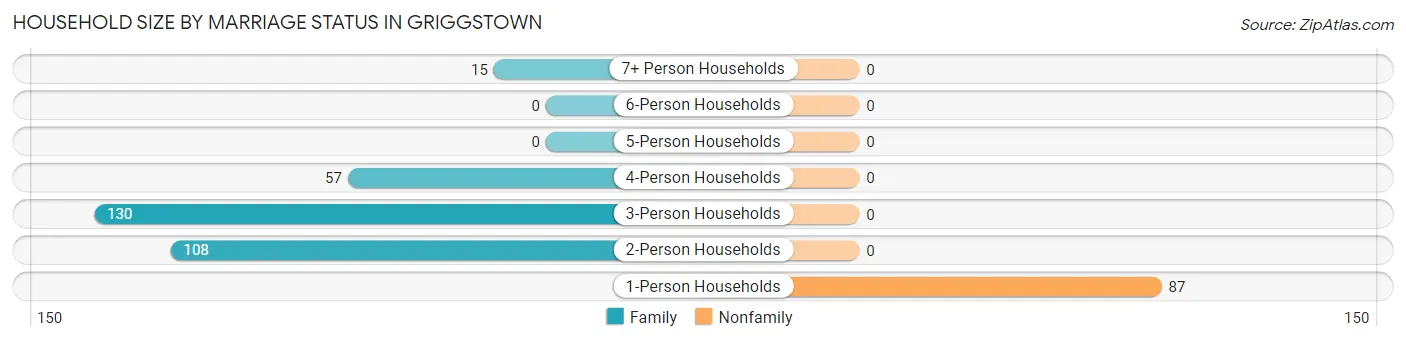
| Household Size | Family Households | Nonfamily Households |
| 1-Person Households | - | 87 (21.9%) |
| 2-Person Households | 108 (27.2%) | 0 (0.0%) |
| 3-Person Households | 130 (32.8%) | 0 (0.0%) |
| 4-Person Households | 57 (14.4%) | 0 (0.0%) |
| 5-Person Households | 0 (0.0%) | 0 (0.0%) |
| 6-Person Households | 0 (0.0%) | 0 (0.0%) |
| 7+ Person Households | 15 (3.8%) | 0 (0.0%) |
| Total | 310 (78.1%) | 87 (21.9%) |
Female Fertility in Griggstown
Fertility by Age in Griggstown
Average fertility rate in Griggstown is 70.0 births per 1,000 women. Women in the age bracket of 35 to 50 years have the highest fertility rate with 273.0 births per 1,000 women. Women in the age bracket of 35 to 50 years acount for 100.0% of all women with births.
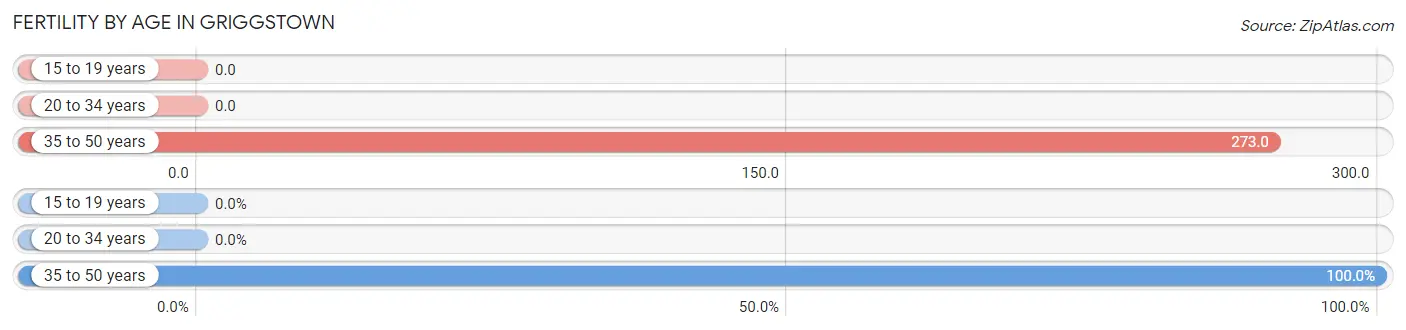
| Age Bracket | Women with Births | Births / 1,000 Women |
| 15 to 19 years | 0 (0.0%) | 0.0 |
| 20 to 34 years | 0 (0.0%) | 0.0 |
| 35 to 50 years | 21 (100.0%) | 273.0 |
| Total | 21 (100.0%) | 70.0 |
Fertility by Age by Marriage Status in Griggstown
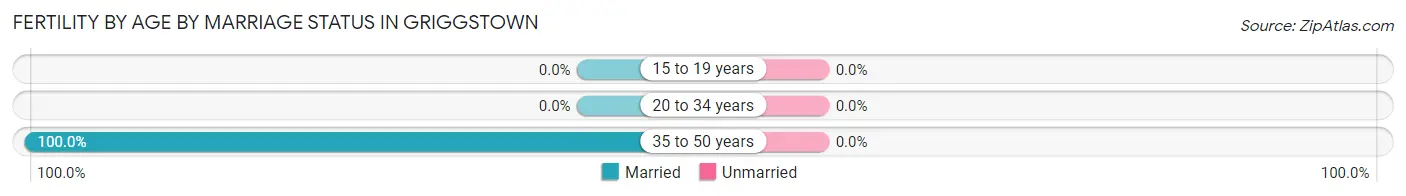
| Age Bracket | Married | Unmarried |
| 15 to 19 years | 0 (0.0%) | 0 (0.0%) |
| 20 to 34 years | 0 (0.0%) | 0 (0.0%) |
| 35 to 50 years | 21 (100.0%) | 0 (0.0%) |
| Total | 21 (100.0%) | 0 (0.0%) |
Fertility by Education in Griggstown
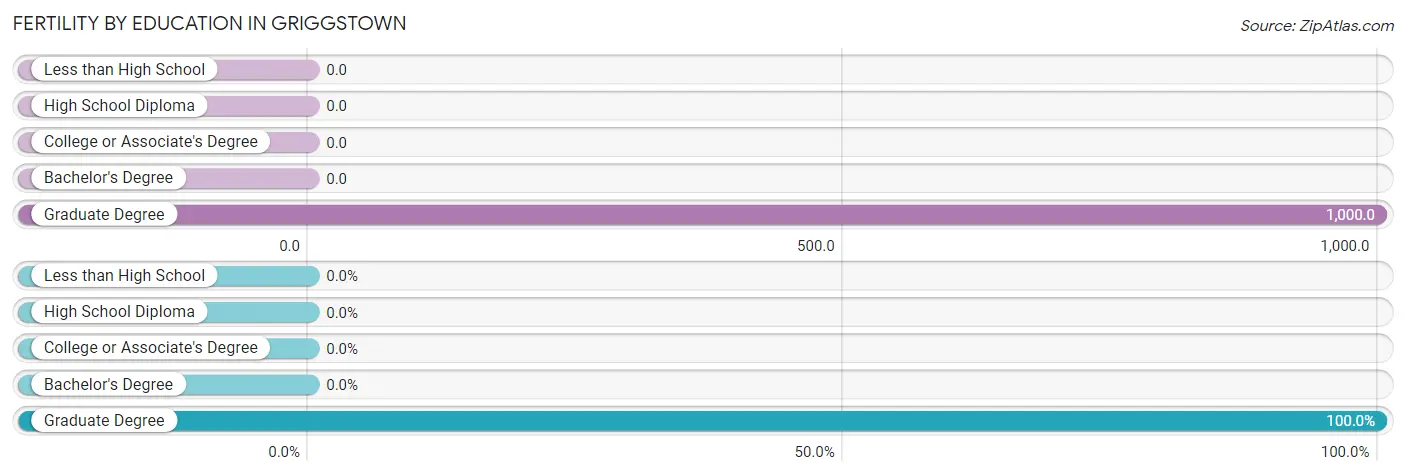
| Educational Attainment | Women with Births | Births / 1,000 Women |
| Less than High School | 0 (0.0%) | 0.0 |
| High School Diploma | 0 (0.0%) | 0.0 |
| College or Associate's Degree | 0 (0.0%) | 0.0 |
| Bachelor's Degree | 0 (0.0%) | 0.0 |
| Graduate Degree | 21 (100.0%) | 1,000.0 |
| Total | 21 (100.0%) | 70.0 |
Fertility by Education by Marriage Status in Griggstown
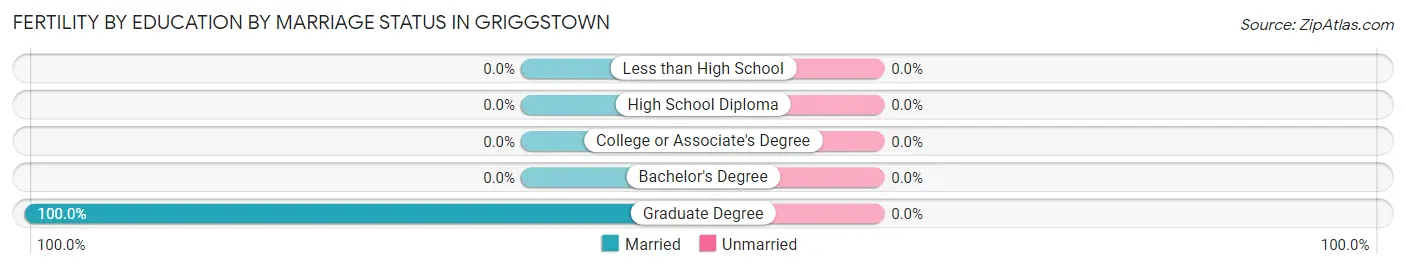
| Educational Attainment | Married | Unmarried |
| Less than High School | 0 (0.0%) | 0 (0.0%) |
| High School Diploma | 0 (0.0%) | 0 (0.0%) |
| College or Associate's Degree | 0 (0.0%) | 0 (0.0%) |
| Bachelor's Degree | 0 (0.0%) | 0 (0.0%) |
| Graduate Degree | 21 (100.0%) | 0 (0.0%) |
| Total | 21 (100.0%) | 0 (0.0%) |
Employment Characteristics in Griggstown
Employment by Class of Employer in Griggstown
Among the 618 employed individuals in Griggstown, private company employees (416 | 67.3%), self-employed (not incorporated) (113 | 18.3%), and state government employees (36 | 5.8%) make up the most common classes of employment.
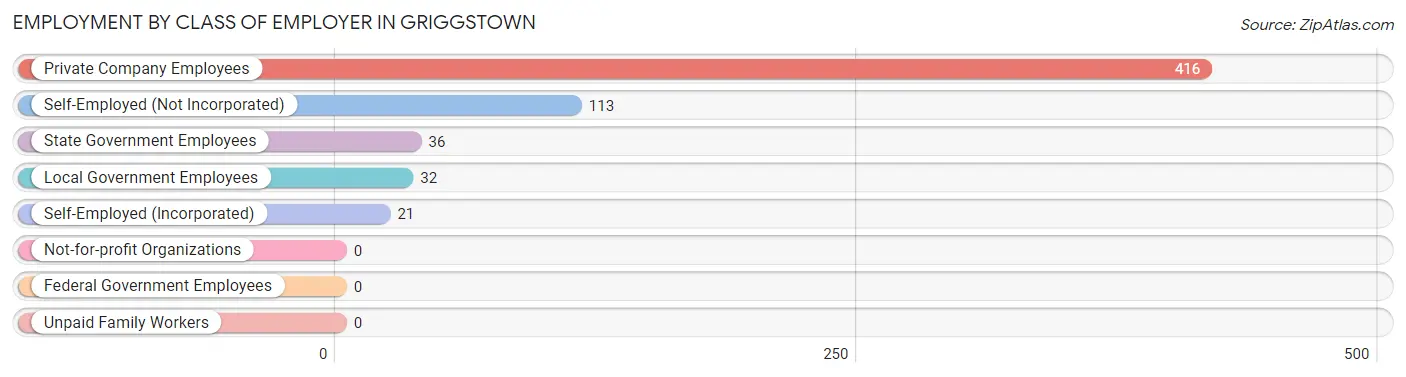
| Employer Class | # Employees | % Employees |
| Private Company Employees | 416 | 67.3% |
| Self-Employed (Incorporated) | 21 | 3.4% |
| Self-Employed (Not Incorporated) | 113 | 18.3% |
| Not-for-profit Organizations | 0 | 0.0% |
| Local Government Employees | 32 | 5.2% |
| State Government Employees | 36 | 5.8% |
| Federal Government Employees | 0 | 0.0% |
| Unpaid Family Workers | 0 | 0.0% |
| Total | 618 | 100.0% |
Employment Status by Age in Griggstown
According to the labor force statistics for Griggstown, out of the total population over 16 years of age (994), 67.9% or 675 individuals are in the labor force, with 8.4% or 57 of them unemployed. The age group with the highest labor force participation rate is 25 to 29 years, with 100.0% or 30 individuals in the labor force. Within the labor force, the 25 to 29 years age range has the highest percentage of unemployed individuals, with 100.0% or 30 of them being unemployed.
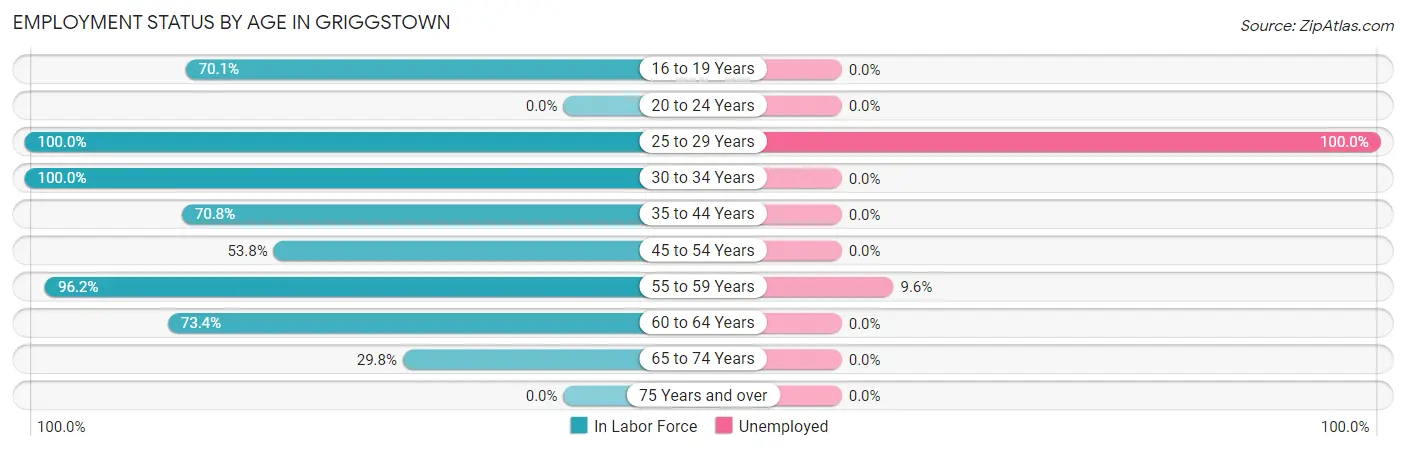
| Age Bracket | In Labor Force | Unemployed |
| 16 to 19 Years | 150 (70.1%) | 0 (0.0%) |
| 20 to 24 Years | 0 (0.0%) | 0 (0.0%) |
| 25 to 29 Years | 30 (100.0%) | 30 (100.0%) |
| 30 to 34 Years | 27 (100.0%) | 0 (0.0%) |
| 35 to 44 Years | 51 (70.8%) | 0 (0.0%) |
| 45 to 54 Years | 43 (53.8%) | 0 (0.0%) |
| 55 to 59 Years | 282 (96.2%) | 27 (9.6%) |
| 60 to 64 Years | 47 (73.4%) | 0 (0.0%) |
| 65 to 74 Years | 45 (29.8%) | 0 (0.0%) |
| 75 Years and over | 0 (0.0%) | 0 (0.0%) |
| Total | 675 (67.9%) | 57 (8.4%) |
Employment Status by Educational Attainment in Griggstown
According to labor force statistics for Griggstown, 84.8% of individuals (480) out of the total population between 25 and 64 years of age (566) are in the labor force, with 11.9% or 57 of them being unemployed. The group with the highest labor force participation rate are those with the educational attainment of bachelor's degree or higher, with 94.7% or 377 individuals in the labor force. Within the labor force, individuals with bachelor's degree or higher education have the highest percentage of unemployment, with 15.1% or 57 of them being unemployed.
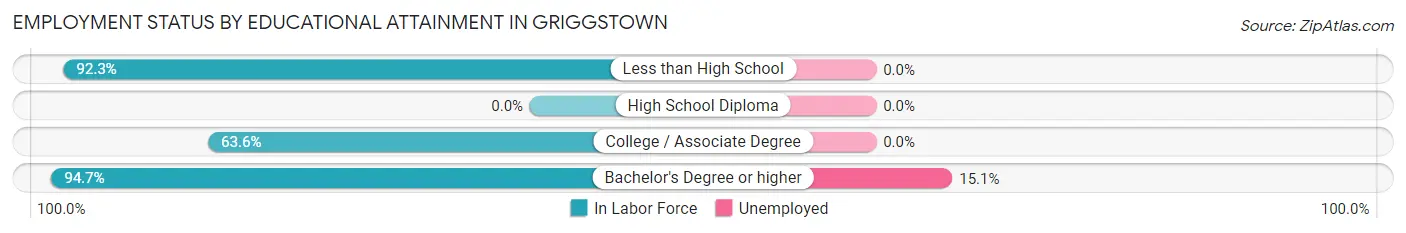
| Educational Attainment | In Labor Force | Unemployed |
| Less than High School | 12 (92.3%) | 0 (0.0%) |
| High School Diploma | 0 (0.0%) | 0 (0.0%) |
| College / Associate Degree | 91 (63.6%) | 0 (0.0%) |
| Bachelor's Degree or higher | 377 (94.7%) | 60 (15.1%) |
| Total | 480 (84.8%) | 67 (11.9%) |
Employment Occupations by Sex in Griggstown
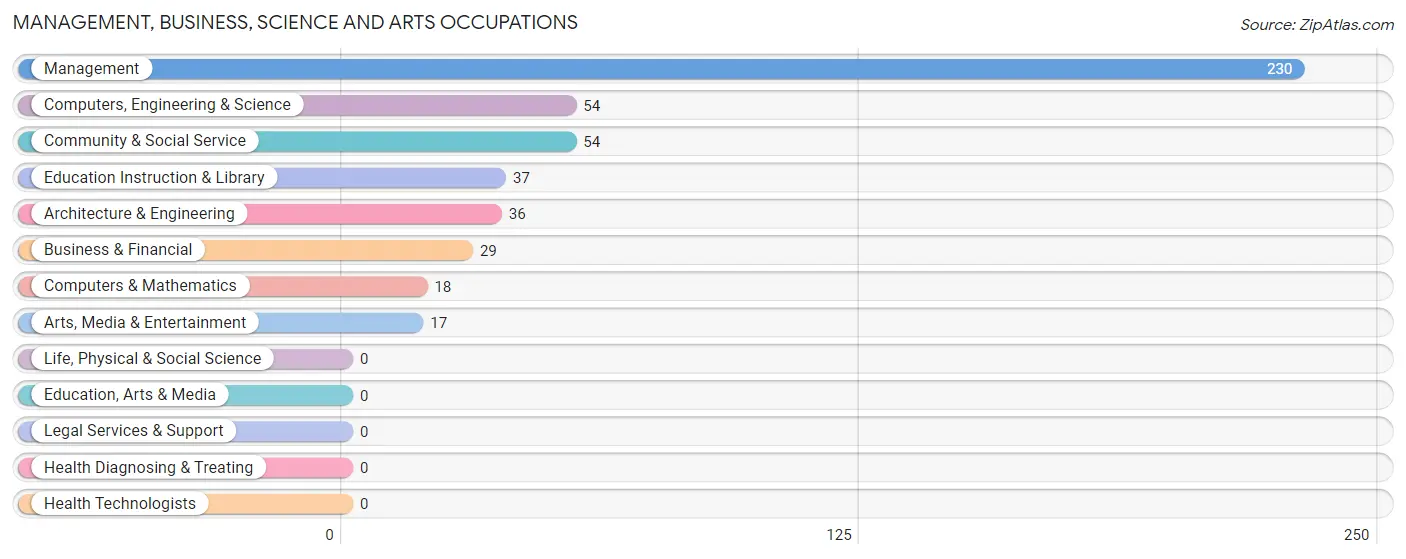
Management, Business, Science and Arts Occupations
The most common Management, Business, Science and Arts occupations in Griggstown are Management (230 | 37.2%), Computers, Engineering & Science (54 | 8.7%), Community & Social Service (54 | 8.7%), Education Instruction & Library (37 | 6.0%), and Architecture & Engineering (36 | 5.8%).
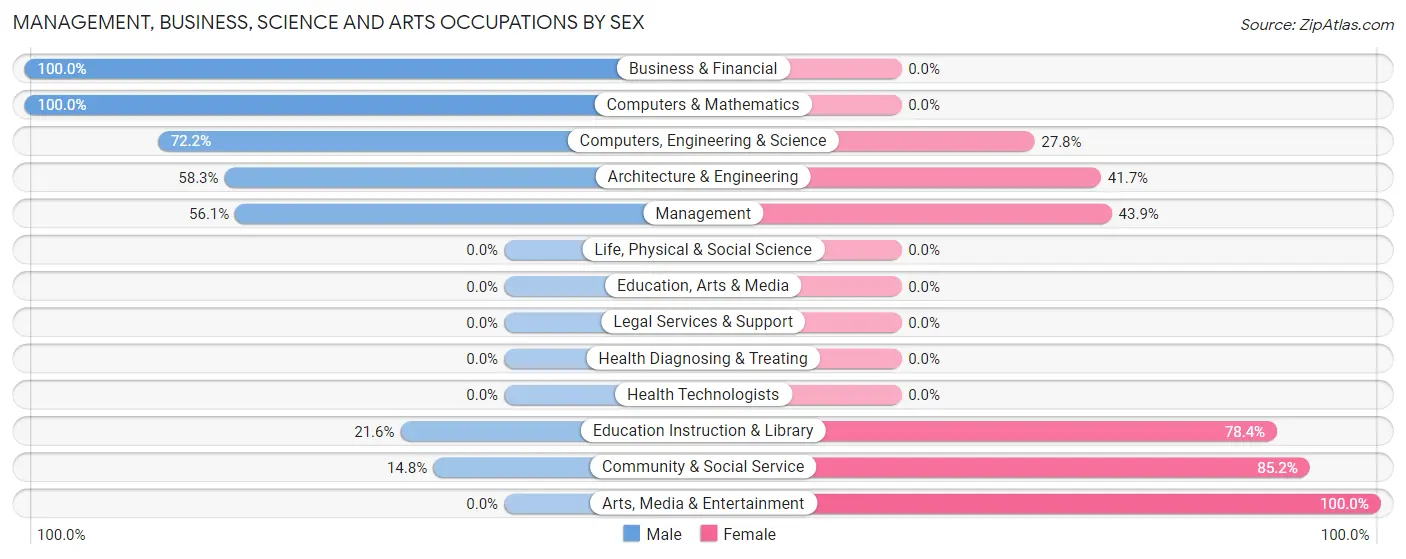
Management, Business, Science and Arts Occupations by Sex
Within the Management, Business, Science and Arts occupations in Griggstown, the most male-oriented occupations are Business & Financial (100.0%), Computers & Mathematics (100.0%), and Computers, Engineering & Science (72.2%), while the most female-oriented occupations are Arts, Media & Entertainment (100.0%), Community & Social Service (85.2%), and Education Instruction & Library (78.4%).
| Occupation | Male | Female |
| Management | 129 (56.1%) | 101 (43.9%) |
| Business & Financial | 29 (100.0%) | 0 (0.0%) |
| Computers, Engineering & Science | 39 (72.2%) | 15 (27.8%) |
| Computers & Mathematics | 18 (100.0%) | 0 (0.0%) |
| Architecture & Engineering | 21 (58.3%) | 15 (41.7%) |
| Life, Physical & Social Science | 0 (0.0%) | 0 (0.0%) |
| Community & Social Service | 8 (14.8%) | 46 (85.2%) |
| Education, Arts & Media | 0 (0.0%) | 0 (0.0%) |
| Legal Services & Support | 0 (0.0%) | 0 (0.0%) |
| Education Instruction & Library | 8 (21.6%) | 29 (78.4%) |
| Arts, Media & Entertainment | 0 (0.0%) | 17 (100.0%) |
| Health Diagnosing & Treating | 0 (0.0%) | 0 (0.0%) |
| Health Technologists | 0 (0.0%) | 0 (0.0%) |
| Total (Category) | 205 (55.9%) | 162 (44.1%) |
| Total (Overall) | 259 (41.9%) | 359 (58.1%) |
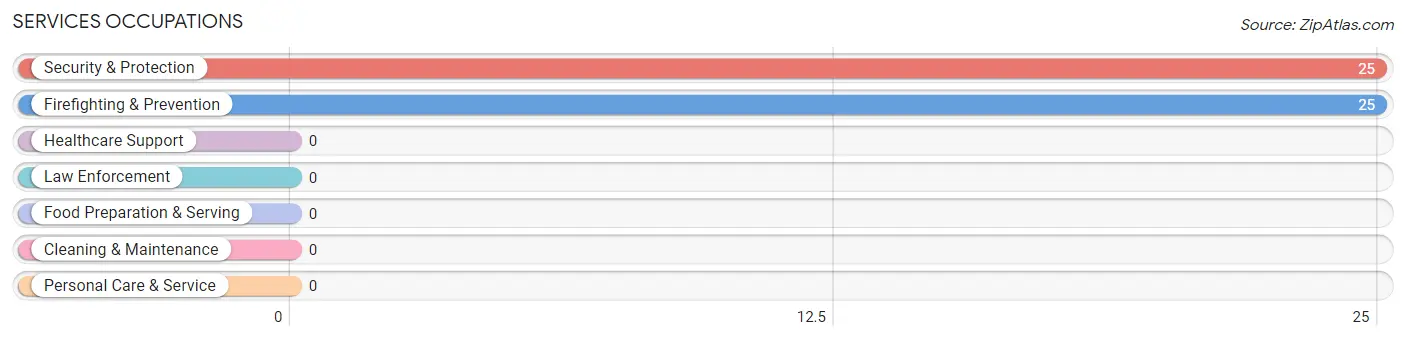
Services Occupations
The most common Services occupations in Griggstown are Security & Protection (25 | 4.1%), and Firefighting & Prevention (25 | 4.1%).
Services Occupations by Sex
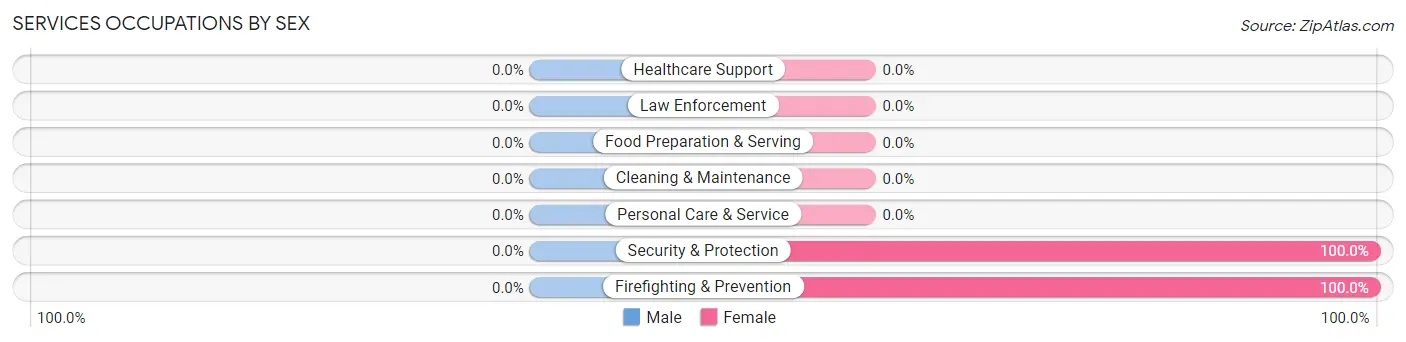
| Occupation | Male | Female |
| Healthcare Support | 0 (0.0%) | 0 (0.0%) |
| Security & Protection | 0 (0.0%) | 25 (100.0%) |
| Firefighting & Prevention | 0 (0.0%) | 25 (100.0%) |
| Law Enforcement | 0 (0.0%) | 0 (0.0%) |
| Food Preparation & Serving | 0 (0.0%) | 0 (0.0%) |
| Cleaning & Maintenance | 0 (0.0%) | 0 (0.0%) |
| Personal Care & Service | 0 (0.0%) | 0 (0.0%) |
| Total (Category) | 0 (0.0%) | 25 (100.0%) |
| Total (Overall) | 259 (41.9%) | 359 (58.1%) |
Sales and Office Occupations
The most common Sales and Office occupations in Griggstown are Sales & Related (23 | 3.7%), and Office & Administration (12 | 1.9%).
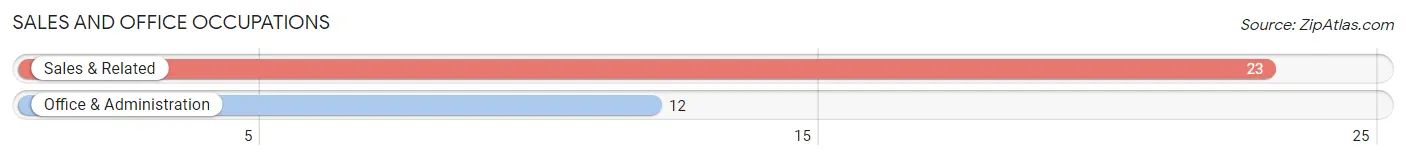
Sales and Office Occupations by Sex
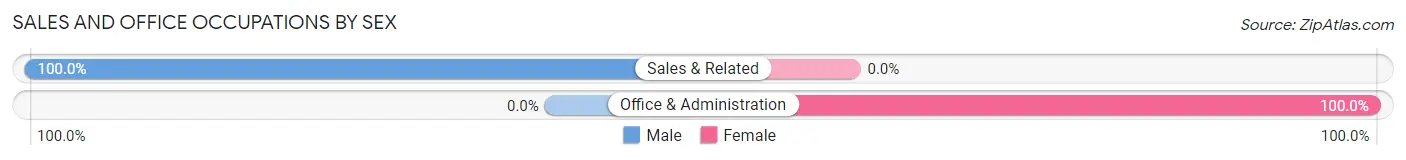
| Occupation | Male | Female |
| Sales & Related | 23 (100.0%) | 0 (0.0%) |
| Office & Administration | 0 (0.0%) | 12 (100.0%) |
| Total (Category) | 23 (65.7%) | 12 (34.3%) |
| Total (Overall) | 259 (41.9%) | 359 (58.1%) |
Natural Resources, Construction and Maintenance Occupations
The most common Natural Resources, Construction and Maintenance occupations in Griggstown are Farming, Fishing & Forestry (150 | 24.3%), and Construction & Extraction (9 | 1.5%).
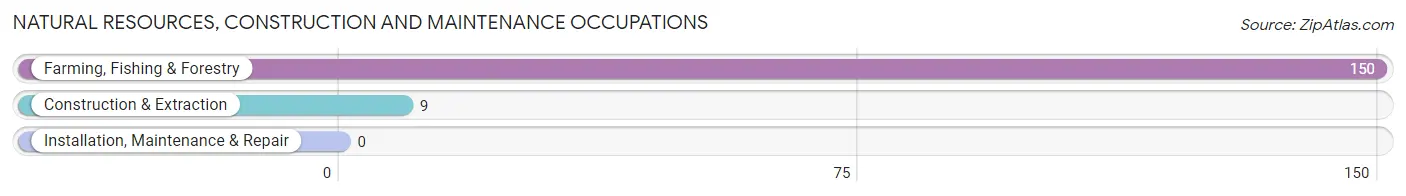
Natural Resources, Construction and Maintenance Occupations by Sex
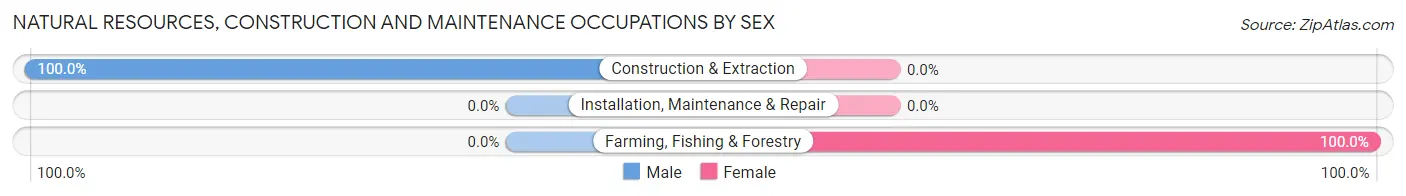
| Occupation | Male | Female |
| Farming, Fishing & Forestry | 0 (0.0%) | 150 (100.0%) |
| Construction & Extraction | 9 (100.0%) | 0 (0.0%) |
| Installation, Maintenance & Repair | 0 (0.0%) | 0 (0.0%) |
| Total (Category) | 9 (5.7%) | 150 (94.3%) |
| Total (Overall) | 259 (41.9%) | 359 (58.1%) |
Production, Transportation and Moving Occupations
The most common Production, Transportation and Moving occupations in Griggstown are Material Moving (22 | 3.6%), and Transportation (10 | 1.6%).
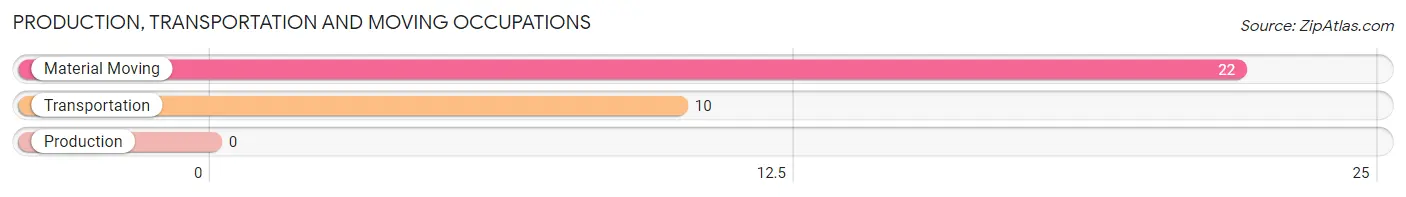
Production, Transportation and Moving Occupations by Sex
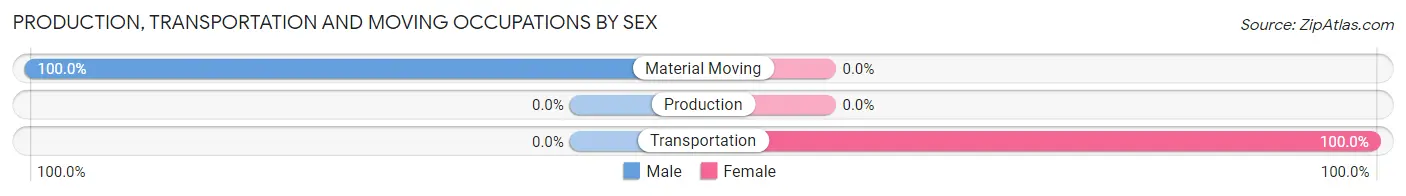
| Occupation | Male | Female |
| Production | 0 (0.0%) | 0 (0.0%) |
| Transportation | 0 (0.0%) | 10 (100.0%) |
| Material Moving | 22 (100.0%) | 0 (0.0%) |
| Total (Category) | 22 (68.8%) | 10 (31.2%) |
| Total (Overall) | 259 (41.9%) | 359 (58.1%) |
Employment Industries by Sex in Griggstown
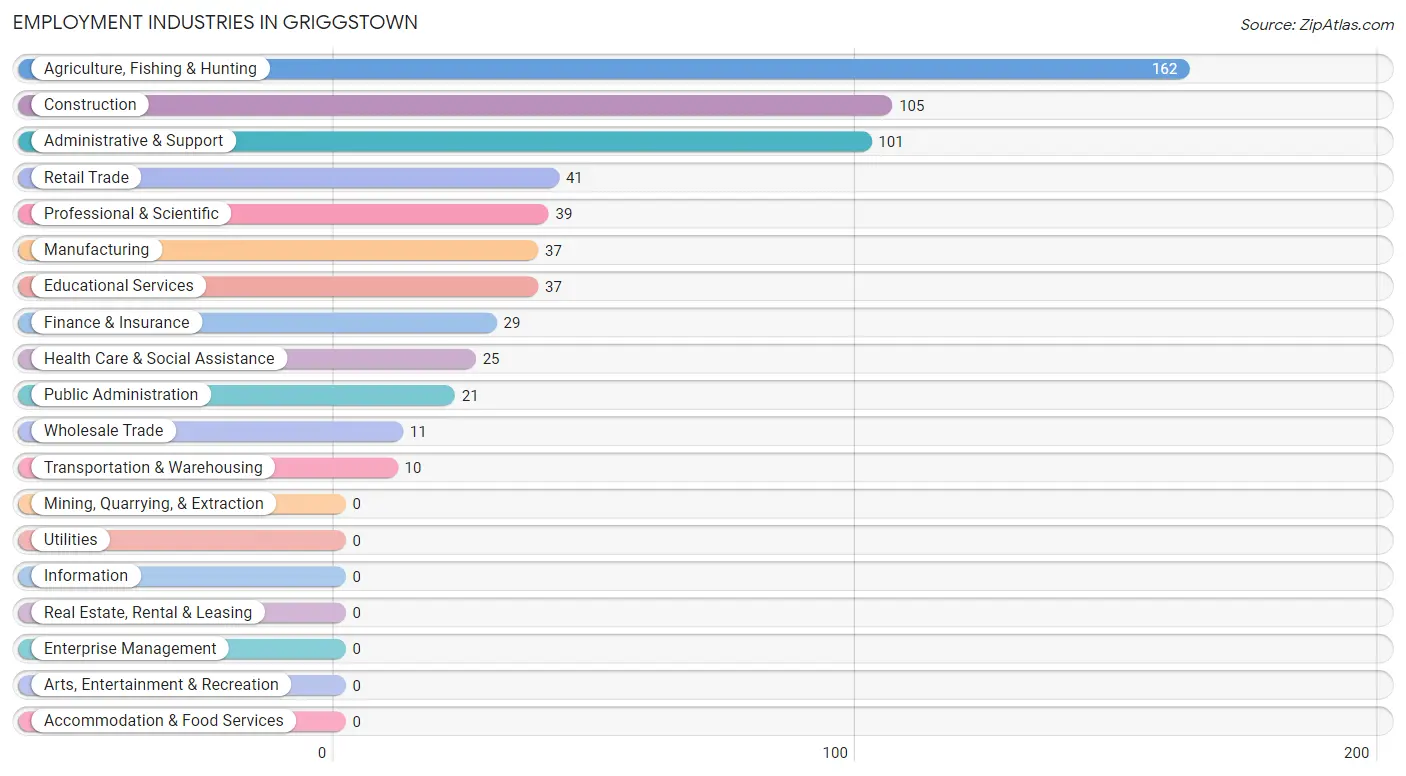
Employment Industries in Griggstown
The major employment industries in Griggstown include Agriculture, Fishing & Hunting (162 | 26.2%), Construction (105 | 17.0%), Administrative & Support (101 | 16.3%), Retail Trade (41 | 6.6%), and Professional & Scientific (39 | 6.3%).
Employment Industries by Sex in Griggstown
The Griggstown industries that see more men than women are Manufacturing (100.0%), Wholesale Trade (100.0%), and Retail Trade (100.0%), whereas the industries that tend to have a higher number of women are Transportation & Warehousing (100.0%), Finance & Insurance (100.0%), and Administrative & Support (100.0%).
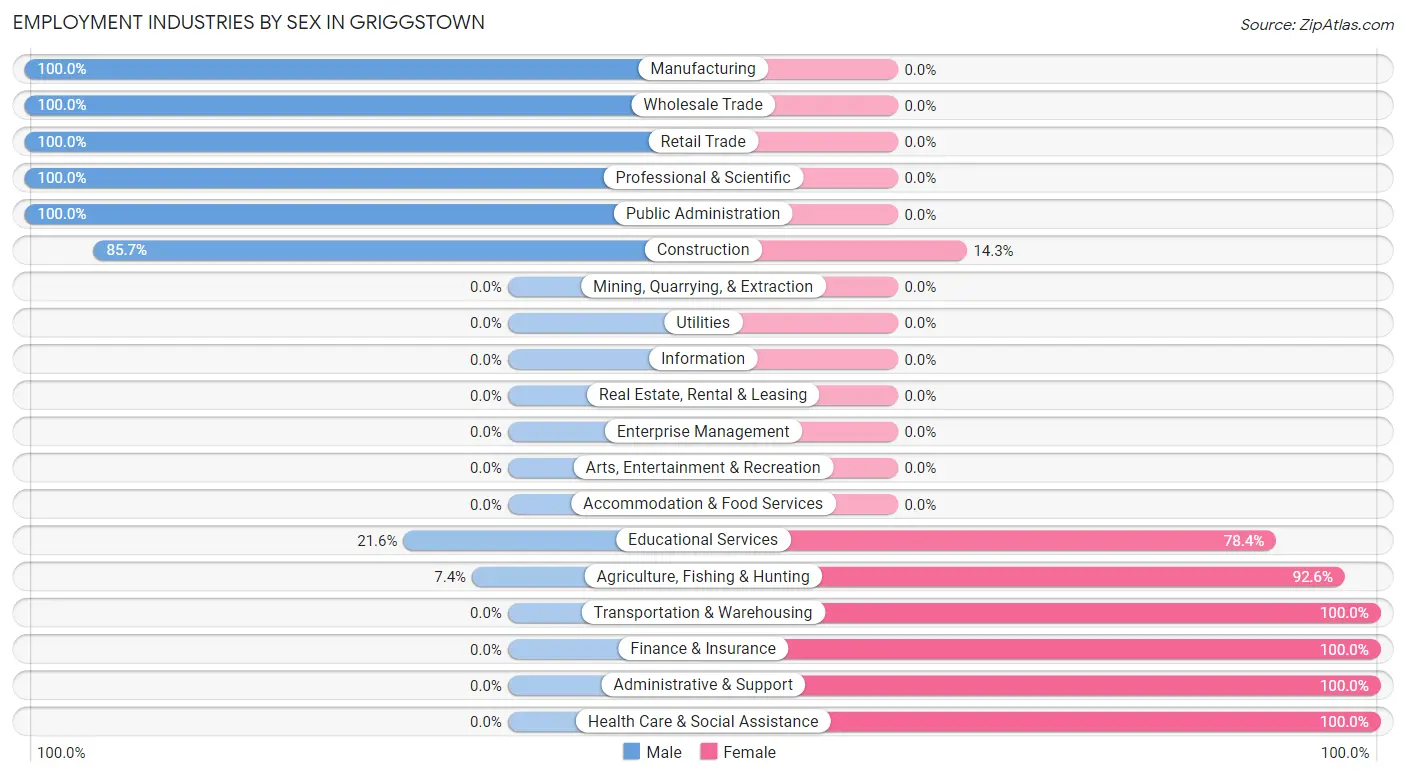
| Industry | Male | Female |
| Agriculture, Fishing & Hunting | 12 (7.4%) | 150 (92.6%) |
| Mining, Quarrying, & Extraction | 0 (0.0%) | 0 (0.0%) |
| Construction | 90 (85.7%) | 15 (14.3%) |
| Manufacturing | 37 (100.0%) | 0 (0.0%) |
| Wholesale Trade | 11 (100.0%) | 0 (0.0%) |
| Retail Trade | 41 (100.0%) | 0 (0.0%) |
| Transportation & Warehousing | 0 (0.0%) | 10 (100.0%) |
| Utilities | 0 (0.0%) | 0 (0.0%) |
| Information | 0 (0.0%) | 0 (0.0%) |
| Finance & Insurance | 0 (0.0%) | 29 (100.0%) |
| Real Estate, Rental & Leasing | 0 (0.0%) | 0 (0.0%) |
| Professional & Scientific | 39 (100.0%) | 0 (0.0%) |
| Enterprise Management | 0 (0.0%) | 0 (0.0%) |
| Administrative & Support | 0 (0.0%) | 101 (100.0%) |
| Educational Services | 8 (21.6%) | 29 (78.4%) |
| Health Care & Social Assistance | 0 (0.0%) | 25 (100.0%) |
| Arts, Entertainment & Recreation | 0 (0.0%) | 0 (0.0%) |
| Accommodation & Food Services | 0 (0.0%) | 0 (0.0%) |
| Public Administration | 21 (100.0%) | 0 (0.0%) |
| Total | 259 (41.9%) | 359 (58.1%) |
Education in Griggstown
School Enrollment in Griggstown
The most common levels of schooling among the 148 students in Griggstown are high school (64 | 43.2%), middle school (40 | 27.0%), and elementary school (32 | 21.6%).
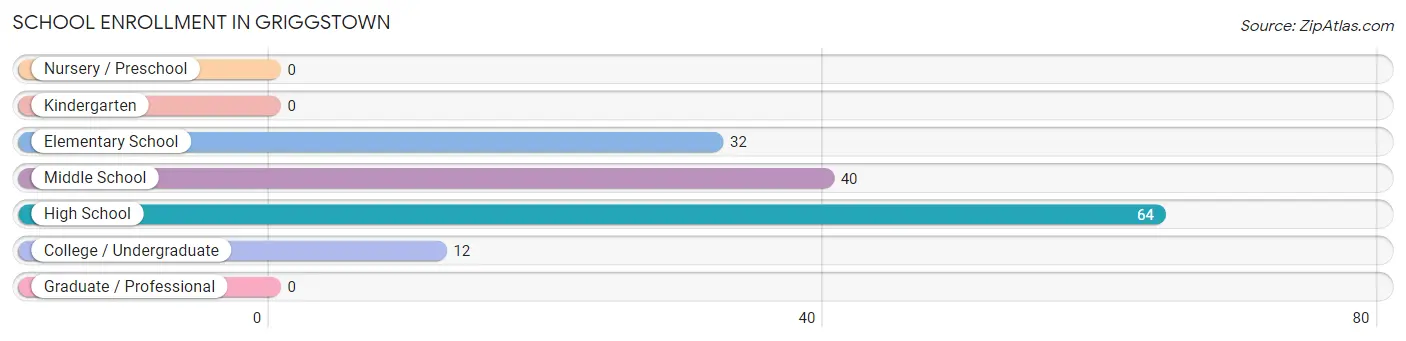
| School Level | # Students | % Students |
| Nursery / Preschool | 0 | 0.0% |
| Kindergarten | 0 | 0.0% |
| Elementary School | 32 | 21.6% |
| Middle School | 40 | 27.0% |
| High School | 64 | 43.2% |
| College / Undergraduate | 12 | 8.1% |
| Graduate / Professional | 0 | 0.0% |
| Total | 148 | 100.0% |
School Enrollment by Age by Funding Source in Griggstown
Out of a total of 148 students who are enrolled in schools in Griggstown, 134 (90.5%) attend a private institution, while the remaining 14 (9.5%) are enrolled in public schools. The age group of 10 to 14 year olds has the highest likelihood of being enrolled in private schools, with 58 (100.0% in the age bracket) enrolled. Conversely, the age group of 5 to 9 year old has the lowest likelihood of being enrolled in a private school, with 14 (100.0% in the age bracket) attending a public institution.
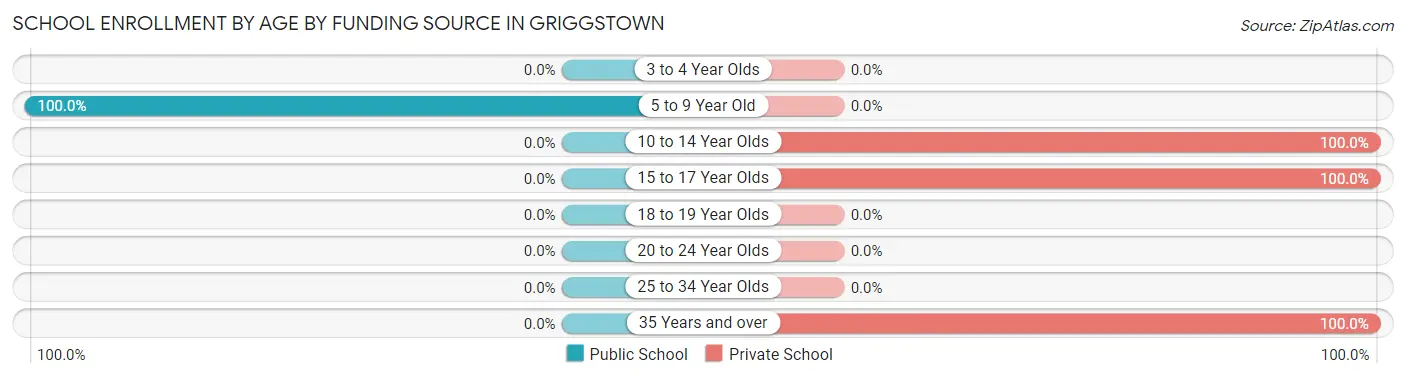
| Age Bracket | Public School | Private School |
| 3 to 4 Year Olds | 0 (0.0%) | 0 (0.0%) |
| 5 to 9 Year Old | 14 (100.0%) | 0 (0.0%) |
| 10 to 14 Year Olds | 0 (0.0%) | 58 (100.0%) |
| 15 to 17 Year Olds | 0 (0.0%) | 64 (100.0%) |
| 18 to 19 Year Olds | 0 (0.0%) | 0 (0.0%) |
| 20 to 24 Year Olds | 0 (0.0%) | 0 (0.0%) |
| 25 to 34 Year Olds | 0 (0.0%) | 0 (0.0%) |
| 35 Years and over | 0 (0.0%) | 12 (100.0%) |
| Total | 14 (9.5%) | 134 (90.5%) |
Educational Attainment by Field of Study in Griggstown
Business (150 | 29.5%), communications (76 | 14.9%), engineering (54 | 10.6%), bio, nature & agricultural (48 | 9.4%), and social sciences (40 | 7.9%) are the most common fields of study among 509 individuals in Griggstown who have obtained a bachelor's degree or higher.
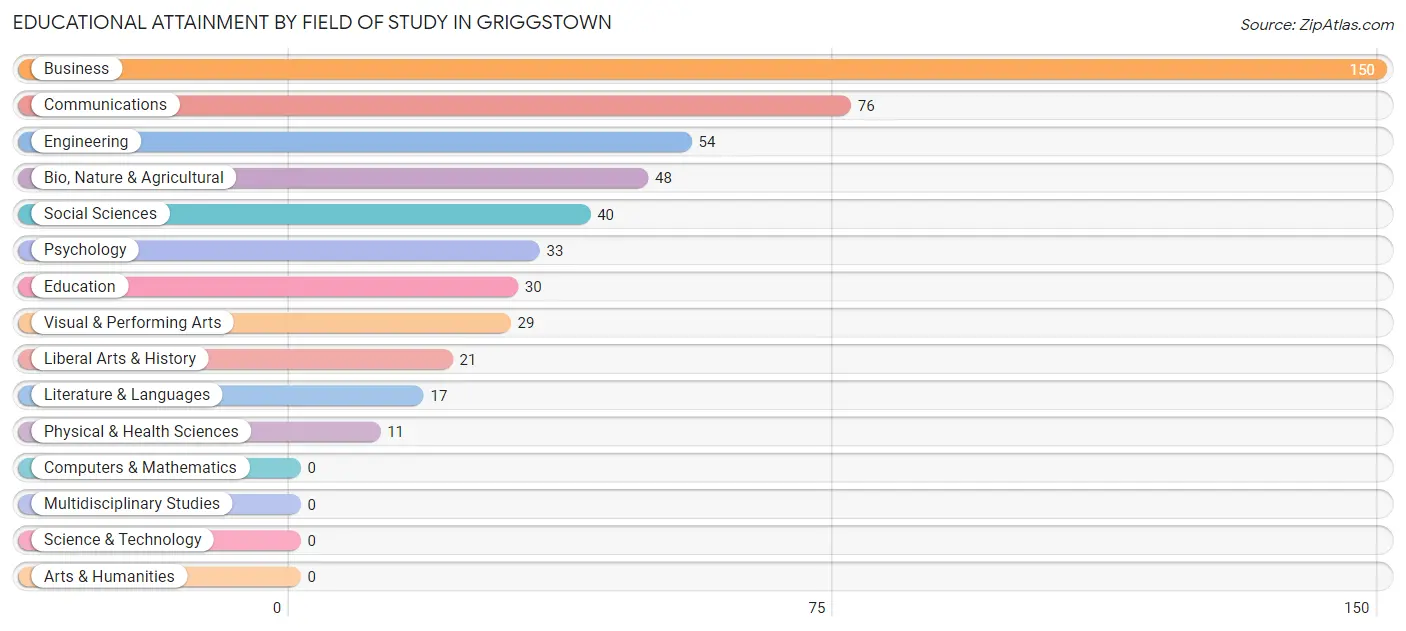
| Field of Study | # Graduates | % Graduates |
| Computers & Mathematics | 0 | 0.0% |
| Bio, Nature & Agricultural | 48 | 9.4% |
| Physical & Health Sciences | 11 | 2.2% |
| Psychology | 33 | 6.5% |
| Social Sciences | 40 | 7.9% |
| Engineering | 54 | 10.6% |
| Multidisciplinary Studies | 0 | 0.0% |
| Science & Technology | 0 | 0.0% |
| Business | 150 | 29.5% |
| Education | 30 | 5.9% |
| Literature & Languages | 17 | 3.3% |
| Liberal Arts & History | 21 | 4.1% |
| Visual & Performing Arts | 29 | 5.7% |
| Communications | 76 | 14.9% |
| Arts & Humanities | 0 | 0.0% |
| Total | 509 | 100.0% |
Transportation & Commute in Griggstown
Vehicle Availability by Sex in Griggstown
The most prevalent vehicle ownership categories in Griggstown are males with 2 vehicles (143, accounting for 55.2%) and females with 2 vehicles (285, making up 39.8%).
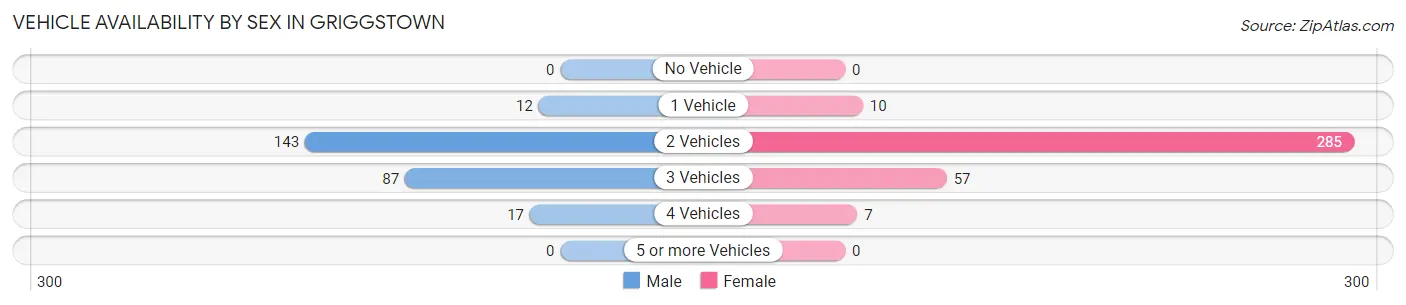
| Vehicles Available | Male | Female |
| No Vehicle | 0 (0.0%) | 0 (0.0%) |
| 1 Vehicle | 12 (4.6%) | 10 (2.8%) |
| 2 Vehicles | 143 (55.2%) | 285 (79.4%) |
| 3 Vehicles | 87 (33.6%) | 57 (15.9%) |
| 4 Vehicles | 17 (6.6%) | 7 (1.9%) |
| 5 or more Vehicles | 0 (0.0%) | 0 (0.0%) |
| Total | 259 (100.0%) | 359 (100.0%) |
Commute Time in Griggstown
The most frequently occuring commute durations in Griggstown are less than 5 minutes (158 commuters, 33.8%), 45 to 59 minutes (91 commuters, 19.5%), and 40 to 44 minutes (54 commuters, 11.6%).
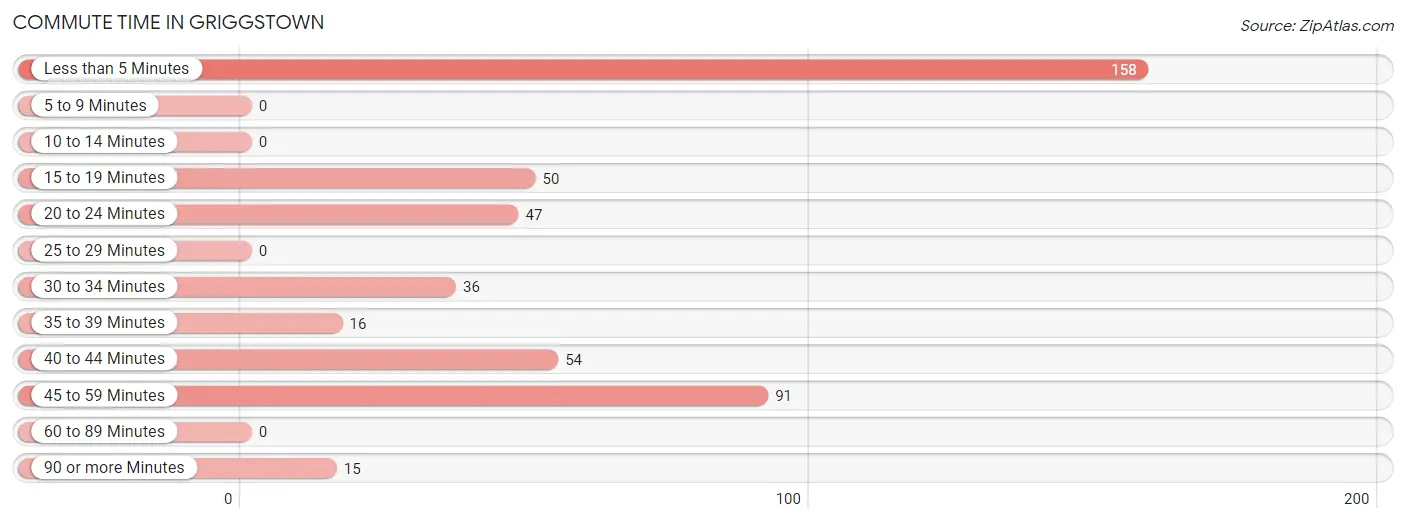
| Commute Time | # Commuters | % Commuters |
| Less than 5 Minutes | 158 | 33.8% |
| 5 to 9 Minutes | 0 | 0.0% |
| 10 to 14 Minutes | 0 | 0.0% |
| 15 to 19 Minutes | 50 | 10.7% |
| 20 to 24 Minutes | 47 | 10.1% |
| 25 to 29 Minutes | 0 | 0.0% |
| 30 to 34 Minutes | 36 | 7.7% |
| 35 to 39 Minutes | 16 | 3.4% |
| 40 to 44 Minutes | 54 | 11.6% |
| 45 to 59 Minutes | 91 | 19.5% |
| 60 to 89 Minutes | 0 | 0.0% |
| 90 or more Minutes | 15 | 3.2% |
Commute Time by Sex in Griggstown
The most common commute times in Griggstown are 45 to 59 minutes (81 commuters, 32.7%) for males and less than 5 minutes (150 commuters, 68.5%) for females.
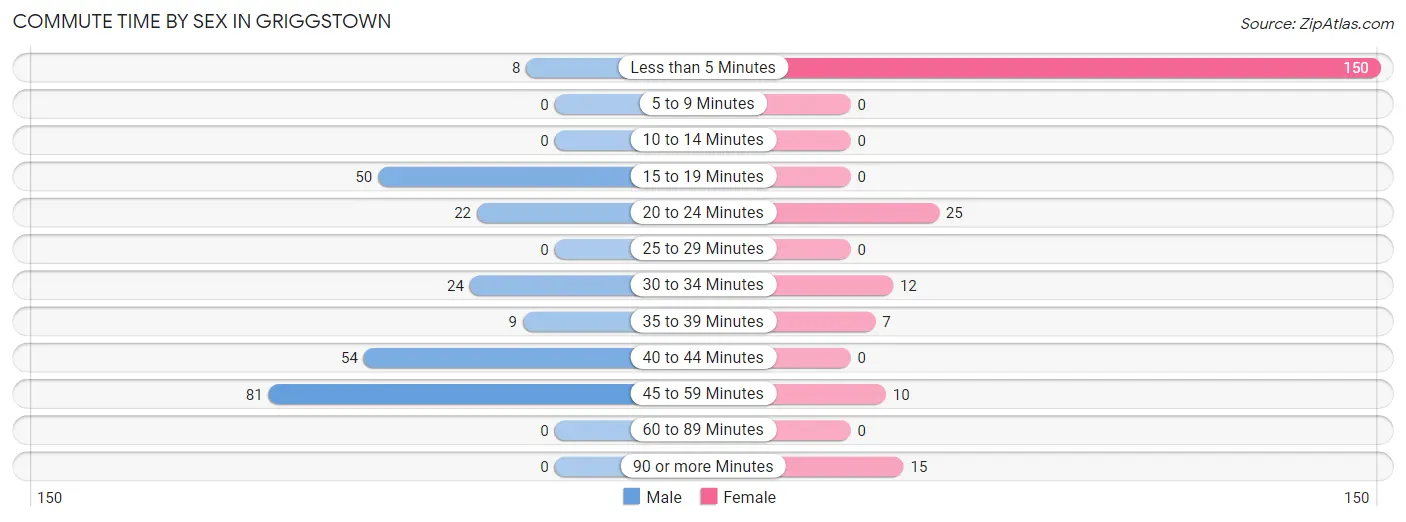
| Commute Time | Male | Female |
| Less than 5 Minutes | 8 (3.2%) | 150 (68.5%) |
| 5 to 9 Minutes | 0 (0.0%) | 0 (0.0%) |
| 10 to 14 Minutes | 0 (0.0%) | 0 (0.0%) |
| 15 to 19 Minutes | 50 (20.2%) | 0 (0.0%) |
| 20 to 24 Minutes | 22 (8.9%) | 25 (11.4%) |
| 25 to 29 Minutes | 0 (0.0%) | 0 (0.0%) |
| 30 to 34 Minutes | 24 (9.7%) | 12 (5.5%) |
| 35 to 39 Minutes | 9 (3.6%) | 7 (3.2%) |
| 40 to 44 Minutes | 54 (21.8%) | 0 (0.0%) |
| 45 to 59 Minutes | 81 (32.7%) | 10 (4.6%) |
| 60 to 89 Minutes | 0 (0.0%) | 0 (0.0%) |
| 90 or more Minutes | 0 (0.0%) | 15 (6.9%) |
Time of Departure to Work by Sex in Griggstown
The most frequent times of departure to work in Griggstown are 5:00 AM to 5:29 AM (81, 32.7%) for males and 12:00 PM to 3:59 PM (157, 71.7%) for females.
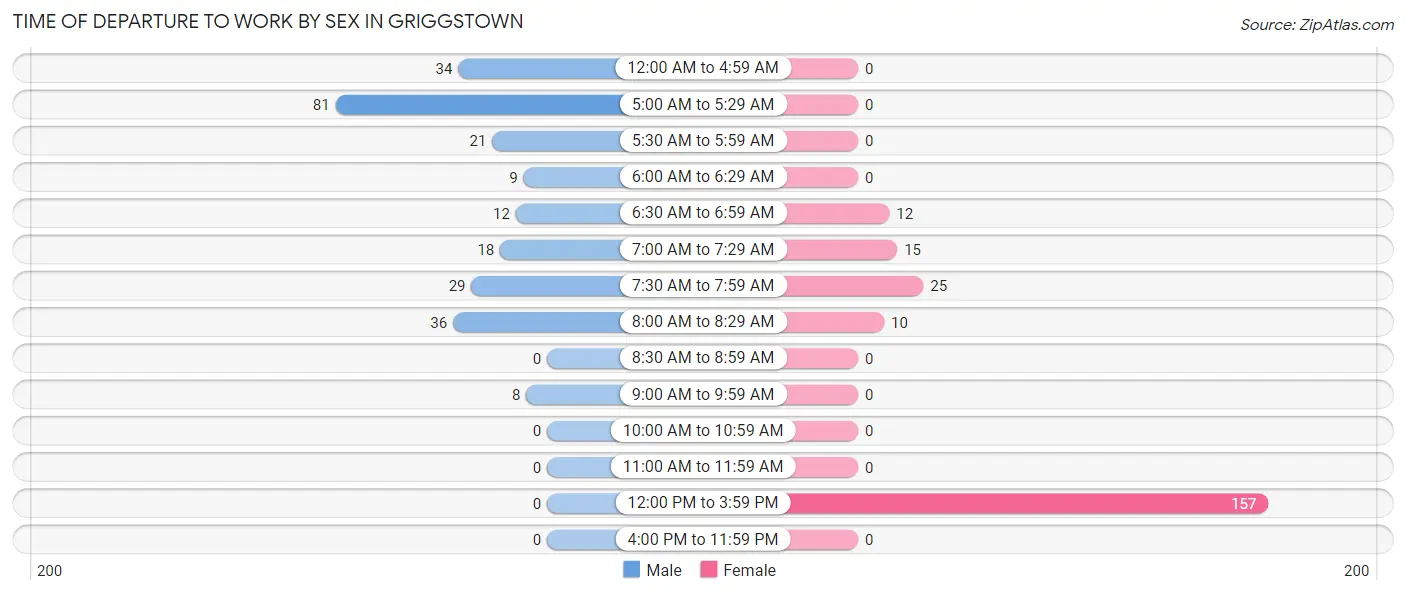
| Time of Departure | Male | Female |
| 12:00 AM to 4:59 AM | 34 (13.7%) | 0 (0.0%) |
| 5:00 AM to 5:29 AM | 81 (32.7%) | 0 (0.0%) |
| 5:30 AM to 5:59 AM | 21 (8.5%) | 0 (0.0%) |
| 6:00 AM to 6:29 AM | 9 (3.6%) | 0 (0.0%) |
| 6:30 AM to 6:59 AM | 12 (4.8%) | 12 (5.5%) |
| 7:00 AM to 7:29 AM | 18 (7.3%) | 15 (6.9%) |
| 7:30 AM to 7:59 AM | 29 (11.7%) | 25 (11.4%) |
| 8:00 AM to 8:29 AM | 36 (14.5%) | 10 (4.6%) |
| 8:30 AM to 8:59 AM | 0 (0.0%) | 0 (0.0%) |
| 9:00 AM to 9:59 AM | 8 (3.2%) | 0 (0.0%) |
| 10:00 AM to 10:59 AM | 0 (0.0%) | 0 (0.0%) |
| 11:00 AM to 11:59 AM | 0 (0.0%) | 0 (0.0%) |
| 12:00 PM to 3:59 PM | 0 (0.0%) | 157 (71.7%) |
| 4:00 PM to 11:59 PM | 0 (0.0%) | 0 (0.0%) |
| Total | 248 (100.0%) | 219 (100.0%) |
Housing Occupancy in Griggstown
Occupancy by Ownership in Griggstown
Of the total 397 dwellings in Griggstown, owner-occupied units account for 397 (100.0%), while renter-occupied units make up 0 (0.0%).
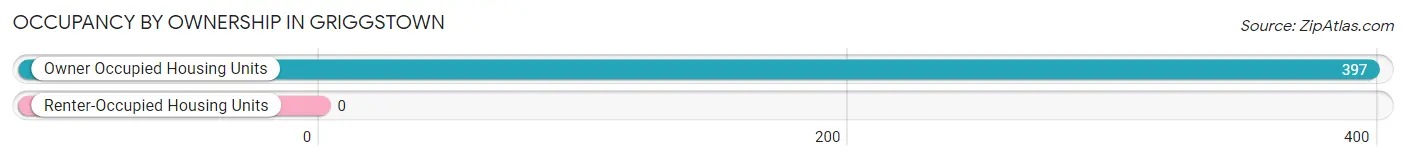
| Occupancy | # Housing Units | % Housing Units |
| Owner Occupied Housing Units | 397 | 100.0% |
| Renter-Occupied Housing Units | 0 | 0.0% |
| Total Occupied Housing Units | 397 | 100.0% |
Occupancy by Household Size in Griggstown
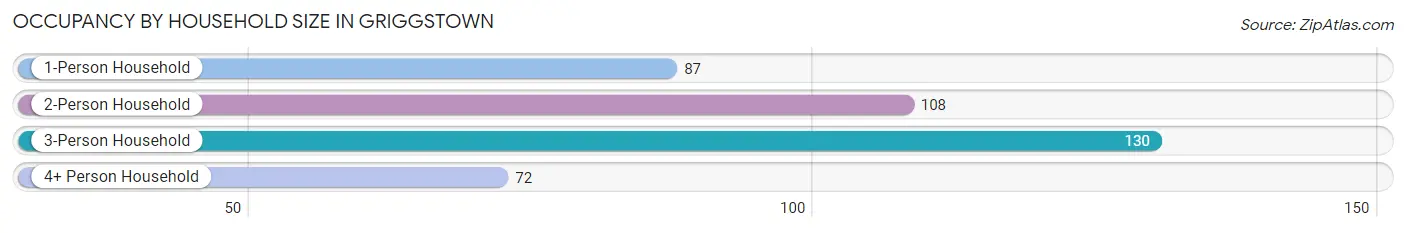
| Household Size | # Housing Units | % Housing Units |
| 1-Person Household | 87 | 21.9% |
| 2-Person Household | 108 | 27.2% |
| 3-Person Household | 130 | 32.8% |
| 4+ Person Household | 72 | 18.1% |
| Total Housing Units | 397 | 100.0% |
Occupancy by Ownership by Household Size in Griggstown
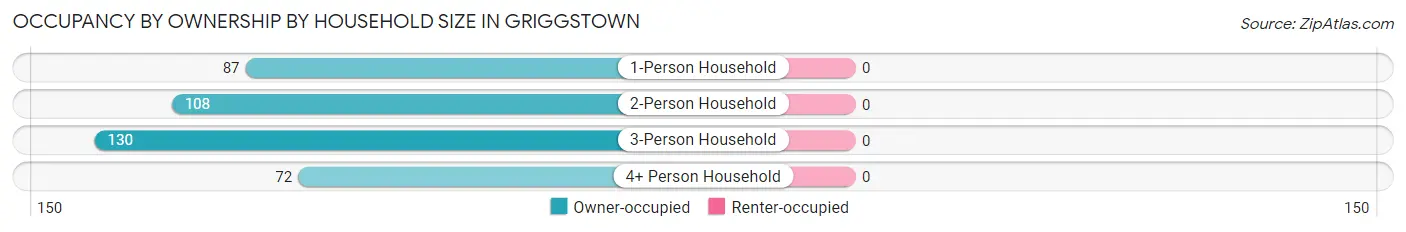
| Household Size | Owner-occupied | Renter-occupied |
| 1-Person Household | 87 (100.0%) | 0 (0.0%) |
| 2-Person Household | 108 (100.0%) | 0 (0.0%) |
| 3-Person Household | 130 (100.0%) | 0 (0.0%) |
| 4+ Person Household | 72 (100.0%) | 0 (0.0%) |
| Total Housing Units | 397 (100.0%) | 0 (0.0%) |
Occupancy by Educational Attainment in Griggstown
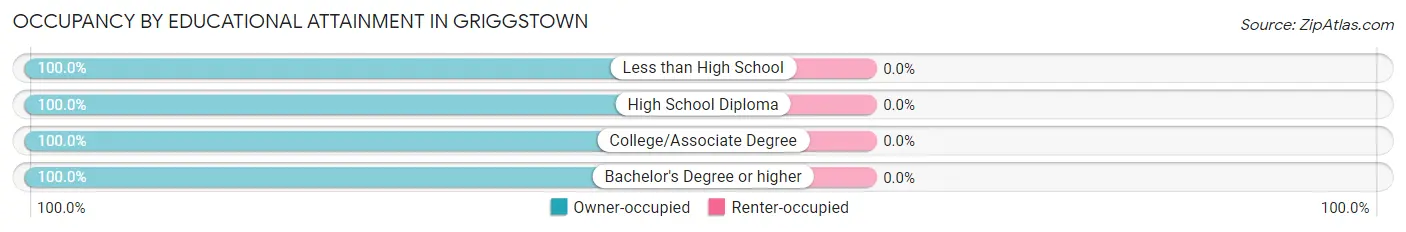
| Household Size | Owner-occupied | Renter-occupied |
| Less than High School | 19 (100.0%) | 0 (0.0%) |
| High School Diploma | 12 (100.0%) | 0 (0.0%) |
| College/Associate Degree | 84 (100.0%) | 0 (0.0%) |
| Bachelor's Degree or higher | 282 (100.0%) | 0 (0.0%) |
Occupancy by Age of Householder in Griggstown
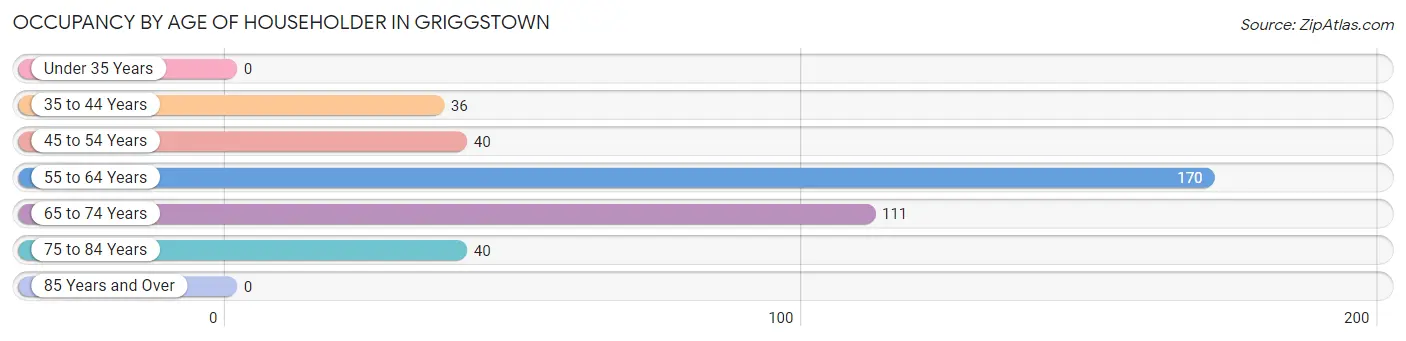
| Age Bracket | # Households | % Households |
| Under 35 Years | 0 | 0.0% |
| 35 to 44 Years | 36 | 9.1% |
| 45 to 54 Years | 40 | 10.1% |
| 55 to 64 Years | 170 | 42.8% |
| 65 to 74 Years | 111 | 28.0% |
| 75 to 84 Years | 40 | 10.1% |
| 85 Years and Over | 0 | 0.0% |
| Total | 397 | 100.0% |
Housing Finances in Griggstown
Median Income by Occupancy in Griggstown
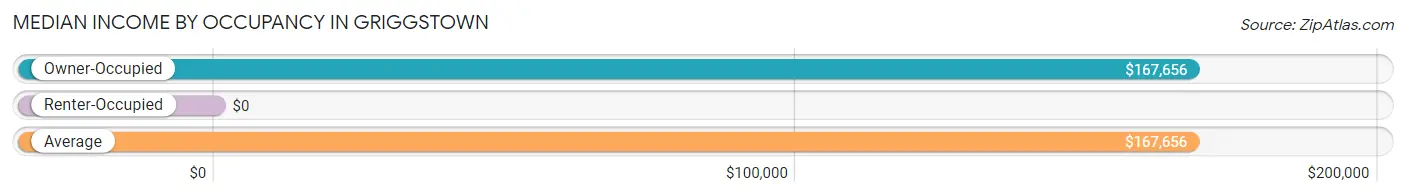
| Occupancy Type | # Households | Median Income |
| Owner-Occupied | 397 (100.0%) | $167,656 |
| Renter-Occupied | 0 (0.0%) | $0 |
| Average | 397 (100.0%) | $167,656 |
Occupancy by Householder Income Bracket in Griggstown
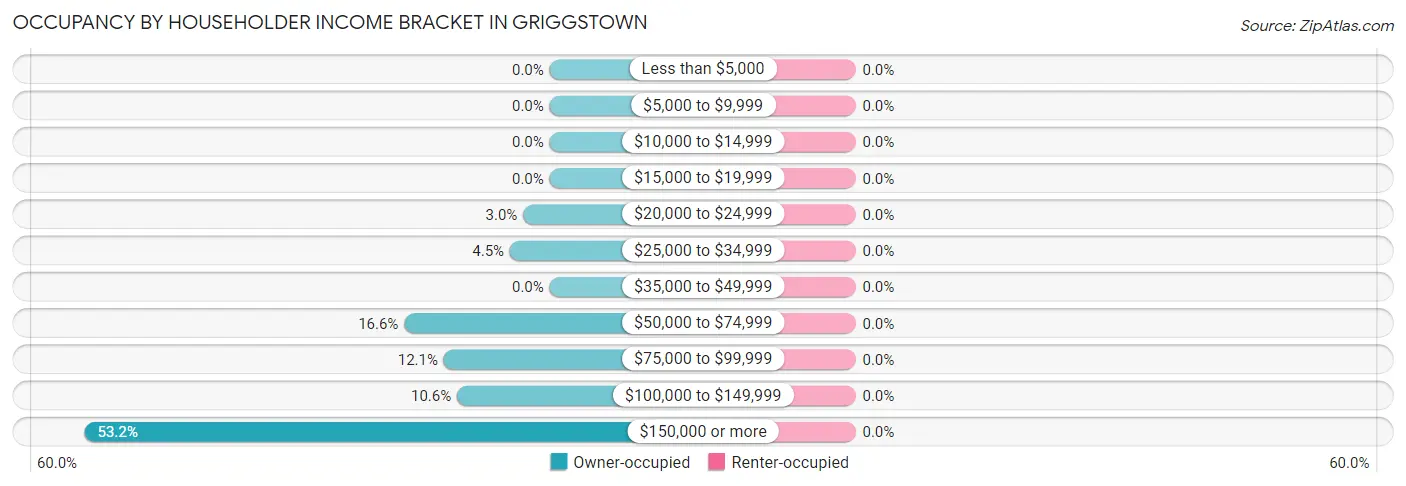
| Income Bracket | Owner-occupied | Renter-occupied |
| Less than $5,000 | 0 (0.0%) | 0 (0.0%) |
| $5,000 to $9,999 | 0 (0.0%) | 0 (0.0%) |
| $10,000 to $14,999 | 0 (0.0%) | 0 (0.0%) |
| $15,000 to $19,999 | 0 (0.0%) | 0 (0.0%) |
| $20,000 to $24,999 | 12 (3.0%) | 0 (0.0%) |
| $25,000 to $34,999 | 18 (4.5%) | 0 (0.0%) |
| $35,000 to $49,999 | 0 (0.0%) | 0 (0.0%) |
| $50,000 to $74,999 | 66 (16.6%) | 0 (0.0%) |
| $75,000 to $99,999 | 48 (12.1%) | 0 (0.0%) |
| $100,000 to $149,999 | 42 (10.6%) | 0 (0.0%) |
| $150,000 or more | 211 (53.1%) | 0 (0.0%) |
| Total | 397 (100.0%) | 0 (0.0%) |
Monthly Housing Cost Tiers in Griggstown
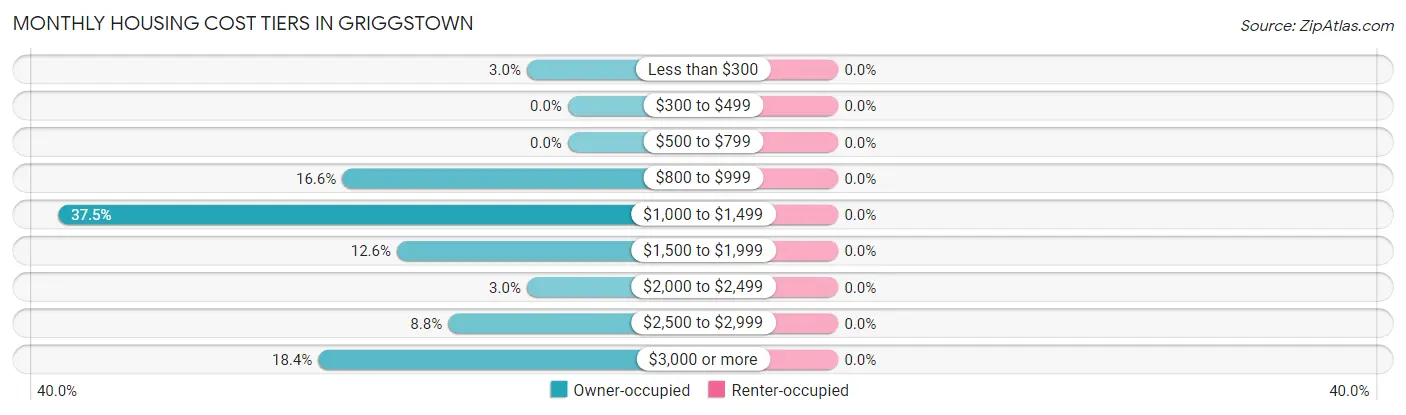
| Monthly Cost | Owner-occupied | Renter-occupied |
| Less than $300 | 12 (3.0%) | 0 (0.0%) |
| $300 to $499 | 0 (0.0%) | 0 (0.0%) |
| $500 to $799 | 0 (0.0%) | 0 (0.0%) |
| $800 to $999 | 66 (16.6%) | 0 (0.0%) |
| $1,000 to $1,499 | 149 (37.5%) | 0 (0.0%) |
| $1,500 to $1,999 | 50 (12.6%) | 0 (0.0%) |
| $2,000 to $2,499 | 12 (3.0%) | 0 (0.0%) |
| $2,500 to $2,999 | 35 (8.8%) | 0 (0.0%) |
| $3,000 or more | 73 (18.4%) | 0 (0.0%) |
| Total | 397 (100.0%) | 0 (0.0%) |
Physical Housing Characteristics in Griggstown
Housing Structures in Griggstown
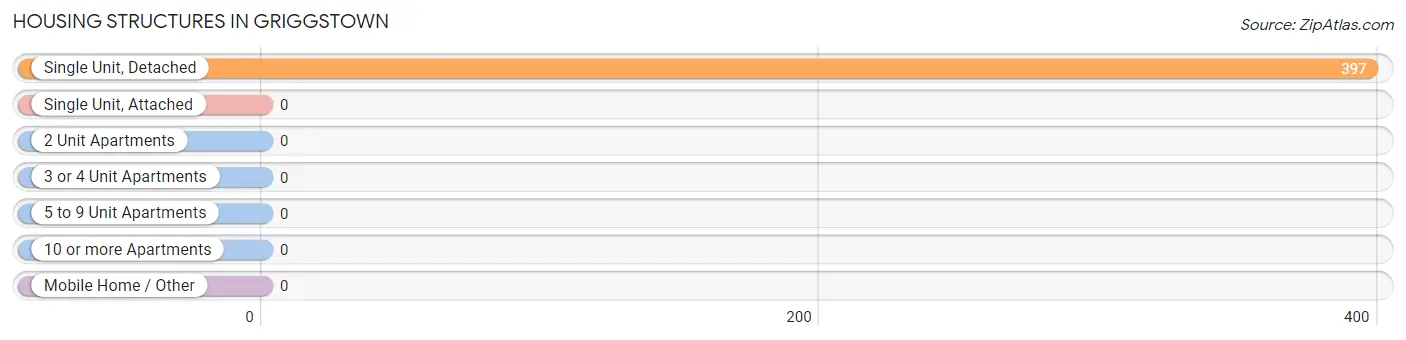
| Structure Type | # Housing Units | % Housing Units |
| Single Unit, Detached | 397 | 100.0% |
| Single Unit, Attached | 0 | 0.0% |
| 2 Unit Apartments | 0 | 0.0% |
| 3 or 4 Unit Apartments | 0 | 0.0% |
| 5 to 9 Unit Apartments | 0 | 0.0% |
| 10 or more Apartments | 0 | 0.0% |
| Mobile Home / Other | 0 | 0.0% |
| Total | 397 | 100.0% |
Housing Structures by Occupancy in Griggstown
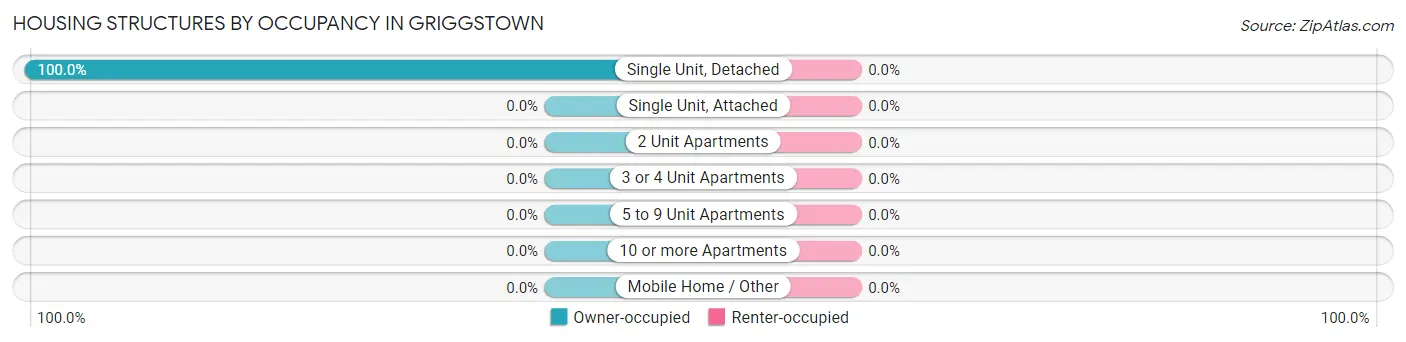
| Structure Type | Owner-occupied | Renter-occupied |
| Single Unit, Detached | 397 (100.0%) | 0 (0.0%) |
| Single Unit, Attached | 0 (0.0%) | 0 (0.0%) |
| 2 Unit Apartments | 0 (0.0%) | 0 (0.0%) |
| 3 or 4 Unit Apartments | 0 (0.0%) | 0 (0.0%) |
| 5 to 9 Unit Apartments | 0 (0.0%) | 0 (0.0%) |
| 10 or more Apartments | 0 (0.0%) | 0 (0.0%) |
| Mobile Home / Other | 0 (0.0%) | 0 (0.0%) |
| Total | 397 (100.0%) | 0 (0.0%) |
Housing Structures by Number of Rooms in Griggstown
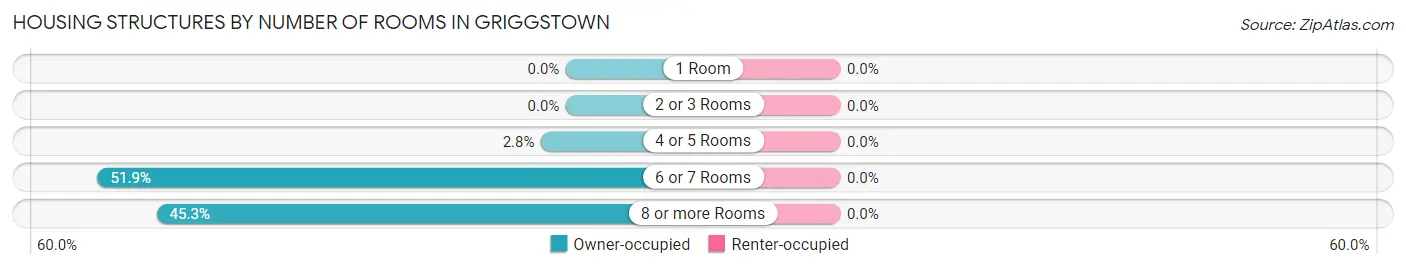
| Number of Rooms | Owner-occupied | Renter-occupied |
| 1 Room | 0 (0.0%) | 0 (0.0%) |
| 2 or 3 Rooms | 0 (0.0%) | 0 (0.0%) |
| 4 or 5 Rooms | 11 (2.8%) | 0 (0.0%) |
| 6 or 7 Rooms | 206 (51.9%) | 0 (0.0%) |
| 8 or more Rooms | 180 (45.3%) | 0 (0.0%) |
| Total | 397 (100.0%) | 0 (0.0%) |
Housing Structure by Heating Type in Griggstown
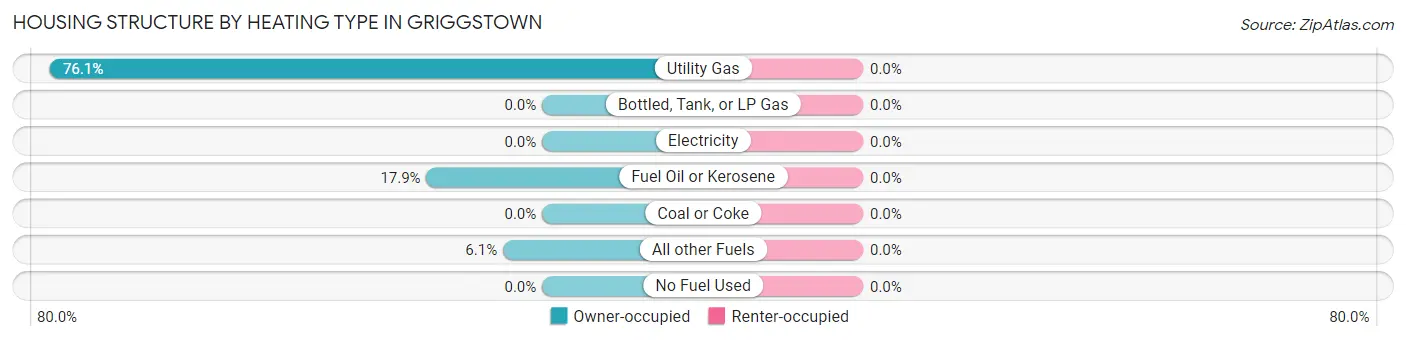
| Heating Type | Owner-occupied | Renter-occupied |
| Utility Gas | 302 (76.1%) | 0 (0.0%) |
| Bottled, Tank, or LP Gas | 0 (0.0%) | 0 (0.0%) |
| Electricity | 0 (0.0%) | 0 (0.0%) |
| Fuel Oil or Kerosene | 71 (17.9%) | 0 (0.0%) |
| Coal or Coke | 0 (0.0%) | 0 (0.0%) |
| All other Fuels | 24 (6.0%) | 0 (0.0%) |
| No Fuel Used | 0 (0.0%) | 0 (0.0%) |
| Total | 397 (100.0%) | 0 (0.0%) |
Household Vehicle Usage in Griggstown
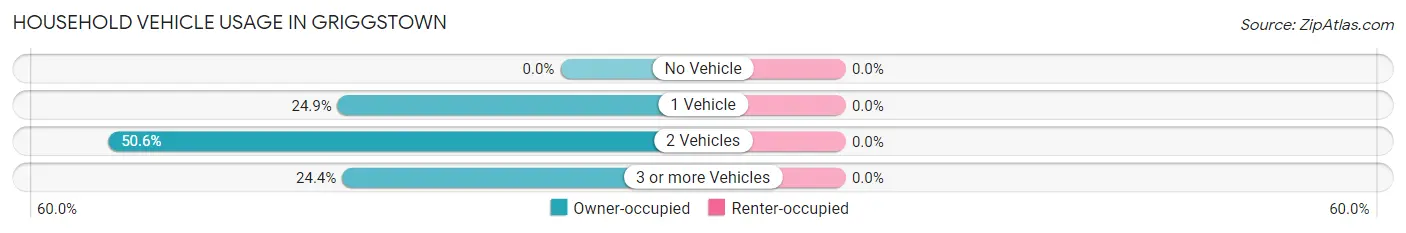
| Vehicles per Household | Owner-occupied | Renter-occupied |
| No Vehicle | 0 (0.0%) | 0 (0.0%) |
| 1 Vehicle | 99 (24.9%) | 0 (0.0%) |
| 2 Vehicles | 201 (50.6%) | 0 (0.0%) |
| 3 or more Vehicles | 97 (24.4%) | 0 (0.0%) |
| Total | 397 (100.0%) | 0 (0.0%) |
Real Estate & Mortgages in Griggstown
Real Estate and Mortgage Overview in Griggstown
| Characteristic | Without Mortgage | With Mortgage |
| Housing Units | 227 | 170 |
| Median Property Value | $472,000 | $452,900 |
| Median Household Income | - | - |
| Monthly Housing Costs | $1,176 | $73 |
| Real Estate Taxes | $8,726 | $0 |
Property Value by Mortgage Status in Griggstown
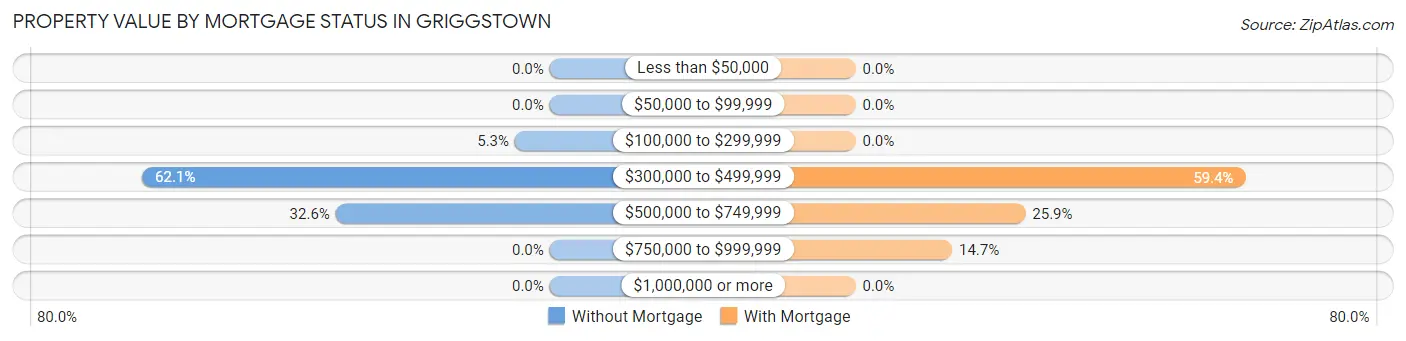
| Property Value | Without Mortgage | With Mortgage |
| Less than $50,000 | 0 (0.0%) | 0 (0.0%) |
| $50,000 to $99,999 | 0 (0.0%) | 0 (0.0%) |
| $100,000 to $299,999 | 12 (5.3%) | 0 (0.0%) |
| $300,000 to $499,999 | 141 (62.1%) | 101 (59.4%) |
| $500,000 to $749,999 | 74 (32.6%) | 44 (25.9%) |
| $750,000 to $999,999 | 0 (0.0%) | 25 (14.7%) |
| $1,000,000 or more | 0 (0.0%) | 0 (0.0%) |
| Total | 227 (100.0%) | 170 (100.0%) |
Household Income by Mortgage Status in Griggstown
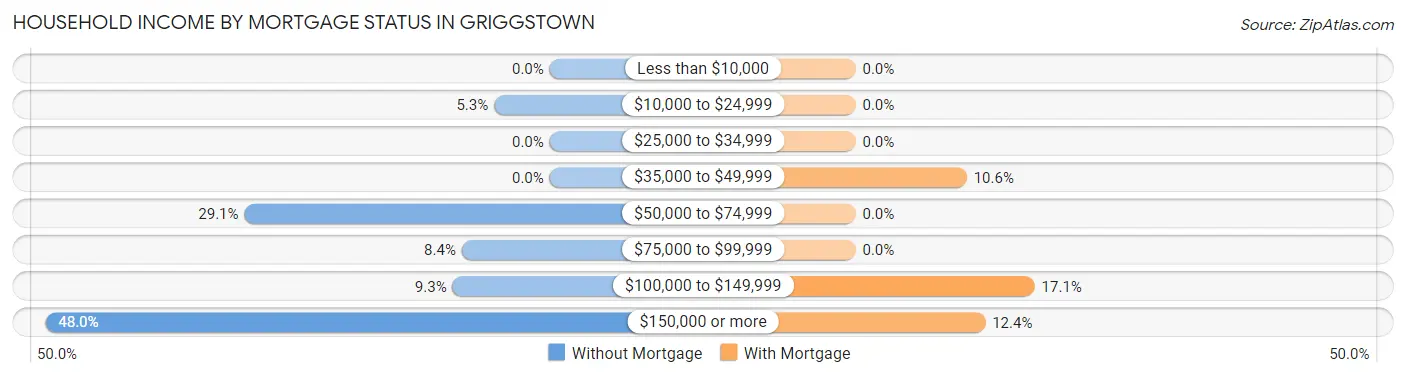
| Household Income | Without Mortgage | With Mortgage |
| Less than $10,000 | 0 (0.0%) | 0 (0.0%) |
| $10,000 to $24,999 | 12 (5.3%) | 0 (0.0%) |
| $25,000 to $34,999 | 0 (0.0%) | 0 (0.0%) |
| $35,000 to $49,999 | 0 (0.0%) | 18 (10.6%) |
| $50,000 to $74,999 | 66 (29.1%) | 0 (0.0%) |
| $75,000 to $99,999 | 19 (8.4%) | 0 (0.0%) |
| $100,000 to $149,999 | 21 (9.2%) | 29 (17.1%) |
| $150,000 or more | 109 (48.0%) | 21 (12.3%) |
| Total | 227 (100.0%) | 170 (100.0%) |
Property Value to Household Income Ratio in Griggstown
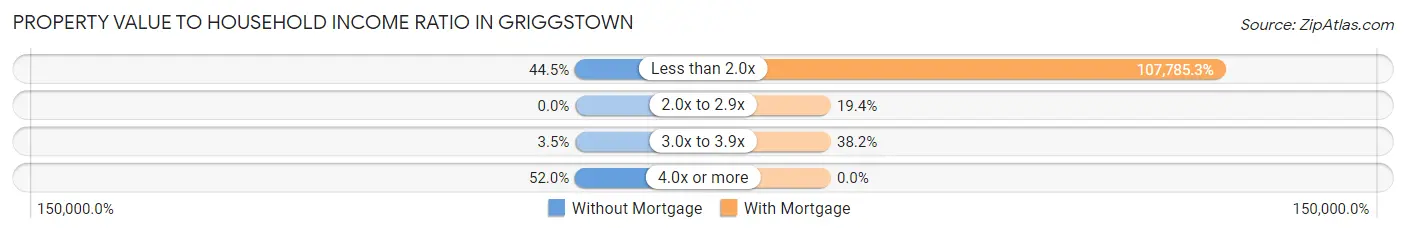
| Value-to-Income Ratio | Without Mortgage | With Mortgage |
| Less than 2.0x | 101 (44.5%) | 183,235 (107,785.3%) |
| 2.0x to 2.9x | 0 (0.0%) | 33 (19.4%) |
| 3.0x to 3.9x | 8 (3.5%) | 65 (38.2%) |
| 4.0x or more | 118 (52.0%) | 0 (0.0%) |
| Total | 227 (100.0%) | 170 (100.0%) |
Real Estate Taxes by Mortgage Status in Griggstown
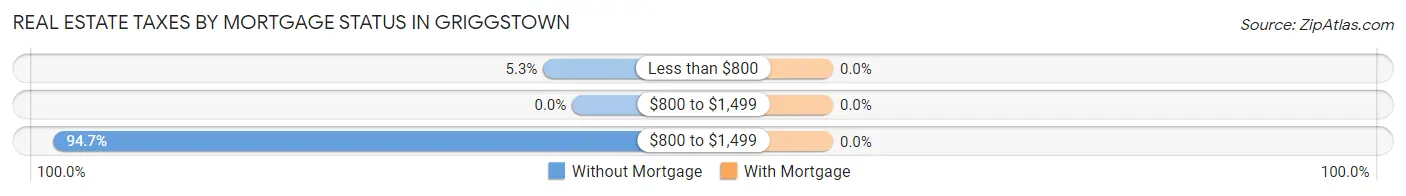
| Property Taxes | Without Mortgage | With Mortgage |
| Less than $800 | 12 (5.3%) | 0 (0.0%) |
| $800 to $1,499 | 0 (0.0%) | 0 (0.0%) |
| $800 to $1,499 | 215 (94.7%) | 0 (0.0%) |
| Total | 227 (100.0%) | 170 (100.0%) |
Health & Disability in Griggstown
Health Insurance Coverage by Age in Griggstown
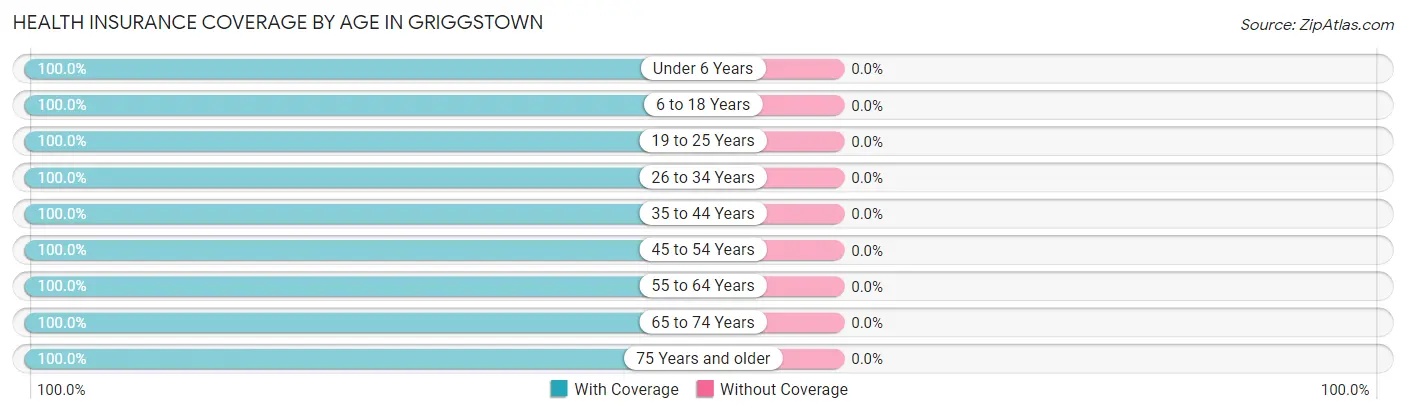
| Age Bracket | With Coverage | Without Coverage |
| Under 6 Years | 36 (100.0%) | 0 (0.0%) |
| 6 to 18 Years | 136 (100.0%) | 0 (0.0%) |
| 19 to 25 Years | 150 (100.0%) | 0 (0.0%) |
| 26 to 34 Years | 57 (100.0%) | 0 (0.0%) |
| 35 to 44 Years | 72 (100.0%) | 0 (0.0%) |
| 45 to 54 Years | 80 (100.0%) | 0 (0.0%) |
| 55 to 64 Years | 357 (100.0%) | 0 (0.0%) |
| 65 to 74 Years | 151 (100.0%) | 0 (0.0%) |
| 75 Years and older | 63 (100.0%) | 0 (0.0%) |
| Total | 1,102 (100.0%) | 0 (0.0%) |
Health Insurance Coverage by Citizenship Status in Griggstown
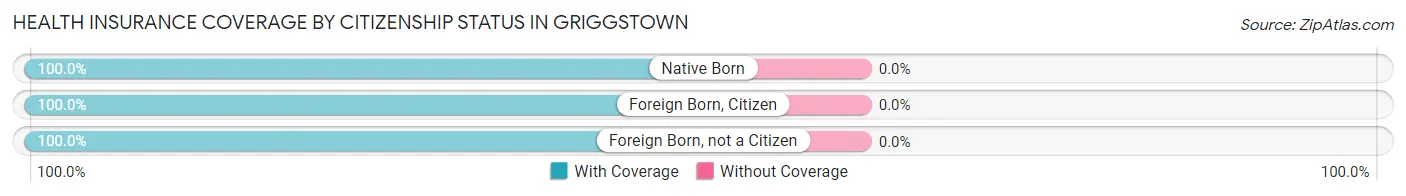
| Citizenship Status | With Coverage | Without Coverage |
| Native Born | 36 (100.0%) | 0 (0.0%) |
| Foreign Born, Citizen | 136 (100.0%) | 0 (0.0%) |
| Foreign Born, not a Citizen | 150 (100.0%) | 0 (0.0%) |
Health Insurance Coverage by Household Income in Griggstown
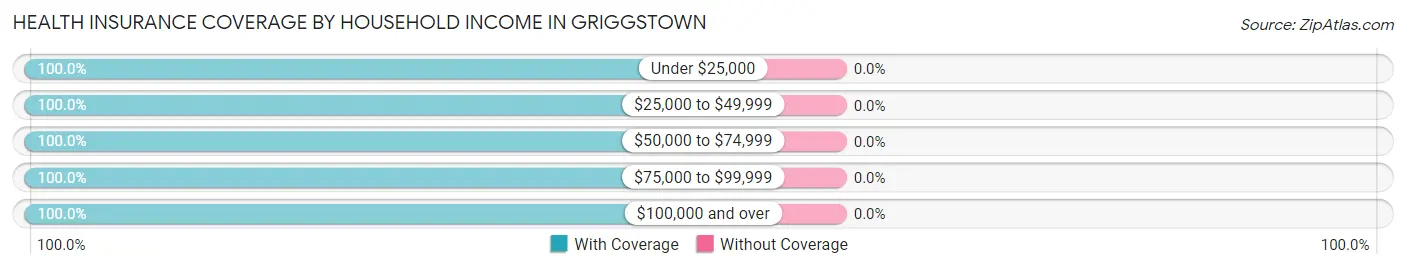
| Household Income | With Coverage | Without Coverage |
| Under $25,000 | 22 (100.0%) | 0 (0.0%) |
| $25,000 to $49,999 | 73 (100.0%) | 0 (0.0%) |
| $50,000 to $74,999 | 66 (100.0%) | 0 (0.0%) |
| $75,000 to $99,999 | 100 (100.0%) | 0 (0.0%) |
| $100,000 and over | 838 (100.0%) | 0 (0.0%) |
Public vs Private Health Insurance Coverage by Age in Griggstown
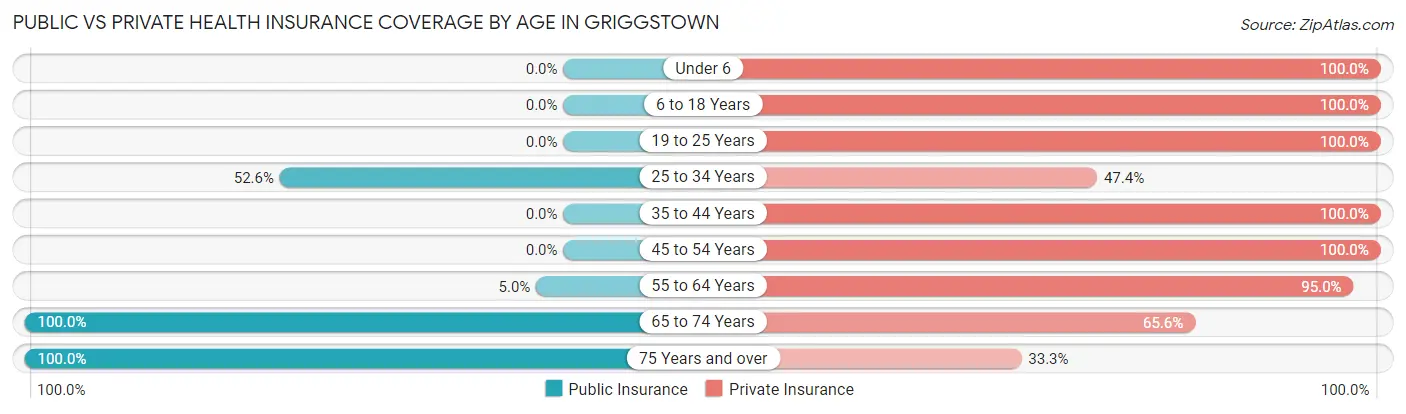
| Age Bracket | Public Insurance | Private Insurance |
| Under 6 | 0 (0.0%) | 36 (100.0%) |
| 6 to 18 Years | 0 (0.0%) | 136 (100.0%) |
| 19 to 25 Years | 0 (0.0%) | 150 (100.0%) |
| 25 to 34 Years | 30 (52.6%) | 27 (47.4%) |
| 35 to 44 Years | 0 (0.0%) | 72 (100.0%) |
| 45 to 54 Years | 0 (0.0%) | 80 (100.0%) |
| 55 to 64 Years | 18 (5.0%) | 339 (95.0%) |
| 65 to 74 Years | 151 (100.0%) | 99 (65.6%) |
| 75 Years and over | 63 (100.0%) | 21 (33.3%) |
| Total | 262 (23.8%) | 960 (87.1%) |
Disability Status by Sex by Age in Griggstown
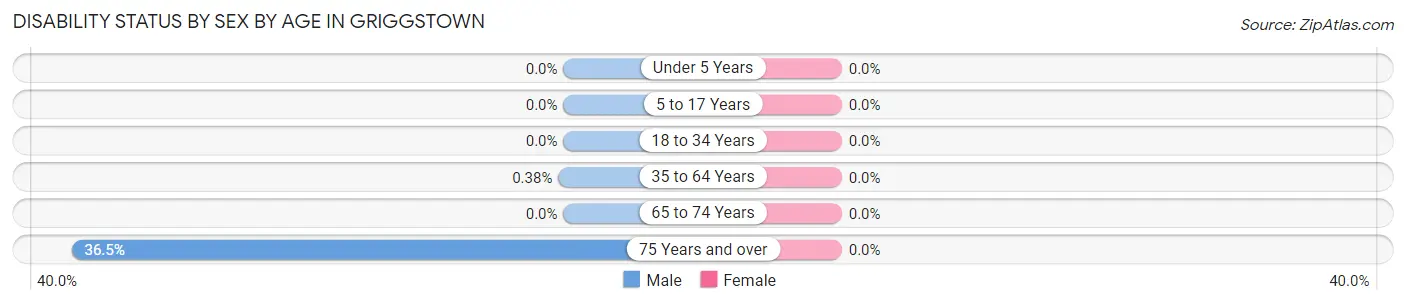
| Age Bracket | Male | Female |
| Under 5 Years | 0 (0.0%) | 0 (0.0%) |
| 5 to 17 Years | 0 (0.0%) | 0 (0.0%) |
| 18 to 34 Years | 0 (0.0%) | 0 (0.0%) |
| 35 to 64 Years | 1 (0.4%) | 0 (0.0%) |
| 65 to 74 Years | 0 (0.0%) | 0 (0.0%) |
| 75 Years and over | 23 (36.5%) | 0 (0.0%) |
Disability Class by Sex by Age in Griggstown
Disability Class: Hearing Difficulty
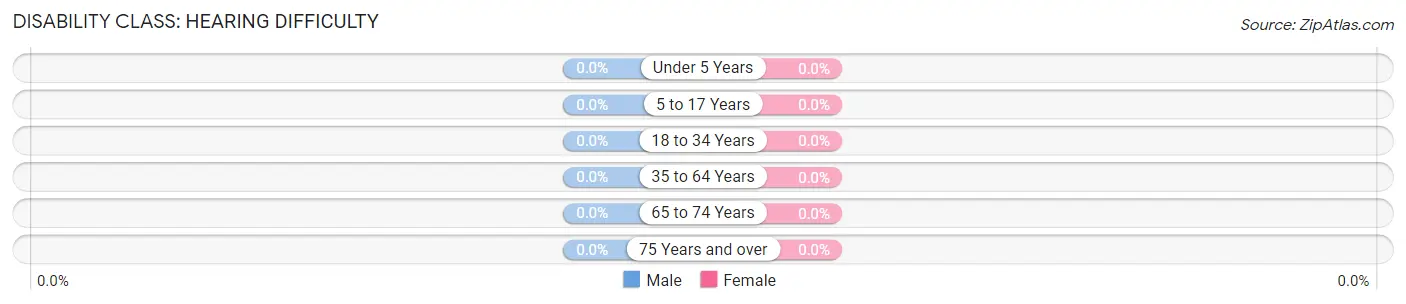
| Age Bracket | Male | Female |
| Under 5 Years | 0 (0.0%) | 0 (0.0%) |
| 5 to 17 Years | 0 (0.0%) | 0 (0.0%) |
| 18 to 34 Years | 0 (0.0%) | 0 (0.0%) |
| 35 to 64 Years | 0 (0.0%) | 0 (0.0%) |
| 65 to 74 Years | 0 (0.0%) | 0 (0.0%) |
| 75 Years and over | 0 (0.0%) | 0 (0.0%) |
Disability Class: Vision Difficulty
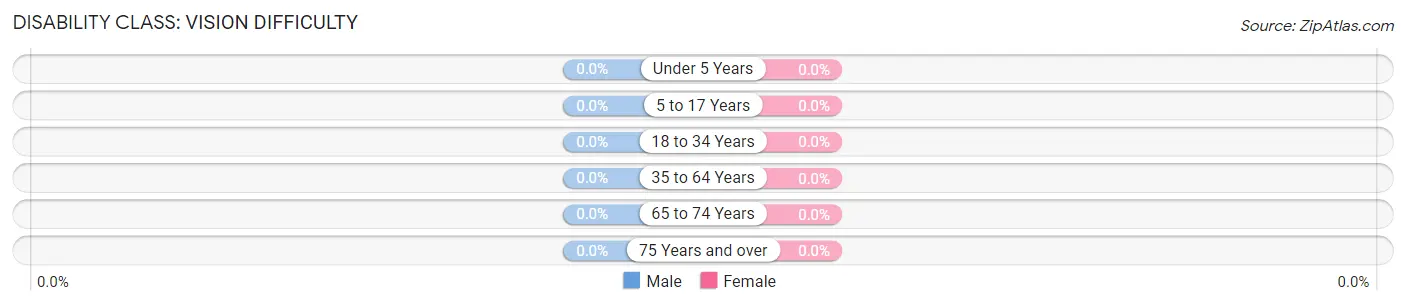
| Age Bracket | Male | Female |
| Under 5 Years | 0 (0.0%) | 0 (0.0%) |
| 5 to 17 Years | 0 (0.0%) | 0 (0.0%) |
| 18 to 34 Years | 0 (0.0%) | 0 (0.0%) |
| 35 to 64 Years | 0 (0.0%) | 0 (0.0%) |
| 65 to 74 Years | 0 (0.0%) | 0 (0.0%) |
| 75 Years and over | 0 (0.0%) | 0 (0.0%) |
Disability Class: Cognitive Difficulty

| Age Bracket | Male | Female |
| 5 to 17 Years | 0 (0.0%) | 0 (0.0%) |
| 18 to 34 Years | 0 (0.0%) | 0 (0.0%) |
| 35 to 64 Years | 1 (0.4%) | 0 (0.0%) |
| 65 to 74 Years | 0 (0.0%) | 0 (0.0%) |
| 75 Years and over | 0 (0.0%) | 0 (0.0%) |
Disability Class: Ambulatory Difficulty
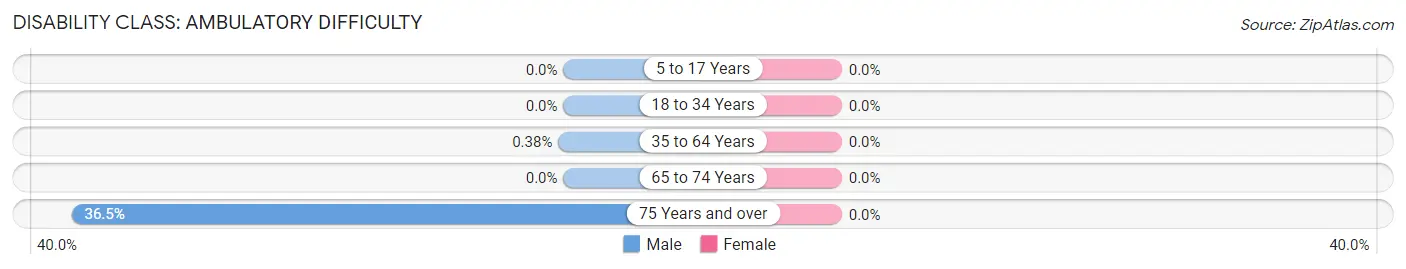
| Age Bracket | Male | Female |
| 5 to 17 Years | 0 (0.0%) | 0 (0.0%) |
| 18 to 34 Years | 0 (0.0%) | 0 (0.0%) |
| 35 to 64 Years | 1 (0.4%) | 0 (0.0%) |
| 65 to 74 Years | 0 (0.0%) | 0 (0.0%) |
| 75 Years and over | 23 (36.5%) | 0 (0.0%) |
Disability Class: Self-Care Difficulty
| Age Bracket | Male | Female |
| 5 to 17 Years | 0 (0.0%) | 0 (0.0%) |
| 18 to 34 Years | 0 (0.0%) | 0 (0.0%) |
| 35 to 64 Years | 1 (0.4%) | 0 (0.0%) |
| 65 to 74 Years | 0 (0.0%) | 0 (0.0%) |
| 75 Years and over | 0 (0.0%) | 0 (0.0%) |
Technology Access in Griggstown
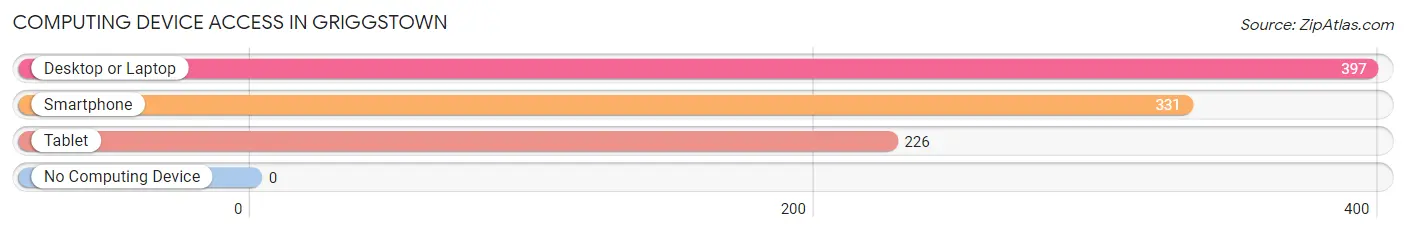
Computing Device Access in Griggstown
| Device Type | # Households | % Households |
| Desktop or Laptop | 397 | 100.0% |
| Smartphone | 331 | 83.4% |
| Tablet | 226 | 56.9% |
| No Computing Device | 0 | 0.0% |
| Total | 397 | 100.0% |
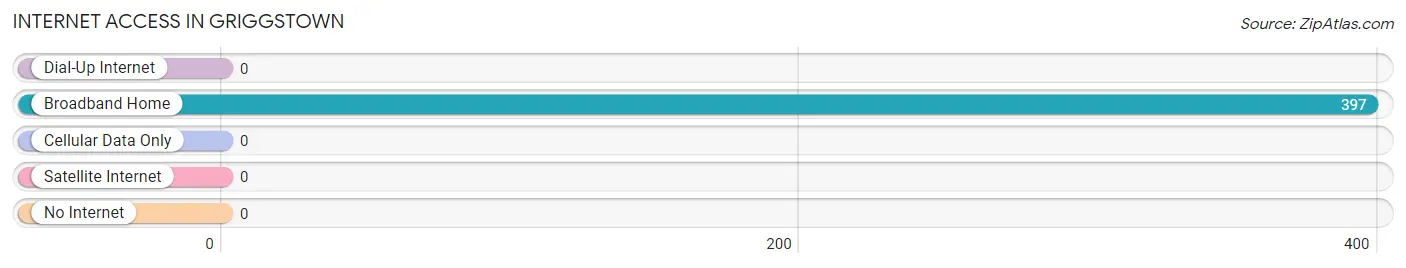
Internet Access in Griggstown
| Internet Type | # Households | % Households |
| Dial-Up Internet | 0 | 0.0% |
| Broadband Home | 397 | 100.0% |
| Cellular Data Only | 0 | 0.0% |
| Satellite Internet | 0 | 0.0% |
| No Internet | 0 | 0.0% |
| Total | 397 | 100.0% |
Griggstown Summary
Griggstown is an unincorporated community located in Franklin Township, Somerset County, New Jersey. It is situated along the Millstone River, a tributary of the Raritan River. Griggstown is a small rural community with a population of approximately 1,000 people.
History
Griggstown was first settled in the late 1700s by a group of German immigrants. The area was originally known as “Grigg’s Town” after the family who owned the land. The Grigg family operated a mill on the Millstone River, which was the main source of income for the community. The mill was used to grind grain and produce flour, which was then sold to local farmers and merchants.
In the early 1800s, the Grigg family sold the land to the Van Doren family, who continued to operate the mill. The Van Doren family also built a store and a post office, which served the community until the early 1900s.
In the late 1800s, Griggstown became a popular destination for summer vacationers. The area was known for its scenic views of the Millstone River and its abundance of wildlife. The area also had several inns and hotels, which attracted visitors from all over the country.
Geography
Griggstown is located in Franklin Township, Somerset County, New Jersey. It is situated along the Millstone River, a tributary of the Raritan River. The area is mostly rural, with rolling hills and farmland. The climate is temperate, with hot summers and cold winters.
Economy
Griggstown’s economy is largely based on agriculture. The area is home to several farms, which produce a variety of crops, including corn, soybeans, and wheat. The area also has several nurseries, which produce flowers and plants for sale.
In addition to agriculture, Griggstown is home to several small businesses, including a general store, a post office, and a few restaurants. The area also has several bed and breakfasts, which attract visitors from all over the country.
Demographics
As of the 2010 census, Griggstown had a population of 1,000 people. The racial makeup of the town was 94.2% White, 2.2% African American, 0.2% Native American, 0.8% Asian, and 2.6% from other races. The median household income was $68,750, and the median family income was $76,250.
Conclusion
Griggstown is a small rural community located in Franklin Township, Somerset County, New Jersey. It is situated along the Millstone River, a tributary of the Raritan River. Griggstown was first settled in the late 1700s by a group of German immigrants, and the area was known for its scenic views and abundance of wildlife. The economy of Griggstown is largely based on agriculture, and the area is home to several small businesses. As of the 2010 census, Griggstown had a population of 1,000 people.
Common Questions
What is Per Capita Income in Griggstown?
Per Capita income in Griggstown is $60,540.
What is the Median Family Income in Griggstown?
Median Family Income in Griggstown is $201,900.
What is the Median Household income in Griggstown?
Median Household Income in Griggstown is $167,656.
What is Inequality or Gini Index in Griggstown?
Inequality or Gini Index in Griggstown is 0.33.
What is the Total Population of Griggstown?
Total Population of Griggstown is 1,102.
What is the Total Male Population of Griggstown?
Total Male Population of Griggstown is 459.
What is the Total Female Population of Griggstown?
Total Female Population of Griggstown is 643.
What is the Ratio of Males per 100 Females in Griggstown?
There are 71.38 Males per 100 Females in Griggstown.
What is the Ratio of Females per 100 Males in Griggstown?
There are 140.09 Females per 100 Males in Griggstown.
What is the Median Population Age in Griggstown?
Median Population Age in Griggstown is 55.2 Years.
What is the Average Family Size in Griggstown
Average Family Size in Griggstown is 3.1 People.
What is the Average Household Size in Griggstown
Average Household Size in Griggstown is 2.8 People.
How Large is the Labor Force in Griggstown?
There are 675 People in the Labor Forcein in Griggstown.
What is the Percentage of People in the Labor Force in Griggstown?
67.9% of People are in the Labor Force in Griggstown.
What is the Unemployment Rate in Griggstown?
Unemployment Rate in Griggstown is 8.4%.