White Horse, NJ Map & Demographics
White Horse Map
White Horse Overview
$46,073
PER CAPITA INCOME
$110,469
AVG FAMILY INCOME
$101,380
AVG HOUSEHOLD INCOME
32.6%
WAGE / INCOME GAP [ % ]
67.4¢/ $1
WAGE / INCOME GAP [ $ ]
0.39
INEQUALITY / GINI INDEX
9,692
TOTAL POPULATION
4,920
MALE POPULATION
4,772
FEMALE POPULATION
103.10
MALES / 100 FEMALES
96.99
FEMALES / 100 MALES
44.2
MEDIAN AGE
3.1
AVG FAMILY SIZE
2.5
AVG HOUSEHOLD SIZE
5,274
LABOR FORCE [ PEOPLE ]
61.3%
PERCENT IN LABOR FORCE
3.0%
UNEMPLOYMENT RATE
Income in White Horse
Income Overview in White Horse
Per Capita Income in White Horse is $46,073, while median incomes of families and households are $110,469 and $101,380 respectively.
| Characteristic | Number | Measure |
| Per Capita Income | 9,692 | $46,073 |
| Median Family Income | 2,593 | $110,469 |
| Mean Family Income | 2,593 | $130,868 |
| Median Household Income | 3,857 | $101,380 |
| Mean Household Income | 3,857 | $112,946 |
| Income Deficit | 2,593 | $0 |
| Wage / Income Gap (%) | 9,692 | 32.59% |
| Wage / Income Gap ($) | 9,692 | 67.41¢ per $1 |
| Gini / Inequality Index | 9,692 | 0.39 |
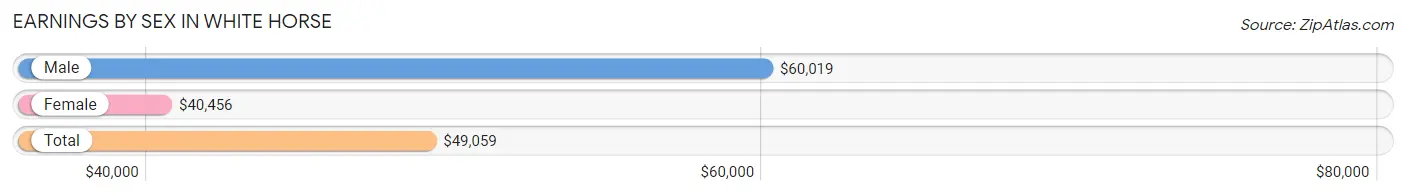
Earnings by Sex in White Horse
Average Earnings in White Horse are $49,059, $60,019 for men and $40,456 for women, a difference of 32.6%.
| Sex | Number | Average Earnings |
| Male | 2,869 (52.3%) | $60,019 |
| Female | 2,615 (47.7%) | $40,456 |
| Total | 5,484 (100.0%) | $49,059 |
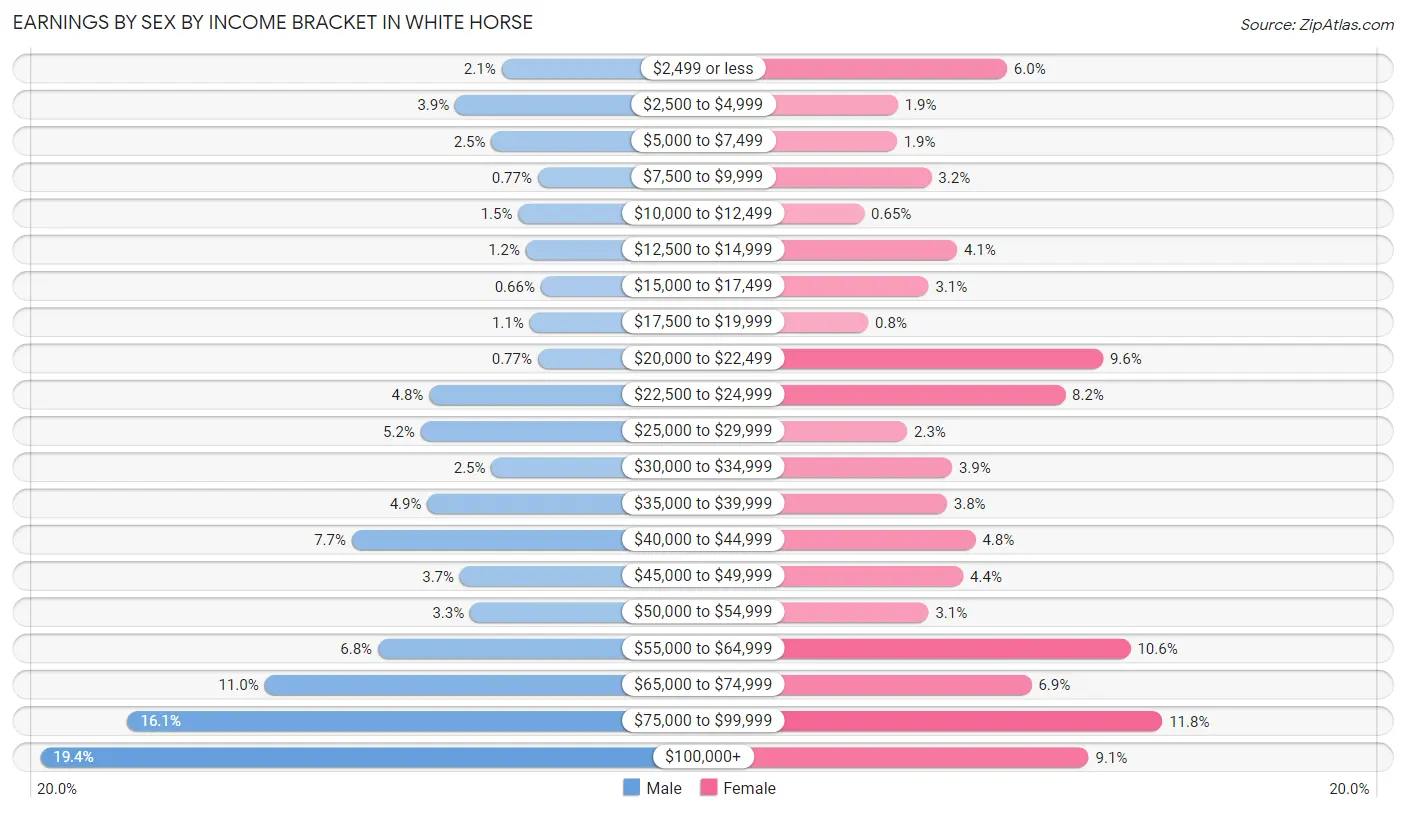
Earnings by Sex by Income Bracket in White Horse
The most common earnings brackets in White Horse are $100,000+ for men (557 | 19.4%) and $75,000 to $99,999 for women (309 | 11.8%).
| Income | Male | Female |
| $2,499 or less | 61 (2.1%) | 157 (6.0%) |
| $2,500 to $4,999 | 111 (3.9%) | 50 (1.9%) |
| $5,000 to $7,499 | 72 (2.5%) | 49 (1.9%) |
| $7,500 to $9,999 | 22 (0.8%) | 83 (3.2%) |
| $10,000 to $12,499 | 43 (1.5%) | 17 (0.6%) |
| $12,500 to $14,999 | 35 (1.2%) | 108 (4.1%) |
| $15,000 to $17,499 | 19 (0.7%) | 80 (3.1%) |
| $17,500 to $19,999 | 31 (1.1%) | 21 (0.8%) |
| $20,000 to $22,499 | 22 (0.8%) | 251 (9.6%) |
| $22,500 to $24,999 | 139 (4.8%) | 214 (8.2%) |
| $25,000 to $29,999 | 148 (5.2%) | 59 (2.3%) |
| $30,000 to $34,999 | 72 (2.5%) | 103 (3.9%) |
| $35,000 to $39,999 | 141 (4.9%) | 98 (3.7%) |
| $40,000 to $44,999 | 222 (7.7%) | 126 (4.8%) |
| $45,000 to $49,999 | 106 (3.7%) | 114 (4.4%) |
| $50,000 to $54,999 | 95 (3.3%) | 80 (3.1%) |
| $55,000 to $64,999 | 194 (6.8%) | 278 (10.6%) |
| $65,000 to $74,999 | 316 (11.0%) | 181 (6.9%) |
| $75,000 to $99,999 | 463 (16.1%) | 309 (11.8%) |
| $100,000+ | 557 (19.4%) | 237 (9.1%) |
| Total | 2,869 (100.0%) | 2,615 (100.0%) |
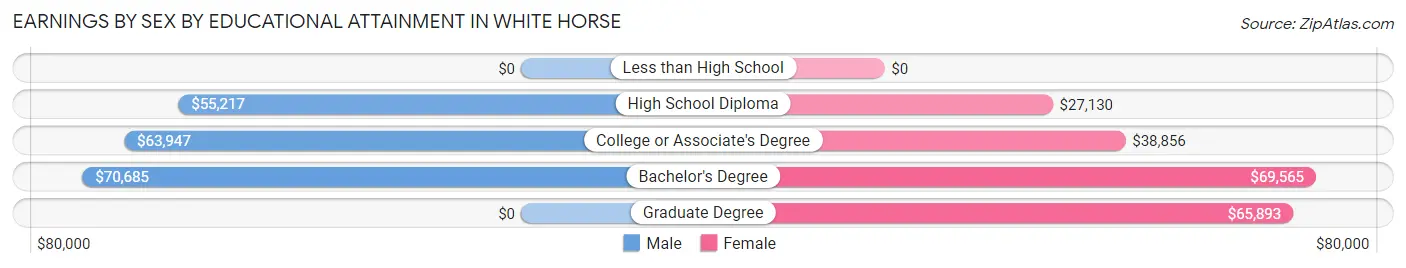
Earnings by Sex by Educational Attainment in White Horse
Average earnings in White Horse are $67,549 for men and $48,346 for women, a difference of 28.4%. Men with an educational attainment of bachelor's degree enjoy the highest average annual earnings of $70,685, while those with high school diploma education earn the least with $55,217. Women with an educational attainment of bachelor's degree earn the most with the average annual earnings of $69,565, while those with high school diploma education have the smallest earnings of $27,130.
| Educational Attainment | Male Income | Female Income |
| Less than High School | - | - |
| High School Diploma | $55,217 | $27,130 |
| College or Associate's Degree | $63,947 | $38,856 |
| Bachelor's Degree | $70,685 | $69,565 |
| Graduate Degree | - | - |
| Total | $67,549 | $48,346 |
Family Income in White Horse
Family Income Brackets in White Horse
According to the White Horse family income data, there are 708 families falling into the $100,000 to $149,999 income range, which is the most common income bracket and makes up 27.3% of all families.
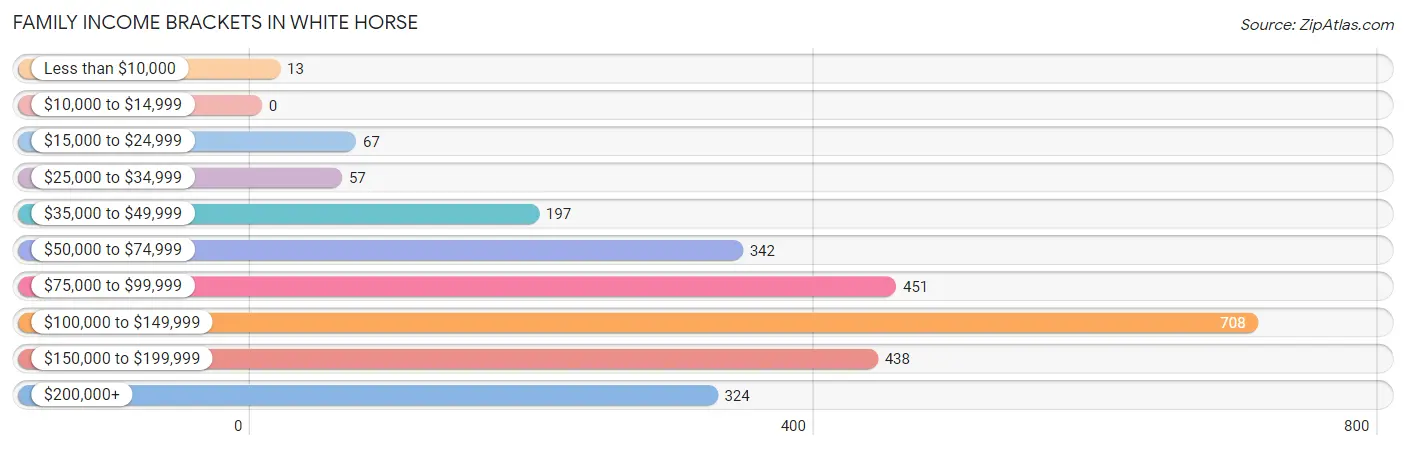
| Income Bracket | # Families | % Families |
| Less than $10,000 | 13 | 0.5% |
| $10,000 to $14,999 | 0 | 0.0% |
| $15,000 to $24,999 | 67 | 2.6% |
| $25,000 to $34,999 | 57 | 2.2% |
| $35,000 to $49,999 | 197 | 7.6% |
| $50,000 to $74,999 | 342 | 13.2% |
| $75,000 to $99,999 | 451 | 17.4% |
| $100,000 to $149,999 | 708 | 27.3% |
| $150,000 to $199,999 | 438 | 16.9% |
| $200,000+ | 324 | 12.5% |
Family Income by Famaliy Size in White Horse
4-person families (388 | 15.0%) account for the highest median family income in White Horse with $145,086 per family, while 2-person families (1,037 | 40.0%) have the highest median income of $46,830 per family member.
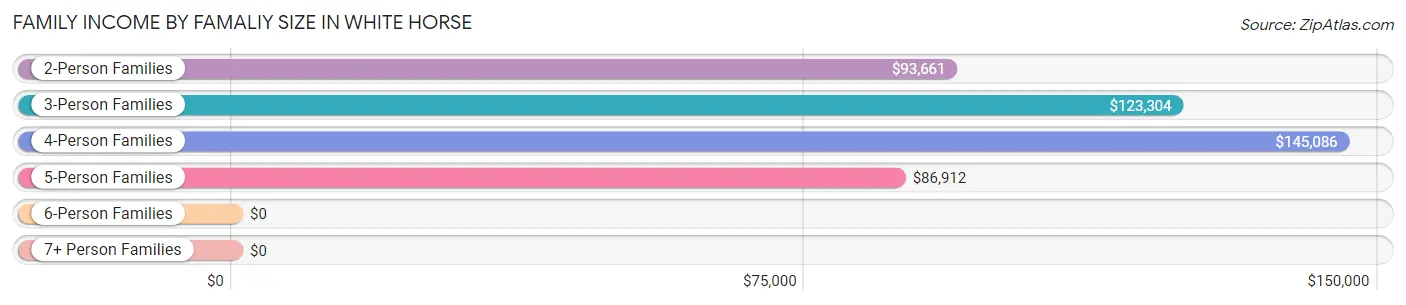
| Income Bracket | # Families | Median Income |
| 2-Person Families | 1,037 (40.0%) | $93,661 |
| 3-Person Families | 909 (35.1%) | $123,304 |
| 4-Person Families | 388 (15.0%) | $145,086 |
| 5-Person Families | 250 (9.6%) | $86,912 |
| 6-Person Families | 0 (0.0%) | $0 |
| 7+ Person Families | 9 (0.4%) | $0 |
| Total | 2,593 (100.0%) | $110,469 |
Family Income by Number of Earners in White Horse
The median family income in White Horse is $110,469, with families comprising 3+ earners (317) having the highest median family income of $172,438, while families with 1 earner (648) have the lowest median family income of $71,301, accounting for 12.2% and 25.0% of families, respectively.
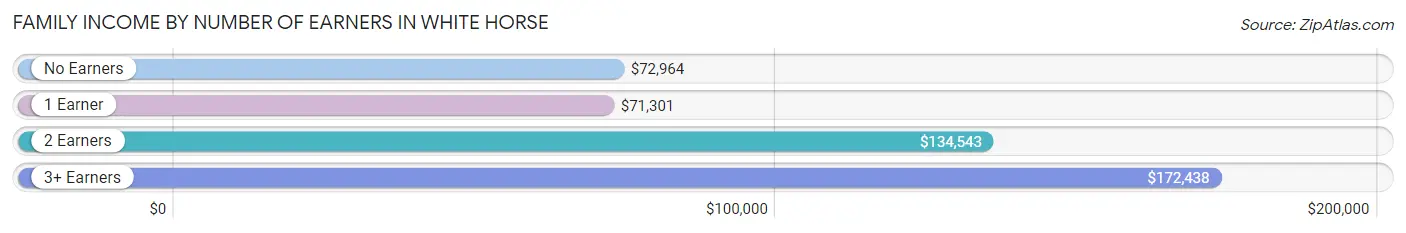
| Number of Earners | # Families | Median Income |
| No Earners | 355 (13.7%) | $72,964 |
| 1 Earner | 648 (25.0%) | $71,301 |
| 2 Earners | 1,273 (49.1%) | $134,543 |
| 3+ Earners | 317 (12.2%) | $172,438 |
| Total | 2,593 (100.0%) | $110,469 |
Household Income in White Horse
Household Income Brackets in White Horse
With 1,072 households falling in the category, the $100,000 to $149,999 income range is the most frequent in White Horse, accounting for 27.8% of all households. In contrast, only 62 households (1.6%) fall into the $10,000 to $14,999 income bracket, making it the least populous group.
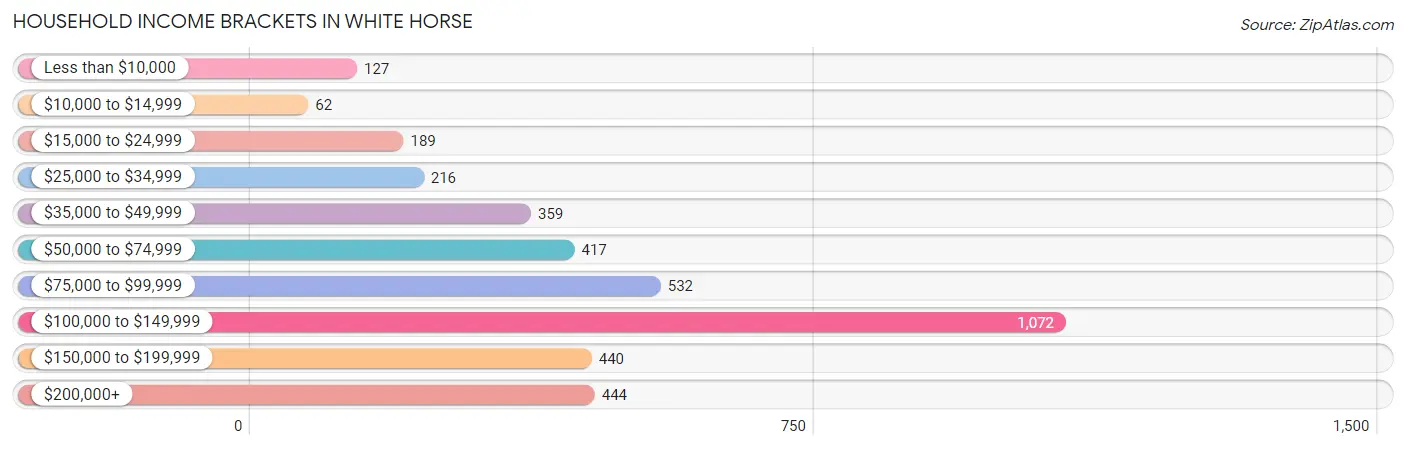
| Income Bracket | # Households | % Households |
| Less than $10,000 | 127 | 3.3% |
| $10,000 to $14,999 | 62 | 1.6% |
| $15,000 to $24,999 | 189 | 4.9% |
| $25,000 to $34,999 | 216 | 5.6% |
| $35,000 to $49,999 | 359 | 9.3% |
| $50,000 to $74,999 | 417 | 10.8% |
| $75,000 to $99,999 | 532 | 13.8% |
| $100,000 to $149,999 | 1,072 | 27.8% |
| $150,000 to $199,999 | 440 | 11.4% |
| $200,000+ | 444 | 11.5% |
Household Income by Householder Age in White Horse
The median household income in White Horse is $101,380, with the highest median household income of $122,177 found in the 45 to 64 years age bracket for the primary householder. A total of 1,465 households (38.0%) fall into this category. Meanwhile, the 15 to 24 years age bracket for the primary householder has the lowest median household income of $0, with 103 households (2.7%) in this group.
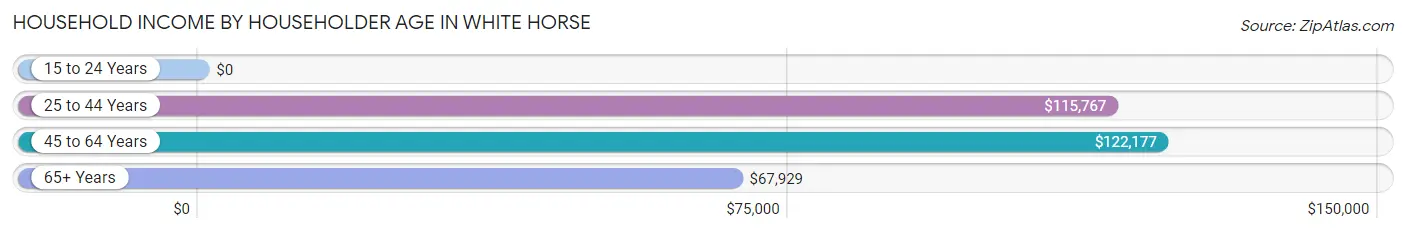
| Income Bracket | # Households | Median Income |
| 15 to 24 Years | 103 (2.7%) | $0 |
| 25 to 44 Years | 911 (23.6%) | $115,767 |
| 45 to 64 Years | 1,465 (38.0%) | $122,177 |
| 65+ Years | 1,378 (35.7%) | $67,929 |
| Total | 3,857 (100.0%) | $101,380 |
Poverty in White Horse
Income Below Poverty by Sex and Age in White Horse
With 3.9% poverty level for males and 3.1% for females among the residents of White Horse, 18 to 24 year old males and 75 year old and over females are the most vulnerable to poverty, with 40 males (9.7%) and 64 females (9.9%) in their respective age groups living below the poverty level.
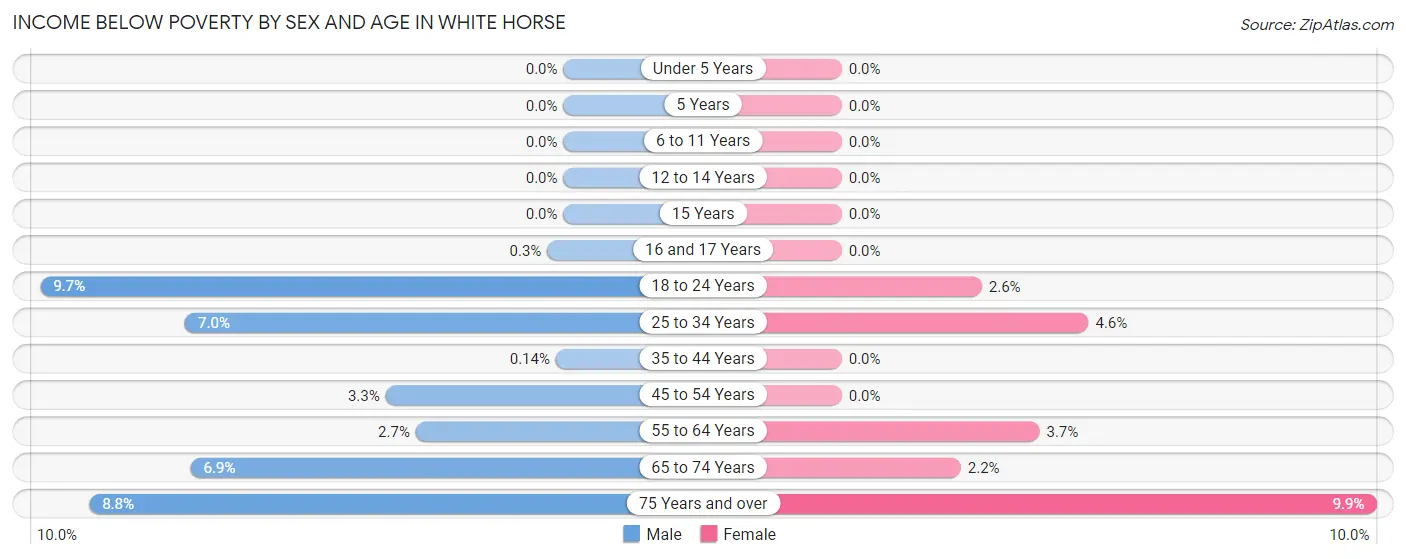
| Age Bracket | Male | Female |
| Under 5 Years | 0 (0.0%) | 0 (0.0%) |
| 5 Years | 0 (0.0%) | 0 (0.0%) |
| 6 to 11 Years | 0 (0.0%) | 0 (0.0%) |
| 12 to 14 Years | 0 (0.0%) | 0 (0.0%) |
| 15 Years | 0 (0.0%) | 0 (0.0%) |
| 16 and 17 Years | 1 (0.3%) | 0 (0.0%) |
| 18 to 24 Years | 40 (9.7%) | 12 (2.6%) |
| 25 to 34 Years | 32 (7.0%) | 34 (4.6%) |
| 35 to 44 Years | 1 (0.1%) | 0 (0.0%) |
| 45 to 54 Years | 15 (3.3%) | 0 (0.0%) |
| 55 to 64 Years | 23 (2.7%) | 25 (3.7%) |
| 65 to 74 Years | 48 (6.9%) | 12 (2.2%) |
| 75 Years and over | 33 (8.8%) | 64 (9.9%) |
| Total | 193 (3.9%) | 147 (3.1%) |
Income Above Poverty by Sex and Age in White Horse
According to the poverty statistics in White Horse, males aged under 5 years and females aged under 5 years are the age groups that are most secure financially, with 100.0% of males and 100.0% of females in these age groups living above the poverty line.
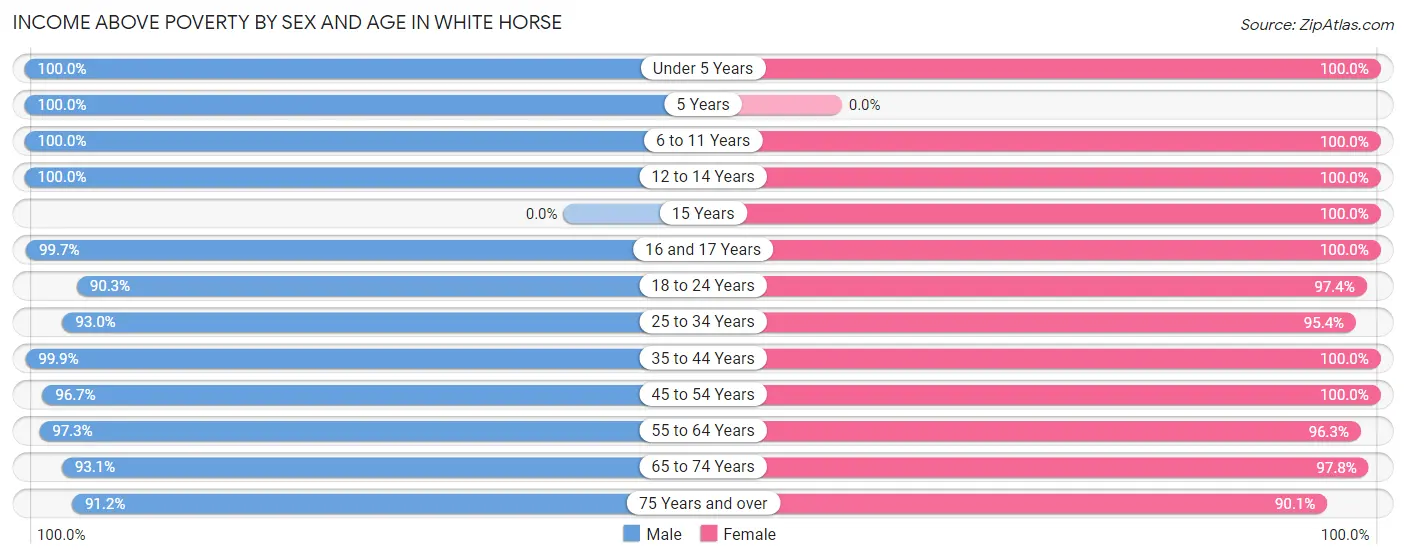
| Age Bracket | Male | Female |
| Under 5 Years | 273 (100.0%) | 59 (100.0%) |
| 5 Years | 148 (100.0%) | 0 (0.0%) |
| 6 to 11 Years | 165 (100.0%) | 239 (100.0%) |
| 12 to 14 Years | 46 (100.0%) | 149 (100.0%) |
| 15 Years | 0 (0.0%) | 10 (100.0%) |
| 16 and 17 Years | 329 (99.7%) | 79 (100.0%) |
| 18 to 24 Years | 372 (90.3%) | 450 (97.4%) |
| 25 to 34 Years | 424 (93.0%) | 709 (95.4%) |
| 35 to 44 Years | 726 (99.9%) | 627 (100.0%) |
| 45 to 54 Years | 439 (96.7%) | 534 (100.0%) |
| 55 to 64 Years | 817 (97.3%) | 657 (96.3%) |
| 65 to 74 Years | 646 (93.1%) | 531 (97.8%) |
| 75 Years and over | 342 (91.2%) | 581 (90.1%) |
| Total | 4,727 (96.1%) | 4,625 (96.9%) |
Income Below Poverty Among Married-Couple Families in White Horse
The poverty statistics for married-couple families in White Horse show that 0.6% or 12 of the total 2,044 families live below the poverty line. Families with no children have the highest poverty rate of 0.9%, comprising of 12 families. On the other hand, families with 1 or 2 children have the lowest poverty rate of 0.0%, which includes 0 families.
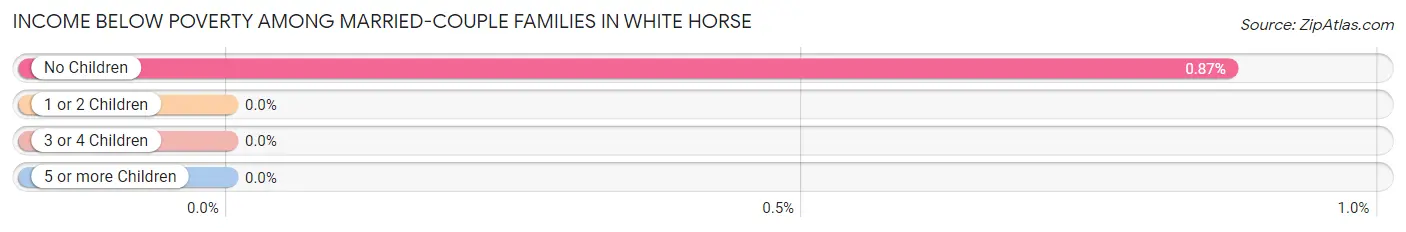
| Children | Above Poverty | Below Poverty |
| No Children | 1,370 (99.1%) | 12 (0.9%) |
| 1 or 2 Children | 601 (100.0%) | 0 (0.0%) |
| 3 or 4 Children | 61 (100.0%) | 0 (0.0%) |
| 5 or more Children | 0 (0.0%) | 0 (0.0%) |
| Total | 2,032 (99.4%) | 12 (0.6%) |
Income Below Poverty Among Single-Parent Households in White Horse
| Children | Single Father | Single Mother |
| No Children | 0 (0.0%) | 0 (0.0%) |
| 1 or 2 Children | 0 (0.0%) | 0 (0.0%) |
| 3 or 4 Children | 0 (0.0%) | 0 (0.0%) |
| 5 or more Children | 0 (0.0%) | 0 (0.0%) |
| Total | 0 (0.0%) | 0 (0.0%) |
Income Below Poverty Among Married-Couple vs Single-Parent Households in White Horse
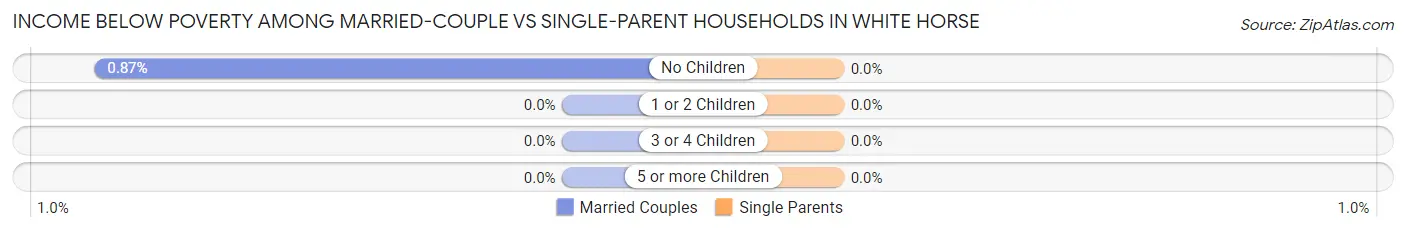
| Children | Married-Couple Families | Single-Parent Households |
| No Children | 12 (0.9%) | 0 (0.0%) |
| 1 or 2 Children | 0 (0.0%) | 0 (0.0%) |
| 3 or 4 Children | 0 (0.0%) | 0 (0.0%) |
| 5 or more Children | 0 (0.0%) | 0 (0.0%) |
| Total | 12 (0.6%) | 0 (0.0%) |
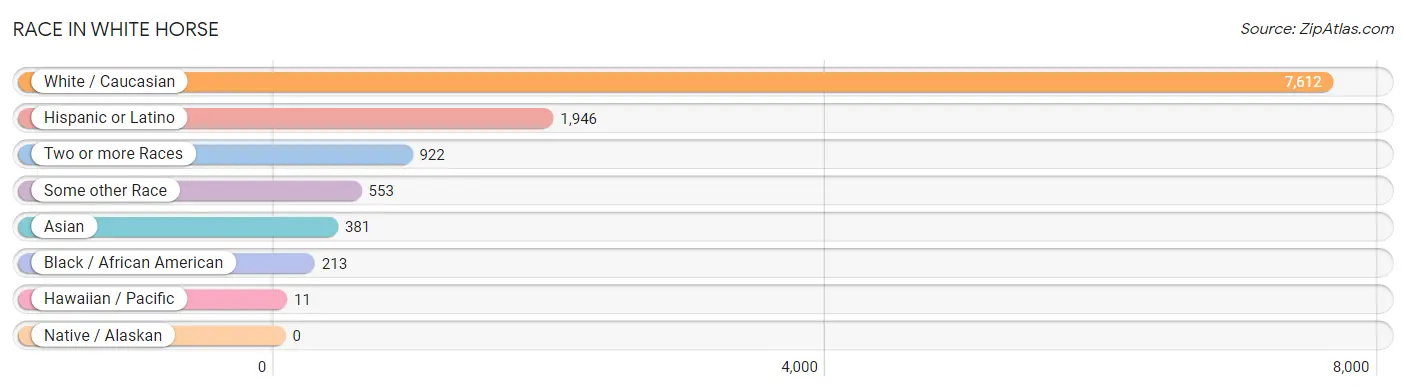
Race in White Horse
The most populous races in White Horse are White / Caucasian (7,612 | 78.5%), Hispanic or Latino (1,946 | 20.1%), and Two or more Races (922 | 9.5%).
| Race | # Population | % Population |
| Asian | 381 | 3.9% |
| Black / African American | 213 | 2.2% |
| Hawaiian / Pacific | 11 | 0.1% |
| Hispanic or Latino | 1,946 | 20.1% |
| Native / Alaskan | 0 | 0.0% |
| White / Caucasian | 7,612 | 78.5% |
| Two or more Races | 922 | 9.5% |
| Some other Race | 553 | 5.7% |
| Total | 9,692 | 100.0% |
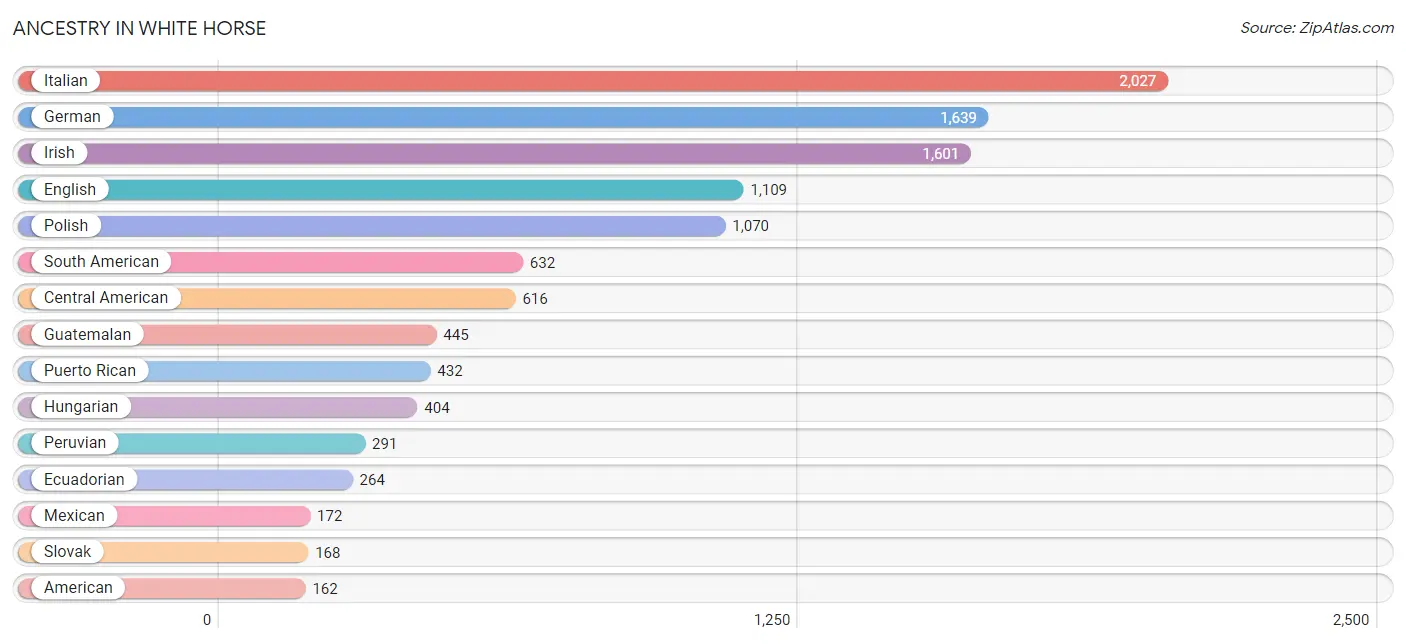
Ancestry in White Horse
The most populous ancestries reported in White Horse are Italian (2,027 | 20.9%), German (1,639 | 16.9%), Irish (1,601 | 16.5%), English (1,109 | 11.4%), and Polish (1,070 | 11.0%), together accounting for 76.8% of all White Horse residents.
| Ancestry | # Population | % Population |
| American | 162 | 1.7% |
| Arab | 70 | 0.7% |
| Austrian | 26 | 0.3% |
| Brazilian | 58 | 0.6% |
| British | 28 | 0.3% |
| Burmese | 56 | 0.6% |
| Canadian | 75 | 0.8% |
| Central American | 616 | 6.4% |
| Central American Indian | 22 | 0.2% |
| Colombian | 77 | 0.8% |
| Costa Rican | 12 | 0.1% |
| Cuban | 12 | 0.1% |
| Czech | 26 | 0.3% |
| Dominican | 22 | 0.2% |
| Dutch | 70 | 0.7% |
| Eastern European | 7 | 0.1% |
| Ecuadorian | 264 | 2.7% |
| Egyptian | 70 | 0.7% |
| English | 1,109 | 11.4% |
| European | 17 | 0.2% |
| Finnish | 14 | 0.1% |
| French | 139 | 1.4% |
| German | 1,639 | 16.9% |
| Greek | 19 | 0.2% |
| Guamanian / Chamorro | 7 | 0.1% |
| Guatemalan | 445 | 4.6% |
| Haitian | 42 | 0.4% |
| Hungarian | 404 | 4.2% |
| Indian (Asian) | 8 | 0.1% |
| Indonesian | 143 | 1.5% |
| Irish | 1,601 | 16.5% |
| Italian | 2,027 | 20.9% |
| Korean | 35 | 0.4% |
| Latvian | 22 | 0.2% |
| Mexican | 172 | 1.8% |
| Pennsylvania German | 19 | 0.2% |
| Peruvian | 291 | 3.0% |
| Polish | 1,070 | 11.0% |
| Puerto Rican | 432 | 4.5% |
| Romanian | 8 | 0.1% |
| Russian | 49 | 0.5% |
| Salvadoran | 159 | 1.6% |
| Samoan | 11 | 0.1% |
| Scotch-Irish | 12 | 0.1% |
| Scottish | 125 | 1.3% |
| Slovak | 168 | 1.7% |
| South American | 632 | 6.5% |
| Spaniard | 16 | 0.2% |
| Sri Lankan | 93 | 1.0% |
| Swedish | 12 | 0.1% |
| Thai | 68 | 0.7% |
| Trinidadian and Tobagonian | 25 | 0.3% |
| Turkish | 51 | 0.5% |
| Ukrainian | 45 | 0.5% | View All 54 Rows |
Immigrants in White Horse
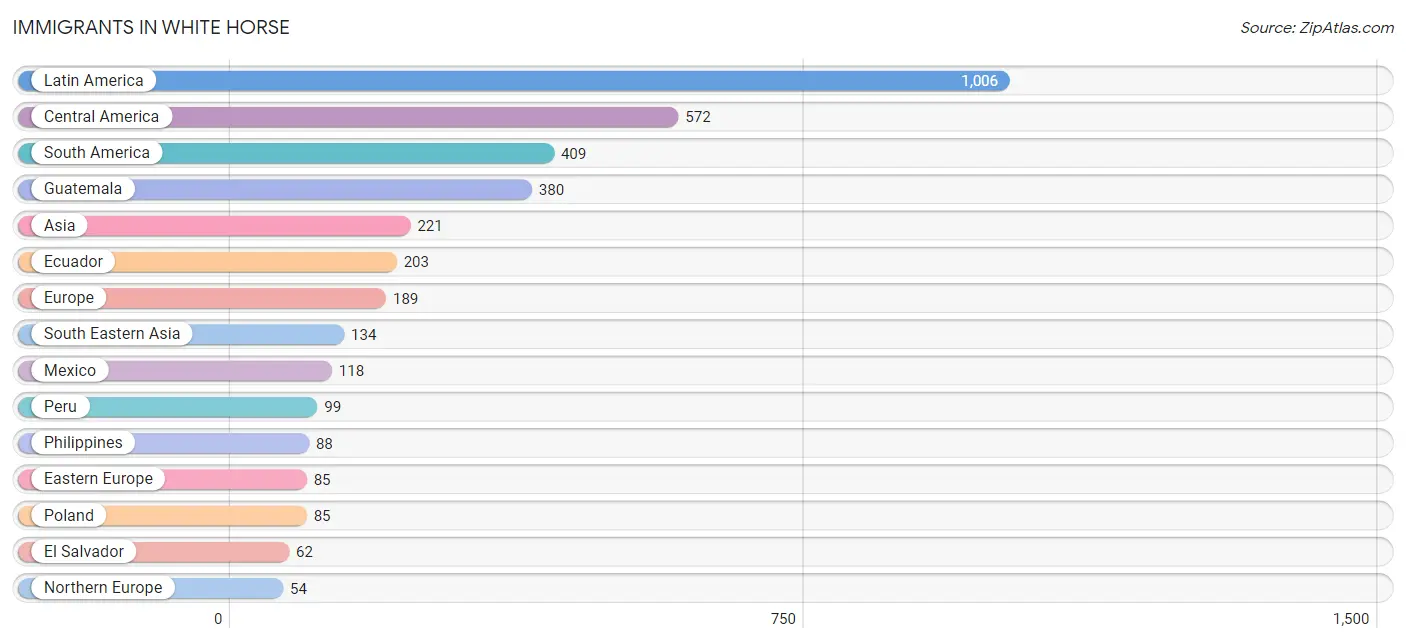
The most numerous immigrant groups reported in White Horse came from Latin America (1,006 | 10.4%), Central America (572 | 5.9%), South America (409 | 4.2%), Guatemala (380 | 3.9%), and Asia (221 | 2.3%), together accounting for 26.7% of all White Horse residents.
| Immigration Origin | # Population | % Population |
| Africa | 44 | 0.4% |
| Asia | 221 | 2.3% |
| Brazil | 48 | 0.5% |
| Caribbean | 25 | 0.3% |
| Central America | 572 | 5.9% |
| Colombia | 33 | 0.3% |
| Costa Rica | 12 | 0.1% |
| Eastern Asia | 14 | 0.1% |
| Eastern Europe | 85 | 0.9% |
| Ecuador | 203 | 2.1% |
| Egypt | 44 | 0.4% |
| El Salvador | 62 | 0.6% |
| England | 20 | 0.2% |
| Europe | 189 | 1.9% |
| Germany | 30 | 0.3% |
| Guatemala | 380 | 3.9% |
| India | 22 | 0.2% |
| Ireland | 34 | 0.4% |
| Italy | 20 | 0.2% |
| Korea | 14 | 0.1% |
| Latin America | 1,006 | 10.4% |
| Mexico | 118 | 1.2% |
| Northern Africa | 44 | 0.4% |
| Northern Europe | 54 | 0.6% |
| Peru | 99 | 1.0% |
| Philippines | 88 | 0.9% |
| Poland | 85 | 0.9% |
| South America | 409 | 4.2% |
| South Central Asia | 22 | 0.2% |
| South Eastern Asia | 134 | 1.4% |
| Southern Europe | 20 | 0.2% |
| Trinidad and Tobago | 25 | 0.3% |
| Turkey | 51 | 0.5% |
| Venezuela | 26 | 0.3% |
| Vietnam | 46 | 0.5% |
| Western Asia | 51 | 0.5% |
| Western Europe | 30 | 0.3% | View All 37 Rows |
Sex and Age in White Horse
Sex and Age in White Horse
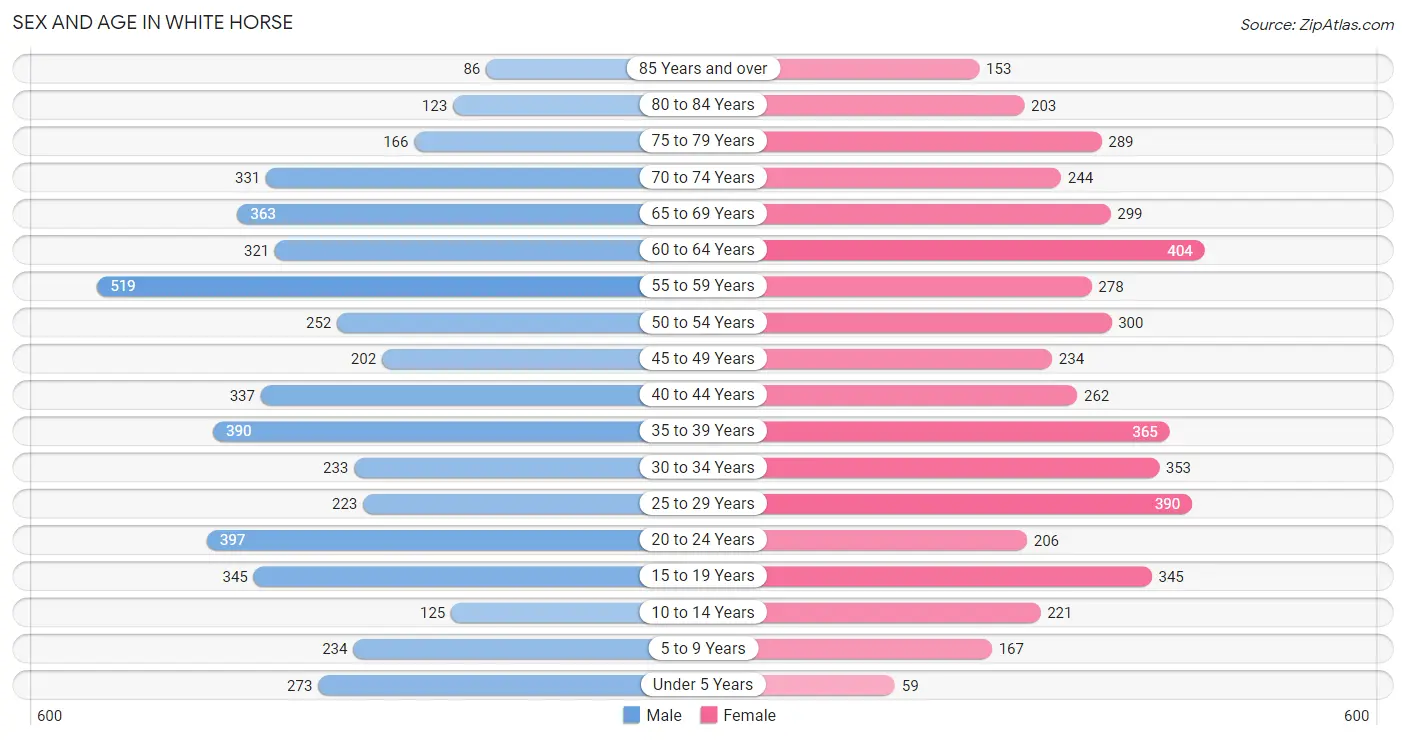
The most populous age groups in White Horse are 55 to 59 Years (519 | 10.5%) for men and 60 to 64 Years (404 | 8.5%) for women.
| Age Bracket | Male | Female |
| Under 5 Years | 273 (5.6%) | 59 (1.2%) |
| 5 to 9 Years | 234 (4.8%) | 167 (3.5%) |
| 10 to 14 Years | 125 (2.5%) | 221 (4.6%) |
| 15 to 19 Years | 345 (7.0%) | 345 (7.2%) |
| 20 to 24 Years | 397 (8.1%) | 206 (4.3%) |
| 25 to 29 Years | 223 (4.5%) | 390 (8.2%) |
| 30 to 34 Years | 233 (4.7%) | 353 (7.4%) |
| 35 to 39 Years | 390 (7.9%) | 365 (7.6%) |
| 40 to 44 Years | 337 (6.9%) | 262 (5.5%) |
| 45 to 49 Years | 202 (4.1%) | 234 (4.9%) |
| 50 to 54 Years | 252 (5.1%) | 300 (6.3%) |
| 55 to 59 Years | 519 (10.5%) | 278 (5.8%) |
| 60 to 64 Years | 321 (6.5%) | 404 (8.5%) |
| 65 to 69 Years | 363 (7.4%) | 299 (6.3%) |
| 70 to 74 Years | 331 (6.7%) | 244 (5.1%) |
| 75 to 79 Years | 166 (3.4%) | 289 (6.1%) |
| 80 to 84 Years | 123 (2.5%) | 203 (4.3%) |
| 85 Years and over | 86 (1.8%) | 153 (3.2%) |
| Total | 4,920 (100.0%) | 4,772 (100.0%) |
Families and Households in White Horse
Median Family Size in White Horse
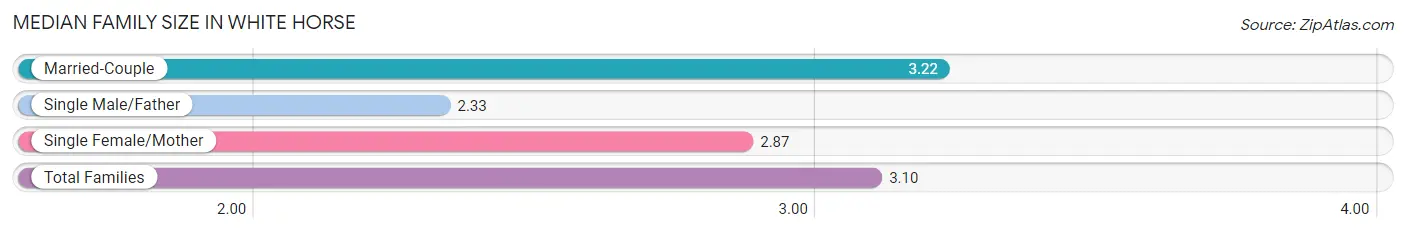
The median family size in White Horse is 3.10 persons per family, with married-couple families (2,044 | 78.8%) accounting for the largest median family size of 3.22 persons per family. On the other hand, single male/father families (225 | 8.7%) represent the smallest median family size with 2.33 persons per family.
| Family Type | # Families | Family Size |
| Married-Couple | 2,044 (78.8%) | 3.22 |
| Single Male/Father | 225 (8.7%) | 2.33 |
| Single Female/Mother | 324 (12.5%) | 2.87 |
| Total Families | 2,593 (100.0%) | 3.10 |
Median Household Size in White Horse
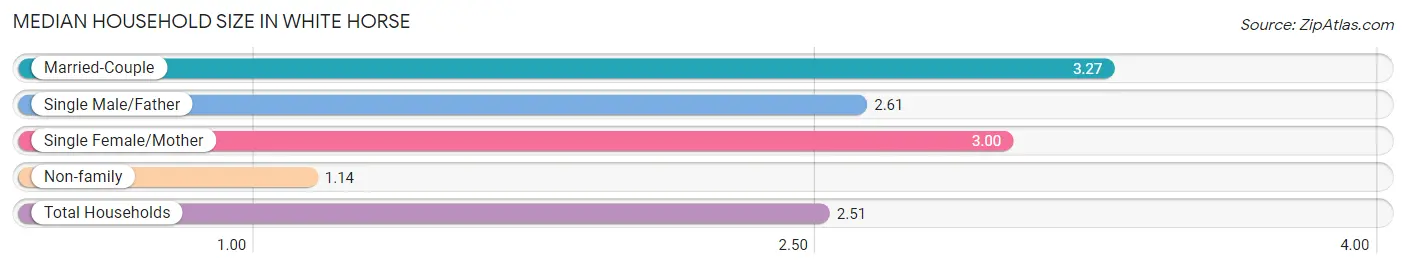
The median household size in White Horse is 2.51 persons per household, with married-couple households (2,044 | 53.0%) accounting for the largest median household size of 3.27 persons per household. non-family households (1,264 | 32.8%) represent the smallest median household size with 1.14 persons per household.
| Household Type | # Households | Household Size |
| Married-Couple | 2,044 (53.0%) | 3.27 |
| Single Male/Father | 225 (5.8%) | 2.61 |
| Single Female/Mother | 324 (8.4%) | 3.00 |
| Non-family | 1,264 (32.8%) | 1.14 |
| Total Households | 3,857 (100.0%) | 2.51 |
Household Size by Marriage Status in White Horse
Out of a total of 3,857 households in White Horse, 2,593 (67.2%) are family households, while 1,264 (32.8%) are nonfamily households. The most numerous type of family households are 2-person households, comprising 982, and the most common type of nonfamily households are 1-person households, comprising 1,111.
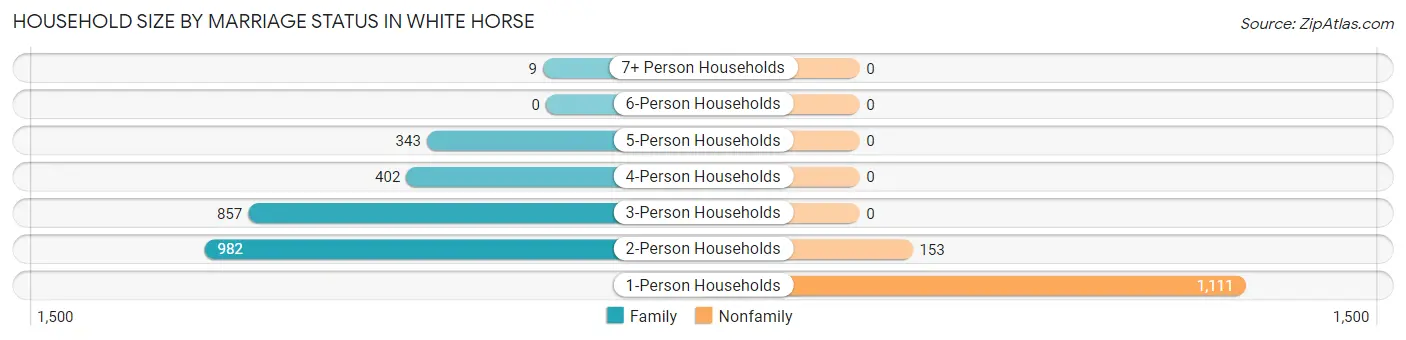
| Household Size | Family Households | Nonfamily Households |
| 1-Person Households | - | 1,111 (28.8%) |
| 2-Person Households | 982 (25.5%) | 153 (4.0%) |
| 3-Person Households | 857 (22.2%) | 0 (0.0%) |
| 4-Person Households | 402 (10.4%) | 0 (0.0%) |
| 5-Person Households | 343 (8.9%) | 0 (0.0%) |
| 6-Person Households | 0 (0.0%) | 0 (0.0%) |
| 7+ Person Households | 9 (0.2%) | 0 (0.0%) |
| Total | 2,593 (67.2%) | 1,264 (32.8%) |
Female Fertility in White Horse
Fertility by Age in White Horse
| Age Bracket | Women with Births | Births / 1,000 Women |
| 15 to 19 years | 0 (0.0%) | 0.0 |
| 20 to 34 years | 0 (0.0%) | 0.0 |
| 35 to 50 years | 0 (0.0%) | 0.0 |
| Total | 0 (0.0%) | 0.0 |
Fertility by Age by Marriage Status in White Horse
| Age Bracket | Married | Unmarried |
| 15 to 19 years | 0 (0.0%) | 0 (0.0%) |
| 20 to 34 years | 0 (0.0%) | 0 (0.0%) |
| 35 to 50 years | 0 (0.0%) | 0 (0.0%) |
| Total | 0 (0.0%) | 0 (0.0%) |
Fertility by Education in White Horse
| Educational Attainment | Women with Births | Births / 1,000 Women |
| Less than High School | 0 (0.0%) | 0.0 |
| High School Diploma | 0 (0.0%) | 0.0 |
| College or Associate's Degree | 0 (0.0%) | 0.0 |
| Bachelor's Degree | 0 (0.0%) | 0.0 |
| Graduate Degree | 0 (0.0%) | 0.0 |
| Total | 0 (0.0%) | 0.0 |
Fertility by Education by Marriage Status in White Horse
| Educational Attainment | Married | Unmarried |
| Less than High School | 0 (0.0%) | 0 (0.0%) |
| High School Diploma | 0 (0.0%) | 0 (0.0%) |
| College or Associate's Degree | 0 (0.0%) | 0 (0.0%) |
| Bachelor's Degree | 0 (0.0%) | 0 (0.0%) |
| Graduate Degree | 0 (0.0%) | 0 (0.0%) |
| Total | 0 (0.0%) | 0 (0.0%) |
Employment Characteristics in White Horse
Employment by Class of Employer in White Horse
Among the 5,088 employed individuals in White Horse, private company employees (3,491 | 68.6%), local government employees (516 | 10.1%), and not-for-profit organizations (479 | 9.4%) make up the most common classes of employment.
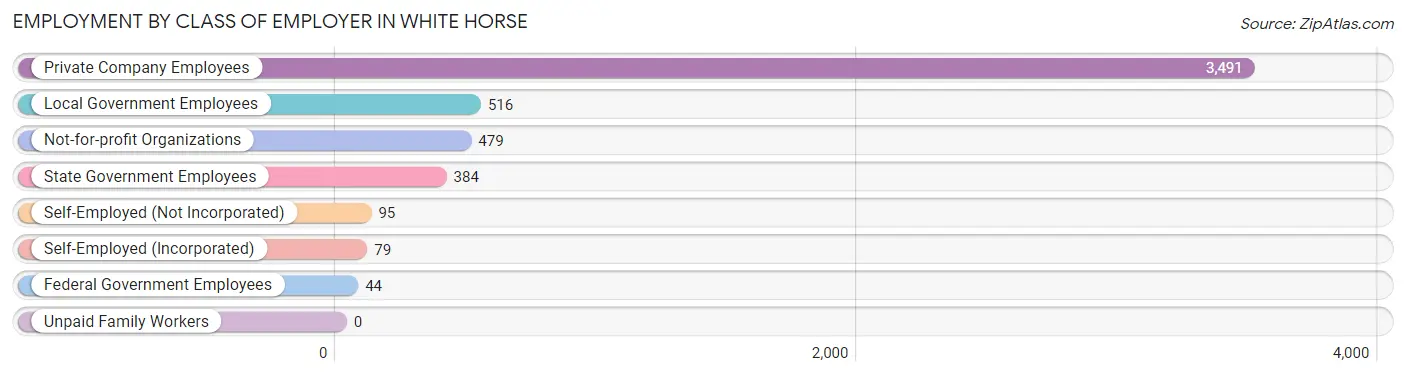
| Employer Class | # Employees | % Employees |
| Private Company Employees | 3,491 | 68.6% |
| Self-Employed (Incorporated) | 79 | 1.5% |
| Self-Employed (Not Incorporated) | 95 | 1.9% |
| Not-for-profit Organizations | 479 | 9.4% |
| Local Government Employees | 516 | 10.1% |
| State Government Employees | 384 | 7.5% |
| Federal Government Employees | 44 | 0.9% |
| Unpaid Family Workers | 0 | 0.0% |
| Total | 5,088 | 100.0% |
Employment Status by Age in White Horse
According to the labor force statistics for White Horse, out of the total population over 16 years of age (8,603), 61.3% or 5,274 individuals are in the labor force, with 3.0% or 158 of them unemployed. The age group with the highest labor force participation rate is 30 to 34 years, with 91.5% or 536 individuals in the labor force. Within the labor force, the 16 to 19 years age range has the highest percentage of unemployed individuals, with 23.3% or 31 of them being unemployed.
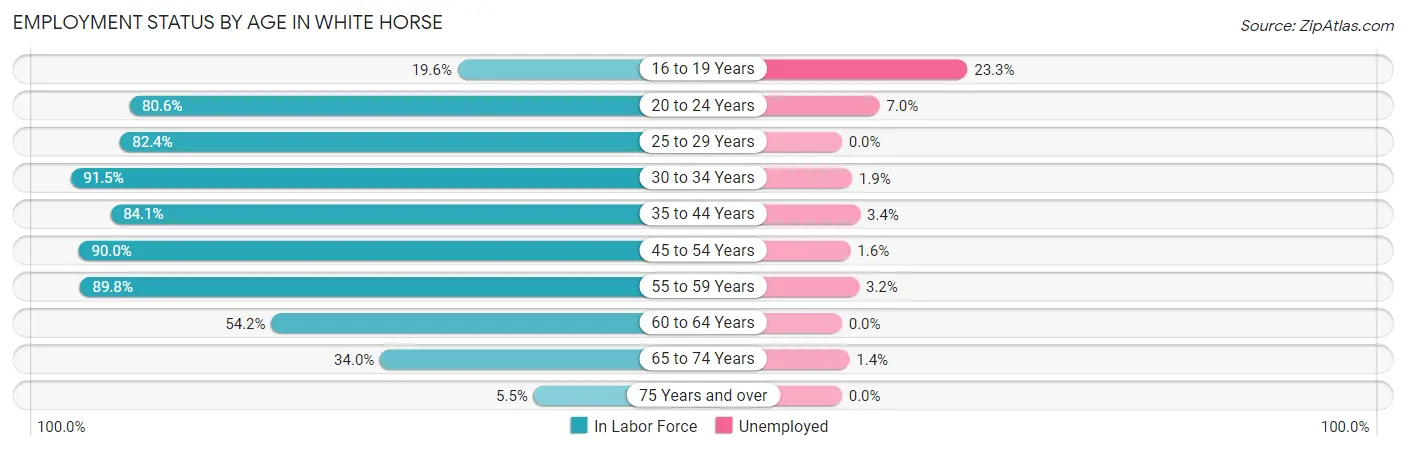
| Age Bracket | In Labor Force | Unemployed |
| 16 to 19 Years | 133 (19.6%) | 31 (23.3%) |
| 20 to 24 Years | 486 (80.6%) | 34 (7.0%) |
| 25 to 29 Years | 505 (82.4%) | 0 (0.0%) |
| 30 to 34 Years | 536 (91.5%) | 10 (1.9%) |
| 35 to 44 Years | 1,139 (84.1%) | 39 (3.4%) |
| 45 to 54 Years | 889 (90.0%) | 14 (1.6%) |
| 55 to 59 Years | 716 (89.8%) | 23 (3.2%) |
| 60 to 64 Years | 393 (54.2%) | 0 (0.0%) |
| 65 to 74 Years | 421 (34.0%) | 6 (1.4%) |
| 75 Years and over | 56 (5.5%) | 0 (0.0%) |
| Total | 5,274 (61.3%) | 158 (3.0%) |
Employment Status by Educational Attainment in White Horse
According to labor force statistics for White Horse, 82.5% of individuals (4,177) out of the total population between 25 and 64 years of age (5,063) are in the labor force, with 2.1% or 88 of them being unemployed. The group with the highest labor force participation rate are those with the educational attainment of bachelor's degree or higher, with 96.4% or 1,692 individuals in the labor force. Within the labor force, individuals with less than high school education have the highest percentage of unemployment, with 4.5% or 12 of them being unemployed.
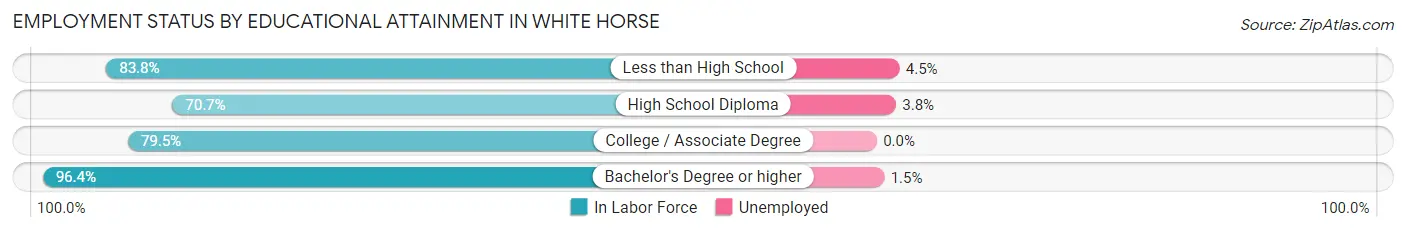
| Educational Attainment | In Labor Force | Unemployed |
| Less than High School | 264 (83.8%) | 14 (4.5%) |
| High School Diploma | 1,261 (70.7%) | 68 (3.8%) |
| College / Associate Degree | 962 (79.5%) | 0 (0.0%) |
| Bachelor's Degree or higher | 1,692 (96.4%) | 26 (1.5%) |
| Total | 4,177 (82.5%) | 106 (2.1%) |
Employment Occupations by Sex in White Horse
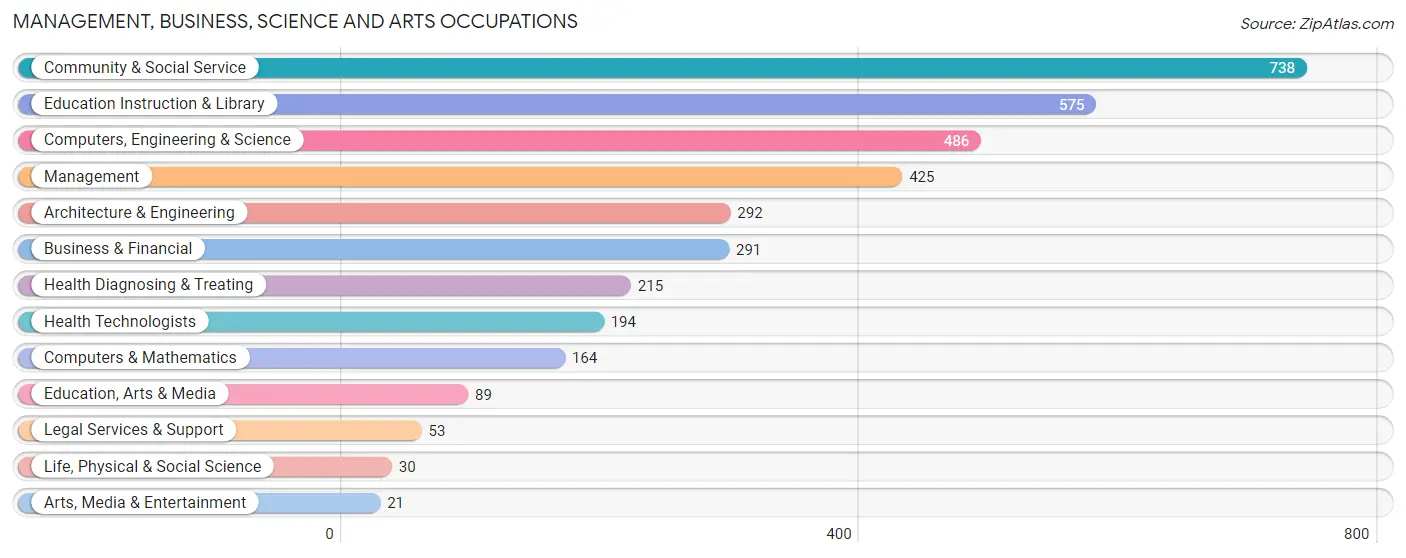
Management, Business, Science and Arts Occupations
The most common Management, Business, Science and Arts occupations in White Horse are Community & Social Service (738 | 14.4%), Education Instruction & Library (575 | 11.2%), Computers, Engineering & Science (486 | 9.5%), Management (425 | 8.3%), and Architecture & Engineering (292 | 5.7%).
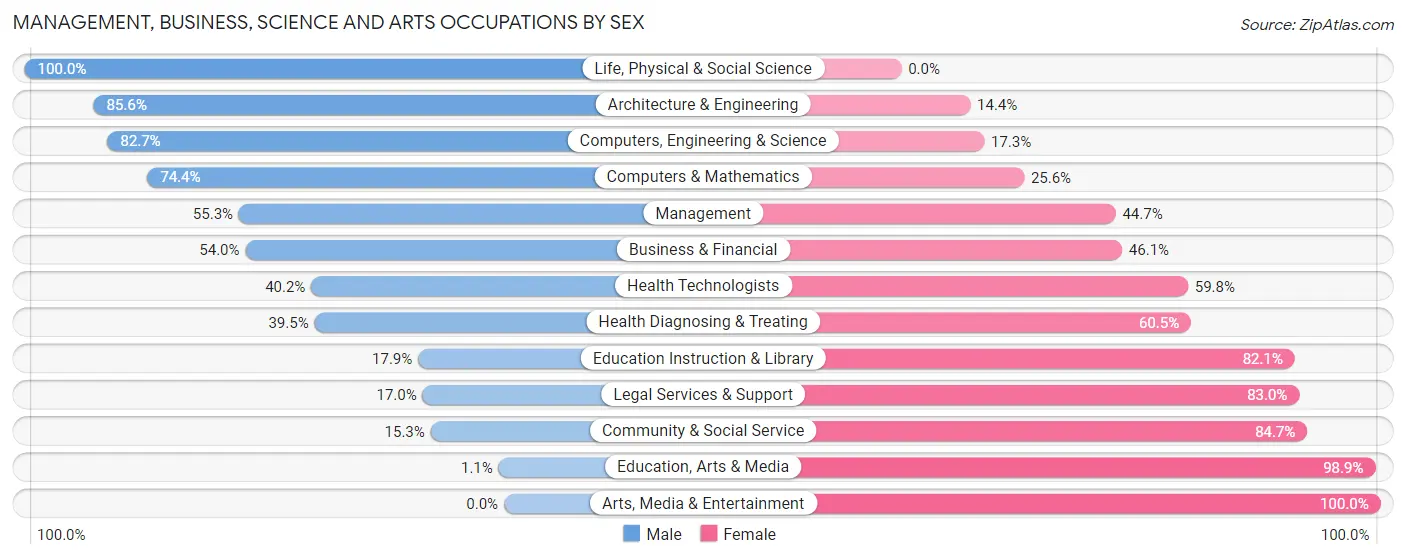
Management, Business, Science and Arts Occupations by Sex
Within the Management, Business, Science and Arts occupations in White Horse, the most male-oriented occupations are Life, Physical & Social Science (100.0%), Architecture & Engineering (85.6%), and Computers, Engineering & Science (82.7%), while the most female-oriented occupations are Arts, Media & Entertainment (100.0%), Education, Arts & Media (98.9%), and Community & Social Service (84.7%).
| Occupation | Male | Female |
| Management | 235 (55.3%) | 190 (44.7%) |
| Business & Financial | 157 (53.9%) | 134 (46.1%) |
| Computers, Engineering & Science | 402 (82.7%) | 84 (17.3%) |
| Computers & Mathematics | 122 (74.4%) | 42 (25.6%) |
| Architecture & Engineering | 250 (85.6%) | 42 (14.4%) |
| Life, Physical & Social Science | 30 (100.0%) | 0 (0.0%) |
| Community & Social Service | 113 (15.3%) | 625 (84.7%) |
| Education, Arts & Media | 1 (1.1%) | 88 (98.9%) |
| Legal Services & Support | 9 (17.0%) | 44 (83.0%) |
| Education Instruction & Library | 103 (17.9%) | 472 (82.1%) |
| Arts, Media & Entertainment | 0 (0.0%) | 21 (100.0%) |
| Health Diagnosing & Treating | 85 (39.5%) | 130 (60.5%) |
| Health Technologists | 78 (40.2%) | 116 (59.8%) |
| Total (Category) | 992 (46.0%) | 1,163 (54.0%) |
| Total (Overall) | 2,671 (52.2%) | 2,446 (47.8%) |
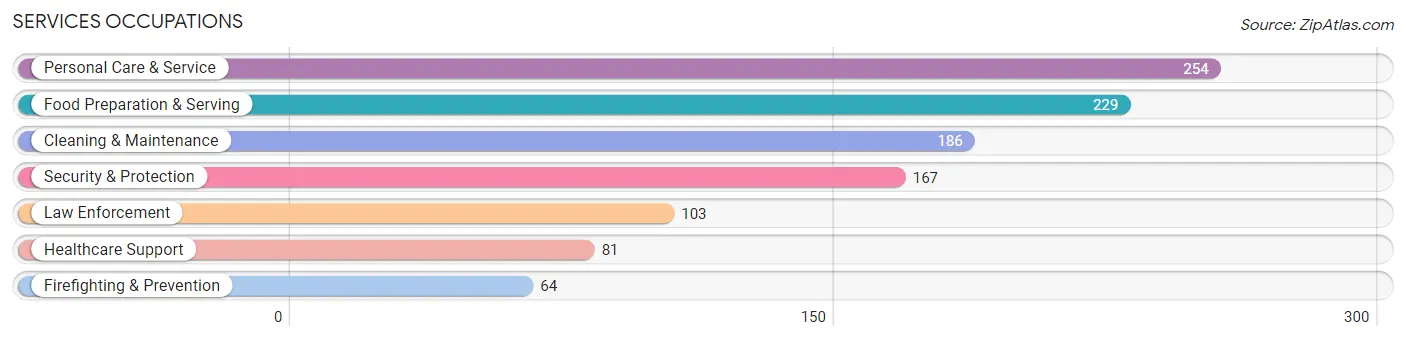
Services Occupations
The most common Services occupations in White Horse are Personal Care & Service (254 | 5.0%), Food Preparation & Serving (229 | 4.5%), Cleaning & Maintenance (186 | 3.6%), Security & Protection (167 | 3.3%), and Law Enforcement (103 | 2.0%).
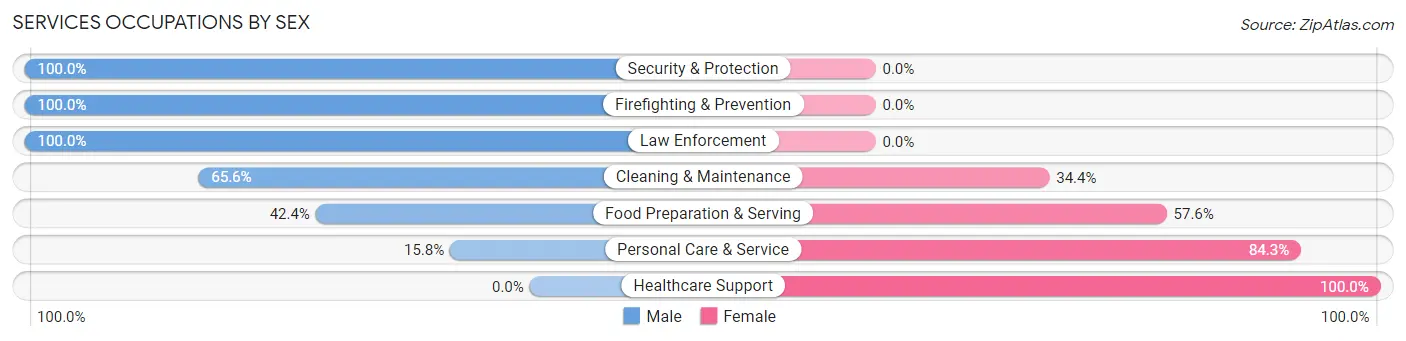
Services Occupations by Sex
Within the Services occupations in White Horse, the most male-oriented occupations are Security & Protection (100.0%), Firefighting & Prevention (100.0%), and Law Enforcement (100.0%), while the most female-oriented occupations are Healthcare Support (100.0%), Personal Care & Service (84.3%), and Food Preparation & Serving (57.6%).
| Occupation | Male | Female |
| Healthcare Support | 0 (0.0%) | 81 (100.0%) |
| Security & Protection | 167 (100.0%) | 0 (0.0%) |
| Firefighting & Prevention | 64 (100.0%) | 0 (0.0%) |
| Law Enforcement | 103 (100.0%) | 0 (0.0%) |
| Food Preparation & Serving | 97 (42.4%) | 132 (57.6%) |
| Cleaning & Maintenance | 122 (65.6%) | 64 (34.4%) |
| Personal Care & Service | 40 (15.8%) | 214 (84.3%) |
| Total (Category) | 426 (46.5%) | 491 (53.5%) |
| Total (Overall) | 2,671 (52.2%) | 2,446 (47.8%) |
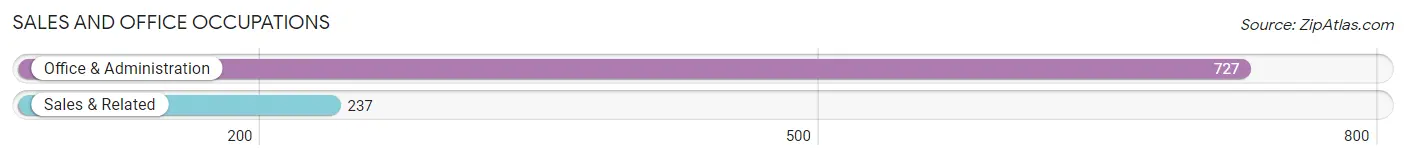
Sales and Office Occupations
The most common Sales and Office occupations in White Horse are Office & Administration (727 | 14.2%), and Sales & Related (237 | 4.6%).
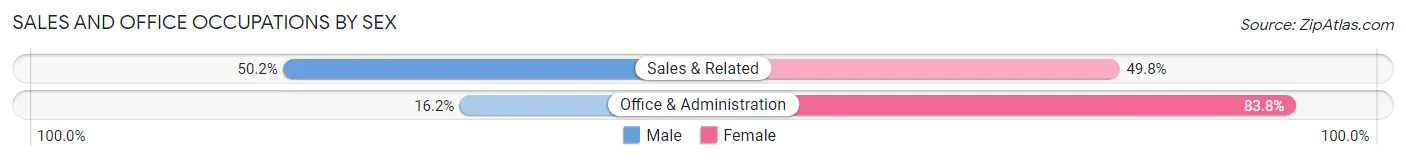
Sales and Office Occupations by Sex
| Occupation | Male | Female |
| Sales & Related | 119 (50.2%) | 118 (49.8%) |
| Office & Administration | 118 (16.2%) | 609 (83.8%) |
| Total (Category) | 237 (24.6%) | 727 (75.4%) |
| Total (Overall) | 2,671 (52.2%) | 2,446 (47.8%) |
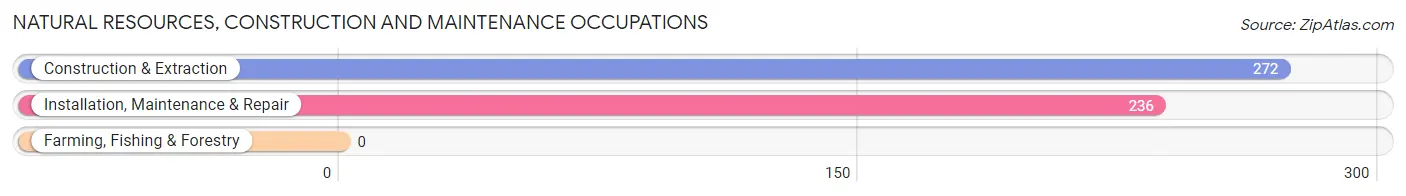
Natural Resources, Construction and Maintenance Occupations
The most common Natural Resources, Construction and Maintenance occupations in White Horse are Construction & Extraction (272 | 5.3%), and Installation, Maintenance & Repair (236 | 4.6%).
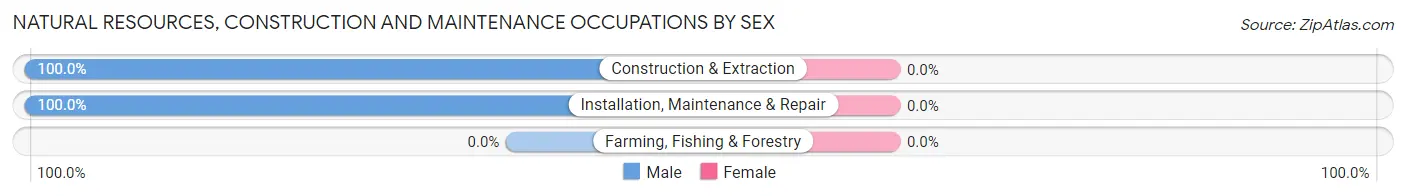
Natural Resources, Construction and Maintenance Occupations by Sex
| Occupation | Male | Female |
| Farming, Fishing & Forestry | 0 (0.0%) | 0 (0.0%) |
| Construction & Extraction | 272 (100.0%) | 0 (0.0%) |
| Installation, Maintenance & Repair | 236 (100.0%) | 0 (0.0%) |
| Total (Category) | 508 (100.0%) | 0 (0.0%) |
| Total (Overall) | 2,671 (52.2%) | 2,446 (47.8%) |
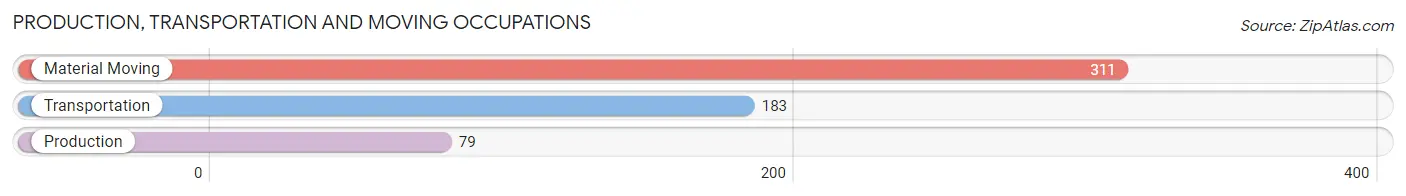
Production, Transportation and Moving Occupations
The most common Production, Transportation and Moving occupations in White Horse are Material Moving (311 | 6.1%), Transportation (183 | 3.6%), and Production (79 | 1.5%).
Production, Transportation and Moving Occupations by Sex
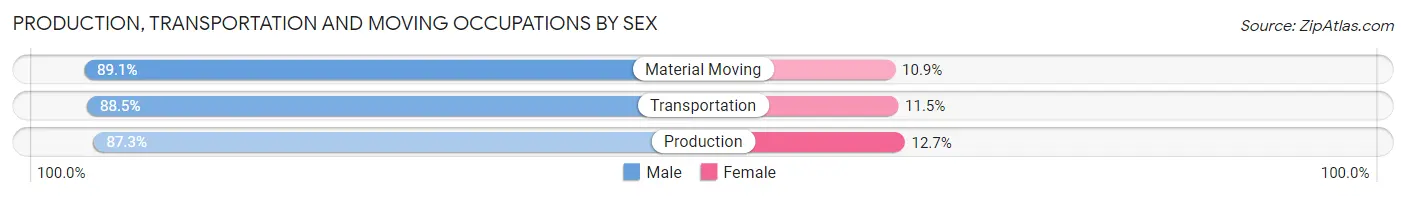
| Occupation | Male | Female |
| Production | 69 (87.3%) | 10 (12.7%) |
| Transportation | 162 (88.5%) | 21 (11.5%) |
| Material Moving | 277 (89.1%) | 34 (10.9%) |
| Total (Category) | 508 (88.7%) | 65 (11.3%) |
| Total (Overall) | 2,671 (52.2%) | 2,446 (47.8%) |
Employment Industries by Sex in White Horse
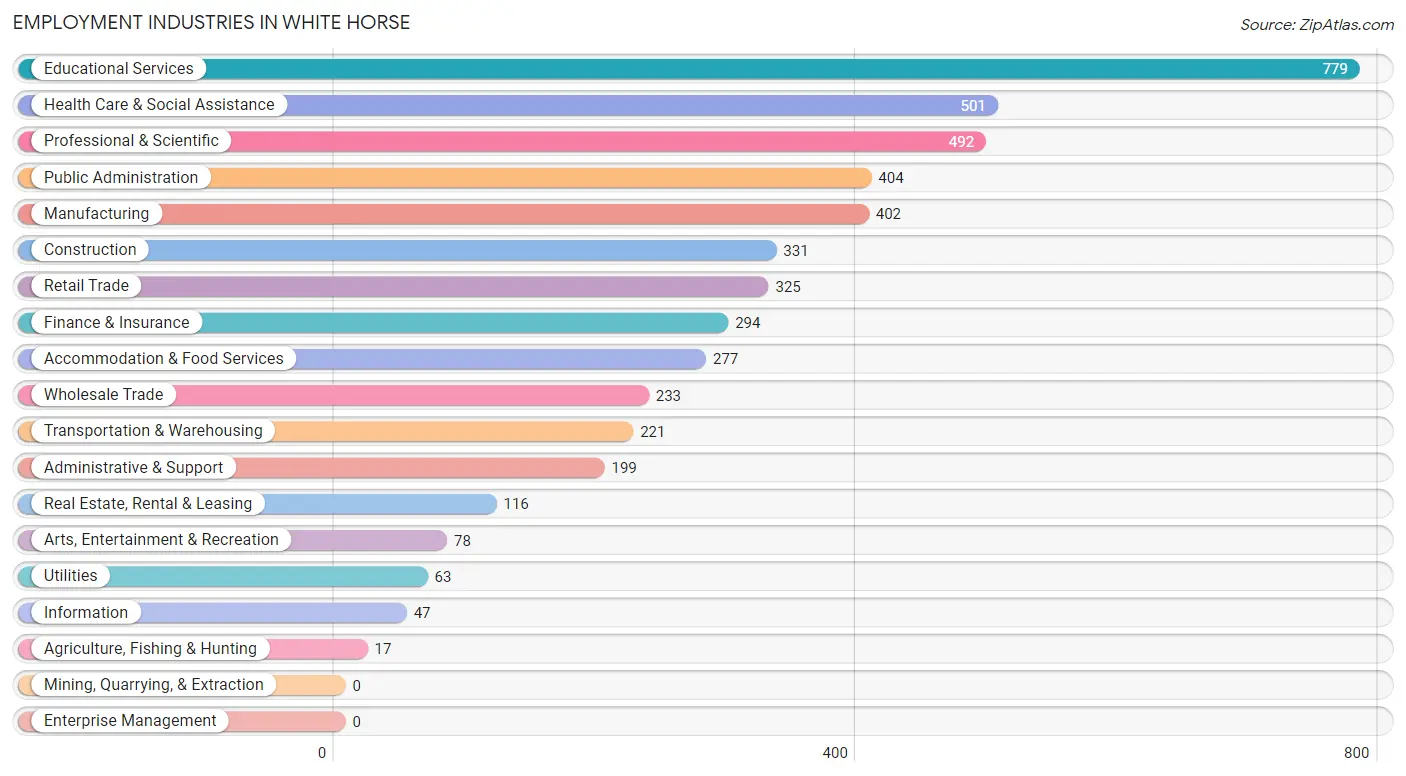
Employment Industries in White Horse
The major employment industries in White Horse include Educational Services (779 | 15.2%), Health Care & Social Assistance (501 | 9.8%), Professional & Scientific (492 | 9.6%), Public Administration (404 | 7.9%), and Manufacturing (402 | 7.9%).
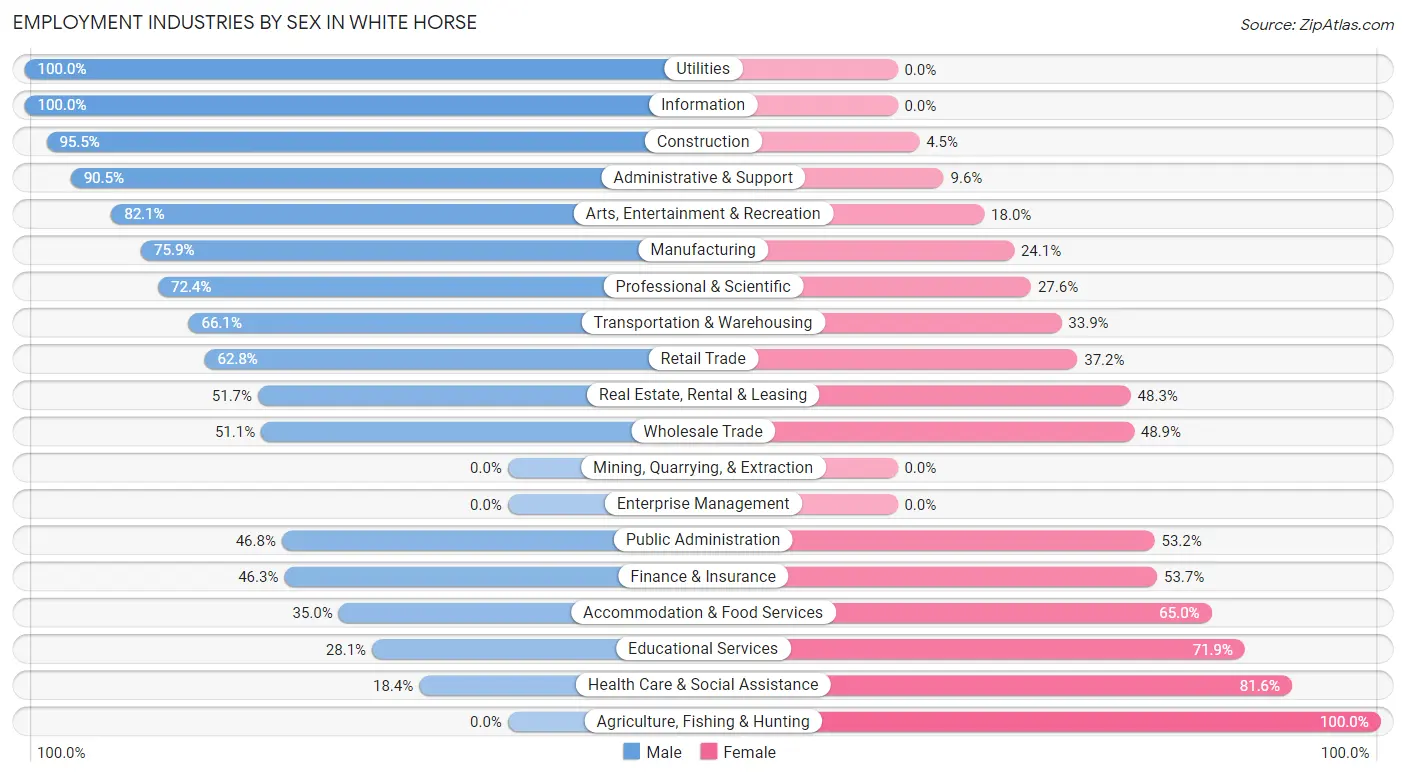
Employment Industries by Sex in White Horse
The White Horse industries that see more men than women are Utilities (100.0%), Information (100.0%), and Construction (95.5%), whereas the industries that tend to have a higher number of women are Agriculture, Fishing & Hunting (100.0%), Health Care & Social Assistance (81.6%), and Educational Services (71.9%).
| Industry | Male | Female |
| Agriculture, Fishing & Hunting | 0 (0.0%) | 17 (100.0%) |
| Mining, Quarrying, & Extraction | 0 (0.0%) | 0 (0.0%) |
| Construction | 316 (95.5%) | 15 (4.5%) |
| Manufacturing | 305 (75.9%) | 97 (24.1%) |
| Wholesale Trade | 119 (51.1%) | 114 (48.9%) |
| Retail Trade | 204 (62.8%) | 121 (37.2%) |
| Transportation & Warehousing | 146 (66.1%) | 75 (33.9%) |
| Utilities | 63 (100.0%) | 0 (0.0%) |
| Information | 47 (100.0%) | 0 (0.0%) |
| Finance & Insurance | 136 (46.3%) | 158 (53.7%) |
| Real Estate, Rental & Leasing | 60 (51.7%) | 56 (48.3%) |
| Professional & Scientific | 356 (72.4%) | 136 (27.6%) |
| Enterprise Management | 0 (0.0%) | 0 (0.0%) |
| Administrative & Support | 180 (90.4%) | 19 (9.6%) |
| Educational Services | 219 (28.1%) | 560 (71.9%) |
| Health Care & Social Assistance | 92 (18.4%) | 409 (81.6%) |
| Arts, Entertainment & Recreation | 64 (82.1%) | 14 (17.9%) |
| Accommodation & Food Services | 97 (35.0%) | 180 (65.0%) |
| Public Administration | 189 (46.8%) | 215 (53.2%) |
| Total | 2,671 (52.2%) | 2,446 (47.8%) |
Education in White Horse
School Enrollment in White Horse
The most common levels of schooling among the 2,061 students in White Horse are college / undergraduate (590 | 28.6%), high school (573 | 27.8%), and elementary school (257 | 12.5%).
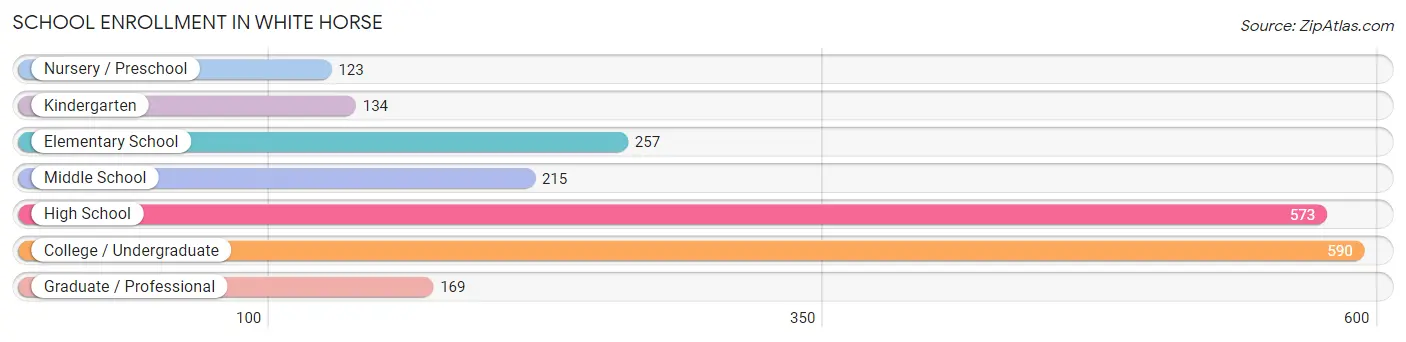
| School Level | # Students | % Students |
| Nursery / Preschool | 123 | 6.0% |
| Kindergarten | 134 | 6.5% |
| Elementary School | 257 | 12.5% |
| Middle School | 215 | 10.4% |
| High School | 573 | 27.8% |
| College / Undergraduate | 590 | 28.6% |
| Graduate / Professional | 169 | 8.2% |
| Total | 2,061 | 100.0% |
School Enrollment by Age by Funding Source in White Horse
Out of a total of 2,061 students who are enrolled in schools in White Horse, 291 (14.1%) attend a private institution, while the remaining 1,770 (85.9%) are enrolled in public schools. The age group of 25 to 34 year olds has the highest likelihood of being enrolled in private schools, with 109 (60.6% in the age bracket) enrolled. Conversely, the age group of 15 to 17 year olds has the lowest likelihood of being enrolled in a private school, with 419 (100.0% in the age bracket) attending a public institution.
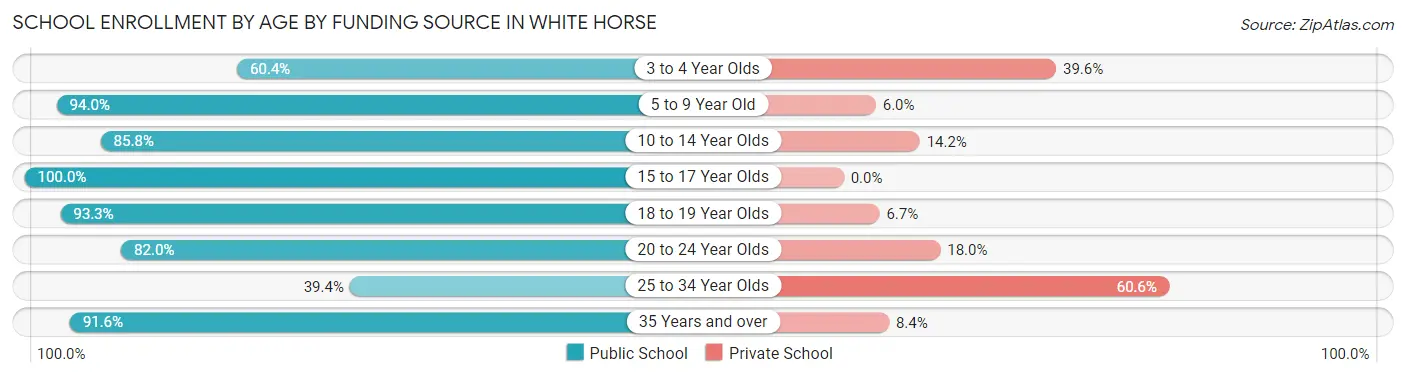
| Age Bracket | Public School | Private School |
| 3 to 4 Year Olds | 55 (60.4%) | 36 (39.6%) |
| 5 to 9 Year Old | 346 (94.0%) | 22 (6.0%) |
| 10 to 14 Year Olds | 297 (85.8%) | 49 (14.2%) |
| 15 to 17 Year Olds | 419 (100.0%) | 0 (0.0%) |
| 18 to 19 Year Olds | 224 (93.3%) | 16 (6.7%) |
| 20 to 24 Year Olds | 196 (82.0%) | 43 (18.0%) |
| 25 to 34 Year Olds | 71 (39.4%) | 109 (60.6%) |
| 35 Years and over | 163 (91.6%) | 15 (8.4%) |
| Total | 1,770 (85.9%) | 291 (14.1%) |
Educational Attainment by Field of Study in White Horse
Business (469 | 19.6%), education (323 | 13.5%), engineering (296 | 12.4%), science & technology (168 | 7.0%), and psychology (154 | 6.4%) are the most common fields of study among 2,395 individuals in White Horse who have obtained a bachelor's degree or higher.
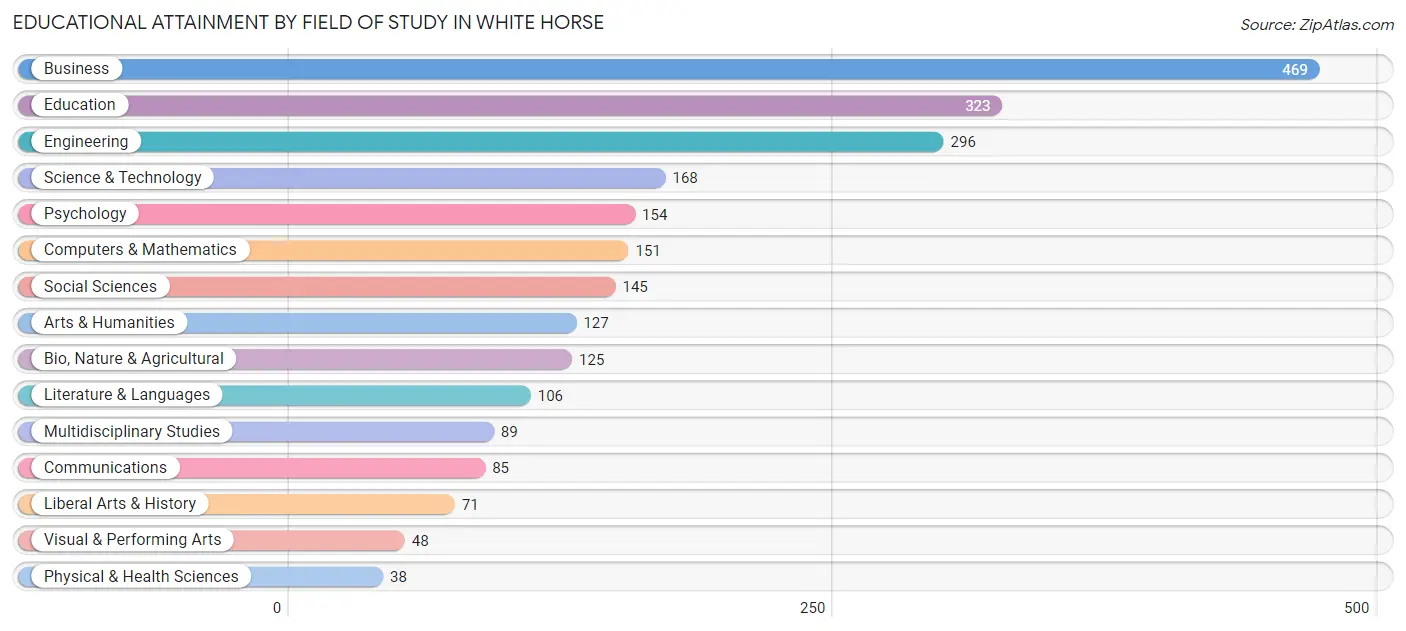
| Field of Study | # Graduates | % Graduates |
| Computers & Mathematics | 151 | 6.3% |
| Bio, Nature & Agricultural | 125 | 5.2% |
| Physical & Health Sciences | 38 | 1.6% |
| Psychology | 154 | 6.4% |
| Social Sciences | 145 | 6.0% |
| Engineering | 296 | 12.4% |
| Multidisciplinary Studies | 89 | 3.7% |
| Science & Technology | 168 | 7.0% |
| Business | 469 | 19.6% |
| Education | 323 | 13.5% |
| Literature & Languages | 106 | 4.4% |
| Liberal Arts & History | 71 | 3.0% |
| Visual & Performing Arts | 48 | 2.0% |
| Communications | 85 | 3.5% |
| Arts & Humanities | 127 | 5.3% |
| Total | 2,395 | 100.0% |
Transportation & Commute in White Horse
Vehicle Availability by Sex in White Horse
The most prevalent vehicle ownership categories in White Horse are males with 2 vehicles (1,108, accounting for 41.5%) and females with 2 vehicles (805, making up 45.9%).
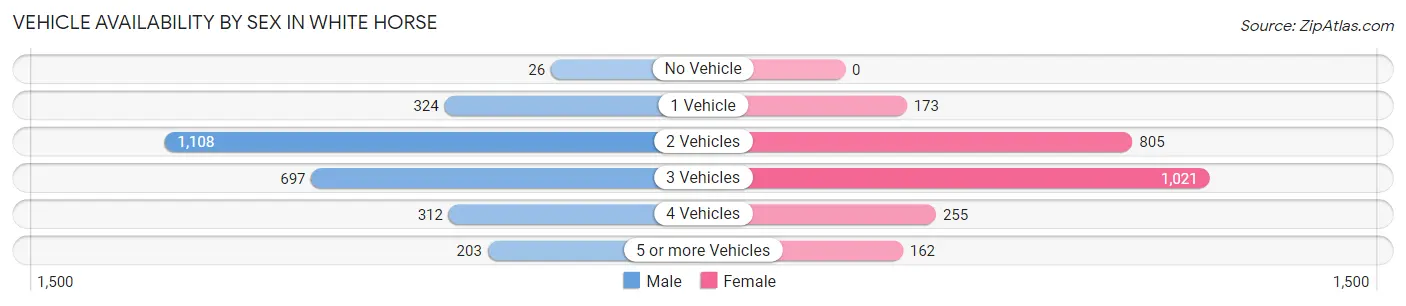
| Vehicles Available | Male | Female |
| No Vehicle | 26 (1.0%) | 0 (0.0%) |
| 1 Vehicle | 324 (12.1%) | 173 (7.2%) |
| 2 Vehicles | 1,108 (41.5%) | 805 (33.3%) |
| 3 Vehicles | 697 (26.1%) | 1,021 (42.3%) |
| 4 Vehicles | 312 (11.7%) | 255 (10.5%) |
| 5 or more Vehicles | 203 (7.6%) | 162 (6.7%) |
| Total | 2,670 (100.0%) | 2,416 (100.0%) |
Commute Time in White Horse
The most frequently occuring commute durations in White Horse are 10 to 14 minutes (885 commuters, 18.7%), 20 to 24 minutes (813 commuters, 17.2%), and 30 to 34 minutes (629 commuters, 13.3%).
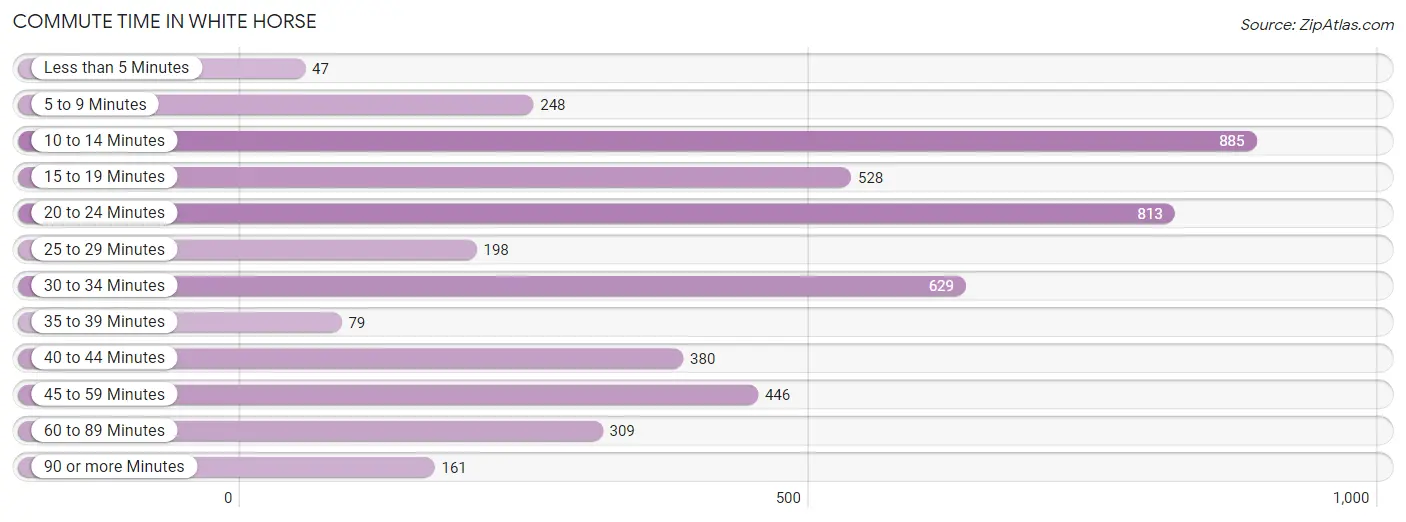
| Commute Time | # Commuters | % Commuters |
| Less than 5 Minutes | 47 | 1.0% |
| 5 to 9 Minutes | 248 | 5.2% |
| 10 to 14 Minutes | 885 | 18.7% |
| 15 to 19 Minutes | 528 | 11.2% |
| 20 to 24 Minutes | 813 | 17.2% |
| 25 to 29 Minutes | 198 | 4.2% |
| 30 to 34 Minutes | 629 | 13.3% |
| 35 to 39 Minutes | 79 | 1.7% |
| 40 to 44 Minutes | 380 | 8.1% |
| 45 to 59 Minutes | 446 | 9.4% |
| 60 to 89 Minutes | 309 | 6.5% |
| 90 or more Minutes | 161 | 3.4% |
Commute Time by Sex in White Horse
The most common commute times in White Horse are 20 to 24 minutes (455 commuters, 18.4%) for males and 10 to 14 minutes (482 commuters, 21.4%) for females.

| Commute Time | Male | Female |
| Less than 5 Minutes | 47 (1.9%) | 0 (0.0%) |
| 5 to 9 Minutes | 103 (4.2%) | 145 (6.4%) |
| 10 to 14 Minutes | 403 (16.3%) | 482 (21.4%) |
| 15 to 19 Minutes | 276 (11.2%) | 252 (11.2%) |
| 20 to 24 Minutes | 455 (18.4%) | 358 (15.9%) |
| 25 to 29 Minutes | 59 (2.4%) | 139 (6.2%) |
| 30 to 34 Minutes | 258 (10.4%) | 371 (16.5%) |
| 35 to 39 Minutes | 79 (3.2%) | 0 (0.0%) |
| 40 to 44 Minutes | 153 (6.2%) | 227 (10.1%) |
| 45 to 59 Minutes | 382 (15.5%) | 64 (2.8%) |
| 60 to 89 Minutes | 148 (6.0%) | 161 (7.1%) |
| 90 or more Minutes | 108 (4.4%) | 53 (2.4%) |
Time of Departure to Work by Sex in White Horse
The most frequent times of departure to work in White Horse are 7:30 AM to 7:59 AM (441, 17.8%) for males and 7:30 AM to 7:59 AM (545, 24.2%) for females.
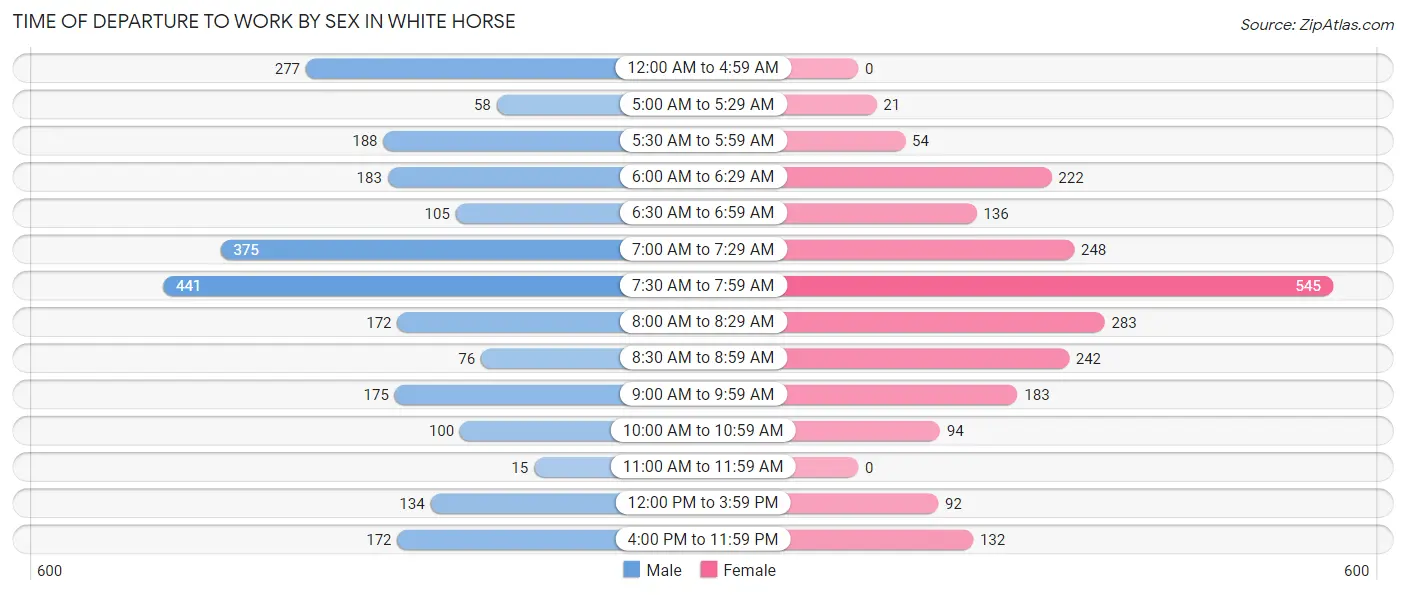
| Time of Departure | Male | Female |
| 12:00 AM to 4:59 AM | 277 (11.2%) | 0 (0.0%) |
| 5:00 AM to 5:29 AM | 58 (2.4%) | 21 (0.9%) |
| 5:30 AM to 5:59 AM | 188 (7.6%) | 54 (2.4%) |
| 6:00 AM to 6:29 AM | 183 (7.4%) | 222 (9.9%) |
| 6:30 AM to 6:59 AM | 105 (4.3%) | 136 (6.0%) |
| 7:00 AM to 7:29 AM | 375 (15.2%) | 248 (11.0%) |
| 7:30 AM to 7:59 AM | 441 (17.8%) | 545 (24.2%) |
| 8:00 AM to 8:29 AM | 172 (7.0%) | 283 (12.6%) |
| 8:30 AM to 8:59 AM | 76 (3.1%) | 242 (10.7%) |
| 9:00 AM to 9:59 AM | 175 (7.1%) | 183 (8.1%) |
| 10:00 AM to 10:59 AM | 100 (4.1%) | 94 (4.2%) |
| 11:00 AM to 11:59 AM | 15 (0.6%) | 0 (0.0%) |
| 12:00 PM to 3:59 PM | 134 (5.4%) | 92 (4.1%) |
| 4:00 PM to 11:59 PM | 172 (7.0%) | 132 (5.9%) |
| Total | 2,471 (100.0%) | 2,252 (100.0%) |
Housing Occupancy in White Horse
Occupancy by Ownership in White Horse
Of the total 3,857 dwellings in White Horse, owner-occupied units account for 3,234 (83.9%), while renter-occupied units make up 623 (16.2%).
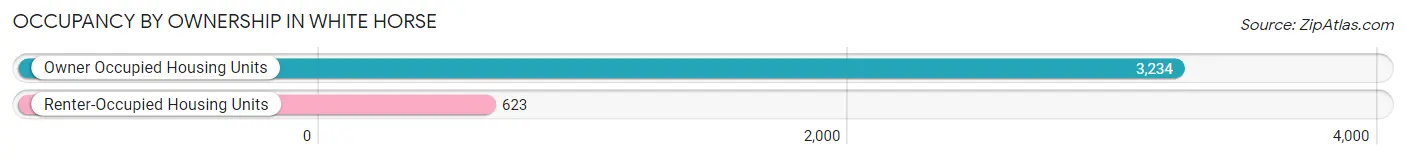
| Occupancy | # Housing Units | % Housing Units |
| Owner Occupied Housing Units | 3,234 | 83.9% |
| Renter-Occupied Housing Units | 623 | 16.2% |
| Total Occupied Housing Units | 3,857 | 100.0% |
Occupancy by Household Size in White Horse
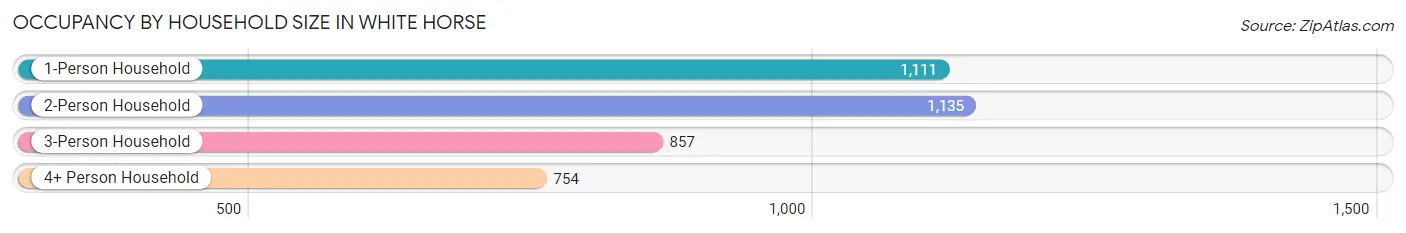
| Household Size | # Housing Units | % Housing Units |
| 1-Person Household | 1,111 | 28.8% |
| 2-Person Household | 1,135 | 29.4% |
| 3-Person Household | 857 | 22.2% |
| 4+ Person Household | 754 | 19.6% |
| Total Housing Units | 3,857 | 100.0% |
Occupancy by Ownership by Household Size in White Horse
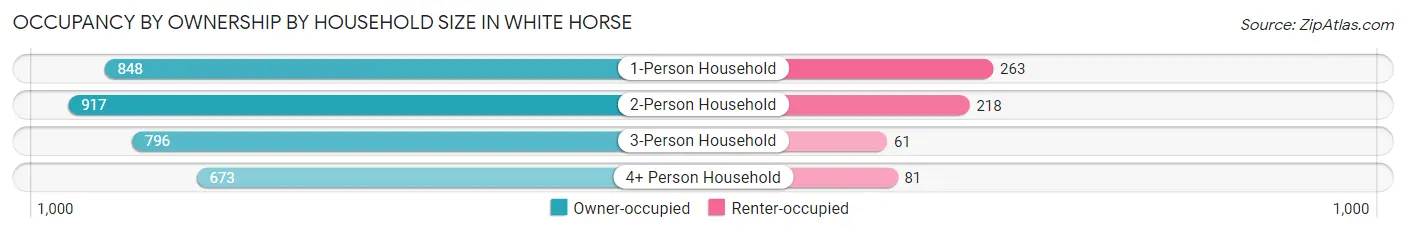
| Household Size | Owner-occupied | Renter-occupied |
| 1-Person Household | 848 (76.3%) | 263 (23.7%) |
| 2-Person Household | 917 (80.8%) | 218 (19.2%) |
| 3-Person Household | 796 (92.9%) | 61 (7.1%) |
| 4+ Person Household | 673 (89.3%) | 81 (10.7%) |
| Total Housing Units | 3,234 (83.9%) | 623 (16.2%) |
Occupancy by Educational Attainment in White Horse
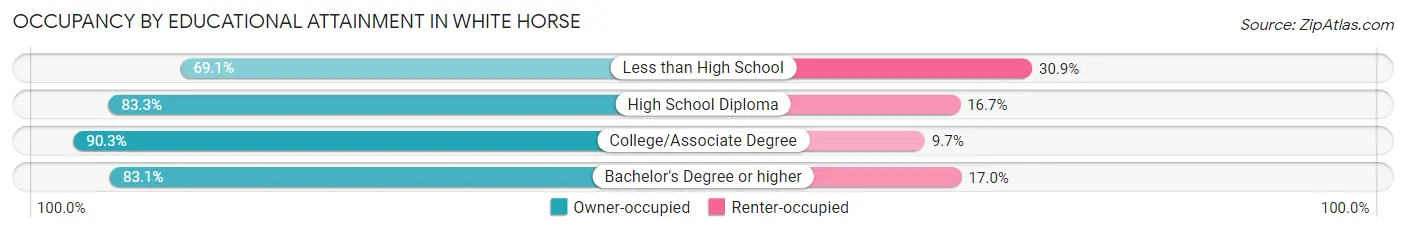
| Household Size | Owner-occupied | Renter-occupied |
| Less than High School | 152 (69.1%) | 68 (30.9%) |
| High School Diploma | 1,185 (83.3%) | 237 (16.7%) |
| College/Associate Degree | 711 (90.3%) | 76 (9.7%) |
| Bachelor's Degree or higher | 1,186 (83.1%) | 242 (17.0%) |
Occupancy by Age of Householder in White Horse
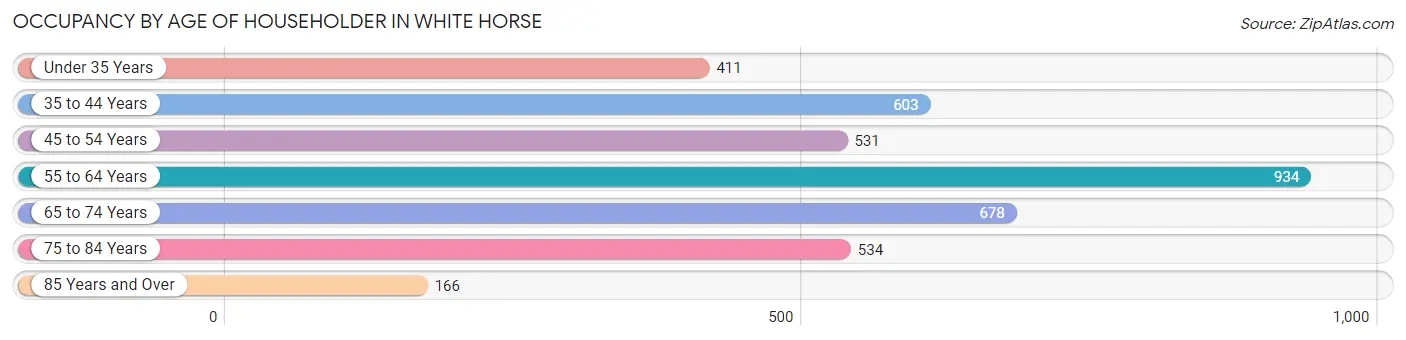
| Age Bracket | # Households | % Households |
| Under 35 Years | 411 | 10.7% |
| 35 to 44 Years | 603 | 15.6% |
| 45 to 54 Years | 531 | 13.8% |
| 55 to 64 Years | 934 | 24.2% |
| 65 to 74 Years | 678 | 17.6% |
| 75 to 84 Years | 534 | 13.8% |
| 85 Years and Over | 166 | 4.3% |
| Total | 3,857 | 100.0% |
Housing Finances in White Horse
Median Income by Occupancy in White Horse
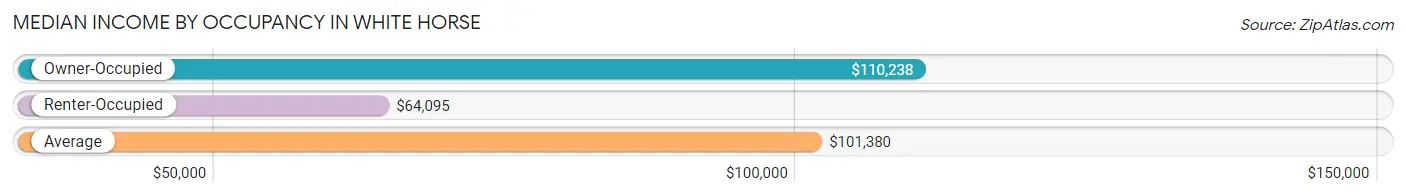
| Occupancy Type | # Households | Median Income |
| Owner-Occupied | 3,234 (83.9%) | $110,238 |
| Renter-Occupied | 623 (16.2%) | $64,095 |
| Average | 3,857 (100.0%) | $101,380 |
Occupancy by Householder Income Bracket in White Horse
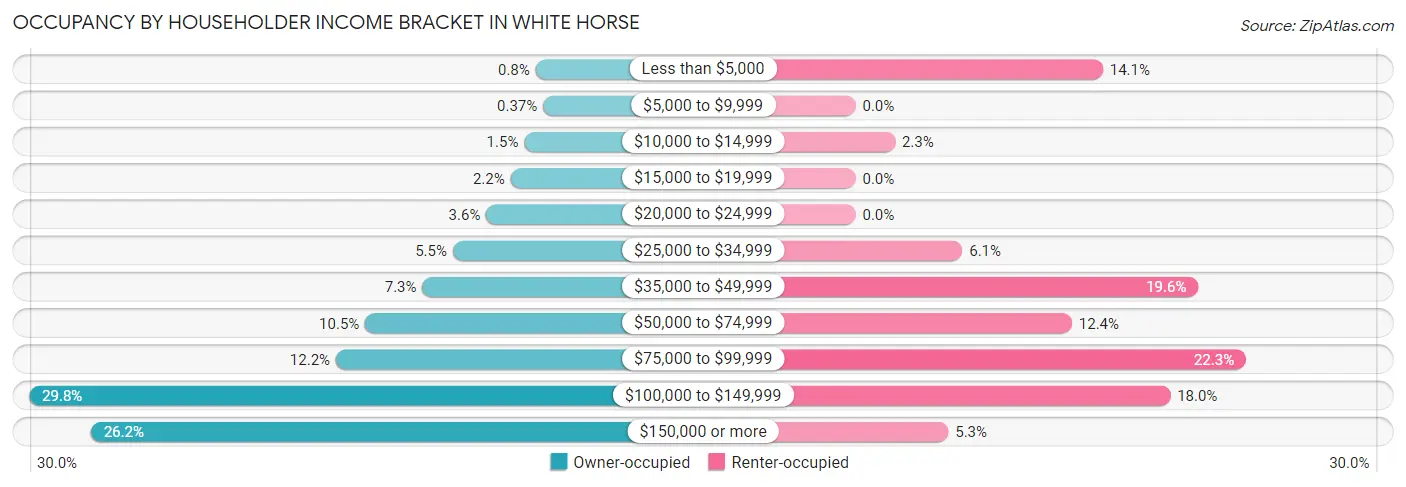
| Income Bracket | Owner-occupied | Renter-occupied |
| Less than $5,000 | 26 (0.8%) | 88 (14.1%) |
| $5,000 to $9,999 | 12 (0.4%) | 0 (0.0%) |
| $10,000 to $14,999 | 47 (1.5%) | 14 (2.2%) |
| $15,000 to $19,999 | 72 (2.2%) | 0 (0.0%) |
| $20,000 to $24,999 | 117 (3.6%) | 0 (0.0%) |
| $25,000 to $34,999 | 179 (5.5%) | 38 (6.1%) |
| $35,000 to $49,999 | 235 (7.3%) | 122 (19.6%) |
| $50,000 to $74,999 | 341 (10.5%) | 77 (12.4%) |
| $75,000 to $99,999 | 395 (12.2%) | 139 (22.3%) |
| $100,000 to $149,999 | 962 (29.7%) | 112 (18.0%) |
| $150,000 or more | 848 (26.2%) | 33 (5.3%) |
| Total | 3,234 (100.0%) | 623 (100.0%) |
Monthly Housing Cost Tiers in White Horse
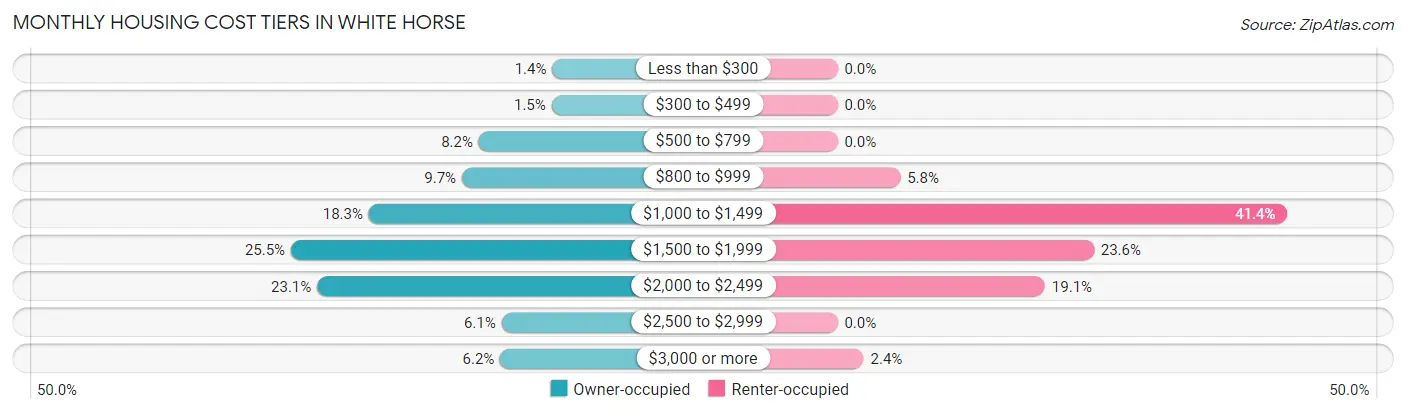
| Monthly Cost | Owner-occupied | Renter-occupied |
| Less than $300 | 46 (1.4%) | 0 (0.0%) |
| $300 to $499 | 48 (1.5%) | 0 (0.0%) |
| $500 to $799 | 265 (8.2%) | 0 (0.0%) |
| $800 to $999 | 315 (9.7%) | 36 (5.8%) |
| $1,000 to $1,499 | 592 (18.3%) | 258 (41.4%) |
| $1,500 to $1,999 | 824 (25.5%) | 147 (23.6%) |
| $2,000 to $2,499 | 746 (23.1%) | 119 (19.1%) |
| $2,500 to $2,999 | 197 (6.1%) | 0 (0.0%) |
| $3,000 or more | 201 (6.2%) | 15 (2.4%) |
| Total | 3,234 (100.0%) | 623 (100.0%) |
Physical Housing Characteristics in White Horse
Housing Structures in White Horse
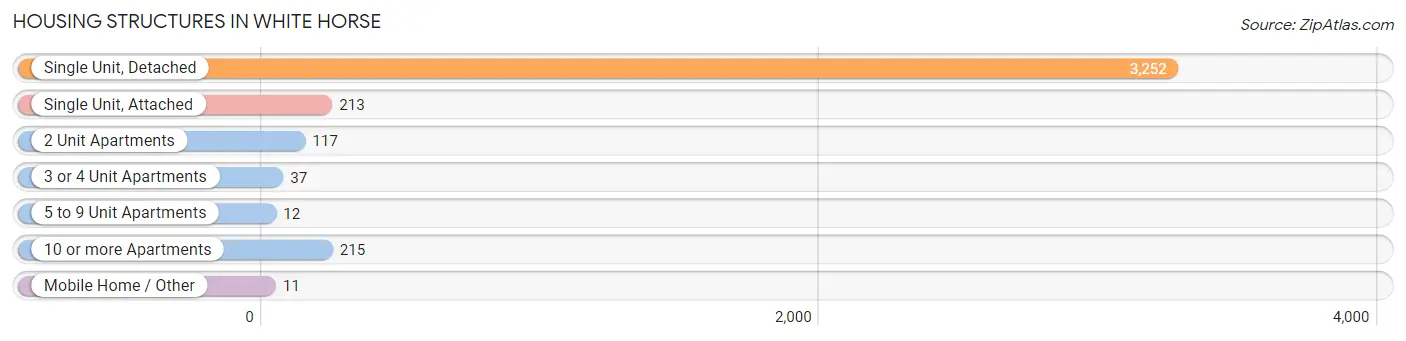
| Structure Type | # Housing Units | % Housing Units |
| Single Unit, Detached | 3,252 | 84.3% |
| Single Unit, Attached | 213 | 5.5% |
| 2 Unit Apartments | 117 | 3.0% |
| 3 or 4 Unit Apartments | 37 | 1.0% |
| 5 to 9 Unit Apartments | 12 | 0.3% |
| 10 or more Apartments | 215 | 5.6% |
| Mobile Home / Other | 11 | 0.3% |
| Total | 3,857 | 100.0% |
Housing Structures by Occupancy in White Horse
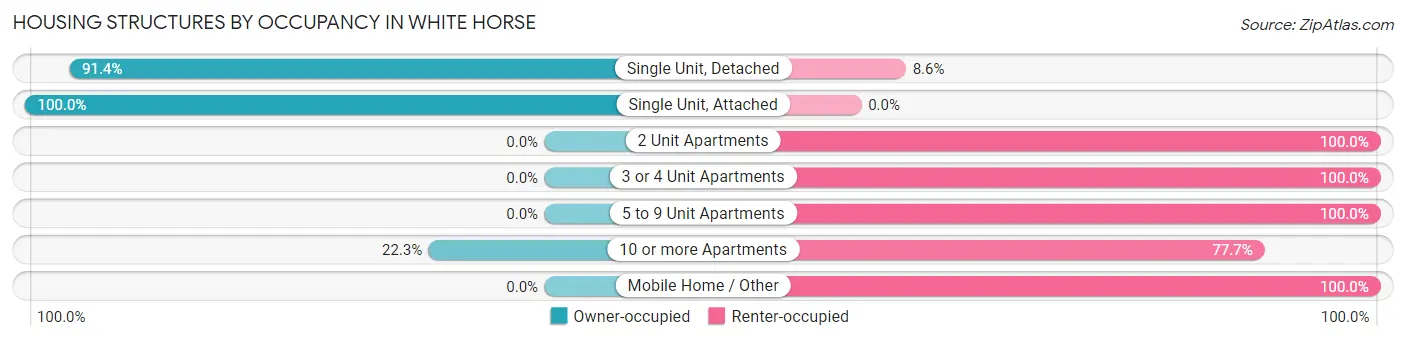
| Structure Type | Owner-occupied | Renter-occupied |
| Single Unit, Detached | 2,973 (91.4%) | 279 (8.6%) |
| Single Unit, Attached | 213 (100.0%) | 0 (0.0%) |
| 2 Unit Apartments | 0 (0.0%) | 117 (100.0%) |
| 3 or 4 Unit Apartments | 0 (0.0%) | 37 (100.0%) |
| 5 to 9 Unit Apartments | 0 (0.0%) | 12 (100.0%) |
| 10 or more Apartments | 48 (22.3%) | 167 (77.7%) |
| Mobile Home / Other | 0 (0.0%) | 11 (100.0%) |
| Total | 3,234 (83.9%) | 623 (16.2%) |
Housing Structures by Number of Rooms in White Horse
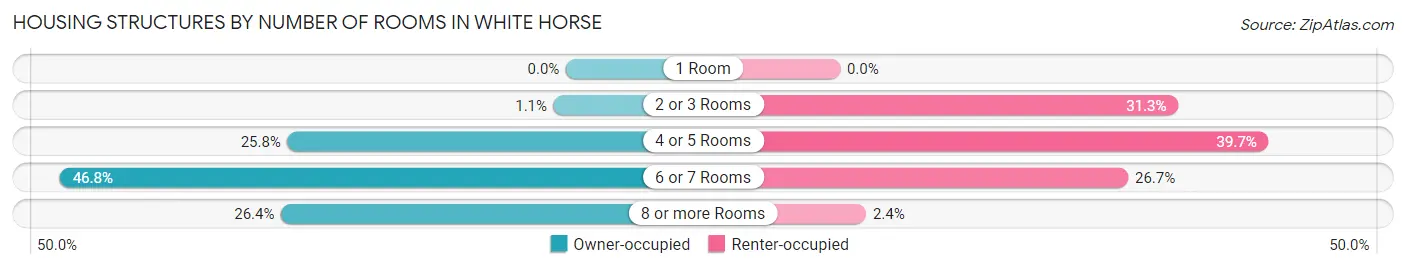
| Number of Rooms | Owner-occupied | Renter-occupied |
| 1 Room | 0 (0.0%) | 0 (0.0%) |
| 2 or 3 Rooms | 37 (1.1%) | 195 (31.3%) |
| 4 or 5 Rooms | 833 (25.8%) | 247 (39.7%) |
| 6 or 7 Rooms | 1,512 (46.8%) | 166 (26.7%) |
| 8 or more Rooms | 852 (26.4%) | 15 (2.4%) |
| Total | 3,234 (100.0%) | 623 (100.0%) |
Housing Structure by Heating Type in White Horse
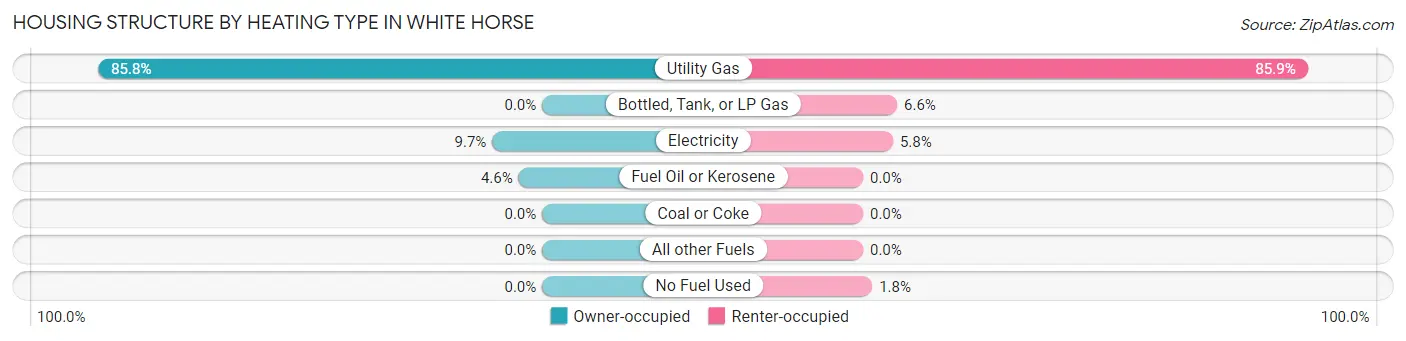
| Heating Type | Owner-occupied | Renter-occupied |
| Utility Gas | 2,775 (85.8%) | 535 (85.9%) |
| Bottled, Tank, or LP Gas | 0 (0.0%) | 41 (6.6%) |
| Electricity | 312 (9.7%) | 36 (5.8%) |
| Fuel Oil or Kerosene | 147 (4.5%) | 0 (0.0%) |
| Coal or Coke | 0 (0.0%) | 0 (0.0%) |
| All other Fuels | 0 (0.0%) | 0 (0.0%) |
| No Fuel Used | 0 (0.0%) | 11 (1.8%) |
| Total | 3,234 (100.0%) | 623 (100.0%) |
Household Vehicle Usage in White Horse
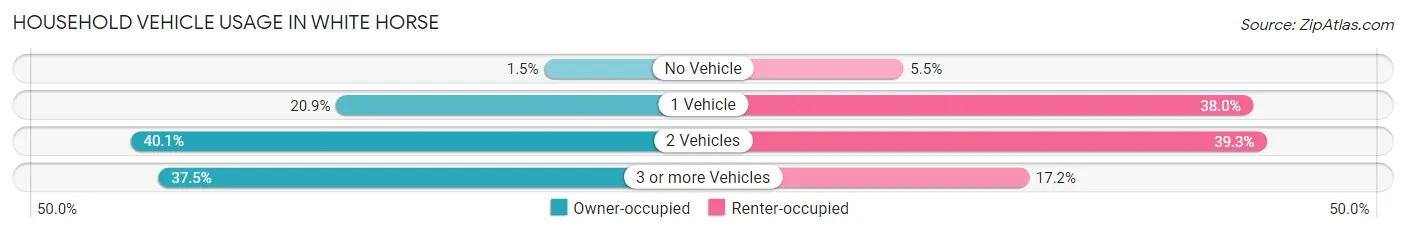
| Vehicles per Household | Owner-occupied | Renter-occupied |
| No Vehicle | 48 (1.5%) | 34 (5.5%) |
| 1 Vehicle | 676 (20.9%) | 237 (38.0%) |
| 2 Vehicles | 1,297 (40.1%) | 245 (39.3%) |
| 3 or more Vehicles | 1,213 (37.5%) | 107 (17.2%) |
| Total | 3,234 (100.0%) | 623 (100.0%) |
Real Estate & Mortgages in White Horse
Real Estate and Mortgage Overview in White Horse
| Characteristic | Without Mortgage | With Mortgage |
| Housing Units | 1,140 | 2,094 |
| Median Property Value | $258,600 | $268,700 |
| Median Household Income | $73,071 | $649 |
| Monthly Housing Costs | $950 | $201 |
| Real Estate Taxes | $6,528 | $40 |
Property Value by Mortgage Status in White Horse
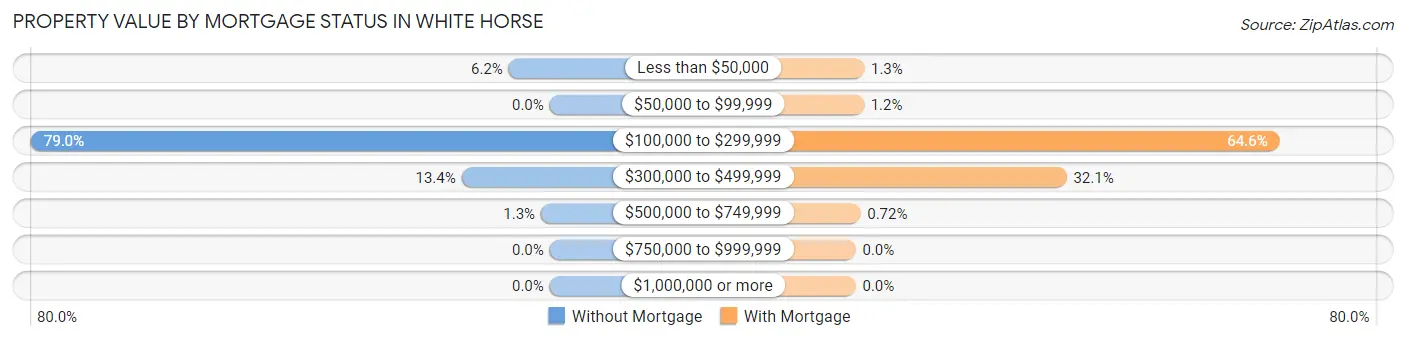
| Property Value | Without Mortgage | With Mortgage |
| Less than $50,000 | 71 (6.2%) | 27 (1.3%) |
| $50,000 to $99,999 | 0 (0.0%) | 26 (1.2%) |
| $100,000 to $299,999 | 901 (79.0%) | 1,353 (64.6%) |
| $300,000 to $499,999 | 153 (13.4%) | 673 (32.1%) |
| $500,000 to $749,999 | 15 (1.3%) | 15 (0.7%) |
| $750,000 to $999,999 | 0 (0.0%) | 0 (0.0%) |
| $1,000,000 or more | 0 (0.0%) | 0 (0.0%) |
| Total | 1,140 (100.0%) | 2,094 (100.0%) |
Household Income by Mortgage Status in White Horse
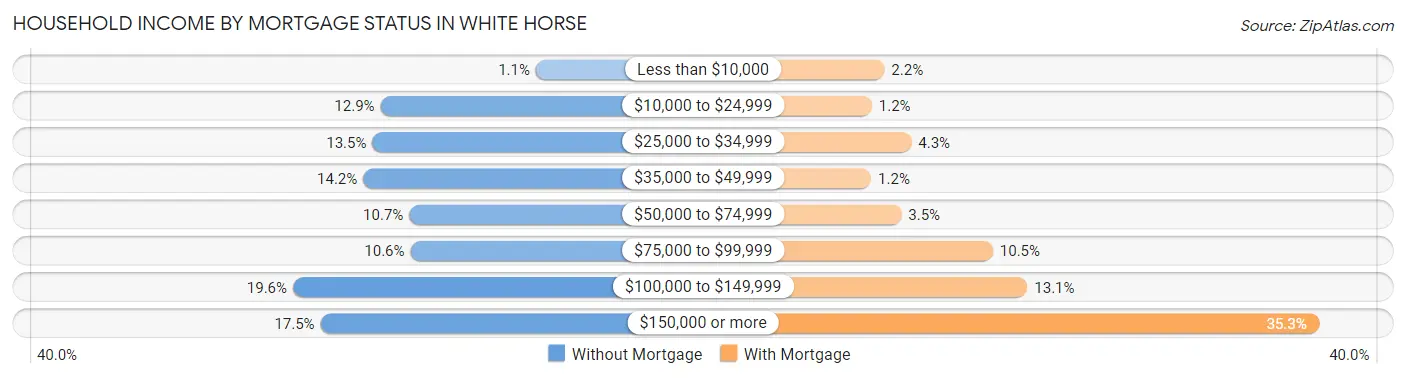
| Household Income | Without Mortgage | With Mortgage |
| Less than $10,000 | 12 (1.1%) | 46 (2.2%) |
| $10,000 to $24,999 | 147 (12.9%) | 26 (1.2%) |
| $25,000 to $34,999 | 154 (13.5%) | 89 (4.3%) |
| $35,000 to $49,999 | 162 (14.2%) | 25 (1.2%) |
| $50,000 to $74,999 | 122 (10.7%) | 73 (3.5%) |
| $75,000 to $99,999 | 121 (10.6%) | 219 (10.5%) |
| $100,000 to $149,999 | 223 (19.6%) | 274 (13.1%) |
| $150,000 or more | 199 (17.5%) | 739 (35.3%) |
| Total | 1,140 (100.0%) | 2,094 (100.0%) |
Property Value to Household Income Ratio in White Horse
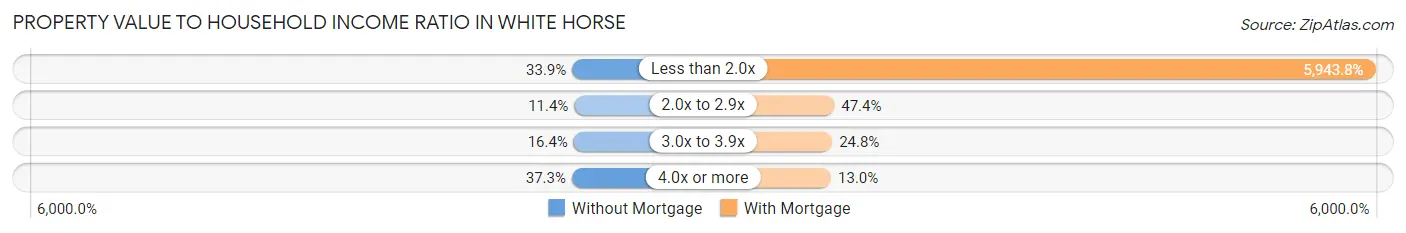
| Value-to-Income Ratio | Without Mortgage | With Mortgage |
| Less than 2.0x | 386 (33.9%) | 124,464 (5,943.8%) |
| 2.0x to 2.9x | 130 (11.4%) | 993 (47.4%) |
| 3.0x to 3.9x | 187 (16.4%) | 519 (24.8%) |
| 4.0x or more | 425 (37.3%) | 272 (13.0%) |
| Total | 1,140 (100.0%) | 2,094 (100.0%) |
Real Estate Taxes by Mortgage Status in White Horse
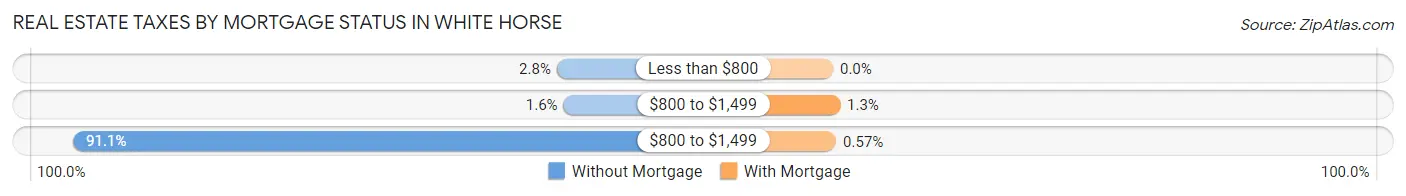
| Property Taxes | Without Mortgage | With Mortgage |
| Less than $800 | 32 (2.8%) | 0 (0.0%) |
| $800 to $1,499 | 18 (1.6%) | 27 (1.3%) |
| $800 to $1,499 | 1,039 (91.1%) | 12 (0.6%) |
| Total | 1,140 (100.0%) | 2,094 (100.0%) |
Health & Disability in White Horse
Health Insurance Coverage by Age in White Horse
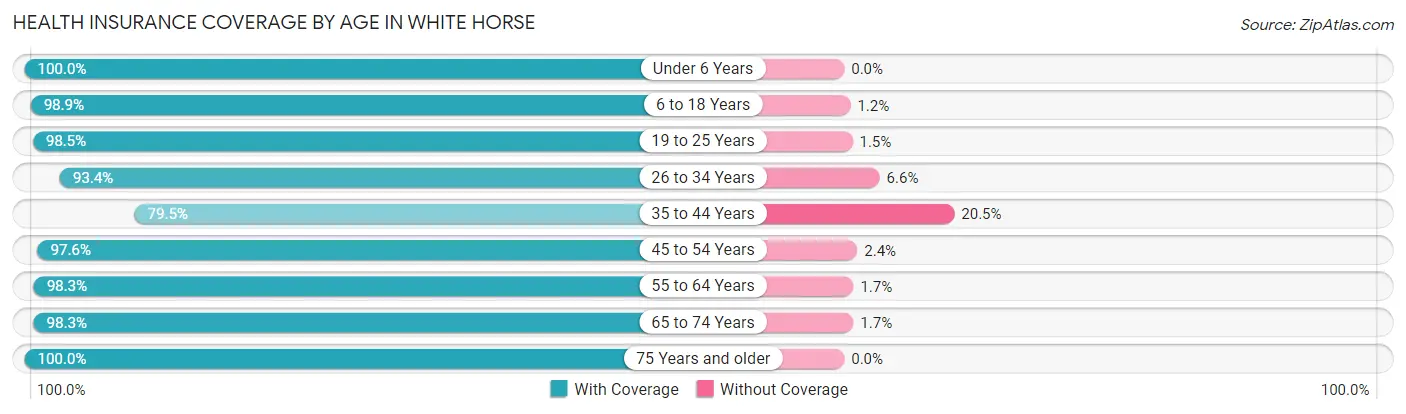
| Age Bracket | With Coverage | Without Coverage |
| Under 6 Years | 480 (100.0%) | 0 (0.0%) |
| 6 to 18 Years | 1,204 (98.9%) | 14 (1.1%) |
| 19 to 25 Years | 709 (98.5%) | 11 (1.5%) |
| 26 to 34 Years | 1,077 (93.4%) | 76 (6.6%) |
| 35 to 44 Years | 1,076 (79.5%) | 278 (20.5%) |
| 45 to 54 Years | 964 (97.6%) | 24 (2.4%) |
| 55 to 64 Years | 1,496 (98.3%) | 26 (1.7%) |
| 65 to 74 Years | 1,216 (98.3%) | 21 (1.7%) |
| 75 Years and older | 1,020 (100.0%) | 0 (0.0%) |
| Total | 9,242 (95.4%) | 450 (4.6%) |
Health Insurance Coverage by Citizenship Status in White Horse
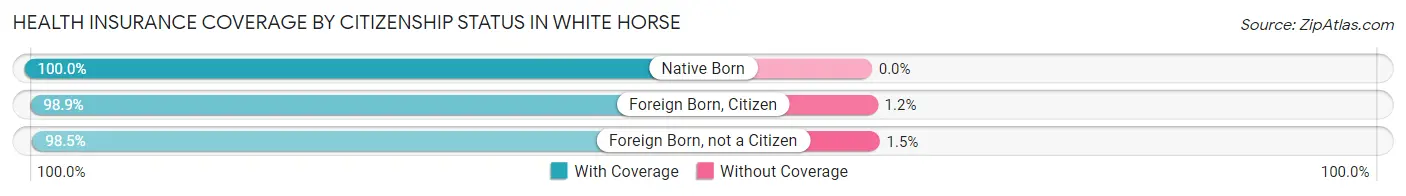
| Citizenship Status | With Coverage | Without Coverage |
| Native Born | 480 (100.0%) | 0 (0.0%) |
| Foreign Born, Citizen | 1,204 (98.9%) | 14 (1.1%) |
| Foreign Born, not a Citizen | 709 (98.5%) | 11 (1.5%) |
Health Insurance Coverage by Household Income in White Horse
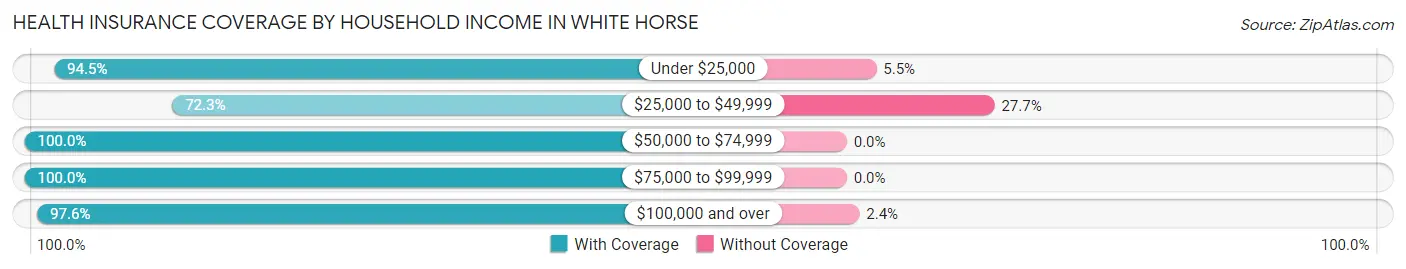
| Household Income | With Coverage | Without Coverage |
| Under $25,000 | 426 (94.5%) | 25 (5.5%) |
| $25,000 to $49,999 | 753 (72.3%) | 288 (27.7%) |
| $50,000 to $74,999 | 1,025 (100.0%) | 0 (0.0%) |
| $75,000 to $99,999 | 1,407 (100.0%) | 0 (0.0%) |
| $100,000 and over | 5,627 (97.6%) | 136 (2.4%) |
Public vs Private Health Insurance Coverage by Age in White Horse
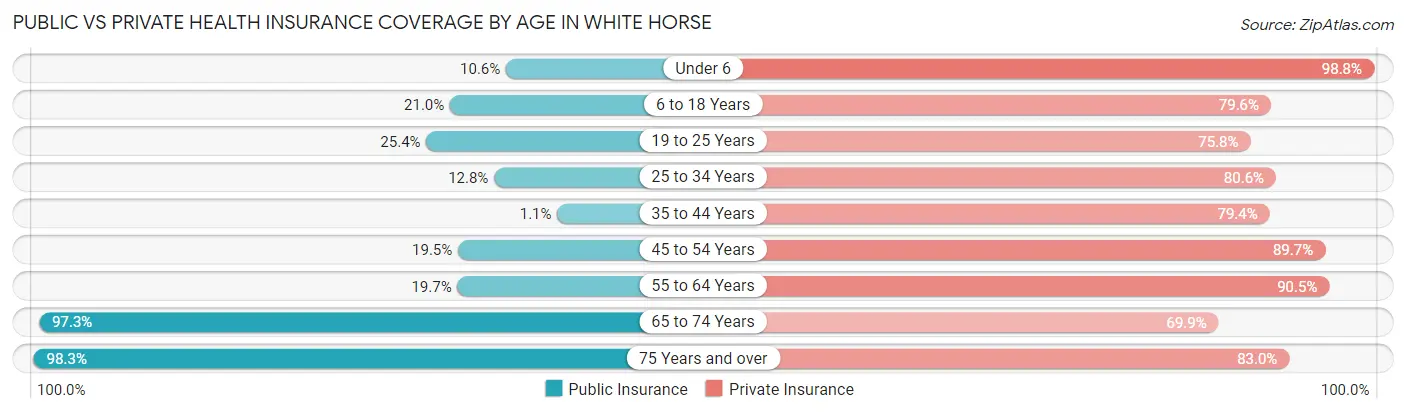
| Age Bracket | Public Insurance | Private Insurance |
| Under 6 | 51 (10.6%) | 474 (98.8%) |
| 6 to 18 Years | 256 (21.0%) | 970 (79.6%) |
| 19 to 25 Years | 183 (25.4%) | 546 (75.8%) |
| 25 to 34 Years | 148 (12.8%) | 929 (80.6%) |
| 35 to 44 Years | 15 (1.1%) | 1,075 (79.4%) |
| 45 to 54 Years | 193 (19.5%) | 886 (89.7%) |
| 55 to 64 Years | 299 (19.7%) | 1,377 (90.5%) |
| 65 to 74 Years | 1,204 (97.3%) | 865 (69.9%) |
| 75 Years and over | 1,003 (98.3%) | 847 (83.0%) |
| Total | 3,352 (34.6%) | 7,969 (82.2%) |
Disability Status by Sex by Age in White Horse
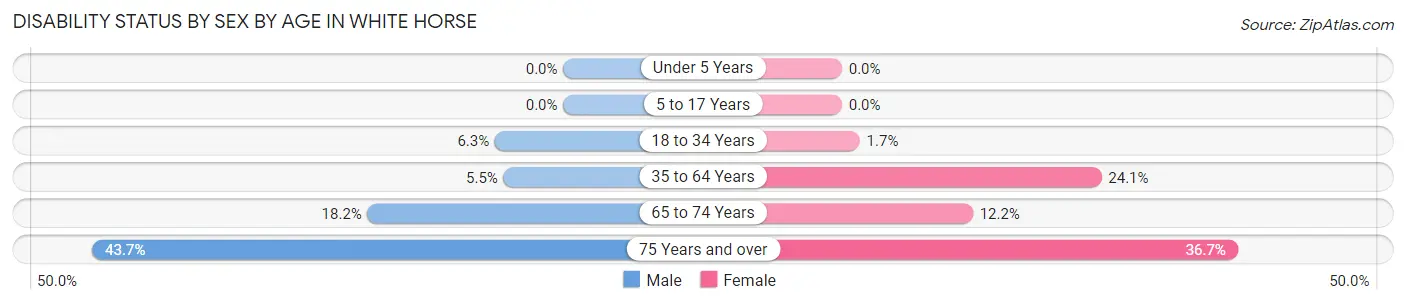
| Age Bracket | Male | Female |
| Under 5 Years | 0 (0.0%) | 0 (0.0%) |
| 5 to 17 Years | 0 (0.0%) | 0 (0.0%) |
| 18 to 34 Years | 55 (6.3%) | 20 (1.7%) |
| 35 to 64 Years | 112 (5.5%) | 444 (24.1%) |
| 65 to 74 Years | 126 (18.2%) | 66 (12.1%) |
| 75 Years and over | 164 (43.7%) | 237 (36.7%) |
Disability Class by Sex by Age in White Horse
Disability Class: Hearing Difficulty
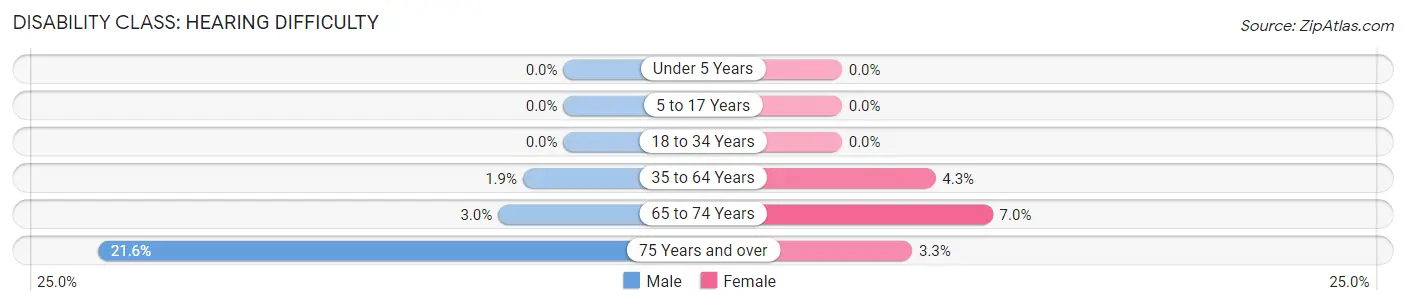
| Age Bracket | Male | Female |
| Under 5 Years | 0 (0.0%) | 0 (0.0%) |
| 5 to 17 Years | 0 (0.0%) | 0 (0.0%) |
| 18 to 34 Years | 0 (0.0%) | 0 (0.0%) |
| 35 to 64 Years | 38 (1.9%) | 80 (4.3%) |
| 65 to 74 Years | 21 (3.0%) | 38 (7.0%) |
| 75 Years and over | 81 (21.6%) | 21 (3.3%) |
Disability Class: Vision Difficulty
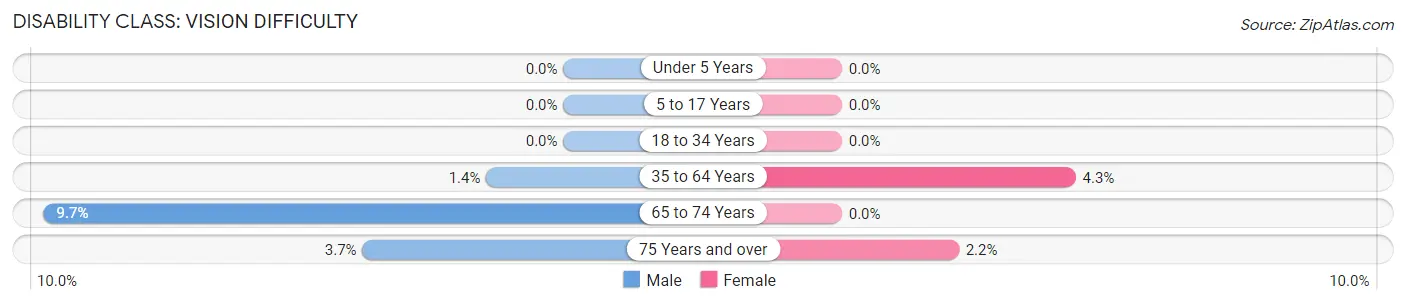
| Age Bracket | Male | Female |
| Under 5 Years | 0 (0.0%) | 0 (0.0%) |
| 5 to 17 Years | 0 (0.0%) | 0 (0.0%) |
| 18 to 34 Years | 0 (0.0%) | 0 (0.0%) |
| 35 to 64 Years | 29 (1.4%) | 80 (4.3%) |
| 65 to 74 Years | 67 (9.7%) | 0 (0.0%) |
| 75 Years and over | 14 (3.7%) | 14 (2.2%) |
Disability Class: Cognitive Difficulty
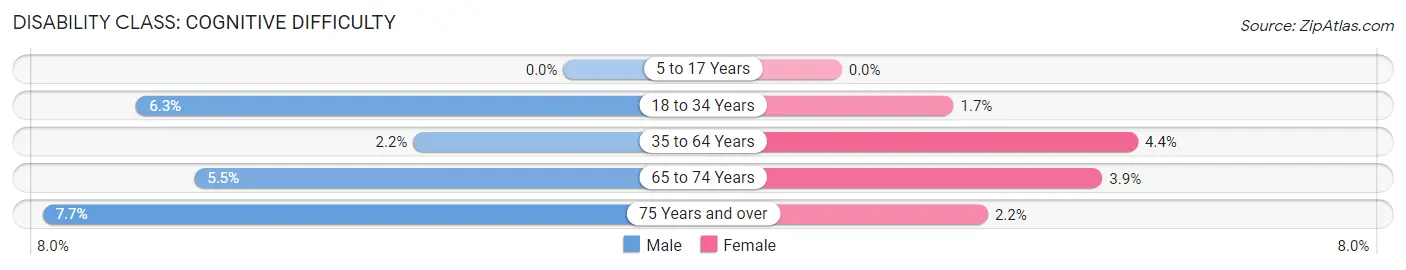
| Age Bracket | Male | Female |
| 5 to 17 Years | 0 (0.0%) | 0 (0.0%) |
| 18 to 34 Years | 55 (6.3%) | 20 (1.7%) |
| 35 to 64 Years | 45 (2.2%) | 81 (4.4%) |
| 65 to 74 Years | 38 (5.5%) | 21 (3.9%) |
| 75 Years and over | 29 (7.7%) | 14 (2.2%) |
Disability Class: Ambulatory Difficulty
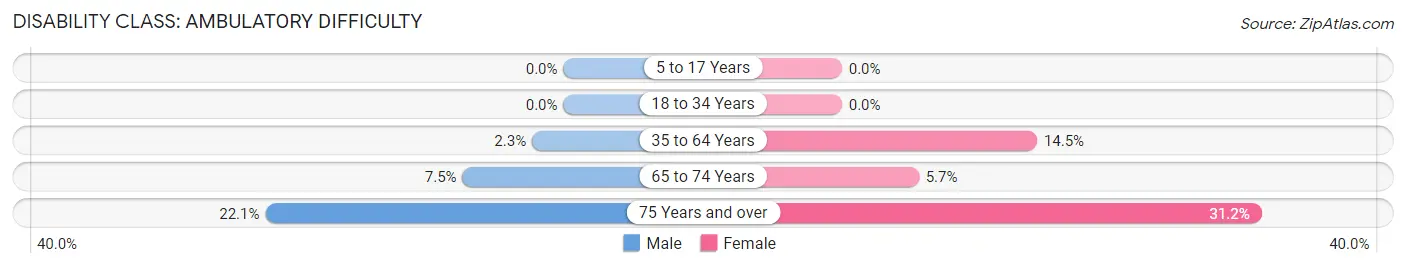
| Age Bracket | Male | Female |
| 5 to 17 Years | 0 (0.0%) | 0 (0.0%) |
| 18 to 34 Years | 0 (0.0%) | 0 (0.0%) |
| 35 to 64 Years | 47 (2.3%) | 267 (14.5%) |
| 65 to 74 Years | 52 (7.5%) | 31 (5.7%) |
| 75 Years and over | 83 (22.1%) | 201 (31.2%) |
Disability Class: Self-Care Difficulty
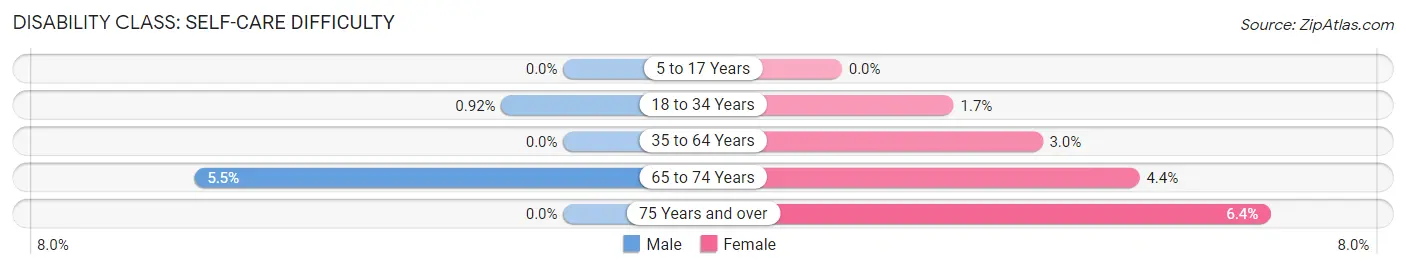
| Age Bracket | Male | Female |
| 5 to 17 Years | 0 (0.0%) | 0 (0.0%) |
| 18 to 34 Years | 8 (0.9%) | 20 (1.7%) |
| 35 to 64 Years | 0 (0.0%) | 55 (3.0%) |
| 65 to 74 Years | 38 (5.5%) | 24 (4.4%) |
| 75 Years and over | 0 (0.0%) | 41 (6.4%) |
Technology Access in White Horse
Computing Device Access in White Horse
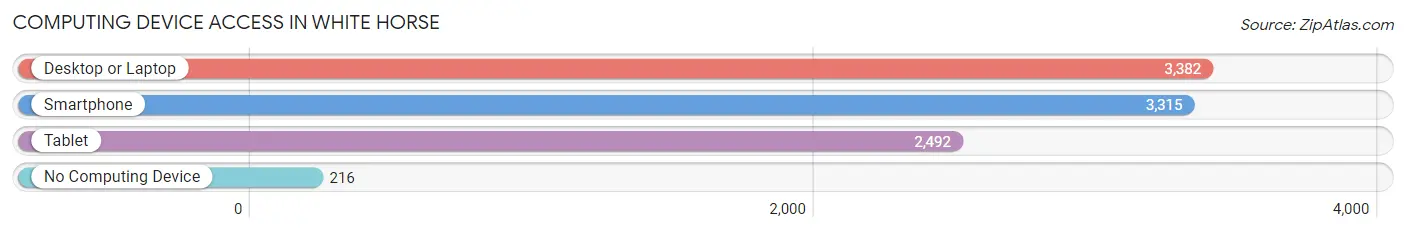
| Device Type | # Households | % Households |
| Desktop or Laptop | 3,382 | 87.7% |
| Smartphone | 3,315 | 86.0% |
| Tablet | 2,492 | 64.6% |
| No Computing Device | 216 | 5.6% |
| Total | 3,857 | 100.0% |
Internet Access in White Horse
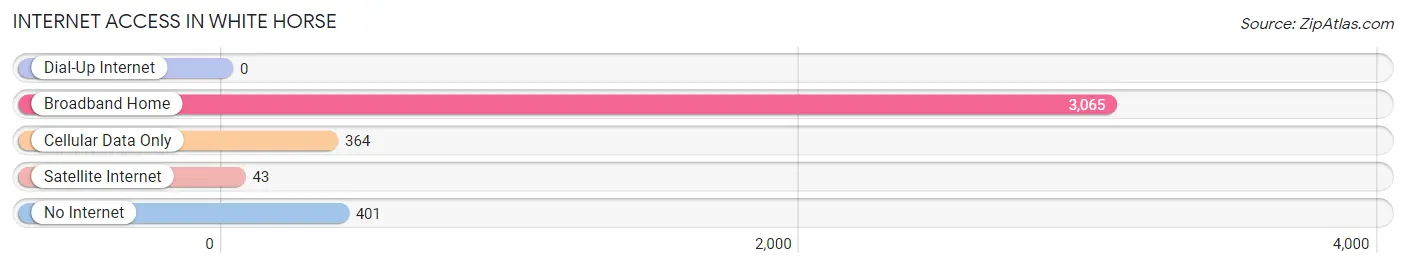
| Internet Type | # Households | % Households |
| Dial-Up Internet | 0 | 0.0% |
| Broadband Home | 3,065 | 79.5% |
| Cellular Data Only | 364 | 9.4% |
| Satellite Internet | 43 | 1.1% |
| No Internet | 401 | 10.4% |
| Total | 3,857 | 100.0% |
White Horse Summary
White Horse, NJ is a small borough located in Camden County, New Jersey. It is situated on the White Horse Pike, a major thoroughfare that runs through the area. The borough was incorporated in 1891 and is home to a population of approximately 4,000 people.
Geography
White Horse is located in the heart of Camden County, New Jersey. It is situated on the White Horse Pike, a major thoroughfare that runs through the area. The borough is bordered by the townships of Gloucester, Winslow, and Waterford. The borough is located approximately 15 miles from Philadelphia and is easily accessible by car or public transportation.
The borough is situated on a flat terrain with an elevation of approximately 50 feet above sea level. The area is mostly residential, with some commercial and industrial development. The White Horse Pike is the main thoroughfare that runs through the borough.
Climate
White Horse has a humid subtropical climate, with hot, humid summers and cold, wet winters. The average temperature in the summer is around 80 degrees Fahrenheit, while the average temperature in the winter is around 40 degrees Fahrenheit. The area receives an average of 45 inches of precipitation per year, with most of it falling in the winter months.
Demographics
As of the 2010 census, White Horse had a population of 4,000 people. The racial makeup of the borough was 79.3% White, 11.2% African American, 0.3% Native American, 2.2% Asian, and 6.9% from other races. Hispanic or Latino of any race were 8.2% of the population.
The median household income in White Horse was $50,000, and the median family income was $60,000. The per capita income for the borough was $25,000. About 8.2% of families and 10.2% of the population were below the poverty line, including 14.2% of those under age 18 and 6.2% of those age 65 or over.
Economy
White Horse is primarily a residential community, with some commercial and industrial development. The borough is home to several small businesses, including restaurants, retail stores, and professional services. The White Horse Pike is the main thoroughfare that runs through the borough, and is home to several large retail stores and restaurants.
The borough is also home to several industrial parks, which provide employment opportunities for local residents. The largest employer in the borough is the White Horse Pike Industrial Park, which is home to several large companies, including a pharmaceutical company, a plastics manufacturer, and a food processing plant.
History
White Horse was originally inhabited by the Lenni Lenape Native American tribe. The area was first settled by Europeans in the late 1600s, and the borough was officially incorporated in 1891. The borough was named after the White Horse Tavern, which was located on the White Horse Pike.
The borough was primarily a rural farming community until the early 1900s, when the White Horse Pike was widened and improved. This led to an increase in commercial and industrial development in the area, and the borough began to grow.
In the 1950s, the borough experienced a population boom, as many people moved to the area from Philadelphia and other nearby cities. This growth continued into the 1960s and 1970s, and the borough has remained relatively stable since then.
Common Questions
What is Per Capita Income in White Horse?
Per Capita income in White Horse is $46,073.
What is the Median Family Income in White Horse?
Median Family Income in White Horse is $110,469.
What is the Median Household income in White Horse?
Median Household Income in White Horse is $101,380.
What is Income or Wage Gap in White Horse?
Income or Wage Gap in White Horse is 32.6%.
Women in White Horse earn 67.4 cents for every dollar earned by a man.
What is Inequality or Gini Index in White Horse?
Inequality or Gini Index in White Horse is 0.39.
What is the Total Population of White Horse?
Total Population of White Horse is 9,692.
What is the Total Male Population of White Horse?
Total Male Population of White Horse is 4,920.
What is the Total Female Population of White Horse?
Total Female Population of White Horse is 4,772.
What is the Ratio of Males per 100 Females in White Horse?
There are 103.10 Males per 100 Females in White Horse.
What is the Ratio of Females per 100 Males in White Horse?
There are 96.99 Females per 100 Males in White Horse.
What is the Median Population Age in White Horse?
Median Population Age in White Horse is 44.2 Years.
What is the Average Family Size in White Horse
Average Family Size in White Horse is 3.1 People.
What is the Average Household Size in White Horse
Average Household Size in White Horse is 2.5 People.
How Large is the Labor Force in White Horse?
There are 5,274 People in the Labor Forcein in White Horse.
What is the Percentage of People in the Labor Force in White Horse?
61.3% of People are in the Labor Force in White Horse.
What is the Unemployment Rate in White Horse?
Unemployment Rate in White Horse is 3.0%.