Dunellen borough, NJ Map & Demographics
Dunellen borough Overview
$36,989
PER CAPITA INCOME
$111,133
AVG FAMILY INCOME
$86,532
AVG HOUSEHOLD INCOME
51.3%
WAGE / INCOME GAP [ % ]
48.7¢/ $1
WAGE / INCOME GAP [ $ ]
0.47
INEQUALITY / GINI INDEX
7,598
TOTAL POPULATION
4,072
MALE POPULATION
3,526
FEMALE POPULATION
115.48
MALES / 100 FEMALES
86.59
FEMALES / 100 MALES
39.4
MEDIAN AGE
3.7
AVG FAMILY SIZE
3.1
AVG HOUSEHOLD SIZE
3,806
LABOR FORCE [ PEOPLE ]
62.8%
PERCENT IN LABOR FORCE
4.3%
UNEMPLOYMENT RATE
Income in Dunellen borough
Income Overview in Dunellen borough
Per Capita Income in Dunellen borough is $36,989, while median incomes of families and households are $111,133 and $86,532 respectively.
| Characteristic | Number | Measure |
| Per Capita Income | 7,598 | $36,989 |
| Median Family Income | 1,762 | $111,133 |
| Mean Family Income | 1,762 | $128,494 |
| Median Household Income | 2,446 | $86,532 |
| Mean Household Income | 2,446 | $112,173 |
| Income Deficit | 1,762 | $0 |
| Wage / Income Gap (%) | 7,598 | 51.33% |
| Wage / Income Gap ($) | 7,598 | 48.67¢ per $1 |
| Gini / Inequality Index | 7,598 | 0.47 |
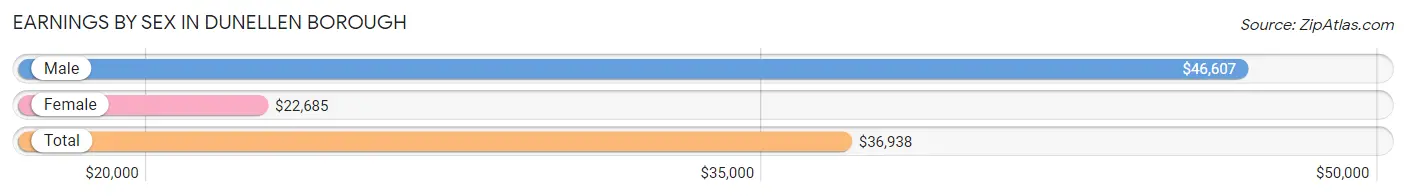
Earnings by Sex in Dunellen borough
Average Earnings in Dunellen borough are $36,938, $46,607 for men and $22,685 for women, a difference of 51.3%.
| Sex | Number | Average Earnings |
| Male | 2,434 (57.2%) | $46,607 |
| Female | 1,823 (42.8%) | $22,685 |
| Total | 4,257 (100.0%) | $36,938 |
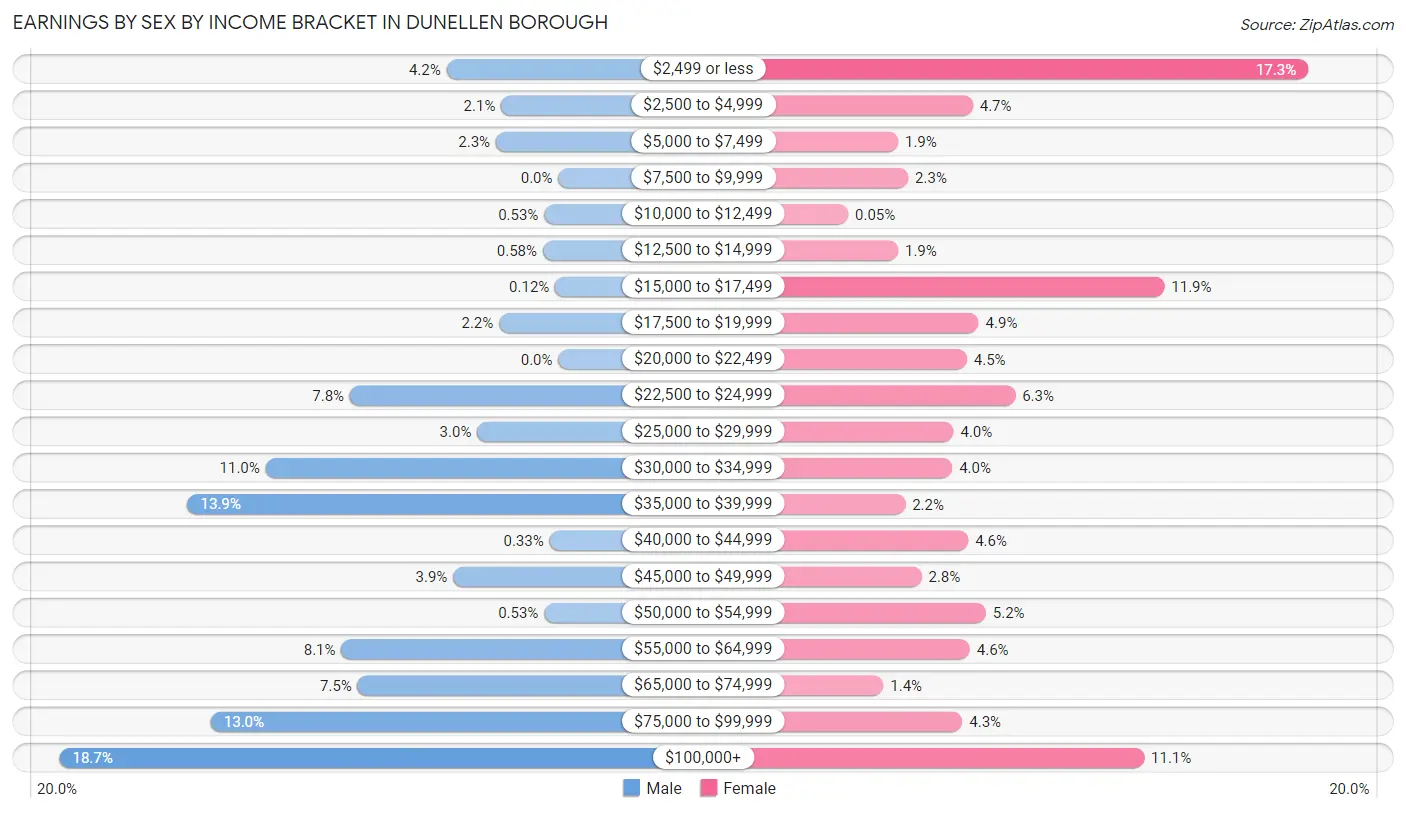
Earnings by Sex by Income Bracket in Dunellen borough
The most common earnings brackets in Dunellen borough are $100,000+ for men (455 | 18.7%) and $2,499 or less for women (315 | 17.3%).
| Income | Male | Female |
| $2,499 or less | 102 (4.2%) | 315 (17.3%) |
| $2,500 to $4,999 | 52 (2.1%) | 86 (4.7%) |
| $5,000 to $7,499 | 57 (2.3%) | 35 (1.9%) |
| $7,500 to $9,999 | 0 (0.0%) | 42 (2.3%) |
| $10,000 to $12,499 | 13 (0.5%) | 1 (0.1%) |
| $12,500 to $14,999 | 14 (0.6%) | 35 (1.9%) |
| $15,000 to $17,499 | 3 (0.1%) | 217 (11.9%) |
| $17,500 to $19,999 | 54 (2.2%) | 90 (4.9%) |
| $20,000 to $22,499 | 0 (0.0%) | 82 (4.5%) |
| $22,500 to $24,999 | 190 (7.8%) | 115 (6.3%) |
| $25,000 to $29,999 | 74 (3.0%) | 73 (4.0%) |
| $30,000 to $34,999 | 267 (11.0%) | 72 (4.0%) |
| $35,000 to $39,999 | 338 (13.9%) | 40 (2.2%) |
| $40,000 to $44,999 | 8 (0.3%) | 83 (4.5%) |
| $45,000 to $49,999 | 96 (3.9%) | 51 (2.8%) |
| $50,000 to $54,999 | 13 (0.5%) | 95 (5.2%) |
| $55,000 to $64,999 | 198 (8.1%) | 84 (4.6%) |
| $65,000 to $74,999 | 183 (7.5%) | 25 (1.4%) |
| $75,000 to $99,999 | 317 (13.0%) | 79 (4.3%) |
| $100,000+ | 455 (18.7%) | 203 (11.1%) |
| Total | 2,434 (100.0%) | 1,823 (100.0%) |
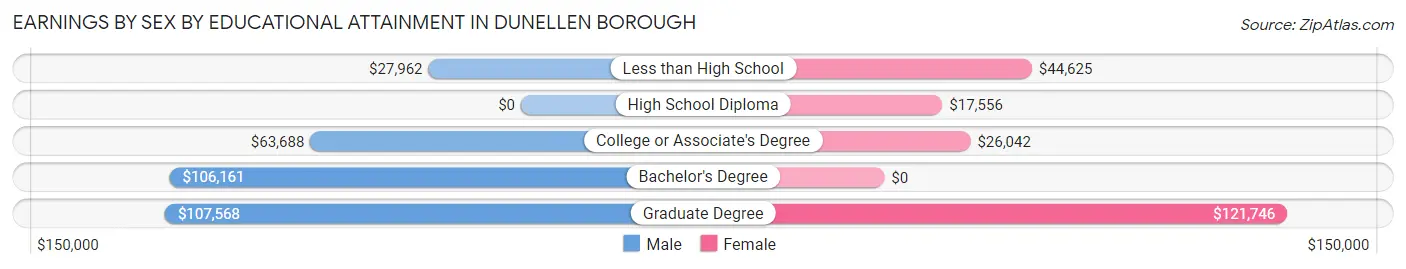
Earnings by Sex by Educational Attainment in Dunellen borough
Average earnings in Dunellen borough are $59,464 for men and $24,989 for women, a difference of 58.0%. Men with an educational attainment of graduate degree enjoy the highest average annual earnings of $107,568, while those with less than high school education earn the least with $27,962. Women with an educational attainment of graduate degree earn the most with the average annual earnings of $121,746, while those with high school diploma education have the smallest earnings of $17,556.
| Educational Attainment | Male Income | Female Income |
| Less than High School | $27,962 | $44,625 |
| High School Diploma | - | - |
| College or Associate's Degree | $63,688 | $26,042 |
| Bachelor's Degree | $106,161 | $0 |
| Graduate Degree | $107,568 | $121,746 |
| Total | $59,464 | $24,989 |
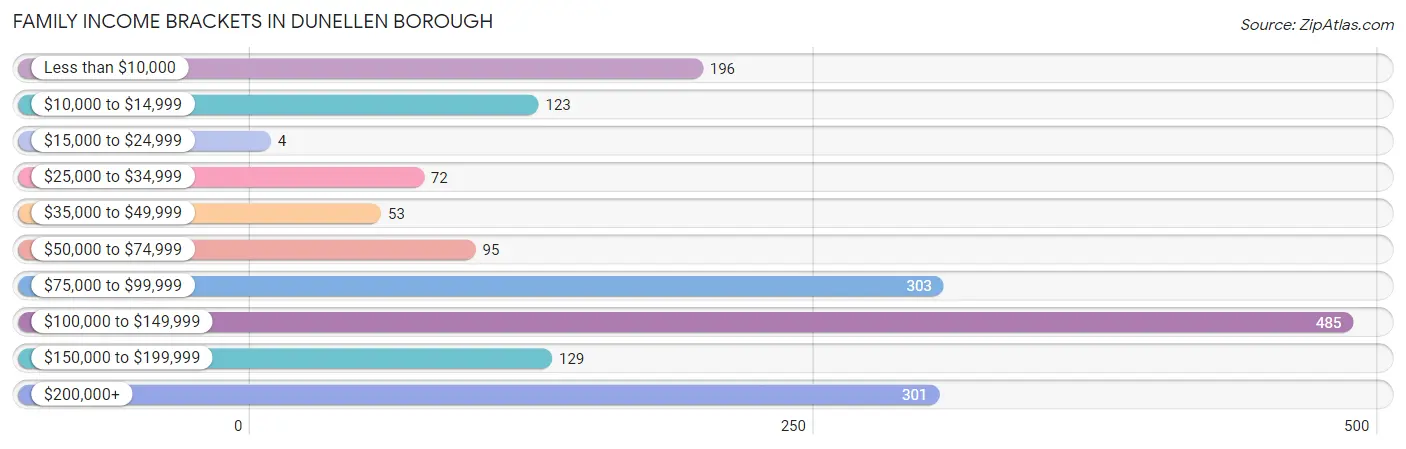
Family Income in Dunellen borough
Family Income Brackets in Dunellen borough
According to the Dunellen borough family income data, there are 485 families falling into the $100,000 to $149,999 income range, which is the most common income bracket and makes up 27.5% of all families. Conversely, the $15,000 to $24,999 income bracket is the least frequent group with only 4 families (0.2%) belonging to this category.
| Income Bracket | # Families | % Families |
| Less than $10,000 | 196 | 11.1% |
| $10,000 to $14,999 | 123 | 7.0% |
| $15,000 to $24,999 | 4 | 0.2% |
| $25,000 to $34,999 | 72 | 4.1% |
| $35,000 to $49,999 | 53 | 3.0% |
| $50,000 to $74,999 | 95 | 5.4% |
| $75,000 to $99,999 | 303 | 17.2% |
| $100,000 to $149,999 | 485 | 27.5% |
| $150,000 to $199,999 | 129 | 7.3% |
| $200,000+ | 301 | 17.1% |
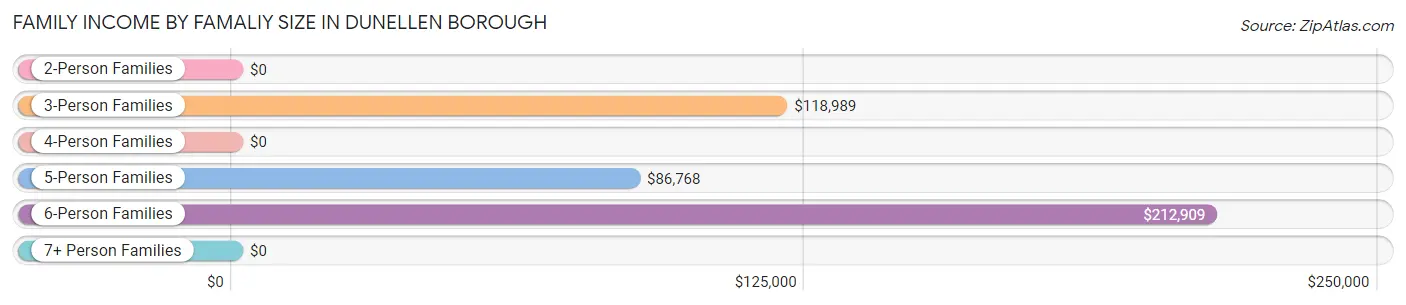
Family Income by Famaliy Size in Dunellen borough
6-person families (133 | 7.5%) account for the highest median family income in Dunellen borough with $212,909 per family, while 3-person families (407 | 23.1%) have the highest median income of $39,663 per family member.
| Income Bracket | # Families | Median Income |
| 2-Person Families | 479 (27.2%) | $0 |
| 3-Person Families | 407 (23.1%) | $118,989 |
| 4-Person Families | 409 (23.2%) | $0 |
| 5-Person Families | 334 (19.0%) | $86,768 |
| 6-Person Families | 133 (7.5%) | $212,909 |
| 7+ Person Families | 0 (0.0%) | $0 |
| Total | 1,762 (100.0%) | $111,133 |
Family Income by Number of Earners in Dunellen borough
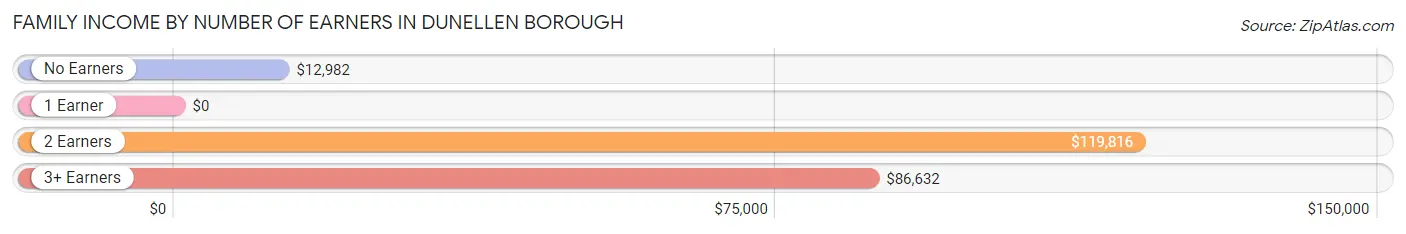
| Number of Earners | # Families | Median Income |
| No Earners | 156 (8.8%) | $12,982 |
| 1 Earner | 353 (20.0%) | $0 |
| 2 Earners | 862 (48.9%) | $119,816 |
| 3+ Earners | 391 (22.2%) | $86,632 |
| Total | 1,762 (100.0%) | $111,133 |
Household Income in Dunellen borough
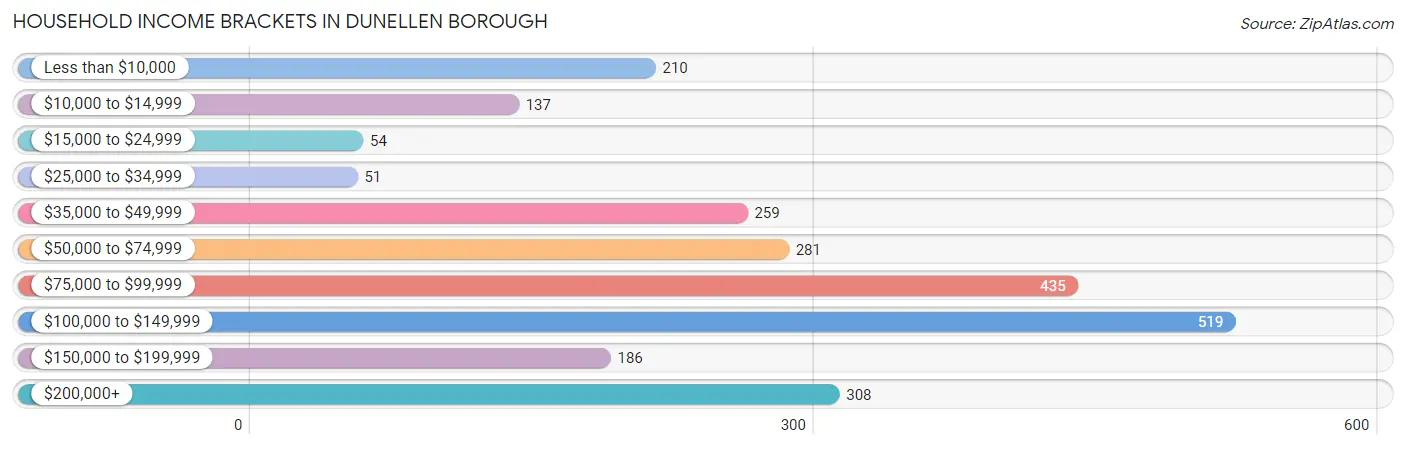
Household Income Brackets in Dunellen borough
With 519 households falling in the category, the $100,000 to $149,999 income range is the most frequent in Dunellen borough, accounting for 21.2% of all households. In contrast, only 51 households (2.1%) fall into the $25,000 to $34,999 income bracket, making it the least populous group.
| Income Bracket | # Households | % Households |
| Less than $10,000 | 210 | 8.6% |
| $10,000 to $14,999 | 137 | 5.6% |
| $15,000 to $24,999 | 54 | 2.2% |
| $25,000 to $34,999 | 51 | 2.1% |
| $35,000 to $49,999 | 259 | 10.6% |
| $50,000 to $74,999 | 281 | 11.5% |
| $75,000 to $99,999 | 435 | 17.8% |
| $100,000 to $149,999 | 519 | 21.2% |
| $150,000 to $199,999 | 186 | 7.6% |
| $200,000+ | 308 | 12.6% |
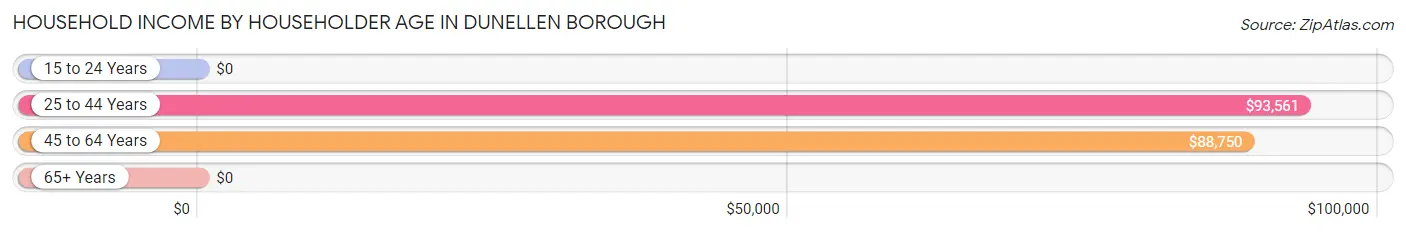
Household Income by Householder Age in Dunellen borough
The median household income in Dunellen borough is $86,532, with the highest median household income of $93,561 found in the 25 to 44 years age bracket for the primary householder. A total of 850 households (34.7%) fall into this category. Meanwhile, the 15 to 24 years age bracket for the primary householder has the lowest median household income of $0, with 28 households (1.1%) in this group.
| Income Bracket | # Households | Median Income |
| 15 to 24 Years | 28 (1.1%) | $0 |
| 25 to 44 Years | 850 (34.7%) | $93,561 |
| 45 to 64 Years | 920 (37.6%) | $88,750 |
| 65+ Years | 648 (26.5%) | $0 |
| Total | 2,446 (100.0%) | $86,532 |
Poverty in Dunellen borough
Income Below Poverty by Sex and Age in Dunellen borough
With 22.2% poverty level for males and 17.4% for females among the residents of Dunellen borough, under 5 year old males and 5 year old females are the most vulnerable to poverty, with 167 males (81.5%) and 50 females (100.0%) in their respective age groups living below the poverty level.
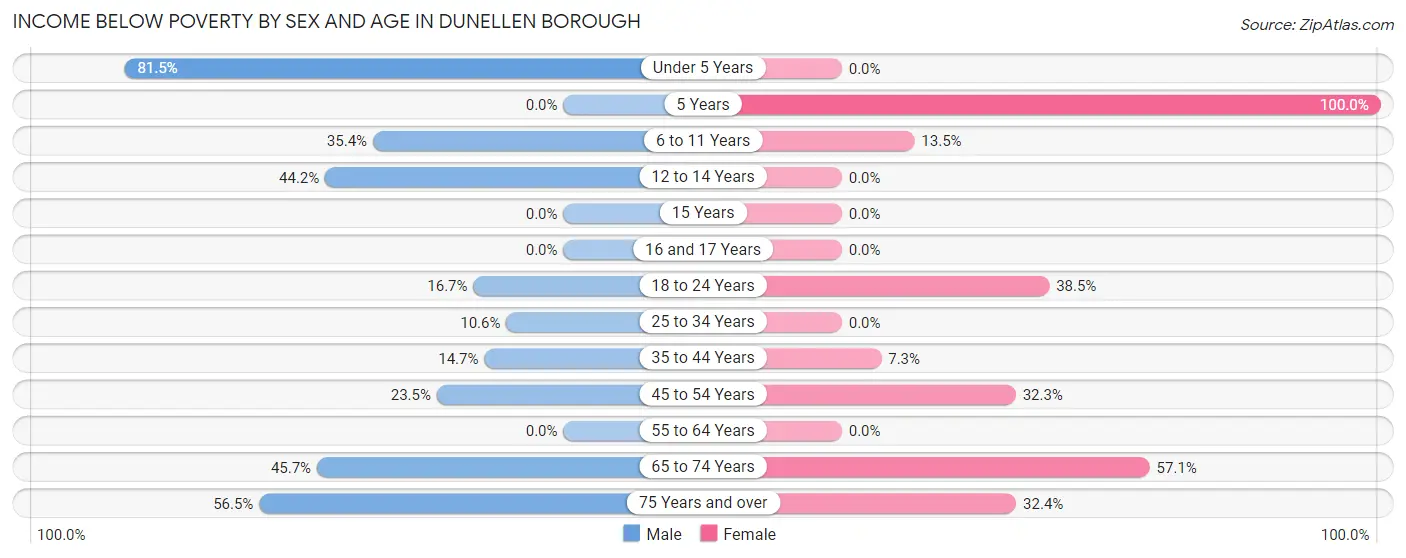
| Age Bracket | Male | Female |
| Under 5 Years | 167 (81.5%) | 0 (0.0%) |
| 5 Years | 0 (0.0%) | 50 (100.0%) |
| 6 to 11 Years | 117 (35.3%) | 50 (13.5%) |
| 12 to 14 Years | 111 (44.2%) | 0 (0.0%) |
| 15 Years | 0 (0.0%) | 0 (0.0%) |
| 16 and 17 Years | 0 (0.0%) | 0 (0.0%) |
| 18 to 24 Years | 89 (16.7%) | 82 (38.5%) |
| 25 to 34 Years | 34 (10.6%) | 0 (0.0%) |
| 35 to 44 Years | 149 (14.7%) | 44 (7.3%) |
| 45 to 54 Years | 66 (23.5%) | 112 (32.3%) |
| 55 to 64 Years | 0 (0.0%) | 0 (0.0%) |
| 65 to 74 Years | 86 (45.7%) | 164 (57.1%) |
| 75 Years and over | 83 (56.5%) | 111 (32.4%) |
| Total | 902 (22.2%) | 613 (17.4%) |
Income Above Poverty by Sex and Age in Dunellen borough
According to the poverty statistics in Dunellen borough, males aged 5 years and females aged under 5 years are the age groups that are most secure financially, with 100.0% of males and 100.0% of females in these age groups living above the poverty line.
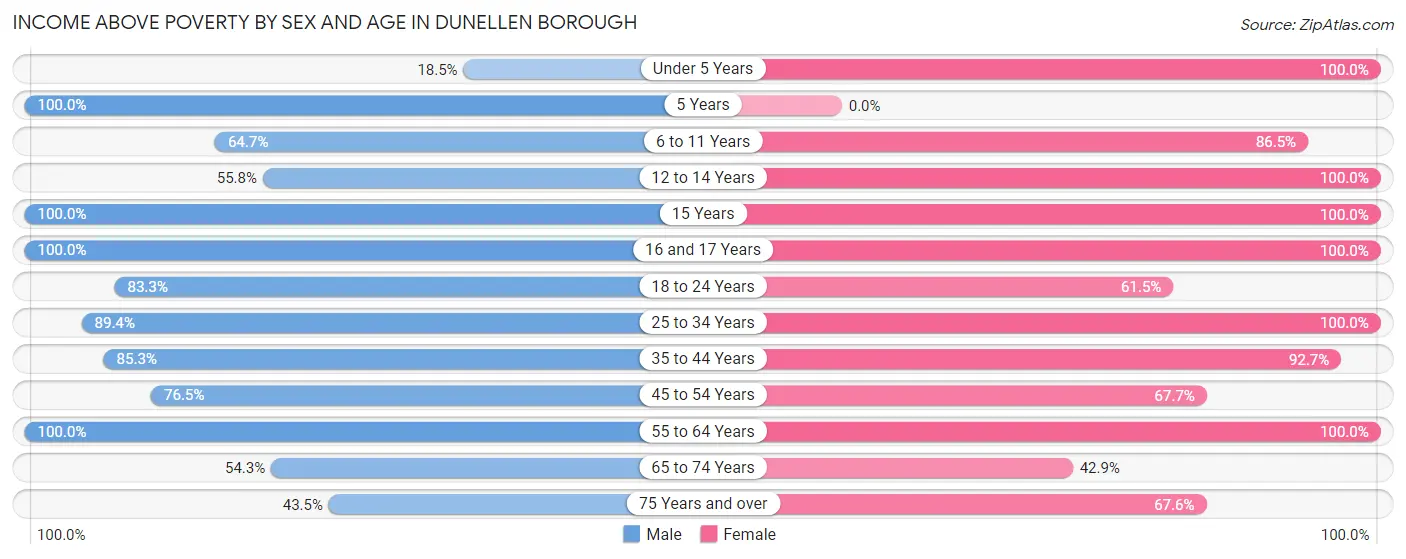
| Age Bracket | Male | Female |
| Under 5 Years | 38 (18.5%) | 77 (100.0%) |
| 5 Years | 47 (100.0%) | 0 (0.0%) |
| 6 to 11 Years | 214 (64.6%) | 321 (86.5%) |
| 12 to 14 Years | 140 (55.8%) | 60 (100.0%) |
| 15 Years | 101 (100.0%) | 38 (100.0%) |
| 16 and 17 Years | 106 (100.0%) | 263 (100.0%) |
| 18 to 24 Years | 444 (83.3%) | 131 (61.5%) |
| 25 to 34 Years | 287 (89.4%) | 180 (100.0%) |
| 35 to 44 Years | 866 (85.3%) | 556 (92.7%) |
| 45 to 54 Years | 215 (76.5%) | 235 (67.7%) |
| 55 to 64 Years | 539 (100.0%) | 697 (100.0%) |
| 65 to 74 Years | 102 (54.3%) | 123 (42.9%) |
| 75 Years and over | 64 (43.5%) | 232 (67.6%) |
| Total | 3,163 (77.8%) | 2,913 (82.6%) |
Income Below Poverty Among Married-Couple Families in Dunellen borough
The poverty statistics for married-couple families in Dunellen borough show that 18.4% or 234 of the total 1,268 families live below the poverty line. Families with no children have the highest poverty rate of 36.9%, comprising of 234 families. On the other hand, families with 1 or 2 children have the lowest poverty rate of 0.0%, which includes 0 families.
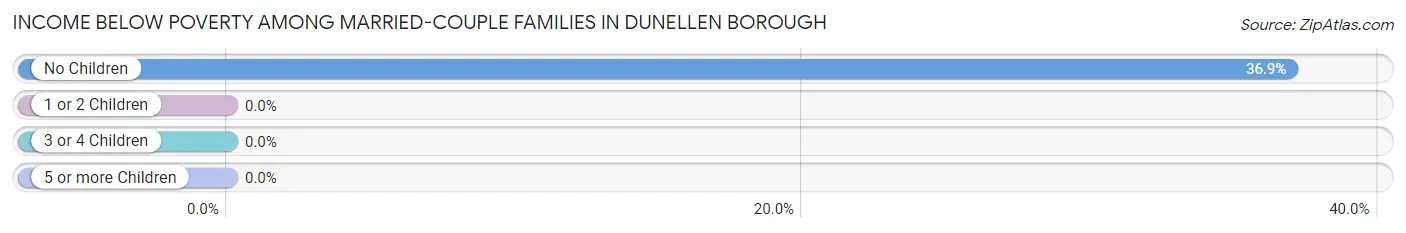
| Children | Above Poverty | Below Poverty |
| No Children | 400 (63.1%) | 234 (36.9%) |
| 1 or 2 Children | 558 (100.0%) | 0 (0.0%) |
| 3 or 4 Children | 76 (100.0%) | 0 (0.0%) |
| 5 or more Children | 0 (0.0%) | 0 (0.0%) |
| Total | 1,034 (81.6%) | 234 (18.4%) |
Income Below Poverty Among Single-Parent Households in Dunellen borough
According to the poverty data in Dunellen borough, 41.2% or 73 single-father households and 28.1% or 89 single-mother households are living below the poverty line. Among single-father households, those with 3 or 4 children have the highest poverty rate, with 73 households (100.0%) experiencing poverty. Likewise, among single-mother households, those with 3 or 4 children have the highest poverty rate, with 41 households (78.8%) falling below the poverty line.
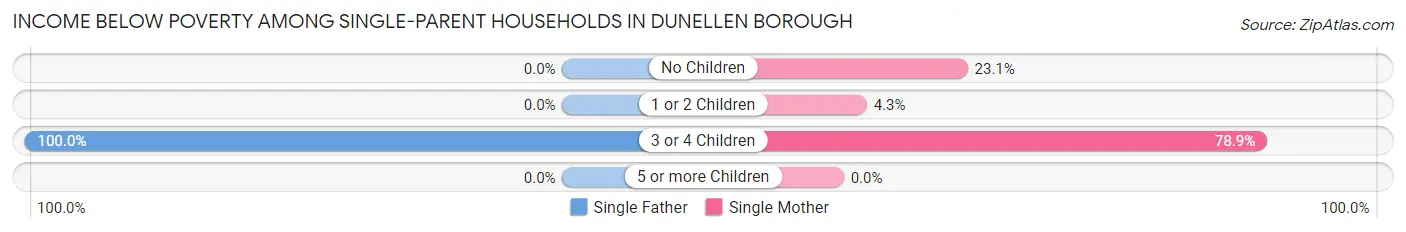
| Children | Single Father | Single Mother |
| No Children | 0 (0.0%) | 45 (23.1%) |
| 1 or 2 Children | 0 (0.0%) | 3 (4.3%) |
| 3 or 4 Children | 73 (100.0%) | 41 (78.8%) |
| 5 or more Children | 0 (0.0%) | 0 (0.0%) |
| Total | 73 (41.2%) | 89 (28.1%) |
Income Below Poverty Among Married-Couple vs Single-Parent Households in Dunellen borough
The poverty data for Dunellen borough shows that 234 of the married-couple family households (18.4%) and 162 of the single-parent households (32.8%) are living below the poverty level. Within the married-couple family households, those with no children have the highest poverty rate, with 234 households (36.9%) falling below the poverty line. Among the single-parent households, those with 3 or 4 children have the highest poverty rate, with 114 household (91.2%) living below poverty.
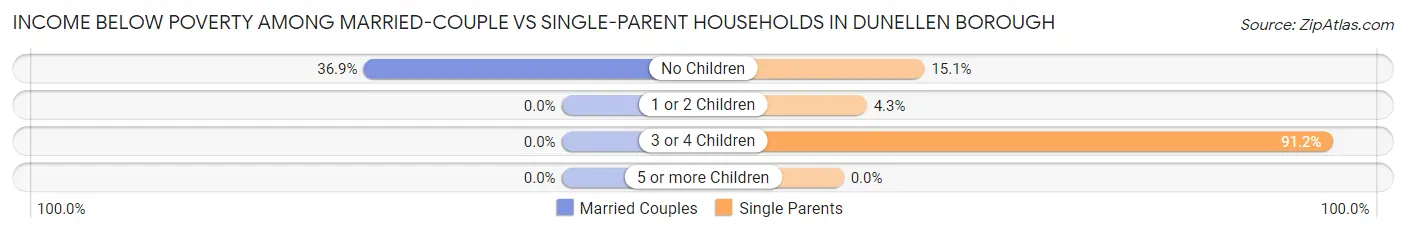
| Children | Married-Couple Families | Single-Parent Households |
| No Children | 234 (36.9%) | 45 (15.0%) |
| 1 or 2 Children | 0 (0.0%) | 3 (4.3%) |
| 3 or 4 Children | 0 (0.0%) | 114 (91.2%) |
| 5 or more Children | 0 (0.0%) | 0 (0.0%) |
| Total | 234 (18.4%) | 162 (32.8%) |
Race in Dunellen borough
The most populous races in Dunellen borough are Hispanic or Latino (3,461 | 45.6%), White / Caucasian (3,233 | 42.5%), and Some other Race (2,266 | 29.8%).
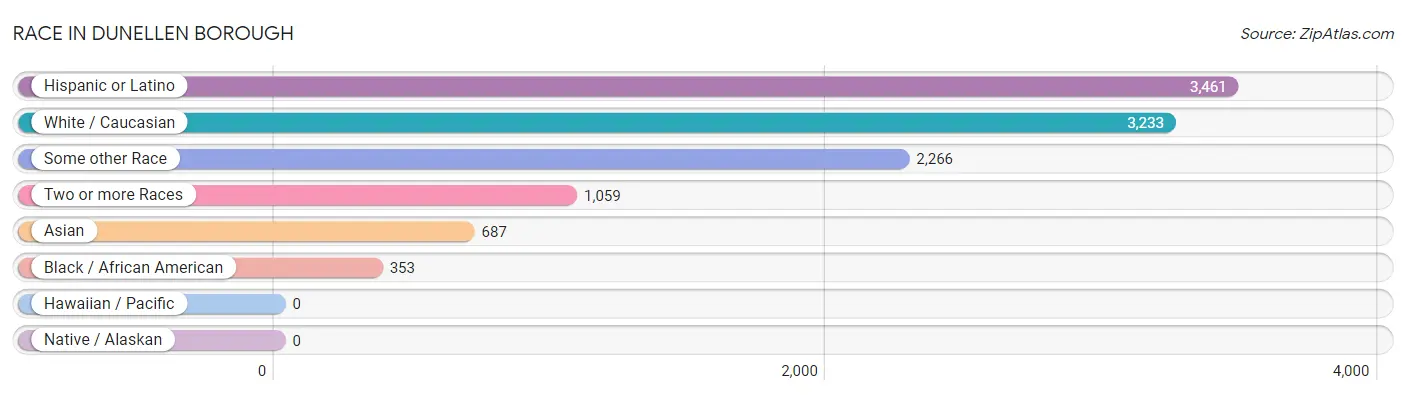
| Race | # Population | % Population |
| Asian | 687 | 9.0% |
| Black / African American | 353 | 4.6% |
| Hawaiian / Pacific | 0 | 0.0% |
| Hispanic or Latino | 3,461 | 45.6% |
| Native / Alaskan | 0 | 0.0% |
| White / Caucasian | 3,233 | 42.5% |
| Two or more Races | 1,059 | 13.9% |
| Some other Race | 2,266 | 29.8% |
| Total | 7,598 | 100.0% |
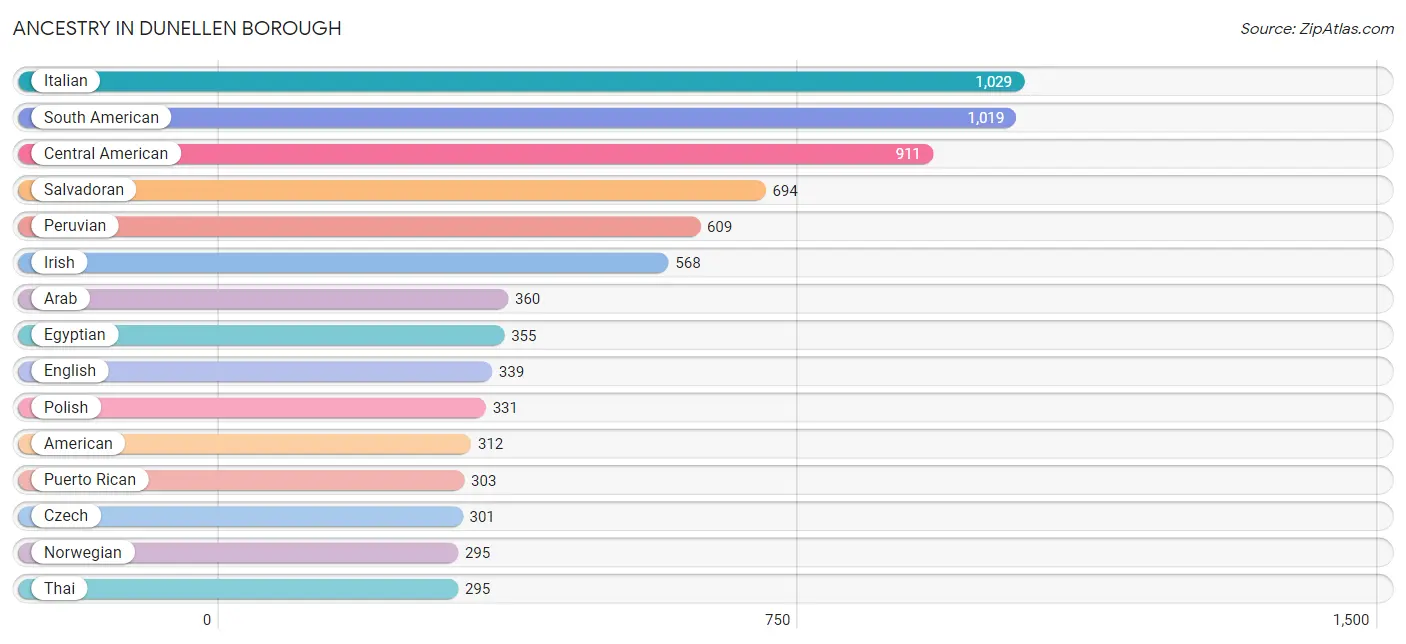
Ancestry in Dunellen borough
The most populous ancestries reported in Dunellen borough are Italian (1,029 | 13.5%), South American (1,019 | 13.4%), Central American (911 | 12.0%), Salvadoran (694 | 9.1%), and Peruvian (609 | 8.0%), together accounting for 56.1% of all Dunellen borough residents.
| Ancestry | # Population | % Population |
| African | 24 | 0.3% |
| American | 312 | 4.1% |
| Arab | 360 | 4.7% |
| Austrian | 68 | 0.9% |
| British | 103 | 1.4% |
| Burmese | 173 | 2.3% |
| Cape Verdean | 5 | 0.1% |
| Central American | 911 | 12.0% |
| Colombian | 249 | 3.3% |
| Costa Rican | 49 | 0.6% |
| Czech | 301 | 4.0% |
| Dominican | 47 | 0.6% |
| Dutch | 25 | 0.3% |
| Ecuadorian | 161 | 2.1% |
| Egyptian | 355 | 4.7% |
| English | 339 | 4.5% |
| European | 32 | 0.4% |
| German | 252 | 3.3% |
| Greek | 23 | 0.3% |
| Guyanese | 20 | 0.3% |
| Hungarian | 36 | 0.5% |
| Indian (Asian) | 13 | 0.2% |
| Irish | 568 | 7.5% |
| Italian | 1,029 | 13.5% |
| Jamaican | 134 | 1.8% |
| Korean | 112 | 1.5% |
| Mexican | 280 | 3.7% |
| Nicaraguan | 168 | 2.2% |
| Norwegian | 295 | 3.9% |
| Peruvian | 609 | 8.0% |
| Polish | 331 | 4.4% |
| Portuguese | 24 | 0.3% |
| Puerto Rican | 303 | 4.0% |
| Russian | 25 | 0.3% |
| Salvadoran | 694 | 9.1% |
| Scottish | 67 | 0.9% |
| Slavic | 76 | 1.0% |
| Slovak | 37 | 0.5% |
| South American | 1,019 | 13.4% |
| Spanish | 2 | 0.0% |
| Sri Lankan | 182 | 2.4% |
| Subsaharan African | 29 | 0.4% |
| Syrian | 5 | 0.1% |
| Thai | 295 | 3.9% |
| Trinidadian and Tobagonian | 9 | 0.1% |
| Yugoslavian | 13 | 0.2% | View All 46 Rows |
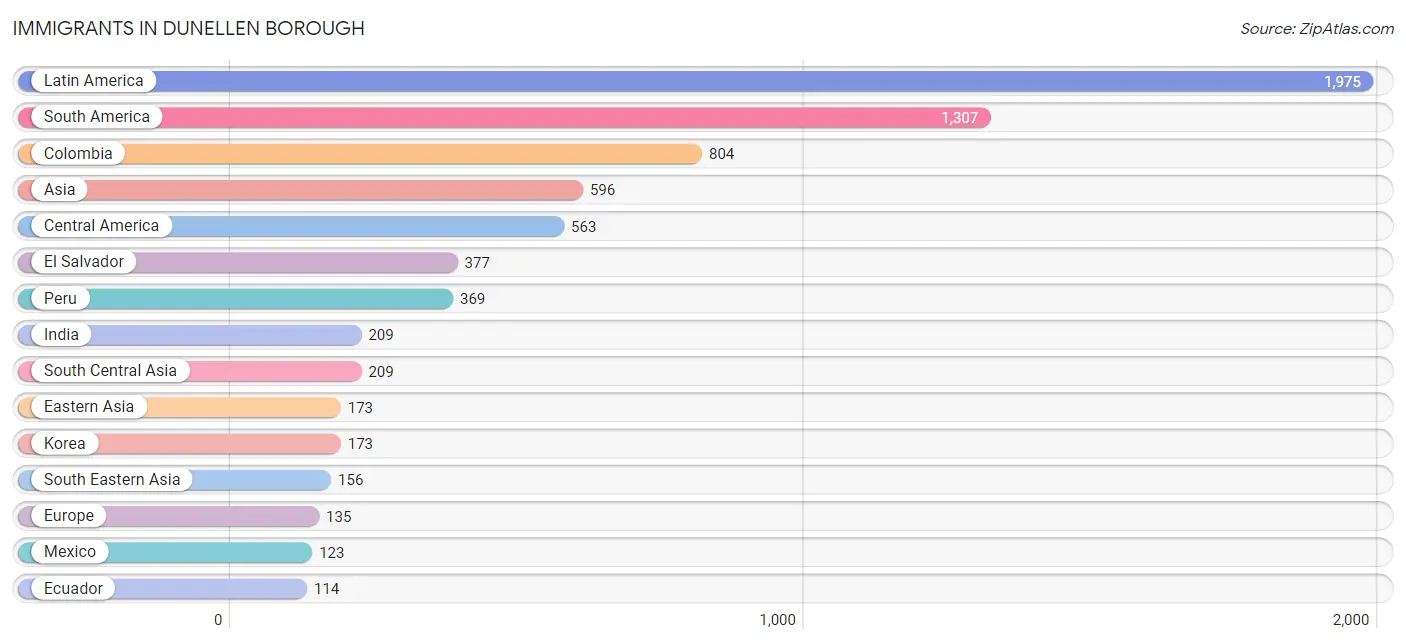
Immigrants in Dunellen borough
The most numerous immigrant groups reported in Dunellen borough came from Latin America (1,975 | 26.0%), South America (1,307 | 17.2%), Colombia (804 | 10.6%), Asia (596 | 7.8%), and Central America (563 | 7.4%), together accounting for 69.0% of all Dunellen borough residents.
| Immigration Origin | # Population | % Population |
| Africa | 31 | 0.4% |
| Asia | 596 | 7.8% |
| Caribbean | 105 | 1.4% |
| Central America | 563 | 7.4% |
| Colombia | 804 | 10.6% |
| Costa Rica | 16 | 0.2% |
| Czechoslovakia | 19 | 0.3% |
| Eastern Africa | 24 | 0.3% |
| Eastern Asia | 173 | 2.3% |
| Eastern Europe | 99 | 1.3% |
| Ecuador | 114 | 1.5% |
| El Salvador | 377 | 5.0% |
| England | 29 | 0.4% |
| Ethiopia | 24 | 0.3% |
| Europe | 135 | 1.8% |
| Guyana | 20 | 0.3% |
| India | 209 | 2.8% |
| Italy | 7 | 0.1% |
| Jamaica | 105 | 1.4% |
| Korea | 173 | 2.3% |
| Latin America | 1,975 | 26.0% |
| Mexico | 123 | 1.6% |
| Nicaragua | 47 | 0.6% |
| Northern Europe | 29 | 0.4% |
| Peru | 369 | 4.9% |
| Philippines | 64 | 0.8% |
| Poland | 80 | 1.1% |
| South America | 1,307 | 17.2% |
| South Central Asia | 209 | 2.8% |
| South Eastern Asia | 156 | 2.1% |
| Southern Europe | 7 | 0.1% |
| Vietnam | 92 | 1.2% |
| Western Asia | 58 | 0.8% | View All 33 Rows |
Sex and Age in Dunellen borough
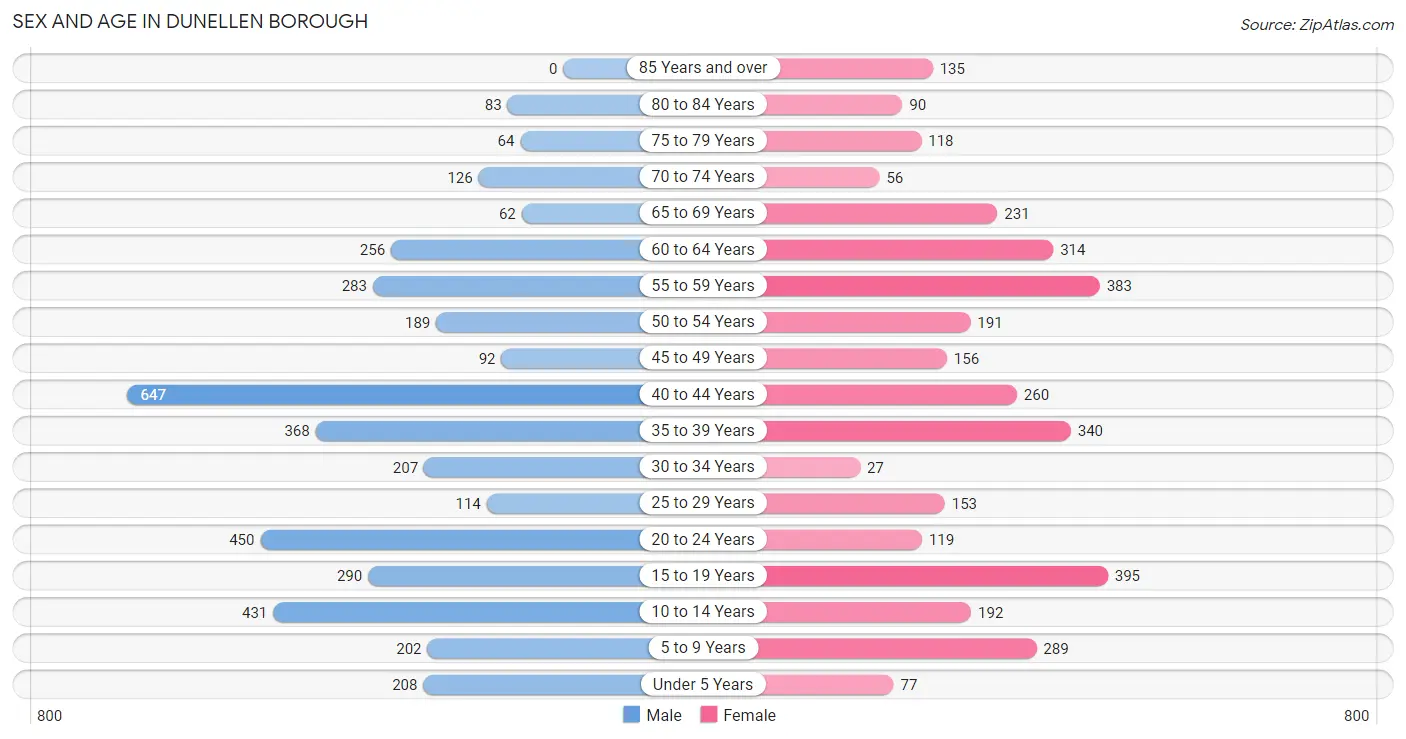
Sex and Age in Dunellen borough
The most populous age groups in Dunellen borough are 40 to 44 Years (647 | 15.9%) for men and 15 to 19 Years (395 | 11.2%) for women.
| Age Bracket | Male | Female |
| Under 5 Years | 208 (5.1%) | 77 (2.2%) |
| 5 to 9 Years | 202 (5.0%) | 289 (8.2%) |
| 10 to 14 Years | 431 (10.6%) | 192 (5.4%) |
| 15 to 19 Years | 290 (7.1%) | 395 (11.2%) |
| 20 to 24 Years | 450 (11.1%) | 119 (3.4%) |
| 25 to 29 Years | 114 (2.8%) | 153 (4.3%) |
| 30 to 34 Years | 207 (5.1%) | 27 (0.8%) |
| 35 to 39 Years | 368 (9.0%) | 340 (9.6%) |
| 40 to 44 Years | 647 (15.9%) | 260 (7.4%) |
| 45 to 49 Years | 92 (2.3%) | 156 (4.4%) |
| 50 to 54 Years | 189 (4.6%) | 191 (5.4%) |
| 55 to 59 Years | 283 (7.0%) | 383 (10.9%) |
| 60 to 64 Years | 256 (6.3%) | 314 (8.9%) |
| 65 to 69 Years | 62 (1.5%) | 231 (6.6%) |
| 70 to 74 Years | 126 (3.1%) | 56 (1.6%) |
| 75 to 79 Years | 64 (1.6%) | 118 (3.4%) |
| 80 to 84 Years | 83 (2.0%) | 90 (2.5%) |
| 85 Years and over | 0 (0.0%) | 135 (3.8%) |
| Total | 4,072 (100.0%) | 3,526 (100.0%) |
Families and Households in Dunellen borough
Median Family Size in Dunellen borough
The median family size in Dunellen borough is 3.72 persons per family, with single male/father families (177 | 10.1%) accounting for the largest median family size of 3.99 persons per family. On the other hand, married-couple families (1,268 | 72.0%) represent the smallest median family size with 3.63 persons per family.

| Family Type | # Families | Family Size |
| Married-Couple | 1,268 (72.0%) | 3.63 |
| Single Male/Father | 177 (10.1%) | 3.99 |
| Single Female/Mother | 317 (18.0%) | 3.94 |
| Total Families | 1,762 (100.0%) | 3.72 |
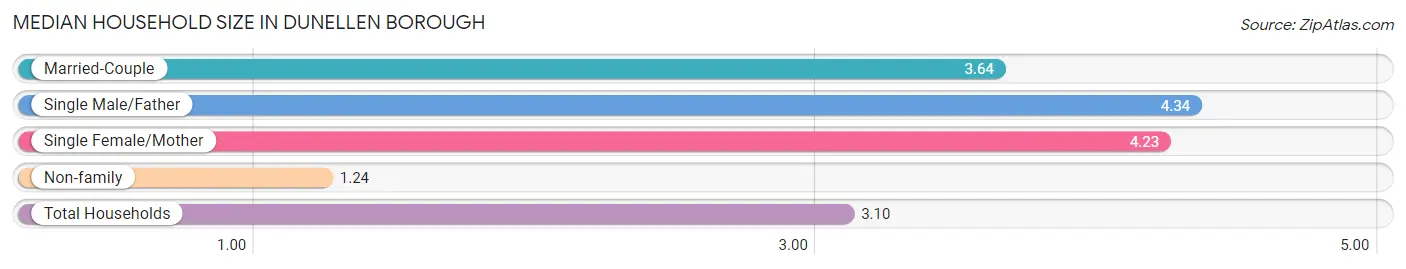
Median Household Size in Dunellen borough
The median household size in Dunellen borough is 3.10 persons per household, with single male/father households (177 | 7.2%) accounting for the largest median household size of 4.34 persons per household. non-family households (684 | 28.0%) represent the smallest median household size with 1.24 persons per household.
| Household Type | # Households | Household Size |
| Married-Couple | 1,268 (51.8%) | 3.64 |
| Single Male/Father | 177 (7.2%) | 4.34 |
| Single Female/Mother | 317 (13.0%) | 4.23 |
| Non-family | 684 (28.0%) | 1.24 |
| Total Households | 2,446 (100.0%) | 3.10 |
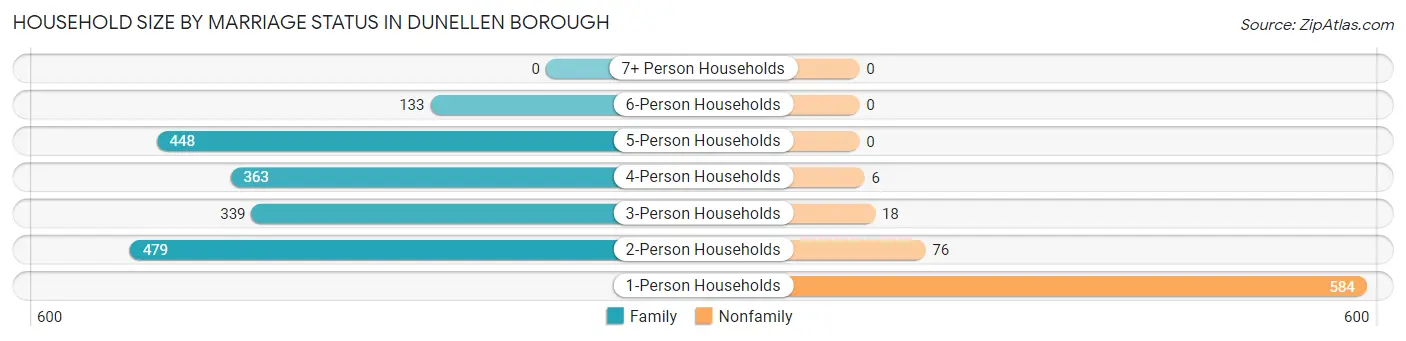
Household Size by Marriage Status in Dunellen borough
Out of a total of 2,446 households in Dunellen borough, 1,762 (72.0%) are family households, while 684 (28.0%) are nonfamily households. The most numerous type of family households are 2-person households, comprising 479, and the most common type of nonfamily households are 1-person households, comprising 584.
| Household Size | Family Households | Nonfamily Households |
| 1-Person Households | - | 584 (23.9%) |
| 2-Person Households | 479 (19.6%) | 76 (3.1%) |
| 3-Person Households | 339 (13.9%) | 18 (0.7%) |
| 4-Person Households | 363 (14.8%) | 6 (0.3%) |
| 5-Person Households | 448 (18.3%) | 0 (0.0%) |
| 6-Person Households | 133 (5.4%) | 0 (0.0%) |
| 7+ Person Households | 0 (0.0%) | 0 (0.0%) |
| Total | 1,762 (72.0%) | 684 (28.0%) |
Female Fertility in Dunellen borough
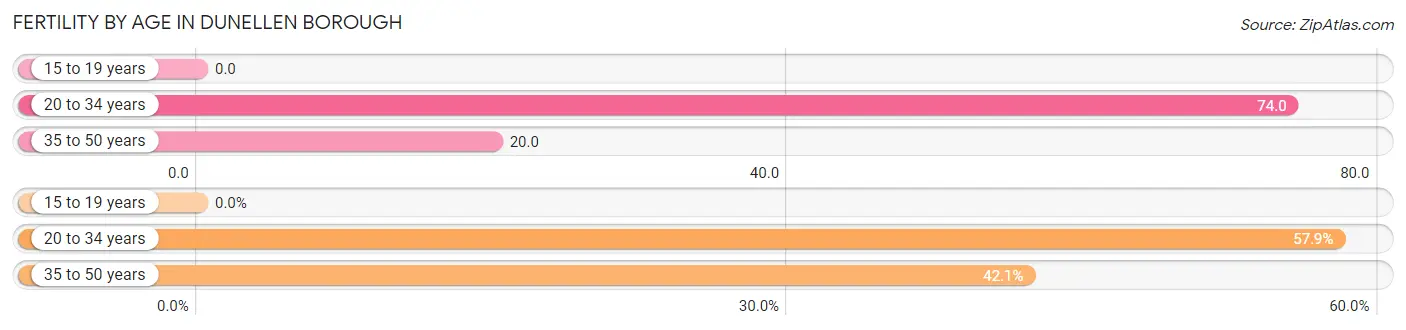
Fertility by Age in Dunellen borough
Average fertility rate in Dunellen borough is 25.0 births per 1,000 women. Women in the age bracket of 20 to 34 years have the highest fertility rate with 74.0 births per 1,000 women. Women in the age bracket of 20 to 34 years acount for 57.9% of all women with births.
| Age Bracket | Women with Births | Births / 1,000 Women |
| 15 to 19 years | 0 (0.0%) | 0.0 |
| 20 to 34 years | 22 (57.9%) | 74.0 |
| 35 to 50 years | 16 (42.1%) | 20.0 |
| Total | 38 (100.0%) | 25.0 |
Fertility by Age by Marriage Status in Dunellen borough
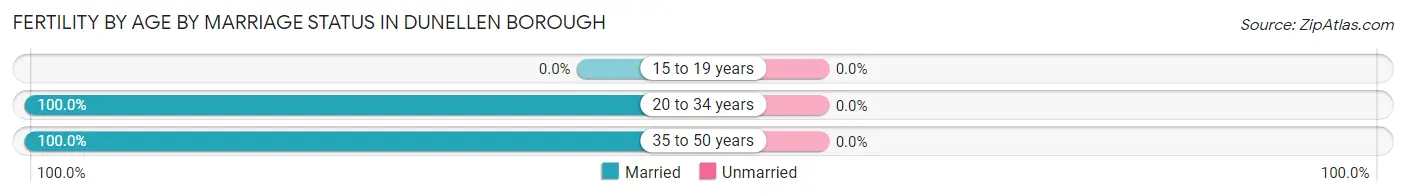
| Age Bracket | Married | Unmarried |
| 15 to 19 years | 0 (0.0%) | 0 (0.0%) |
| 20 to 34 years | 22 (100.0%) | 0 (0.0%) |
| 35 to 50 years | 16 (100.0%) | 0 (0.0%) |
| Total | 38 (100.0%) | 0 (0.0%) |
Fertility by Education in Dunellen borough
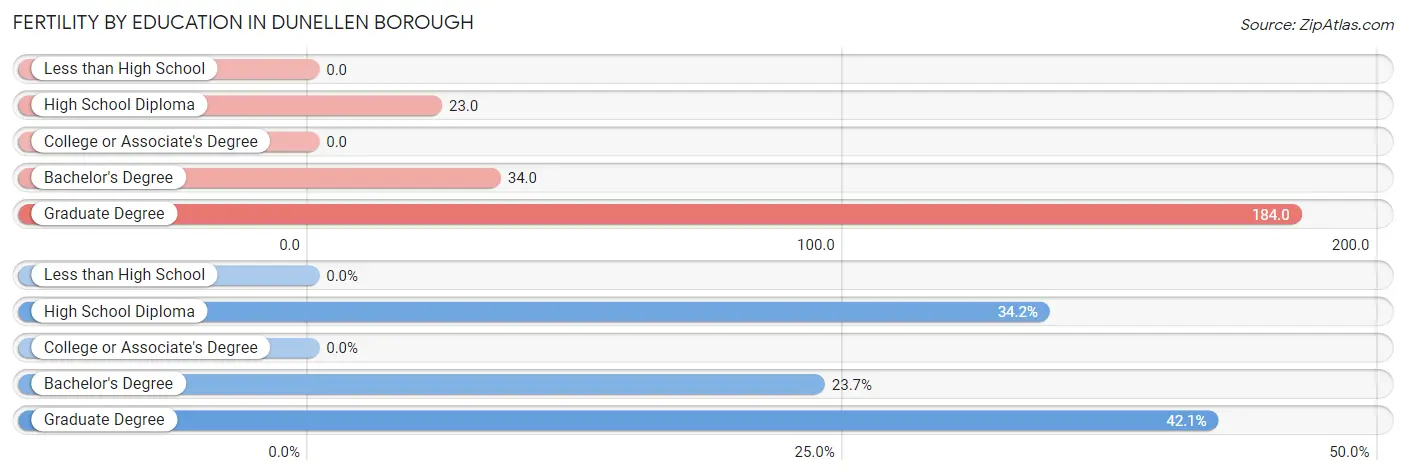
| Educational Attainment | Women with Births | Births / 1,000 Women |
| Less than High School | 0 (0.0%) | 0.0 |
| High School Diploma | 13 (34.2%) | 23.0 |
| College or Associate's Degree | 0 (0.0%) | 0.0 |
| Bachelor's Degree | 9 (23.7%) | 34.0 |
| Graduate Degree | 16 (42.1%) | 184.0 |
| Total | 38 (100.0%) | 25.0 |
Fertility by Education by Marriage Status in Dunellen borough
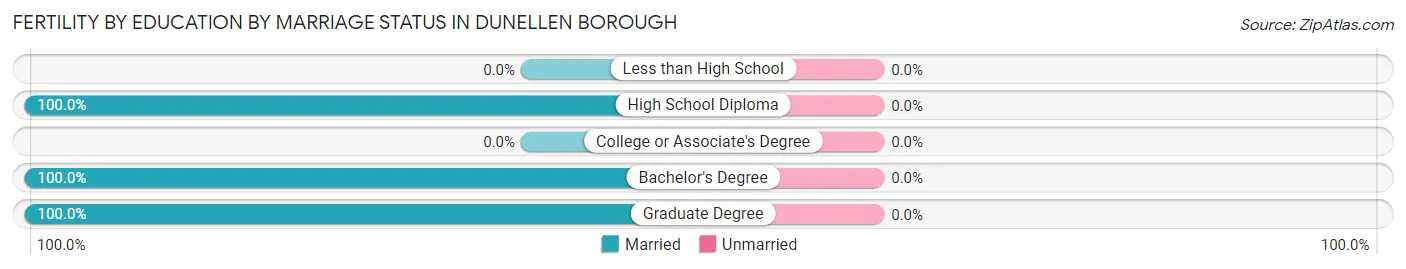
| Educational Attainment | Married | Unmarried |
| Less than High School | 0 (0.0%) | 0 (0.0%) |
| High School Diploma | 13 (100.0%) | 0 (0.0%) |
| College or Associate's Degree | 0 (0.0%) | 0 (0.0%) |
| Bachelor's Degree | 9 (100.0%) | 0 (0.0%) |
| Graduate Degree | 16 (100.0%) | 0 (0.0%) |
| Total | 38 (100.0%) | 0 (0.0%) |
Employment Characteristics in Dunellen borough
Employment by Class of Employer in Dunellen borough
Among the 3,477 employed individuals in Dunellen borough, private company employees (2,972 | 85.5%), not-for-profit organizations (193 | 5.6%), and self-employed (not incorporated) (113 | 3.3%) make up the most common classes of employment.
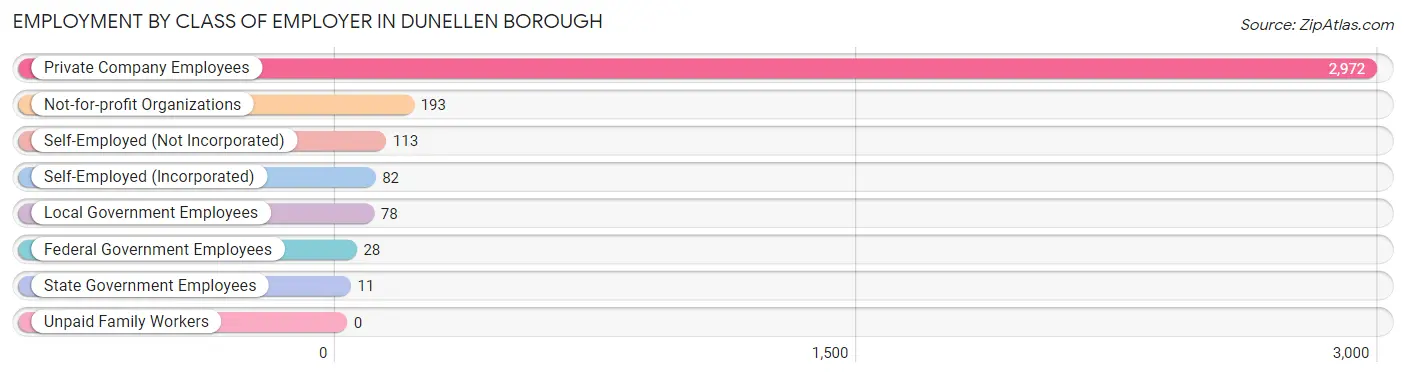
| Employer Class | # Employees | % Employees |
| Private Company Employees | 2,972 | 85.5% |
| Self-Employed (Incorporated) | 82 | 2.4% |
| Self-Employed (Not Incorporated) | 113 | 3.3% |
| Not-for-profit Organizations | 193 | 5.6% |
| Local Government Employees | 78 | 2.2% |
| State Government Employees | 11 | 0.3% |
| Federal Government Employees | 28 | 0.8% |
| Unpaid Family Workers | 0 | 0.0% |
| Total | 3,477 | 100.0% |
Employment Status by Age in Dunellen borough
According to the labor force statistics for Dunellen borough, out of the total population over 16 years of age (6,060), 62.8% or 3,806 individuals are in the labor force, with 4.3% or 164 of them unemployed. The age group with the highest labor force participation rate is 30 to 34 years, with 96.6% or 226 individuals in the labor force. Within the labor force, the 75 years and over age range has the highest percentage of unemployed individuals, with 27.6% or 21 of them being unemployed.
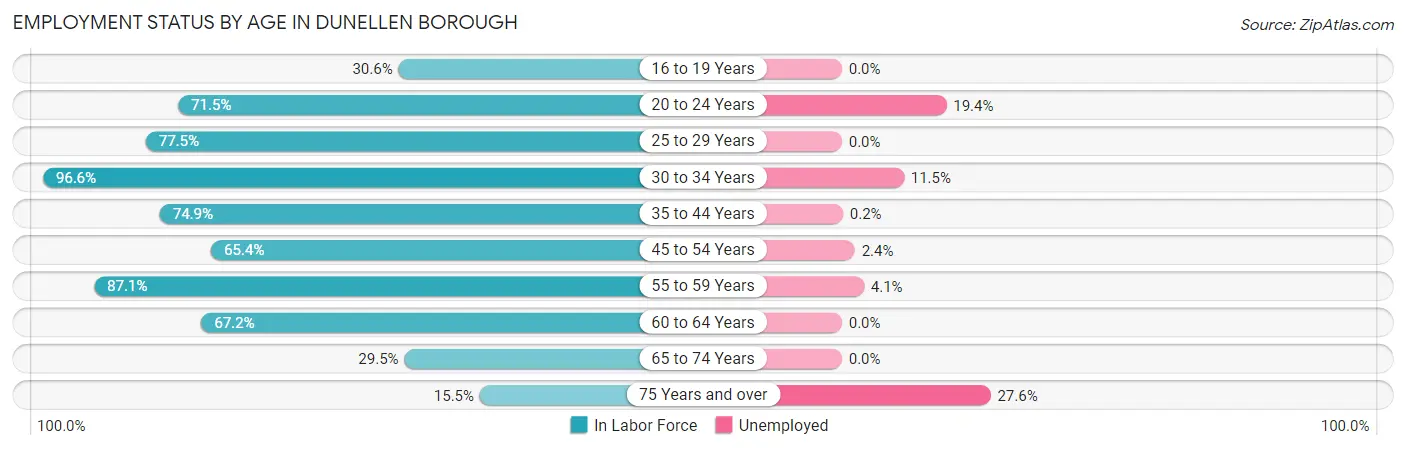
| Age Bracket | In Labor Force | Unemployed |
| 16 to 19 Years | 167 (30.6%) | 0 (0.0%) |
| 20 to 24 Years | 407 (71.5%) | 79 (19.4%) |
| 25 to 29 Years | 207 (77.5%) | 0 (0.0%) |
| 30 to 34 Years | 226 (96.6%) | 26 (11.5%) |
| 35 to 44 Years | 1,210 (74.9%) | 2 (0.2%) |
| 45 to 54 Years | 411 (65.4%) | 10 (2.4%) |
| 55 to 59 Years | 580 (87.1%) | 24 (4.1%) |
| 60 to 64 Years | 383 (67.2%) | 0 (0.0%) |
| 65 to 74 Years | 140 (29.5%) | 0 (0.0%) |
| 75 Years and over | 76 (15.5%) | 21 (27.6%) |
| Total | 3,806 (62.8%) | 164 (4.3%) |
Employment Status by Educational Attainment in Dunellen borough
According to labor force statistics for Dunellen borough, 75.8% of individuals (3,017) out of the total population between 25 and 64 years of age (3,980) are in the labor force, with 2.1% or 63 of them being unemployed. The group with the highest labor force participation rate are those with the educational attainment of bachelor's degree or higher, with 90.0% or 1,151 individuals in the labor force. Within the labor force, individuals with college / associate degree education have the highest percentage of unemployment, with 6.7% or 39 of them being unemployed.
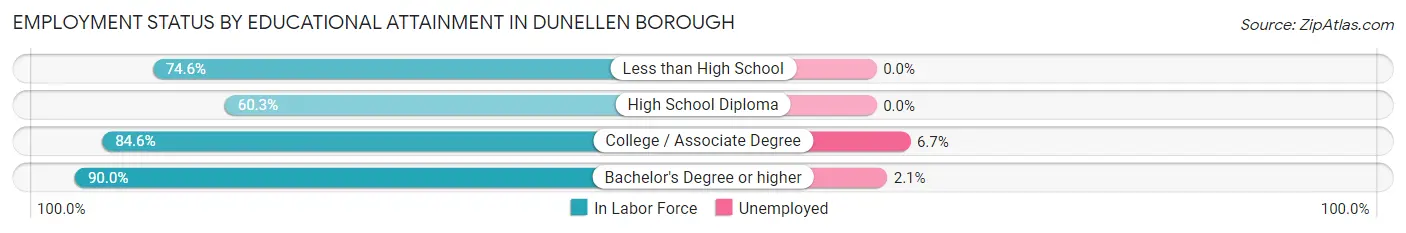
| Educational Attainment | In Labor Force | Unemployed |
| Less than High School | 356 (74.6%) | 0 (0.0%) |
| High School Diploma | 925 (60.3%) | 0 (0.0%) |
| College / Associate Degree | 584 (84.6%) | 46 (6.7%) |
| Bachelor's Degree or higher | 1,151 (90.0%) | 27 (2.1%) |
| Total | 3,017 (75.8%) | 84 (2.1%) |
Employment Occupations by Sex in Dunellen borough
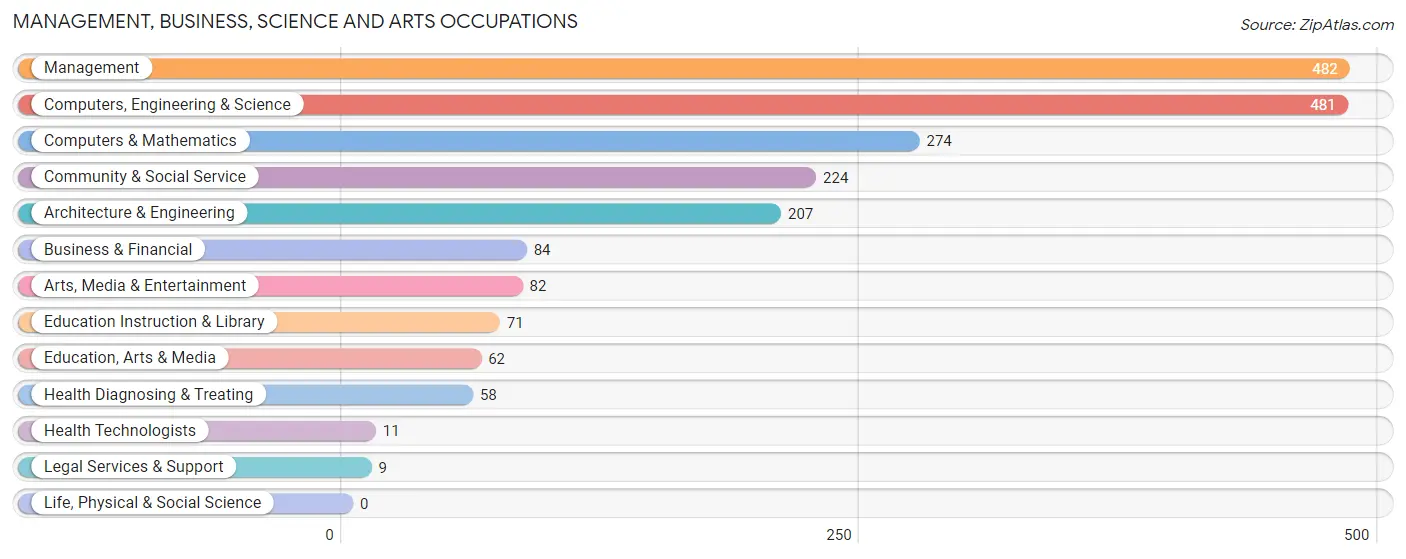
Management, Business, Science and Arts Occupations
The most common Management, Business, Science and Arts occupations in Dunellen borough are Management (482 | 13.2%), Computers, Engineering & Science (481 | 13.2%), Computers & Mathematics (274 | 7.5%), Community & Social Service (224 | 6.1%), and Architecture & Engineering (207 | 5.7%).
Management, Business, Science and Arts Occupations by Sex
Within the Management, Business, Science and Arts occupations in Dunellen borough, the most male-oriented occupations are Architecture & Engineering (100.0%), Education, Arts & Media (100.0%), and Computers, Engineering & Science (97.3%), while the most female-oriented occupations are Legal Services & Support (100.0%), Education Instruction & Library (100.0%), and Health Diagnosing & Treating (100.0%).
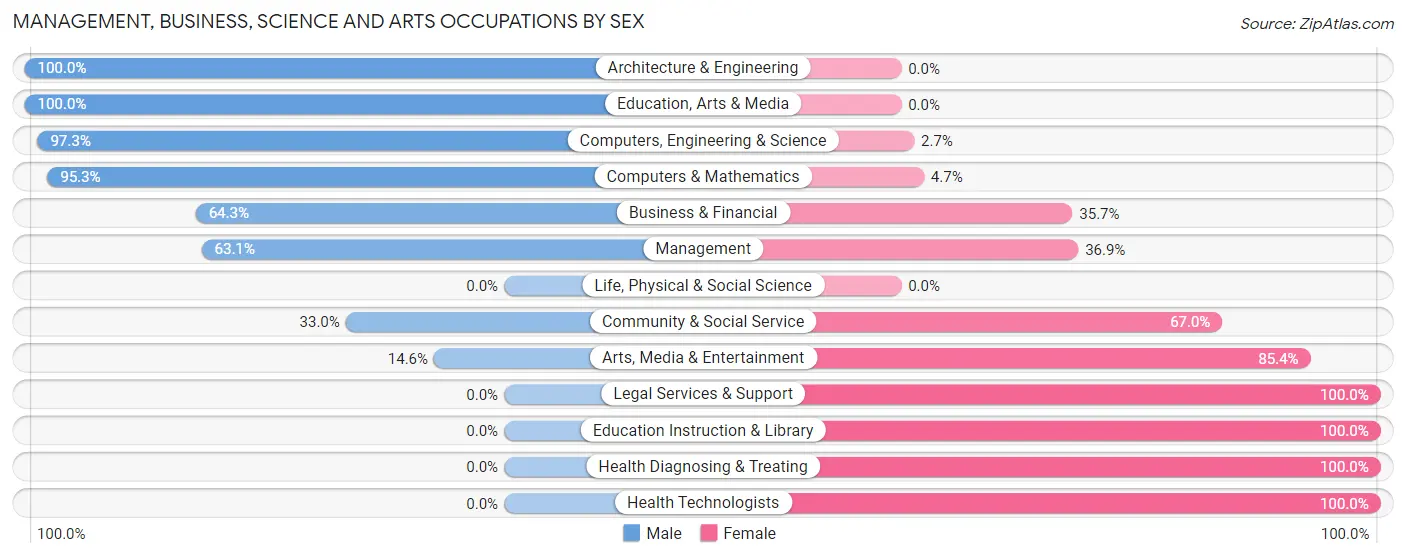
| Occupation | Male | Female |
| Management | 304 (63.1%) | 178 (36.9%) |
| Business & Financial | 54 (64.3%) | 30 (35.7%) |
| Computers, Engineering & Science | 468 (97.3%) | 13 (2.7%) |
| Computers & Mathematics | 261 (95.3%) | 13 (4.7%) |
| Architecture & Engineering | 207 (100.0%) | 0 (0.0%) |
| Life, Physical & Social Science | 0 (0.0%) | 0 (0.0%) |
| Community & Social Service | 74 (33.0%) | 150 (67.0%) |
| Education, Arts & Media | 62 (100.0%) | 0 (0.0%) |
| Legal Services & Support | 0 (0.0%) | 9 (100.0%) |
| Education Instruction & Library | 0 (0.0%) | 71 (100.0%) |
| Arts, Media & Entertainment | 12 (14.6%) | 70 (85.4%) |
| Health Diagnosing & Treating | 0 (0.0%) | 58 (100.0%) |
| Health Technologists | 0 (0.0%) | 11 (100.0%) |
| Total (Category) | 900 (67.7%) | 429 (32.3%) |
| Total (Overall) | 2,332 (64.0%) | 1,311 (36.0%) |
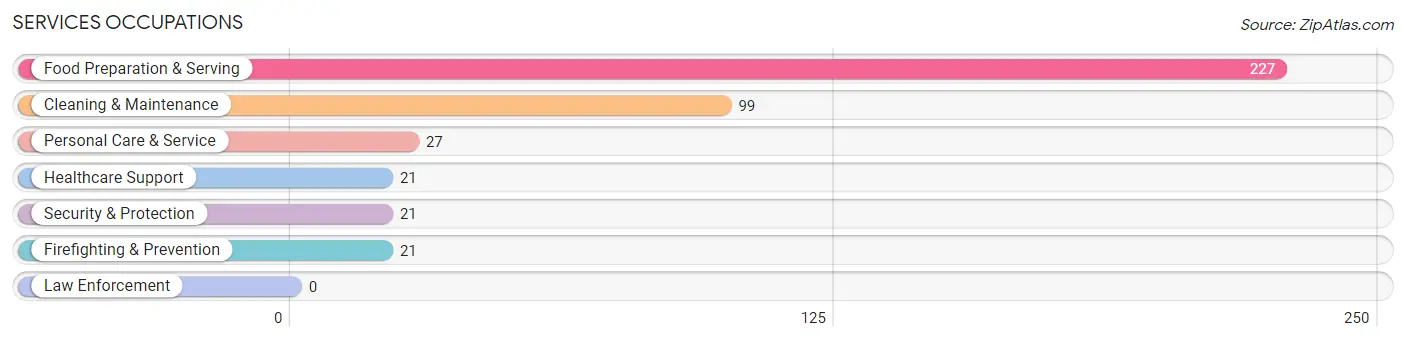
Services Occupations
The most common Services occupations in Dunellen borough are Food Preparation & Serving (227 | 6.2%), Cleaning & Maintenance (99 | 2.7%), Personal Care & Service (27 | 0.7%), Healthcare Support (21 | 0.6%), and Security & Protection (21 | 0.6%).
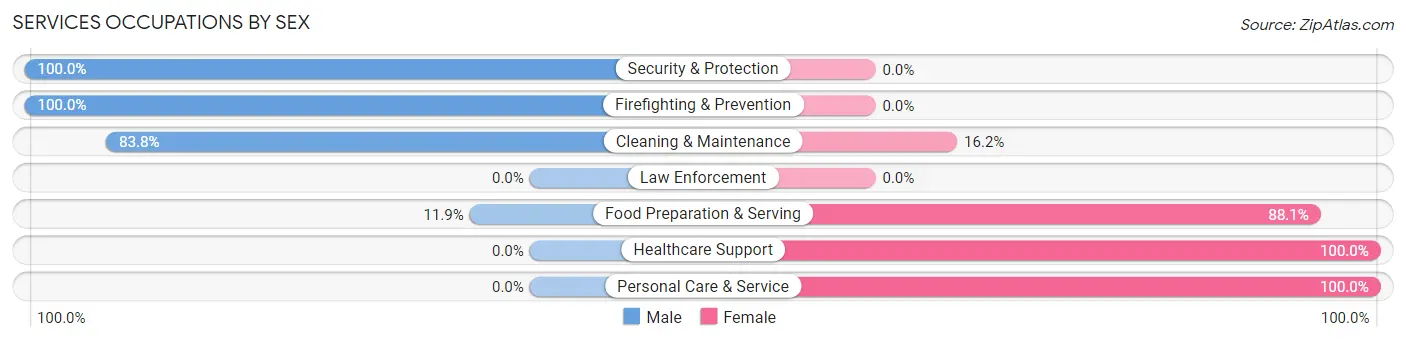
Services Occupations by Sex
Within the Services occupations in Dunellen borough, the most male-oriented occupations are Security & Protection (100.0%), Firefighting & Prevention (100.0%), and Cleaning & Maintenance (83.8%), while the most female-oriented occupations are Healthcare Support (100.0%), Personal Care & Service (100.0%), and Food Preparation & Serving (88.1%).
| Occupation | Male | Female |
| Healthcare Support | 0 (0.0%) | 21 (100.0%) |
| Security & Protection | 21 (100.0%) | 0 (0.0%) |
| Firefighting & Prevention | 21 (100.0%) | 0 (0.0%) |
| Law Enforcement | 0 (0.0%) | 0 (0.0%) |
| Food Preparation & Serving | 27 (11.9%) | 200 (88.1%) |
| Cleaning & Maintenance | 83 (83.8%) | 16 (16.2%) |
| Personal Care & Service | 0 (0.0%) | 27 (100.0%) |
| Total (Category) | 131 (33.2%) | 264 (66.8%) |
| Total (Overall) | 2,332 (64.0%) | 1,311 (36.0%) |
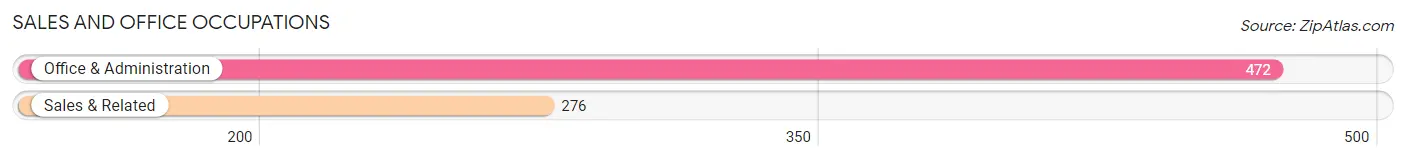
Sales and Office Occupations
The most common Sales and Office occupations in Dunellen borough are Office & Administration (472 | 13.0%), and Sales & Related (276 | 7.6%).
Sales and Office Occupations by Sex
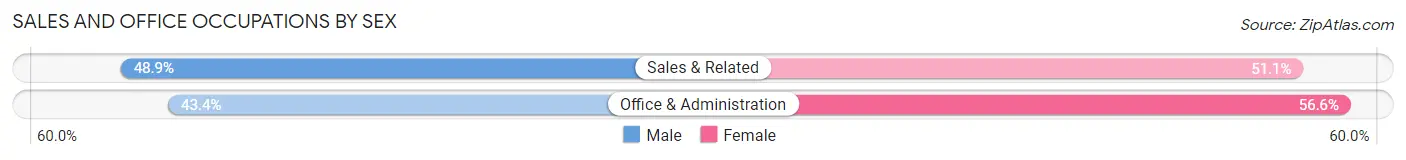
| Occupation | Male | Female |
| Sales & Related | 135 (48.9%) | 141 (51.1%) |
| Office & Administration | 205 (43.4%) | 267 (56.6%) |
| Total (Category) | 340 (45.5%) | 408 (54.5%) |
| Total (Overall) | 2,332 (64.0%) | 1,311 (36.0%) |
Natural Resources, Construction and Maintenance Occupations
The most common Natural Resources, Construction and Maintenance occupations in Dunellen borough are Construction & Extraction (426 | 11.7%), and Installation, Maintenance & Repair (145 | 4.0%).
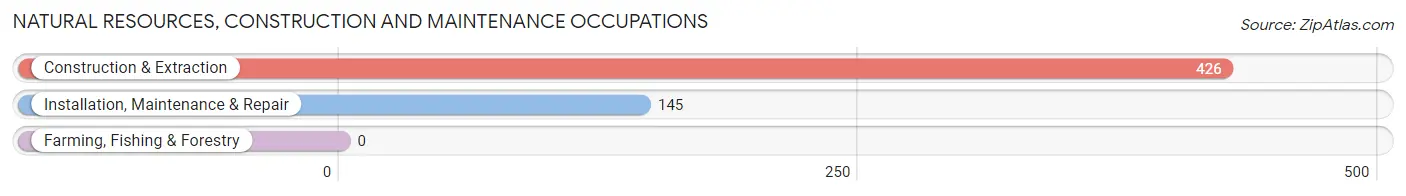
Natural Resources, Construction and Maintenance Occupations by Sex
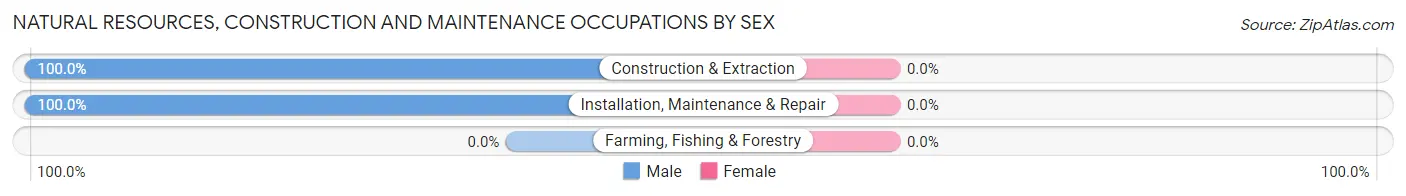
| Occupation | Male | Female |
| Farming, Fishing & Forestry | 0 (0.0%) | 0 (0.0%) |
| Construction & Extraction | 426 (100.0%) | 0 (0.0%) |
| Installation, Maintenance & Repair | 145 (100.0%) | 0 (0.0%) |
| Total (Category) | 571 (100.0%) | 0 (0.0%) |
| Total (Overall) | 2,332 (64.0%) | 1,311 (36.0%) |
Production, Transportation and Moving Occupations
The most common Production, Transportation and Moving occupations in Dunellen borough are Material Moving (209 | 5.7%), Production (202 | 5.5%), and Transportation (189 | 5.2%).
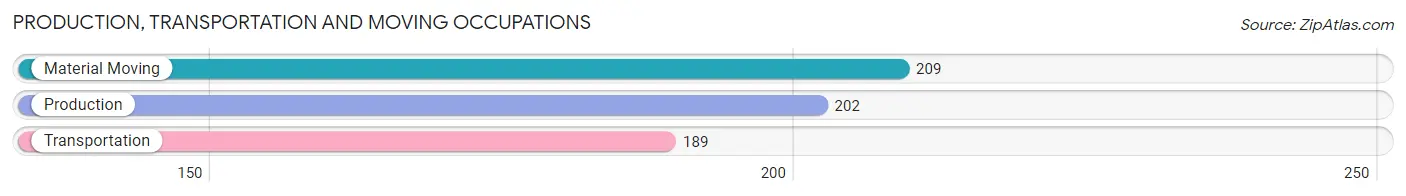
Production, Transportation and Moving Occupations by Sex
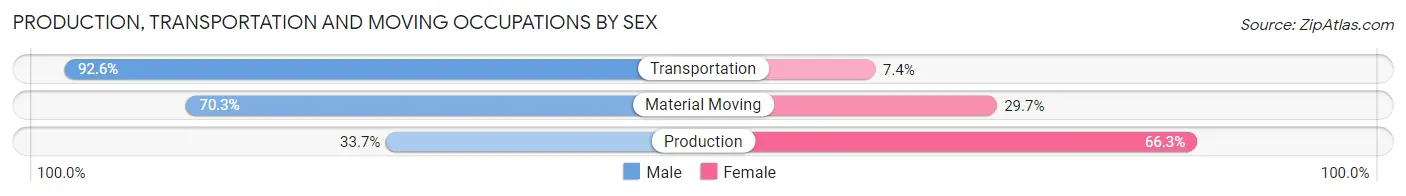
| Occupation | Male | Female |
| Production | 68 (33.7%) | 134 (66.3%) |
| Transportation | 175 (92.6%) | 14 (7.4%) |
| Material Moving | 147 (70.3%) | 62 (29.7%) |
| Total (Category) | 390 (65.0%) | 210 (35.0%) |
| Total (Overall) | 2,332 (64.0%) | 1,311 (36.0%) |
Employment Industries by Sex in Dunellen borough
Employment Industries in Dunellen borough
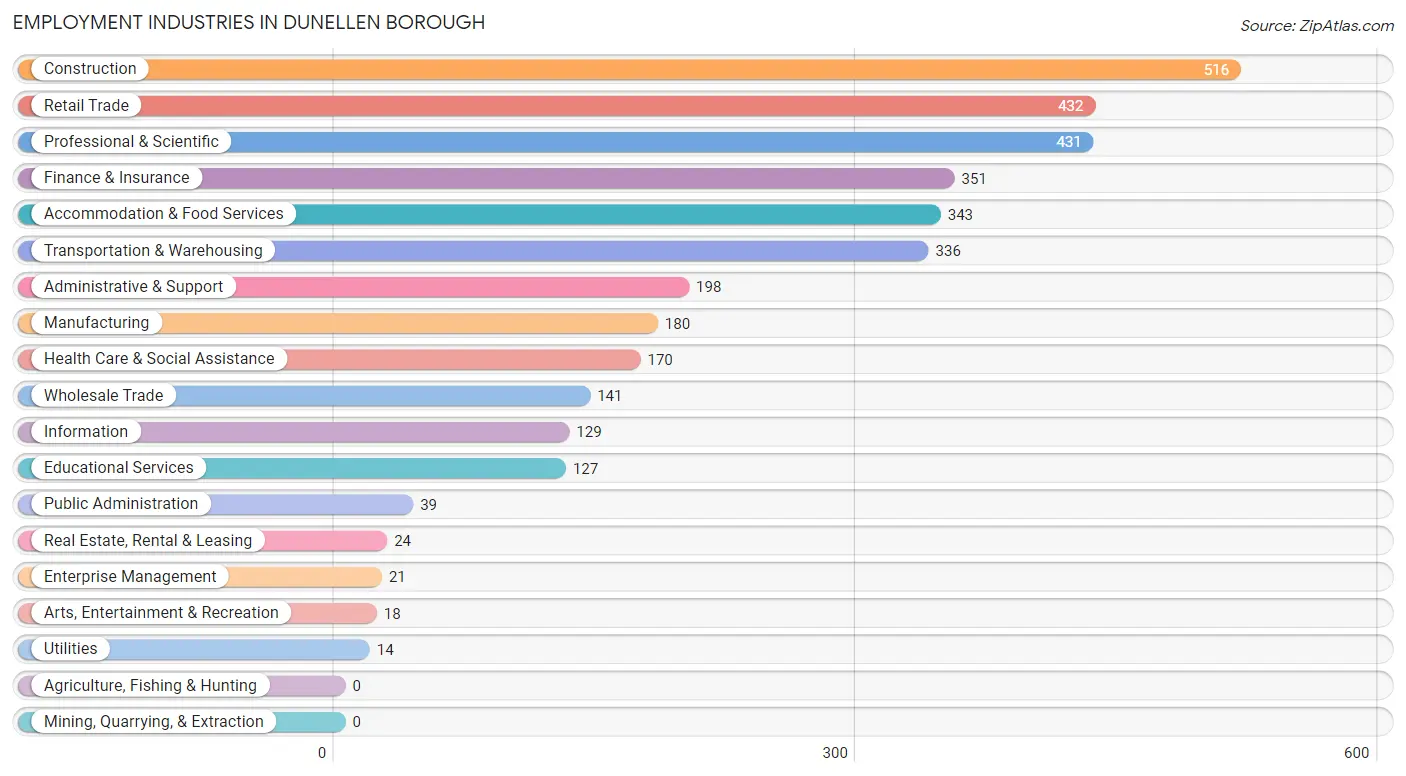
The major employment industries in Dunellen borough include Construction (516 | 14.2%), Retail Trade (432 | 11.9%), Professional & Scientific (431 | 11.8%), Finance & Insurance (351 | 9.6%), and Accommodation & Food Services (343 | 9.4%).
Employment Industries by Sex in Dunellen borough
The Dunellen borough industries that see more men than women are Construction (100.0%), Transportation & Warehousing (100.0%), and Utilities (100.0%), whereas the industries that tend to have a higher number of women are Real Estate, Rental & Leasing (100.0%), Enterprise Management (100.0%), and Arts, Entertainment & Recreation (100.0%).
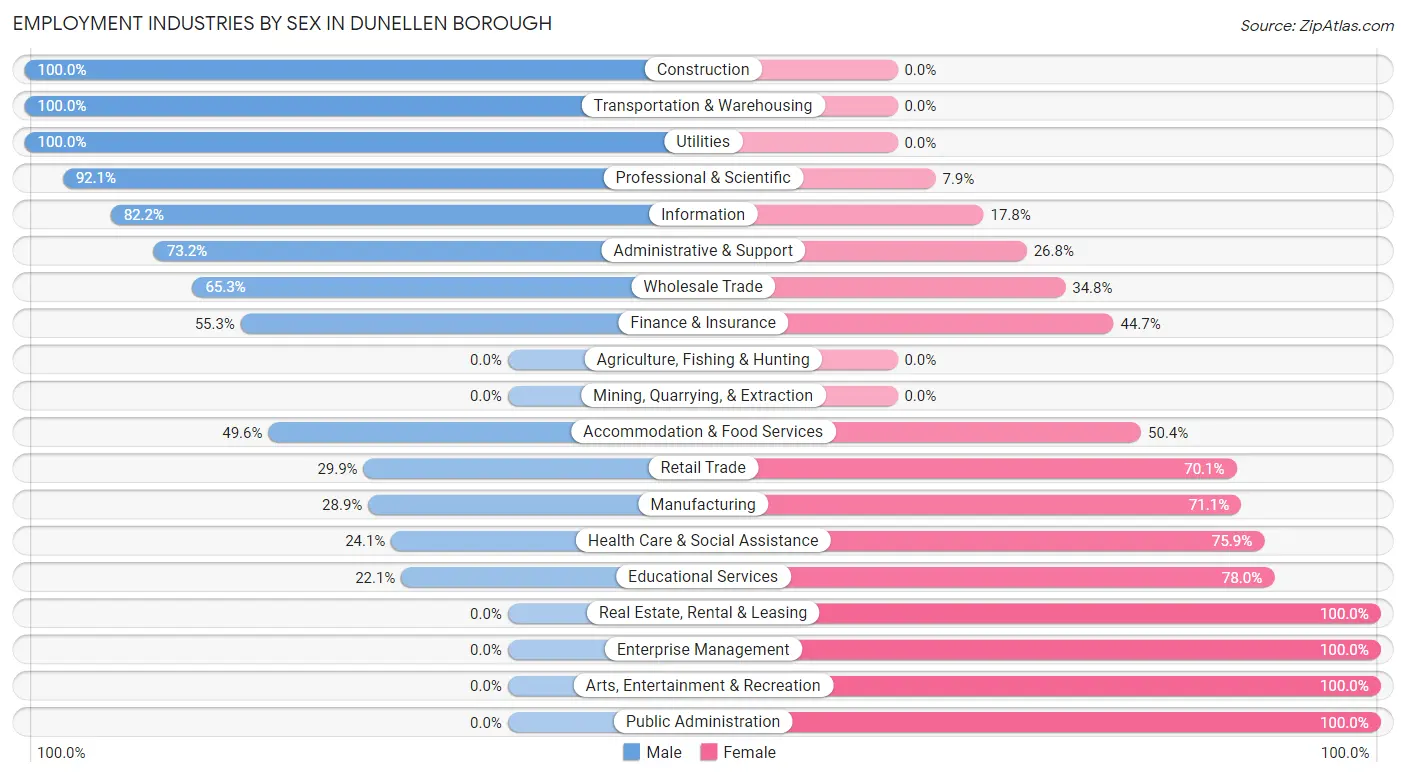
| Industry | Male | Female |
| Agriculture, Fishing & Hunting | 0 (0.0%) | 0 (0.0%) |
| Mining, Quarrying, & Extraction | 0 (0.0%) | 0 (0.0%) |
| Construction | 516 (100.0%) | 0 (0.0%) |
| Manufacturing | 52 (28.9%) | 128 (71.1%) |
| Wholesale Trade | 92 (65.2%) | 49 (34.7%) |
| Retail Trade | 129 (29.9%) | 303 (70.1%) |
| Transportation & Warehousing | 336 (100.0%) | 0 (0.0%) |
| Utilities | 14 (100.0%) | 0 (0.0%) |
| Information | 106 (82.2%) | 23 (17.8%) |
| Finance & Insurance | 194 (55.3%) | 157 (44.7%) |
| Real Estate, Rental & Leasing | 0 (0.0%) | 24 (100.0%) |
| Professional & Scientific | 397 (92.1%) | 34 (7.9%) |
| Enterprise Management | 0 (0.0%) | 21 (100.0%) |
| Administrative & Support | 145 (73.2%) | 53 (26.8%) |
| Educational Services | 28 (22.1%) | 99 (77.9%) |
| Health Care & Social Assistance | 41 (24.1%) | 129 (75.9%) |
| Arts, Entertainment & Recreation | 0 (0.0%) | 18 (100.0%) |
| Accommodation & Food Services | 170 (49.6%) | 173 (50.4%) |
| Public Administration | 0 (0.0%) | 39 (100.0%) |
| Total | 2,332 (64.0%) | 1,311 (36.0%) |
Education in Dunellen borough
School Enrollment in Dunellen borough
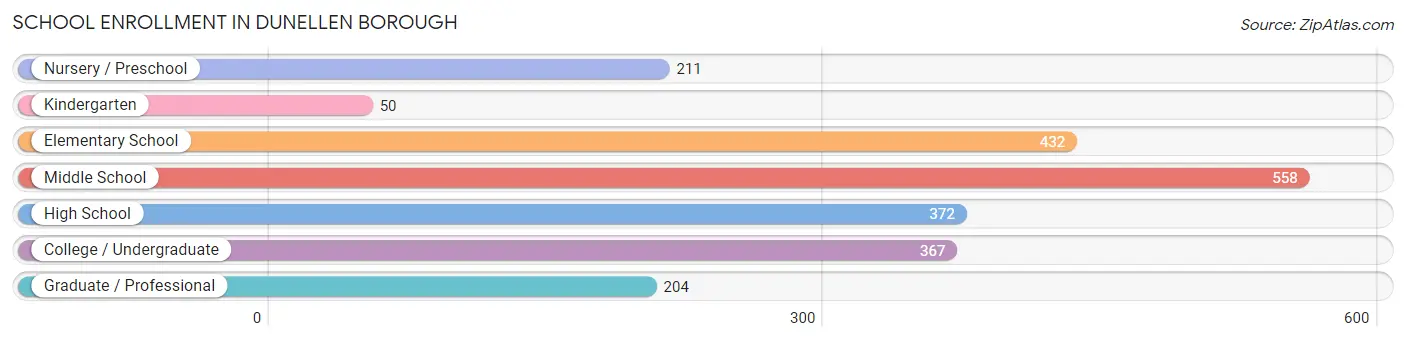
The most common levels of schooling among the 2,194 students in Dunellen borough are middle school (558 | 25.4%), elementary school (432 | 19.7%), and high school (372 | 17.0%).
| School Level | # Students | % Students |
| Nursery / Preschool | 211 | 9.6% |
| Kindergarten | 50 | 2.3% |
| Elementary School | 432 | 19.7% |
| Middle School | 558 | 25.4% |
| High School | 372 | 17.0% |
| College / Undergraduate | 367 | 16.7% |
| Graduate / Professional | 204 | 9.3% |
| Total | 2,194 | 100.0% |
School Enrollment by Age by Funding Source in Dunellen borough
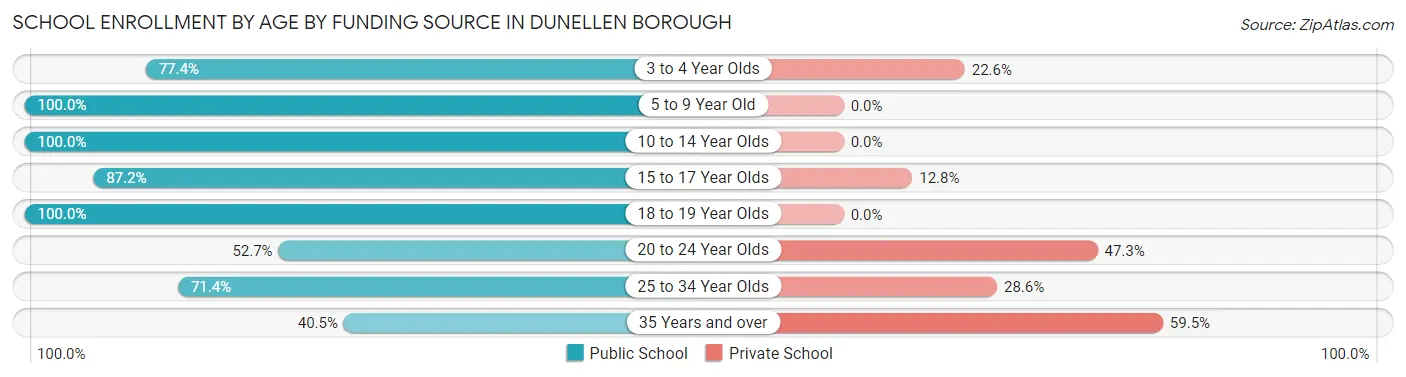
Out of a total of 2,194 students who are enrolled in schools in Dunellen borough, 296 (13.5%) attend a private institution, while the remaining 1,898 (86.5%) are enrolled in public schools. The age group of 35 years and over has the highest likelihood of being enrolled in private schools, with 110 (59.5% in the age bracket) enrolled. Conversely, the age group of 5 to 9 year old has the lowest likelihood of being enrolled in a private school, with 487 (100.0% in the age bracket) attending a public institution.
| Age Bracket | Public School | Private School |
| 3 to 4 Year Olds | 127 (77.4%) | 37 (22.6%) |
| 5 to 9 Year Old | 487 (100.0%) | 0 (0.0%) |
| 10 to 14 Year Olds | 623 (100.0%) | 0 (0.0%) |
| 15 to 17 Year Olds | 259 (87.2%) | 38 (12.8%) |
| 18 to 19 Year Olds | 170 (100.0%) | 0 (0.0%) |
| 20 to 24 Year Olds | 97 (52.7%) | 87 (47.3%) |
| 25 to 34 Year Olds | 60 (71.4%) | 24 (28.6%) |
| 35 Years and over | 75 (40.5%) | 110 (59.5%) |
| Total | 1,898 (86.5%) | 296 (13.5%) |
Educational Attainment by Field of Study in Dunellen borough
Engineering (327 | 19.2%), business (289 | 17.0%), computers & mathematics (274 | 16.1%), education (216 | 12.7%), and psychology (139 | 8.2%) are the most common fields of study among 1,701 individuals in Dunellen borough who have obtained a bachelor's degree or higher.
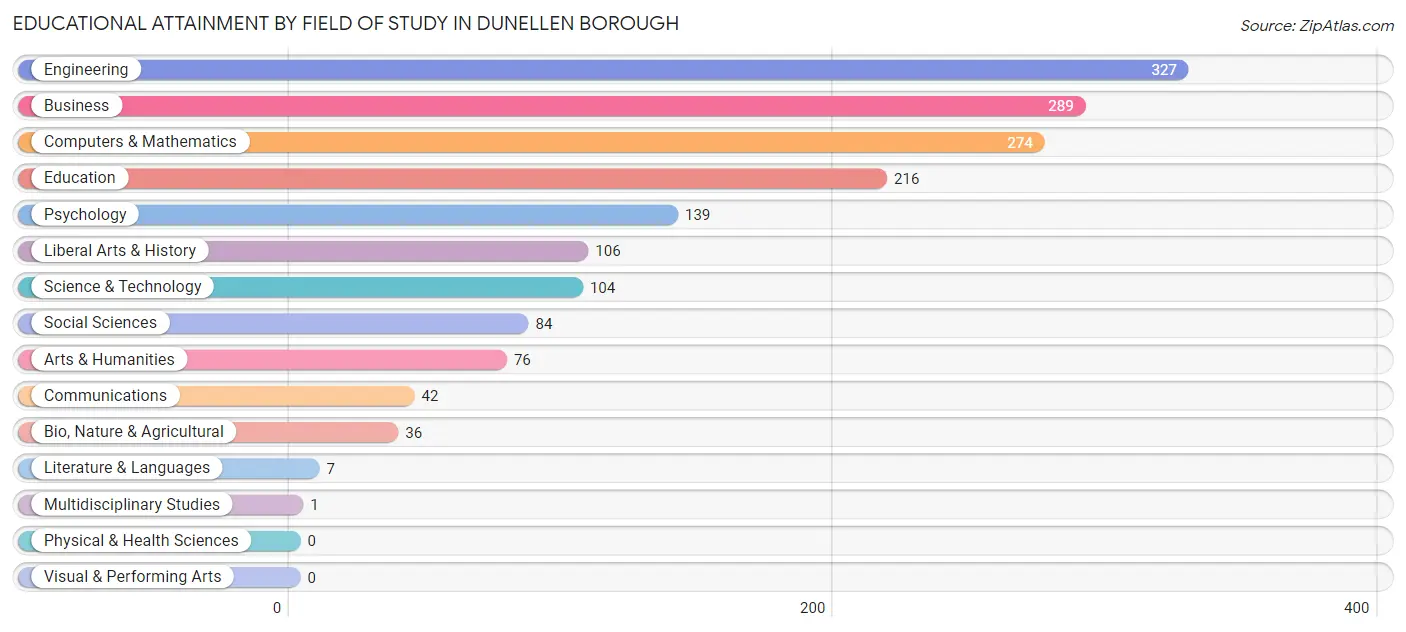
| Field of Study | # Graduates | % Graduates |
| Computers & Mathematics | 274 | 16.1% |
| Bio, Nature & Agricultural | 36 | 2.1% |
| Physical & Health Sciences | 0 | 0.0% |
| Psychology | 139 | 8.2% |
| Social Sciences | 84 | 4.9% |
| Engineering | 327 | 19.2% |
| Multidisciplinary Studies | 1 | 0.1% |
| Science & Technology | 104 | 6.1% |
| Business | 289 | 17.0% |
| Education | 216 | 12.7% |
| Literature & Languages | 7 | 0.4% |
| Liberal Arts & History | 106 | 6.2% |
| Visual & Performing Arts | 0 | 0.0% |
| Communications | 42 | 2.5% |
| Arts & Humanities | 76 | 4.5% |
| Total | 1,701 | 100.0% |
Transportation & Commute in Dunellen borough
Vehicle Availability by Sex in Dunellen borough
The most prevalent vehicle ownership categories in Dunellen borough are males with 2 vehicles (1,128, accounting for 52.1%) and females with 2 vehicles (766, making up 86.0%).
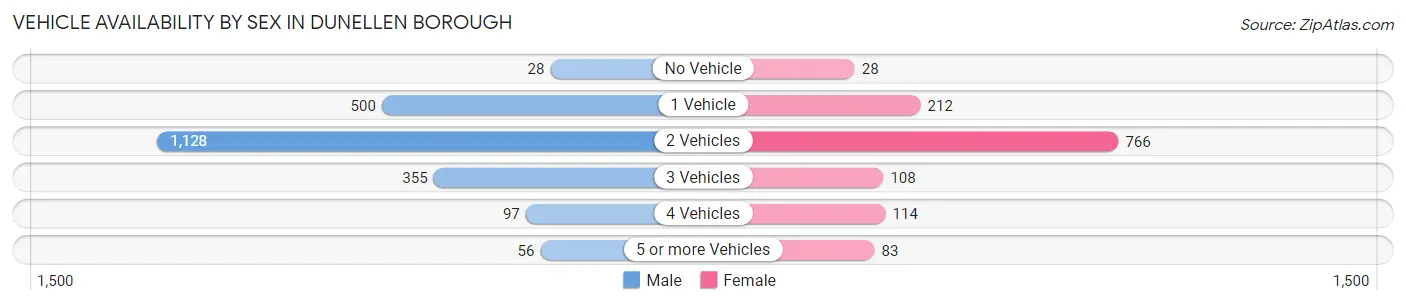
| Vehicles Available | Male | Female |
| No Vehicle | 28 (1.3%) | 28 (2.1%) |
| 1 Vehicle | 500 (23.1%) | 212 (16.2%) |
| 2 Vehicles | 1,128 (52.1%) | 766 (58.4%) |
| 3 Vehicles | 355 (16.4%) | 108 (8.2%) |
| 4 Vehicles | 97 (4.5%) | 114 (8.7%) |
| 5 or more Vehicles | 56 (2.6%) | 83 (6.3%) |
| Total | 2,164 (100.0%) | 1,311 (100.0%) |
Commute Time in Dunellen borough
The most frequently occuring commute durations in Dunellen borough are 15 to 19 minutes (759 commuters, 23.1%), 20 to 24 minutes (542 commuters, 16.5%), and 30 to 34 minutes (322 commuters, 9.8%).
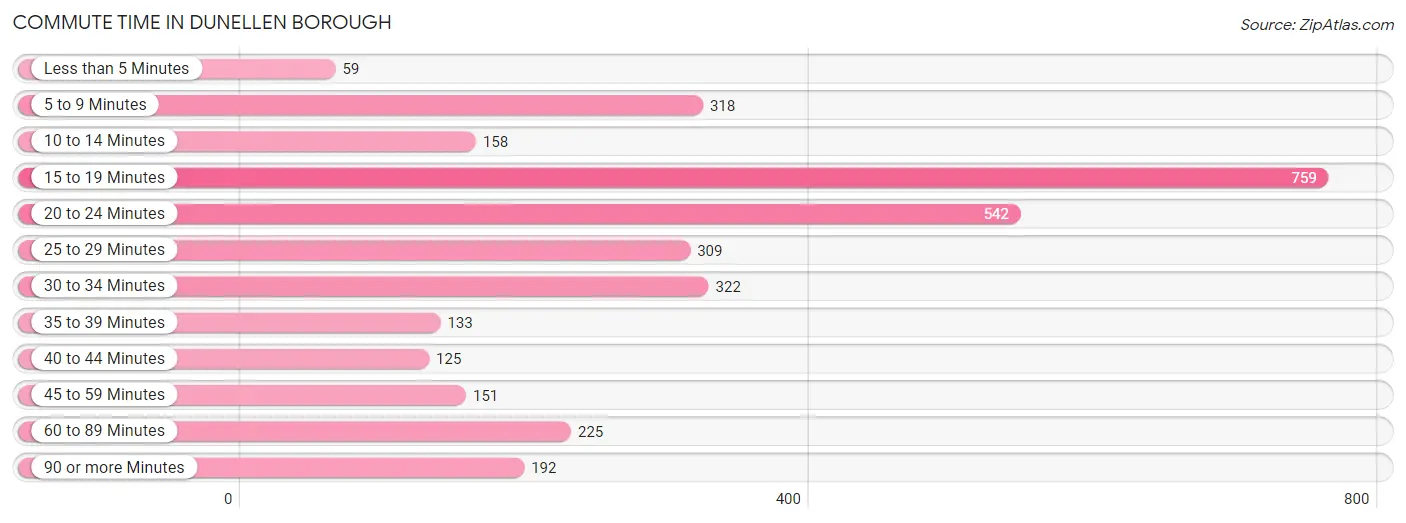
| Commute Time | # Commuters | % Commuters |
| Less than 5 Minutes | 59 | 1.8% |
| 5 to 9 Minutes | 318 | 9.7% |
| 10 to 14 Minutes | 158 | 4.8% |
| 15 to 19 Minutes | 759 | 23.1% |
| 20 to 24 Minutes | 542 | 16.5% |
| 25 to 29 Minutes | 309 | 9.4% |
| 30 to 34 Minutes | 322 | 9.8% |
| 35 to 39 Minutes | 133 | 4.0% |
| 40 to 44 Minutes | 125 | 3.8% |
| 45 to 59 Minutes | 151 | 4.6% |
| 60 to 89 Minutes | 225 | 6.8% |
| 90 or more Minutes | 192 | 5.8% |
Commute Time by Sex in Dunellen borough
The most common commute times in Dunellen borough are 15 to 19 minutes (480 commuters, 23.4%) for males and 5 to 9 minutes (318 commuters, 25.6%) for females.
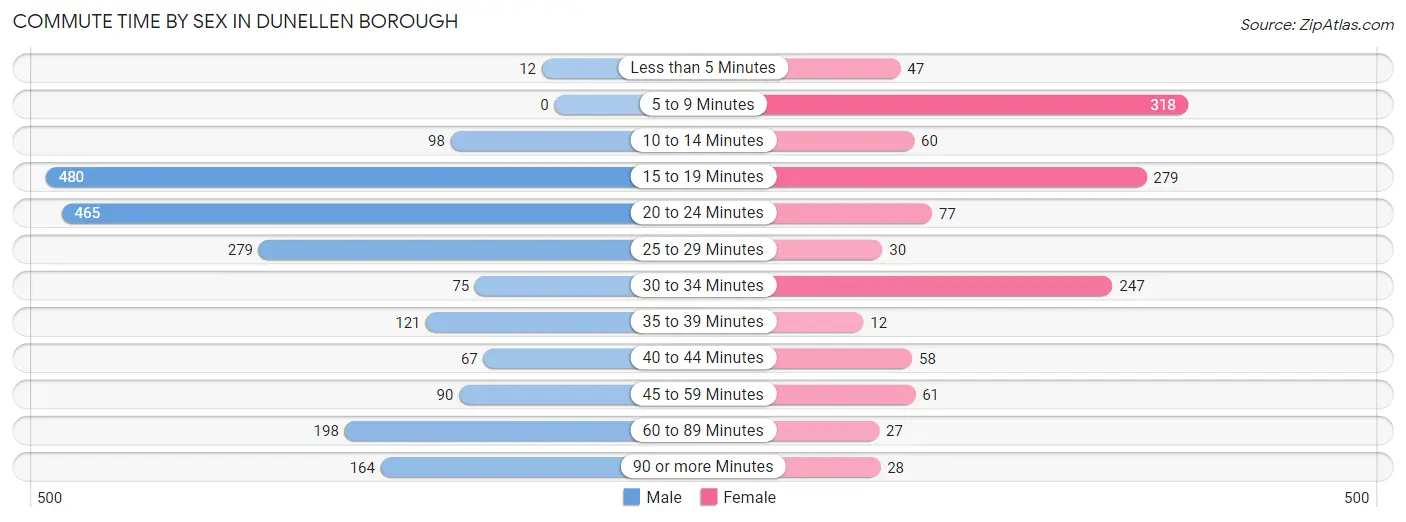
| Commute Time | Male | Female |
| Less than 5 Minutes | 12 (0.6%) | 47 (3.8%) |
| 5 to 9 Minutes | 0 (0.0%) | 318 (25.6%) |
| 10 to 14 Minutes | 98 (4.8%) | 60 (4.8%) |
| 15 to 19 Minutes | 480 (23.4%) | 279 (22.4%) |
| 20 to 24 Minutes | 465 (22.7%) | 77 (6.2%) |
| 25 to 29 Minutes | 279 (13.6%) | 30 (2.4%) |
| 30 to 34 Minutes | 75 (3.7%) | 247 (19.9%) |
| 35 to 39 Minutes | 121 (5.9%) | 12 (1.0%) |
| 40 to 44 Minutes | 67 (3.3%) | 58 (4.7%) |
| 45 to 59 Minutes | 90 (4.4%) | 61 (4.9%) |
| 60 to 89 Minutes | 198 (9.7%) | 27 (2.2%) |
| 90 or more Minutes | 164 (8.0%) | 28 (2.2%) |
Time of Departure to Work by Sex in Dunellen borough
The most frequent times of departure to work in Dunellen borough are 6:00 AM to 6:29 AM (323, 15.8%) for males and 6:30 AM to 6:59 AM (234, 18.8%) for females.
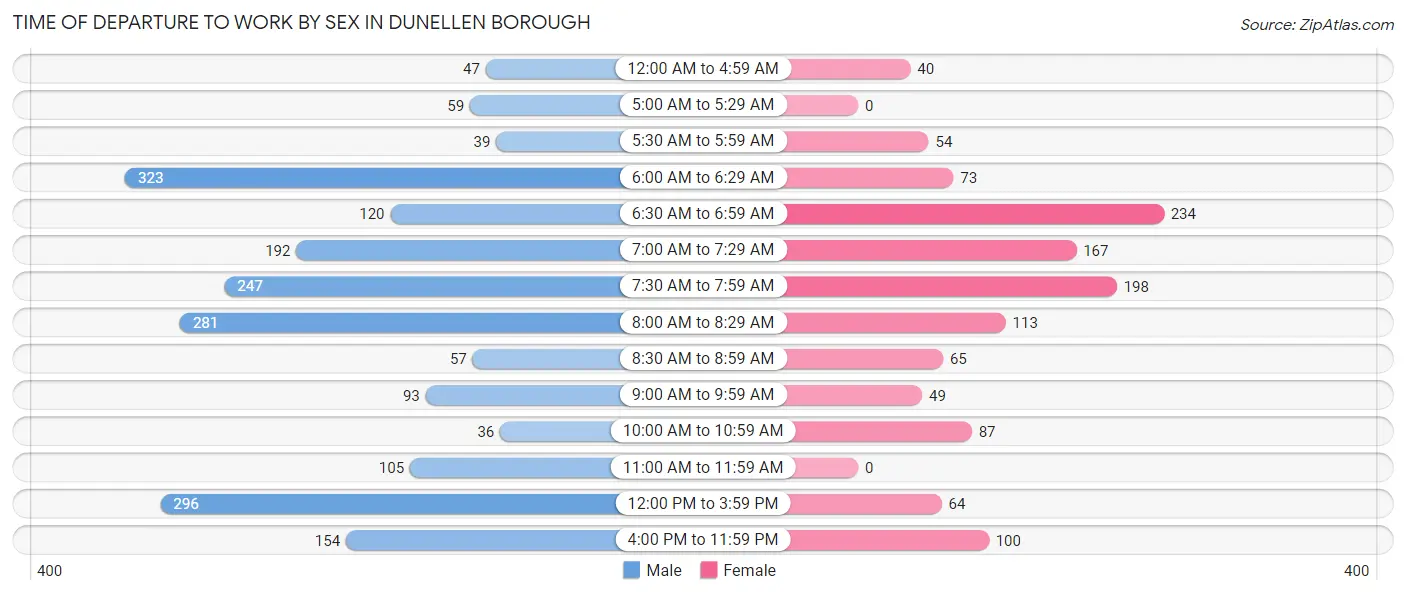
| Time of Departure | Male | Female |
| 12:00 AM to 4:59 AM | 47 (2.3%) | 40 (3.2%) |
| 5:00 AM to 5:29 AM | 59 (2.9%) | 0 (0.0%) |
| 5:30 AM to 5:59 AM | 39 (1.9%) | 54 (4.3%) |
| 6:00 AM to 6:29 AM | 323 (15.8%) | 73 (5.9%) |
| 6:30 AM to 6:59 AM | 120 (5.9%) | 234 (18.8%) |
| 7:00 AM to 7:29 AM | 192 (9.4%) | 167 (13.4%) |
| 7:30 AM to 7:59 AM | 247 (12.0%) | 198 (15.9%) |
| 8:00 AM to 8:29 AM | 281 (13.7%) | 113 (9.1%) |
| 8:30 AM to 8:59 AM | 57 (2.8%) | 65 (5.2%) |
| 9:00 AM to 9:59 AM | 93 (4.5%) | 49 (3.9%) |
| 10:00 AM to 10:59 AM | 36 (1.8%) | 87 (7.0%) |
| 11:00 AM to 11:59 AM | 105 (5.1%) | 0 (0.0%) |
| 12:00 PM to 3:59 PM | 296 (14.4%) | 64 (5.1%) |
| 4:00 PM to 11:59 PM | 154 (7.5%) | 100 (8.0%) |
| Total | 2,049 (100.0%) | 1,244 (100.0%) |
Housing Occupancy in Dunellen borough
Occupancy by Ownership in Dunellen borough
Of the total 2,446 dwellings in Dunellen borough, owner-occupied units account for 1,539 (62.9%), while renter-occupied units make up 907 (37.1%).
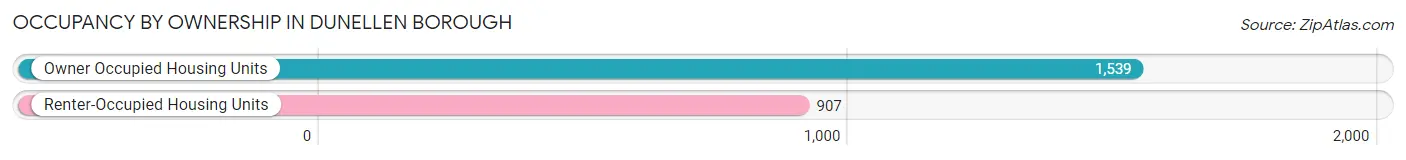
| Occupancy | # Housing Units | % Housing Units |
| Owner Occupied Housing Units | 1,539 | 62.9% |
| Renter-Occupied Housing Units | 907 | 37.1% |
| Total Occupied Housing Units | 2,446 | 100.0% |
Occupancy by Household Size in Dunellen borough
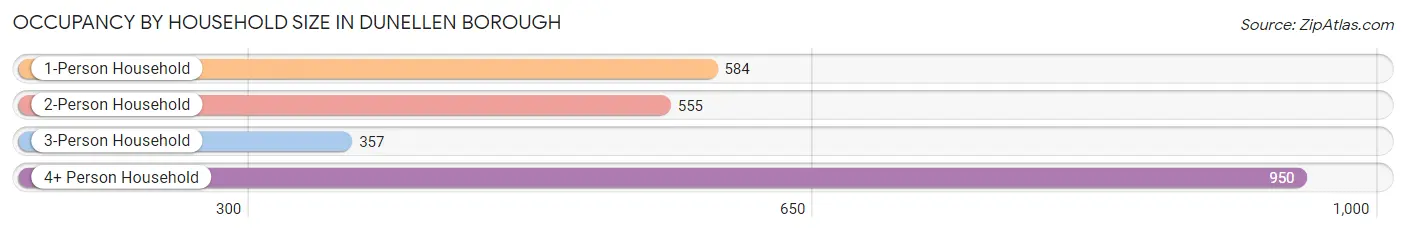
| Household Size | # Housing Units | % Housing Units |
| 1-Person Household | 584 | 23.9% |
| 2-Person Household | 555 | 22.7% |
| 3-Person Household | 357 | 14.6% |
| 4+ Person Household | 950 | 38.8% |
| Total Housing Units | 2,446 | 100.0% |
Occupancy by Ownership by Household Size in Dunellen borough
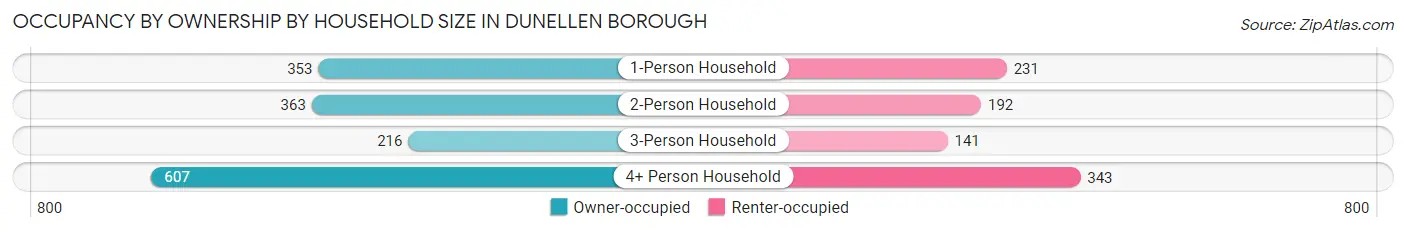
| Household Size | Owner-occupied | Renter-occupied |
| 1-Person Household | 353 (60.5%) | 231 (39.6%) |
| 2-Person Household | 363 (65.4%) | 192 (34.6%) |
| 3-Person Household | 216 (60.5%) | 141 (39.5%) |
| 4+ Person Household | 607 (63.9%) | 343 (36.1%) |
| Total Housing Units | 1,539 (62.9%) | 907 (37.1%) |
Occupancy by Educational Attainment in Dunellen borough
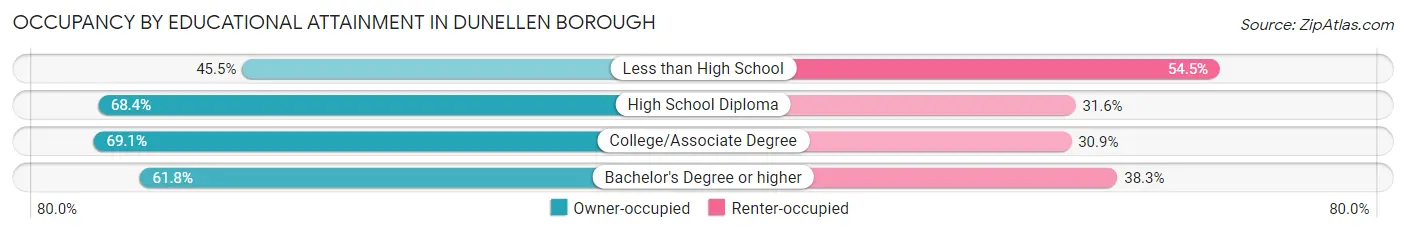
| Household Size | Owner-occupied | Renter-occupied |
| Less than High School | 146 (45.5%) | 175 (54.5%) |
| High School Diploma | 528 (68.4%) | 244 (31.6%) |
| College/Associate Degree | 279 (69.1%) | 125 (30.9%) |
| Bachelor's Degree or higher | 586 (61.8%) | 363 (38.3%) |
Occupancy by Age of Householder in Dunellen borough
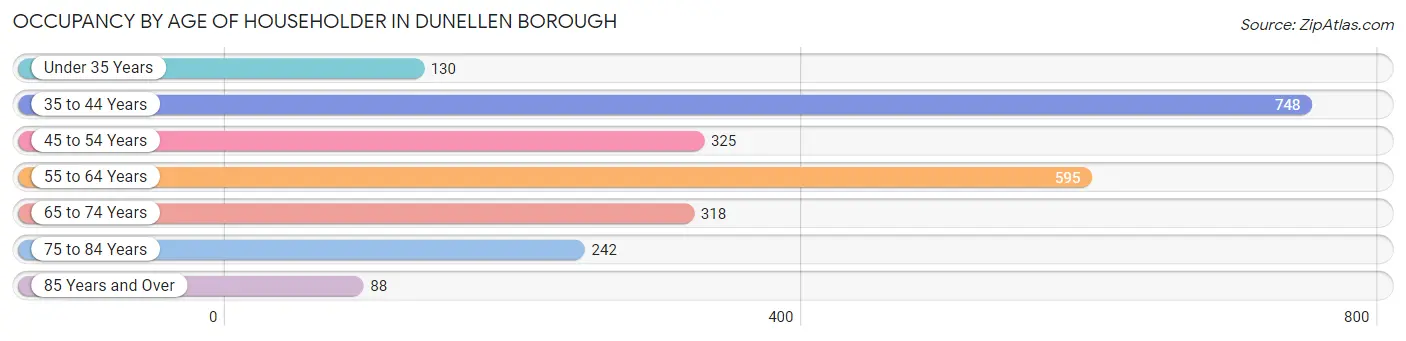
| Age Bracket | # Households | % Households |
| Under 35 Years | 130 | 5.3% |
| 35 to 44 Years | 748 | 30.6% |
| 45 to 54 Years | 325 | 13.3% |
| 55 to 64 Years | 595 | 24.3% |
| 65 to 74 Years | 318 | 13.0% |
| 75 to 84 Years | 242 | 9.9% |
| 85 Years and Over | 88 | 3.6% |
| Total | 2,446 | 100.0% |
Housing Finances in Dunellen borough
Median Income by Occupancy in Dunellen borough
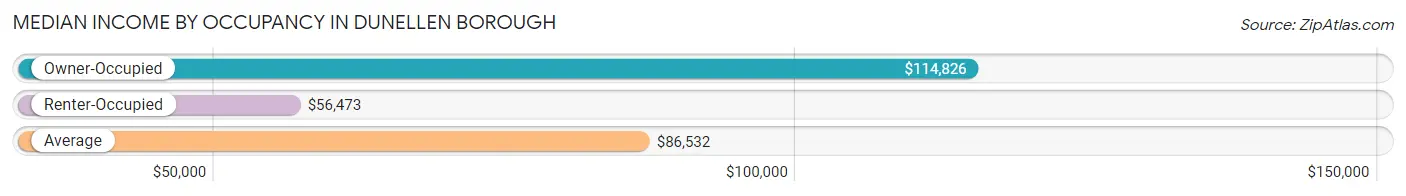
| Occupancy Type | # Households | Median Income |
| Owner-Occupied | 1,539 (62.9%) | $114,826 |
| Renter-Occupied | 907 (37.1%) | $56,473 |
| Average | 2,446 (100.0%) | $86,532 |
Occupancy by Householder Income Bracket in Dunellen borough
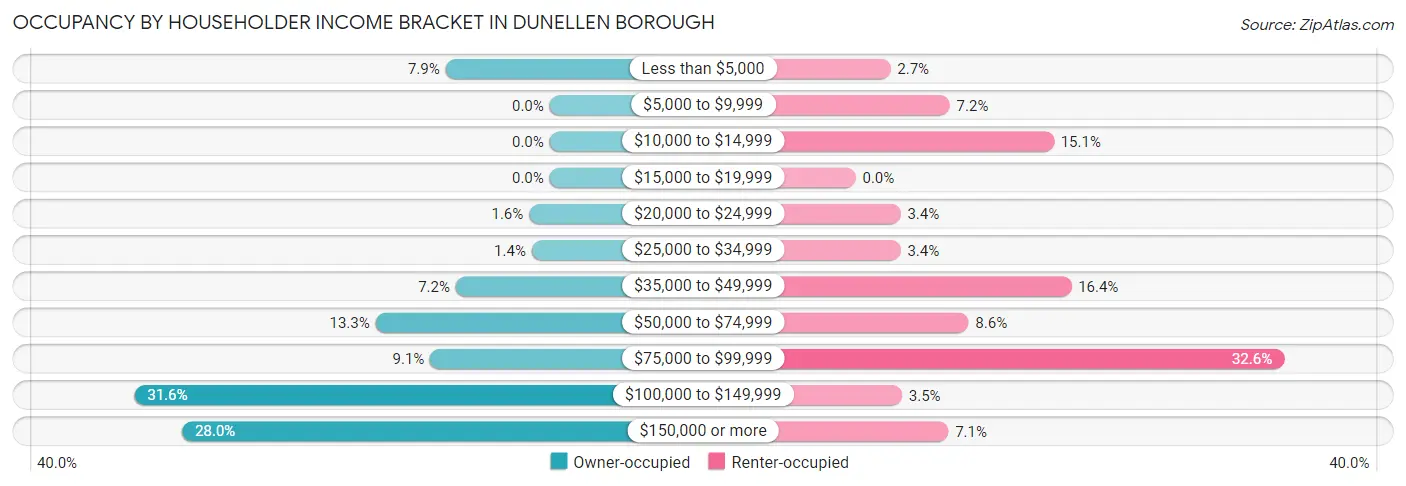
| Income Bracket | Owner-occupied | Renter-occupied |
| Less than $5,000 | 122 (7.9%) | 24 (2.6%) |
| $5,000 to $9,999 | 0 (0.0%) | 65 (7.2%) |
| $10,000 to $14,999 | 0 (0.0%) | 137 (15.1%) |
| $15,000 to $19,999 | 0 (0.0%) | 0 (0.0%) |
| $20,000 to $24,999 | 24 (1.6%) | 31 (3.4%) |
| $25,000 to $34,999 | 21 (1.4%) | 31 (3.4%) |
| $35,000 to $49,999 | 110 (7.1%) | 149 (16.4%) |
| $50,000 to $74,999 | 204 (13.3%) | 78 (8.6%) |
| $75,000 to $99,999 | 140 (9.1%) | 296 (32.6%) |
| $100,000 to $149,999 | 487 (31.6%) | 32 (3.5%) |
| $150,000 or more | 431 (28.0%) | 64 (7.1%) |
| Total | 1,539 (100.0%) | 907 (100.0%) |
Monthly Housing Cost Tiers in Dunellen borough
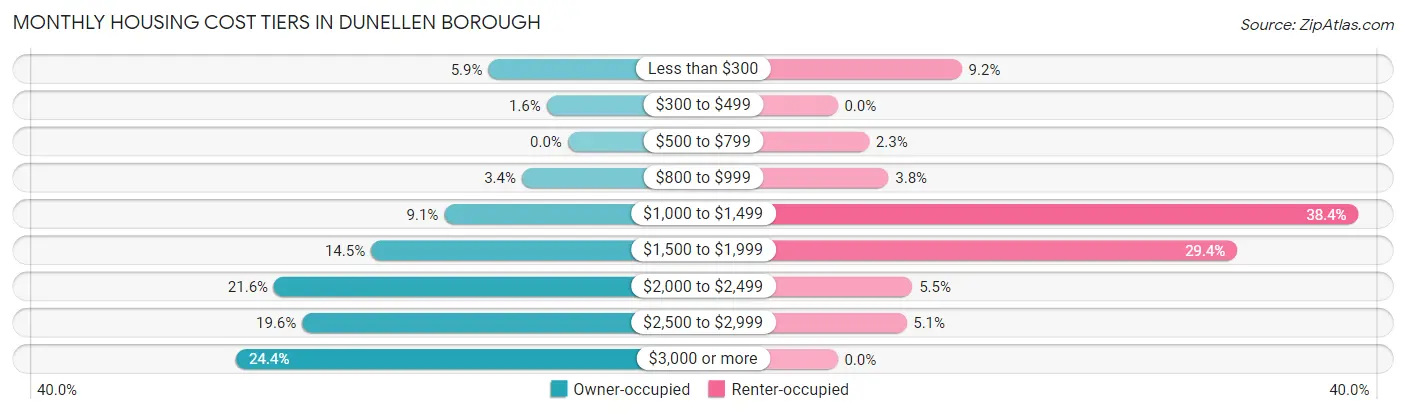
| Monthly Cost | Owner-occupied | Renter-occupied |
| Less than $300 | 90 (5.9%) | 83 (9.1%) |
| $300 to $499 | 24 (1.6%) | 0 (0.0%) |
| $500 to $799 | 0 (0.0%) | 21 (2.3%) |
| $800 to $999 | 52 (3.4%) | 34 (3.7%) |
| $1,000 to $1,499 | 140 (9.1%) | 348 (38.4%) |
| $1,500 to $1,999 | 223 (14.5%) | 267 (29.4%) |
| $2,000 to $2,499 | 333 (21.6%) | 50 (5.5%) |
| $2,500 to $2,999 | 301 (19.6%) | 46 (5.1%) |
| $3,000 or more | 376 (24.4%) | 0 (0.0%) |
| Total | 1,539 (100.0%) | 907 (100.0%) |
Physical Housing Characteristics in Dunellen borough
Housing Structures in Dunellen borough
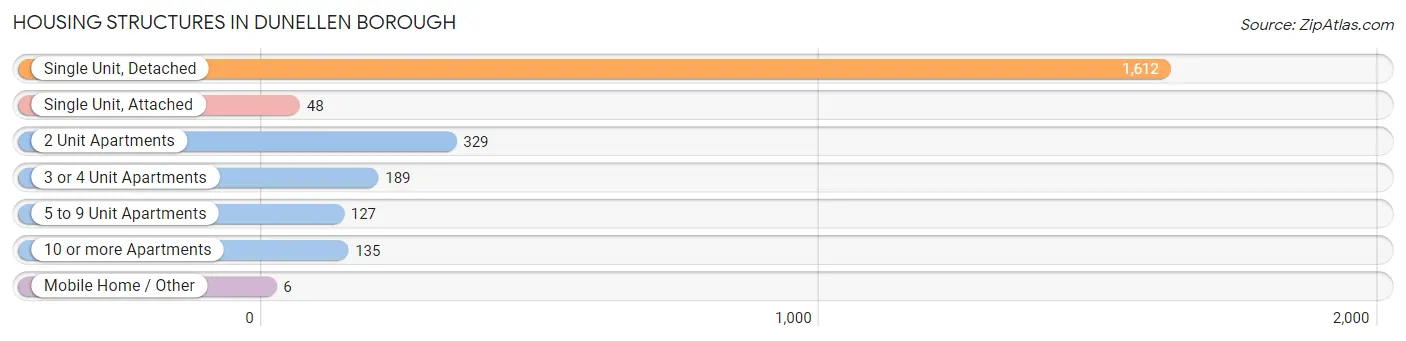
| Structure Type | # Housing Units | % Housing Units |
| Single Unit, Detached | 1,612 | 65.9% |
| Single Unit, Attached | 48 | 2.0% |
| 2 Unit Apartments | 329 | 13.5% |
| 3 or 4 Unit Apartments | 189 | 7.7% |
| 5 to 9 Unit Apartments | 127 | 5.2% |
| 10 or more Apartments | 135 | 5.5% |
| Mobile Home / Other | 6 | 0.3% |
| Total | 2,446 | 100.0% |
Housing Structures by Occupancy in Dunellen borough
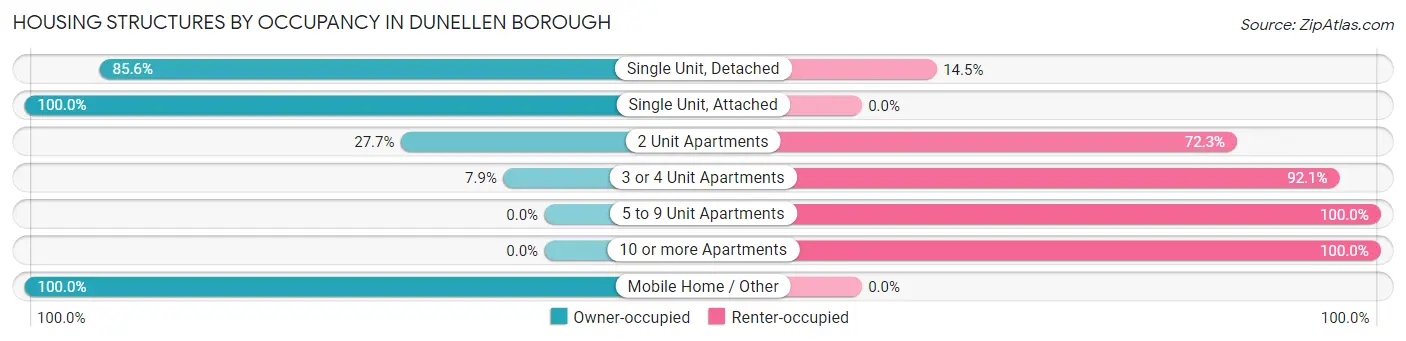
| Structure Type | Owner-occupied | Renter-occupied |
| Single Unit, Detached | 1,379 (85.6%) | 233 (14.4%) |
| Single Unit, Attached | 48 (100.0%) | 0 (0.0%) |
| 2 Unit Apartments | 91 (27.7%) | 238 (72.3%) |
| 3 or 4 Unit Apartments | 15 (7.9%) | 174 (92.1%) |
| 5 to 9 Unit Apartments | 0 (0.0%) | 127 (100.0%) |
| 10 or more Apartments | 0 (0.0%) | 135 (100.0%) |
| Mobile Home / Other | 6 (100.0%) | 0 (0.0%) |
| Total | 1,539 (62.9%) | 907 (37.1%) |
Housing Structures by Number of Rooms in Dunellen borough
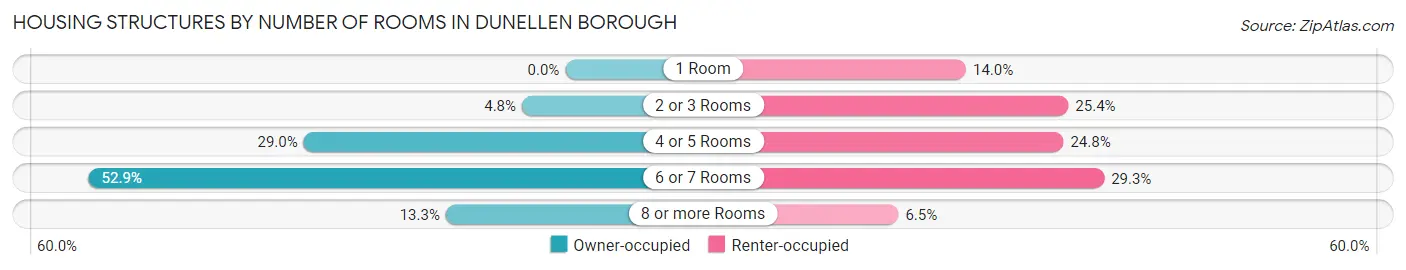
| Number of Rooms | Owner-occupied | Renter-occupied |
| 1 Room | 0 (0.0%) | 127 (14.0%) |
| 2 or 3 Rooms | 74 (4.8%) | 230 (25.4%) |
| 4 or 5 Rooms | 447 (29.0%) | 225 (24.8%) |
| 6 or 7 Rooms | 814 (52.9%) | 266 (29.3%) |
| 8 or more Rooms | 204 (13.3%) | 59 (6.5%) |
| Total | 1,539 (100.0%) | 907 (100.0%) |
Housing Structure by Heating Type in Dunellen borough
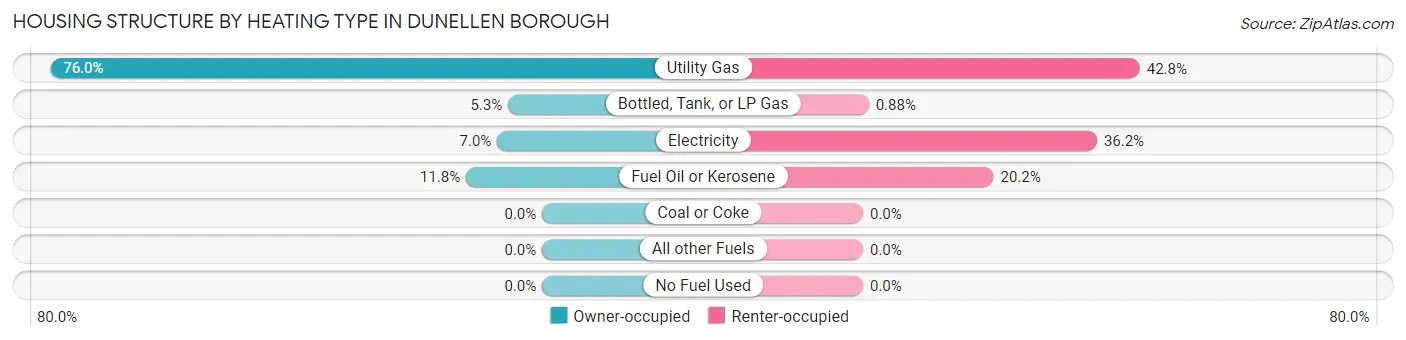
| Heating Type | Owner-occupied | Renter-occupied |
| Utility Gas | 1,170 (76.0%) | 388 (42.8%) |
| Bottled, Tank, or LP Gas | 81 (5.3%) | 8 (0.9%) |
| Electricity | 107 (7.0%) | 328 (36.2%) |
| Fuel Oil or Kerosene | 181 (11.8%) | 183 (20.2%) |
| Coal or Coke | 0 (0.0%) | 0 (0.0%) |
| All other Fuels | 0 (0.0%) | 0 (0.0%) |
| No Fuel Used | 0 (0.0%) | 0 (0.0%) |
| Total | 1,539 (100.0%) | 907 (100.0%) |
Household Vehicle Usage in Dunellen borough
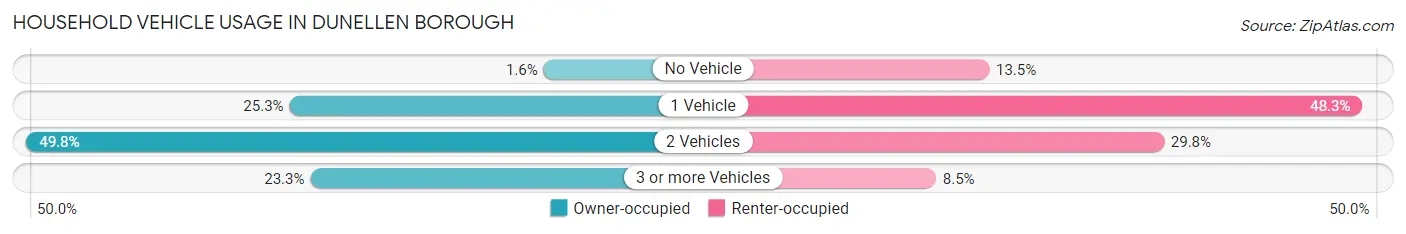
| Vehicles per Household | Owner-occupied | Renter-occupied |
| No Vehicle | 24 (1.6%) | 122 (13.5%) |
| 1 Vehicle | 389 (25.3%) | 438 (48.3%) |
| 2 Vehicles | 767 (49.8%) | 270 (29.8%) |
| 3 or more Vehicles | 359 (23.3%) | 77 (8.5%) |
| Total | 1,539 (100.0%) | 907 (100.0%) |
Real Estate & Mortgages in Dunellen borough
Real Estate and Mortgage Overview in Dunellen borough
| Characteristic | Without Mortgage | With Mortgage |
| Housing Units | 323 | 1,216 |
| Median Property Value | $272,300 | $390,100 |
| Median Household Income | $115,431 | $394 |
| Monthly Housing Costs | $1,105 | $376 |
| Real Estate Taxes | $9,272 | $16 |
Property Value by Mortgage Status in Dunellen borough
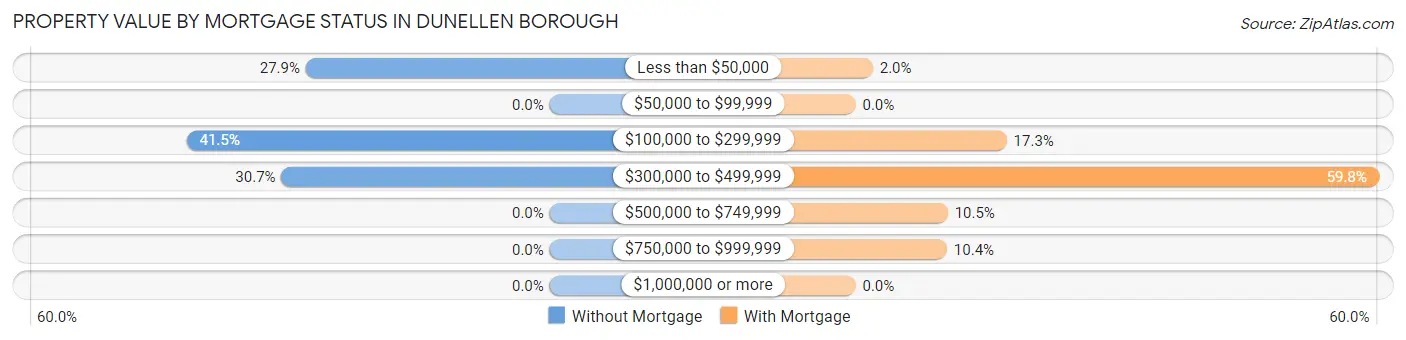
| Property Value | Without Mortgage | With Mortgage |
| Less than $50,000 | 90 (27.9%) | 24 (2.0%) |
| $50,000 to $99,999 | 0 (0.0%) | 0 (0.0%) |
| $100,000 to $299,999 | 134 (41.5%) | 210 (17.3%) |
| $300,000 to $499,999 | 99 (30.6%) | 727 (59.8%) |
| $500,000 to $749,999 | 0 (0.0%) | 128 (10.5%) |
| $750,000 to $999,999 | 0 (0.0%) | 127 (10.4%) |
| $1,000,000 or more | 0 (0.0%) | 0 (0.0%) |
| Total | 323 (100.0%) | 1,216 (100.0%) |
Household Income by Mortgage Status in Dunellen borough
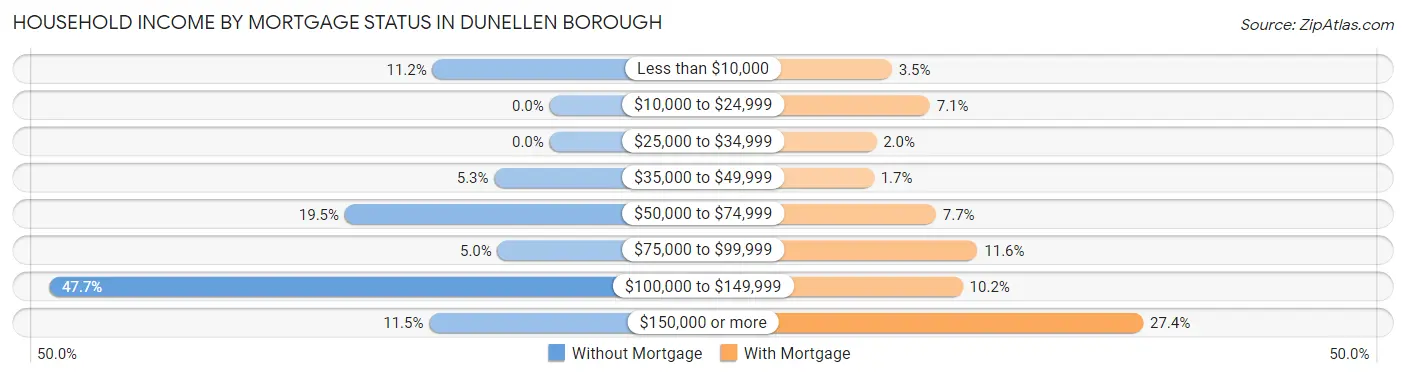
| Household Income | Without Mortgage | With Mortgage |
| Less than $10,000 | 36 (11.2%) | 42 (3.5%) |
| $10,000 to $24,999 | 0 (0.0%) | 86 (7.1%) |
| $25,000 to $34,999 | 0 (0.0%) | 24 (2.0%) |
| $35,000 to $49,999 | 17 (5.3%) | 21 (1.7%) |
| $50,000 to $74,999 | 63 (19.5%) | 93 (7.6%) |
| $75,000 to $99,999 | 16 (5.0%) | 141 (11.6%) |
| $100,000 to $149,999 | 154 (47.7%) | 124 (10.2%) |
| $150,000 or more | 37 (11.5%) | 333 (27.4%) |
| Total | 323 (100.0%) | 1,216 (100.0%) |
Property Value to Household Income Ratio in Dunellen borough
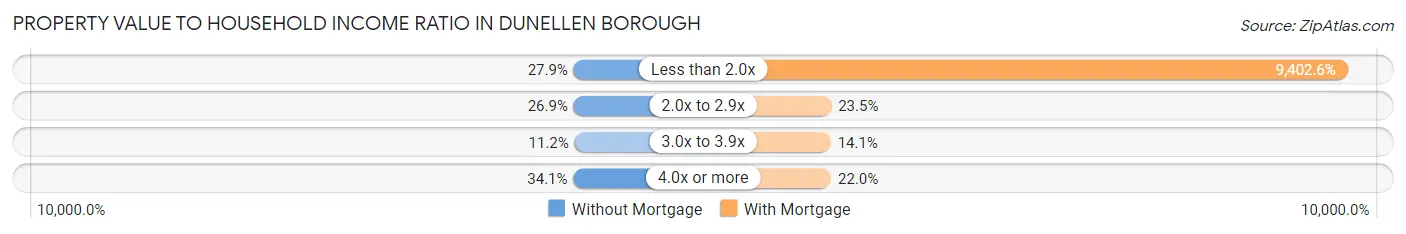
| Value-to-Income Ratio | Without Mortgage | With Mortgage |
| Less than 2.0x | 90 (27.9%) | 114,335 (9,402.5%) |
| 2.0x to 2.9x | 87 (26.9%) | 286 (23.5%) |
| 3.0x to 3.9x | 36 (11.2%) | 172 (14.1%) |
| 4.0x or more | 110 (34.1%) | 267 (22.0%) |
| Total | 323 (100.0%) | 1,216 (100.0%) |
Real Estate Taxes by Mortgage Status in Dunellen borough
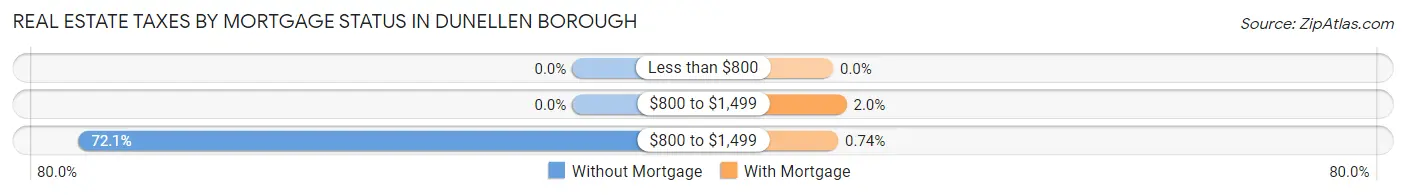
| Property Taxes | Without Mortgage | With Mortgage |
| Less than $800 | 0 (0.0%) | 0 (0.0%) |
| $800 to $1,499 | 0 (0.0%) | 24 (2.0%) |
| $800 to $1,499 | 233 (72.1%) | 9 (0.7%) |
| Total | 323 (100.0%) | 1,216 (100.0%) |
Health & Disability in Dunellen borough
Health Insurance Coverage by Age in Dunellen borough
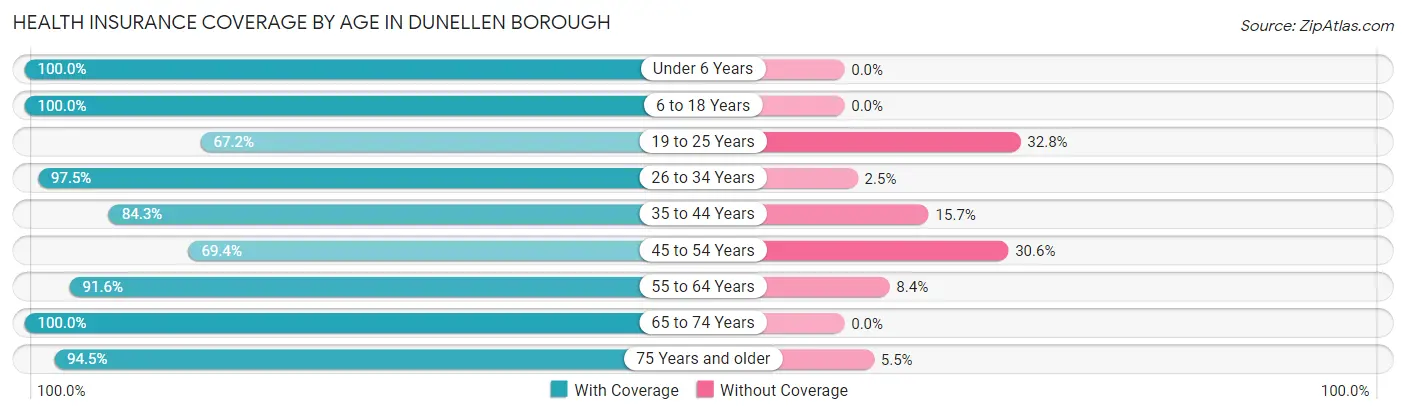
| Age Bracket | With Coverage | Without Coverage |
| Under 6 Years | 386 (100.0%) | 0 (0.0%) |
| 6 to 18 Years | 1,604 (100.0%) | 0 (0.0%) |
| 19 to 25 Years | 458 (67.2%) | 224 (32.8%) |
| 26 to 34 Years | 470 (97.5%) | 12 (2.5%) |
| 35 to 44 Years | 1,361 (84.3%) | 254 (15.7%) |
| 45 to 54 Years | 436 (69.4%) | 192 (30.6%) |
| 55 to 64 Years | 1,132 (91.6%) | 104 (8.4%) |
| 65 to 74 Years | 475 (100.0%) | 0 (0.0%) |
| 75 Years and older | 463 (94.5%) | 27 (5.5%) |
| Total | 6,785 (89.3%) | 813 (10.7%) |
Health Insurance Coverage by Citizenship Status in Dunellen borough
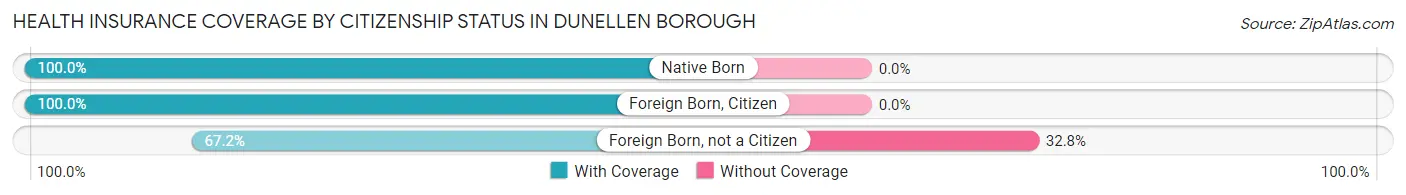
| Citizenship Status | With Coverage | Without Coverage |
| Native Born | 386 (100.0%) | 0 (0.0%) |
| Foreign Born, Citizen | 1,604 (100.0%) | 0 (0.0%) |
| Foreign Born, not a Citizen | 458 (67.2%) | 224 (32.8%) |
Health Insurance Coverage by Household Income in Dunellen borough
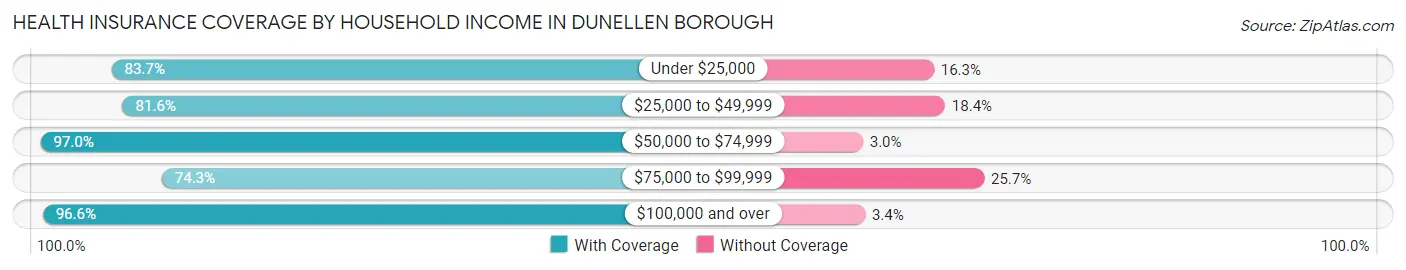
| Household Income | With Coverage | Without Coverage |
| Under $25,000 | 693 (83.7%) | 135 (16.3%) |
| $25,000 to $49,999 | 684 (81.6%) | 154 (18.4%) |
| $50,000 to $74,999 | 776 (97.0%) | 24 (3.0%) |
| $75,000 to $99,999 | 1,086 (74.3%) | 376 (25.7%) |
| $100,000 and over | 3,519 (96.6%) | 124 (3.4%) |
Public vs Private Health Insurance Coverage by Age in Dunellen borough
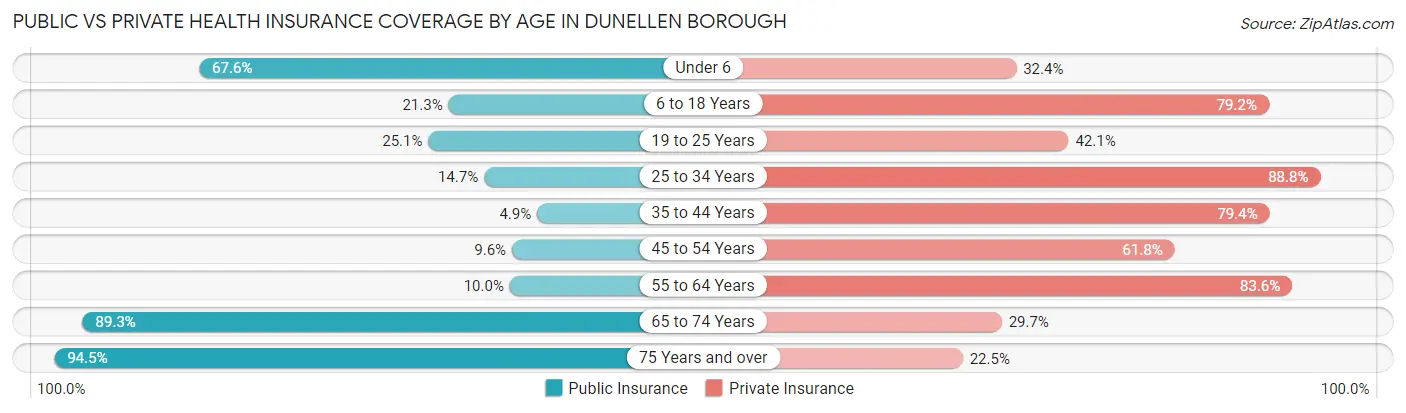
| Age Bracket | Public Insurance | Private Insurance |
| Under 6 | 261 (67.6%) | 125 (32.4%) |
| 6 to 18 Years | 342 (21.3%) | 1,271 (79.2%) |
| 19 to 25 Years | 171 (25.1%) | 287 (42.1%) |
| 25 to 34 Years | 71 (14.7%) | 428 (88.8%) |
| 35 to 44 Years | 79 (4.9%) | 1,282 (79.4%) |
| 45 to 54 Years | 60 (9.6%) | 388 (61.8%) |
| 55 to 64 Years | 123 (10.0%) | 1,033 (83.6%) |
| 65 to 74 Years | 424 (89.3%) | 141 (29.7%) |
| 75 Years and over | 463 (94.5%) | 110 (22.5%) |
| Total | 1,994 (26.2%) | 5,065 (66.7%) |
Disability Status by Sex by Age in Dunellen borough
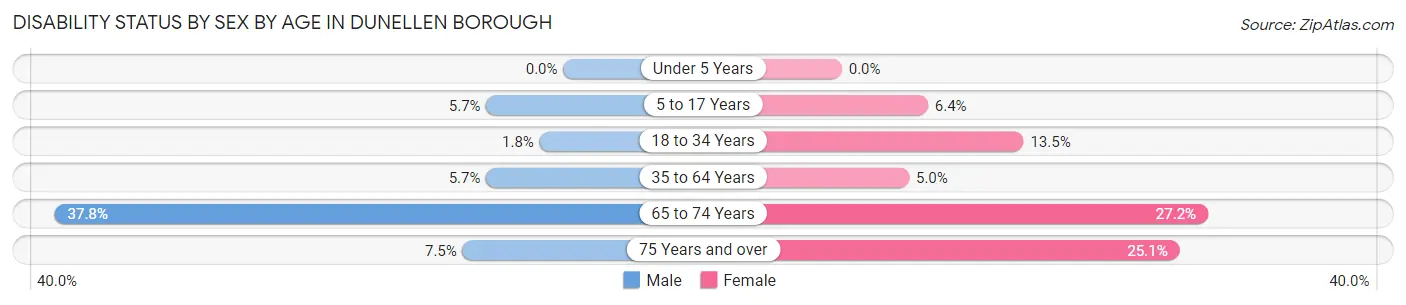
| Age Bracket | Male | Female |
| Under 5 Years | 0 (0.0%) | 0 (0.0%) |
| 5 to 17 Years | 48 (5.7%) | 50 (6.4%) |
| 18 to 34 Years | 15 (1.8%) | 53 (13.5%) |
| 35 to 64 Years | 105 (5.7%) | 82 (5.0%) |
| 65 to 74 Years | 71 (37.8%) | 78 (27.2%) |
| 75 Years and over | 11 (7.5%) | 86 (25.1%) |
Disability Class by Sex by Age in Dunellen borough
Disability Class: Hearing Difficulty
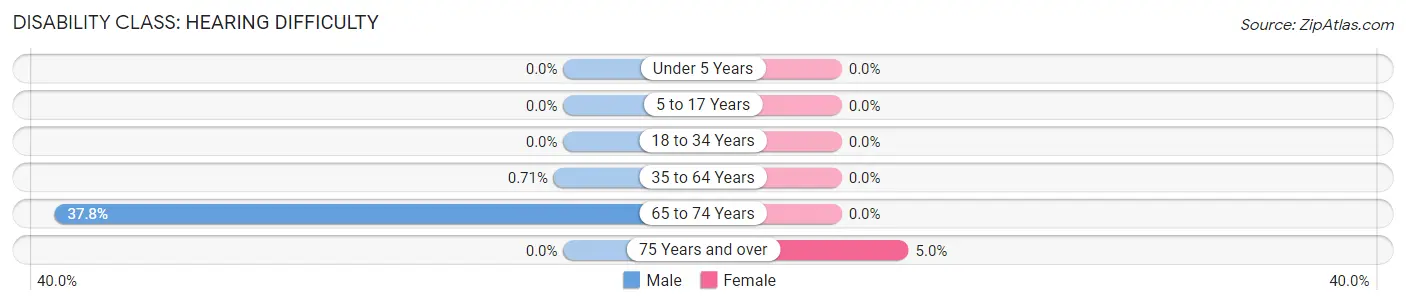
| Age Bracket | Male | Female |
| Under 5 Years | 0 (0.0%) | 0 (0.0%) |
| 5 to 17 Years | 0 (0.0%) | 0 (0.0%) |
| 18 to 34 Years | 0 (0.0%) | 0 (0.0%) |
| 35 to 64 Years | 13 (0.7%) | 0 (0.0%) |
| 65 to 74 Years | 71 (37.8%) | 0 (0.0%) |
| 75 Years and over | 0 (0.0%) | 17 (5.0%) |
Disability Class: Vision Difficulty
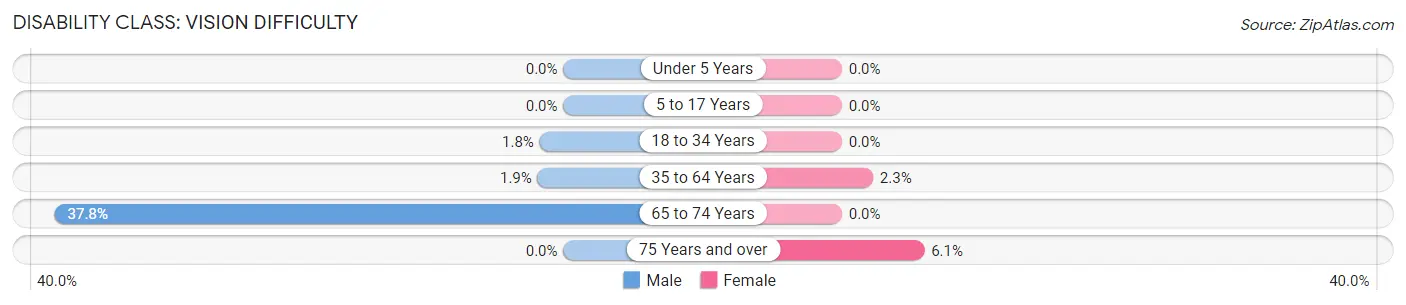
| Age Bracket | Male | Female |
| Under 5 Years | 0 (0.0%) | 0 (0.0%) |
| 5 to 17 Years | 0 (0.0%) | 0 (0.0%) |
| 18 to 34 Years | 15 (1.8%) | 0 (0.0%) |
| 35 to 64 Years | 35 (1.9%) | 38 (2.3%) |
| 65 to 74 Years | 71 (37.8%) | 0 (0.0%) |
| 75 Years and over | 0 (0.0%) | 21 (6.1%) |
Disability Class: Cognitive Difficulty
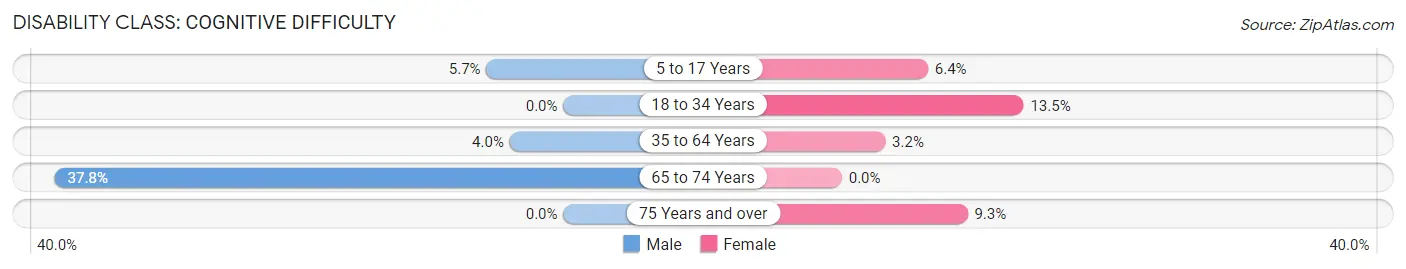
| Age Bracket | Male | Female |
| 5 to 17 Years | 48 (5.7%) | 50 (6.4%) |
| 18 to 34 Years | 0 (0.0%) | 53 (13.5%) |
| 35 to 64 Years | 73 (4.0%) | 53 (3.2%) |
| 65 to 74 Years | 71 (37.8%) | 0 (0.0%) |
| 75 Years and over | 0 (0.0%) | 32 (9.3%) |
Disability Class: Ambulatory Difficulty
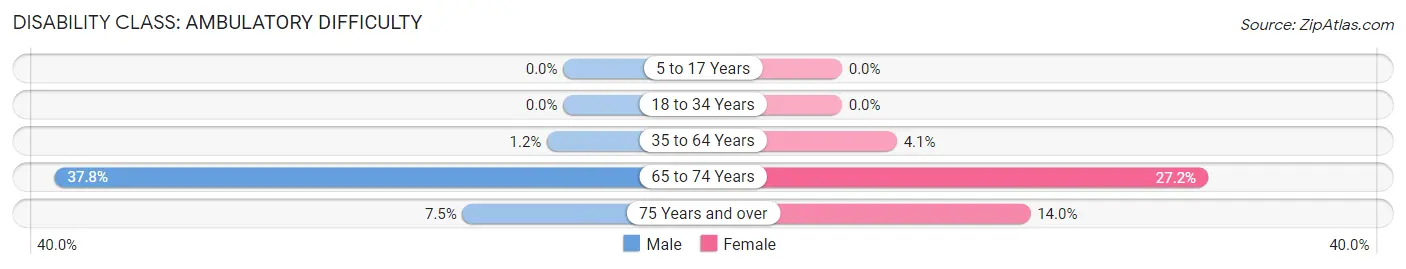
| Age Bracket | Male | Female |
| 5 to 17 Years | 0 (0.0%) | 0 (0.0%) |
| 18 to 34 Years | 0 (0.0%) | 0 (0.0%) |
| 35 to 64 Years | 22 (1.2%) | 67 (4.1%) |
| 65 to 74 Years | 71 (37.8%) | 78 (27.2%) |
| 75 Years and over | 11 (7.5%) | 48 (14.0%) |
Disability Class: Self-Care Difficulty
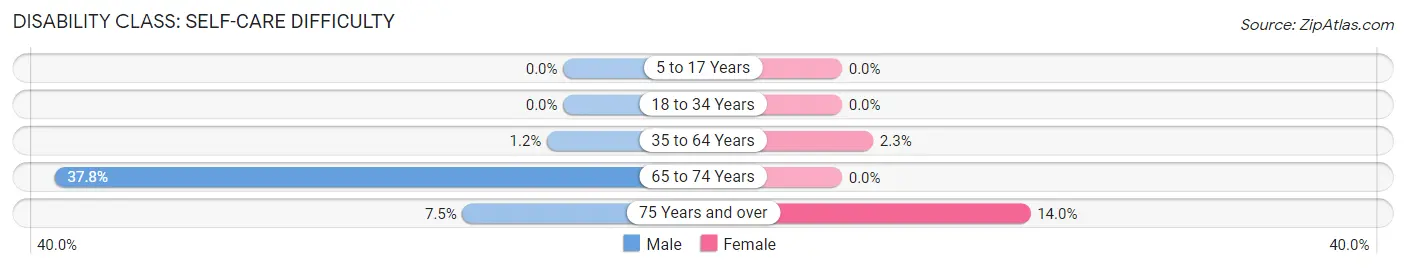
| Age Bracket | Male | Female |
| 5 to 17 Years | 0 (0.0%) | 0 (0.0%) |
| 18 to 34 Years | 0 (0.0%) | 0 (0.0%) |
| 35 to 64 Years | 22 (1.2%) | 38 (2.3%) |
| 65 to 74 Years | 71 (37.8%) | 0 (0.0%) |
| 75 Years and over | 11 (7.5%) | 48 (14.0%) |
Technology Access in Dunellen borough
Computing Device Access in Dunellen borough
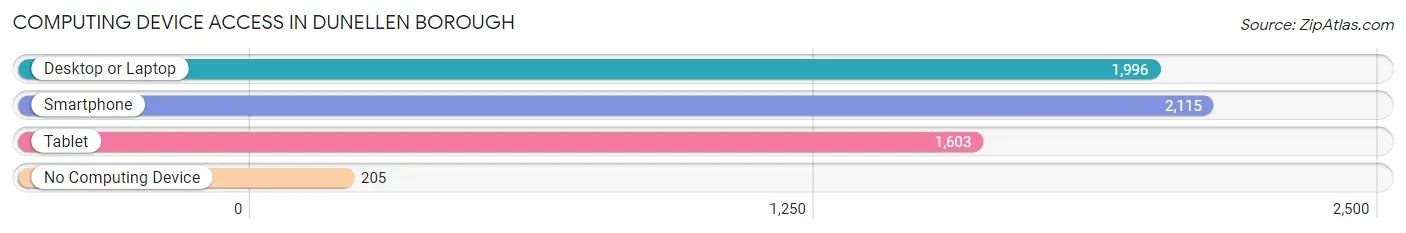
| Device Type | # Households | % Households |
| Desktop or Laptop | 1,996 | 81.6% |
| Smartphone | 2,115 | 86.5% |
| Tablet | 1,603 | 65.5% |
| No Computing Device | 205 | 8.4% |
| Total | 2,446 | 100.0% |
Internet Access in Dunellen borough
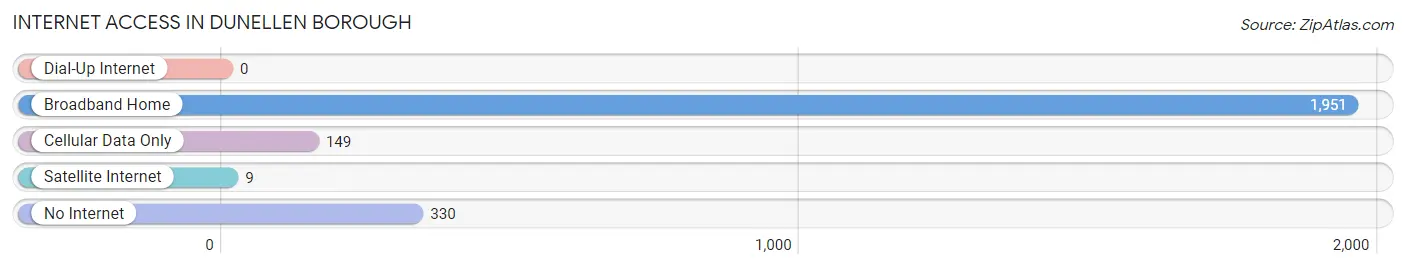
| Internet Type | # Households | % Households |
| Dial-Up Internet | 0 | 0.0% |
| Broadband Home | 1,951 | 79.8% |
| Cellular Data Only | 149 | 6.1% |
| Satellite Internet | 9 | 0.4% |
| No Internet | 330 | 13.5% |
| Total | 2,446 | 100.0% |
Dunellen borough Summary
Dunellen Borough is a small borough located in Middlesex County, New Jersey. It is situated in the Raritan Valley region of Central New Jersey, and is bordered by the towns of Piscataway, Plainfield, Green Brook, and Bound Brook. The borough is home to a population of approximately 7,000 people, and is a part of the larger New York metropolitan area.
History
The area that is now Dunellen Borough was originally inhabited by the Lenape Native Americans. The first European settlers arrived in the area in the late 17th century, and the area was officially incorporated as a borough in 1887. The name Dunellen is derived from the Gaelic words “dun” and “ellen”, which mean “fort” and “hill”, respectively.
The borough was originally a farming community, and the area was known for its production of potatoes, corn, and other vegetables. In the late 19th century, the area began to develop into a residential community, and the population began to grow. The borough was also home to several factories, including a paper mill, a silk mill, and a brickyard.
Geography
Dunellen Borough is located in the Raritan Valley region of Central New Jersey. It is situated in the northern part of Middlesex County, and is bordered by the towns of Piscataway, Plainfield, Green Brook, and Bound Brook. The borough covers an area of 1.3 square miles, and is home to a population of approximately 7,000 people.
The borough is located in a low-lying area, and is situated at an elevation of approximately 50 feet above sea level. The borough is located in a humid subtropical climate zone, and experiences hot, humid summers and cold, wet winters.
Economy
The economy of Dunellen Borough is largely based on the service industry. The borough is home to several restaurants, retail stores, and other businesses. The borough is also home to several manufacturing companies, including a paper mill, a silk mill, and a brickyard.
The borough is also home to several educational institutions, including Dunellen High School, Dunellen Middle School, and Dunellen Elementary School. The borough is also home to several parks and recreational facilities, including the Dunellen Community Park, the Dunellen Skate Park, and the Dunellen Public Library.
Demographics
As of the 2010 census, the population of Dunellen Borough was 7,227. The racial makeup of the borough was 79.2% White, 11.2% African American, 0.3% Native American, 3.2% Asian, and 4.9% from other races. Hispanic or Latino of any race were 11.7% of the population.
The median household income in Dunellen Borough was $63,917, and the median family income was $76,917. The per capita income in the borough was $30,917. Approximately 8.2% of the population was below the poverty line.
Conclusion
Dunellen Borough is a small borough located in Middlesex County, New Jersey. It is situated in the Raritan Valley region of Central New Jersey, and is bordered by the towns of Piscataway, Plainfield, Green Brook, and Bound Brook. The borough is home to a population of approximately 7,000 people, and is a part of the larger New York metropolitan area. The economy of Dunellen Borough is largely based on the service industry, and the borough is home to several educational institutions, parks, and recreational facilities. The racial makeup of the borough is 79.2% White, 11.2% African American, 0.3% Native American, 3.2% Asian, and 4.9% from other races. The median household income in Dunellen Borough was $63,917, and the median family income was $76,917.
Common Questions
What is Per Capita Income in Dunellen borough?
Per Capita income in Dunellen borough is $36,989.
What is the Median Family Income in Dunellen borough?
Median Family Income in Dunellen borough is $111,133.
What is the Median Household income in Dunellen borough?
Median Household Income in Dunellen borough is $86,532.
What is Income or Wage Gap in Dunellen borough?
Income or Wage Gap in Dunellen borough is 51.3%.
Women in Dunellen borough earn 48.7 cents for every dollar earned by a man.
What is Inequality or Gini Index in Dunellen borough?
Inequality or Gini Index in Dunellen borough is 0.47.
What is the Total Population of Dunellen borough?
Total Population of Dunellen borough is 7,598.
What is the Total Male Population of Dunellen borough?
Total Male Population of Dunellen borough is 4,072.
What is the Total Female Population of Dunellen borough?
Total Female Population of Dunellen borough is 3,526.
What is the Ratio of Males per 100 Females in Dunellen borough?
There are 115.48 Males per 100 Females in Dunellen borough.
What is the Ratio of Females per 100 Males in Dunellen borough?
There are 86.59 Females per 100 Males in Dunellen borough.
What is the Median Population Age in Dunellen borough?
Median Population Age in Dunellen borough is 39.4 Years.
What is the Average Family Size in Dunellen borough
Average Family Size in Dunellen borough is 3.7 People.
What is the Average Household Size in Dunellen borough
Average Household Size in Dunellen borough is 3.1 People.
How Large is the Labor Force in Dunellen borough?
There are 3,806 People in the Labor Forcein in Dunellen borough.
What is the Percentage of People in the Labor Force in Dunellen borough?
62.8% of People are in the Labor Force in Dunellen borough.
What is the Unemployment Rate in Dunellen borough?
Unemployment Rate in Dunellen borough is 4.3%.