Ship Bottom borough, NJ Map & Demographics
Ship Bottom borough Overview
$74,531
PER CAPITA INCOME
$133,125
AVG FAMILY INCOME
$95,208
AVG HOUSEHOLD INCOME
38.5%
WAGE / INCOME GAP [ % ]
61.5¢/ $1
WAGE / INCOME GAP [ $ ]
0.47
INEQUALITY / GINI INDEX
995
TOTAL POPULATION
493
MALE POPULATION
502
FEMALE POPULATION
98.21
MALES / 100 FEMALES
101.83
FEMALES / 100 MALES
63.1
MEDIAN AGE
2.4
AVG FAMILY SIZE
2.0
AVG HOUSEHOLD SIZE
430
LABOR FORCE [ PEOPLE ]
45.9%
PERCENT IN LABOR FORCE
2.3%
UNEMPLOYMENT RATE
Income in Ship Bottom borough
Income Overview in Ship Bottom borough
Per Capita Income in Ship Bottom borough is $74,531, while median incomes of families and households are $133,125 and $95,208 respectively.
| Characteristic | Number | Measure |
| Per Capita Income | 995 | $74,531 |
| Median Family Income | 327 | $133,125 |
| Mean Family Income | 327 | $177,268 |
| Median Household Income | 500 | $95,208 |
| Mean Household Income | 500 | $142,740 |
| Income Deficit | 327 | $0 |
| Wage / Income Gap (%) | 995 | 38.54% |
| Wage / Income Gap ($) | 995 | 61.46¢ per $1 |
| Gini / Inequality Index | 995 | 0.47 |
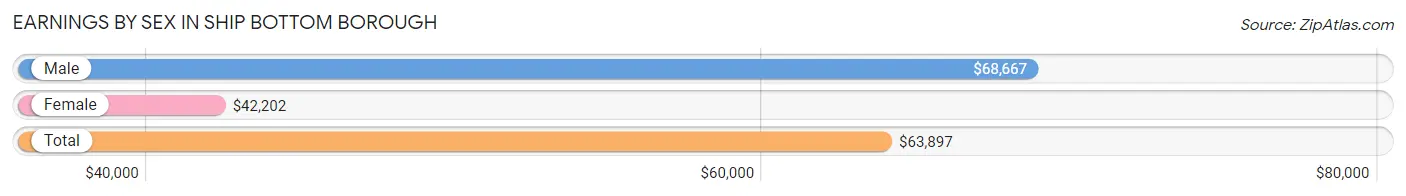
Earnings by Sex in Ship Bottom borough
Average Earnings in Ship Bottom borough are $63,897, $68,667 for men and $42,202 for women, a difference of 38.5%.
| Sex | Number | Average Earnings |
| Male | 274 (55.8%) | $68,667 |
| Female | 217 (44.2%) | $42,202 |
| Total | 491 (100.0%) | $63,897 |
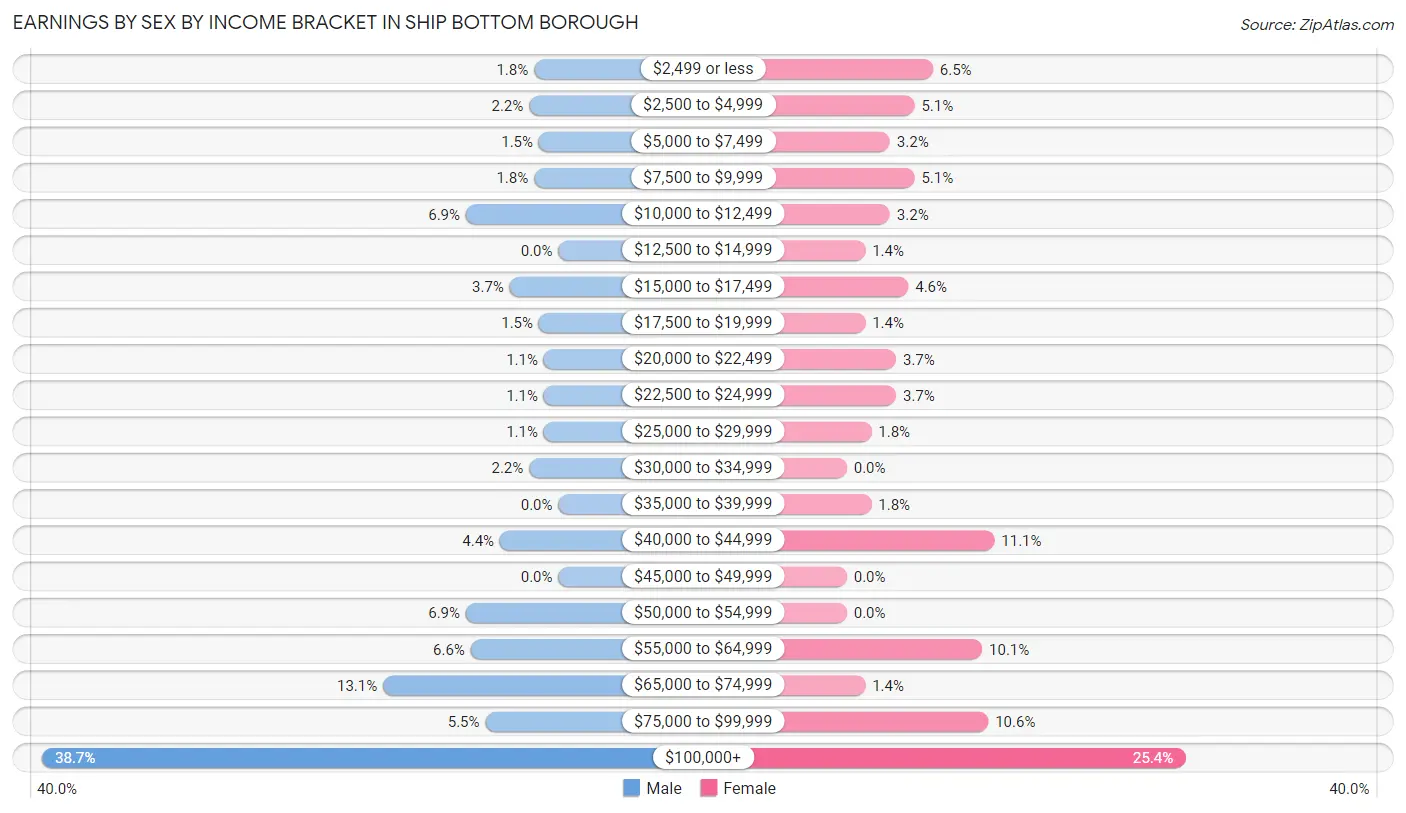
Earnings by Sex by Income Bracket in Ship Bottom borough
The most common earnings brackets in Ship Bottom borough are $100,000+ for men (106 | 38.7%) and $100,000+ for women (55 | 25.4%).
| Income | Male | Female |
| $2,499 or less | 5 (1.8%) | 14 (6.5%) |
| $2,500 to $4,999 | 6 (2.2%) | 11 (5.1%) |
| $5,000 to $7,499 | 4 (1.5%) | 7 (3.2%) |
| $7,500 to $9,999 | 5 (1.8%) | 11 (5.1%) |
| $10,000 to $12,499 | 19 (6.9%) | 7 (3.2%) |
| $12,500 to $14,999 | 0 (0.0%) | 3 (1.4%) |
| $15,000 to $17,499 | 10 (3.6%) | 10 (4.6%) |
| $17,500 to $19,999 | 4 (1.5%) | 3 (1.4%) |
| $20,000 to $22,499 | 3 (1.1%) | 8 (3.7%) |
| $22,500 to $24,999 | 3 (1.1%) | 8 (3.7%) |
| $25,000 to $29,999 | 3 (1.1%) | 4 (1.8%) |
| $30,000 to $34,999 | 6 (2.2%) | 0 (0.0%) |
| $35,000 to $39,999 | 0 (0.0%) | 4 (1.8%) |
| $40,000 to $44,999 | 12 (4.4%) | 24 (11.1%) |
| $45,000 to $49,999 | 0 (0.0%) | 0 (0.0%) |
| $50,000 to $54,999 | 19 (6.9%) | 0 (0.0%) |
| $55,000 to $64,999 | 18 (6.6%) | 22 (10.1%) |
| $65,000 to $74,999 | 36 (13.1%) | 3 (1.4%) |
| $75,000 to $99,999 | 15 (5.5%) | 23 (10.6%) |
| $100,000+ | 106 (38.7%) | 55 (25.4%) |
| Total | 274 (100.0%) | 217 (100.0%) |
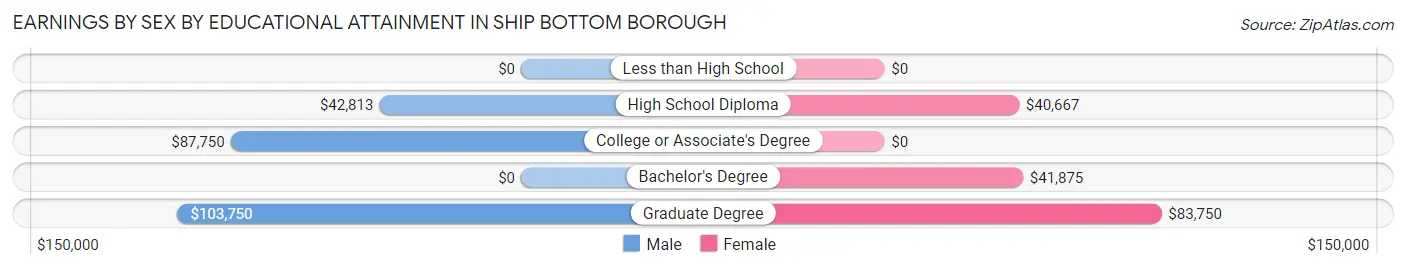
Earnings by Sex by Educational Attainment in Ship Bottom borough
Average earnings in Ship Bottom borough are $69,667 for men and $43,333 for women, a difference of 37.8%. Men with an educational attainment of graduate degree enjoy the highest average annual earnings of $103,750, while those with high school diploma education earn the least with $42,813. Women with an educational attainment of graduate degree earn the most with the average annual earnings of $83,750, while those with high school diploma education have the smallest earnings of $40,667.
| Educational Attainment | Male Income | Female Income |
| Less than High School | - | - |
| High School Diploma | $42,813 | $40,667 |
| College or Associate's Degree | $87,750 | $0 |
| Bachelor's Degree | - | - |
| Graduate Degree | $103,750 | $83,750 |
| Total | $69,667 | $43,333 |
Family Income in Ship Bottom borough
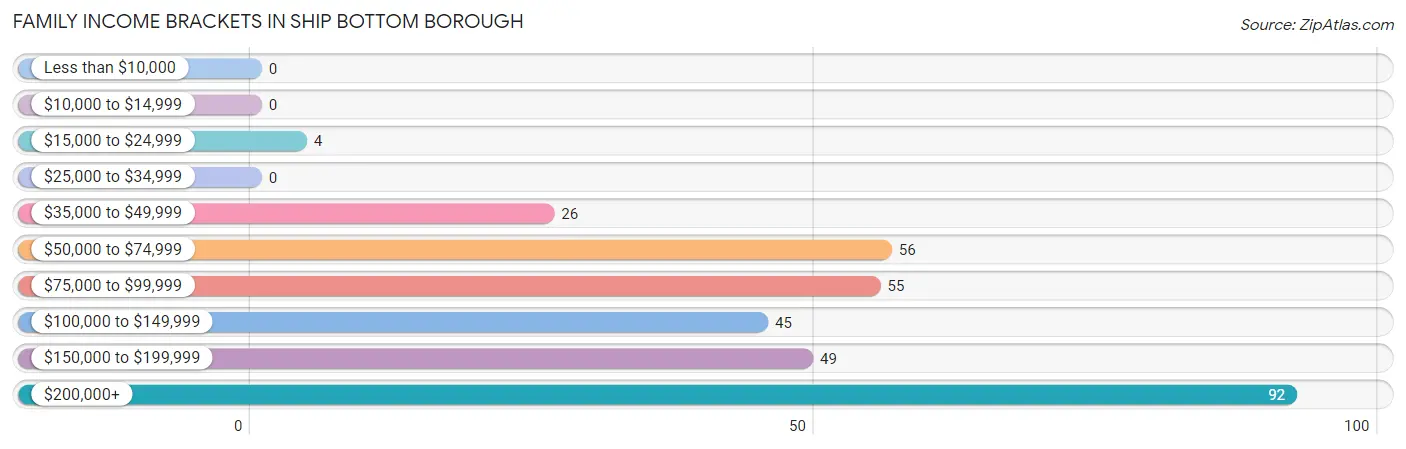
Family Income Brackets in Ship Bottom borough
According to the Ship Bottom borough family income data, there are 92 families falling into the $200,000+ income range, which is the most common income bracket and makes up 28.1% of all families.
| Income Bracket | # Families | % Families |
| Less than $10,000 | 0 | 0.0% |
| $10,000 to $14,999 | 0 | 0.0% |
| $15,000 to $24,999 | 4 | 1.2% |
| $25,000 to $34,999 | 0 | 0.0% |
| $35,000 to $49,999 | 26 | 8.0% |
| $50,000 to $74,999 | 56 | 17.1% |
| $75,000 to $99,999 | 55 | 16.8% |
| $100,000 to $149,999 | 45 | 13.8% |
| $150,000 to $199,999 | 49 | 15.0% |
| $200,000+ | 92 | 28.1% |
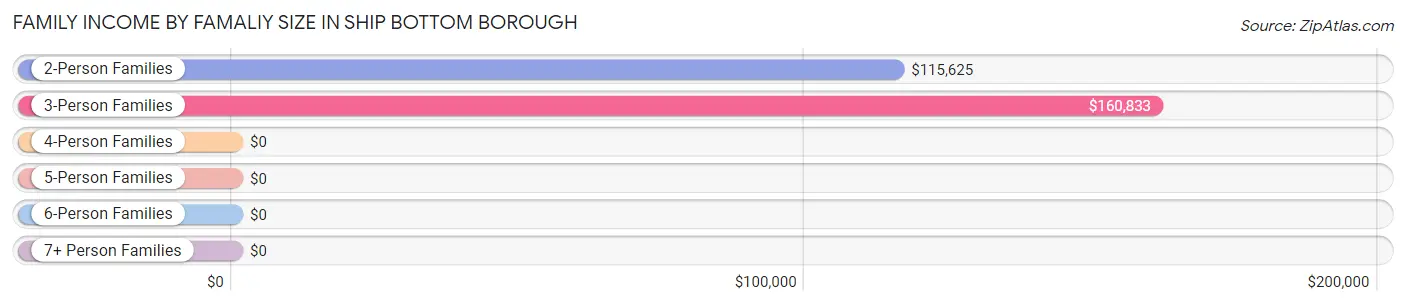
Family Income by Famaliy Size in Ship Bottom borough
3-person families (44 | 13.5%) account for the highest median family income in Ship Bottom borough with $160,833 per family, while 2-person families (250 | 76.4%) have the highest median income of $57,812 per family member.
| Income Bracket | # Families | Median Income |
| 2-Person Families | 250 (76.4%) | $115,625 |
| 3-Person Families | 44 (13.5%) | $160,833 |
| 4-Person Families | 33 (10.1%) | $0 |
| 5-Person Families | 0 (0.0%) | $0 |
| 6-Person Families | 0 (0.0%) | $0 |
| 7+ Person Families | 0 (0.0%) | $0 |
| Total | 327 (100.0%) | $133,125 |
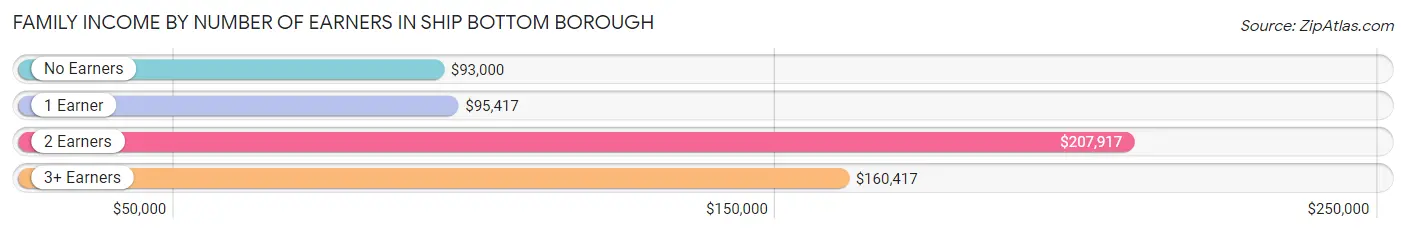
Family Income by Number of Earners in Ship Bottom borough
The median family income in Ship Bottom borough is $133,125, with families comprising 2 earners (91) having the highest median family income of $207,917, while families with no earners (98) have the lowest median family income of $93,000, accounting for 27.8% and 30.0% of families, respectively.
| Number of Earners | # Families | Median Income |
| No Earners | 98 (30.0%) | $93,000 |
| 1 Earner | 117 (35.8%) | $95,417 |
| 2 Earners | 91 (27.8%) | $207,917 |
| 3+ Earners | 21 (6.4%) | $160,417 |
| Total | 327 (100.0%) | $133,125 |
Household Income in Ship Bottom borough
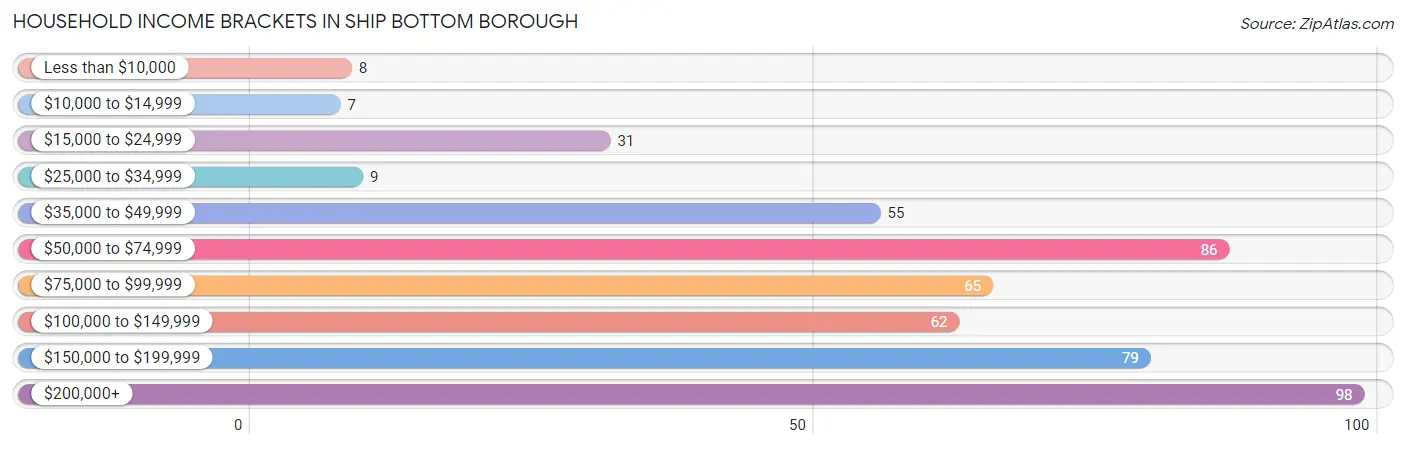
Household Income Brackets in Ship Bottom borough
With 98 households falling in the category, the $200,000+ income range is the most frequent in Ship Bottom borough, accounting for 19.6% of all households. In contrast, only 7 households (1.4%) fall into the $10,000 to $14,999 income bracket, making it the least populous group.
| Income Bracket | # Households | % Households |
| Less than $10,000 | 8 | 1.6% |
| $10,000 to $14,999 | 7 | 1.4% |
| $15,000 to $24,999 | 31 | 6.2% |
| $25,000 to $34,999 | 9 | 1.8% |
| $35,000 to $49,999 | 55 | 11.0% |
| $50,000 to $74,999 | 86 | 17.2% |
| $75,000 to $99,999 | 65 | 13.0% |
| $100,000 to $149,999 | 62 | 12.4% |
| $150,000 to $199,999 | 79 | 15.8% |
| $200,000+ | 98 | 19.6% |
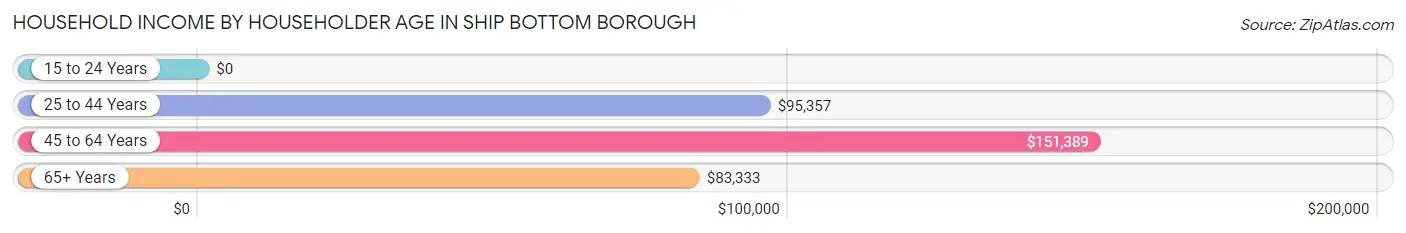
Household Income by Householder Age in Ship Bottom borough
The median household income in Ship Bottom borough is $95,208, with the highest median household income of $151,389 found in the 45 to 64 years age bracket for the primary householder. A total of 214 households (42.8%) fall into this category.
| Income Bracket | # Households | Median Income |
| 15 to 24 Years | 0 (0.0%) | $0 |
| 25 to 44 Years | 36 (7.2%) | $95,357 |
| 45 to 64 Years | 214 (42.8%) | $151,389 |
| 65+ Years | 250 (50.0%) | $83,333 |
| Total | 500 (100.0%) | $95,208 |
Poverty in Ship Bottom borough
Income Below Poverty by Sex and Age in Ship Bottom borough
With 1.2% poverty level for males and 3.0% for females among the residents of Ship Bottom borough, 25 to 34 year old males and 35 to 44 year old females are the most vulnerable to poverty, with 6 males (31.6%) and 3 females (11.1%) in their respective age groups living below the poverty level.
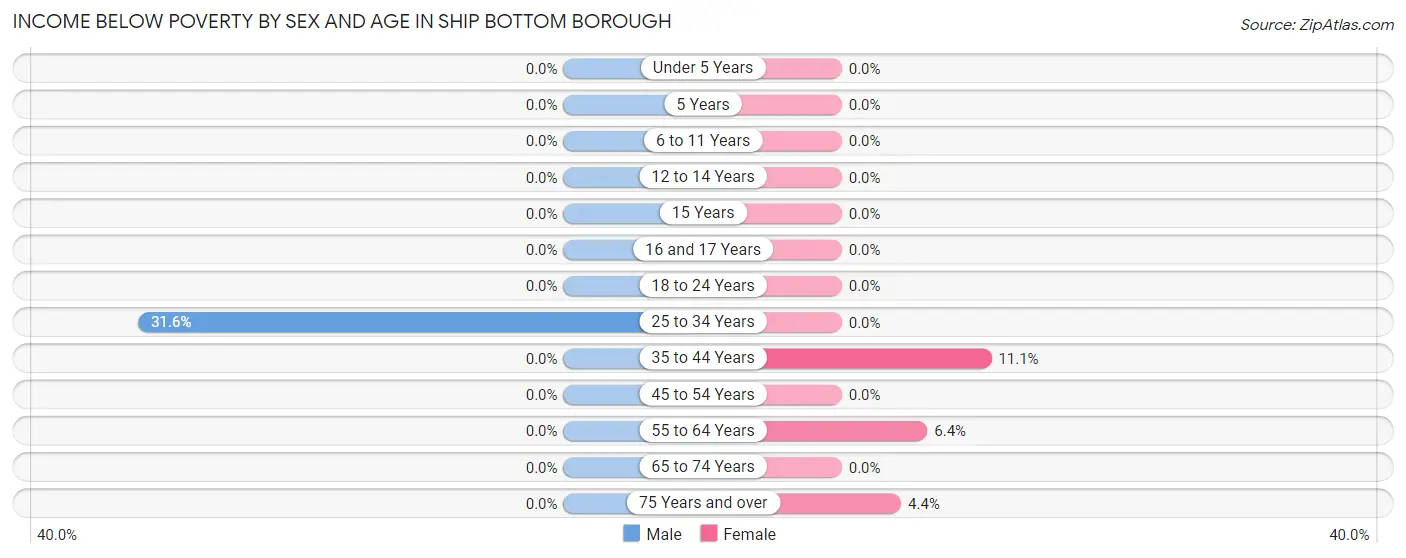
| Age Bracket | Male | Female |
| Under 5 Years | 0 (0.0%) | 0 (0.0%) |
| 5 Years | 0 (0.0%) | 0 (0.0%) |
| 6 to 11 Years | 0 (0.0%) | 0 (0.0%) |
| 12 to 14 Years | 0 (0.0%) | 0 (0.0%) |
| 15 Years | 0 (0.0%) | 0 (0.0%) |
| 16 and 17 Years | 0 (0.0%) | 0 (0.0%) |
| 18 to 24 Years | 0 (0.0%) | 0 (0.0%) |
| 25 to 34 Years | 6 (31.6%) | 0 (0.0%) |
| 35 to 44 Years | 0 (0.0%) | 3 (11.1%) |
| 45 to 54 Years | 0 (0.0%) | 0 (0.0%) |
| 55 to 64 Years | 0 (0.0%) | 8 (6.4%) |
| 65 to 74 Years | 0 (0.0%) | 0 (0.0%) |
| 75 Years and over | 0 (0.0%) | 4 (4.4%) |
| Total | 6 (1.2%) | 15 (3.0%) |
Income Above Poverty by Sex and Age in Ship Bottom borough
According to the poverty statistics in Ship Bottom borough, males aged under 5 years and females aged 6 to 11 years are the age groups that are most secure financially, with 100.0% of males and 100.0% of females in these age groups living above the poverty line.
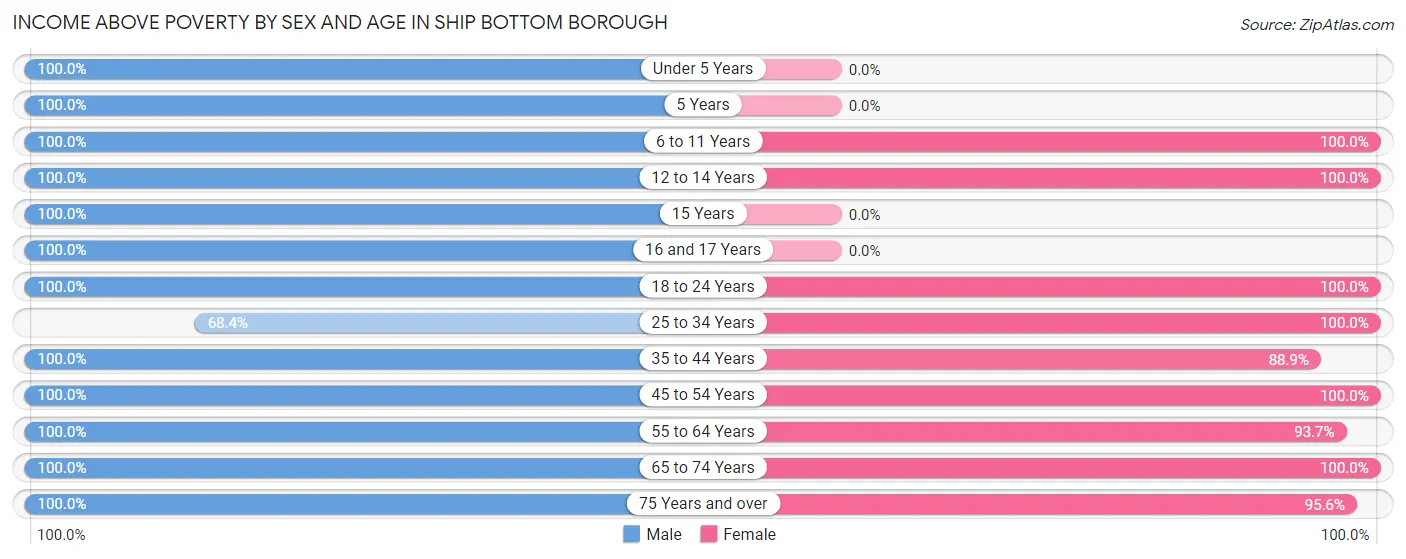
| Age Bracket | Male | Female |
| Under 5 Years | 11 (100.0%) | 0 (0.0%) |
| 5 Years | 3 (100.0%) | 0 (0.0%) |
| 6 to 11 Years | 19 (100.0%) | 4 (100.0%) |
| 12 to 14 Years | 6 (100.0%) | 14 (100.0%) |
| 15 Years | 2 (100.0%) | 0 (0.0%) |
| 16 and 17 Years | 4 (100.0%) | 0 (0.0%) |
| 18 to 24 Years | 30 (100.0%) | 15 (100.0%) |
| 25 to 34 Years | 13 (68.4%) | 20 (100.0%) |
| 35 to 44 Years | 32 (100.0%) | 24 (88.9%) |
| 45 to 54 Years | 57 (100.0%) | 65 (100.0%) |
| 55 to 64 Years | 126 (100.0%) | 118 (93.6%) |
| 65 to 74 Years | 84 (100.0%) | 140 (100.0%) |
| 75 Years and over | 100 (100.0%) | 87 (95.6%) |
| Total | 487 (98.8%) | 487 (97.0%) |
Income Below Poverty Among Married-Couple Families in Ship Bottom borough
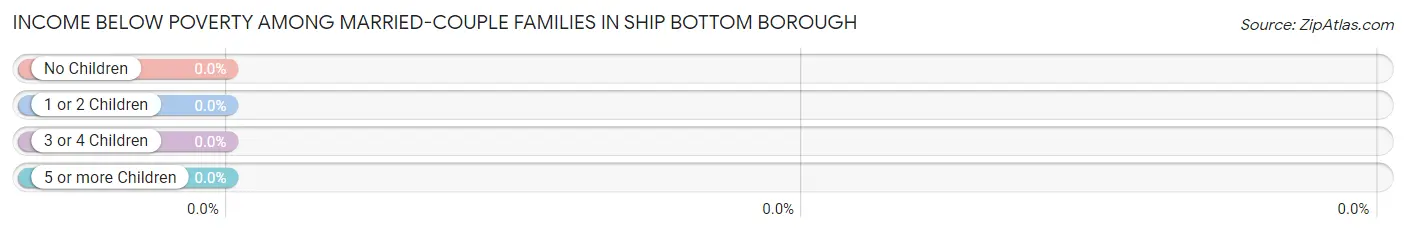
| Children | Above Poverty | Below Poverty |
| No Children | 258 (100.0%) | 0 (0.0%) |
| 1 or 2 Children | 45 (100.0%) | 0 (0.0%) |
| 3 or 4 Children | 0 (0.0%) | 0 (0.0%) |
| 5 or more Children | 0 (0.0%) | 0 (0.0%) |
| Total | 303 (100.0%) | 0 (0.0%) |
Income Below Poverty Among Single-Parent Households in Ship Bottom borough
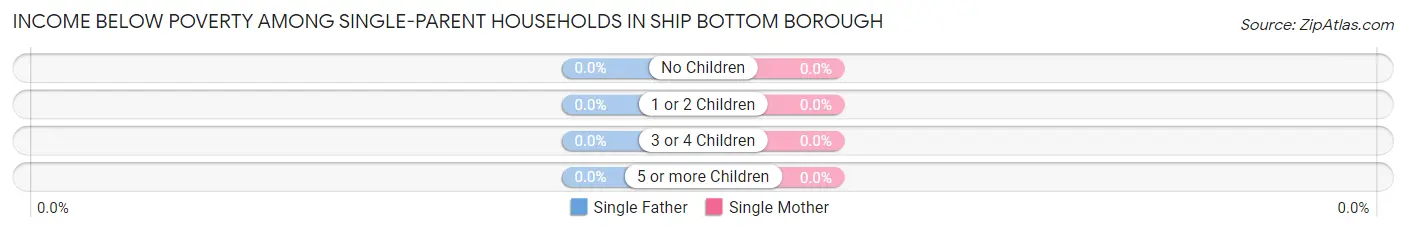
| Children | Single Father | Single Mother |
| No Children | 0 (0.0%) | 0 (0.0%) |
| 1 or 2 Children | 0 (0.0%) | 0 (0.0%) |
| 3 or 4 Children | 0 (0.0%) | 0 (0.0%) |
| 5 or more Children | 0 (0.0%) | 0 (0.0%) |
| Total | 0 (0.0%) | 0 (0.0%) |
Income Below Poverty Among Married-Couple vs Single-Parent Households in Ship Bottom borough
| Children | Married-Couple Families | Single-Parent Households |
| No Children | 0 (0.0%) | 0 (0.0%) |
| 1 or 2 Children | 0 (0.0%) | 0 (0.0%) |
| 3 or 4 Children | 0 (0.0%) | 0 (0.0%) |
| 5 or more Children | 0 (0.0%) | 0 (0.0%) |
| Total | 0 (0.0%) | 0 (0.0%) |
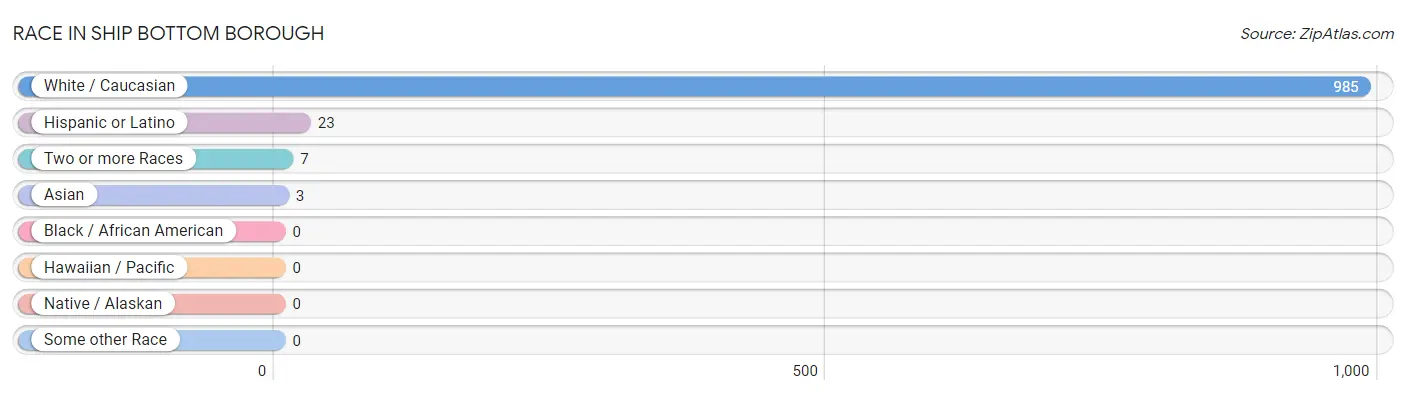
Race in Ship Bottom borough
The most populous races in Ship Bottom borough are White / Caucasian (985 | 99.0%), Hispanic or Latino (23 | 2.3%), and Two or more Races (7 | 0.7%).
| Race | # Population | % Population |
| Asian | 3 | 0.3% |
| Black / African American | 0 | 0.0% |
| Hawaiian / Pacific | 0 | 0.0% |
| Hispanic or Latino | 23 | 2.3% |
| Native / Alaskan | 0 | 0.0% |
| White / Caucasian | 985 | 99.0% |
| Two or more Races | 7 | 0.7% |
| Some other Race | 0 | 0.0% |
| Total | 995 | 100.0% |
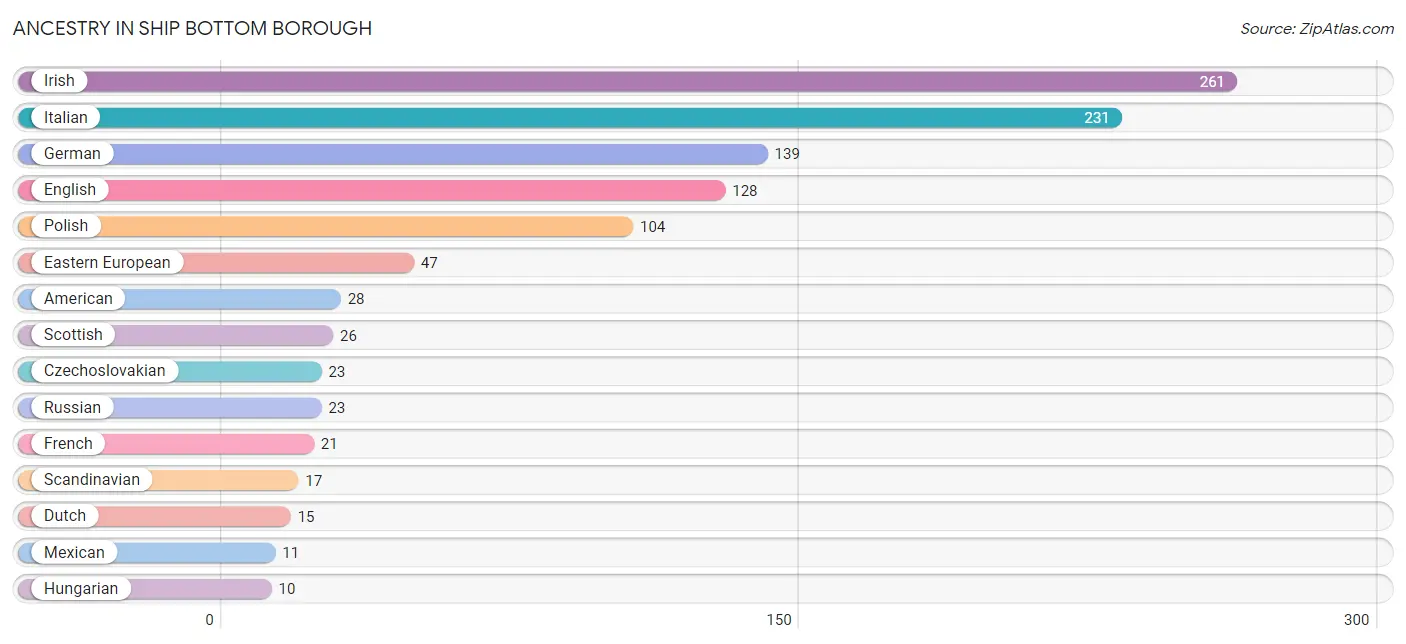
Ancestry in Ship Bottom borough
The most populous ancestries reported in Ship Bottom borough are Irish (261 | 26.2%), Italian (231 | 23.2%), German (139 | 14.0%), English (128 | 12.9%), and Polish (104 | 10.4%), together accounting for 86.7% of all Ship Bottom borough residents.
| Ancestry | # Population | % Population |
| American | 28 | 2.8% |
| Arab | 5 | 0.5% |
| Austrian | 8 | 0.8% |
| Cambodian | 3 | 0.3% |
| Croatian | 7 | 0.7% |
| Czechoslovakian | 23 | 2.3% |
| Dutch | 15 | 1.5% |
| Eastern European | 47 | 4.7% |
| English | 128 | 12.9% |
| European | 3 | 0.3% |
| French | 21 | 2.1% |
| French Canadian | 7 | 0.7% |
| German | 139 | 14.0% |
| Hungarian | 10 | 1.0% |
| Irish | 261 | 26.2% |
| Italian | 231 | 23.2% |
| Lithuanian | 10 | 1.0% |
| Mexican | 11 | 1.1% |
| Norwegian | 7 | 0.7% |
| Polish | 104 | 10.4% |
| Portuguese | 6 | 0.6% |
| Russian | 23 | 2.3% |
| Scandinavian | 17 | 1.7% |
| Scotch-Irish | 4 | 0.4% |
| Scottish | 26 | 2.6% |
| Slavic | 4 | 0.4% |
| Slovak | 9 | 0.9% |
| South American | 10 | 1.0% |
| Spaniard | 2 | 0.2% |
| Swiss | 3 | 0.3% |
| Syrian | 5 | 0.5% |
| Uruguayan | 3 | 0.3% |
| Venezuelan | 7 | 0.7% | View All 33 Rows |
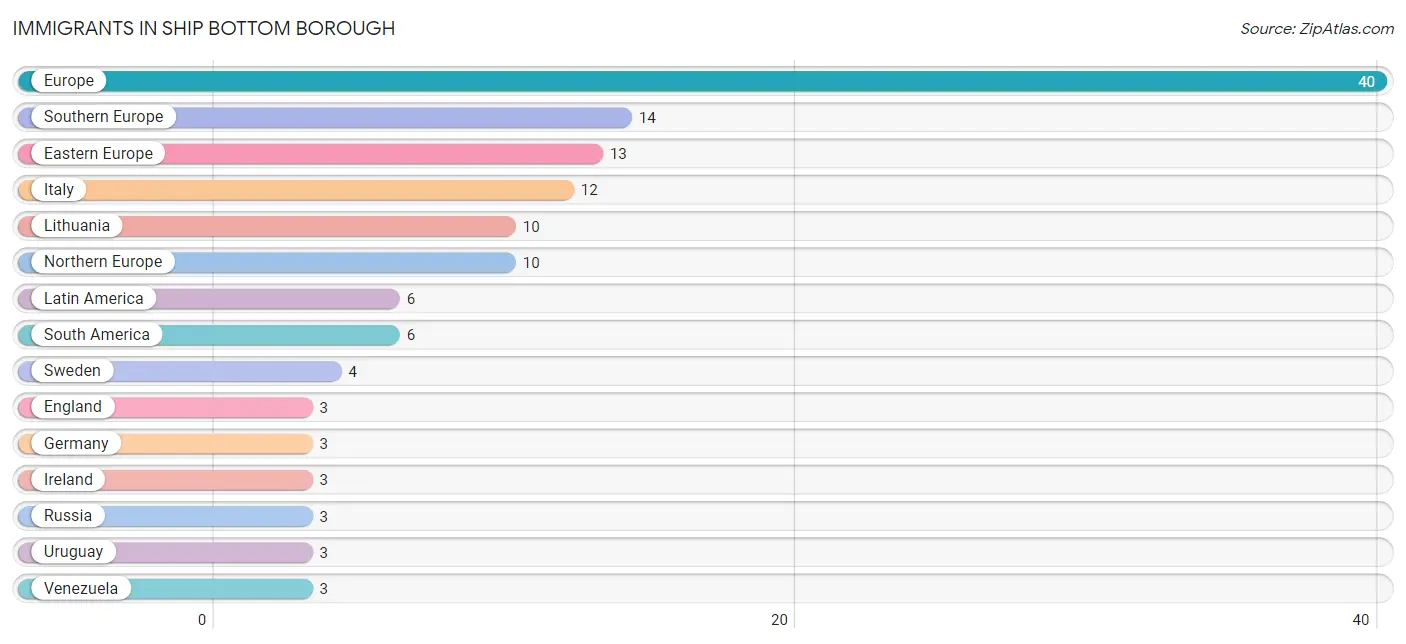
Immigrants in Ship Bottom borough
The most numerous immigrant groups reported in Ship Bottom borough came from Europe (40 | 4.0%), Southern Europe (14 | 1.4%), Eastern Europe (13 | 1.3%), Italy (12 | 1.2%), and Lithuania (10 | 1.0%), together accounting for 9.0% of all Ship Bottom borough residents.
| Immigration Origin | # Population | % Population |
| Eastern Europe | 13 | 1.3% |
| England | 3 | 0.3% |
| Europe | 40 | 4.0% |
| Germany | 3 | 0.3% |
| Ireland | 3 | 0.3% |
| Italy | 12 | 1.2% |
| Latin America | 6 | 0.6% |
| Lithuania | 10 | 1.0% |
| Northern Europe | 10 | 1.0% |
| Russia | 3 | 0.3% |
| South America | 6 | 0.6% |
| Southern Europe | 14 | 1.4% |
| Spain | 2 | 0.2% |
| Sweden | 4 | 0.4% |
| Uruguay | 3 | 0.3% |
| Venezuela | 3 | 0.3% |
| Western Europe | 3 | 0.3% | View All 17 Rows |
Sex and Age in Ship Bottom borough
Sex and Age in Ship Bottom borough
The most populous age groups in Ship Bottom borough are 60 to 64 Years (85 | 17.2%) for men and 60 to 64 Years (95 | 18.9%) for women.
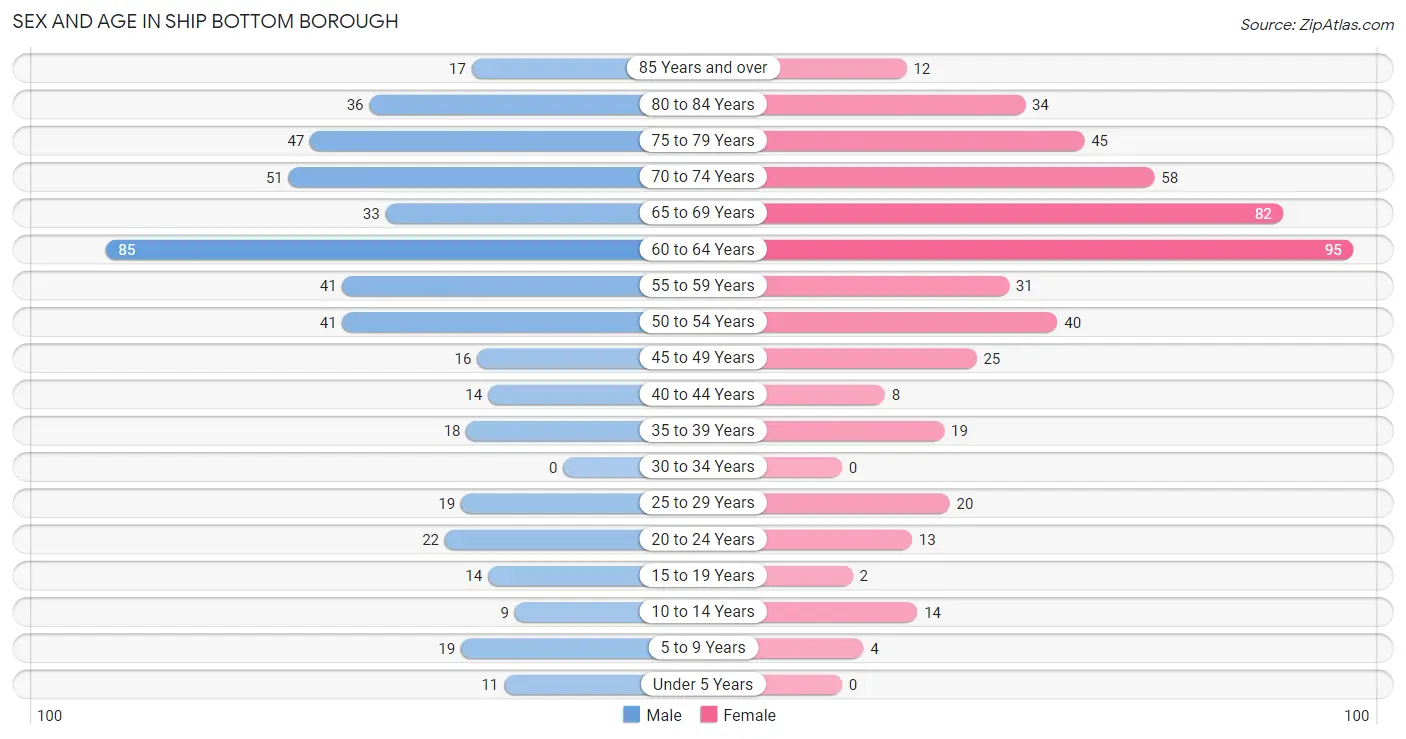
| Age Bracket | Male | Female |
| Under 5 Years | 11 (2.2%) | 0 (0.0%) |
| 5 to 9 Years | 19 (3.8%) | 4 (0.8%) |
| 10 to 14 Years | 9 (1.8%) | 14 (2.8%) |
| 15 to 19 Years | 14 (2.8%) | 2 (0.4%) |
| 20 to 24 Years | 22 (4.5%) | 13 (2.6%) |
| 25 to 29 Years | 19 (3.8%) | 20 (4.0%) |
| 30 to 34 Years | 0 (0.0%) | 0 (0.0%) |
| 35 to 39 Years | 18 (3.6%) | 19 (3.8%) |
| 40 to 44 Years | 14 (2.8%) | 8 (1.6%) |
| 45 to 49 Years | 16 (3.3%) | 25 (5.0%) |
| 50 to 54 Years | 41 (8.3%) | 40 (8.0%) |
| 55 to 59 Years | 41 (8.3%) | 31 (6.2%) |
| 60 to 64 Years | 85 (17.2%) | 95 (18.9%) |
| 65 to 69 Years | 33 (6.7%) | 82 (16.3%) |
| 70 to 74 Years | 51 (10.3%) | 58 (11.6%) |
| 75 to 79 Years | 47 (9.5%) | 45 (9.0%) |
| 80 to 84 Years | 36 (7.3%) | 34 (6.8%) |
| 85 Years and over | 17 (3.5%) | 12 (2.4%) |
| Total | 493 (100.0%) | 502 (100.0%) |
Families and Households in Ship Bottom borough
Median Family Size in Ship Bottom borough
The median family size in Ship Bottom borough is 2.44 persons per family, with married-couple families (303 | 92.7%) accounting for the largest median family size of 2.46 persons per family. On the other hand, single male/father families (4 | 1.2%) represent the smallest median family size with 2.00 persons per family.
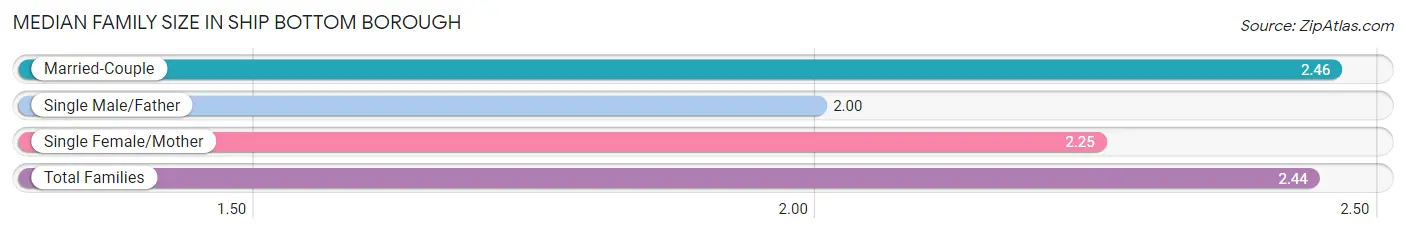
| Family Type | # Families | Family Size |
| Married-Couple | 303 (92.7%) | 2.46 |
| Single Male/Father | 4 (1.2%) | 2.00 |
| Single Female/Mother | 20 (6.1%) | 2.25 |
| Total Families | 327 (100.0%) | 2.44 |
Median Household Size in Ship Bottom borough
The median household size in Ship Bottom borough is 1.99 persons per household, with married-couple households (303 | 60.6%) accounting for the largest median household size of 2.48 persons per household. non-family households (173 | 34.6%) represent the smallest median household size with 1.10 persons per household.
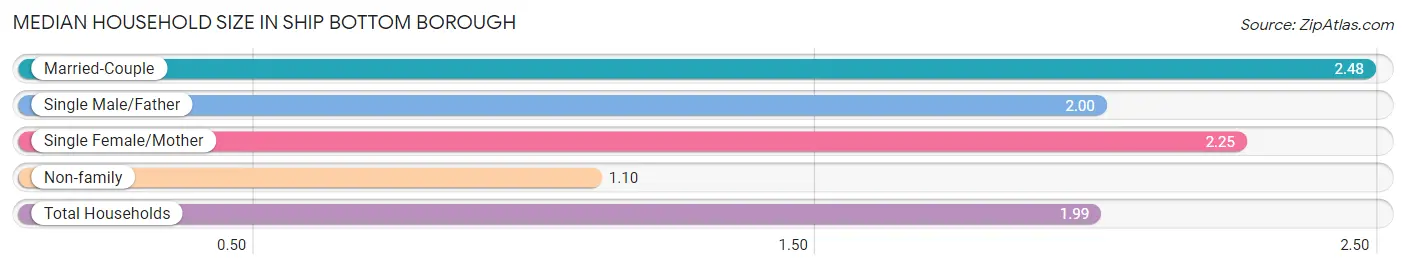
| Household Type | # Households | Household Size |
| Married-Couple | 303 (60.6%) | 2.48 |
| Single Male/Father | 4 (0.8%) | 2.00 |
| Single Female/Mother | 20 (4.0%) | 2.25 |
| Non-family | 173 (34.6%) | 1.10 |
| Total Households | 500 (100.0%) | 1.99 |
Household Size by Marriage Status in Ship Bottom borough
Out of a total of 500 households in Ship Bottom borough, 327 (65.4%) are family households, while 173 (34.6%) are nonfamily households. The most numerous type of family households are 2-person households, comprising 250, and the most common type of nonfamily households are 1-person households, comprising 156.
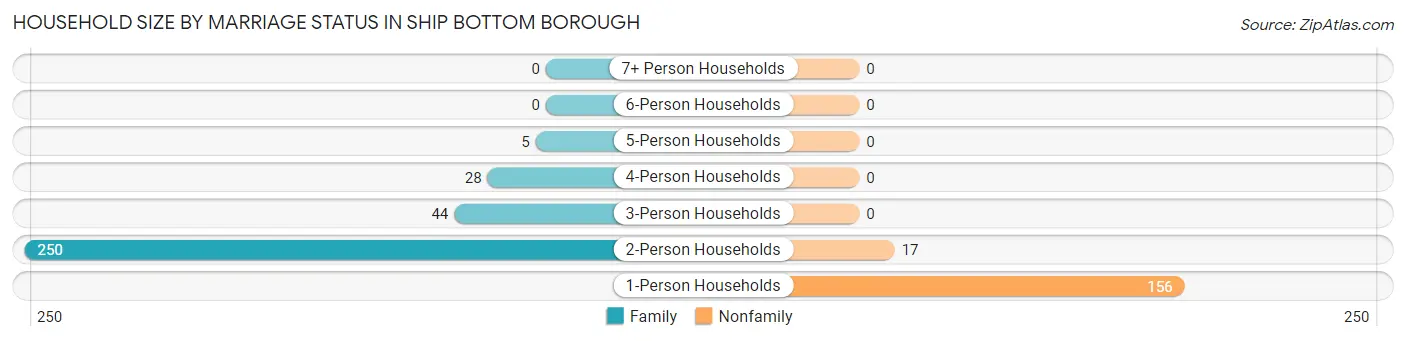
| Household Size | Family Households | Nonfamily Households |
| 1-Person Households | - | 156 (31.2%) |
| 2-Person Households | 250 (50.0%) | 17 (3.4%) |
| 3-Person Households | 44 (8.8%) | 0 (0.0%) |
| 4-Person Households | 28 (5.6%) | 0 (0.0%) |
| 5-Person Households | 5 (1.0%) | 0 (0.0%) |
| 6-Person Households | 0 (0.0%) | 0 (0.0%) |
| 7+ Person Households | 0 (0.0%) | 0 (0.0%) |
| Total | 327 (65.4%) | 173 (34.6%) |
Female Fertility in Ship Bottom borough
Fertility by Age in Ship Bottom borough
| Age Bracket | Women with Births | Births / 1,000 Women |
| 15 to 19 years | 0 (0.0%) | 0.0 |
| 20 to 34 years | 0 (0.0%) | 0.0 |
| 35 to 50 years | 0 (0.0%) | 0.0 |
| Total | 0 (0.0%) | 0.0 |
Fertility by Age by Marriage Status in Ship Bottom borough
| Age Bracket | Married | Unmarried |
| 15 to 19 years | 0 (0.0%) | 0 (0.0%) |
| 20 to 34 years | 0 (0.0%) | 0 (0.0%) |
| 35 to 50 years | 0 (0.0%) | 0 (0.0%) |
| Total | 0 (0.0%) | 0 (0.0%) |
Fertility by Education in Ship Bottom borough
| Educational Attainment | Women with Births | Births / 1,000 Women |
| Less than High School | 0 (0.0%) | 0.0 |
| High School Diploma | 0 (0.0%) | 0.0 |
| College or Associate's Degree | 0 (0.0%) | 0.0 |
| Bachelor's Degree | 0 (0.0%) | 0.0 |
| Graduate Degree | 0 (0.0%) | 0.0 |
| Total | 0 (0.0%) | 0.0 |
Fertility by Education by Marriage Status in Ship Bottom borough
| Educational Attainment | Married | Unmarried |
| Less than High School | 0 (0.0%) | 0 (0.0%) |
| High School Diploma | 0 (0.0%) | 0 (0.0%) |
| College or Associate's Degree | 0 (0.0%) | 0 (0.0%) |
| Bachelor's Degree | 0 (0.0%) | 0 (0.0%) |
| Graduate Degree | 0 (0.0%) | 0 (0.0%) |
| Total | 0 (0.0%) | 0 (0.0%) |
Employment Characteristics in Ship Bottom borough
Employment by Class of Employer in Ship Bottom borough
Among the 412 employed individuals in Ship Bottom borough, private company employees (224 | 54.4%), local government employees (61 | 14.8%), and self-employed (incorporated) (47 | 11.4%) make up the most common classes of employment.
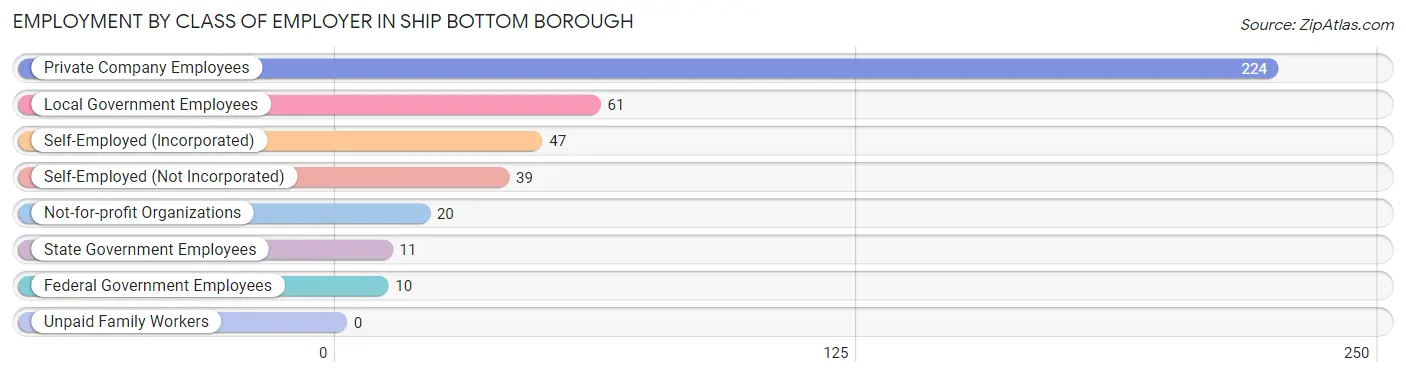
| Employer Class | # Employees | % Employees |
| Private Company Employees | 224 | 54.4% |
| Self-Employed (Incorporated) | 47 | 11.4% |
| Self-Employed (Not Incorporated) | 39 | 9.5% |
| Not-for-profit Organizations | 20 | 4.9% |
| Local Government Employees | 61 | 14.8% |
| State Government Employees | 11 | 2.7% |
| Federal Government Employees | 10 | 2.4% |
| Unpaid Family Workers | 0 | 0.0% |
| Total | 412 | 100.0% |
Employment Status by Age in Ship Bottom borough
According to the labor force statistics for Ship Bottom borough, out of the total population over 16 years of age (936), 45.9% or 430 individuals are in the labor force, with 2.3% or 10 of them unemployed. The age group with the highest labor force participation rate is 45 to 54 years, with 89.3% or 109 individuals in the labor force. Within the labor force, the 16 to 19 years age range has the highest percentage of unemployed individuals, with 50.0% or 2 of them being unemployed.
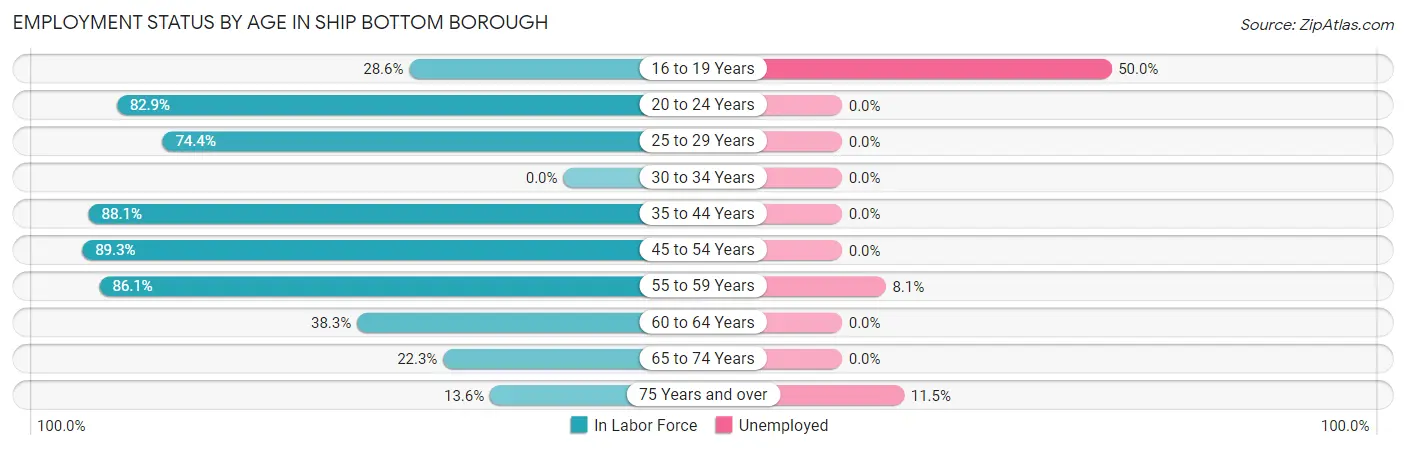
| Age Bracket | In Labor Force | Unemployed |
| 16 to 19 Years | 4 (28.6%) | 2 (50.0%) |
| 20 to 24 Years | 29 (82.9%) | 0 (0.0%) |
| 25 to 29 Years | 29 (74.4%) | 0 (0.0%) |
| 30 to 34 Years | 0 (0.0%) | 0 (0.0%) |
| 35 to 44 Years | 52 (88.1%) | 0 (0.0%) |
| 45 to 54 Years | 109 (89.3%) | 0 (0.0%) |
| 55 to 59 Years | 62 (86.1%) | 5 (8.1%) |
| 60 to 64 Years | 69 (38.3%) | 0 (0.0%) |
| 65 to 74 Years | 50 (22.3%) | 0 (0.0%) |
| 75 Years and over | 26 (13.6%) | 3 (11.5%) |
| Total | 430 (45.9%) | 10 (2.3%) |
Employment Status by Educational Attainment in Ship Bottom borough
According to labor force statistics for Ship Bottom borough, 68.0% of individuals (321) out of the total population between 25 and 64 years of age (472) are in the labor force, with 1.6% or 5 of them being unemployed. The group with the highest labor force participation rate are those with the educational attainment of bachelor's degree or higher, with 73.3% or 203 individuals in the labor force. Within the labor force, individuals with bachelor's degree or higher education have the highest percentage of unemployment, with 2.5% or 5 of them being unemployed.
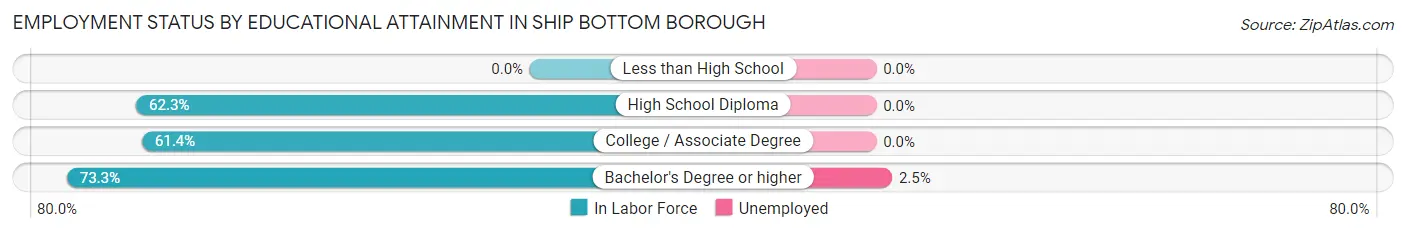
| Educational Attainment | In Labor Force | Unemployed |
| Less than High School | 0 (0.0%) | 0 (0.0%) |
| High School Diploma | 48 (62.3%) | 0 (0.0%) |
| College / Associate Degree | 70 (61.4%) | 0 (0.0%) |
| Bachelor's Degree or higher | 203 (73.3%) | 7 (2.5%) |
| Total | 321 (68.0%) | 8 (1.6%) |
Employment Occupations by Sex in Ship Bottom borough
Management, Business, Science and Arts Occupations
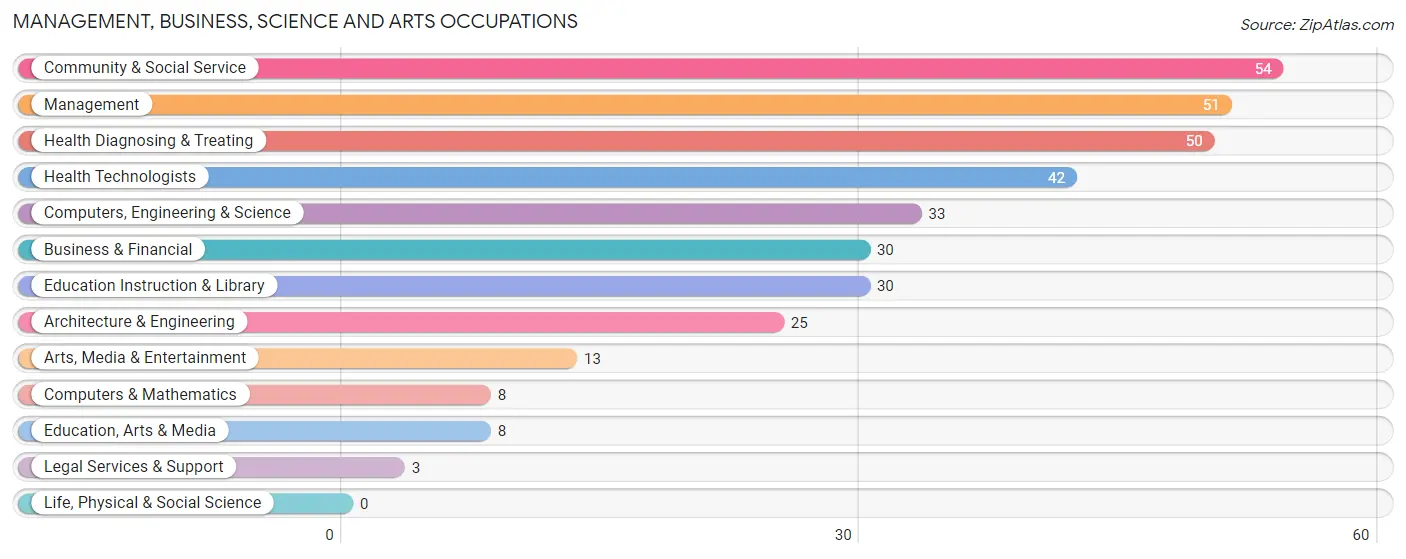
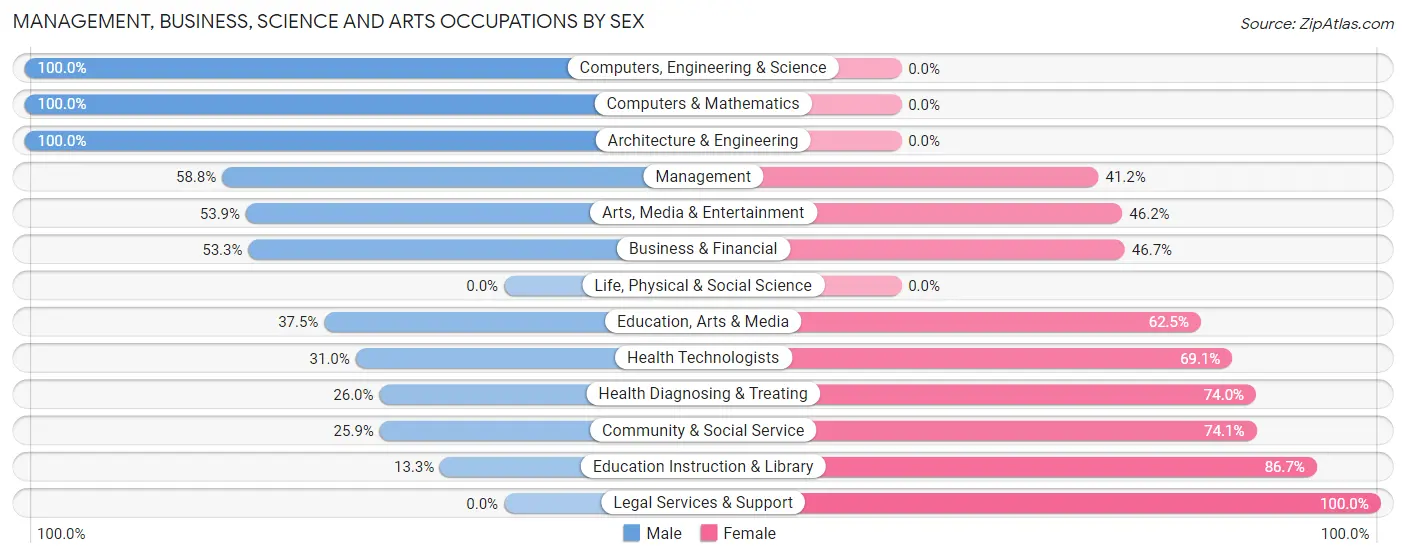
The most common Management, Business, Science and Arts occupations in Ship Bottom borough are Community & Social Service (54 | 12.9%), Management (51 | 12.1%), Health Diagnosing & Treating (50 | 11.9%), Health Technologists (42 | 10.0%), and Computers, Engineering & Science (33 | 7.9%).
Management, Business, Science and Arts Occupations by Sex
Within the Management, Business, Science and Arts occupations in Ship Bottom borough, the most male-oriented occupations are Computers, Engineering & Science (100.0%), Computers & Mathematics (100.0%), and Architecture & Engineering (100.0%), while the most female-oriented occupations are Legal Services & Support (100.0%), Education Instruction & Library (86.7%), and Community & Social Service (74.1%).
| Occupation | Male | Female |
| Management | 30 (58.8%) | 21 (41.2%) |
| Business & Financial | 16 (53.3%) | 14 (46.7%) |
| Computers, Engineering & Science | 33 (100.0%) | 0 (0.0%) |
| Computers & Mathematics | 8 (100.0%) | 0 (0.0%) |
| Architecture & Engineering | 25 (100.0%) | 0 (0.0%) |
| Life, Physical & Social Science | 0 (0.0%) | 0 (0.0%) |
| Community & Social Service | 14 (25.9%) | 40 (74.1%) |
| Education, Arts & Media | 3 (37.5%) | 5 (62.5%) |
| Legal Services & Support | 0 (0.0%) | 3 (100.0%) |
| Education Instruction & Library | 4 (13.3%) | 26 (86.7%) |
| Arts, Media & Entertainment | 7 (53.8%) | 6 (46.2%) |
| Health Diagnosing & Treating | 13 (26.0%) | 37 (74.0%) |
| Health Technologists | 13 (30.9%) | 29 (69.1%) |
| Total (Category) | 106 (48.6%) | 112 (51.4%) |
| Total (Overall) | 245 (58.3%) | 175 (41.7%) |
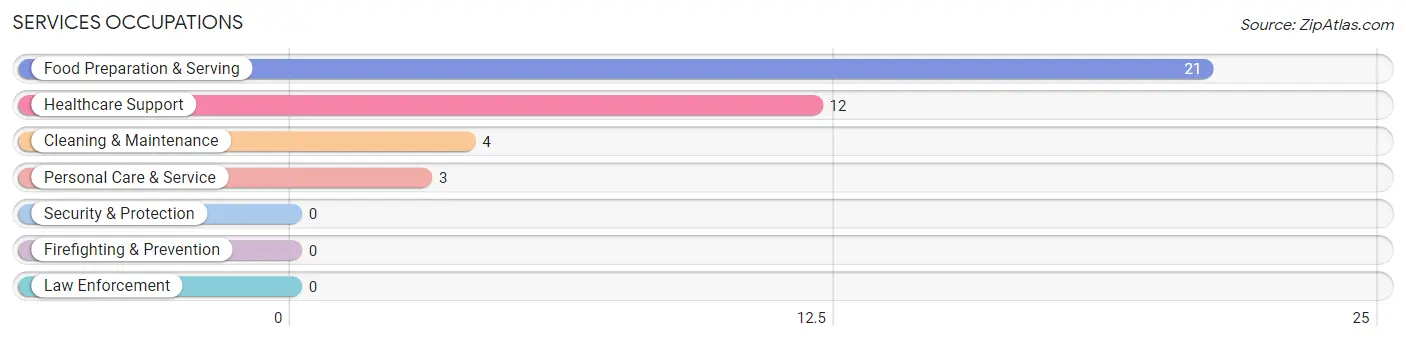
Services Occupations
The most common Services occupations in Ship Bottom borough are Food Preparation & Serving (21 | 5.0%), Healthcare Support (12 | 2.9%), Cleaning & Maintenance (4 | 0.9%), and Personal Care & Service (3 | 0.7%).
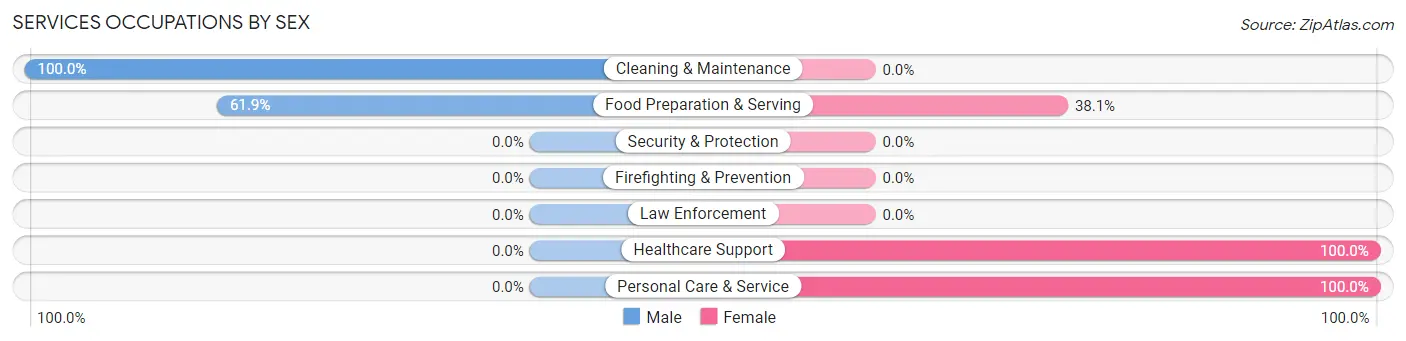
Services Occupations by Sex
Within the Services occupations in Ship Bottom borough, the most male-oriented occupations are Cleaning & Maintenance (100.0%), and Food Preparation & Serving (61.9%), while the most female-oriented occupations are Healthcare Support (100.0%), Personal Care & Service (100.0%), and Food Preparation & Serving (38.1%).
| Occupation | Male | Female |
| Healthcare Support | 0 (0.0%) | 12 (100.0%) |
| Security & Protection | 0 (0.0%) | 0 (0.0%) |
| Firefighting & Prevention | 0 (0.0%) | 0 (0.0%) |
| Law Enforcement | 0 (0.0%) | 0 (0.0%) |
| Food Preparation & Serving | 13 (61.9%) | 8 (38.1%) |
| Cleaning & Maintenance | 4 (100.0%) | 0 (0.0%) |
| Personal Care & Service | 0 (0.0%) | 3 (100.0%) |
| Total (Category) | 17 (42.5%) | 23 (57.5%) |
| Total (Overall) | 245 (58.3%) | 175 (41.7%) |
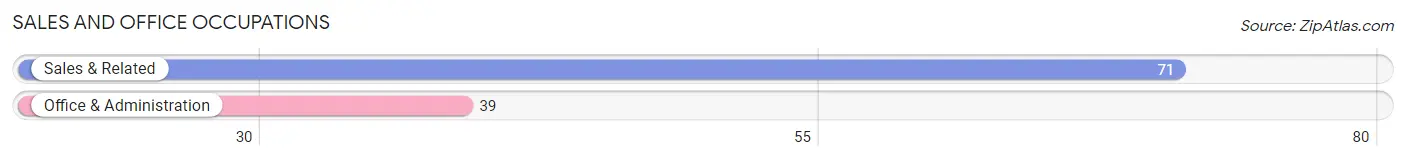
Sales and Office Occupations
The most common Sales and Office occupations in Ship Bottom borough are Sales & Related (71 | 16.9%), and Office & Administration (39 | 9.3%).
Sales and Office Occupations by Sex
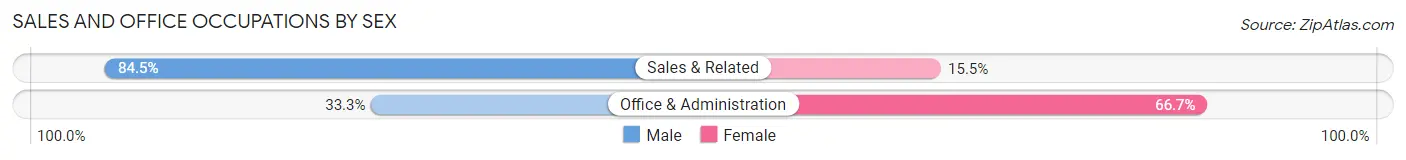
| Occupation | Male | Female |
| Sales & Related | 60 (84.5%) | 11 (15.5%) |
| Office & Administration | 13 (33.3%) | 26 (66.7%) |
| Total (Category) | 73 (66.4%) | 37 (33.6%) |
| Total (Overall) | 245 (58.3%) | 175 (41.7%) |
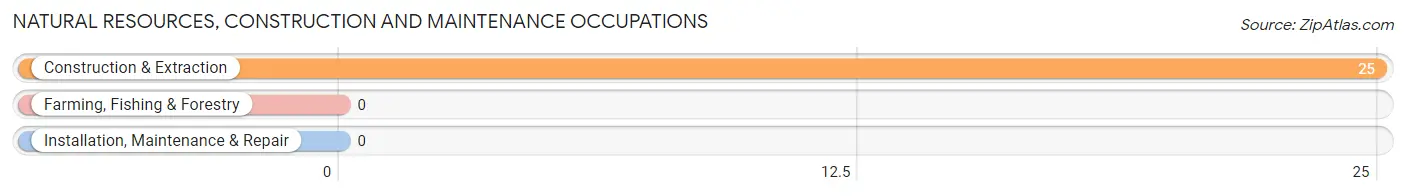
Natural Resources, Construction and Maintenance Occupations
The most common Natural Resources, Construction and Maintenance occupations in Ship Bottom borough are , and Construction & Extraction (25 | 5.9%).
Natural Resources, Construction and Maintenance Occupations by Sex
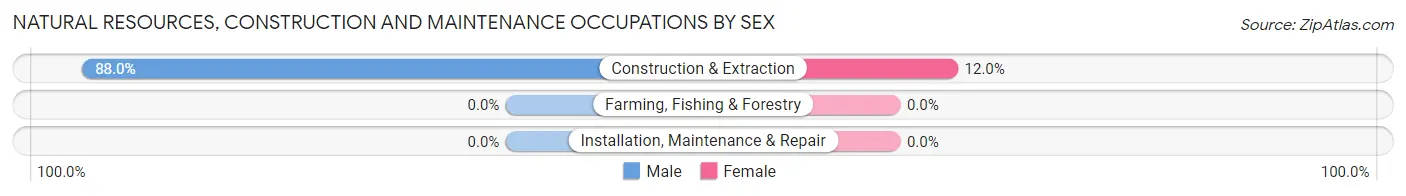
| Occupation | Male | Female |
| Farming, Fishing & Forestry | 0 (0.0%) | 0 (0.0%) |
| Construction & Extraction | 22 (88.0%) | 3 (12.0%) |
| Installation, Maintenance & Repair | 0 (0.0%) | 0 (0.0%) |
| Total (Category) | 22 (88.0%) | 3 (12.0%) |
| Total (Overall) | 245 (58.3%) | 175 (41.7%) |
Production, Transportation and Moving Occupations
The most common Production, Transportation and Moving occupations in Ship Bottom borough are Production (15 | 3.6%), Transportation (8 | 1.9%), and Material Moving (4 | 0.9%).
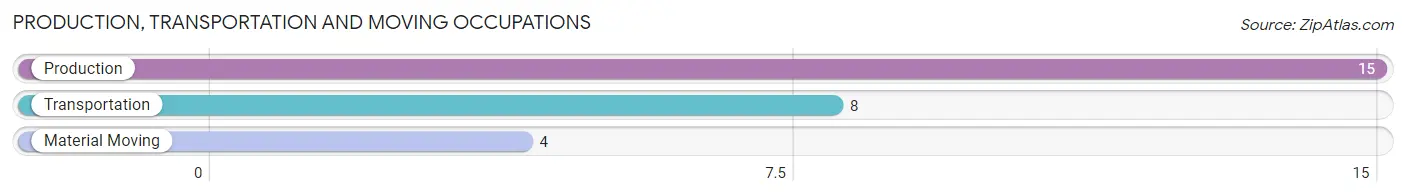
Production, Transportation and Moving Occupations by Sex
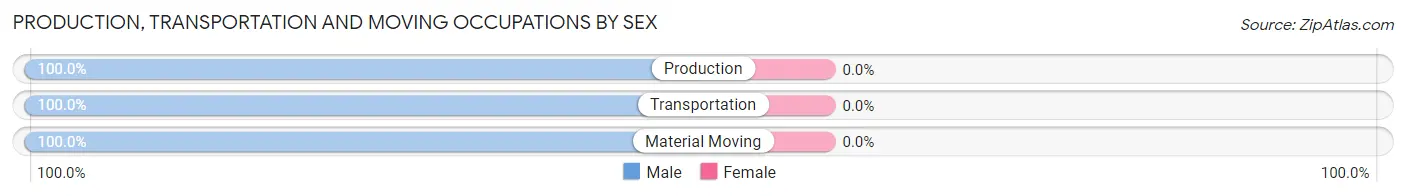
| Occupation | Male | Female |
| Production | 15 (100.0%) | 0 (0.0%) |
| Transportation | 8 (100.0%) | 0 (0.0%) |
| Material Moving | 4 (100.0%) | 0 (0.0%) |
| Total (Category) | 27 (100.0%) | 0 (0.0%) |
| Total (Overall) | 245 (58.3%) | 175 (41.7%) |
Employment Industries by Sex in Ship Bottom borough
Employment Industries in Ship Bottom borough
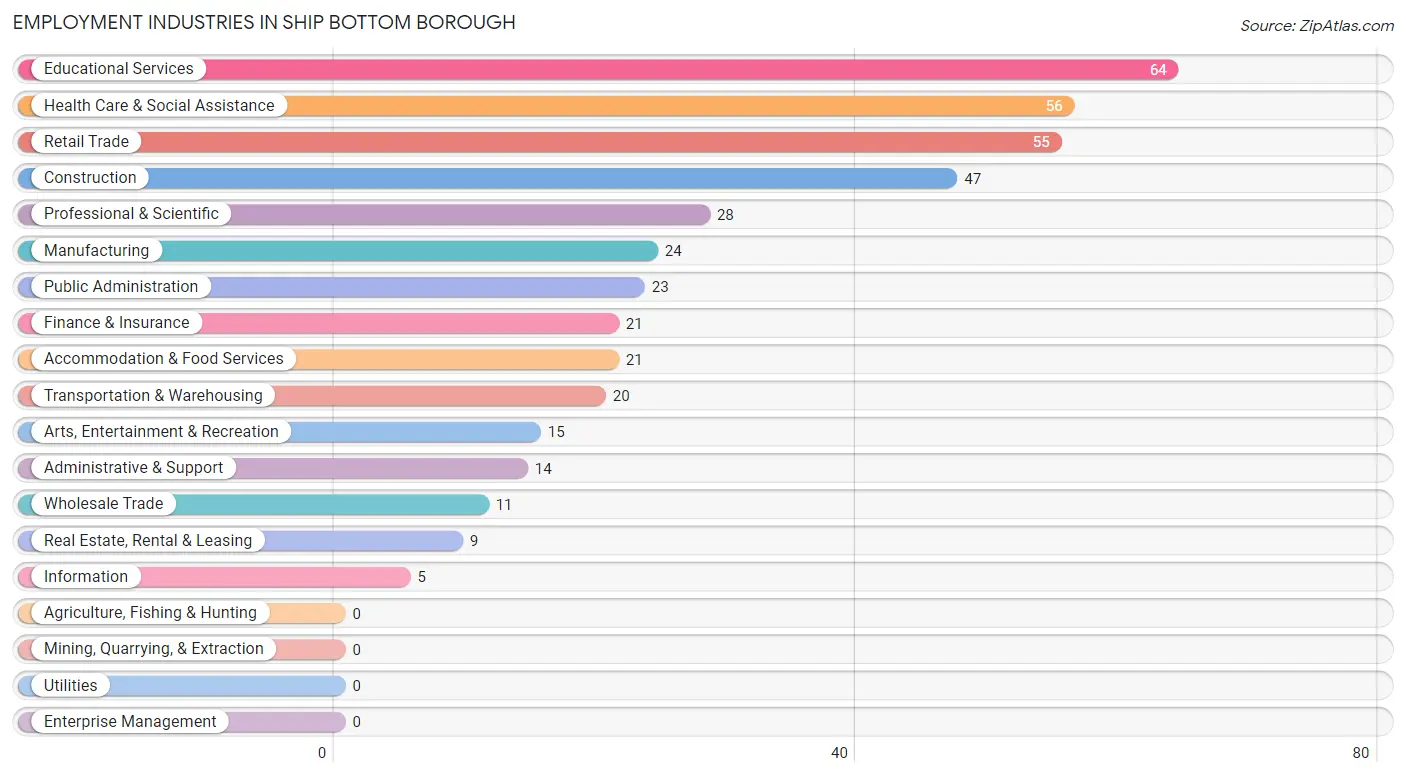
The major employment industries in Ship Bottom borough include Educational Services (64 | 15.2%), Health Care & Social Assistance (56 | 13.3%), Retail Trade (55 | 13.1%), Construction (47 | 11.2%), and Professional & Scientific (28 | 6.7%).
Employment Industries by Sex in Ship Bottom borough
The Ship Bottom borough industries that see more men than women are Information (100.0%), Real Estate, Rental & Leasing (100.0%), and Transportation & Warehousing (85.0%), whereas the industries that tend to have a higher number of women are Educational Services (89.1%), Health Care & Social Assistance (76.8%), and Finance & Insurance (57.1%).
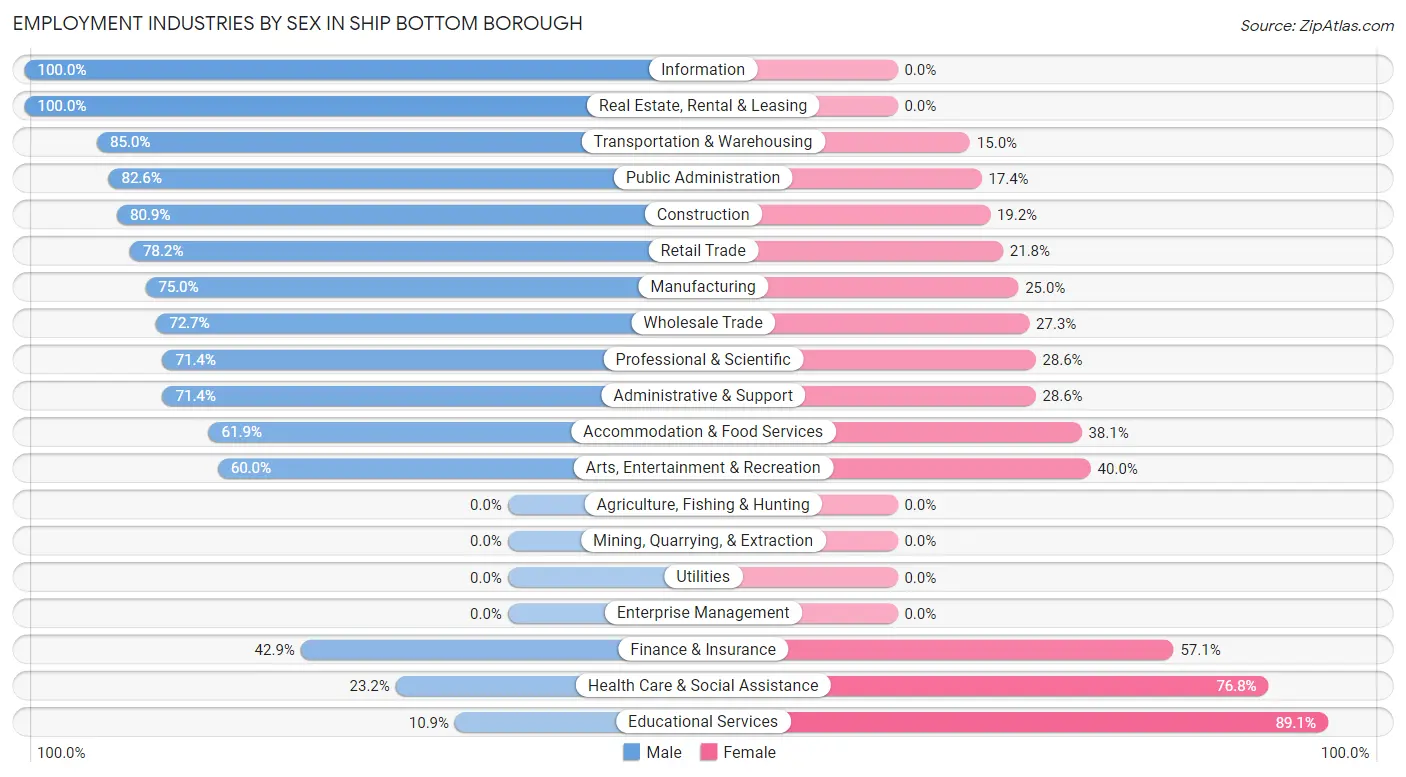
| Industry | Male | Female |
| Agriculture, Fishing & Hunting | 0 (0.0%) | 0 (0.0%) |
| Mining, Quarrying, & Extraction | 0 (0.0%) | 0 (0.0%) |
| Construction | 38 (80.8%) | 9 (19.2%) |
| Manufacturing | 18 (75.0%) | 6 (25.0%) |
| Wholesale Trade | 8 (72.7%) | 3 (27.3%) |
| Retail Trade | 43 (78.2%) | 12 (21.8%) |
| Transportation & Warehousing | 17 (85.0%) | 3 (15.0%) |
| Utilities | 0 (0.0%) | 0 (0.0%) |
| Information | 5 (100.0%) | 0 (0.0%) |
| Finance & Insurance | 9 (42.9%) | 12 (57.1%) |
| Real Estate, Rental & Leasing | 9 (100.0%) | 0 (0.0%) |
| Professional & Scientific | 20 (71.4%) | 8 (28.6%) |
| Enterprise Management | 0 (0.0%) | 0 (0.0%) |
| Administrative & Support | 10 (71.4%) | 4 (28.6%) |
| Educational Services | 7 (10.9%) | 57 (89.1%) |
| Health Care & Social Assistance | 13 (23.2%) | 43 (76.8%) |
| Arts, Entertainment & Recreation | 9 (60.0%) | 6 (40.0%) |
| Accommodation & Food Services | 13 (61.9%) | 8 (38.1%) |
| Public Administration | 19 (82.6%) | 4 (17.4%) |
| Total | 245 (58.3%) | 175 (41.7%) |
Education in Ship Bottom borough
School Enrollment in Ship Bottom borough
The most common levels of schooling among the 109 students in Ship Bottom borough are college / undergraduate (35 | 32.1%), elementary school (20 | 18.3%), and high school (18 | 16.5%).
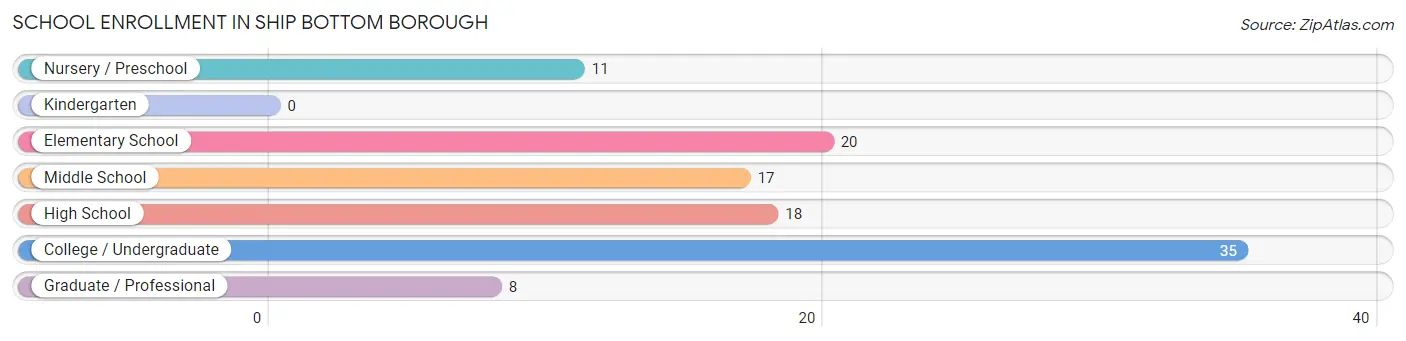
| School Level | # Students | % Students |
| Nursery / Preschool | 11 | 10.1% |
| Kindergarten | 0 | 0.0% |
| Elementary School | 20 | 18.3% |
| Middle School | 17 | 15.6% |
| High School | 18 | 16.5% |
| College / Undergraduate | 35 | 32.1% |
| Graduate / Professional | 8 | 7.3% |
| Total | 109 | 100.0% |
School Enrollment by Age by Funding Source in Ship Bottom borough
Out of a total of 109 students who are enrolled in schools in Ship Bottom borough, 7 (6.4%) attend a private institution, while the remaining 102 (93.6%) are enrolled in public schools. The age group of 15 to 17 year olds has the highest likelihood of being enrolled in private schools, with 4 (66.7% in the age bracket) enrolled. Conversely, the age group of 3 to 4 year olds has the lowest likelihood of being enrolled in a private school, with 8 (100.0% in the age bracket) attending a public institution.
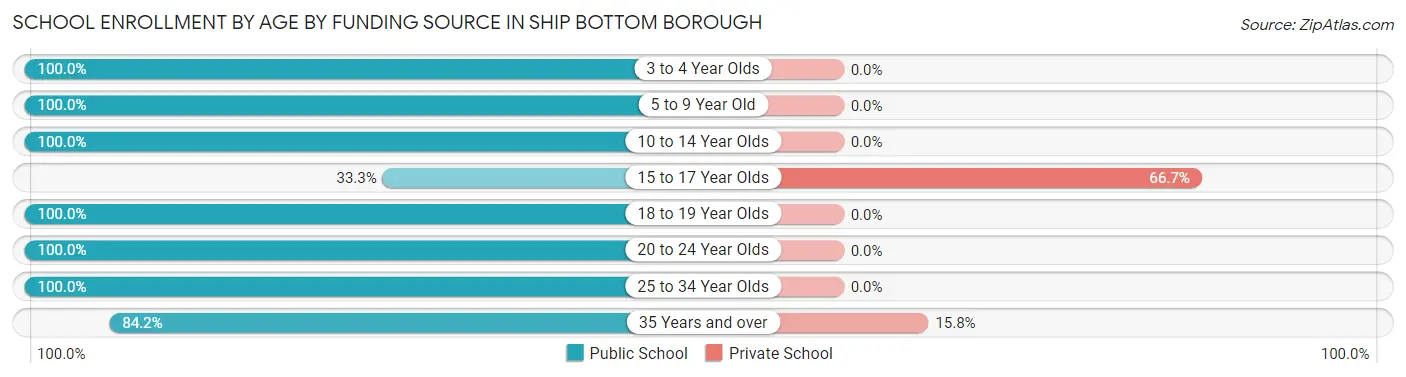
| Age Bracket | Public School | Private School |
| 3 to 4 Year Olds | 8 (100.0%) | 0 (0.0%) |
| 5 to 9 Year Old | 23 (100.0%) | 0 (0.0%) |
| 10 to 14 Year Olds | 23 (100.0%) | 0 (0.0%) |
| 15 to 17 Year Olds | 2 (33.3%) | 4 (66.7%) |
| 18 to 19 Year Olds | 10 (100.0%) | 0 (0.0%) |
| 20 to 24 Year Olds | 4 (100.0%) | 0 (0.0%) |
| 25 to 34 Year Olds | 16 (100.0%) | 0 (0.0%) |
| 35 Years and over | 16 (84.2%) | 3 (15.8%) |
| Total | 102 (93.6%) | 7 (6.4%) |
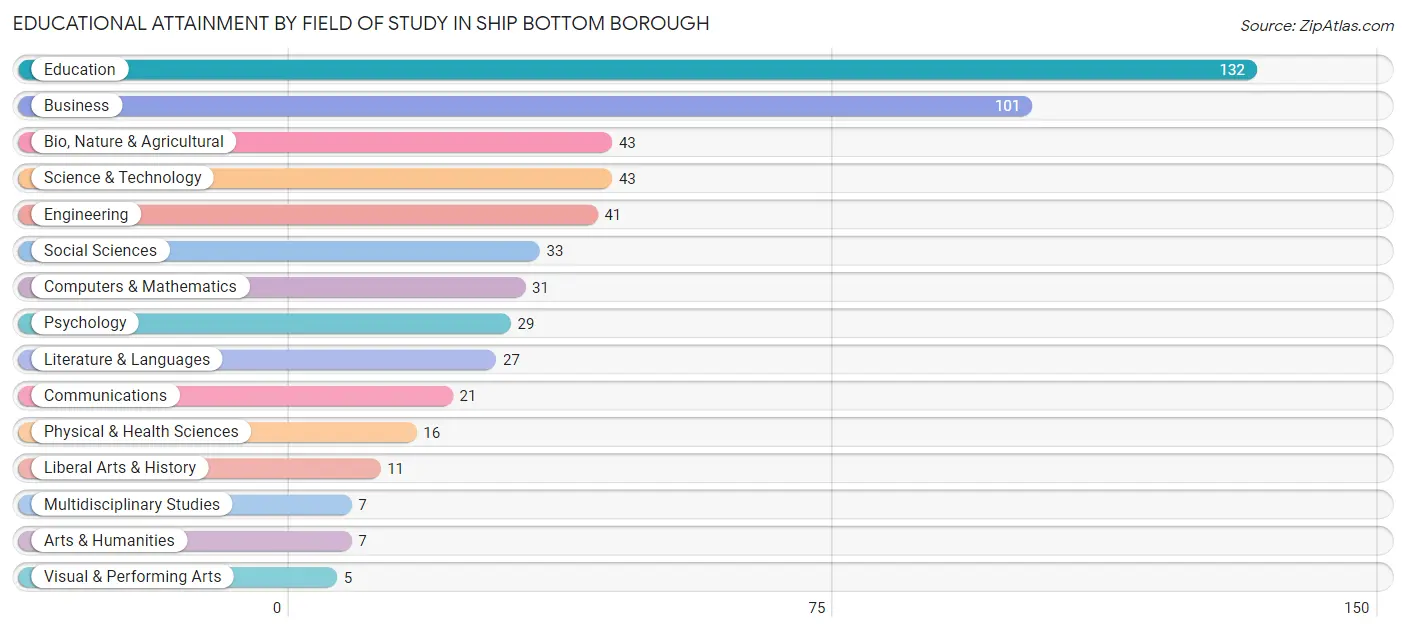
Educational Attainment by Field of Study in Ship Bottom borough
Education (132 | 24.1%), business (101 | 18.5%), bio, nature & agricultural (43 | 7.9%), science & technology (43 | 7.9%), and engineering (41 | 7.5%) are the most common fields of study among 547 individuals in Ship Bottom borough who have obtained a bachelor's degree or higher.
| Field of Study | # Graduates | % Graduates |
| Computers & Mathematics | 31 | 5.7% |
| Bio, Nature & Agricultural | 43 | 7.9% |
| Physical & Health Sciences | 16 | 2.9% |
| Psychology | 29 | 5.3% |
| Social Sciences | 33 | 6.0% |
| Engineering | 41 | 7.5% |
| Multidisciplinary Studies | 7 | 1.3% |
| Science & Technology | 43 | 7.9% |
| Business | 101 | 18.5% |
| Education | 132 | 24.1% |
| Literature & Languages | 27 | 4.9% |
| Liberal Arts & History | 11 | 2.0% |
| Visual & Performing Arts | 5 | 0.9% |
| Communications | 21 | 3.8% |
| Arts & Humanities | 7 | 1.3% |
| Total | 547 | 100.0% |
Transportation & Commute in Ship Bottom borough
Vehicle Availability by Sex in Ship Bottom borough
The most prevalent vehicle ownership categories in Ship Bottom borough are males with 2 vehicles (107, accounting for 44.4%) and females with 2 vehicles (83, making up 62.6%).
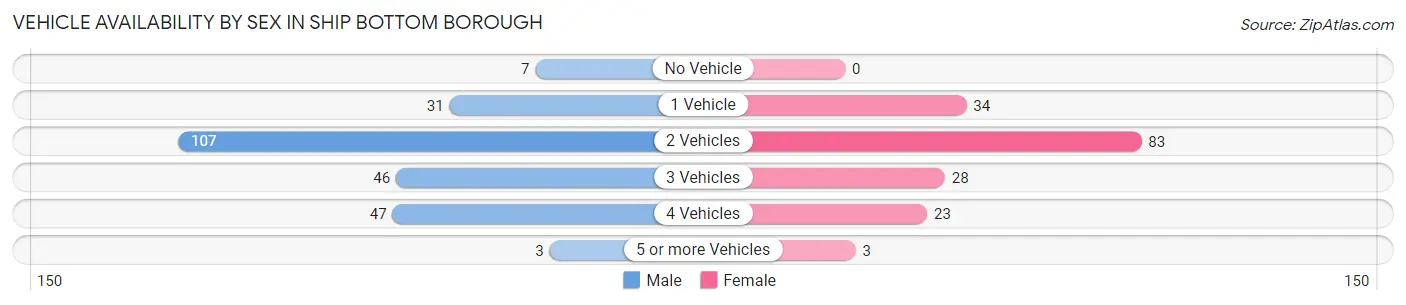
| Vehicles Available | Male | Female |
| No Vehicle | 7 (2.9%) | 0 (0.0%) |
| 1 Vehicle | 31 (12.9%) | 34 (19.9%) |
| 2 Vehicles | 107 (44.4%) | 83 (48.5%) |
| 3 Vehicles | 46 (19.1%) | 28 (16.4%) |
| 4 Vehicles | 47 (19.5%) | 23 (13.5%) |
| 5 or more Vehicles | 3 (1.2%) | 3 (1.8%) |
| Total | 241 (100.0%) | 171 (100.0%) |
Commute Time in Ship Bottom borough
The most frequently occuring commute durations in Ship Bottom borough are 5 to 9 minutes (88 commuters, 23.7%), 10 to 14 minutes (45 commuters, 12.1%), and 90 or more minutes (44 commuters, 11.9%).
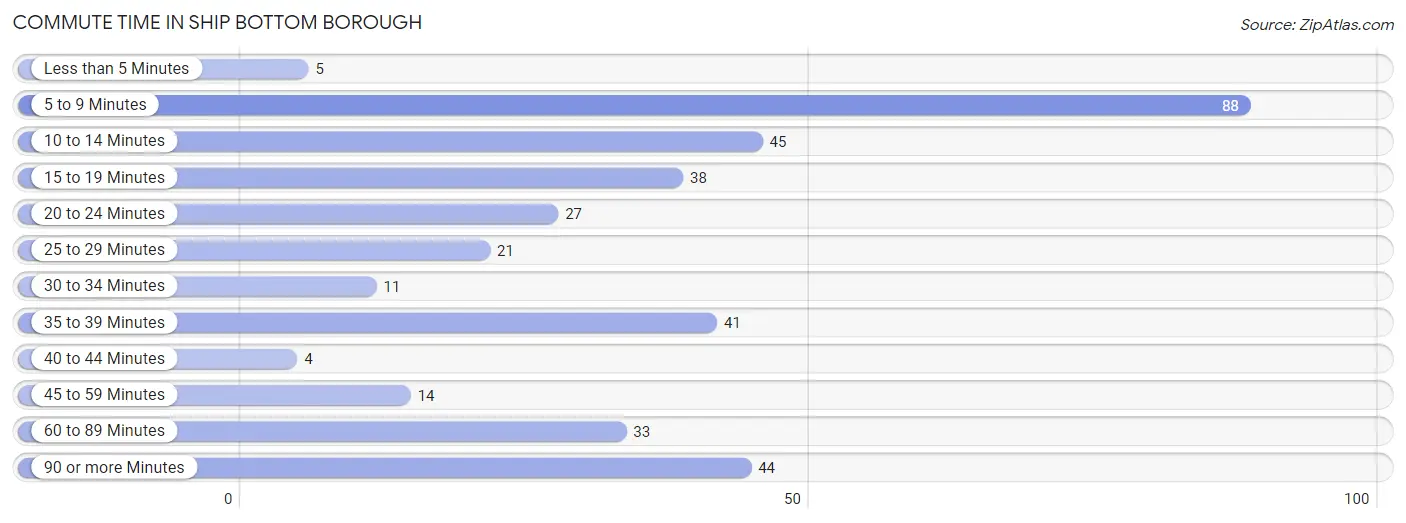
| Commute Time | # Commuters | % Commuters |
| Less than 5 Minutes | 5 | 1.3% |
| 5 to 9 Minutes | 88 | 23.7% |
| 10 to 14 Minutes | 45 | 12.1% |
| 15 to 19 Minutes | 38 | 10.2% |
| 20 to 24 Minutes | 27 | 7.3% |
| 25 to 29 Minutes | 21 | 5.7% |
| 30 to 34 Minutes | 11 | 3.0% |
| 35 to 39 Minutes | 41 | 11.1% |
| 40 to 44 Minutes | 4 | 1.1% |
| 45 to 59 Minutes | 14 | 3.8% |
| 60 to 89 Minutes | 33 | 8.9% |
| 90 or more Minutes | 44 | 11.9% |
Commute Time by Sex in Ship Bottom borough
The most common commute times in Ship Bottom borough are 5 to 9 minutes (50 commuters, 22.0%) for males and 5 to 9 minutes (38 commuters, 26.4%) for females.
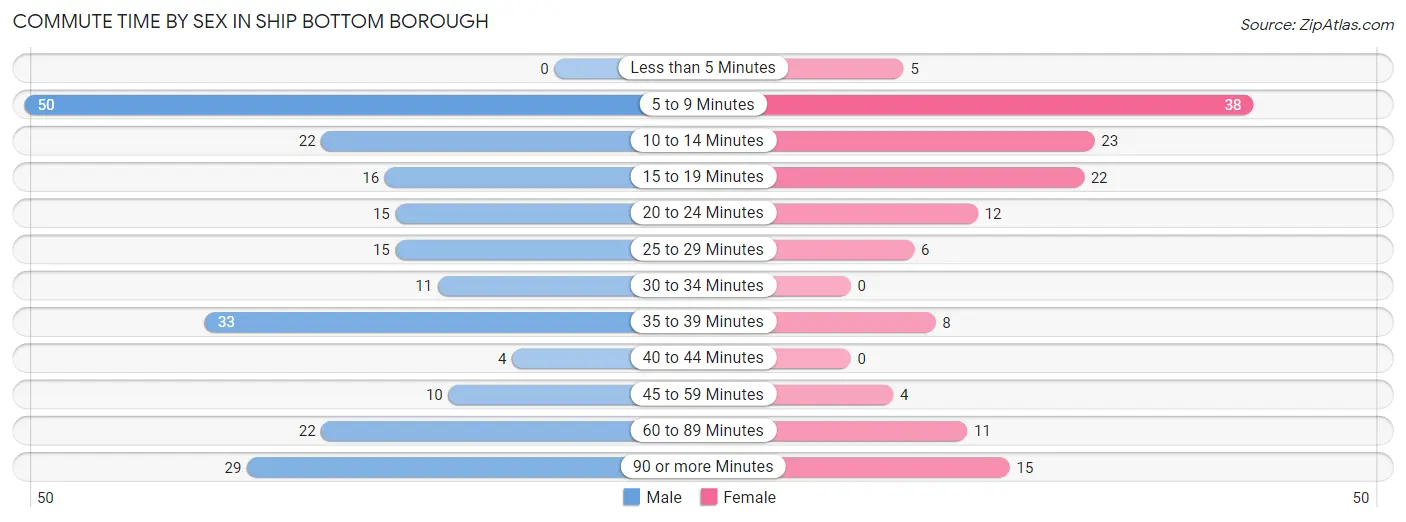
| Commute Time | Male | Female |
| Less than 5 Minutes | 0 (0.0%) | 5 (3.5%) |
| 5 to 9 Minutes | 50 (22.0%) | 38 (26.4%) |
| 10 to 14 Minutes | 22 (9.7%) | 23 (16.0%) |
| 15 to 19 Minutes | 16 (7.0%) | 22 (15.3%) |
| 20 to 24 Minutes | 15 (6.6%) | 12 (8.3%) |
| 25 to 29 Minutes | 15 (6.6%) | 6 (4.2%) |
| 30 to 34 Minutes | 11 (4.9%) | 0 (0.0%) |
| 35 to 39 Minutes | 33 (14.5%) | 8 (5.6%) |
| 40 to 44 Minutes | 4 (1.8%) | 0 (0.0%) |
| 45 to 59 Minutes | 10 (4.4%) | 4 (2.8%) |
| 60 to 89 Minutes | 22 (9.7%) | 11 (7.6%) |
| 90 or more Minutes | 29 (12.8%) | 15 (10.4%) |
Time of Departure to Work by Sex in Ship Bottom borough
The most frequent times of departure to work in Ship Bottom borough are 7:30 AM to 7:59 AM (53, 23.4%) for males and 7:30 AM to 7:59 AM (50, 34.7%) for females.
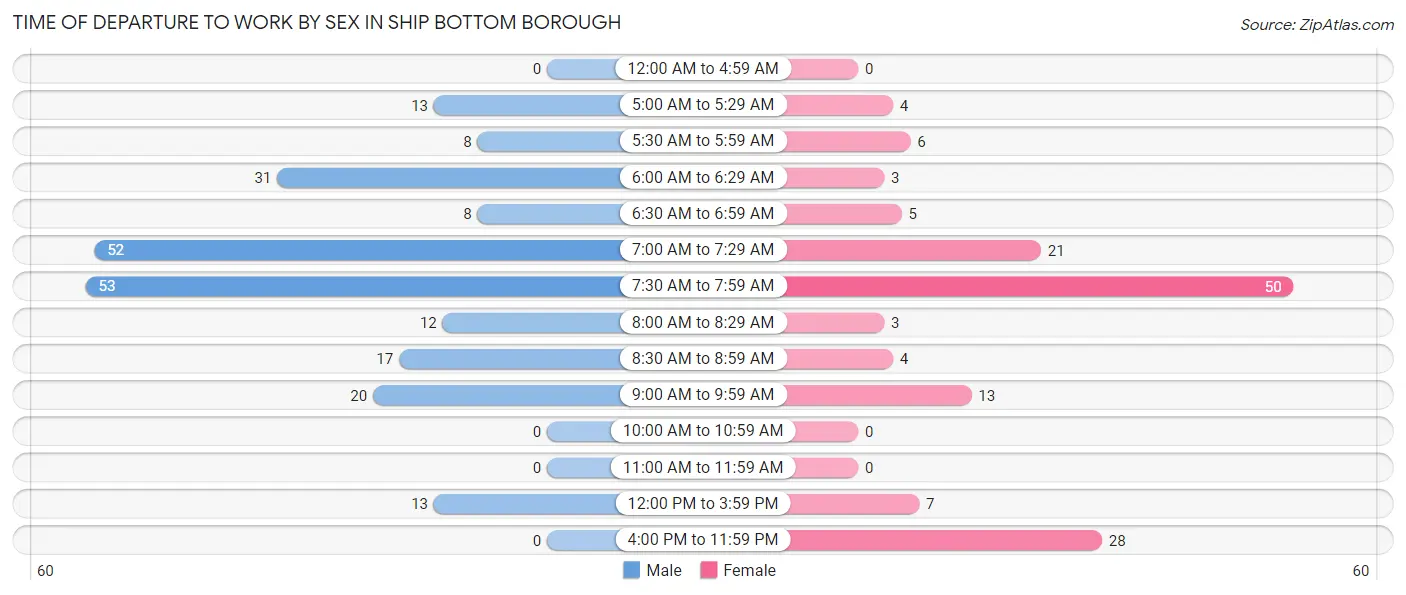
| Time of Departure | Male | Female |
| 12:00 AM to 4:59 AM | 0 (0.0%) | 0 (0.0%) |
| 5:00 AM to 5:29 AM | 13 (5.7%) | 4 (2.8%) |
| 5:30 AM to 5:59 AM | 8 (3.5%) | 6 (4.2%) |
| 6:00 AM to 6:29 AM | 31 (13.7%) | 3 (2.1%) |
| 6:30 AM to 6:59 AM | 8 (3.5%) | 5 (3.5%) |
| 7:00 AM to 7:29 AM | 52 (22.9%) | 21 (14.6%) |
| 7:30 AM to 7:59 AM | 53 (23.4%) | 50 (34.7%) |
| 8:00 AM to 8:29 AM | 12 (5.3%) | 3 (2.1%) |
| 8:30 AM to 8:59 AM | 17 (7.5%) | 4 (2.8%) |
| 9:00 AM to 9:59 AM | 20 (8.8%) | 13 (9.0%) |
| 10:00 AM to 10:59 AM | 0 (0.0%) | 0 (0.0%) |
| 11:00 AM to 11:59 AM | 0 (0.0%) | 0 (0.0%) |
| 12:00 PM to 3:59 PM | 13 (5.7%) | 7 (4.9%) |
| 4:00 PM to 11:59 PM | 0 (0.0%) | 28 (19.4%) |
| Total | 227 (100.0%) | 144 (100.0%) |
Housing Occupancy in Ship Bottom borough
Occupancy by Ownership in Ship Bottom borough
Of the total 500 dwellings in Ship Bottom borough, owner-occupied units account for 454 (90.8%), while renter-occupied units make up 46 (9.2%).
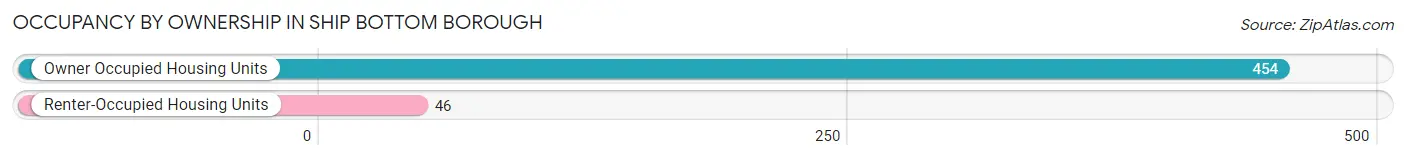
| Occupancy | # Housing Units | % Housing Units |
| Owner Occupied Housing Units | 454 | 90.8% |
| Renter-Occupied Housing Units | 46 | 9.2% |
| Total Occupied Housing Units | 500 | 100.0% |
Occupancy by Household Size in Ship Bottom borough
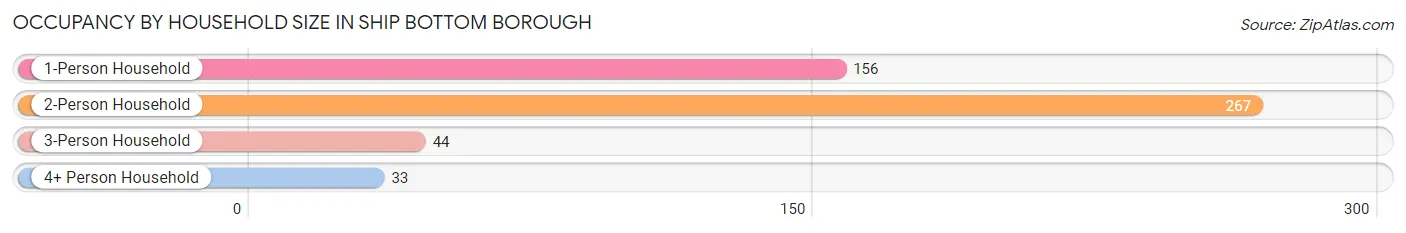
| Household Size | # Housing Units | % Housing Units |
| 1-Person Household | 156 | 31.2% |
| 2-Person Household | 267 | 53.4% |
| 3-Person Household | 44 | 8.8% |
| 4+ Person Household | 33 | 6.6% |
| Total Housing Units | 500 | 100.0% |
Occupancy by Ownership by Household Size in Ship Bottom borough
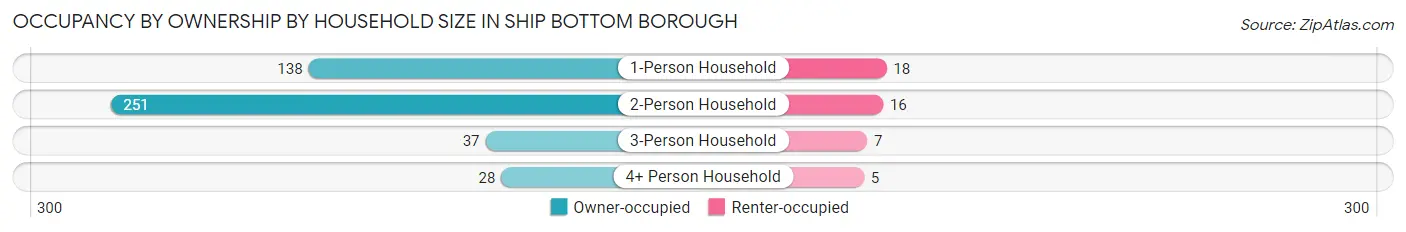
| Household Size | Owner-occupied | Renter-occupied |
| 1-Person Household | 138 (88.5%) | 18 (11.5%) |
| 2-Person Household | 251 (94.0%) | 16 (6.0%) |
| 3-Person Household | 37 (84.1%) | 7 (15.9%) |
| 4+ Person Household | 28 (84.9%) | 5 (15.1%) |
| Total Housing Units | 454 (90.8%) | 46 (9.2%) |
Occupancy by Educational Attainment in Ship Bottom borough
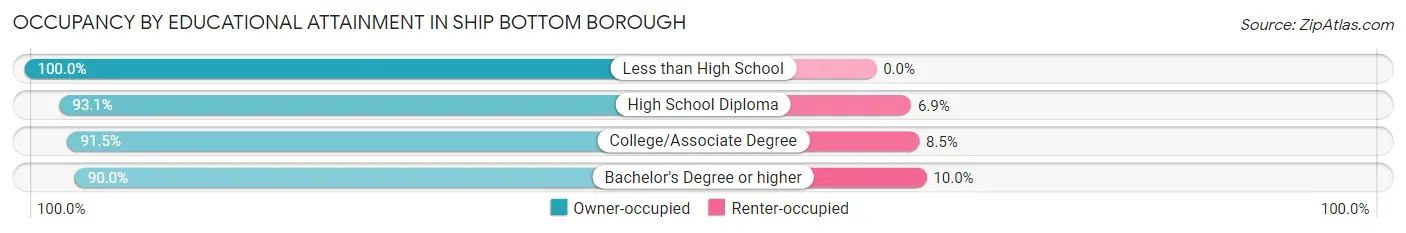
| Household Size | Owner-occupied | Renter-occupied |
| Less than High School | 7 (100.0%) | 0 (0.0%) |
| High School Diploma | 54 (93.1%) | 4 (6.9%) |
| College/Associate Degree | 86 (91.5%) | 8 (8.5%) |
| Bachelor's Degree or higher | 307 (90.0%) | 34 (10.0%) |
Occupancy by Age of Householder in Ship Bottom borough
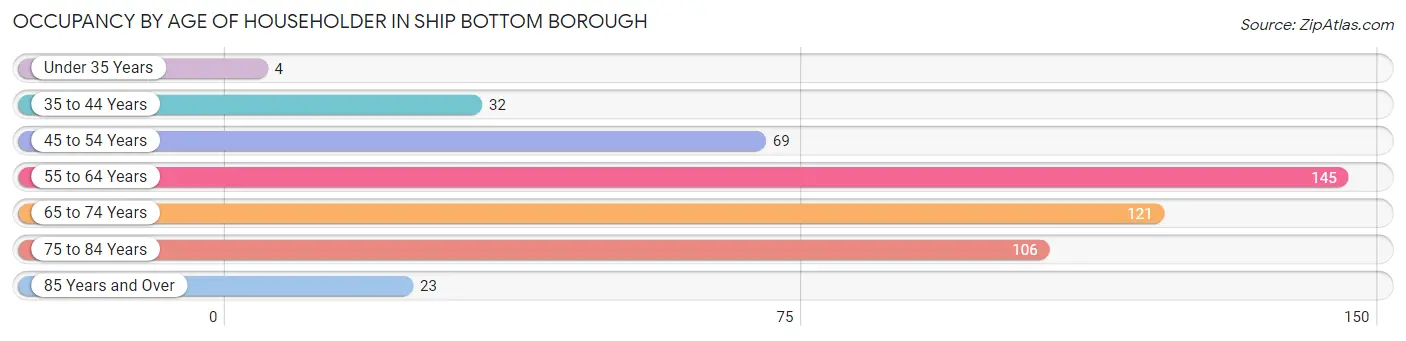
| Age Bracket | # Households | % Households |
| Under 35 Years | 4 | 0.8% |
| 35 to 44 Years | 32 | 6.4% |
| 45 to 54 Years | 69 | 13.8% |
| 55 to 64 Years | 145 | 29.0% |
| 65 to 74 Years | 121 | 24.2% |
| 75 to 84 Years | 106 | 21.2% |
| 85 Years and Over | 23 | 4.6% |
| Total | 500 | 100.0% |
Housing Finances in Ship Bottom borough
Median Income by Occupancy in Ship Bottom borough
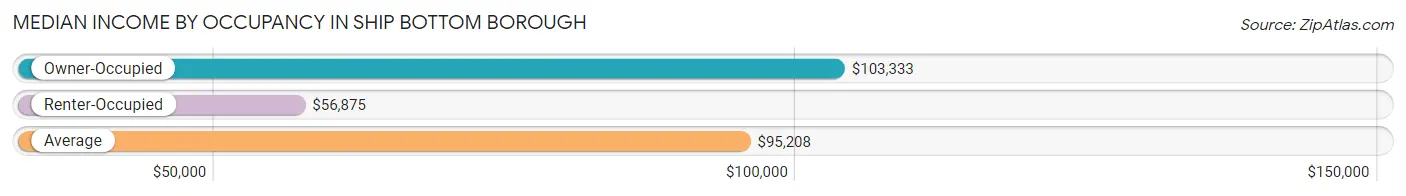
| Occupancy Type | # Households | Median Income |
| Owner-Occupied | 454 (90.8%) | $103,333 |
| Renter-Occupied | 46 (9.2%) | $56,875 |
| Average | 500 (100.0%) | $95,208 |
Occupancy by Householder Income Bracket in Ship Bottom borough
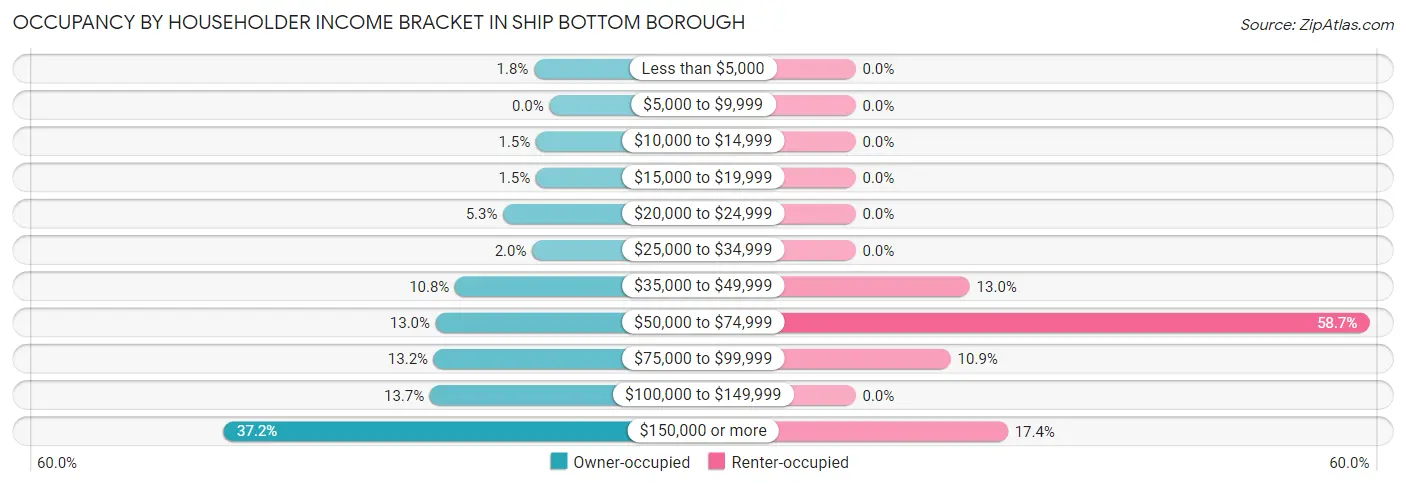
| Income Bracket | Owner-occupied | Renter-occupied |
| Less than $5,000 | 8 (1.8%) | 0 (0.0%) |
| $5,000 to $9,999 | 0 (0.0%) | 0 (0.0%) |
| $10,000 to $14,999 | 7 (1.5%) | 0 (0.0%) |
| $15,000 to $19,999 | 7 (1.5%) | 0 (0.0%) |
| $20,000 to $24,999 | 24 (5.3%) | 0 (0.0%) |
| $25,000 to $34,999 | 9 (2.0%) | 0 (0.0%) |
| $35,000 to $49,999 | 49 (10.8%) | 6 (13.0%) |
| $50,000 to $74,999 | 59 (13.0%) | 27 (58.7%) |
| $75,000 to $99,999 | 60 (13.2%) | 5 (10.9%) |
| $100,000 to $149,999 | 62 (13.7%) | 0 (0.0%) |
| $150,000 or more | 169 (37.2%) | 8 (17.4%) |
| Total | 454 (100.0%) | 46 (100.0%) |
Monthly Housing Cost Tiers in Ship Bottom borough
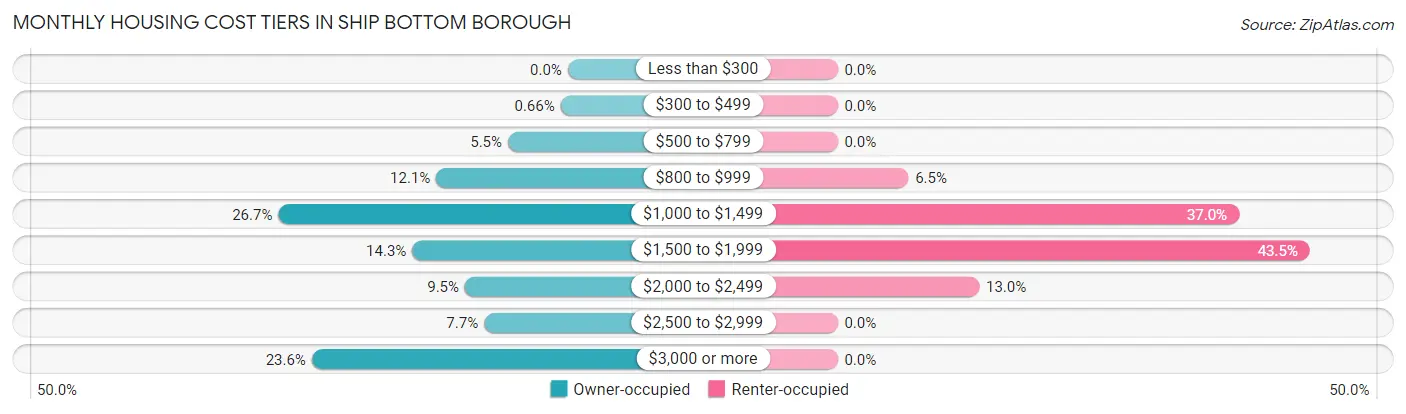
| Monthly Cost | Owner-occupied | Renter-occupied |
| Less than $300 | 0 (0.0%) | 0 (0.0%) |
| $300 to $499 | 3 (0.7%) | 0 (0.0%) |
| $500 to $799 | 25 (5.5%) | 0 (0.0%) |
| $800 to $999 | 55 (12.1%) | 3 (6.5%) |
| $1,000 to $1,499 | 121 (26.7%) | 17 (37.0%) |
| $1,500 to $1,999 | 65 (14.3%) | 20 (43.5%) |
| $2,000 to $2,499 | 43 (9.5%) | 6 (13.0%) |
| $2,500 to $2,999 | 35 (7.7%) | 0 (0.0%) |
| $3,000 or more | 107 (23.6%) | 0 (0.0%) |
| Total | 454 (100.0%) | 46 (100.0%) |
Physical Housing Characteristics in Ship Bottom borough
Housing Structures in Ship Bottom borough
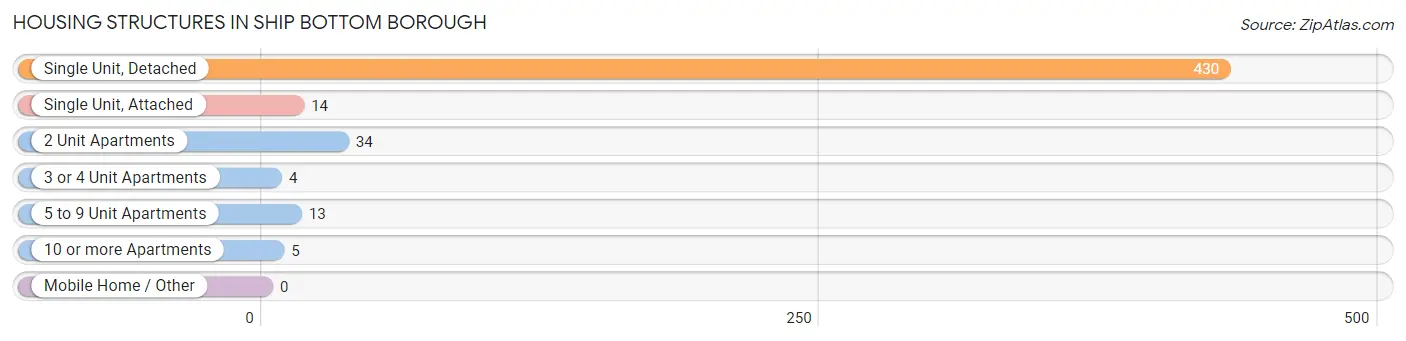
| Structure Type | # Housing Units | % Housing Units |
| Single Unit, Detached | 430 | 86.0% |
| Single Unit, Attached | 14 | 2.8% |
| 2 Unit Apartments | 34 | 6.8% |
| 3 or 4 Unit Apartments | 4 | 0.8% |
| 5 to 9 Unit Apartments | 13 | 2.6% |
| 10 or more Apartments | 5 | 1.0% |
| Mobile Home / Other | 0 | 0.0% |
| Total | 500 | 100.0% |
Housing Structures by Occupancy in Ship Bottom borough
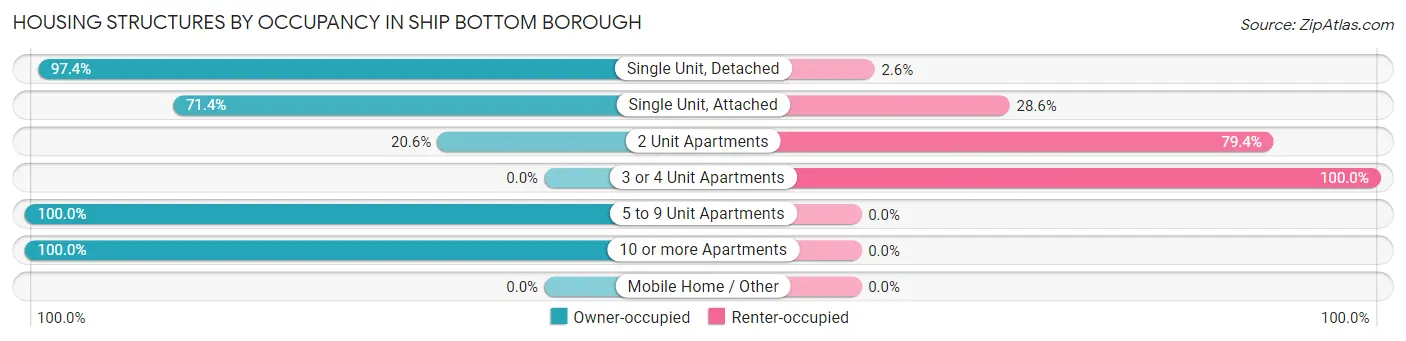
| Structure Type | Owner-occupied | Renter-occupied |
| Single Unit, Detached | 419 (97.4%) | 11 (2.6%) |
| Single Unit, Attached | 10 (71.4%) | 4 (28.6%) |
| 2 Unit Apartments | 7 (20.6%) | 27 (79.4%) |
| 3 or 4 Unit Apartments | 0 (0.0%) | 4 (100.0%) |
| 5 to 9 Unit Apartments | 13 (100.0%) | 0 (0.0%) |
| 10 or more Apartments | 5 (100.0%) | 0 (0.0%) |
| Mobile Home / Other | 0 (0.0%) | 0 (0.0%) |
| Total | 454 (90.8%) | 46 (9.2%) |
Housing Structures by Number of Rooms in Ship Bottom borough
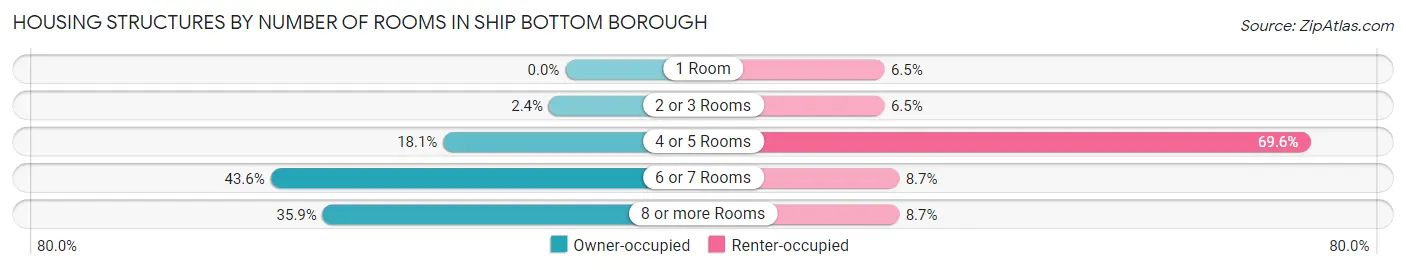
| Number of Rooms | Owner-occupied | Renter-occupied |
| 1 Room | 0 (0.0%) | 3 (6.5%) |
| 2 or 3 Rooms | 11 (2.4%) | 3 (6.5%) |
| 4 or 5 Rooms | 82 (18.1%) | 32 (69.6%) |
| 6 or 7 Rooms | 198 (43.6%) | 4 (8.7%) |
| 8 or more Rooms | 163 (35.9%) | 4 (8.7%) |
| Total | 454 (100.0%) | 46 (100.0%) |
Housing Structure by Heating Type in Ship Bottom borough
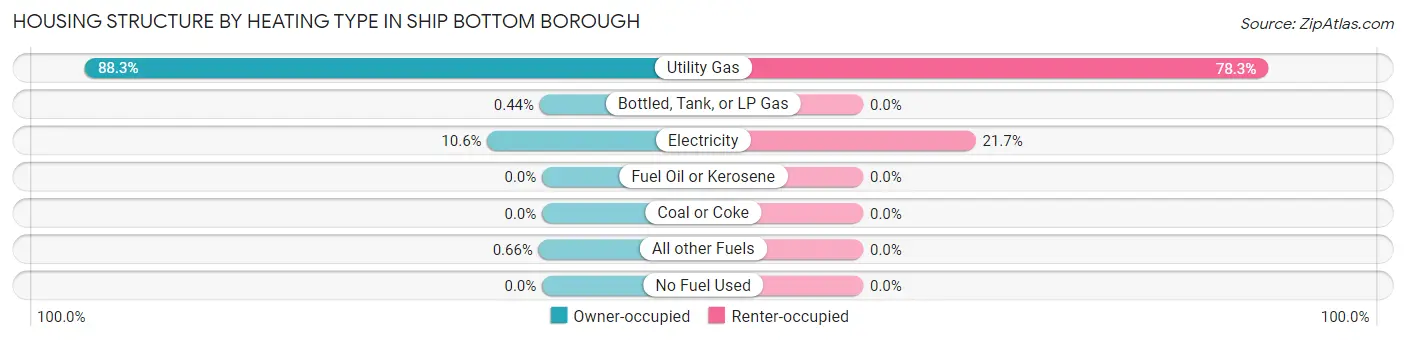
| Heating Type | Owner-occupied | Renter-occupied |
| Utility Gas | 401 (88.3%) | 36 (78.3%) |
| Bottled, Tank, or LP Gas | 2 (0.4%) | 0 (0.0%) |
| Electricity | 48 (10.6%) | 10 (21.7%) |
| Fuel Oil or Kerosene | 0 (0.0%) | 0 (0.0%) |
| Coal or Coke | 0 (0.0%) | 0 (0.0%) |
| All other Fuels | 3 (0.7%) | 0 (0.0%) |
| No Fuel Used | 0 (0.0%) | 0 (0.0%) |
| Total | 454 (100.0%) | 46 (100.0%) |
Household Vehicle Usage in Ship Bottom borough
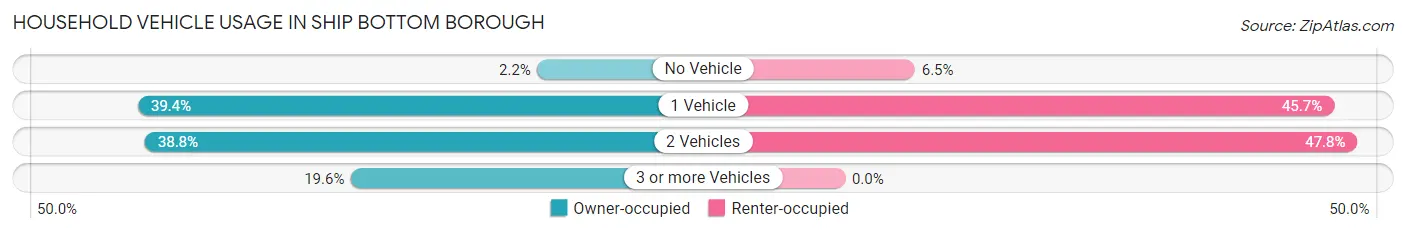
| Vehicles per Household | Owner-occupied | Renter-occupied |
| No Vehicle | 10 (2.2%) | 3 (6.5%) |
| 1 Vehicle | 179 (39.4%) | 21 (45.7%) |
| 2 Vehicles | 176 (38.8%) | 22 (47.8%) |
| 3 or more Vehicles | 89 (19.6%) | 0 (0.0%) |
| Total | 454 (100.0%) | 46 (100.0%) |
Real Estate & Mortgages in Ship Bottom borough
Real Estate and Mortgage Overview in Ship Bottom borough
| Characteristic | Without Mortgage | With Mortgage |
| Housing Units | 244 | 210 |
| Median Property Value | $826,900 | $869,900 |
| Median Household Income | $81,667 | $99 |
| Monthly Housing Costs | $1,123 | $101 |
| Real Estate Taxes | $7,821 | $0 |
Property Value by Mortgage Status in Ship Bottom borough
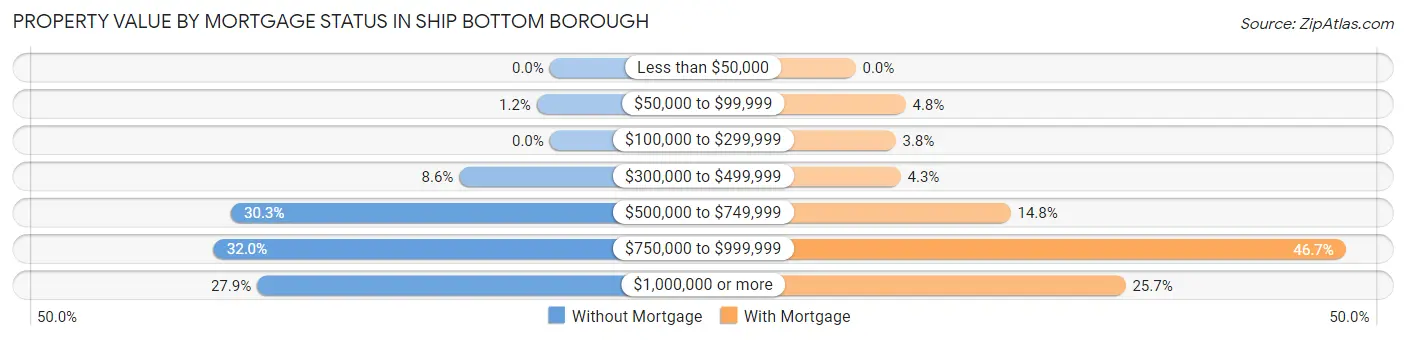
| Property Value | Without Mortgage | With Mortgage |
| Less than $50,000 | 0 (0.0%) | 0 (0.0%) |
| $50,000 to $99,999 | 3 (1.2%) | 10 (4.8%) |
| $100,000 to $299,999 | 0 (0.0%) | 8 (3.8%) |
| $300,000 to $499,999 | 21 (8.6%) | 9 (4.3%) |
| $500,000 to $749,999 | 74 (30.3%) | 31 (14.8%) |
| $750,000 to $999,999 | 78 (32.0%) | 98 (46.7%) |
| $1,000,000 or more | 68 (27.9%) | 54 (25.7%) |
| Total | 244 (100.0%) | 210 (100.0%) |
Household Income by Mortgage Status in Ship Bottom borough
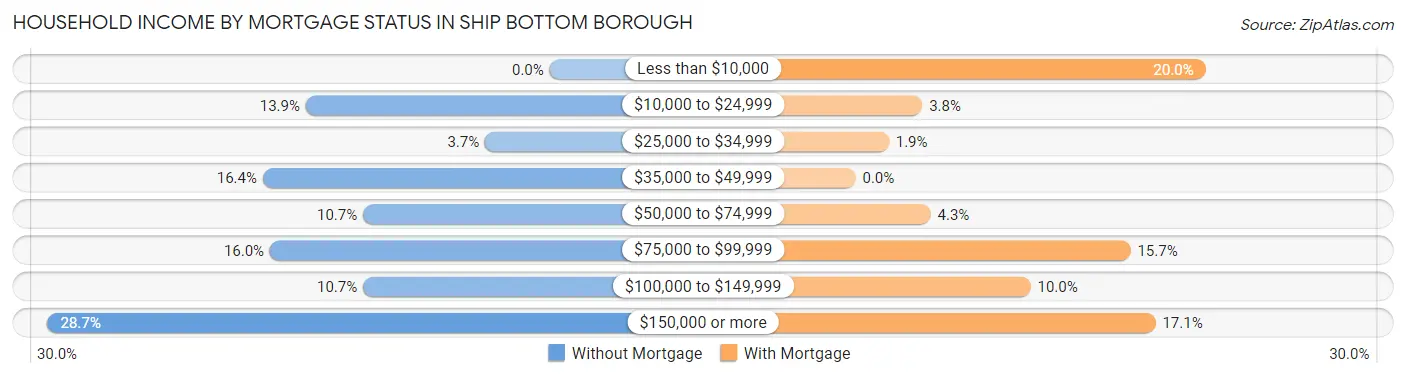
| Household Income | Without Mortgage | With Mortgage |
| Less than $10,000 | 0 (0.0%) | 42 (20.0%) |
| $10,000 to $24,999 | 34 (13.9%) | 8 (3.8%) |
| $25,000 to $34,999 | 9 (3.7%) | 4 (1.9%) |
| $35,000 to $49,999 | 40 (16.4%) | 0 (0.0%) |
| $50,000 to $74,999 | 26 (10.7%) | 9 (4.3%) |
| $75,000 to $99,999 | 39 (16.0%) | 33 (15.7%) |
| $100,000 to $149,999 | 26 (10.7%) | 21 (10.0%) |
| $150,000 or more | 70 (28.7%) | 36 (17.1%) |
| Total | 244 (100.0%) | 210 (100.0%) |
Property Value to Household Income Ratio in Ship Bottom borough
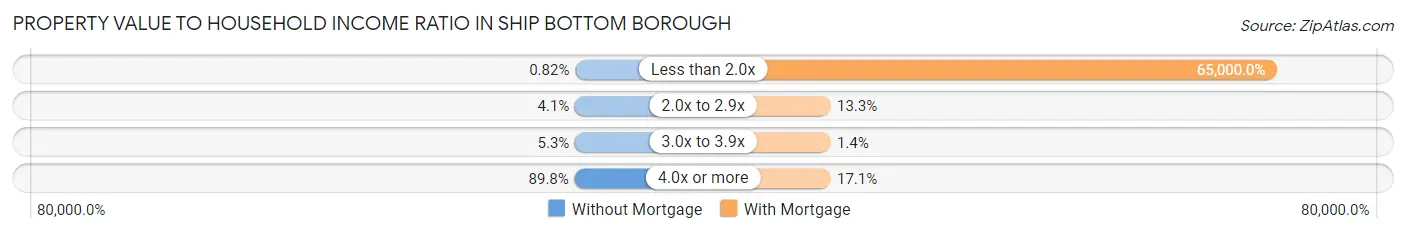
| Value-to-Income Ratio | Without Mortgage | With Mortgage |
| Less than 2.0x | 2 (0.8%) | 136,500 (65,000.0%) |
| 2.0x to 2.9x | 10 (4.1%) | 28 (13.3%) |
| 3.0x to 3.9x | 13 (5.3%) | 3 (1.4%) |
| 4.0x or more | 219 (89.7%) | 36 (17.1%) |
| Total | 244 (100.0%) | 210 (100.0%) |
Real Estate Taxes by Mortgage Status in Ship Bottom borough
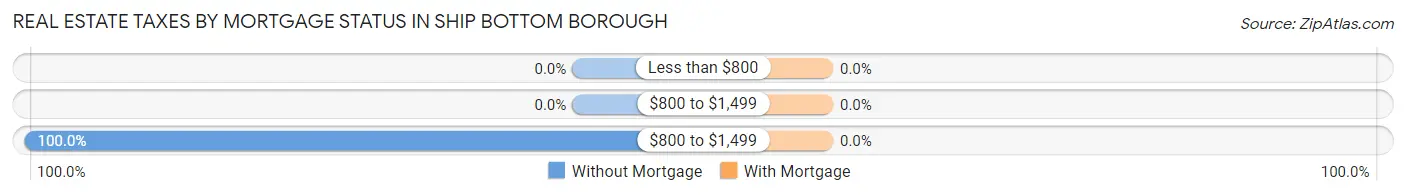
| Property Taxes | Without Mortgage | With Mortgage |
| Less than $800 | 0 (0.0%) | 0 (0.0%) |
| $800 to $1,499 | 0 (0.0%) | 0 (0.0%) |
| $800 to $1,499 | 244 (100.0%) | 0 (0.0%) |
| Total | 244 (100.0%) | 210 (100.0%) |
Health & Disability in Ship Bottom borough
Health Insurance Coverage by Age in Ship Bottom borough
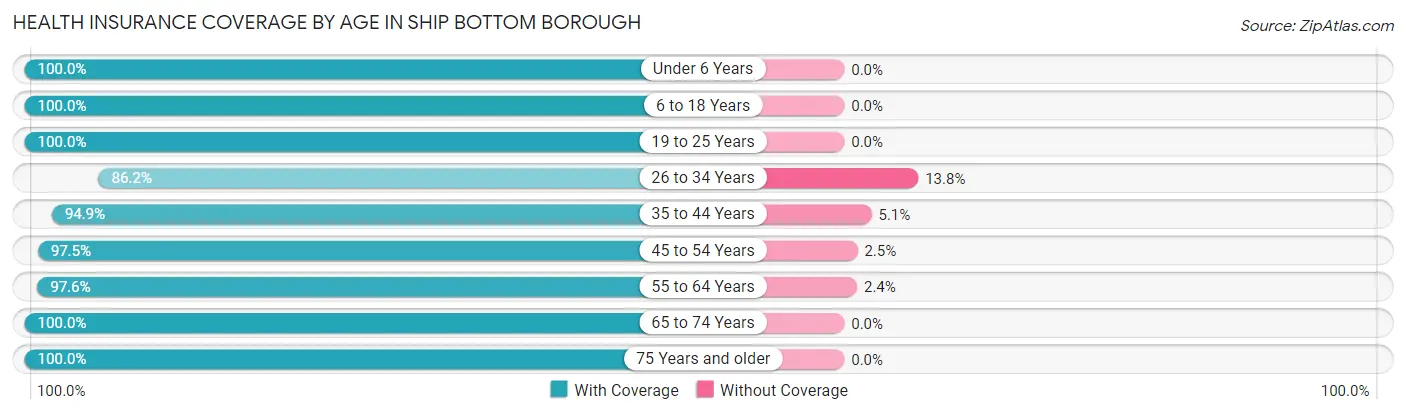
| Age Bracket | With Coverage | Without Coverage |
| Under 6 Years | 14 (100.0%) | 0 (0.0%) |
| 6 to 18 Years | 55 (100.0%) | 0 (0.0%) |
| 19 to 25 Years | 49 (100.0%) | 0 (0.0%) |
| 26 to 34 Years | 25 (86.2%) | 4 (13.8%) |
| 35 to 44 Years | 56 (94.9%) | 3 (5.1%) |
| 45 to 54 Years | 119 (97.5%) | 3 (2.5%) |
| 55 to 64 Years | 246 (97.6%) | 6 (2.4%) |
| 65 to 74 Years | 224 (100.0%) | 0 (0.0%) |
| 75 Years and older | 191 (100.0%) | 0 (0.0%) |
| Total | 979 (98.4%) | 16 (1.6%) |
Health Insurance Coverage by Citizenship Status in Ship Bottom borough
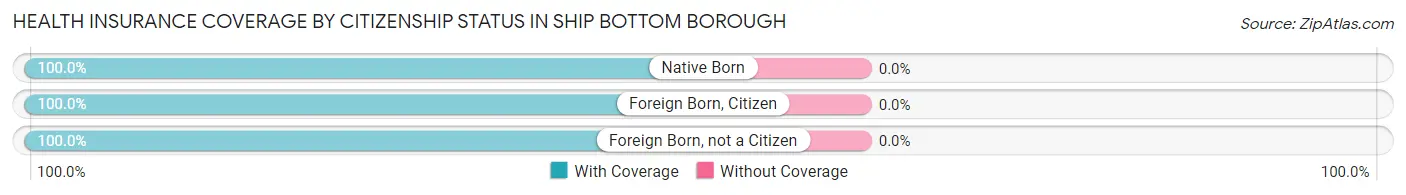
| Citizenship Status | With Coverage | Without Coverage |
| Native Born | 14 (100.0%) | 0 (0.0%) |
| Foreign Born, Citizen | 55 (100.0%) | 0 (0.0%) |
| Foreign Born, not a Citizen | 49 (100.0%) | 0 (0.0%) |
Health Insurance Coverage by Household Income in Ship Bottom borough
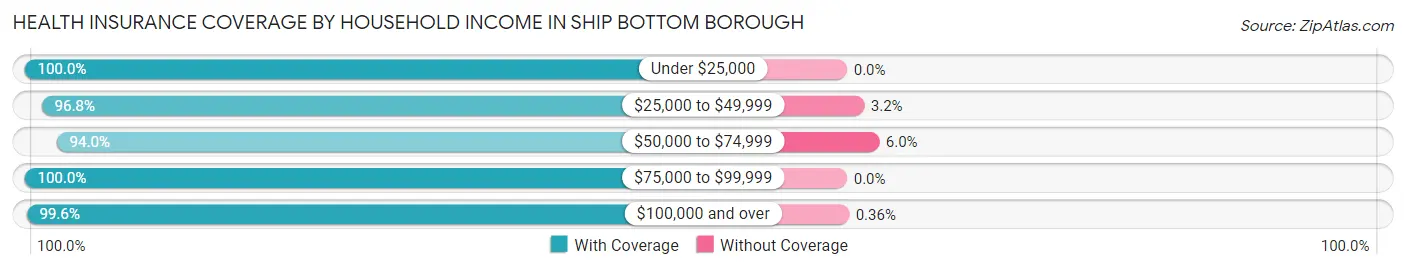
| Household Income | With Coverage | Without Coverage |
| Under $25,000 | 49 (100.0%) | 0 (0.0%) |
| $25,000 to $49,999 | 91 (96.8%) | 3 (3.2%) |
| $50,000 to $74,999 | 172 (94.0%) | 11 (6.0%) |
| $75,000 to $99,999 | 121 (100.0%) | 0 (0.0%) |
| $100,000 and over | 546 (99.6%) | 2 (0.4%) |
Public vs Private Health Insurance Coverage by Age in Ship Bottom borough
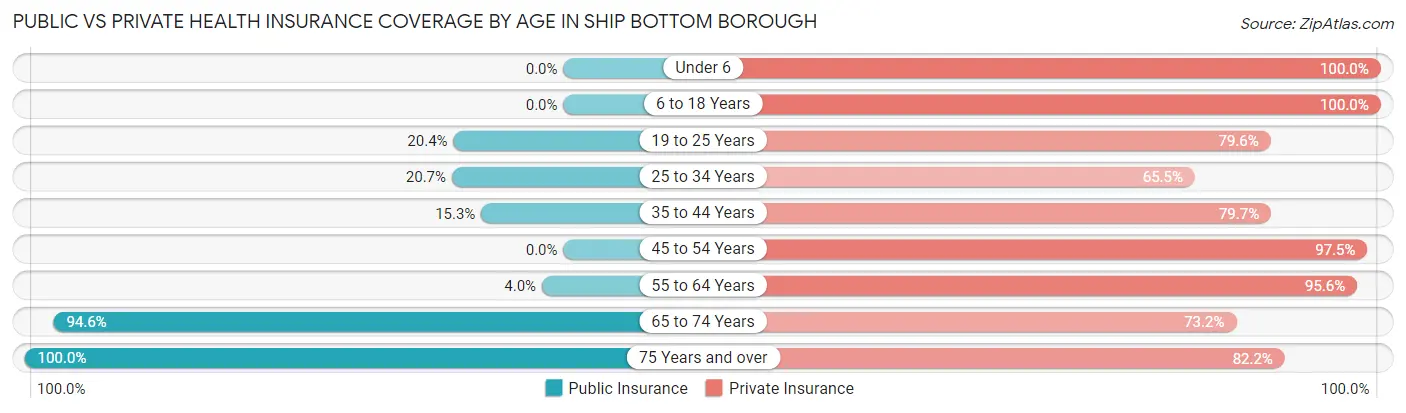
| Age Bracket | Public Insurance | Private Insurance |
| Under 6 | 0 (0.0%) | 14 (100.0%) |
| 6 to 18 Years | 0 (0.0%) | 55 (100.0%) |
| 19 to 25 Years | 10 (20.4%) | 39 (79.6%) |
| 25 to 34 Years | 6 (20.7%) | 19 (65.5%) |
| 35 to 44 Years | 9 (15.2%) | 47 (79.7%) |
| 45 to 54 Years | 0 (0.0%) | 119 (97.5%) |
| 55 to 64 Years | 10 (4.0%) | 241 (95.6%) |
| 65 to 74 Years | 212 (94.6%) | 164 (73.2%) |
| 75 Years and over | 191 (100.0%) | 157 (82.2%) |
| Total | 438 (44.0%) | 855 (85.9%) |
Disability Status by Sex by Age in Ship Bottom borough
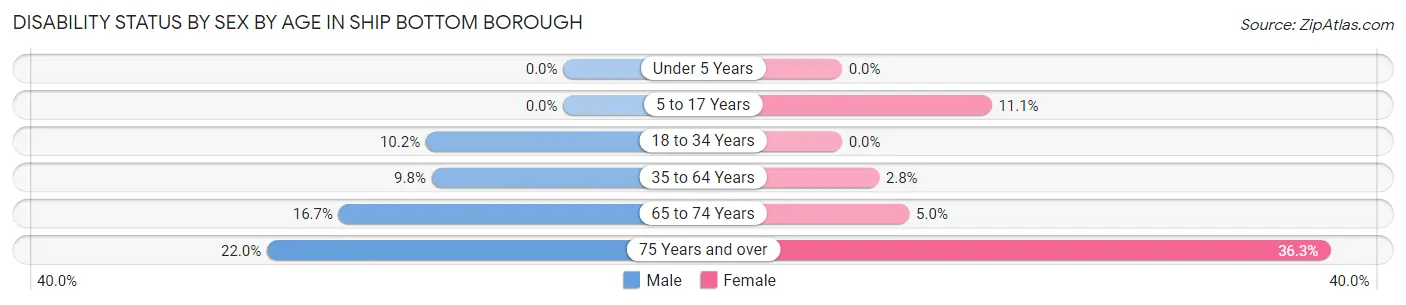
| Age Bracket | Male | Female |
| Under 5 Years | 0 (0.0%) | 0 (0.0%) |
| 5 to 17 Years | 0 (0.0%) | 2 (11.1%) |
| 18 to 34 Years | 5 (10.2%) | 0 (0.0%) |
| 35 to 64 Years | 21 (9.8%) | 6 (2.8%) |
| 65 to 74 Years | 14 (16.7%) | 7 (5.0%) |
| 75 Years and over | 22 (22.0%) | 33 (36.3%) |
Disability Class by Sex by Age in Ship Bottom borough
Disability Class: Hearing Difficulty
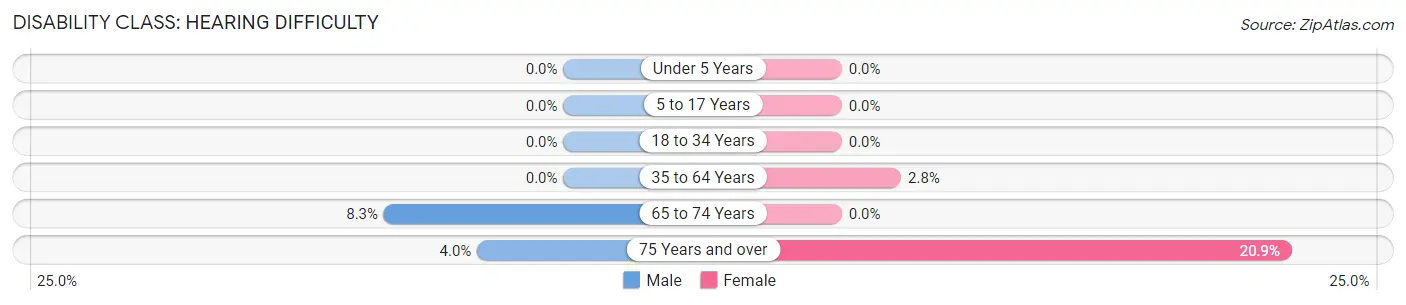
| Age Bracket | Male | Female |
| Under 5 Years | 0 (0.0%) | 0 (0.0%) |
| 5 to 17 Years | 0 (0.0%) | 0 (0.0%) |
| 18 to 34 Years | 0 (0.0%) | 0 (0.0%) |
| 35 to 64 Years | 0 (0.0%) | 6 (2.8%) |
| 65 to 74 Years | 7 (8.3%) | 0 (0.0%) |
| 75 Years and over | 4 (4.0%) | 19 (20.9%) |
Disability Class: Vision Difficulty
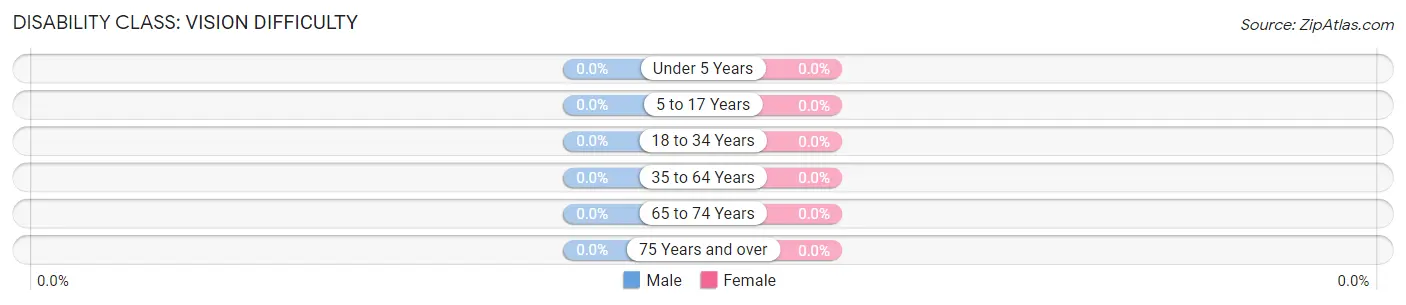
| Age Bracket | Male | Female |
| Under 5 Years | 0 (0.0%) | 0 (0.0%) |
| 5 to 17 Years | 0 (0.0%) | 0 (0.0%) |
| 18 to 34 Years | 0 (0.0%) | 0 (0.0%) |
| 35 to 64 Years | 0 (0.0%) | 0 (0.0%) |
| 65 to 74 Years | 0 (0.0%) | 0 (0.0%) |
| 75 Years and over | 0 (0.0%) | 0 (0.0%) |
Disability Class: Cognitive Difficulty
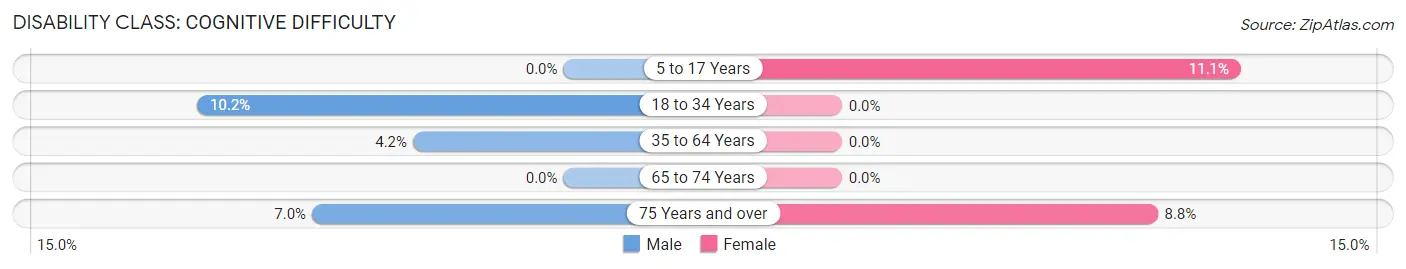
| Age Bracket | Male | Female |
| 5 to 17 Years | 0 (0.0%) | 2 (11.1%) |
| 18 to 34 Years | 5 (10.2%) | 0 (0.0%) |
| 35 to 64 Years | 9 (4.2%) | 0 (0.0%) |
| 65 to 74 Years | 0 (0.0%) | 0 (0.0%) |
| 75 Years and over | 7 (7.0%) | 8 (8.8%) |
Disability Class: Ambulatory Difficulty
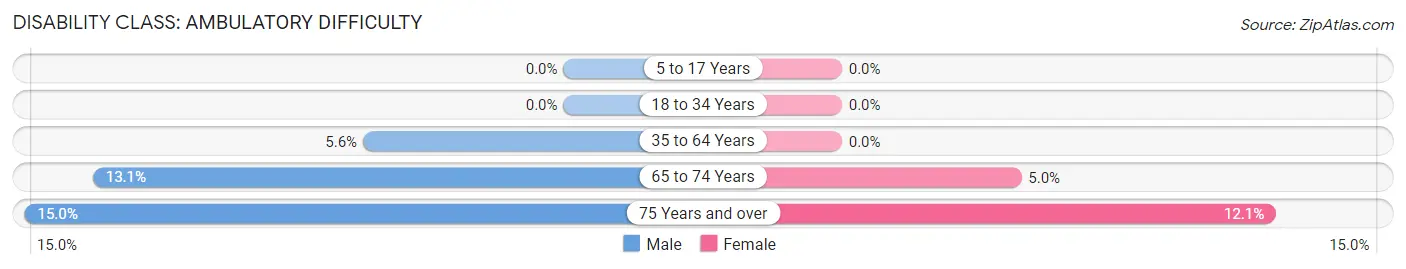
| Age Bracket | Male | Female |
| 5 to 17 Years | 0 (0.0%) | 0 (0.0%) |
| 18 to 34 Years | 0 (0.0%) | 0 (0.0%) |
| 35 to 64 Years | 12 (5.6%) | 0 (0.0%) |
| 65 to 74 Years | 11 (13.1%) | 7 (5.0%) |
| 75 Years and over | 15 (15.0%) | 11 (12.1%) |
Disability Class: Self-Care Difficulty
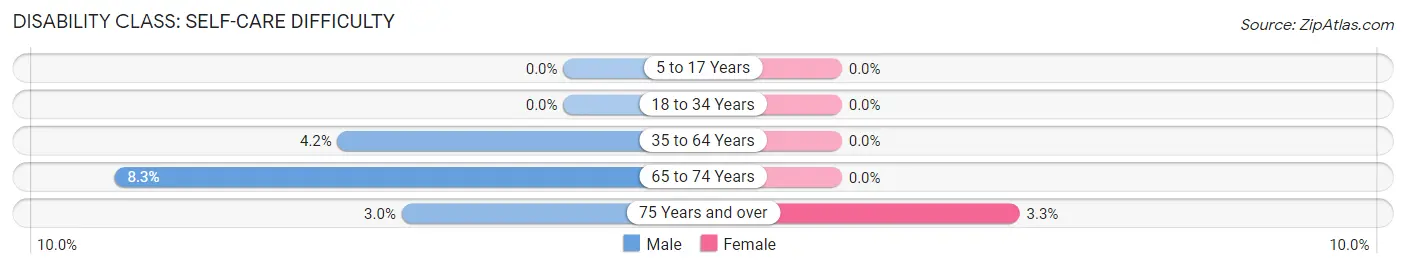
| Age Bracket | Male | Female |
| 5 to 17 Years | 0 (0.0%) | 0 (0.0%) |
| 18 to 34 Years | 0 (0.0%) | 0 (0.0%) |
| 35 to 64 Years | 9 (4.2%) | 0 (0.0%) |
| 65 to 74 Years | 7 (8.3%) | 0 (0.0%) |
| 75 Years and over | 3 (3.0%) | 3 (3.3%) |
Technology Access in Ship Bottom borough
Computing Device Access in Ship Bottom borough
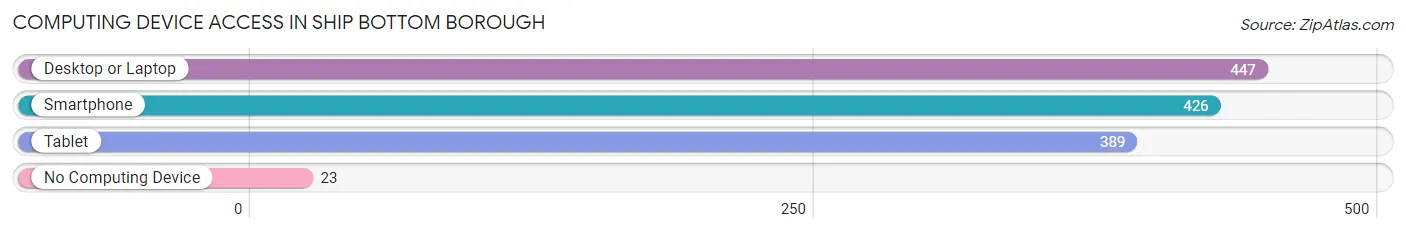
| Device Type | # Households | % Households |
| Desktop or Laptop | 447 | 89.4% |
| Smartphone | 426 | 85.2% |
| Tablet | 389 | 77.8% |
| No Computing Device | 23 | 4.6% |
| Total | 500 | 100.0% |
Internet Access in Ship Bottom borough
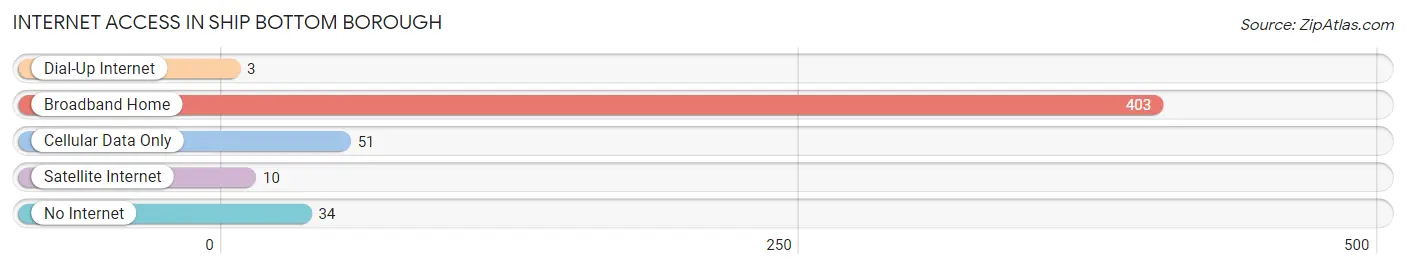
| Internet Type | # Households | % Households |
| Dial-Up Internet | 3 | 0.6% |
| Broadband Home | 403 | 80.6% |
| Cellular Data Only | 51 | 10.2% |
| Satellite Internet | 10 | 2.0% |
| No Internet | 34 | 6.8% |
| Total | 500 | 100.0% |
Ship Bottom borough Summary
Introduction
Ship Bottom Borough is a small borough located in Ocean County, New Jersey. It is situated on Long Beach Island, a barrier island off the coast of New Jersey. The borough is bordered by the Atlantic Ocean to the east, Barnegat Bay to the west, and the municipalities of Long Beach Township and Surf City to the north and south, respectively. As of the 2010 United States Census, the borough had a population of 1,156.
History
Ship Bottom Borough was incorporated in 1925, and is named after a shipwreck that occurred off the coast of the island in 1848. The ship, the SS Monmouth, was a sidewheel steamer that was carrying passengers and cargo from New York City to Philadelphia when it ran aground in a storm. The ship was eventually broken up by the waves, and the wreckage was scattered along the beach. The name “Ship Bottom” was given to the area in honor of the shipwreck.
Geography
Ship Bottom Borough is located on Long Beach Island, a barrier island off the coast of New Jersey. The borough is bordered by the Atlantic Ocean to the east, Barnegat Bay to the west, and the municipalities of Long Beach Township and Surf City to the north and south, respectively. The borough covers an area of 1.2 square miles, and is located approximately 60 miles south of New York City and 70 miles northeast of Philadelphia.
The borough is located in a temperate climate zone, with hot, humid summers and mild winters. The average temperature in the summer months is around 75°F, and the average temperature in the winter months is around 40°F. The average annual precipitation is around 45 inches.
Economy
Ship Bottom Borough’s economy is largely based on tourism. The borough is home to several popular beaches, including Ship Bottom Beach, which is the largest beach in the borough. The borough also has several restaurants, bars, and shops that cater to tourists. In addition, the borough is home to several marinas, which provide services to boaters and fishermen.
Demographics
As of the 2010 United States Census, the borough had a population of 1,156. The racial makeup of the borough was 94.3% White, 1.2% African American, 0.2% Native American, 1.2% Asian, 0.1% Pacific Islander, 1.7% from other races, and 1.5% from two or more races. Hispanic or Latino of any race were 4.2% of the population.
The median household income in the borough was $63,750, and the median family income was $76,250. The per capita income was $35,945. About 4.3% of families and 6.2% of the population were below the poverty line, including 8.3% of those under age 18 and 4.2% of those age 65 or over.
Conclusion
Ship Bottom Borough is a small borough located in Ocean County, New Jersey. It is situated on Long Beach Island, a barrier island off the coast of New Jersey. The borough was incorporated in 1925, and is named after a shipwreck that occurred off the coast of the island in 1848. The borough covers an area of 1.2 square miles, and is located approximately 60 miles south of New York City and 70 miles northeast of Philadelphia. The borough’s economy is largely based on tourism, and the population of the borough was 1,156 as of the 2010 United States Census.
Common Questions
What is Per Capita Income in Ship Bottom borough?
Per Capita income in Ship Bottom borough is $74,531.
What is the Median Family Income in Ship Bottom borough?
Median Family Income in Ship Bottom borough is $133,125.
What is the Median Household income in Ship Bottom borough?
Median Household Income in Ship Bottom borough is $95,208.
What is Income or Wage Gap in Ship Bottom borough?
Income or Wage Gap in Ship Bottom borough is 38.5%.
Women in Ship Bottom borough earn 61.5 cents for every dollar earned by a man.
What is Inequality or Gini Index in Ship Bottom borough?
Inequality or Gini Index in Ship Bottom borough is 0.47.
What is the Total Population of Ship Bottom borough?
Total Population of Ship Bottom borough is 995.
What is the Total Male Population of Ship Bottom borough?
Total Male Population of Ship Bottom borough is 493.
What is the Total Female Population of Ship Bottom borough?
Total Female Population of Ship Bottom borough is 502.
What is the Ratio of Males per 100 Females in Ship Bottom borough?
There are 98.21 Males per 100 Females in Ship Bottom borough.
What is the Ratio of Females per 100 Males in Ship Bottom borough?
There are 101.83 Females per 100 Males in Ship Bottom borough.
What is the Median Population Age in Ship Bottom borough?
Median Population Age in Ship Bottom borough is 63.1 Years.
What is the Average Family Size in Ship Bottom borough
Average Family Size in Ship Bottom borough is 2.4 People.
What is the Average Household Size in Ship Bottom borough
Average Household Size in Ship Bottom borough is 2.0 People.
How Large is the Labor Force in Ship Bottom borough?
There are 430 People in the Labor Forcein in Ship Bottom borough.
What is the Percentage of People in the Labor Force in Ship Bottom borough?
45.9% of People are in the Labor Force in Ship Bottom borough.
What is the Unemployment Rate in Ship Bottom borough?
Unemployment Rate in Ship Bottom borough is 2.3%.