Roseland borough, NJ Map & Demographics
Roseland borough Overview
$68,547
PER CAPITA INCOME
$152,000
AVG FAMILY INCOME
$135,451
AVG HOUSEHOLD INCOME
9.4%
WAGE / INCOME GAP [ % ]
90.6¢/ $1
WAGE / INCOME GAP [ $ ]
0.44
INEQUALITY / GINI INDEX
6,221
TOTAL POPULATION
2,963
MALE POPULATION
3,258
FEMALE POPULATION
90.95
MALES / 100 FEMALES
109.96
FEMALES / 100 MALES
46.1
MEDIAN AGE
2.9
AVG FAMILY SIZE
2.5
AVG HOUSEHOLD SIZE
3,310
LABOR FORCE [ PEOPLE ]
66.7%
PERCENT IN LABOR FORCE
5.4%
UNEMPLOYMENT RATE
Income in Roseland borough
Income Overview in Roseland borough
Per Capita Income in Roseland borough is $68,547, while median incomes of families and households are $152,000 and $135,451 respectively.
| Characteristic | Number | Measure |
| Per Capita Income | 6,221 | $68,547 |
| Median Family Income | 1,904 | $152,000 |
| Mean Family Income | 1,904 | $193,849 |
| Median Household Income | 2,451 | $135,451 |
| Mean Household Income | 2,451 | $176,266 |
| Income Deficit | 1,904 | $0 |
| Wage / Income Gap (%) | 6,221 | 9.36% |
| Wage / Income Gap ($) | 6,221 | 90.64¢ per $1 |
| Gini / Inequality Index | 6,221 | 0.44 |
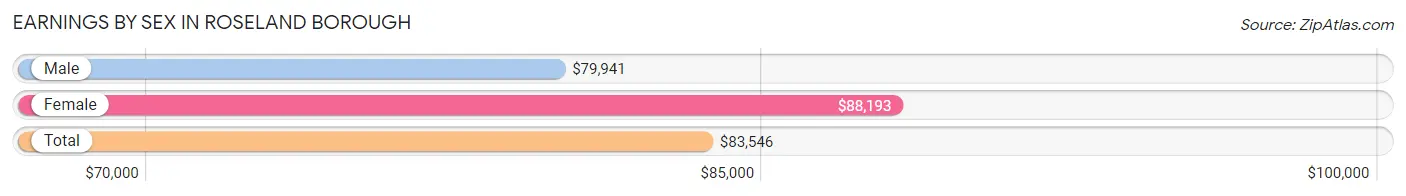
Earnings by Sex in Roseland borough
Average Earnings in Roseland borough are $83,546, $79,941 for men and $88,193 for women, a difference of 9.4%.
| Sex | Number | Average Earnings |
| Male | 1,623 (50.2%) | $79,941 |
| Female | 1,611 (49.8%) | $88,193 |
| Total | 3,234 (100.0%) | $83,546 |
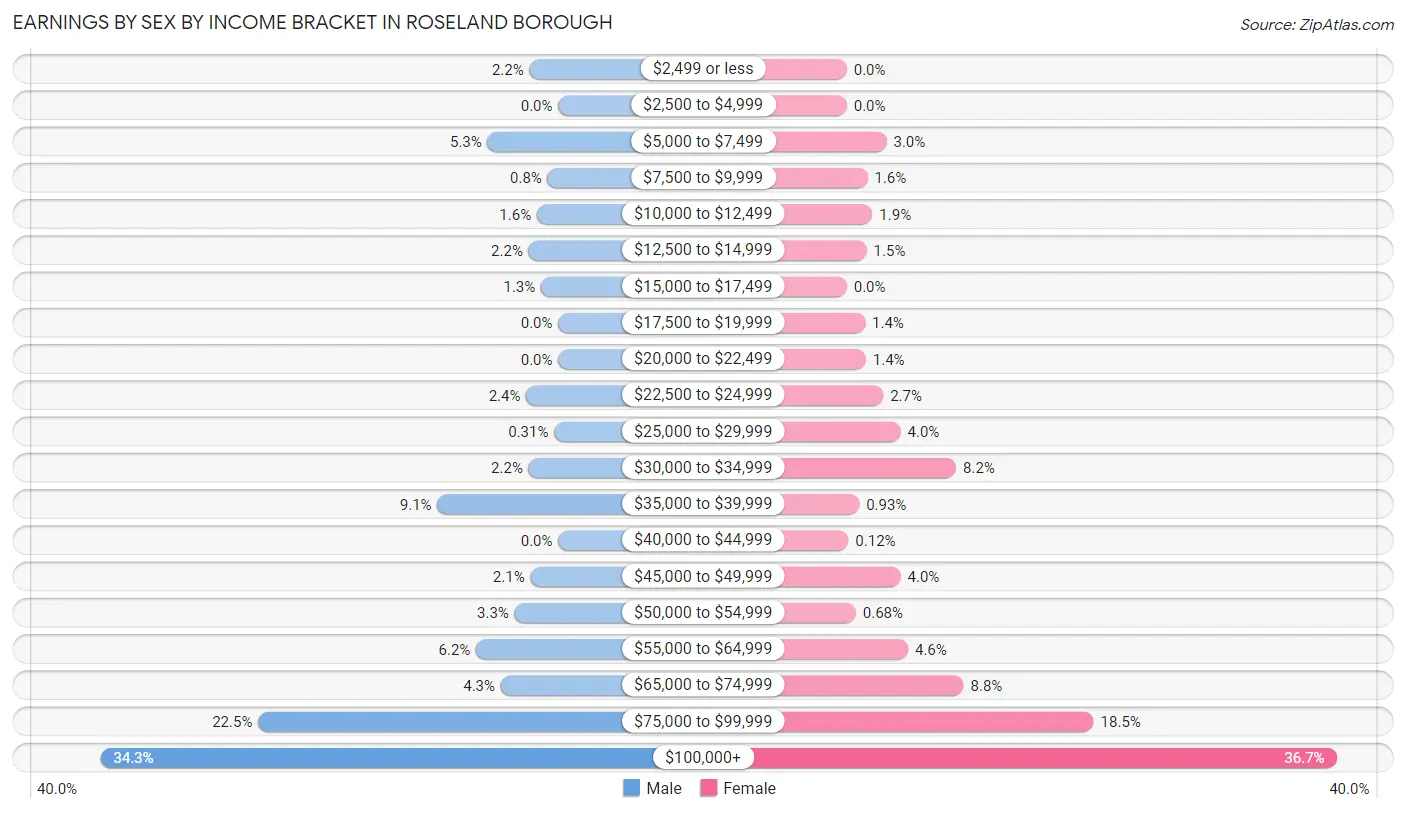
Earnings by Sex by Income Bracket in Roseland borough
The most common earnings brackets in Roseland borough are $100,000+ for men (557 | 34.3%) and $100,000+ for women (591 | 36.7%).
| Income | Male | Female |
| $2,499 or less | 35 (2.2%) | 0 (0.0%) |
| $2,500 to $4,999 | 0 (0.0%) | 0 (0.0%) |
| $5,000 to $7,499 | 86 (5.3%) | 48 (3.0%) |
| $7,500 to $9,999 | 13 (0.8%) | 25 (1.5%) |
| $10,000 to $12,499 | 26 (1.6%) | 31 (1.9%) |
| $12,500 to $14,999 | 36 (2.2%) | 24 (1.5%) |
| $15,000 to $17,499 | 21 (1.3%) | 0 (0.0%) |
| $17,500 to $19,999 | 0 (0.0%) | 22 (1.4%) |
| $20,000 to $22,499 | 0 (0.0%) | 23 (1.4%) |
| $22,500 to $24,999 | 39 (2.4%) | 44 (2.7%) |
| $25,000 to $29,999 | 5 (0.3%) | 65 (4.0%) |
| $30,000 to $34,999 | 36 (2.2%) | 132 (8.2%) |
| $35,000 to $39,999 | 147 (9.1%) | 15 (0.9%) |
| $40,000 to $44,999 | 0 (0.0%) | 2 (0.1%) |
| $45,000 to $49,999 | 34 (2.1%) | 65 (4.0%) |
| $50,000 to $54,999 | 53 (3.3%) | 11 (0.7%) |
| $55,000 to $64,999 | 100 (6.2%) | 74 (4.6%) |
| $65,000 to $74,999 | 70 (4.3%) | 141 (8.7%) |
| $75,000 to $99,999 | 365 (22.5%) | 298 (18.5%) |
| $100,000+ | 557 (34.3%) | 591 (36.7%) |
| Total | 1,623 (100.0%) | 1,611 (100.0%) |
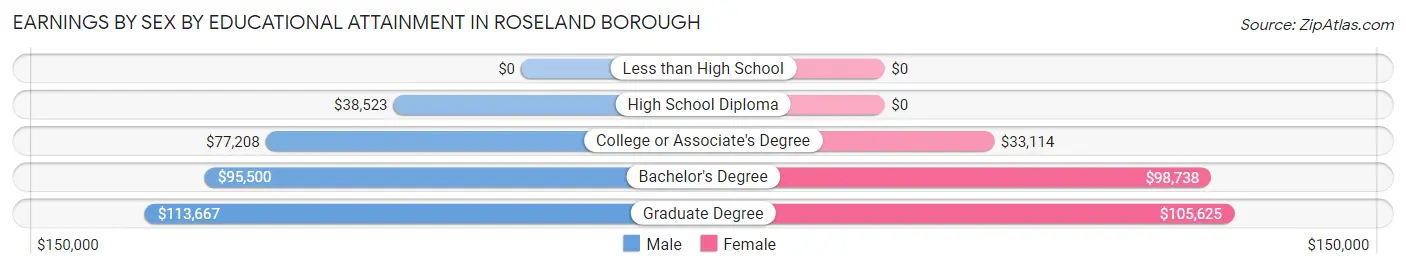
Earnings by Sex by Educational Attainment in Roseland borough
Average earnings in Roseland borough are $83,865 for men and $88,492 for women, a difference of 5.2%. Men with an educational attainment of graduate degree enjoy the highest average annual earnings of $113,667, while those with high school diploma education earn the least with $38,523. Women with an educational attainment of graduate degree earn the most with the average annual earnings of $105,625, while those with college or associate's degree education have the smallest earnings of $33,114.
| Educational Attainment | Male Income | Female Income |
| Less than High School | - | - |
| High School Diploma | $38,523 | $0 |
| College or Associate's Degree | $77,208 | $33,114 |
| Bachelor's Degree | $95,500 | $98,738 |
| Graduate Degree | $113,667 | $105,625 |
| Total | $83,865 | $88,492 |
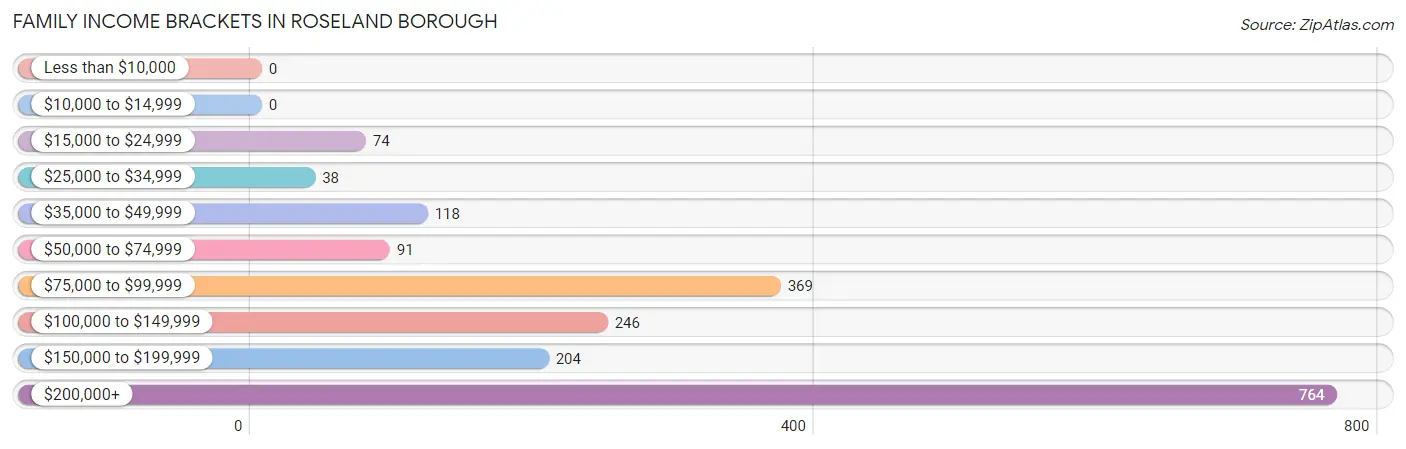
Family Income in Roseland borough
Family Income Brackets in Roseland borough
According to the Roseland borough family income data, there are 764 families falling into the $200,000+ income range, which is the most common income bracket and makes up 40.1% of all families.
| Income Bracket | # Families | % Families |
| Less than $10,000 | 0 | 0.0% |
| $10,000 to $14,999 | 0 | 0.0% |
| $15,000 to $24,999 | 74 | 3.9% |
| $25,000 to $34,999 | 38 | 2.0% |
| $35,000 to $49,999 | 118 | 6.2% |
| $50,000 to $74,999 | 91 | 4.8% |
| $75,000 to $99,999 | 369 | 19.4% |
| $100,000 to $149,999 | 246 | 12.9% |
| $150,000 to $199,999 | 204 | 10.7% |
| $200,000+ | 764 | 40.1% |
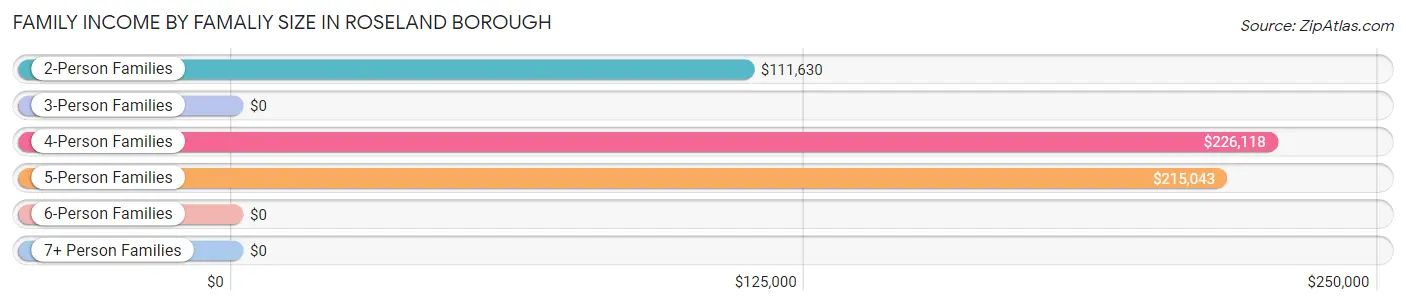
Family Income by Famaliy Size in Roseland borough
4-person families (417 | 21.9%) account for the highest median family income in Roseland borough with $226,118 per family, while 4-person families (417 | 21.9%) have the highest median income of $56,530 per family member.
| Income Bracket | # Families | Median Income |
| 2-Person Families | 900 (47.3%) | $111,630 |
| 3-Person Families | 456 (23.9%) | $0 |
| 4-Person Families | 417 (21.9%) | $226,118 |
| 5-Person Families | 118 (6.2%) | $215,043 |
| 6-Person Families | 13 (0.7%) | $0 |
| 7+ Person Families | 0 (0.0%) | $0 |
| Total | 1,904 (100.0%) | $152,000 |
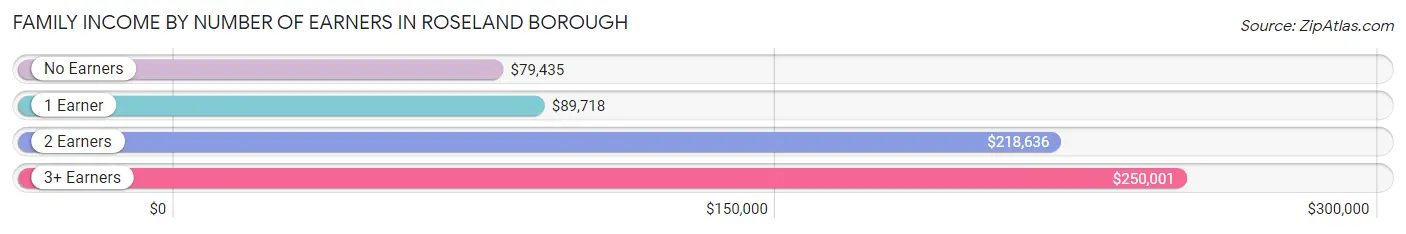
Family Income by Number of Earners in Roseland borough
The median family income in Roseland borough is $152,000, with families comprising 3+ earners (179) having the highest median family income of $250,001, while families with no earners (425) have the lowest median family income of $79,435, accounting for 9.4% and 22.3% of families, respectively.
| Number of Earners | # Families | Median Income |
| No Earners | 425 (22.3%) | $79,435 |
| 1 Earner | 456 (23.9%) | $89,718 |
| 2 Earners | 844 (44.3%) | $218,636 |
| 3+ Earners | 179 (9.4%) | $250,001 |
| Total | 1,904 (100.0%) | $152,000 |
Household Income in Roseland borough
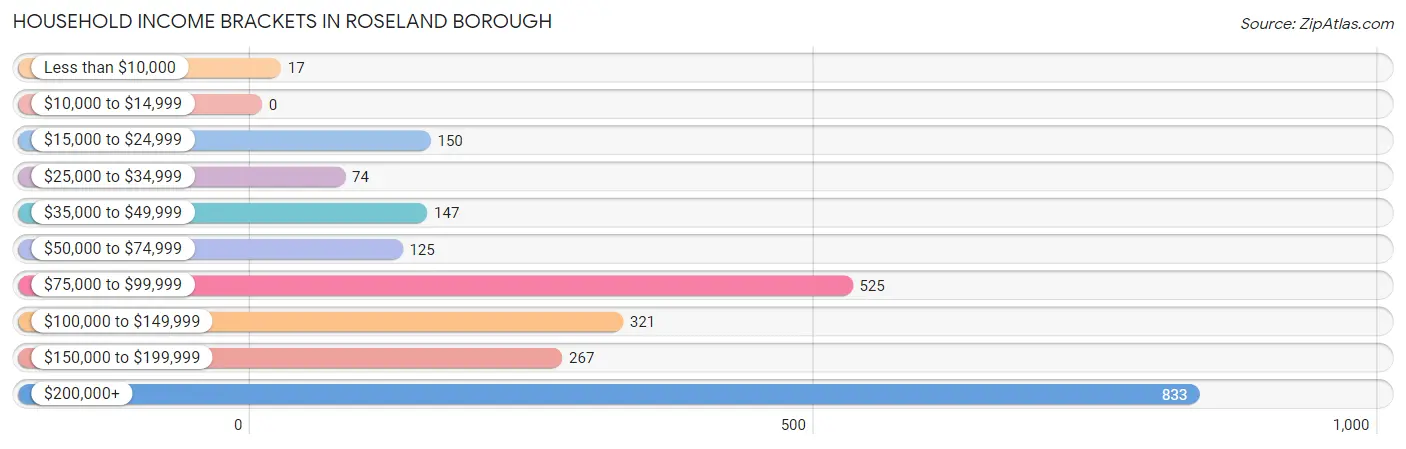
Household Income Brackets in Roseland borough
With 833 households falling in the category, the $200,000+ income range is the most frequent in Roseland borough, accounting for 34.0% of all households.
| Income Bracket | # Households | % Households |
| Less than $10,000 | 17 | 0.7% |
| $10,000 to $14,999 | 0 | 0.0% |
| $15,000 to $24,999 | 150 | 6.1% |
| $25,000 to $34,999 | 74 | 3.0% |
| $35,000 to $49,999 | 147 | 6.0% |
| $50,000 to $74,999 | 125 | 5.1% |
| $75,000 to $99,999 | 525 | 21.4% |
| $100,000 to $149,999 | 321 | 13.1% |
| $150,000 to $199,999 | 267 | 10.9% |
| $200,000+ | 833 | 34.0% |
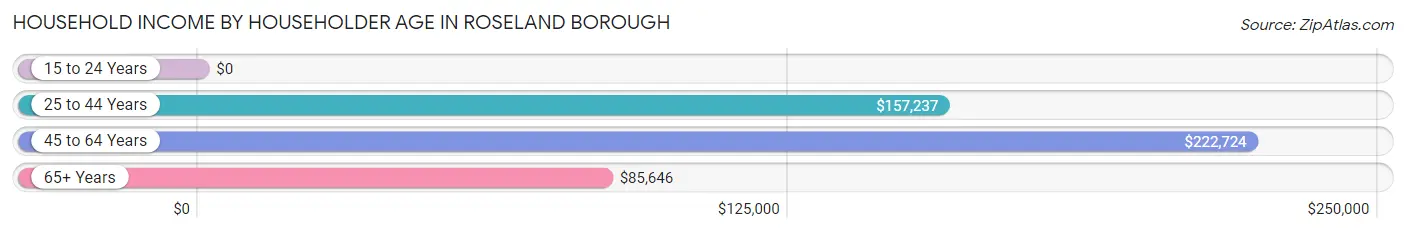
Household Income by Householder Age in Roseland borough
The median household income in Roseland borough is $135,451, with the highest median household income of $222,724 found in the 45 to 64 years age bracket for the primary householder. A total of 798 households (32.6%) fall into this category.
| Income Bracket | # Households | Median Income |
| 15 to 24 Years | 0 (0.0%) | $0 |
| 25 to 44 Years | 678 (27.7%) | $157,237 |
| 45 to 64 Years | 798 (32.6%) | $222,724 |
| 65+ Years | 975 (39.8%) | $85,646 |
| Total | 2,451 (100.0%) | $135,451 |
Poverty in Roseland borough
Income Below Poverty by Sex and Age in Roseland borough
With 2.4% poverty level for males and 1.3% for females among the residents of Roseland borough, 25 to 34 year old males and 55 to 64 year old females are the most vulnerable to poverty, with 54 males (14.8%) and 26 females (8.3%) in their respective age groups living below the poverty level.
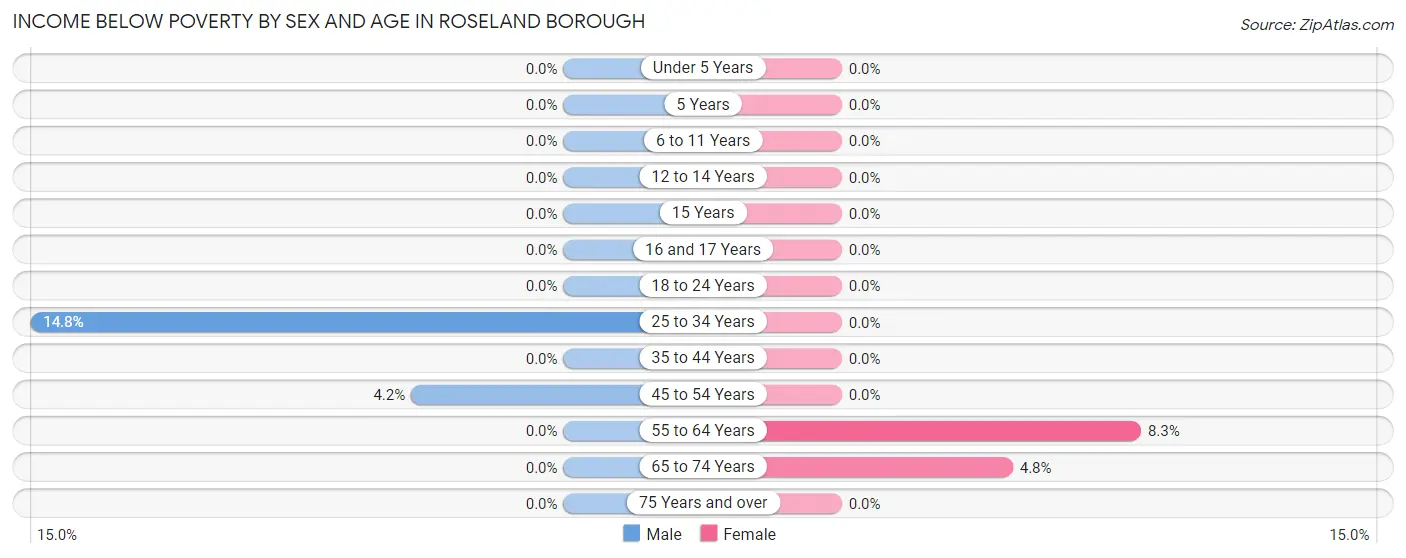
| Age Bracket | Male | Female |
| Under 5 Years | 0 (0.0%) | 0 (0.0%) |
| 5 Years | 0 (0.0%) | 0 (0.0%) |
| 6 to 11 Years | 0 (0.0%) | 0 (0.0%) |
| 12 to 14 Years | 0 (0.0%) | 0 (0.0%) |
| 15 Years | 0 (0.0%) | 0 (0.0%) |
| 16 and 17 Years | 0 (0.0%) | 0 (0.0%) |
| 18 to 24 Years | 0 (0.0%) | 0 (0.0%) |
| 25 to 34 Years | 54 (14.8%) | 0 (0.0%) |
| 35 to 44 Years | 0 (0.0%) | 0 (0.0%) |
| 45 to 54 Years | 18 (4.2%) | 0 (0.0%) |
| 55 to 64 Years | 0 (0.0%) | 26 (8.3%) |
| 65 to 74 Years | 0 (0.0%) | 16 (4.8%) |
| 75 Years and over | 0 (0.0%) | 0 (0.0%) |
| Total | 72 (2.4%) | 42 (1.3%) |
Income Above Poverty by Sex and Age in Roseland borough
According to the poverty statistics in Roseland borough, males aged under 5 years and females aged under 5 years are the age groups that are most secure financially, with 100.0% of males and 100.0% of females in these age groups living above the poverty line.
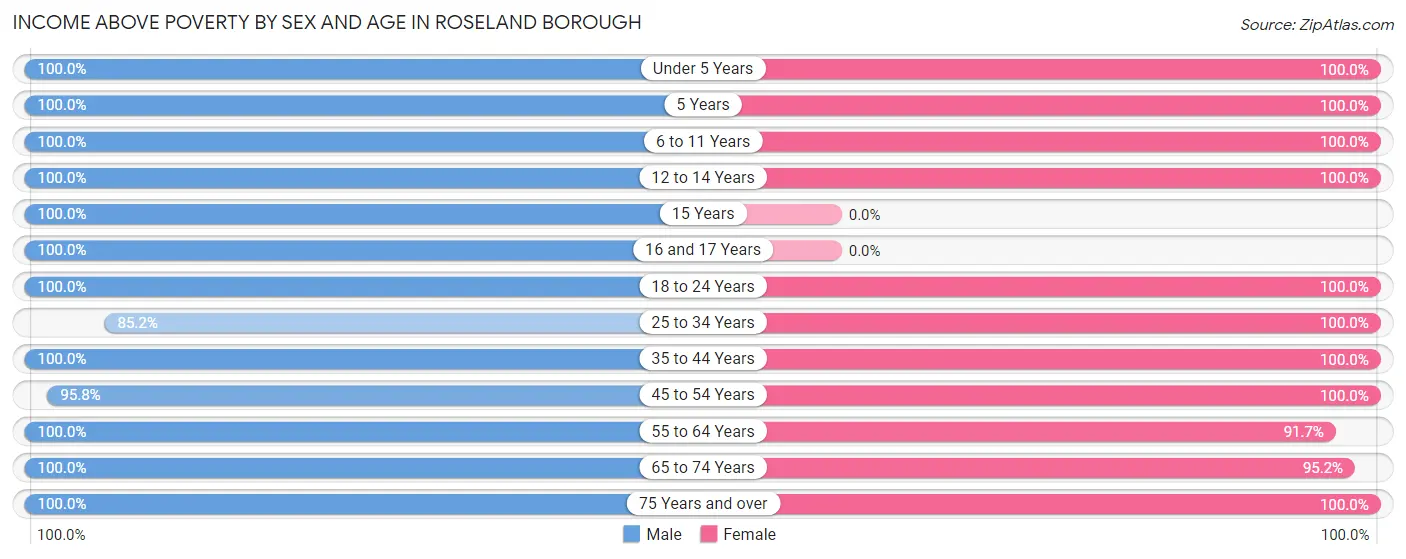
| Age Bracket | Male | Female |
| Under 5 Years | 276 (100.0%) | 255 (100.0%) |
| 5 Years | 18 (100.0%) | 62 (100.0%) |
| 6 to 11 Years | 344 (100.0%) | 103 (100.0%) |
| 12 to 14 Years | 82 (100.0%) | 90 (100.0%) |
| 15 Years | 29 (100.0%) | 0 (0.0%) |
| 16 and 17 Years | 19 (100.0%) | 0 (0.0%) |
| 18 to 24 Years | 157 (100.0%) | 61 (100.0%) |
| 25 to 34 Years | 310 (85.2%) | 491 (100.0%) |
| 35 to 44 Years | 310 (100.0%) | 422 (100.0%) |
| 45 to 54 Years | 407 (95.8%) | 499 (100.0%) |
| 55 to 64 Years | 299 (100.0%) | 286 (91.7%) |
| 65 to 74 Years | 243 (100.0%) | 320 (95.2%) |
| 75 Years and over | 397 (100.0%) | 627 (100.0%) |
| Total | 2,891 (97.6%) | 3,216 (98.7%) |
Income Below Poverty Among Married-Couple Families in Roseland borough
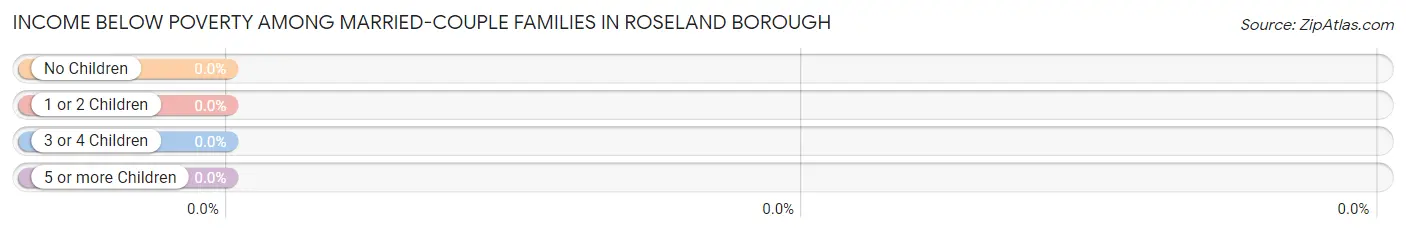
| Children | Above Poverty | Below Poverty |
| No Children | 823 (100.0%) | 0 (0.0%) |
| 1 or 2 Children | 582 (100.0%) | 0 (0.0%) |
| 3 or 4 Children | 110 (100.0%) | 0 (0.0%) |
| 5 or more Children | 0 (0.0%) | 0 (0.0%) |
| Total | 1,515 (100.0%) | 0 (0.0%) |
Income Below Poverty Among Single-Parent Households in Roseland borough
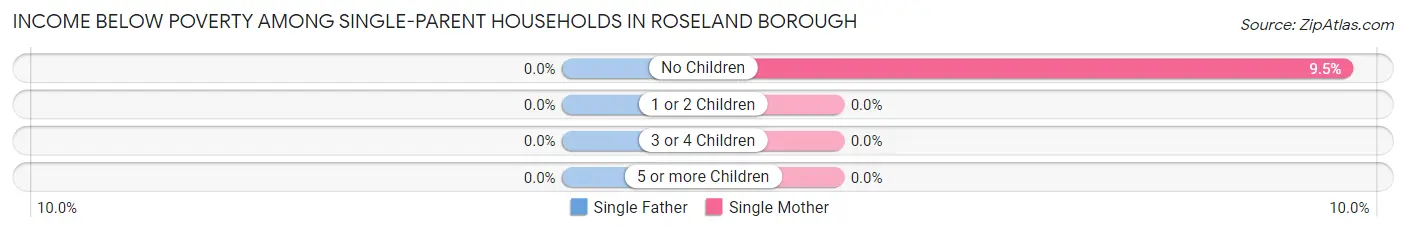
| Children | Single Father | Single Mother |
| No Children | 0 (0.0%) | 26 (9.5%) |
| 1 or 2 Children | 0 (0.0%) | 0 (0.0%) |
| 3 or 4 Children | 0 (0.0%) | 0 (0.0%) |
| 5 or more Children | 0 (0.0%) | 0 (0.0%) |
| Total | 0 (0.0%) | 26 (7.2%) |
Income Below Poverty Among Married-Couple vs Single-Parent Households in Roseland borough
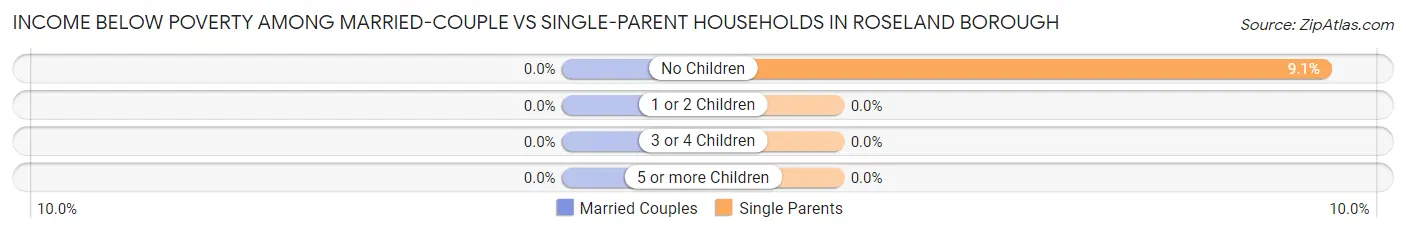
| Children | Married-Couple Families | Single-Parent Households |
| No Children | 0 (0.0%) | 26 (9.1%) |
| 1 or 2 Children | 0 (0.0%) | 0 (0.0%) |
| 3 or 4 Children | 0 (0.0%) | 0 (0.0%) |
| 5 or more Children | 0 (0.0%) | 0 (0.0%) |
| Total | 0 (0.0%) | 26 (6.7%) |
Race in Roseland borough
The most populous races in Roseland borough are White / Caucasian (4,806 | 77.2%), Asian (764 | 12.3%), and Two or more Races (608 | 9.8%).
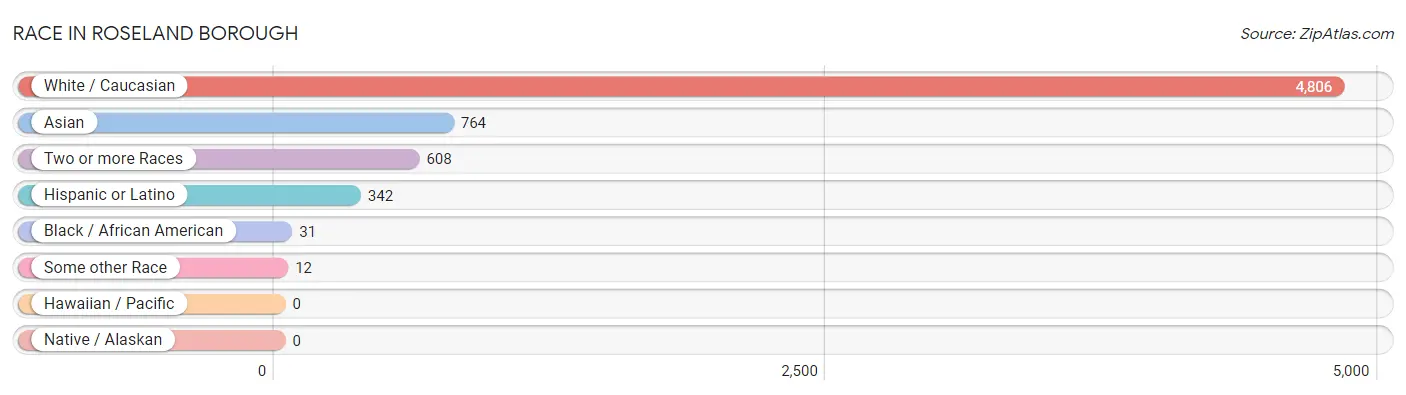
| Race | # Population | % Population |
| Asian | 764 | 12.3% |
| Black / African American | 31 | 0.5% |
| Hawaiian / Pacific | 0 | 0.0% |
| Hispanic or Latino | 342 | 5.5% |
| Native / Alaskan | 0 | 0.0% |
| White / Caucasian | 4,806 | 77.2% |
| Two or more Races | 608 | 9.8% |
| Some other Race | 12 | 0.2% |
| Total | 6,221 | 100.0% |
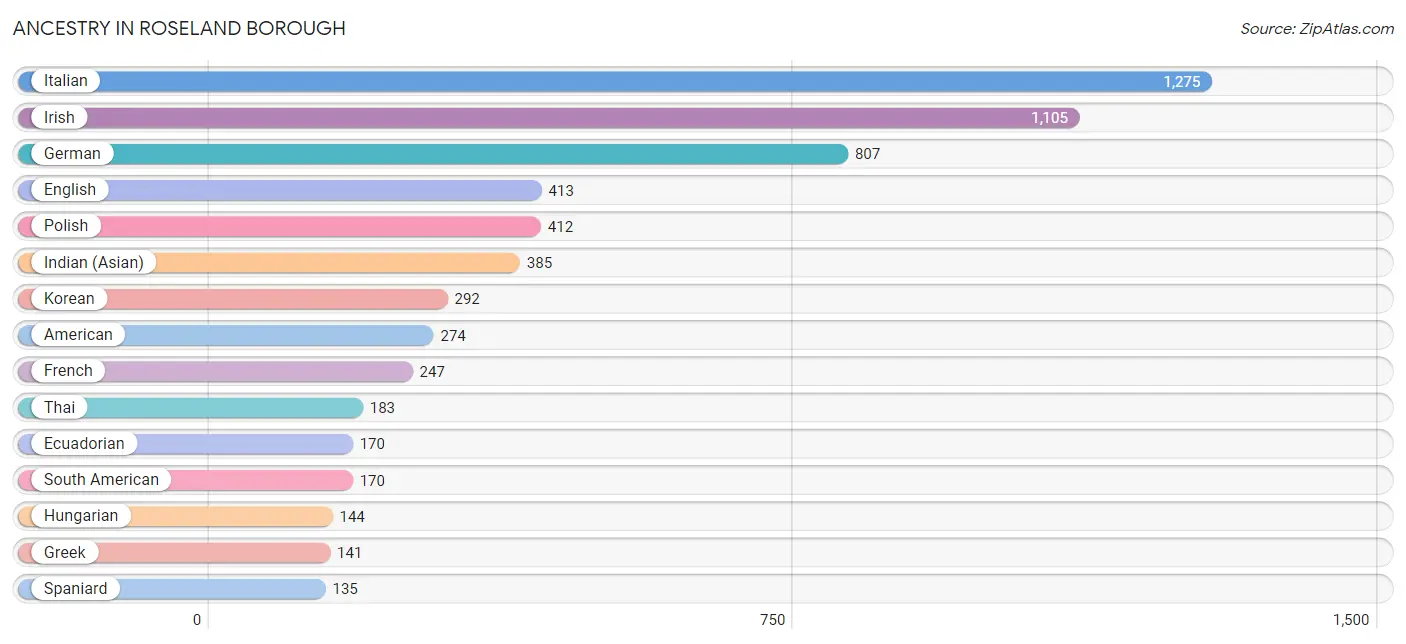
Ancestry in Roseland borough
The most populous ancestries reported in Roseland borough are Italian (1,275 | 20.5%), Irish (1,105 | 17.8%), German (807 | 13.0%), English (413 | 6.6%), and Polish (412 | 6.6%), together accounting for 64.5% of all Roseland borough residents.
| Ancestry | # Population | % Population |
| American | 274 | 4.4% |
| Arab | 38 | 0.6% |
| Austrian | 24 | 0.4% |
| Basque | 19 | 0.3% |
| British | 127 | 2.0% |
| Burmese | 39 | 0.6% |
| Canadian | 17 | 0.3% |
| Central American | 24 | 0.4% |
| Costa Rican | 24 | 0.4% |
| Croatian | 79 | 1.3% |
| Czech | 49 | 0.8% |
| Czechoslovakian | 97 | 1.6% |
| Eastern European | 62 | 1.0% |
| Ecuadorian | 170 | 2.7% |
| English | 413 | 6.6% |
| European | 81 | 1.3% |
| Filipino | 60 | 1.0% |
| French | 247 | 4.0% |
| German | 807 | 13.0% |
| Greek | 141 | 2.3% |
| Hungarian | 144 | 2.3% |
| Indian (Asian) | 385 | 6.2% |
| Irish | 1,105 | 17.8% |
| Italian | 1,275 | 20.5% |
| Korean | 292 | 4.7% |
| Laotian | 20 | 0.3% |
| Lebanese | 38 | 0.6% |
| Maltese | 119 | 1.9% |
| Polish | 412 | 6.6% |
| Puerto Rican | 13 | 0.2% |
| Romanian | 7 | 0.1% |
| Russian | 111 | 1.8% |
| Scotch-Irish | 18 | 0.3% |
| Scottish | 66 | 1.1% |
| Slovak | 5 | 0.1% |
| South American | 170 | 2.7% |
| Spaniard | 135 | 2.2% |
| Sri Lankan | 89 | 1.4% |
| Swedish | 11 | 0.2% |
| Syrian | 22 | 0.4% |
| Thai | 183 | 2.9% |
| Ukrainian | 39 | 0.6% | View All 42 Rows |
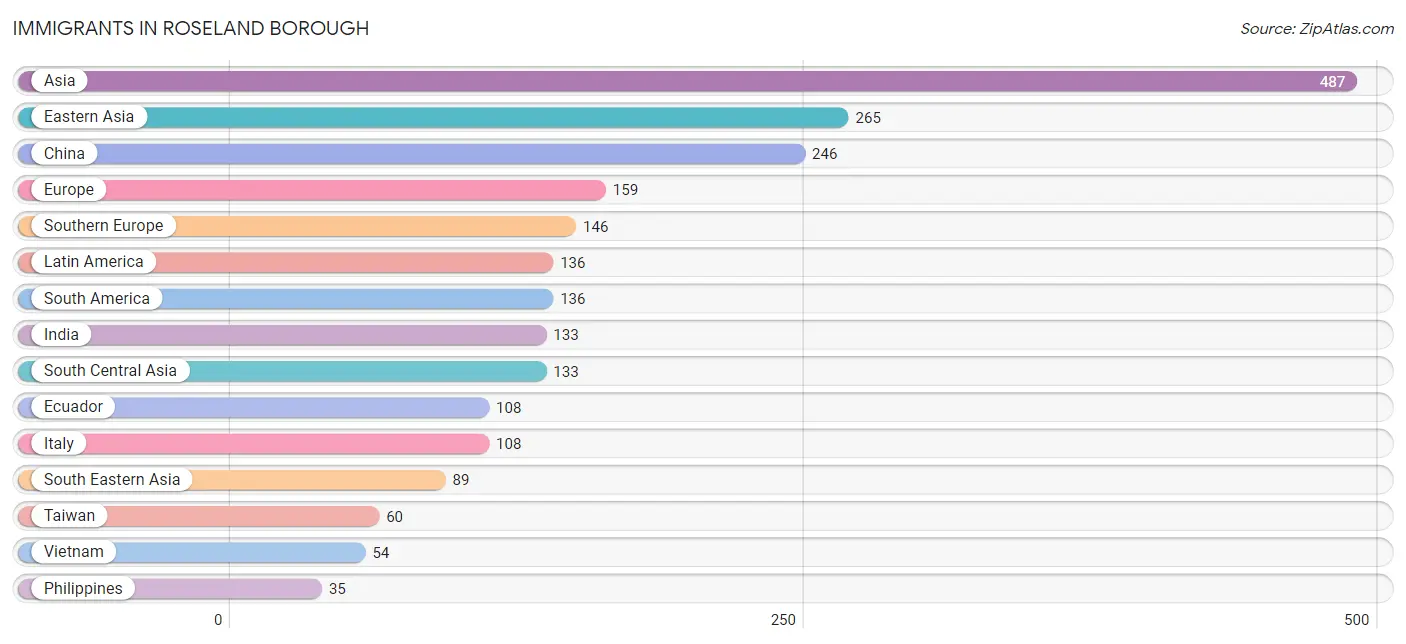
Immigrants in Roseland borough
The most numerous immigrant groups reported in Roseland borough came from Asia (487 | 7.8%), Eastern Asia (265 | 4.3%), China (246 | 4.0%), Europe (159 | 2.6%), and Southern Europe (146 | 2.4%), together accounting for 20.9% of all Roseland borough residents.
| Immigration Origin | # Population | % Population |
| Asia | 487 | 7.8% |
| China | 246 | 4.0% |
| Colombia | 28 | 0.4% |
| Eastern Asia | 265 | 4.3% |
| Eastern Europe | 13 | 0.2% |
| Ecuador | 108 | 1.7% |
| Europe | 159 | 2.6% |
| Greece | 19 | 0.3% |
| Hong Kong | 10 | 0.2% |
| India | 133 | 2.1% |
| Italy | 108 | 1.7% |
| Korea | 19 | 0.3% |
| Latin America | 136 | 2.2% |
| Philippines | 35 | 0.6% |
| Poland | 13 | 0.2% |
| South America | 136 | 2.2% |
| South Central Asia | 133 | 2.1% |
| South Eastern Asia | 89 | 1.4% |
| Southern Europe | 146 | 2.4% |
| Spain | 19 | 0.3% |
| Taiwan | 60 | 1.0% |
| Vietnam | 54 | 0.9% | View All 22 Rows |
Sex and Age in Roseland borough
Sex and Age in Roseland borough
The most populous age groups in Roseland borough are 5 to 9 Years (324 | 10.9%) for men and 40 to 44 Years (319 | 9.8%) for women.
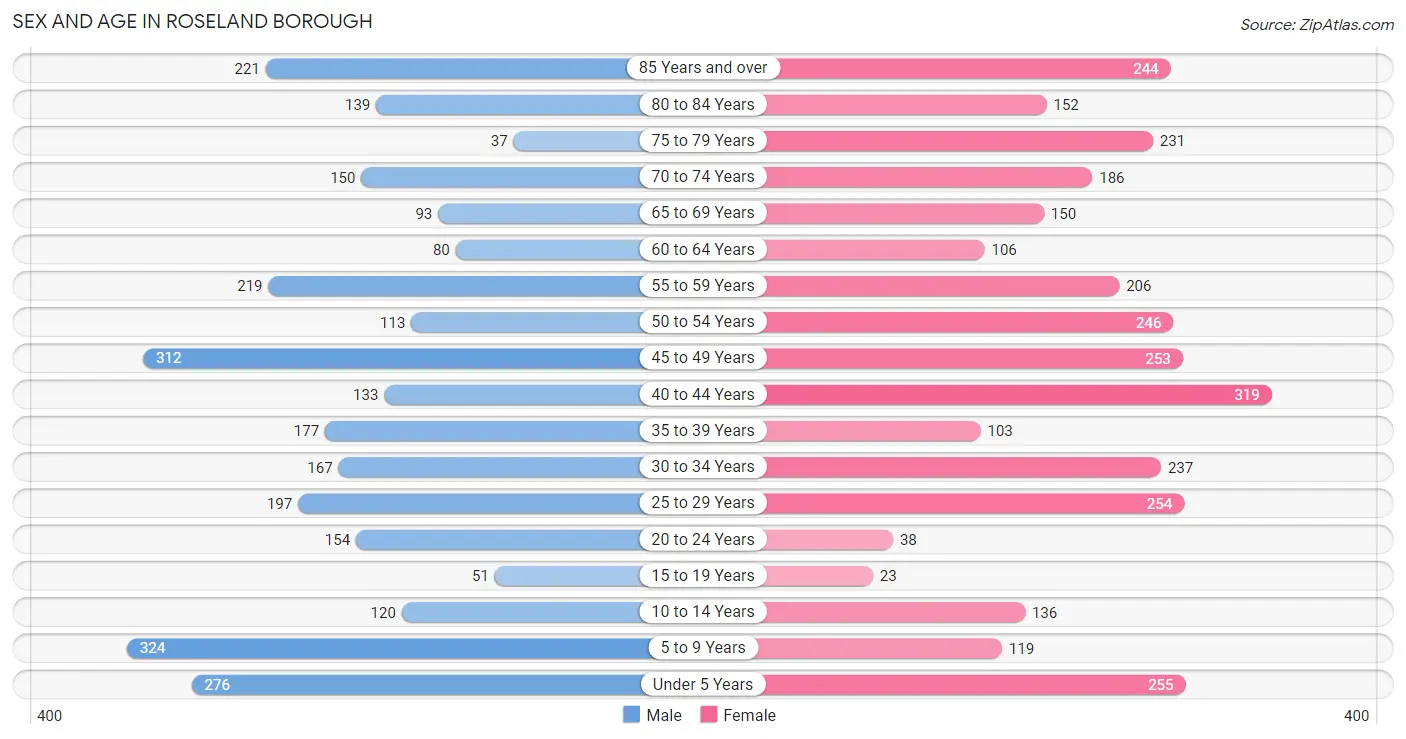
| Age Bracket | Male | Female |
| Under 5 Years | 276 (9.3%) | 255 (7.8%) |
| 5 to 9 Years | 324 (10.9%) | 119 (3.6%) |
| 10 to 14 Years | 120 (4.1%) | 136 (4.2%) |
| 15 to 19 Years | 51 (1.7%) | 23 (0.7%) |
| 20 to 24 Years | 154 (5.2%) | 38 (1.2%) |
| 25 to 29 Years | 197 (6.7%) | 254 (7.8%) |
| 30 to 34 Years | 167 (5.6%) | 237 (7.3%) |
| 35 to 39 Years | 177 (6.0%) | 103 (3.2%) |
| 40 to 44 Years | 133 (4.5%) | 319 (9.8%) |
| 45 to 49 Years | 312 (10.5%) | 253 (7.8%) |
| 50 to 54 Years | 113 (3.8%) | 246 (7.5%) |
| 55 to 59 Years | 219 (7.4%) | 206 (6.3%) |
| 60 to 64 Years | 80 (2.7%) | 106 (3.3%) |
| 65 to 69 Years | 93 (3.1%) | 150 (4.6%) |
| 70 to 74 Years | 150 (5.1%) | 186 (5.7%) |
| 75 to 79 Years | 37 (1.3%) | 231 (7.1%) |
| 80 to 84 Years | 139 (4.7%) | 152 (4.7%) |
| 85 Years and over | 221 (7.5%) | 244 (7.5%) |
| Total | 2,963 (100.0%) | 3,258 (100.0%) |
Families and Households in Roseland borough
Median Family Size in Roseland borough
The median family size in Roseland borough is 2.90 persons per family, with married-couple families (1,515 | 79.6%) accounting for the largest median family size of 3.06 persons per family. On the other hand, single male/father families (30 | 1.6%) represent the smallest median family size with 2.00 persons per family.
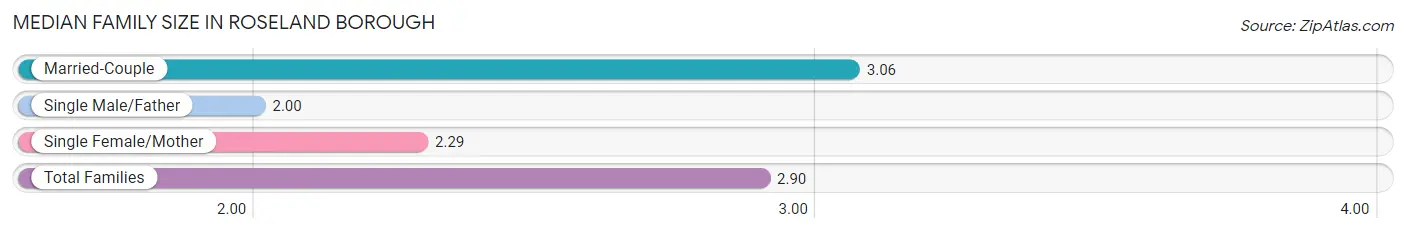
| Family Type | # Families | Family Size |
| Married-Couple | 1,515 (79.6%) | 3.06 |
| Single Male/Father | 30 (1.6%) | 2.00 |
| Single Female/Mother | 359 (18.9%) | 2.29 |
| Total Families | 1,904 (100.0%) | 2.90 |
Median Household Size in Roseland borough
The median household size in Roseland borough is 2.54 persons per household, with married-couple households (1,515 | 61.8%) accounting for the largest median household size of 3.07 persons per household. non-family households (547 | 22.3%) represent the smallest median household size with 1.18 persons per household.
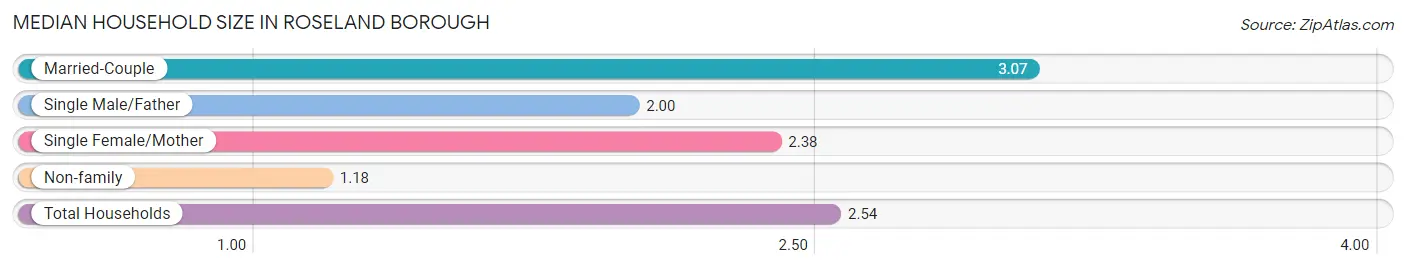
| Household Type | # Households | Household Size |
| Married-Couple | 1,515 (61.8%) | 3.07 |
| Single Male/Father | 30 (1.2%) | 2.00 |
| Single Female/Mother | 359 (14.6%) | 2.38 |
| Non-family | 547 (22.3%) | 1.18 |
| Total Households | 2,451 (100.0%) | 2.54 |
Household Size by Marriage Status in Roseland borough
Out of a total of 2,451 households in Roseland borough, 1,904 (77.7%) are family households, while 547 (22.3%) are nonfamily households. The most numerous type of family households are 2-person households, comprising 845, and the most common type of nonfamily households are 1-person households, comprising 457.
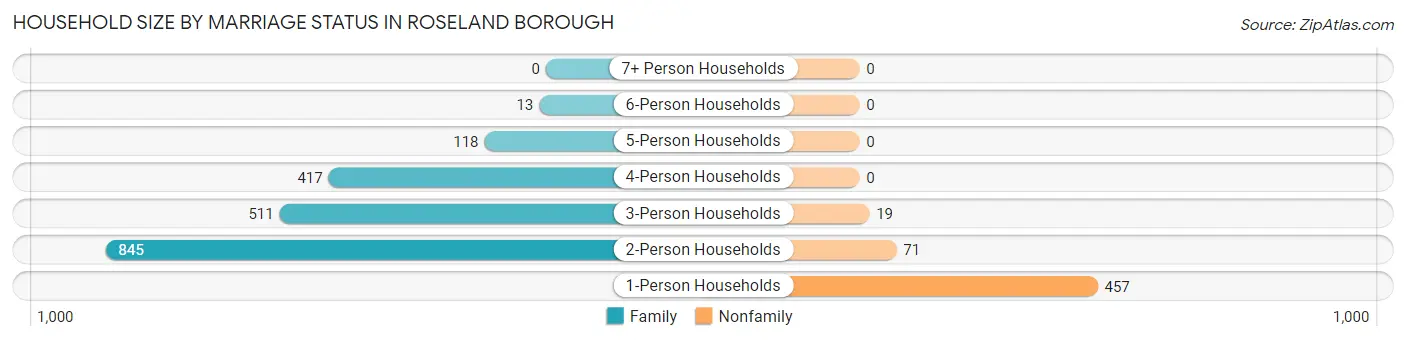
| Household Size | Family Households | Nonfamily Households |
| 1-Person Households | - | 457 (18.6%) |
| 2-Person Households | 845 (34.5%) | 71 (2.9%) |
| 3-Person Households | 511 (20.8%) | 19 (0.8%) |
| 4-Person Households | 417 (17.0%) | 0 (0.0%) |
| 5-Person Households | 118 (4.8%) | 0 (0.0%) |
| 6-Person Households | 13 (0.5%) | 0 (0.0%) |
| 7+ Person Households | 0 (0.0%) | 0 (0.0%) |
| Total | 1,904 (77.7%) | 547 (22.3%) |
Female Fertility in Roseland borough
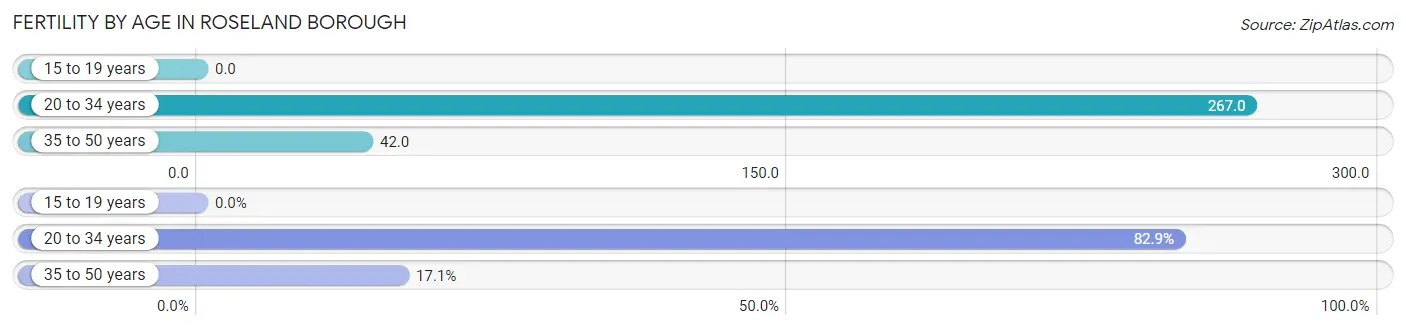
Fertility by Age in Roseland borough
Average fertility rate in Roseland borough is 137.0 births per 1,000 women. Women in the age bracket of 20 to 34 years have the highest fertility rate with 267.0 births per 1,000 women. Women in the age bracket of 20 to 34 years acount for 82.9% of all women with births.
| Age Bracket | Women with Births | Births / 1,000 Women |
| 15 to 19 years | 0 (0.0%) | 0.0 |
| 20 to 34 years | 141 (82.9%) | 267.0 |
| 35 to 50 years | 29 (17.1%) | 42.0 |
| Total | 170 (100.0%) | 137.0 |
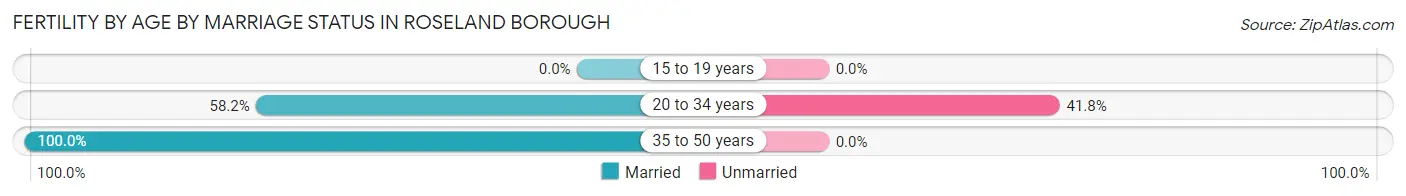
Fertility by Age by Marriage Status in Roseland borough
65.3% of women with births (170) in Roseland borough are married. The highest percentage of unmarried women with births falls into 20 to 34 years age bracket with 41.8% of them unmarried at the time of birth, while the lowest percentage of unmarried women with births belong to 35 to 50 years age bracket with 0.0% of them unmarried.
| Age Bracket | Married | Unmarried |
| 15 to 19 years | 0 (0.0%) | 0 (0.0%) |
| 20 to 34 years | 82 (58.2%) | 59 (41.8%) |
| 35 to 50 years | 29 (100.0%) | 0 (0.0%) |
| Total | 111 (65.3%) | 59 (34.7%) |
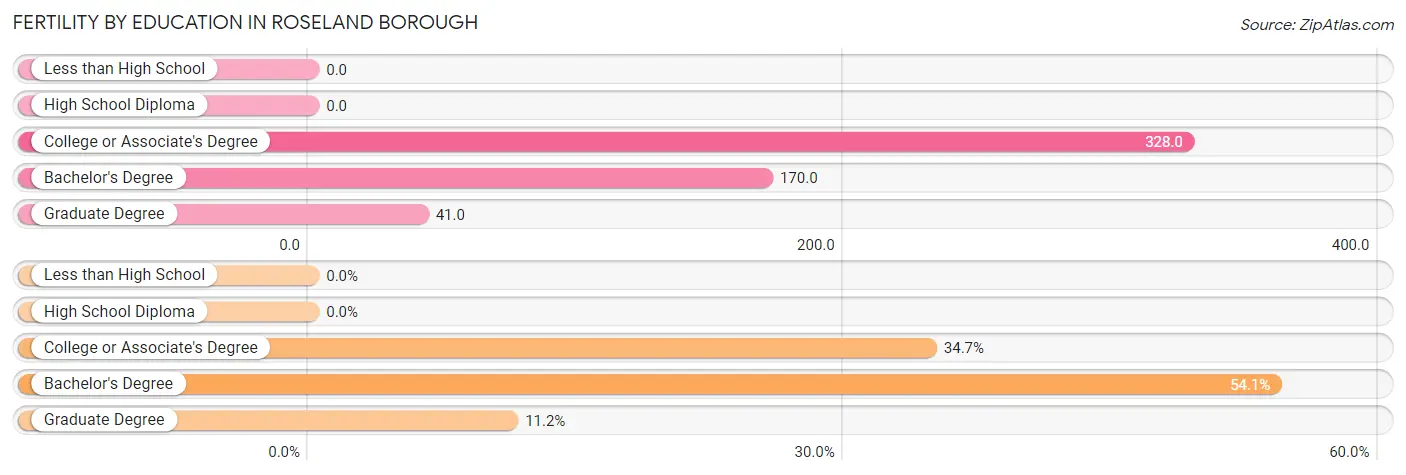
Fertility by Education in Roseland borough
| Educational Attainment | Women with Births | Births / 1,000 Women |
| Less than High School | 0 (0.0%) | 0.0 |
| High School Diploma | 0 (0.0%) | 0.0 |
| College or Associate's Degree | 59 (34.7%) | 328.0 |
| Bachelor's Degree | 92 (54.1%) | 170.0 |
| Graduate Degree | 19 (11.2%) | 41.0 |
| Total | 170 (100.0%) | 137.0 |
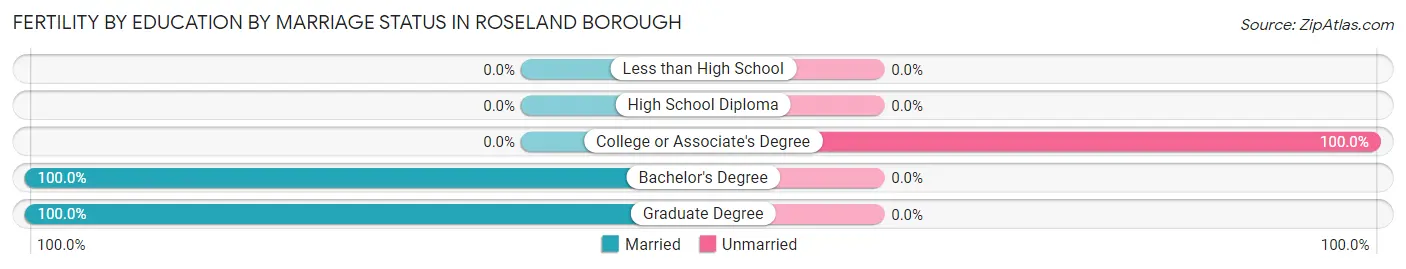
Fertility by Education by Marriage Status in Roseland borough
34.7% of women with births in Roseland borough are unmarried. Women with the educational attainment of bachelor's degree are most likely to be married with 100.0% of them married at childbirth, while women with the educational attainment of college or associate's degree are least likely to be married with 100.0% of them unmarried at childbirth.
| Educational Attainment | Married | Unmarried |
| Less than High School | 0 (0.0%) | 0 (0.0%) |
| High School Diploma | 0 (0.0%) | 0 (0.0%) |
| College or Associate's Degree | 0 (0.0%) | 59 (100.0%) |
| Bachelor's Degree | 92 (100.0%) | 0 (0.0%) |
| Graduate Degree | 19 (100.0%) | 0 (0.0%) |
| Total | 111 (65.3%) | 59 (34.7%) |
Employment Characteristics in Roseland borough
Employment by Class of Employer in Roseland borough
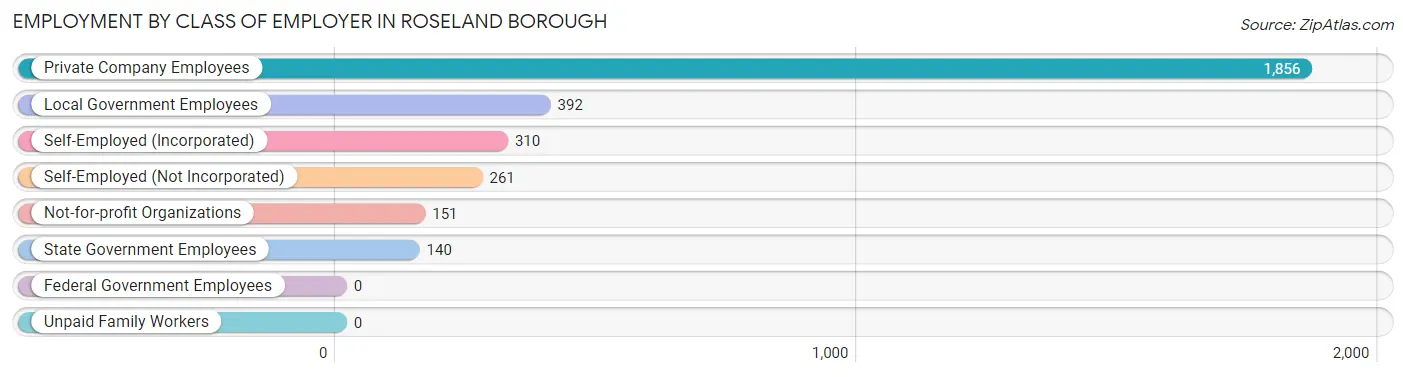
Among the 3,110 employed individuals in Roseland borough, private company employees (1,856 | 59.7%), local government employees (392 | 12.6%), and self-employed (incorporated) (310 | 10.0%) make up the most common classes of employment.
| Employer Class | # Employees | % Employees |
| Private Company Employees | 1,856 | 59.7% |
| Self-Employed (Incorporated) | 310 | 10.0% |
| Self-Employed (Not Incorporated) | 261 | 8.4% |
| Not-for-profit Organizations | 151 | 4.9% |
| Local Government Employees | 392 | 12.6% |
| State Government Employees | 140 | 4.5% |
| Federal Government Employees | 0 | 0.0% |
| Unpaid Family Workers | 0 | 0.0% |
| Total | 3,110 | 100.0% |
Employment Status by Age in Roseland borough
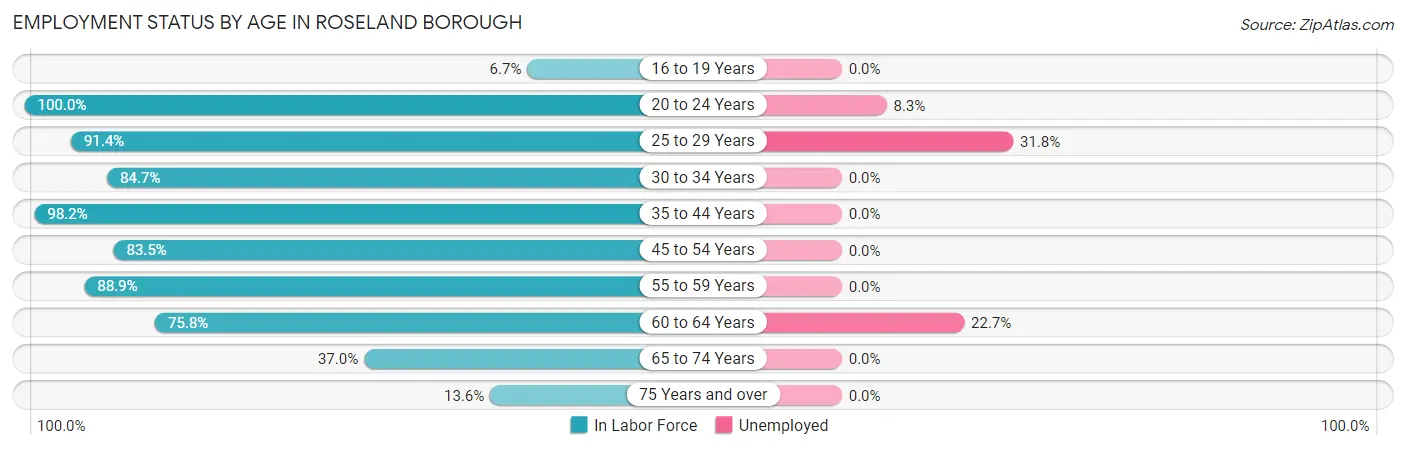
According to the labor force statistics for Roseland borough, out of the total population over 16 years of age (4,962), 66.7% or 3,310 individuals are in the labor force, with 5.4% or 179 of them unemployed. The age group with the highest labor force participation rate is 20 to 24 years, with 100.0% or 192 individuals in the labor force. Within the labor force, the 25 to 29 years age range has the highest percentage of unemployed individuals, with 31.8% or 131 of them being unemployed.
| Age Bracket | In Labor Force | Unemployed |
| 16 to 19 Years | 3 (6.7%) | 0 (0.0%) |
| 20 to 24 Years | 192 (100.0%) | 16 (8.3%) |
| 25 to 29 Years | 412 (91.4%) | 131 (31.8%) |
| 30 to 34 Years | 342 (84.7%) | 0 (0.0%) |
| 35 to 44 Years | 719 (98.2%) | 0 (0.0%) |
| 45 to 54 Years | 772 (83.5%) | 0 (0.0%) |
| 55 to 59 Years | 378 (88.9%) | 0 (0.0%) |
| 60 to 64 Years | 141 (75.8%) | 32 (22.7%) |
| 65 to 74 Years | 214 (37.0%) | 0 (0.0%) |
| 75 Years and over | 139 (13.6%) | 0 (0.0%) |
| Total | 3,310 (66.7%) | 179 (5.4%) |
Employment Status by Educational Attainment in Roseland borough
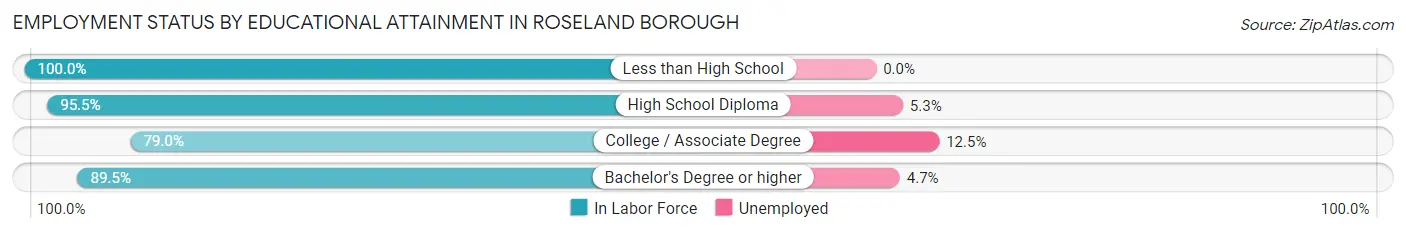
According to labor force statistics for Roseland borough, 88.5% of individuals (2,763) out of the total population between 25 and 64 years of age (3,122) are in the labor force, with 5.9% or 163 of them being unemployed. The group with the highest labor force participation rate are those with the educational attainment of less than high school, with 100.0% or 52 individuals in the labor force. Within the labor force, individuals with college / associate degree education have the highest percentage of unemployment, with 12.5% or 54 of them being unemployed.
| Educational Attainment | In Labor Force | Unemployed |
| Less than High School | 52 (100.0%) | 0 (0.0%) |
| High School Diploma | 359 (95.5%) | 20 (5.3%) |
| College / Associate Degree | 433 (79.0%) | 68 (12.5%) |
| Bachelor's Degree or higher | 1,921 (89.5%) | 101 (4.7%) |
| Total | 2,763 (88.5%) | 184 (5.9%) |
Employment Occupations by Sex in Roseland borough
Management, Business, Science and Arts Occupations
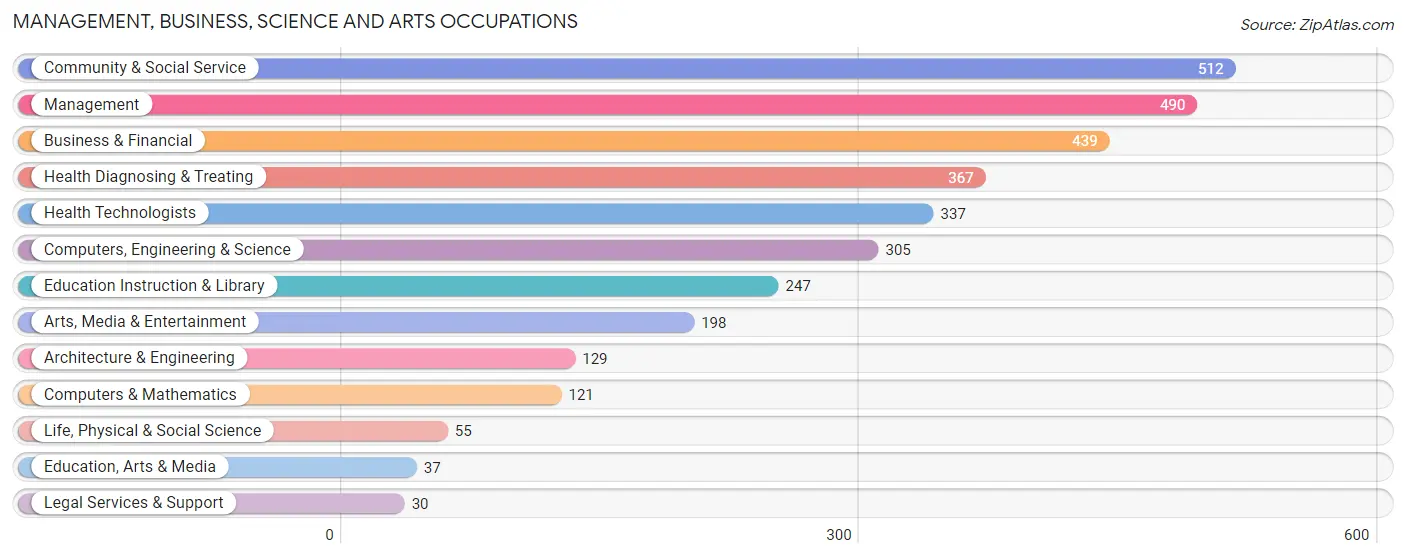
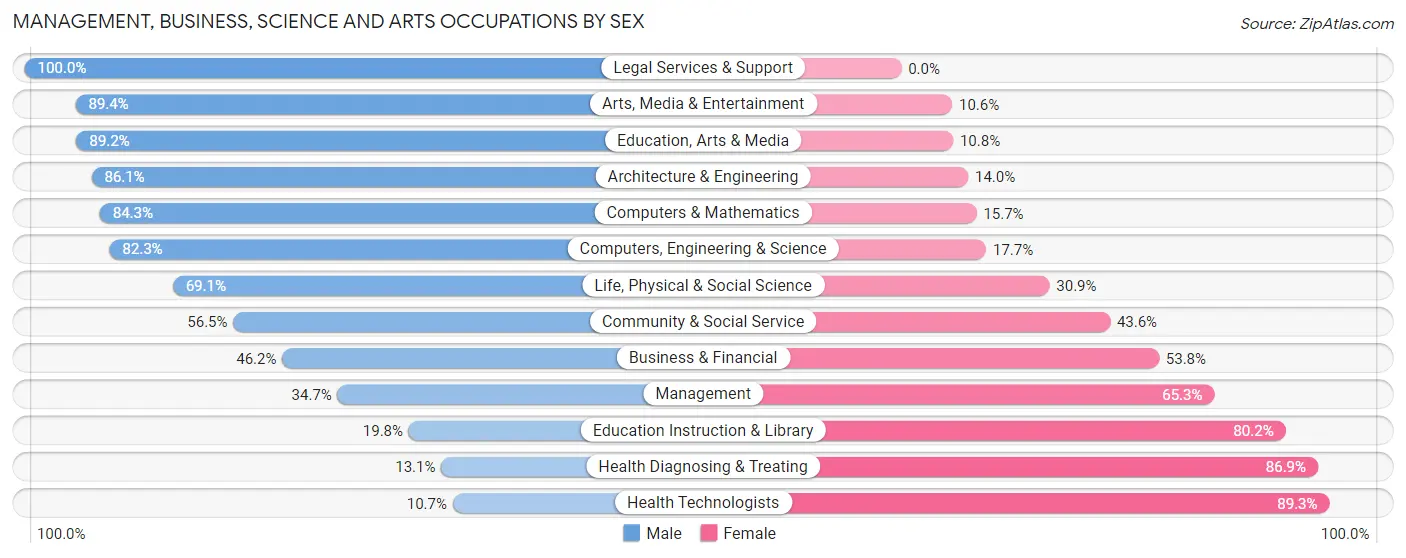
The most common Management, Business, Science and Arts occupations in Roseland borough are Community & Social Service (512 | 16.3%), Management (490 | 15.6%), Business & Financial (439 | 14.0%), Health Diagnosing & Treating (367 | 11.7%), and Health Technologists (337 | 10.8%).
Management, Business, Science and Arts Occupations by Sex
Within the Management, Business, Science and Arts occupations in Roseland borough, the most male-oriented occupations are Legal Services & Support (100.0%), Arts, Media & Entertainment (89.4%), and Education, Arts & Media (89.2%), while the most female-oriented occupations are Health Technologists (89.3%), Health Diagnosing & Treating (86.9%), and Education Instruction & Library (80.2%).
| Occupation | Male | Female |
| Management | 170 (34.7%) | 320 (65.3%) |
| Business & Financial | 203 (46.2%) | 236 (53.8%) |
| Computers, Engineering & Science | 251 (82.3%) | 54 (17.7%) |
| Computers & Mathematics | 102 (84.3%) | 19 (15.7%) |
| Architecture & Engineering | 111 (86.1%) | 18 (14.0%) |
| Life, Physical & Social Science | 38 (69.1%) | 17 (30.9%) |
| Community & Social Service | 289 (56.5%) | 223 (43.5%) |
| Education, Arts & Media | 33 (89.2%) | 4 (10.8%) |
| Legal Services & Support | 30 (100.0%) | 0 (0.0%) |
| Education Instruction & Library | 49 (19.8%) | 198 (80.2%) |
| Arts, Media & Entertainment | 177 (89.4%) | 21 (10.6%) |
| Health Diagnosing & Treating | 48 (13.1%) | 319 (86.9%) |
| Health Technologists | 36 (10.7%) | 301 (89.3%) |
| Total (Category) | 961 (45.5%) | 1,152 (54.5%) |
| Total (Overall) | 1,595 (50.9%) | 1,538 (49.1%) |
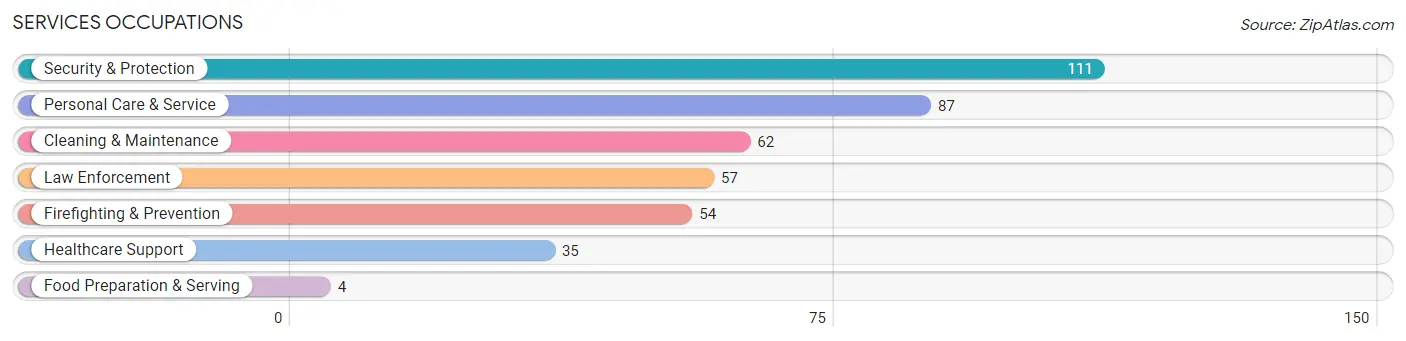
Services Occupations
The most common Services occupations in Roseland borough are Security & Protection (111 | 3.5%), Personal Care & Service (87 | 2.8%), Cleaning & Maintenance (62 | 2.0%), Law Enforcement (57 | 1.8%), and Firefighting & Prevention (54 | 1.7%).
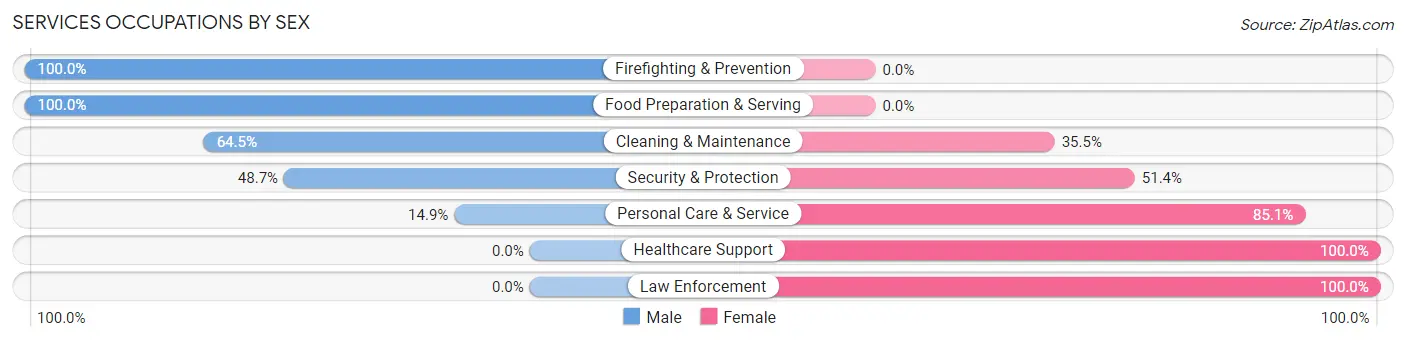
Services Occupations by Sex
Within the Services occupations in Roseland borough, the most male-oriented occupations are Firefighting & Prevention (100.0%), Food Preparation & Serving (100.0%), and Cleaning & Maintenance (64.5%), while the most female-oriented occupations are Healthcare Support (100.0%), Law Enforcement (100.0%), and Personal Care & Service (85.1%).
| Occupation | Male | Female |
| Healthcare Support | 0 (0.0%) | 35 (100.0%) |
| Security & Protection | 54 (48.6%) | 57 (51.3%) |
| Firefighting & Prevention | 54 (100.0%) | 0 (0.0%) |
| Law Enforcement | 0 (0.0%) | 57 (100.0%) |
| Food Preparation & Serving | 4 (100.0%) | 0 (0.0%) |
| Cleaning & Maintenance | 40 (64.5%) | 22 (35.5%) |
| Personal Care & Service | 13 (14.9%) | 74 (85.1%) |
| Total (Category) | 111 (37.1%) | 188 (62.9%) |
| Total (Overall) | 1,595 (50.9%) | 1,538 (49.1%) |
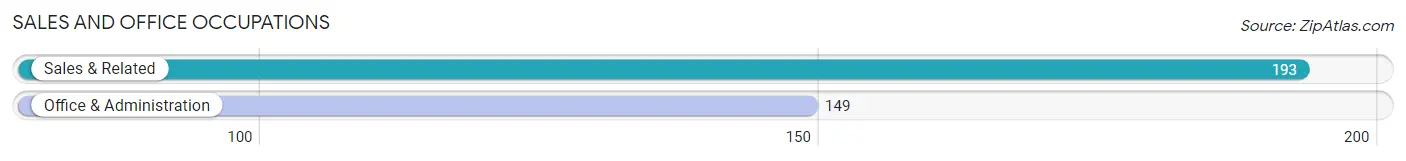
Sales and Office Occupations
The most common Sales and Office occupations in Roseland borough are Sales & Related (193 | 6.2%), and Office & Administration (149 | 4.8%).
Sales and Office Occupations by Sex
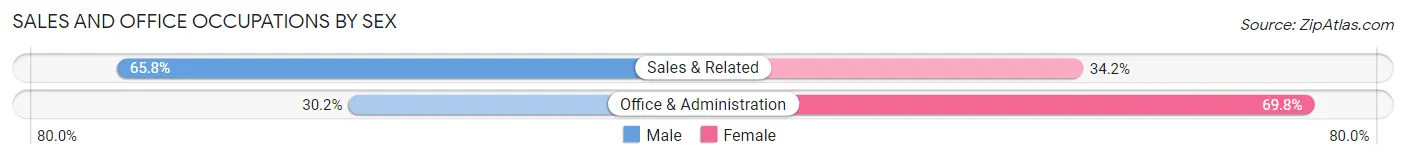
| Occupation | Male | Female |
| Sales & Related | 127 (65.8%) | 66 (34.2%) |
| Office & Administration | 45 (30.2%) | 104 (69.8%) |
| Total (Category) | 172 (50.3%) | 170 (49.7%) |
| Total (Overall) | 1,595 (50.9%) | 1,538 (49.1%) |
Natural Resources, Construction and Maintenance Occupations
The most common Natural Resources, Construction and Maintenance occupations in Roseland borough are Construction & Extraction (127 | 4.1%), and Installation, Maintenance & Repair (55 | 1.8%).
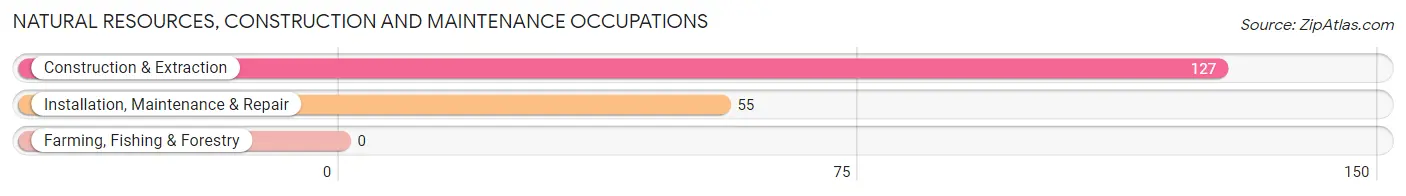
Natural Resources, Construction and Maintenance Occupations by Sex
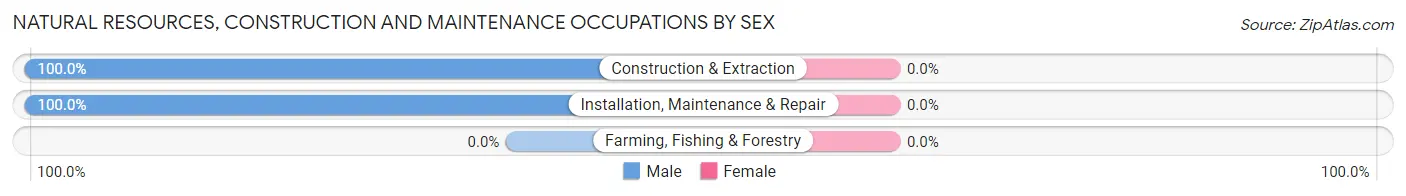
| Occupation | Male | Female |
| Farming, Fishing & Forestry | 0 (0.0%) | 0 (0.0%) |
| Construction & Extraction | 127 (100.0%) | 0 (0.0%) |
| Installation, Maintenance & Repair | 55 (100.0%) | 0 (0.0%) |
| Total (Category) | 182 (100.0%) | 0 (0.0%) |
| Total (Overall) | 1,595 (50.9%) | 1,538 (49.1%) |
Production, Transportation and Moving Occupations
The most common Production, Transportation and Moving occupations in Roseland borough are Production (142 | 4.5%), Material Moving (32 | 1.0%), and Transportation (23 | 0.7%).
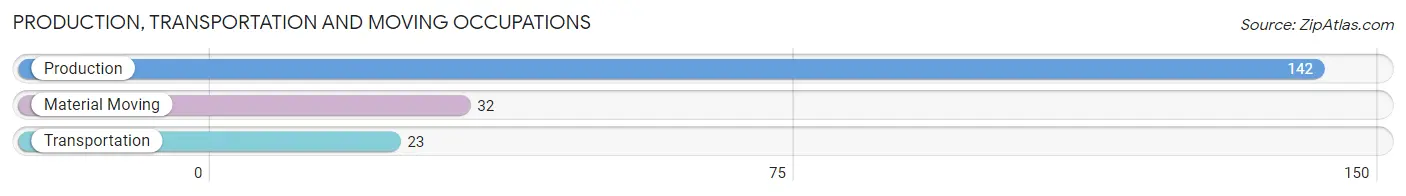
Production, Transportation and Moving Occupations by Sex
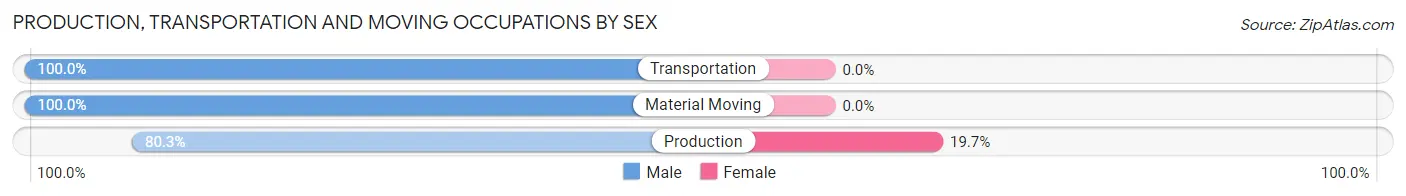
| Occupation | Male | Female |
| Production | 114 (80.3%) | 28 (19.7%) |
| Transportation | 23 (100.0%) | 0 (0.0%) |
| Material Moving | 32 (100.0%) | 0 (0.0%) |
| Total (Category) | 169 (85.8%) | 28 (14.2%) |
| Total (Overall) | 1,595 (50.9%) | 1,538 (49.1%) |
Employment Industries by Sex in Roseland borough
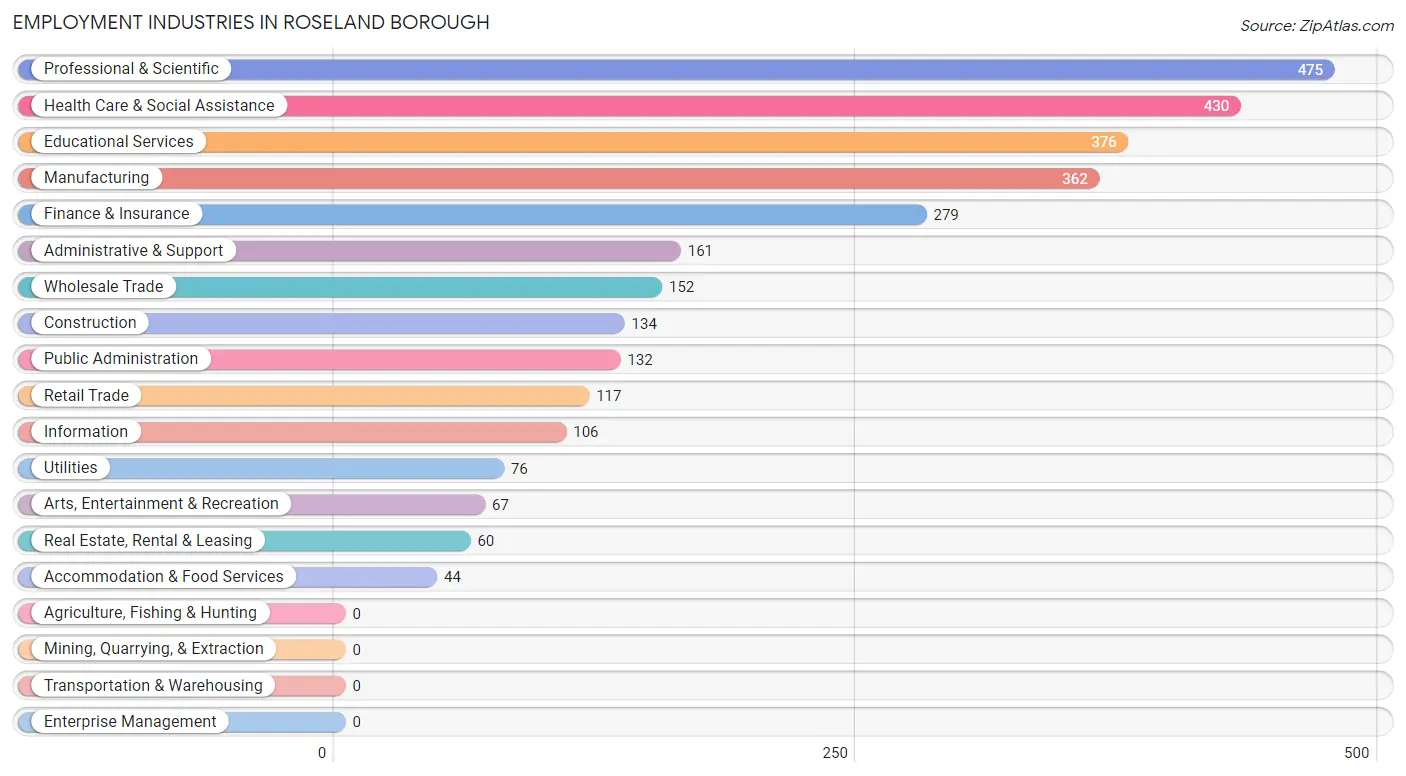
Employment Industries in Roseland borough
The major employment industries in Roseland borough include Professional & Scientific (475 | 15.2%), Health Care & Social Assistance (430 | 13.7%), Educational Services (376 | 12.0%), Manufacturing (362 | 11.6%), and Finance & Insurance (279 | 8.9%).
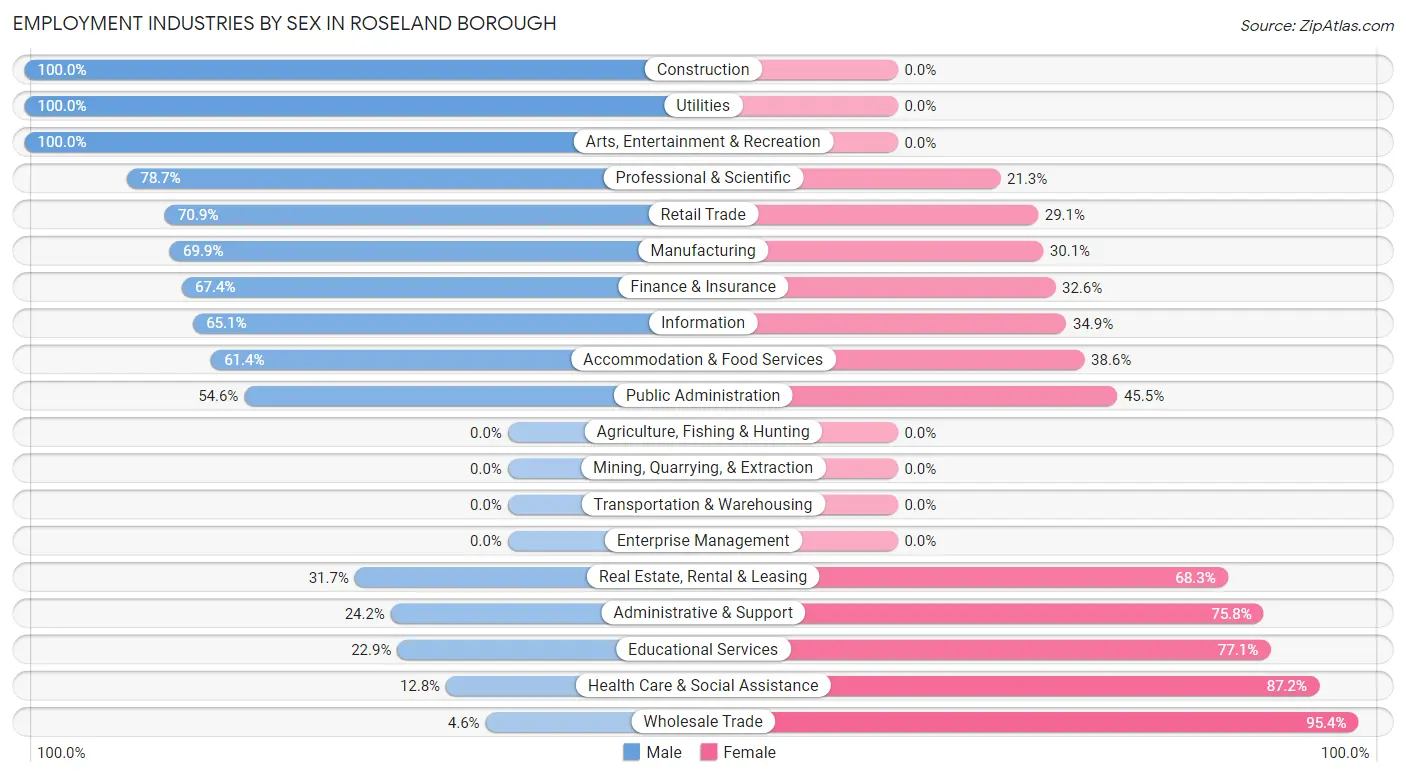
Employment Industries by Sex in Roseland borough
The Roseland borough industries that see more men than women are Construction (100.0%), Utilities (100.0%), and Arts, Entertainment & Recreation (100.0%), whereas the industries that tend to have a higher number of women are Wholesale Trade (95.4%), Health Care & Social Assistance (87.2%), and Educational Services (77.1%).
| Industry | Male | Female |
| Agriculture, Fishing & Hunting | 0 (0.0%) | 0 (0.0%) |
| Mining, Quarrying, & Extraction | 0 (0.0%) | 0 (0.0%) |
| Construction | 134 (100.0%) | 0 (0.0%) |
| Manufacturing | 253 (69.9%) | 109 (30.1%) |
| Wholesale Trade | 7 (4.6%) | 145 (95.4%) |
| Retail Trade | 83 (70.9%) | 34 (29.1%) |
| Transportation & Warehousing | 0 (0.0%) | 0 (0.0%) |
| Utilities | 76 (100.0%) | 0 (0.0%) |
| Information | 69 (65.1%) | 37 (34.9%) |
| Finance & Insurance | 188 (67.4%) | 91 (32.6%) |
| Real Estate, Rental & Leasing | 19 (31.7%) | 41 (68.3%) |
| Professional & Scientific | 374 (78.7%) | 101 (21.3%) |
| Enterprise Management | 0 (0.0%) | 0 (0.0%) |
| Administrative & Support | 39 (24.2%) | 122 (75.8%) |
| Educational Services | 86 (22.9%) | 290 (77.1%) |
| Health Care & Social Assistance | 55 (12.8%) | 375 (87.2%) |
| Arts, Entertainment & Recreation | 67 (100.0%) | 0 (0.0%) |
| Accommodation & Food Services | 27 (61.4%) | 17 (38.6%) |
| Public Administration | 72 (54.5%) | 60 (45.5%) |
| Total | 1,595 (50.9%) | 1,538 (49.1%) |
Education in Roseland borough
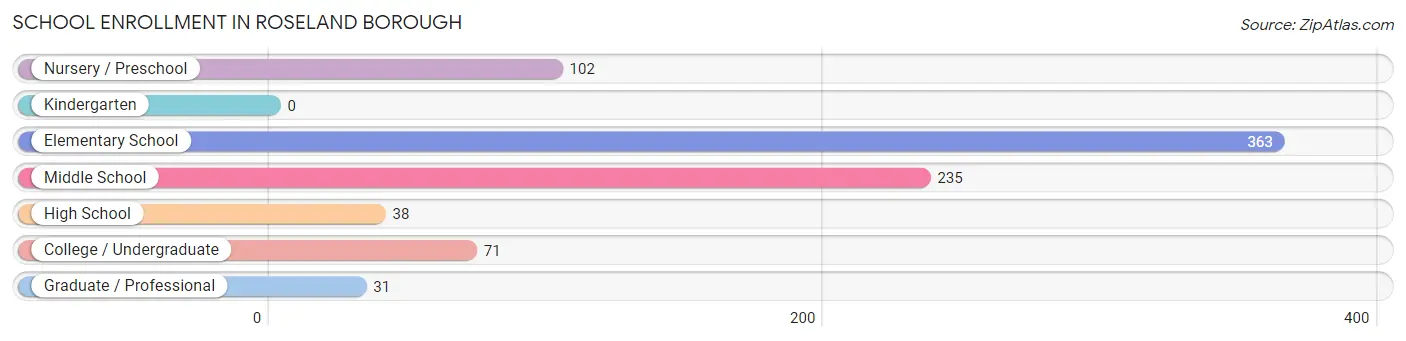
School Enrollment in Roseland borough
The most common levels of schooling among the 840 students in Roseland borough are elementary school (363 | 43.2%), middle school (235 | 28.0%), and nursery / preschool (102 | 12.1%).
| School Level | # Students | % Students |
| Nursery / Preschool | 102 | 12.1% |
| Kindergarten | 0 | 0.0% |
| Elementary School | 363 | 43.2% |
| Middle School | 235 | 28.0% |
| High School | 38 | 4.5% |
| College / Undergraduate | 71 | 8.5% |
| Graduate / Professional | 31 | 3.7% |
| Total | 840 | 100.0% |
School Enrollment by Age by Funding Source in Roseland borough
Out of a total of 840 students who are enrolled in schools in Roseland borough, 85 (10.1%) attend a private institution, while the remaining 755 (89.9%) are enrolled in public schools. The age group of 3 to 4 year olds has the highest likelihood of being enrolled in private schools, with 19 (31.1% in the age bracket) enrolled. Conversely, the age group of 15 to 17 year olds has the lowest likelihood of being enrolled in a private school, with 33 (100.0% in the age bracket) attending a public institution.
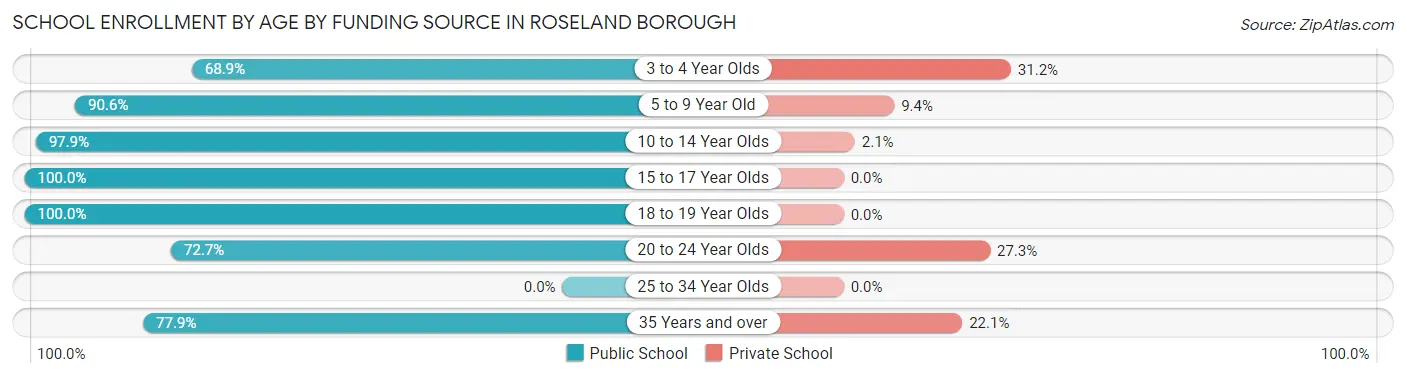
| Age Bracket | Public School | Private School |
| 3 to 4 Year Olds | 42 (68.9%) | 19 (31.1%) |
| 5 to 9 Year Old | 366 (90.6%) | 38 (9.4%) |
| 10 to 14 Year Olds | 235 (97.9%) | 5 (2.1%) |
| 15 to 17 Year Olds | 33 (100.0%) | 0 (0.0%) |
| 18 to 19 Year Olds | 3 (100.0%) | 0 (0.0%) |
| 20 to 24 Year Olds | 16 (72.7%) | 6 (27.3%) |
| 25 to 34 Year Olds | 0 (0.0%) | 0 (0.0%) |
| 35 Years and over | 60 (77.9%) | 17 (22.1%) |
| Total | 755 (89.9%) | 85 (10.1%) |
Educational Attainment by Field of Study in Roseland borough
Business (702 | 22.6%), science & technology (465 | 15.0%), social sciences (382 | 12.3%), education (342 | 11.0%), and computers & mathematics (208 | 6.7%) are the most common fields of study among 3,107 individuals in Roseland borough who have obtained a bachelor's degree or higher.
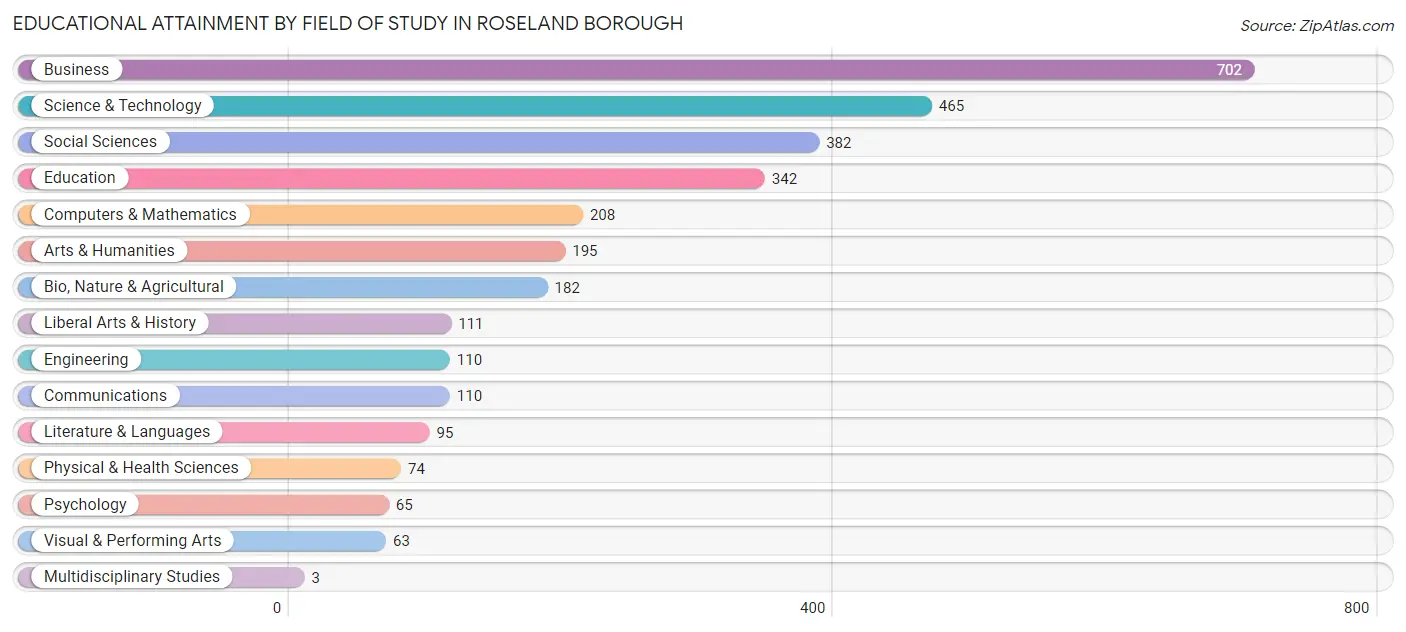
| Field of Study | # Graduates | % Graduates |
| Computers & Mathematics | 208 | 6.7% |
| Bio, Nature & Agricultural | 182 | 5.9% |
| Physical & Health Sciences | 74 | 2.4% |
| Psychology | 65 | 2.1% |
| Social Sciences | 382 | 12.3% |
| Engineering | 110 | 3.5% |
| Multidisciplinary Studies | 3 | 0.1% |
| Science & Technology | 465 | 15.0% |
| Business | 702 | 22.6% |
| Education | 342 | 11.0% |
| Literature & Languages | 95 | 3.1% |
| Liberal Arts & History | 111 | 3.6% |
| Visual & Performing Arts | 63 | 2.0% |
| Communications | 110 | 3.5% |
| Arts & Humanities | 195 | 6.3% |
| Total | 3,107 | 100.0% |
Transportation & Commute in Roseland borough
Vehicle Availability by Sex in Roseland borough
The most prevalent vehicle ownership categories in Roseland borough are males with 2 vehicles (837, accounting for 52.5%) and females with 2 vehicles (930, making up 55.2%).
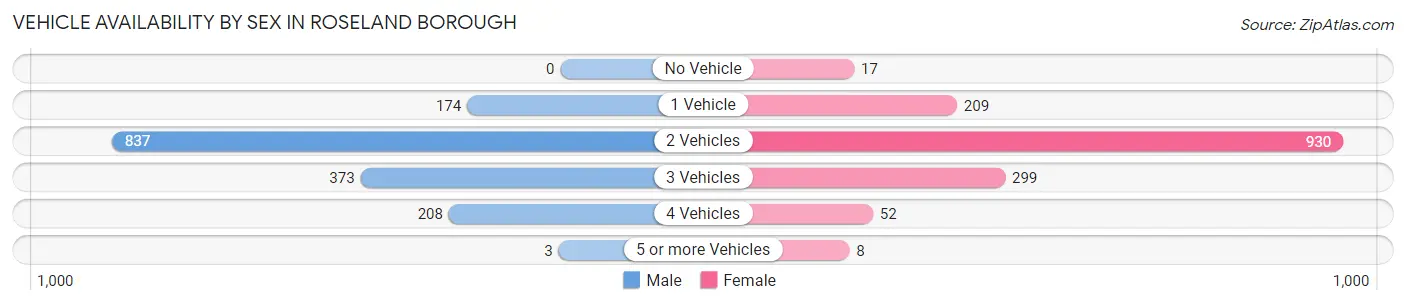
| Vehicles Available | Male | Female |
| No Vehicle | 0 (0.0%) | 17 (1.1%) |
| 1 Vehicle | 174 (10.9%) | 209 (13.8%) |
| 2 Vehicles | 837 (52.5%) | 930 (61.4%) |
| 3 Vehicles | 373 (23.4%) | 299 (19.7%) |
| 4 Vehicles | 208 (13.0%) | 52 (3.4%) |
| 5 or more Vehicles | 3 (0.2%) | 8 (0.5%) |
| Total | 1,595 (100.0%) | 1,515 (100.0%) |
Commute Time in Roseland borough
The most frequently occuring commute durations in Roseland borough are 20 to 24 minutes (488 commuters, 18.9%), 30 to 34 minutes (444 commuters, 17.2%), and 15 to 19 minutes (327 commuters, 12.7%).
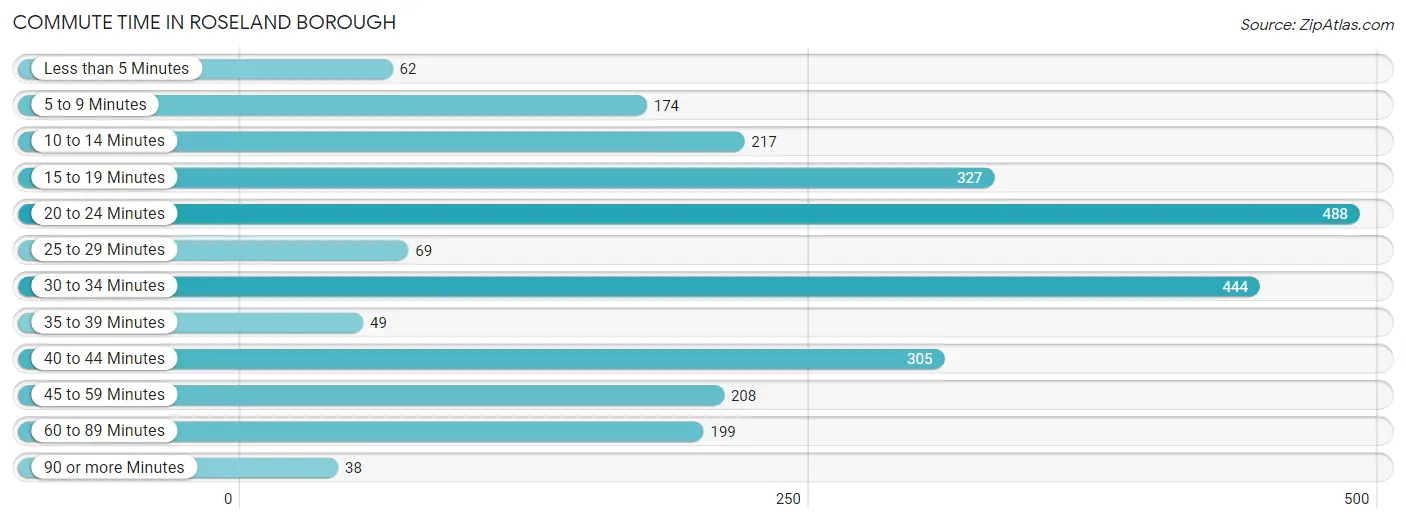
| Commute Time | # Commuters | % Commuters |
| Less than 5 Minutes | 62 | 2.4% |
| 5 to 9 Minutes | 174 | 6.7% |
| 10 to 14 Minutes | 217 | 8.4% |
| 15 to 19 Minutes | 327 | 12.7% |
| 20 to 24 Minutes | 488 | 18.9% |
| 25 to 29 Minutes | 69 | 2.7% |
| 30 to 34 Minutes | 444 | 17.2% |
| 35 to 39 Minutes | 49 | 1.9% |
| 40 to 44 Minutes | 305 | 11.8% |
| 45 to 59 Minutes | 208 | 8.1% |
| 60 to 89 Minutes | 199 | 7.7% |
| 90 or more Minutes | 38 | 1.5% |
Commute Time by Sex in Roseland borough
The most common commute times in Roseland borough are 20 to 24 minutes (234 commuters, 18.0%) for males and 30 to 34 minutes (288 commuters, 22.5%) for females.
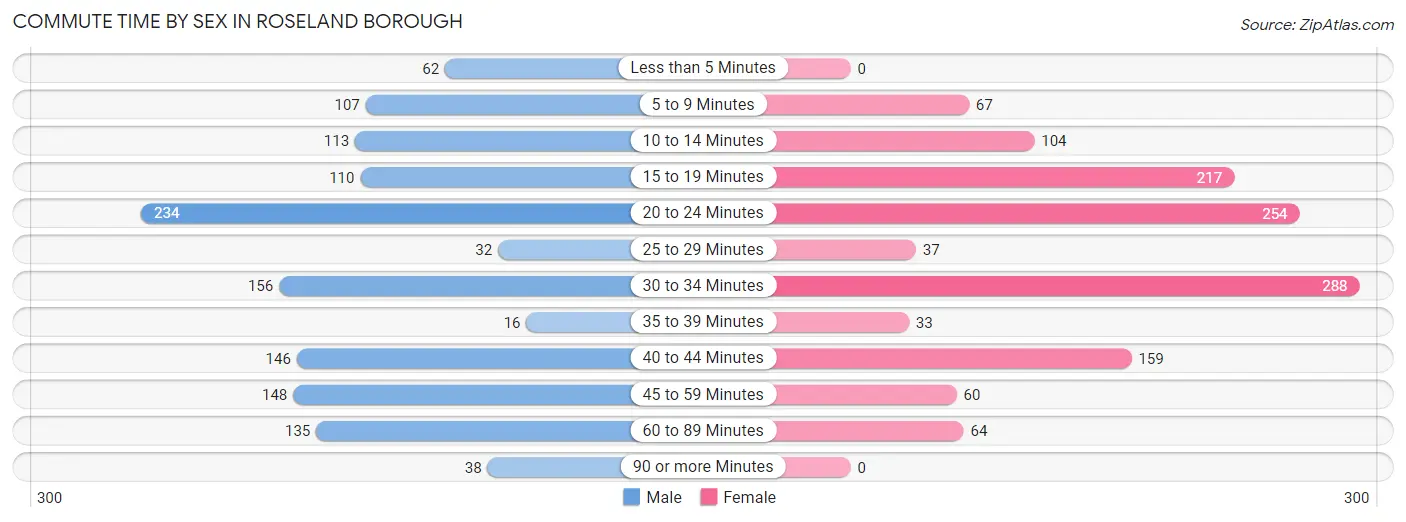
| Commute Time | Male | Female |
| Less than 5 Minutes | 62 (4.8%) | 0 (0.0%) |
| 5 to 9 Minutes | 107 (8.3%) | 67 (5.2%) |
| 10 to 14 Minutes | 113 (8.7%) | 104 (8.1%) |
| 15 to 19 Minutes | 110 (8.5%) | 217 (16.9%) |
| 20 to 24 Minutes | 234 (18.0%) | 254 (19.8%) |
| 25 to 29 Minutes | 32 (2.5%) | 37 (2.9%) |
| 30 to 34 Minutes | 156 (12.0%) | 288 (22.5%) |
| 35 to 39 Minutes | 16 (1.2%) | 33 (2.6%) |
| 40 to 44 Minutes | 146 (11.3%) | 159 (12.4%) |
| 45 to 59 Minutes | 148 (11.4%) | 60 (4.7%) |
| 60 to 89 Minutes | 135 (10.4%) | 64 (5.0%) |
| 90 or more Minutes | 38 (2.9%) | 0 (0.0%) |
Time of Departure to Work by Sex in Roseland borough
The most frequent times of departure to work in Roseland borough are 6:30 AM to 6:59 AM (270, 20.8%) for males and 8:00 AM to 8:29 AM (287, 22.4%) for females.
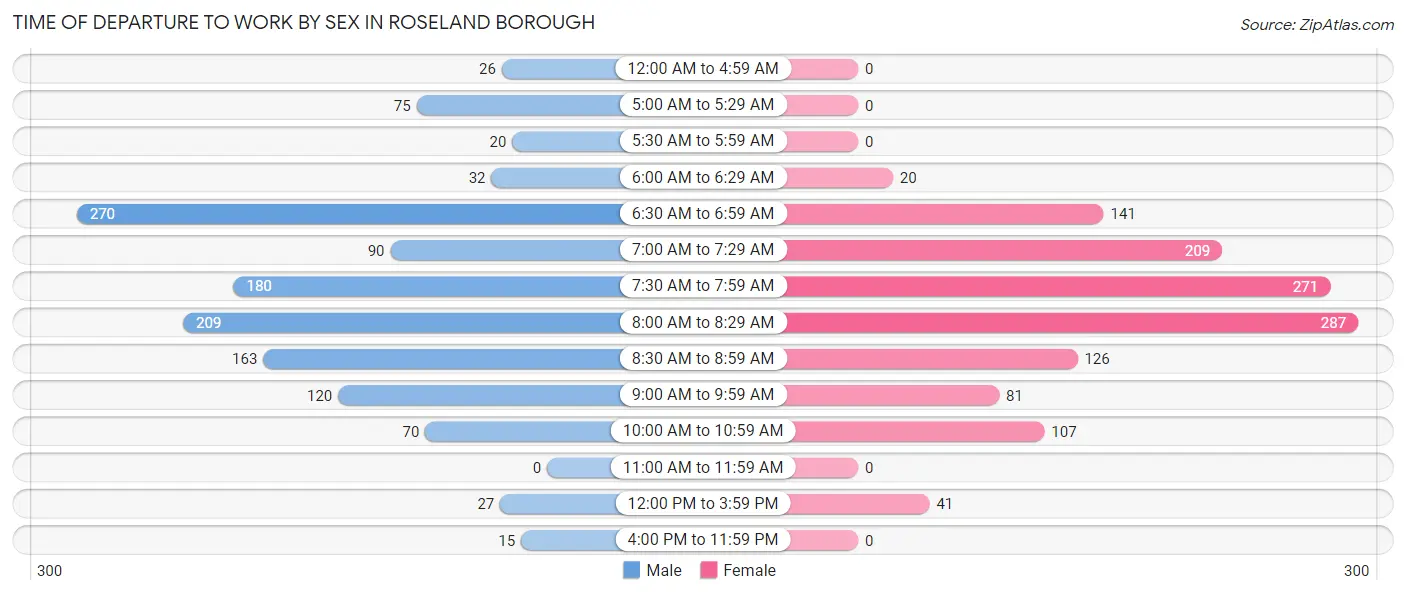
| Time of Departure | Male | Female |
| 12:00 AM to 4:59 AM | 26 (2.0%) | 0 (0.0%) |
| 5:00 AM to 5:29 AM | 75 (5.8%) | 0 (0.0%) |
| 5:30 AM to 5:59 AM | 20 (1.5%) | 0 (0.0%) |
| 6:00 AM to 6:29 AM | 32 (2.5%) | 20 (1.6%) |
| 6:30 AM to 6:59 AM | 270 (20.8%) | 141 (11.0%) |
| 7:00 AM to 7:29 AM | 90 (6.9%) | 209 (16.3%) |
| 7:30 AM to 7:59 AM | 180 (13.9%) | 271 (21.1%) |
| 8:00 AM to 8:29 AM | 209 (16.1%) | 287 (22.4%) |
| 8:30 AM to 8:59 AM | 163 (12.6%) | 126 (9.8%) |
| 9:00 AM to 9:59 AM | 120 (9.2%) | 81 (6.3%) |
| 10:00 AM to 10:59 AM | 70 (5.4%) | 107 (8.3%) |
| 11:00 AM to 11:59 AM | 0 (0.0%) | 0 (0.0%) |
| 12:00 PM to 3:59 PM | 27 (2.1%) | 41 (3.2%) |
| 4:00 PM to 11:59 PM | 15 (1.2%) | 0 (0.0%) |
| Total | 1,297 (100.0%) | 1,283 (100.0%) |
Housing Occupancy in Roseland borough
Occupancy by Ownership in Roseland borough
Of the total 2,451 dwellings in Roseland borough, owner-occupied units account for 1,884 (76.9%), while renter-occupied units make up 567 (23.1%).
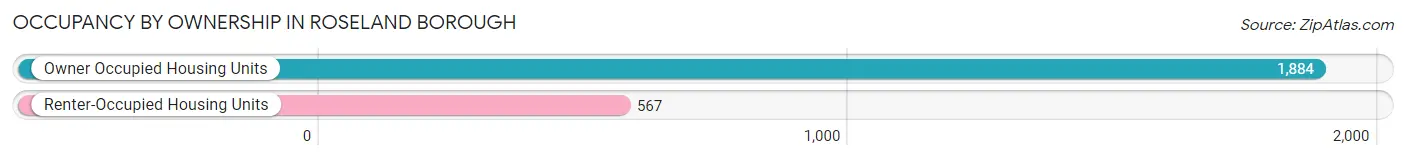
| Occupancy | # Housing Units | % Housing Units |
| Owner Occupied Housing Units | 1,884 | 76.9% |
| Renter-Occupied Housing Units | 567 | 23.1% |
| Total Occupied Housing Units | 2,451 | 100.0% |
Occupancy by Household Size in Roseland borough
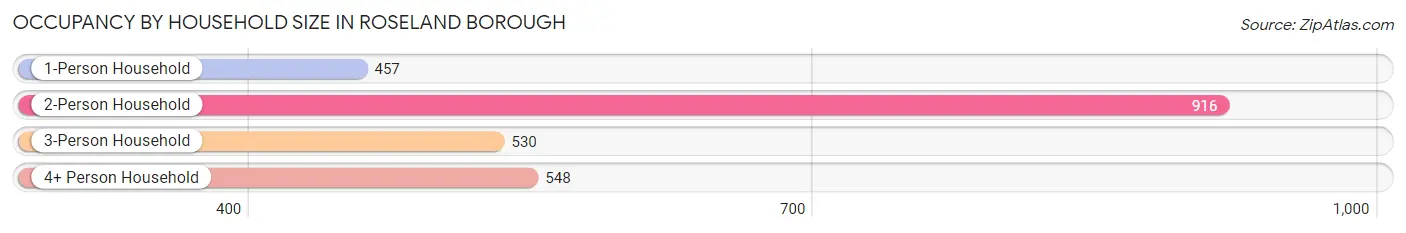
| Household Size | # Housing Units | % Housing Units |
| 1-Person Household | 457 | 18.6% |
| 2-Person Household | 916 | 37.4% |
| 3-Person Household | 530 | 21.6% |
| 4+ Person Household | 548 | 22.4% |
| Total Housing Units | 2,451 | 100.0% |
Occupancy by Ownership by Household Size in Roseland borough
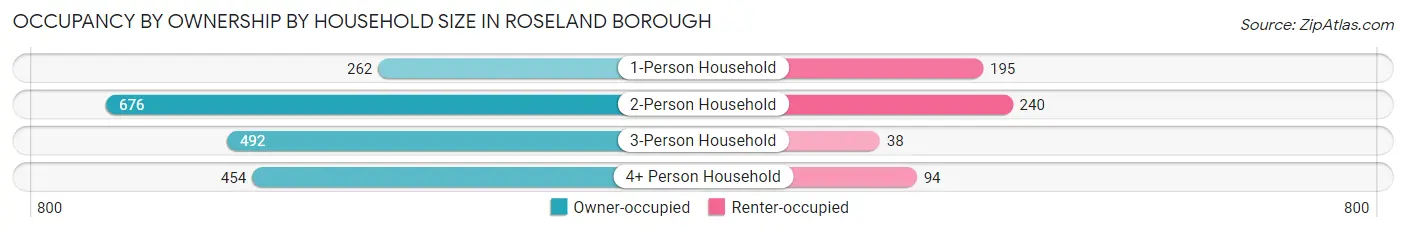
| Household Size | Owner-occupied | Renter-occupied |
| 1-Person Household | 262 (57.3%) | 195 (42.7%) |
| 2-Person Household | 676 (73.8%) | 240 (26.2%) |
| 3-Person Household | 492 (92.8%) | 38 (7.2%) |
| 4+ Person Household | 454 (82.9%) | 94 (17.2%) |
| Total Housing Units | 1,884 (76.9%) | 567 (23.1%) |
Occupancy by Educational Attainment in Roseland borough
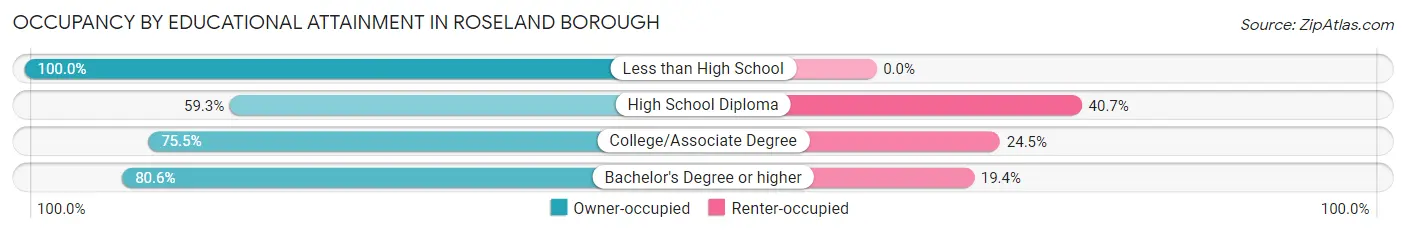
| Household Size | Owner-occupied | Renter-occupied |
| Less than High School | 42 (100.0%) | 0 (0.0%) |
| High School Diploma | 227 (59.3%) | 156 (40.7%) |
| College/Associate Degree | 274 (75.5%) | 89 (24.5%) |
| Bachelor's Degree or higher | 1,341 (80.6%) | 322 (19.4%) |
Occupancy by Age of Householder in Roseland borough
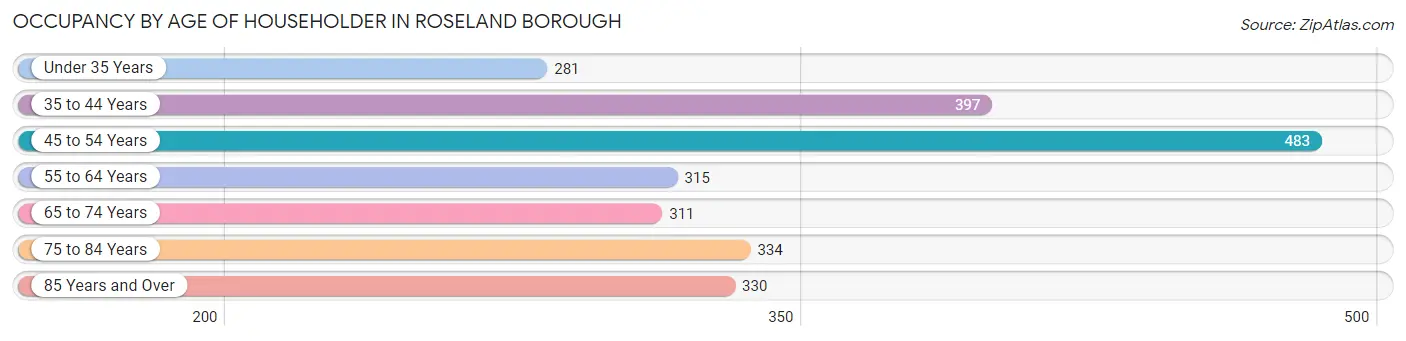
| Age Bracket | # Households | % Households |
| Under 35 Years | 281 | 11.5% |
| 35 to 44 Years | 397 | 16.2% |
| 45 to 54 Years | 483 | 19.7% |
| 55 to 64 Years | 315 | 12.9% |
| 65 to 74 Years | 311 | 12.7% |
| 75 to 84 Years | 334 | 13.6% |
| 85 Years and Over | 330 | 13.5% |
| Total | 2,451 | 100.0% |
Housing Finances in Roseland borough
Median Income by Occupancy in Roseland borough
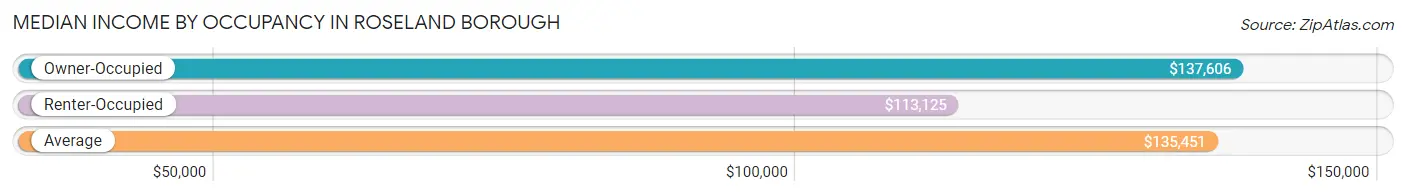
| Occupancy Type | # Households | Median Income |
| Owner-Occupied | 1,884 (76.9%) | $137,606 |
| Renter-Occupied | 567 (23.1%) | $113,125 |
| Average | 2,451 (100.0%) | $135,451 |
Occupancy by Householder Income Bracket in Roseland borough
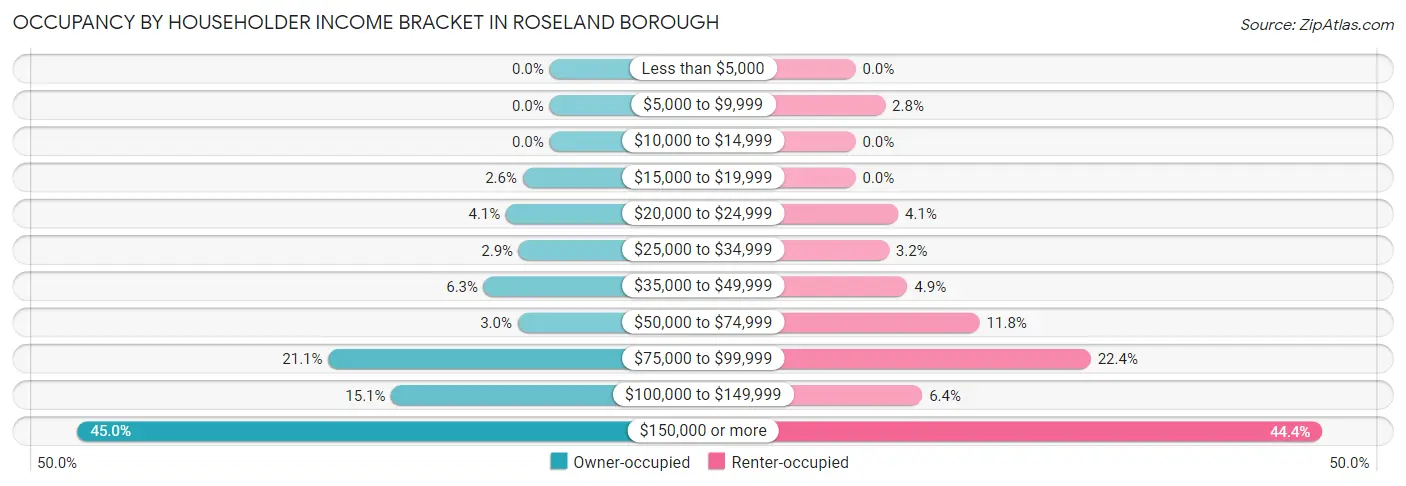
| Income Bracket | Owner-occupied | Renter-occupied |
| Less than $5,000 | 0 (0.0%) | 0 (0.0%) |
| $5,000 to $9,999 | 0 (0.0%) | 16 (2.8%) |
| $10,000 to $14,999 | 0 (0.0%) | 0 (0.0%) |
| $15,000 to $19,999 | 48 (2.5%) | 0 (0.0%) |
| $20,000 to $24,999 | 78 (4.1%) | 23 (4.1%) |
| $25,000 to $34,999 | 55 (2.9%) | 18 (3.2%) |
| $35,000 to $49,999 | 118 (6.3%) | 28 (4.9%) |
| $50,000 to $74,999 | 57 (3.0%) | 67 (11.8%) |
| $75,000 to $99,999 | 397 (21.1%) | 127 (22.4%) |
| $100,000 to $149,999 | 284 (15.1%) | 36 (6.4%) |
| $150,000 or more | 847 (45.0%) | 252 (44.4%) |
| Total | 1,884 (100.0%) | 567 (100.0%) |
Monthly Housing Cost Tiers in Roseland borough
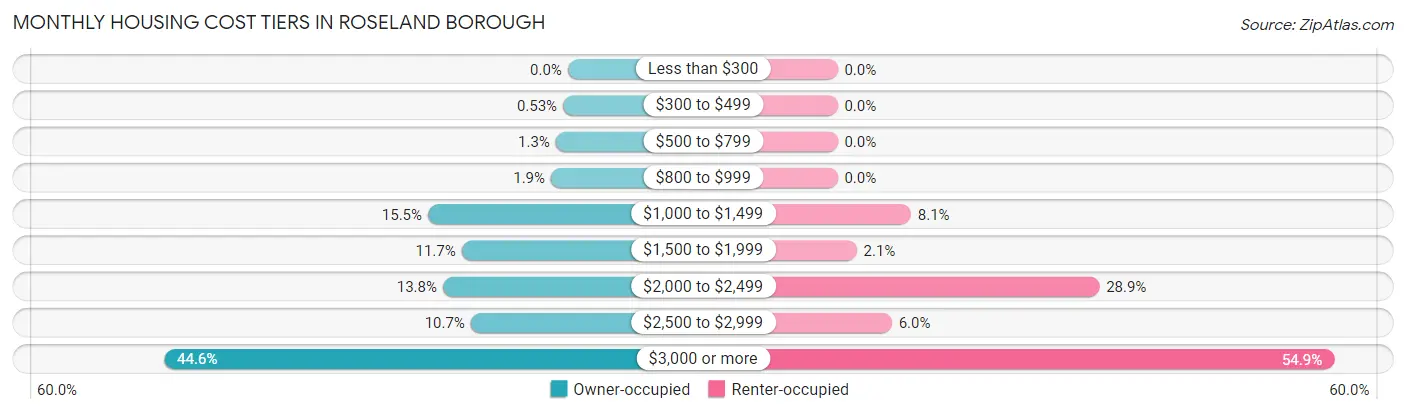
| Monthly Cost | Owner-occupied | Renter-occupied |
| Less than $300 | 0 (0.0%) | 0 (0.0%) |
| $300 to $499 | 10 (0.5%) | 0 (0.0%) |
| $500 to $799 | 25 (1.3%) | 0 (0.0%) |
| $800 to $999 | 35 (1.9%) | 0 (0.0%) |
| $1,000 to $1,499 | 291 (15.4%) | 46 (8.1%) |
| $1,500 to $1,999 | 221 (11.7%) | 12 (2.1%) |
| $2,000 to $2,499 | 260 (13.8%) | 164 (28.9%) |
| $2,500 to $2,999 | 202 (10.7%) | 34 (6.0%) |
| $3,000 or more | 840 (44.6%) | 311 (54.8%) |
| Total | 1,884 (100.0%) | 567 (100.0%) |
Physical Housing Characteristics in Roseland borough
Housing Structures in Roseland borough
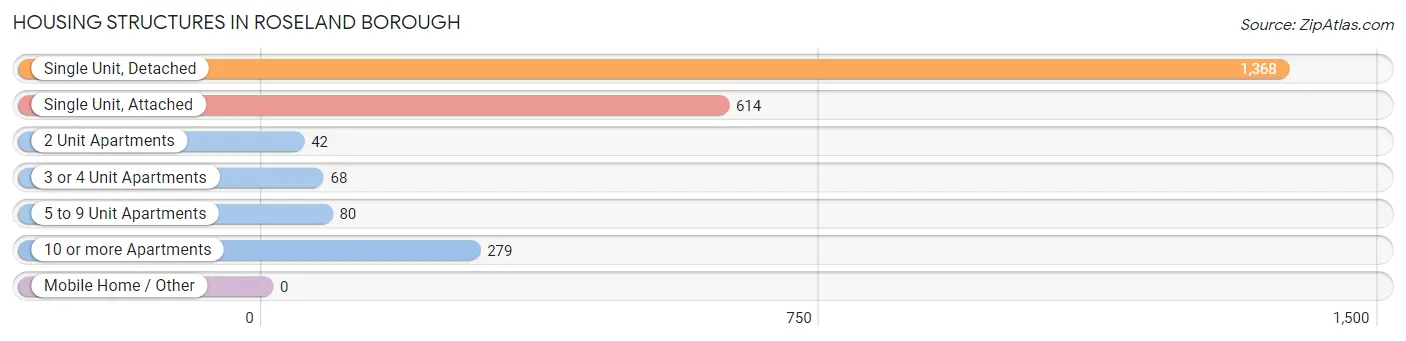
| Structure Type | # Housing Units | % Housing Units |
| Single Unit, Detached | 1,368 | 55.8% |
| Single Unit, Attached | 614 | 25.1% |
| 2 Unit Apartments | 42 | 1.7% |
| 3 or 4 Unit Apartments | 68 | 2.8% |
| 5 to 9 Unit Apartments | 80 | 3.3% |
| 10 or more Apartments | 279 | 11.4% |
| Mobile Home / Other | 0 | 0.0% |
| Total | 2,451 | 100.0% |
Housing Structures by Occupancy in Roseland borough
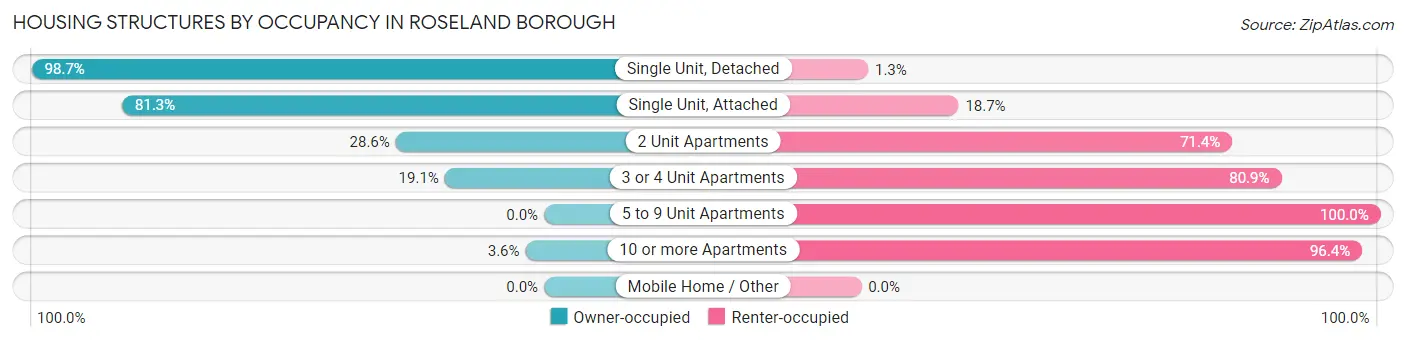
| Structure Type | Owner-occupied | Renter-occupied |
| Single Unit, Detached | 1,350 (98.7%) | 18 (1.3%) |
| Single Unit, Attached | 499 (81.3%) | 115 (18.7%) |
| 2 Unit Apartments | 12 (28.6%) | 30 (71.4%) |
| 3 or 4 Unit Apartments | 13 (19.1%) | 55 (80.9%) |
| 5 to 9 Unit Apartments | 0 (0.0%) | 80 (100.0%) |
| 10 or more Apartments | 10 (3.6%) | 269 (96.4%) |
| Mobile Home / Other | 0 (0.0%) | 0 (0.0%) |
| Total | 1,884 (76.9%) | 567 (23.1%) |
Housing Structures by Number of Rooms in Roseland borough
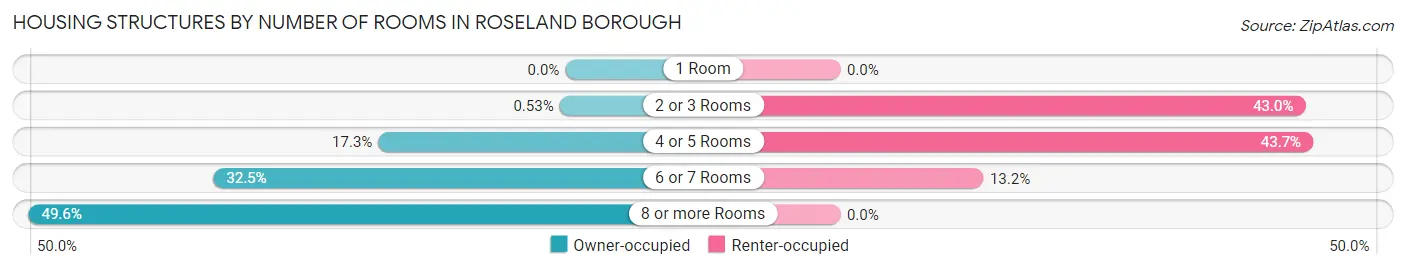
| Number of Rooms | Owner-occupied | Renter-occupied |
| 1 Room | 0 (0.0%) | 0 (0.0%) |
| 2 or 3 Rooms | 10 (0.5%) | 244 (43.0%) |
| 4 or 5 Rooms | 326 (17.3%) | 248 (43.7%) |
| 6 or 7 Rooms | 613 (32.5%) | 75 (13.2%) |
| 8 or more Rooms | 935 (49.6%) | 0 (0.0%) |
| Total | 1,884 (100.0%) | 567 (100.0%) |
Housing Structure by Heating Type in Roseland borough
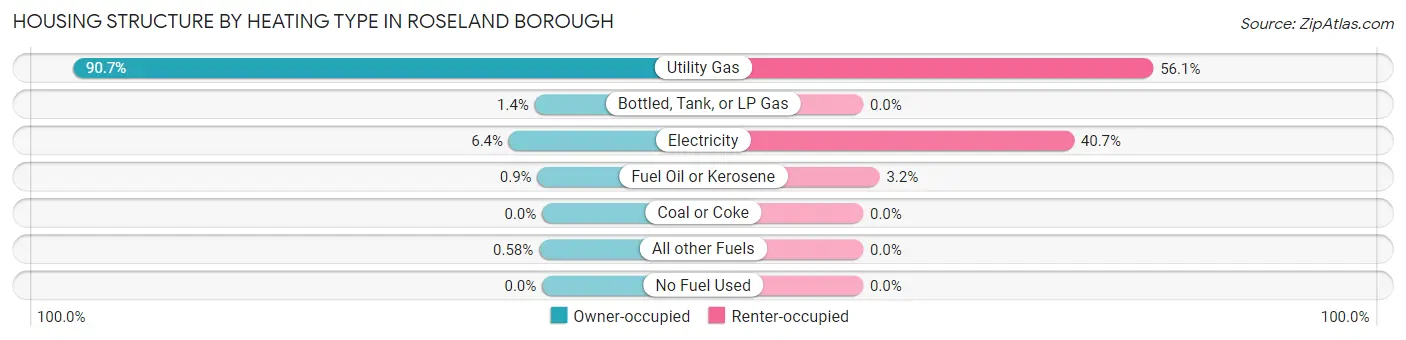
| Heating Type | Owner-occupied | Renter-occupied |
| Utility Gas | 1,708 (90.7%) | 318 (56.1%) |
| Bottled, Tank, or LP Gas | 27 (1.4%) | 0 (0.0%) |
| Electricity | 121 (6.4%) | 231 (40.7%) |
| Fuel Oil or Kerosene | 17 (0.9%) | 18 (3.2%) |
| Coal or Coke | 0 (0.0%) | 0 (0.0%) |
| All other Fuels | 11 (0.6%) | 0 (0.0%) |
| No Fuel Used | 0 (0.0%) | 0 (0.0%) |
| Total | 1,884 (100.0%) | 567 (100.0%) |
Household Vehicle Usage in Roseland borough
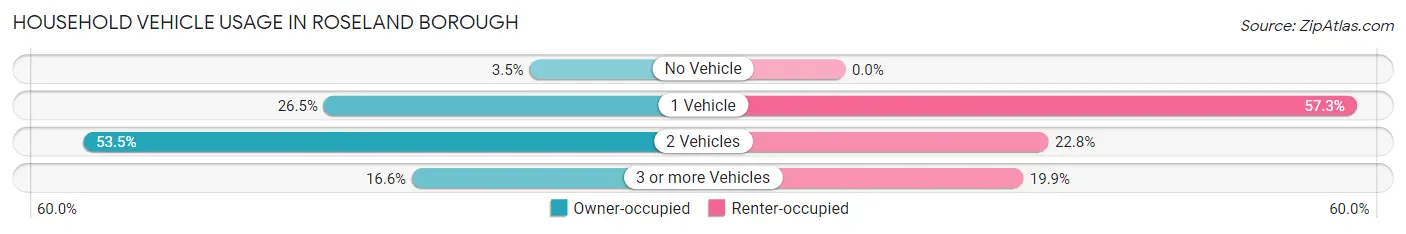
| Vehicles per Household | Owner-occupied | Renter-occupied |
| No Vehicle | 65 (3.5%) | 0 (0.0%) |
| 1 Vehicle | 499 (26.5%) | 325 (57.3%) |
| 2 Vehicles | 1,007 (53.4%) | 129 (22.8%) |
| 3 or more Vehicles | 313 (16.6%) | 113 (19.9%) |
| Total | 1,884 (100.0%) | 567 (100.0%) |
Real Estate & Mortgages in Roseland borough
Real Estate and Mortgage Overview in Roseland borough
| Characteristic | Without Mortgage | With Mortgage |
| Housing Units | 590 | 1,294 |
| Median Property Value | $573,500 | $630,800 |
| Median Household Income | $100,391 | $635 |
| Monthly Housing Costs | $1,470 | $840 |
| Real Estate Taxes | $10,001 | $0 |
Property Value by Mortgage Status in Roseland borough
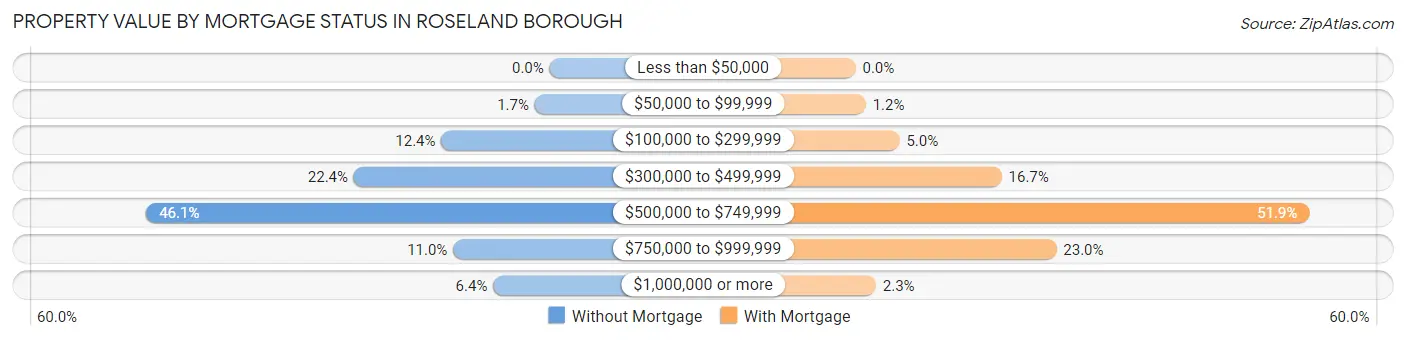
| Property Value | Without Mortgage | With Mortgage |
| Less than $50,000 | 0 (0.0%) | 0 (0.0%) |
| $50,000 to $99,999 | 10 (1.7%) | 15 (1.2%) |
| $100,000 to $299,999 | 73 (12.4%) | 65 (5.0%) |
| $300,000 to $499,999 | 132 (22.4%) | 216 (16.7%) |
| $500,000 to $749,999 | 272 (46.1%) | 671 (51.8%) |
| $750,000 to $999,999 | 65 (11.0%) | 297 (23.0%) |
| $1,000,000 or more | 38 (6.4%) | 30 (2.3%) |
| Total | 590 (100.0%) | 1,294 (100.0%) |
Household Income by Mortgage Status in Roseland borough
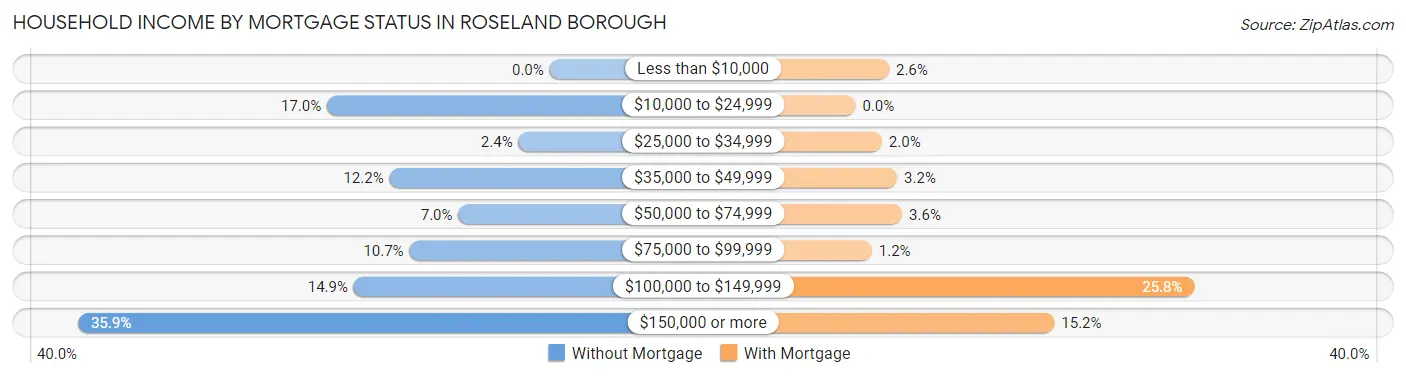
| Household Income | Without Mortgage | With Mortgage |
| Less than $10,000 | 0 (0.0%) | 33 (2.5%) |
| $10,000 to $24,999 | 100 (17.0%) | 0 (0.0%) |
| $25,000 to $34,999 | 14 (2.4%) | 26 (2.0%) |
| $35,000 to $49,999 | 72 (12.2%) | 41 (3.2%) |
| $50,000 to $74,999 | 41 (7.0%) | 46 (3.5%) |
| $75,000 to $99,999 | 63 (10.7%) | 16 (1.2%) |
| $100,000 to $149,999 | 88 (14.9%) | 334 (25.8%) |
| $150,000 or more | 212 (35.9%) | 196 (15.1%) |
| Total | 590 (100.0%) | 1,294 (100.0%) |
Property Value to Household Income Ratio in Roseland borough
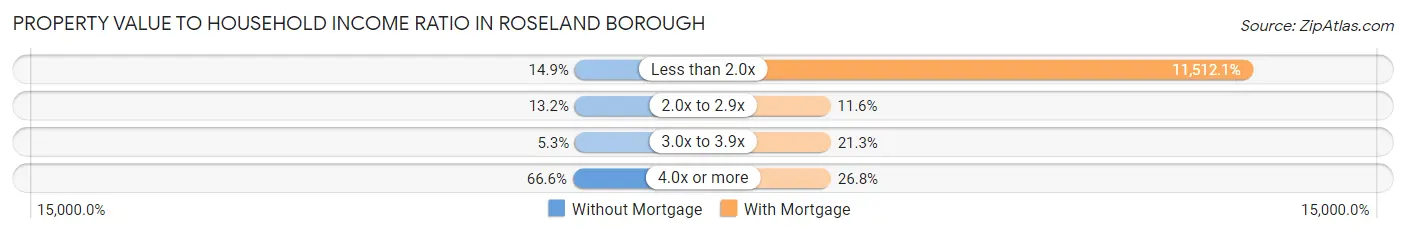
| Value-to-Income Ratio | Without Mortgage | With Mortgage |
| Less than 2.0x | 88 (14.9%) | 148,966 (11,512.1%) |
| 2.0x to 2.9x | 78 (13.2%) | 150 (11.6%) |
| 3.0x to 3.9x | 31 (5.2%) | 275 (21.2%) |
| 4.0x or more | 393 (66.6%) | 347 (26.8%) |
| Total | 590 (100.0%) | 1,294 (100.0%) |
Real Estate Taxes by Mortgage Status in Roseland borough
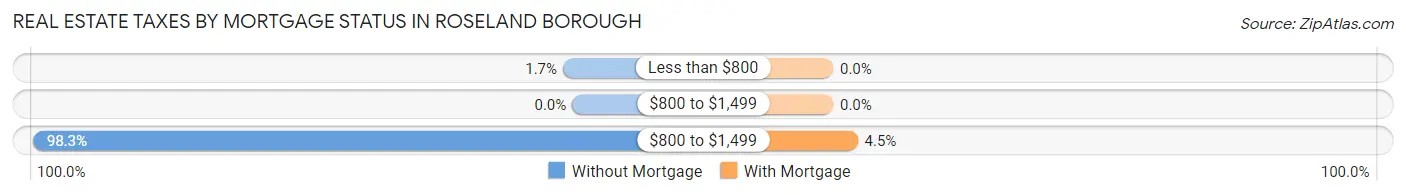
| Property Taxes | Without Mortgage | With Mortgage |
| Less than $800 | 10 (1.7%) | 0 (0.0%) |
| $800 to $1,499 | 0 (0.0%) | 0 (0.0%) |
| $800 to $1,499 | 580 (98.3%) | 58 (4.5%) |
| Total | 590 (100.0%) | 1,294 (100.0%) |
Health & Disability in Roseland borough
Health Insurance Coverage by Age in Roseland borough
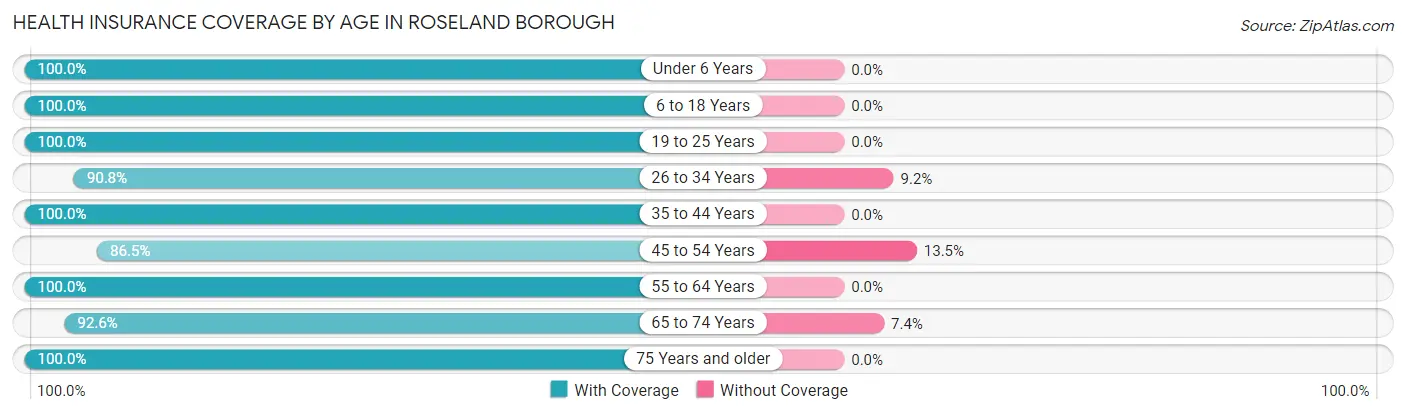
| Age Bracket | With Coverage | Without Coverage |
| Under 6 Years | 611 (100.0%) | 0 (0.0%) |
| 6 to 18 Years | 667 (100.0%) | 0 (0.0%) |
| 19 to 25 Years | 235 (100.0%) | 0 (0.0%) |
| 26 to 34 Years | 761 (90.8%) | 77 (9.2%) |
| 35 to 44 Years | 732 (100.0%) | 0 (0.0%) |
| 45 to 54 Years | 799 (86.5%) | 125 (13.5%) |
| 55 to 64 Years | 611 (100.0%) | 0 (0.0%) |
| 65 to 74 Years | 536 (92.6%) | 43 (7.4%) |
| 75 Years and older | 1,024 (100.0%) | 0 (0.0%) |
| Total | 5,976 (96.1%) | 245 (3.9%) |
Health Insurance Coverage by Citizenship Status in Roseland borough
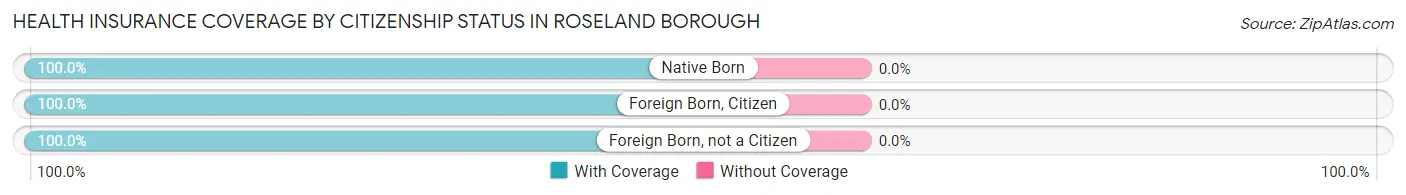
| Citizenship Status | With Coverage | Without Coverage |
| Native Born | 611 (100.0%) | 0 (0.0%) |
| Foreign Born, Citizen | 667 (100.0%) | 0 (0.0%) |
| Foreign Born, not a Citizen | 235 (100.0%) | 0 (0.0%) |
Health Insurance Coverage by Household Income in Roseland borough
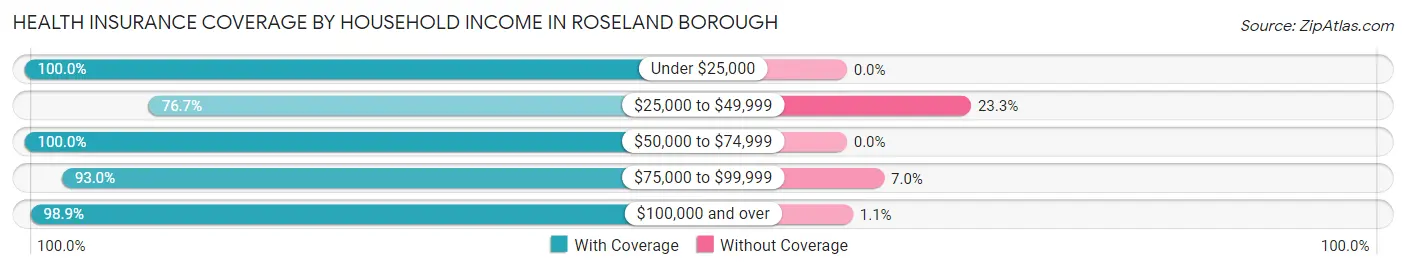
| Household Income | With Coverage | Without Coverage |
| Under $25,000 | 269 (100.0%) | 0 (0.0%) |
| $25,000 to $49,999 | 399 (76.7%) | 121 (23.3%) |
| $50,000 to $74,999 | 218 (100.0%) | 0 (0.0%) |
| $75,000 to $99,999 | 1,025 (93.0%) | 77 (7.0%) |
| $100,000 and over | 4,063 (98.9%) | 47 (1.1%) |
Public vs Private Health Insurance Coverage by Age in Roseland borough
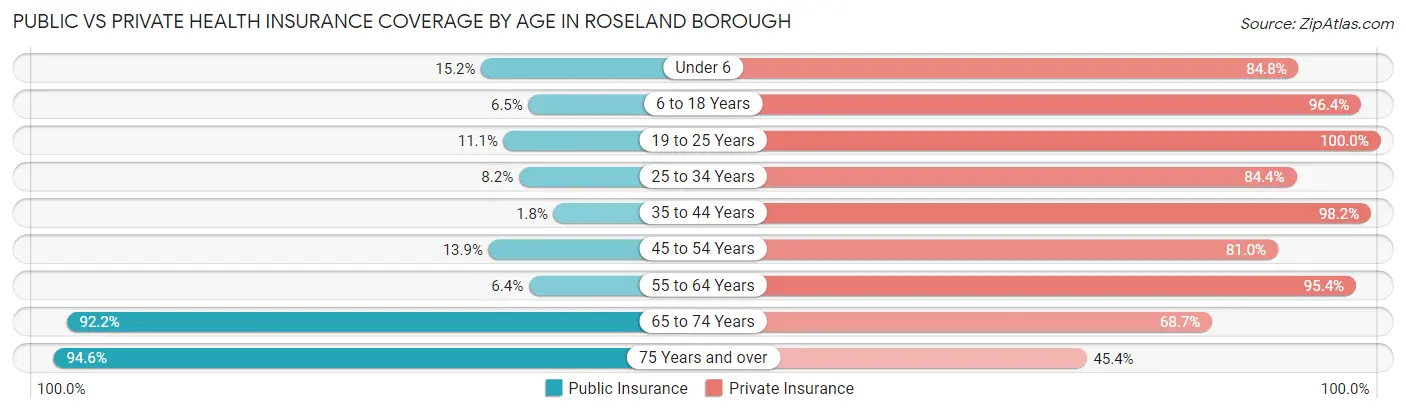
| Age Bracket | Public Insurance | Private Insurance |
| Under 6 | 93 (15.2%) | 518 (84.8%) |
| 6 to 18 Years | 43 (6.5%) | 643 (96.4%) |
| 19 to 25 Years | 26 (11.1%) | 235 (100.0%) |
| 25 to 34 Years | 69 (8.2%) | 707 (84.4%) |
| 35 to 44 Years | 13 (1.8%) | 719 (98.2%) |
| 45 to 54 Years | 128 (13.9%) | 748 (80.9%) |
| 55 to 64 Years | 39 (6.4%) | 583 (95.4%) |
| 65 to 74 Years | 534 (92.2%) | 398 (68.7%) |
| 75 Years and over | 969 (94.6%) | 465 (45.4%) |
| Total | 1,914 (30.8%) | 5,016 (80.6%) |
Disability Status by Sex by Age in Roseland borough
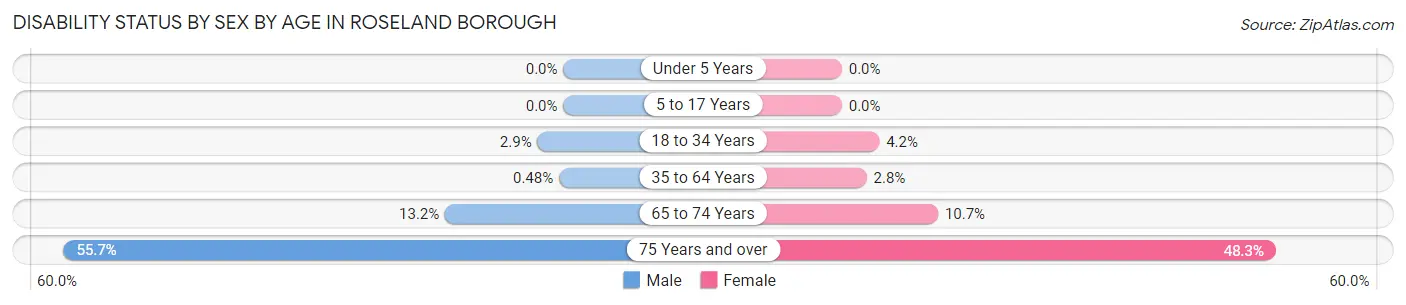
| Age Bracket | Male | Female |
| Under 5 Years | 0 (0.0%) | 0 (0.0%) |
| 5 to 17 Years | 0 (0.0%) | 0 (0.0%) |
| 18 to 34 Years | 15 (2.9%) | 23 (4.2%) |
| 35 to 64 Years | 5 (0.5%) | 34 (2.8%) |
| 65 to 74 Years | 32 (13.2%) | 36 (10.7%) |
| 75 Years and over | 221 (55.7%) | 303 (48.3%) |
Disability Class by Sex by Age in Roseland borough
Disability Class: Hearing Difficulty
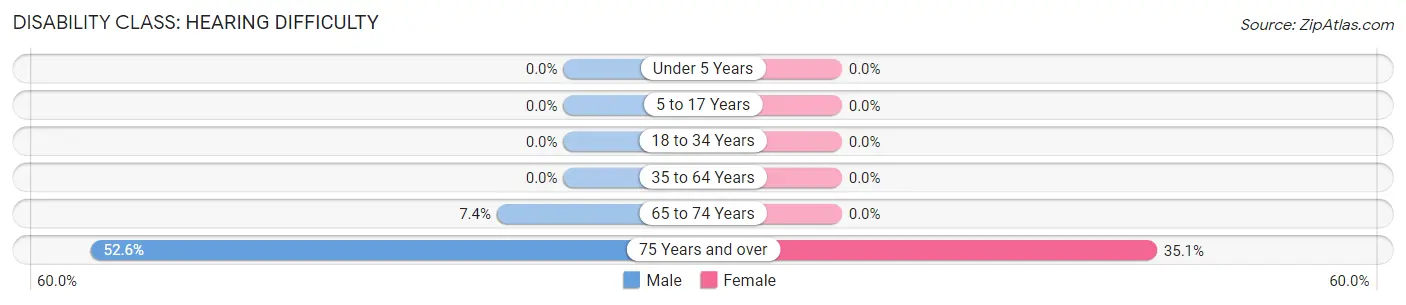
| Age Bracket | Male | Female |
| Under 5 Years | 0 (0.0%) | 0 (0.0%) |
| 5 to 17 Years | 0 (0.0%) | 0 (0.0%) |
| 18 to 34 Years | 0 (0.0%) | 0 (0.0%) |
| 35 to 64 Years | 0 (0.0%) | 0 (0.0%) |
| 65 to 74 Years | 18 (7.4%) | 0 (0.0%) |
| 75 Years and over | 209 (52.6%) | 220 (35.1%) |
Disability Class: Vision Difficulty
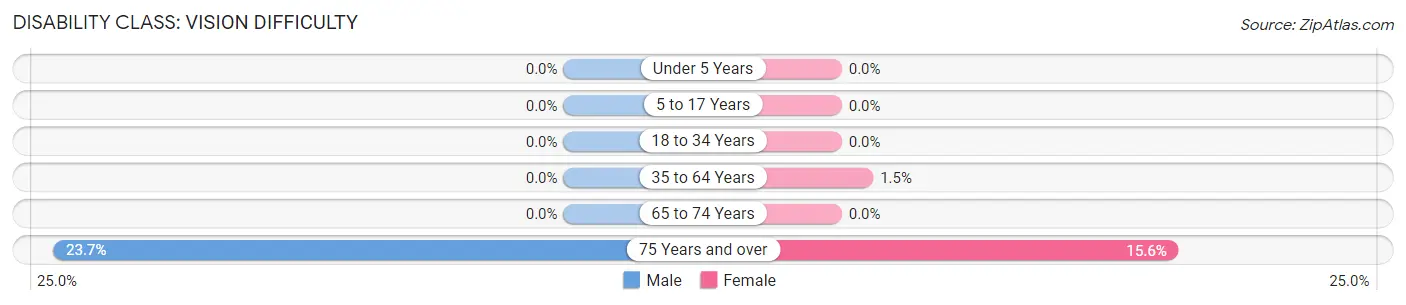
| Age Bracket | Male | Female |
| Under 5 Years | 0 (0.0%) | 0 (0.0%) |
| 5 to 17 Years | 0 (0.0%) | 0 (0.0%) |
| 18 to 34 Years | 0 (0.0%) | 0 (0.0%) |
| 35 to 64 Years | 0 (0.0%) | 18 (1.5%) |
| 65 to 74 Years | 0 (0.0%) | 0 (0.0%) |
| 75 Years and over | 94 (23.7%) | 98 (15.6%) |
Disability Class: Cognitive Difficulty
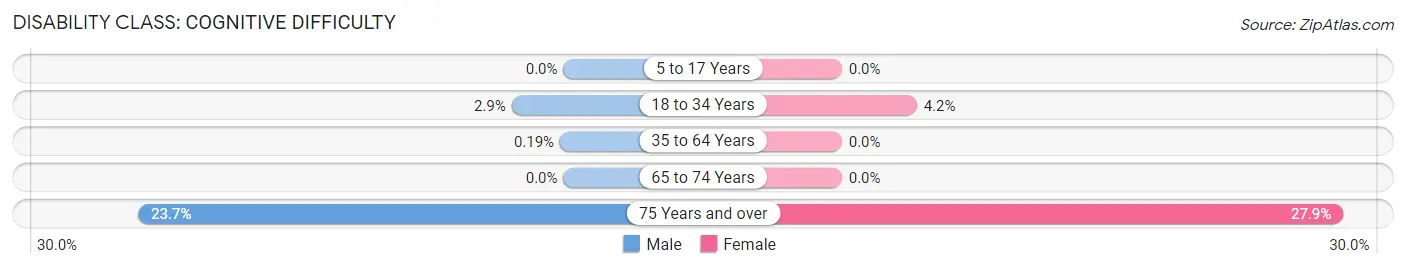
| Age Bracket | Male | Female |
| 5 to 17 Years | 0 (0.0%) | 0 (0.0%) |
| 18 to 34 Years | 15 (2.9%) | 23 (4.2%) |
| 35 to 64 Years | 2 (0.2%) | 0 (0.0%) |
| 65 to 74 Years | 0 (0.0%) | 0 (0.0%) |
| 75 Years and over | 94 (23.7%) | 175 (27.9%) |
Disability Class: Ambulatory Difficulty
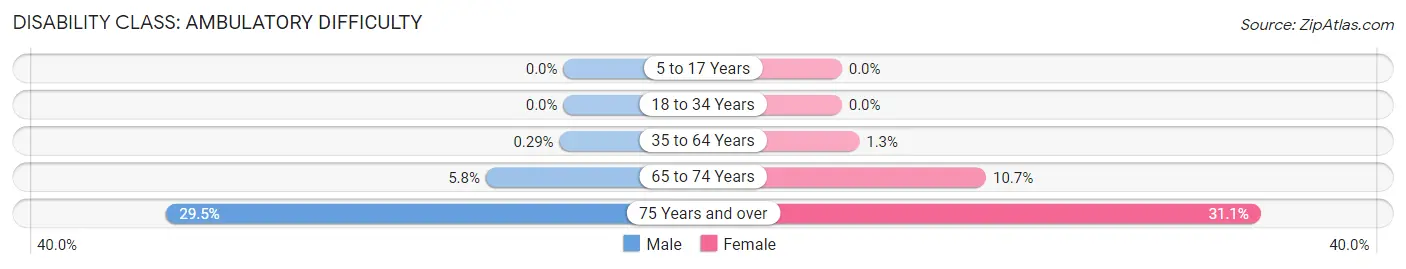
| Age Bracket | Male | Female |
| 5 to 17 Years | 0 (0.0%) | 0 (0.0%) |
| 18 to 34 Years | 0 (0.0%) | 0 (0.0%) |
| 35 to 64 Years | 3 (0.3%) | 16 (1.3%) |
| 65 to 74 Years | 14 (5.8%) | 36 (10.7%) |
| 75 Years and over | 117 (29.5%) | 195 (31.1%) |
Disability Class: Self-Care Difficulty
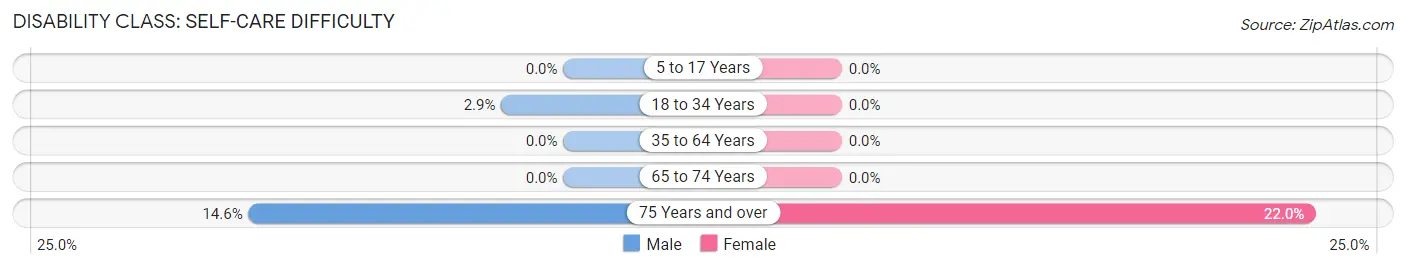
| Age Bracket | Male | Female |
| 5 to 17 Years | 0 (0.0%) | 0 (0.0%) |
| 18 to 34 Years | 15 (2.9%) | 0 (0.0%) |
| 35 to 64 Years | 0 (0.0%) | 0 (0.0%) |
| 65 to 74 Years | 0 (0.0%) | 0 (0.0%) |
| 75 Years and over | 58 (14.6%) | 138 (22.0%) |
Technology Access in Roseland borough
Computing Device Access in Roseland borough
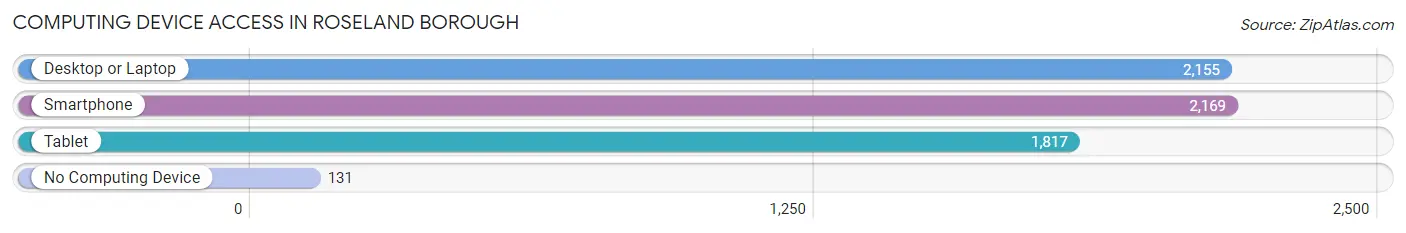
| Device Type | # Households | % Households |
| Desktop or Laptop | 2,155 | 87.9% |
| Smartphone | 2,169 | 88.5% |
| Tablet | 1,817 | 74.1% |
| No Computing Device | 131 | 5.3% |
| Total | 2,451 | 100.0% |
Internet Access in Roseland borough
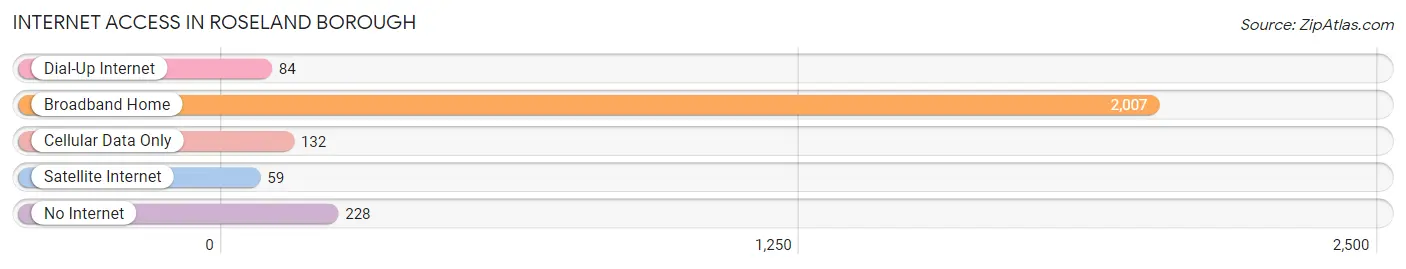
| Internet Type | # Households | % Households |
| Dial-Up Internet | 84 | 3.4% |
| Broadband Home | 2,007 | 81.9% |
| Cellular Data Only | 132 | 5.4% |
| Satellite Internet | 59 | 2.4% |
| No Internet | 228 | 9.3% |
| Total | 2,451 | 100.0% |
Roseland borough Summary
Roseland Borough is a small borough located in Essex County, New Jersey. It is situated in the northeastern part of the state, just west of Newark and east of the Passaic River. The borough is bordered by the towns of Livingston, West Orange, and East Orange. Roseland Borough has a population of approximately 5,000 people and covers an area of 1.2 square miles.
History
Roseland Borough was originally part of the Township of Livingston, which was established in 1699. In 1871, the Township of Livingston was divided into two parts, with the western portion becoming the Township of Roseland. The name Roseland was chosen to honor the Rose family, who were prominent landowners in the area. In 1895, the Borough of Roseland was incorporated from the Township of Roseland.
The borough was originally a rural farming community, but it began to develop rapidly in the early 20th century. The construction of the Morris and Essex Railroad in 1837 brought new industry and development to the area. The railroad connected Roseland to Newark and New York City, making it an attractive place to live and work.
In the 1950s, Roseland Borough experienced a period of rapid growth and development. The construction of the Garden State Parkway in 1955 made the borough more accessible to commuters, and the population began to increase. By the 1970s, Roseland had become a densely populated suburban community.
Geography
Roseland Borough is located in the northeastern part of Essex County, New Jersey. It is situated just west of Newark and east of the Passaic River. The borough is bordered by the towns of Livingston, West Orange, and East Orange. Roseland Borough has a total area of 1.2 square miles, all of which is land.
The borough is located in the Piedmont region of New Jersey, which is characterized by rolling hills and valleys. The borough is located in the Watchung Mountains, which are part of the Appalachian Mountains. The highest point in the borough is located at the intersection of Roseland Avenue and Eagle Rock Avenue, which is approximately 500 feet above sea level.
Economy
Roseland Borough has a diverse economy that is largely based on the service industry. The borough is home to a variety of businesses, including retail stores, restaurants, and professional services. The borough is also home to several corporate headquarters, including the headquarters of the Prudential Financial Corporation.
The borough is also home to several industrial parks, which are home to a variety of manufacturing and distribution companies. The largest employer in the borough is the Prudential Financial Corporation, which employs over 1,000 people.
Demographics
As of the 2010 census, Roseland Borough had a population of 5,000 people. The racial makeup of the borough was 79.2% White, 11.2% African American, 0.3% Native American, 4.2% Asian, and 4.9% from other races. Hispanic or Latino of any race were 8.7% of the population.
The median household income in Roseland Borough was $76,250, and the median family income was $87,500. The per capita income in the borough was $35,000. Approximately 8.2% of the population was below the poverty line.
Conclusion
Roseland Borough is a small borough located in Essex County, New Jersey. It is situated in the northeastern part of the state, just west of Newark and east of the Passaic River. The borough has a population of approximately 5,000 people and covers an area of 1.2 square miles. Roseland Borough has a diverse economy that is largely based on the service industry, and the largest employer in the borough is the Prudential Financial Corporation. The racial makeup of the borough is 79.2% White, 11.2% African American, 0.3% Native American, 4.2% Asian, and 4.9% from other races. The median household income in Roseland Borough was $76,250, and the median family income was $87,500.
Common Questions
What is Per Capita Income in Roseland borough?
Per Capita income in Roseland borough is $68,547.
What is the Median Family Income in Roseland borough?
Median Family Income in Roseland borough is $152,000.
What is the Median Household income in Roseland borough?
Median Household Income in Roseland borough is $135,451.
What is Income or Wage Gap in Roseland borough?
Income or Wage Gap in Roseland borough is 9.4%.
Women in Roseland borough earn 90.6 cents for every dollar earned by a man.
What is Inequality or Gini Index in Roseland borough?
Inequality or Gini Index in Roseland borough is 0.44.
What is the Total Population of Roseland borough?
Total Population of Roseland borough is 6,221.
What is the Total Male Population of Roseland borough?
Total Male Population of Roseland borough is 2,963.
What is the Total Female Population of Roseland borough?
Total Female Population of Roseland borough is 3,258.
What is the Ratio of Males per 100 Females in Roseland borough?
There are 90.95 Males per 100 Females in Roseland borough.
What is the Ratio of Females per 100 Males in Roseland borough?
There are 109.96 Females per 100 Males in Roseland borough.
What is the Median Population Age in Roseland borough?
Median Population Age in Roseland borough is 46.1 Years.
What is the Average Family Size in Roseland borough
Average Family Size in Roseland borough is 2.9 People.
What is the Average Household Size in Roseland borough
Average Household Size in Roseland borough is 2.5 People.
How Large is the Labor Force in Roseland borough?
There are 3,310 People in the Labor Forcein in Roseland borough.
What is the Percentage of People in the Labor Force in Roseland borough?
66.7% of People are in the Labor Force in Roseland borough.
What is the Unemployment Rate in Roseland borough?
Unemployment Rate in Roseland borough is 5.4%.