Zip Codes with the Highest Percentage of Population Employed in Architecture & Engineering in Plainfield, NJ
RELATED REPORTS & OPTIONS
Architecture & Engineering
Plainfield
Compare Zip Codes
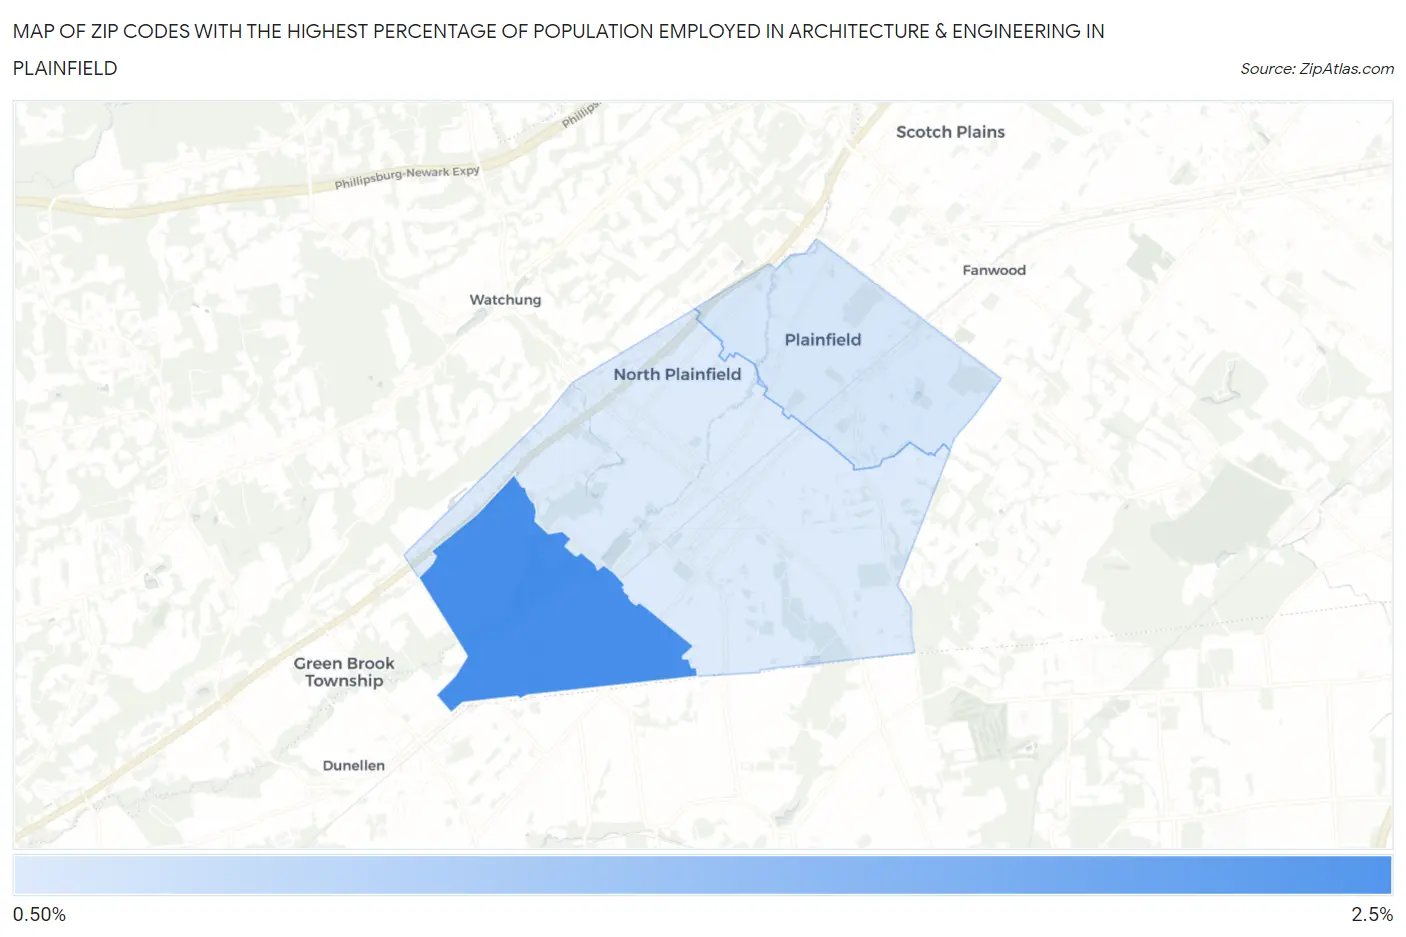
Map of Zip Codes with the Highest Percentage of Population Employed in Architecture & Engineering in Plainfield
0.70%
2.4%
Zip Codes with the Highest Percentage of Population Employed in Architecture & Engineering in Plainfield, NJ
| Zip Code | % Employed | vs State | vs National | |
| 1. | 07063 | 2.4% | 1.9%(+0.547)#152 | 2.1%(+0.290)#7,277 |
| 2. | 07062 | 0.77% | 1.9%(-1.12)#457 | 2.1%(-1.38)#18,376 |
| 3. | 07060 | 0.70% | 1.9%(-1.19)#470 | 2.1%(-1.45)#18,887 |
1
Common Questions
What are the Top Zip Codes with the Highest Percentage of Population Employed in Architecture & Engineering in Plainfield, NJ?
Top Zip Codes with the Highest Percentage of Population Employed in Architecture & Engineering in Plainfield, NJ are:
What zip code has the Highest Percentage of Population Employed in Architecture & Engineering in Plainfield, NJ?
07063 has the Highest Percentage of Population Employed in Architecture & Engineering in Plainfield, NJ with 2.4%.
What is the Percentage of Population Employed in Architecture & Engineering in Plainfield, NJ?
Percentage of Population Employed in Architecture & Engineering in Plainfield is 1.0%.
What is the Percentage of Population Employed in Architecture & Engineering in New Jersey?
Percentage of Population Employed in Architecture & Engineering in New Jersey is 1.9%.
What is the Percentage of Population Employed in Architecture & Engineering in the United States?
Percentage of Population Employed in Architecture & Engineering in the United States is 2.1%.