Bay Head borough, NJ Map & Demographics
Bay Head borough Overview
$97,113
PER CAPITA INCOME
$205,938
AVG FAMILY INCOME
$127,500
AVG HOUSEHOLD INCOME
7.1%
WAGE / INCOME GAP [ % ]
92.9¢/ $1
WAGE / INCOME GAP [ $ ]
0.54
INEQUALITY / GINI INDEX
1,096
TOTAL POPULATION
530
MALE POPULATION
566
FEMALE POPULATION
93.64
MALES / 100 FEMALES
106.79
FEMALES / 100 MALES
57.5
MEDIAN AGE
3.0
AVG FAMILY SIZE
2.3
AVG HOUSEHOLD SIZE
590
LABOR FORCE [ PEOPLE ]
60.4%
PERCENT IN LABOR FORCE
2.7%
UNEMPLOYMENT RATE
Income in Bay Head borough
Income Overview in Bay Head borough
Per Capita Income in Bay Head borough is $97,113, while median incomes of families and households are $205,938 and $127,500 respectively.
| Characteristic | Number | Measure |
| Per Capita Income | 1,096 | $97,113 |
| Median Family Income | 308 | $205,938 |
| Mean Family Income | 308 | $288,018 |
| Median Household Income | 480 | $127,500 |
| Mean Household Income | 480 | $215,397 |
| Income Deficit | 308 | $0 |
| Wage / Income Gap (%) | 1,096 | 7.11% |
| Wage / Income Gap ($) | 1,096 | 92.89¢ per $1 |
| Gini / Inequality Index | 1,096 | 0.54 |
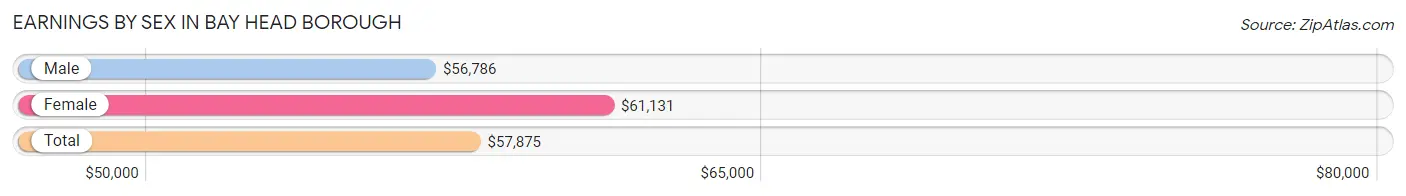
Earnings by Sex in Bay Head borough
Average Earnings in Bay Head borough are $57,875, $56,786 for men and $61,131 for women, a difference of 7.1%.
| Sex | Number | Average Earnings |
| Male | 324 (53.7%) | $56,786 |
| Female | 279 (46.3%) | $61,131 |
| Total | 603 (100.0%) | $57,875 |
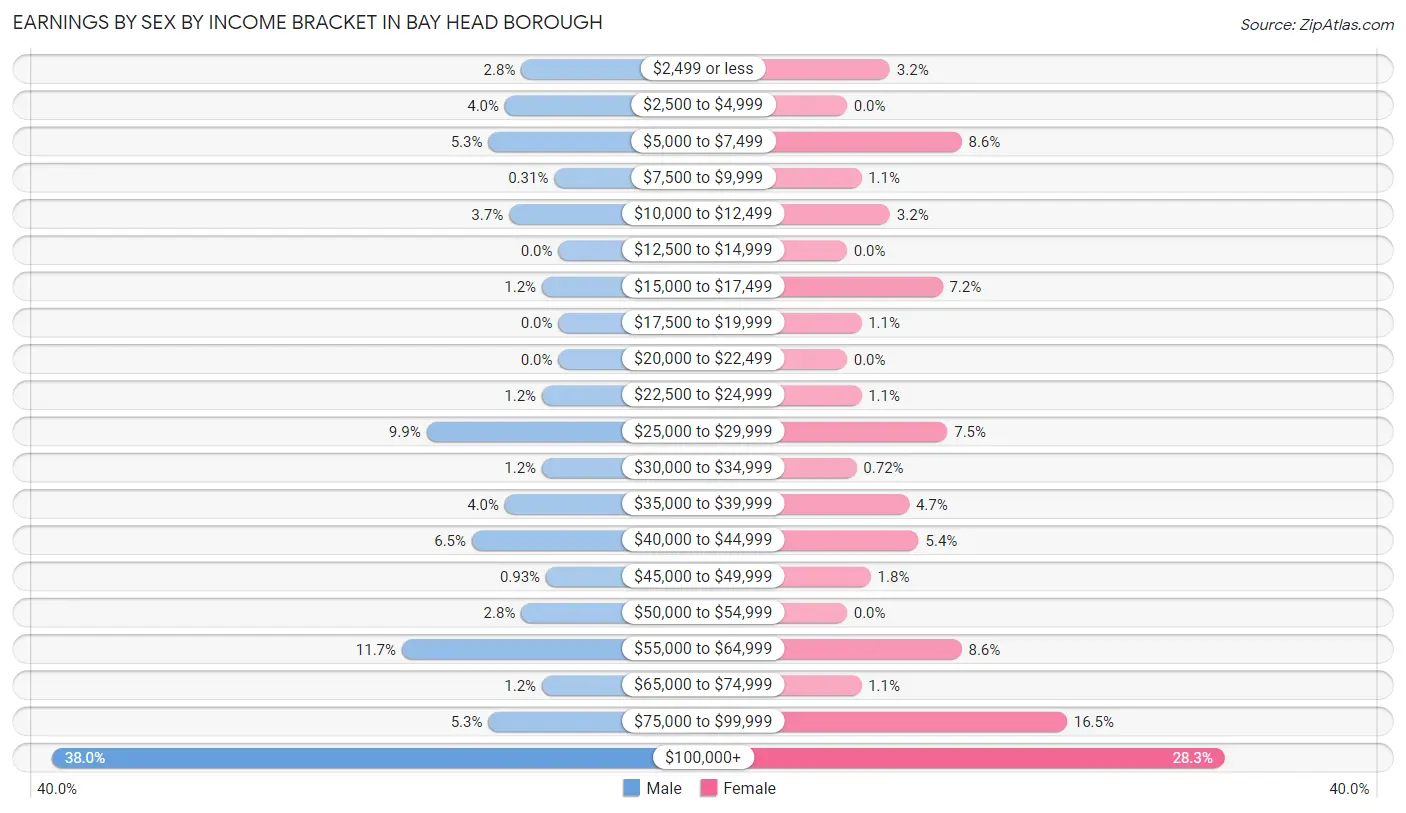
Earnings by Sex by Income Bracket in Bay Head borough
The most common earnings brackets in Bay Head borough are $100,000+ for men (123 | 38.0%) and $100,000+ for women (79 | 28.3%).
| Income | Male | Female |
| $2,499 or less | 9 (2.8%) | 9 (3.2%) |
| $2,500 to $4,999 | 13 (4.0%) | 0 (0.0%) |
| $5,000 to $7,499 | 17 (5.2%) | 24 (8.6%) |
| $7,500 to $9,999 | 1 (0.3%) | 3 (1.1%) |
| $10,000 to $12,499 | 12 (3.7%) | 9 (3.2%) |
| $12,500 to $14,999 | 0 (0.0%) | 0 (0.0%) |
| $15,000 to $17,499 | 4 (1.2%) | 20 (7.2%) |
| $17,500 to $19,999 | 0 (0.0%) | 3 (1.1%) |
| $20,000 to $22,499 | 0 (0.0%) | 0 (0.0%) |
| $22,500 to $24,999 | 4 (1.2%) | 3 (1.1%) |
| $25,000 to $29,999 | 32 (9.9%) | 21 (7.5%) |
| $30,000 to $34,999 | 4 (1.2%) | 2 (0.7%) |
| $35,000 to $39,999 | 13 (4.0%) | 13 (4.7%) |
| $40,000 to $44,999 | 21 (6.5%) | 15 (5.4%) |
| $45,000 to $49,999 | 3 (0.9%) | 5 (1.8%) |
| $50,000 to $54,999 | 9 (2.8%) | 0 (0.0%) |
| $55,000 to $64,999 | 38 (11.7%) | 24 (8.6%) |
| $65,000 to $74,999 | 4 (1.2%) | 3 (1.1%) |
| $75,000 to $99,999 | 17 (5.2%) | 46 (16.5%) |
| $100,000+ | 123 (38.0%) | 79 (28.3%) |
| Total | 324 (100.0%) | 279 (100.0%) |
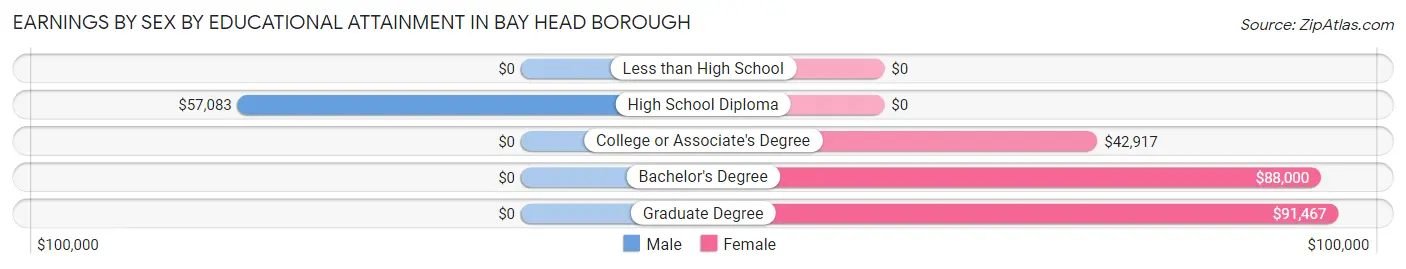
Earnings by Sex by Educational Attainment in Bay Head borough
Average earnings in Bay Head borough are $77,917 for men and $86,250 for women, a difference of 9.7%. Men with an educational attainment of high school diploma enjoy the highest average annual earnings of $57,083, while those with high school diploma education earn the least with $57,083. Women with an educational attainment of graduate degree earn the most with the average annual earnings of $91,467, while those with college or associate's degree education have the smallest earnings of $42,917.
| Educational Attainment | Male Income | Female Income |
| Less than High School | - | - |
| High School Diploma | $57,083 | $0 |
| College or Associate's Degree | - | - |
| Bachelor's Degree | - | - |
| Graduate Degree | - | - |
| Total | $77,917 | $86,250 |
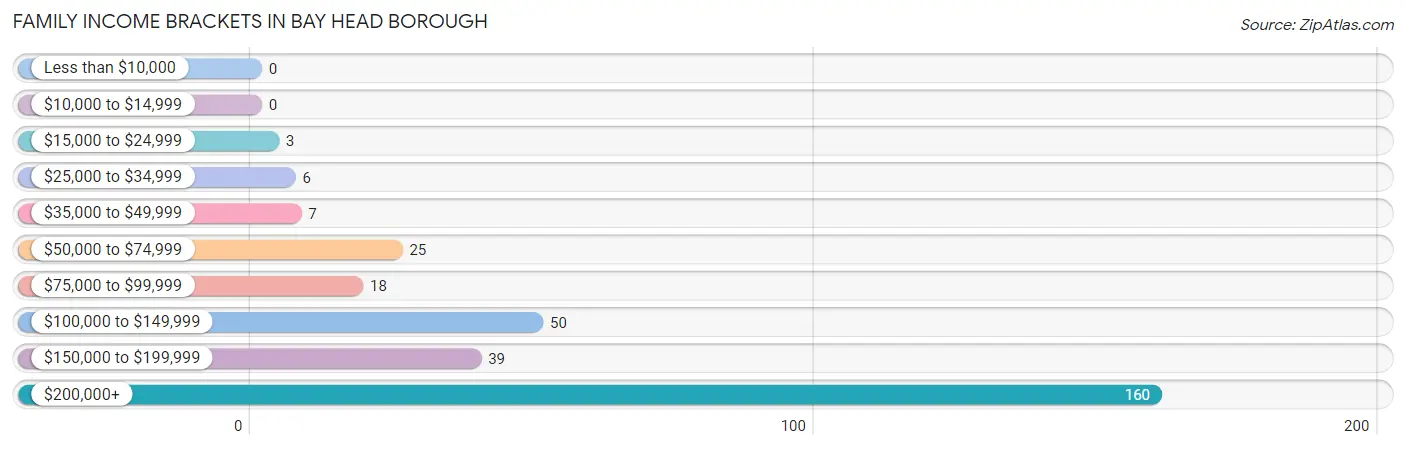
Family Income in Bay Head borough
Family Income Brackets in Bay Head borough
According to the Bay Head borough family income data, there are 160 families falling into the $200,000+ income range, which is the most common income bracket and makes up 51.9% of all families.
| Income Bracket | # Families | % Families |
| Less than $10,000 | 0 | 0.0% |
| $10,000 to $14,999 | 0 | 0.0% |
| $15,000 to $24,999 | 3 | 1.0% |
| $25,000 to $34,999 | 6 | 1.9% |
| $35,000 to $49,999 | 7 | 2.3% |
| $50,000 to $74,999 | 25 | 8.1% |
| $75,000 to $99,999 | 18 | 5.8% |
| $100,000 to $149,999 | 50 | 16.2% |
| $150,000 to $199,999 | 39 | 12.7% |
| $200,000+ | 160 | 51.9% |
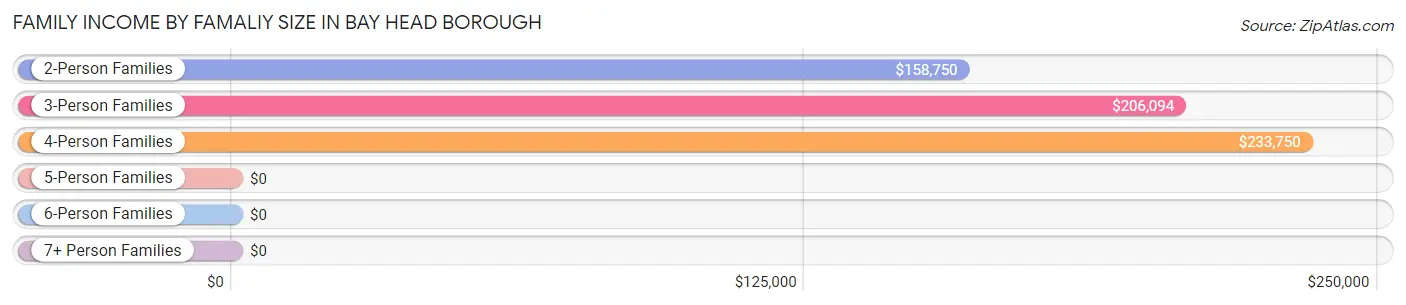
Family Income by Famaliy Size in Bay Head borough
4-person families (30 | 9.7%) account for the highest median family income in Bay Head borough with $233,750 per family, while 2-person families (183 | 59.4%) have the highest median income of $79,375 per family member.
| Income Bracket | # Families | Median Income |
| 2-Person Families | 183 (59.4%) | $158,750 |
| 3-Person Families | 64 (20.8%) | $206,094 |
| 4-Person Families | 30 (9.7%) | $233,750 |
| 5-Person Families | 13 (4.2%) | $0 |
| 6-Person Families | 7 (2.3%) | $0 |
| 7+ Person Families | 11 (3.6%) | $0 |
| Total | 308 (100.0%) | $205,938 |
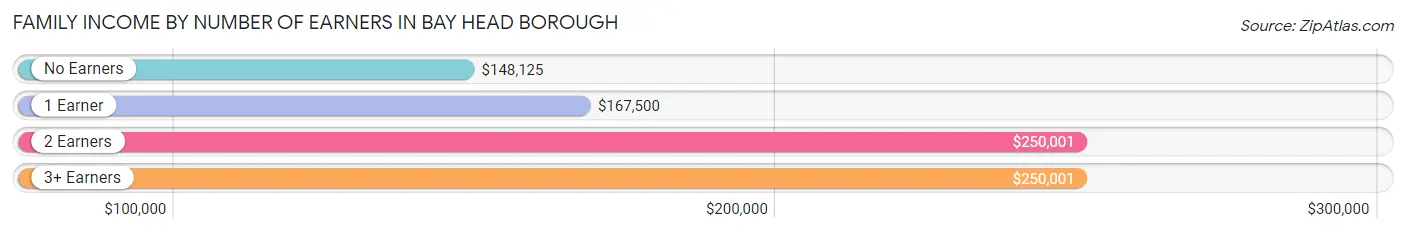
Family Income by Number of Earners in Bay Head borough
The median family income in Bay Head borough is $205,938, with families comprising 2 earners (110) having the highest median family income of $250,001, while families with no earners (76) have the lowest median family income of $148,125, accounting for 35.7% and 24.7% of families, respectively.
| Number of Earners | # Families | Median Income |
| No Earners | 76 (24.7%) | $148,125 |
| 1 Earner | 62 (20.1%) | $167,500 |
| 2 Earners | 110 (35.7%) | $250,001 |
| 3+ Earners | 60 (19.5%) | $250,001 |
| Total | 308 (100.0%) | $205,938 |
Household Income in Bay Head borough
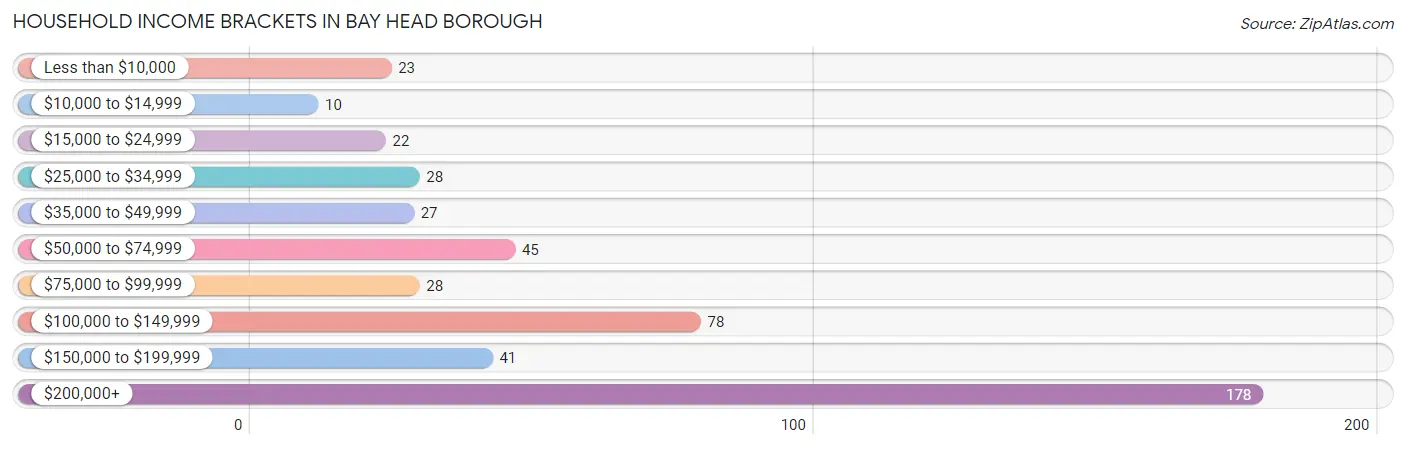
Household Income Brackets in Bay Head borough
With 178 households falling in the category, the $200,000+ income range is the most frequent in Bay Head borough, accounting for 37.1% of all households. In contrast, only 10 households (2.1%) fall into the $10,000 to $14,999 income bracket, making it the least populous group.
| Income Bracket | # Households | % Households |
| Less than $10,000 | 23 | 4.8% |
| $10,000 to $14,999 | 10 | 2.1% |
| $15,000 to $24,999 | 22 | 4.6% |
| $25,000 to $34,999 | 28 | 5.8% |
| $35,000 to $49,999 | 27 | 5.6% |
| $50,000 to $74,999 | 45 | 9.4% |
| $75,000 to $99,999 | 28 | 5.8% |
| $100,000 to $149,999 | 78 | 16.3% |
| $150,000 to $199,999 | 41 | 8.5% |
| $200,000+ | 178 | 37.1% |
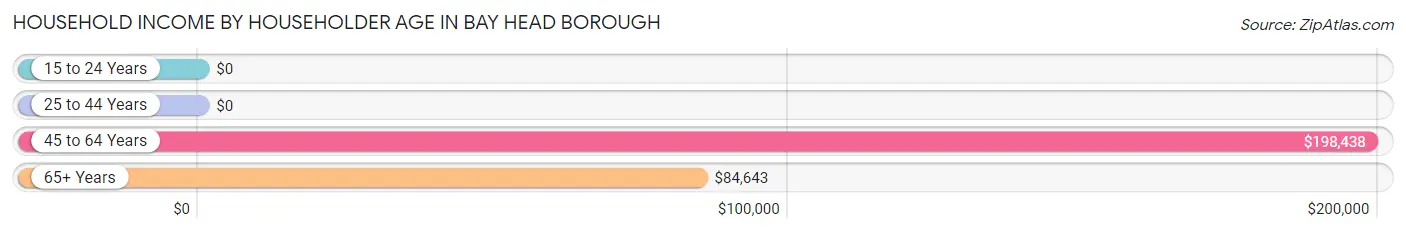
Household Income by Householder Age in Bay Head borough
The median household income in Bay Head borough is $127,500, with the highest median household income of $198,438 found in the 45 to 64 years age bracket for the primary householder. A total of 235 households (49.0%) fall into this category. Meanwhile, the 15 to 24 years age bracket for the primary householder has the lowest median household income of $0, with 16 households (3.3%) in this group.
| Income Bracket | # Households | Median Income |
| 15 to 24 Years | 16 (3.3%) | $0 |
| 25 to 44 Years | 27 (5.6%) | $0 |
| 45 to 64 Years | 235 (49.0%) | $198,438 |
| 65+ Years | 202 (42.1%) | $84,643 |
| Total | 480 (100.0%) | $127,500 |
Poverty in Bay Head borough
Income Below Poverty by Sex and Age in Bay Head borough
With 2.3% poverty level for males and 4.8% for females among the residents of Bay Head borough, 25 to 34 year old males and 65 to 74 year old females are the most vulnerable to poverty, with 5 males (8.3%) and 9 females (10.2%) in their respective age groups living below the poverty level.
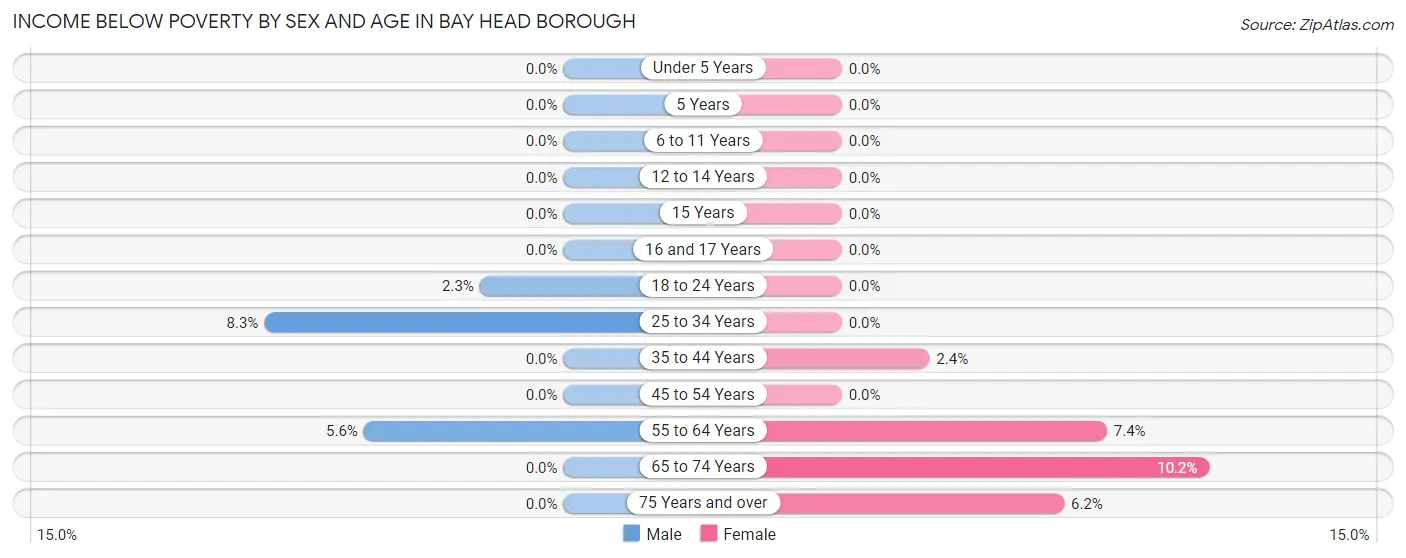
| Age Bracket | Male | Female |
| Under 5 Years | 0 (0.0%) | 0 (0.0%) |
| 5 Years | 0 (0.0%) | 0 (0.0%) |
| 6 to 11 Years | 0 (0.0%) | 0 (0.0%) |
| 12 to 14 Years | 0 (0.0%) | 0 (0.0%) |
| 15 Years | 0 (0.0%) | 0 (0.0%) |
| 16 and 17 Years | 0 (0.0%) | 0 (0.0%) |
| 18 to 24 Years | 1 (2.3%) | 0 (0.0%) |
| 25 to 34 Years | 5 (8.3%) | 0 (0.0%) |
| 35 to 44 Years | 0 (0.0%) | 1 (2.4%) |
| 45 to 54 Years | 0 (0.0%) | 0 (0.0%) |
| 55 to 64 Years | 6 (5.6%) | 11 (7.4%) |
| 65 to 74 Years | 0 (0.0%) | 9 (10.2%) |
| 75 Years and over | 0 (0.0%) | 6 (6.2%) |
| Total | 12 (2.3%) | 27 (4.8%) |
Income Above Poverty by Sex and Age in Bay Head borough
According to the poverty statistics in Bay Head borough, males aged under 5 years and females aged under 5 years are the age groups that are most secure financially, with 100.0% of males and 100.0% of females in these age groups living above the poverty line.
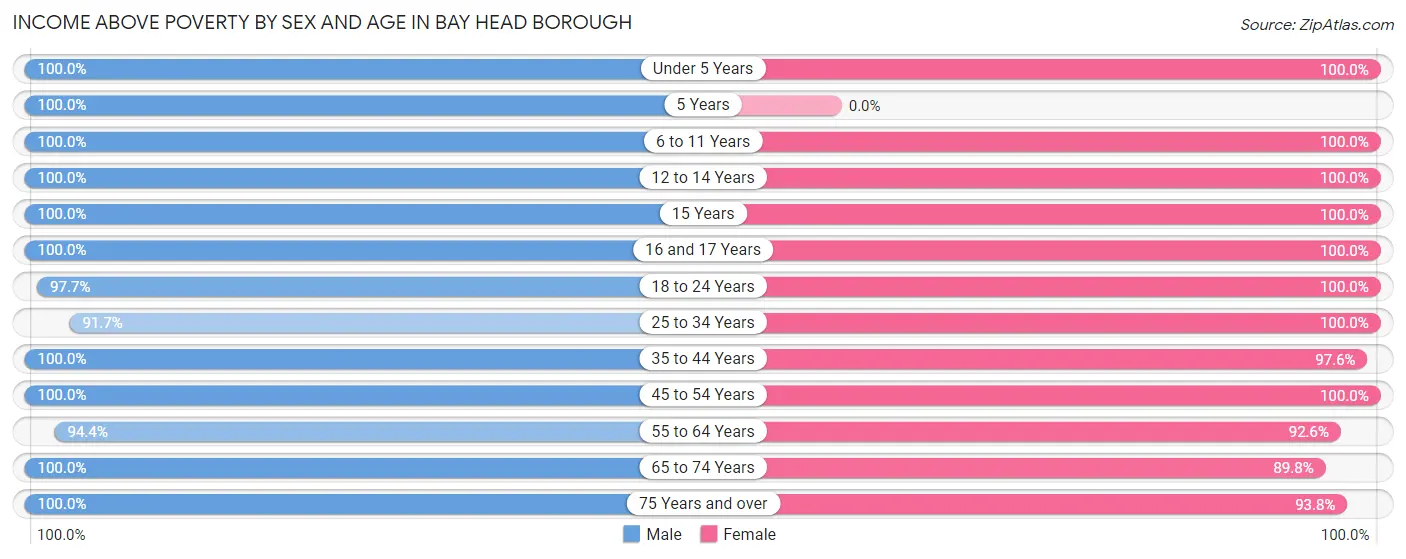
| Age Bracket | Male | Female |
| Under 5 Years | 3 (100.0%) | 2 (100.0%) |
| 5 Years | 3 (100.0%) | 0 (0.0%) |
| 6 to 11 Years | 24 (100.0%) | 25 (100.0%) |
| 12 to 14 Years | 35 (100.0%) | 21 (100.0%) |
| 15 Years | 2 (100.0%) | 4 (100.0%) |
| 16 and 17 Years | 10 (100.0%) | 9 (100.0%) |
| 18 to 24 Years | 42 (97.7%) | 38 (100.0%) |
| 25 to 34 Years | 55 (91.7%) | 18 (100.0%) |
| 35 to 44 Years | 26 (100.0%) | 40 (97.6%) |
| 45 to 54 Years | 58 (100.0%) | 74 (100.0%) |
| 55 to 64 Years | 102 (94.4%) | 138 (92.6%) |
| 65 to 74 Years | 87 (100.0%) | 79 (89.8%) |
| 75 Years and over | 71 (100.0%) | 91 (93.8%) |
| Total | 518 (97.7%) | 539 (95.2%) |
Income Below Poverty Among Married-Couple Families in Bay Head borough
| Children | Above Poverty | Below Poverty |
| No Children | 216 (100.0%) | 0 (0.0%) |
| 1 or 2 Children | 30 (100.0%) | 0 (0.0%) |
| 3 or 4 Children | 23 (100.0%) | 0 (0.0%) |
| 5 or more Children | 0 (0.0%) | 0 (0.0%) |
| Total | 269 (100.0%) | 0 (0.0%) |
Income Below Poverty Among Single-Parent Households in Bay Head borough
| Children | Single Father | Single Mother |
| No Children | 0 (0.0%) | 0 (0.0%) |
| 1 or 2 Children | 0 (0.0%) | 0 (0.0%) |
| 3 or 4 Children | 0 (0.0%) | 0 (0.0%) |
| 5 or more Children | 0 (0.0%) | 0 (0.0%) |
| Total | 0 (0.0%) | 0 (0.0%) |
Income Below Poverty Among Married-Couple vs Single-Parent Households in Bay Head borough
| Children | Married-Couple Families | Single-Parent Households |
| No Children | 0 (0.0%) | 0 (0.0%) |
| 1 or 2 Children | 0 (0.0%) | 0 (0.0%) |
| 3 or 4 Children | 0 (0.0%) | 0 (0.0%) |
| 5 or more Children | 0 (0.0%) | 0 (0.0%) |
| Total | 0 (0.0%) | 0 (0.0%) |
Race in Bay Head borough
The most populous races in Bay Head borough are White / Caucasian (1,025 | 93.5%), Two or more Races (41 | 3.7%), and Asian (30 | 2.7%).
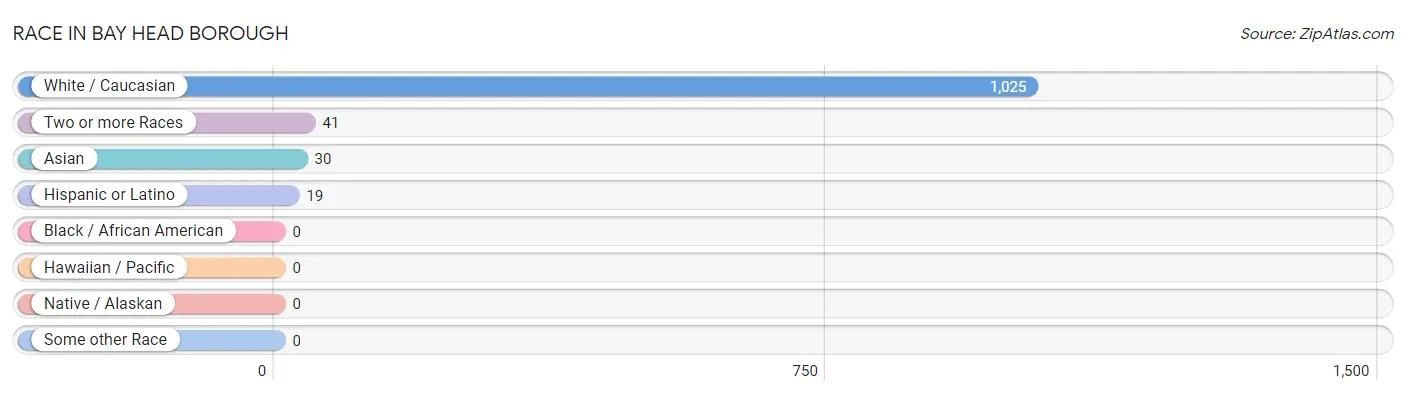
| Race | # Population | % Population |
| Asian | 30 | 2.7% |
| Black / African American | 0 | 0.0% |
| Hawaiian / Pacific | 0 | 0.0% |
| Hispanic or Latino | 19 | 1.7% |
| Native / Alaskan | 0 | 0.0% |
| White / Caucasian | 1,025 | 93.5% |
| Two or more Races | 41 | 3.7% |
| Some other Race | 0 | 0.0% |
| Total | 1,096 | 100.0% |
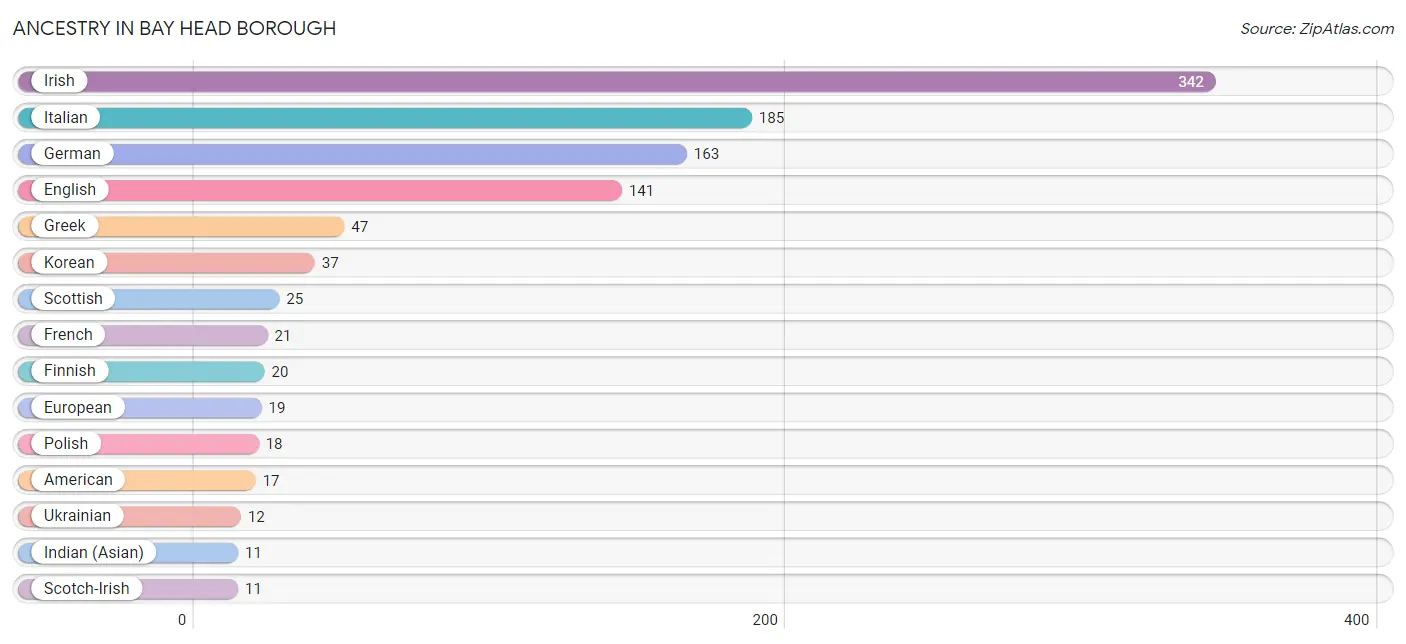
Ancestry in Bay Head borough
The most populous ancestries reported in Bay Head borough are Irish (342 | 31.2%), Italian (185 | 16.9%), German (163 | 14.9%), English (141 | 12.9%), and Greek (47 | 4.3%), together accounting for 80.1% of all Bay Head borough residents.
| Ancestry | # Population | % Population |
| American | 17 | 1.5% |
| Arab | 4 | 0.4% |
| Austrian | 10 | 0.9% |
| British | 7 | 0.6% |
| Burmese | 8 | 0.7% |
| Carpatho Rusyn | 4 | 0.4% |
| Colombian | 8 | 0.7% |
| Cuban | 2 | 0.2% |
| Czechoslovakian | 8 | 0.7% |
| Danish | 3 | 0.3% |
| Dutch | 7 | 0.6% |
| Eastern European | 8 | 0.7% |
| Egyptian | 4 | 0.4% |
| English | 141 | 12.9% |
| European | 19 | 1.7% |
| Finnish | 20 | 1.8% |
| French | 21 | 1.9% |
| German | 163 | 14.9% |
| Greek | 47 | 4.3% |
| Indian (Asian) | 11 | 1.0% |
| Irish | 342 | 31.2% |
| Italian | 185 | 16.9% |
| Korean | 37 | 3.4% |
| Mexican | 4 | 0.4% |
| Norwegian | 5 | 0.5% |
| Polish | 18 | 1.6% |
| Puerto Rican | 5 | 0.5% |
| Russian | 10 | 0.9% |
| Scandinavian | 3 | 0.3% |
| Scotch-Irish | 11 | 1.0% |
| Scottish | 25 | 2.3% |
| Slavic | 1 | 0.1% |
| South American | 8 | 0.7% |
| Swedish | 11 | 1.0% |
| Swiss | 3 | 0.3% |
| Ukrainian | 12 | 1.1% |
| Welsh | 2 | 0.2% | View All 37 Rows |
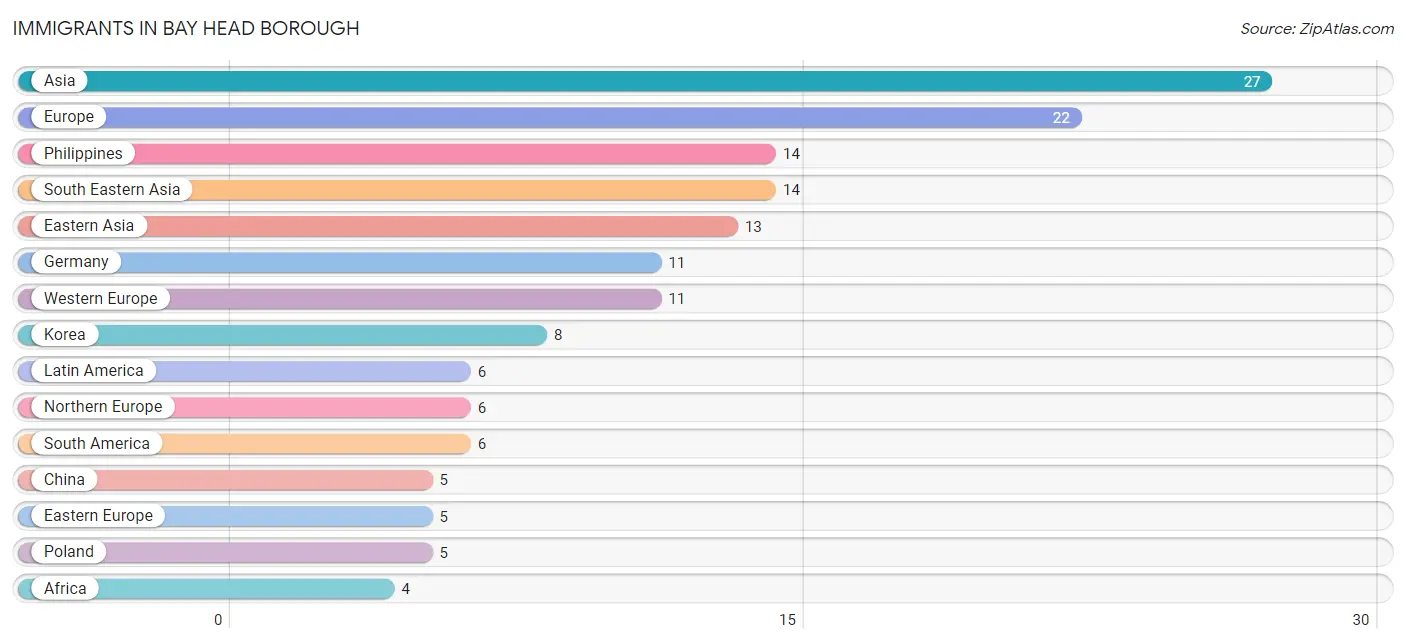
Immigrants in Bay Head borough
The most numerous immigrant groups reported in Bay Head borough came from Asia (27 | 2.5%), Europe (22 | 2.0%), Philippines (14 | 1.3%), South Eastern Asia (14 | 1.3%), and Eastern Asia (13 | 1.2%), together accounting for 8.2% of all Bay Head borough residents.
| Immigration Origin | # Population | % Population |
| Africa | 4 | 0.4% |
| Asia | 27 | 2.5% |
| Chile | 3 | 0.3% |
| China | 5 | 0.5% |
| Colombia | 3 | 0.3% |
| Eastern Asia | 13 | 1.2% |
| Eastern Europe | 5 | 0.5% |
| Egypt | 4 | 0.4% |
| Europe | 22 | 2.0% |
| Germany | 11 | 1.0% |
| Ireland | 2 | 0.2% |
| Korea | 8 | 0.7% |
| Latin America | 6 | 0.5% |
| Northern Africa | 4 | 0.4% |
| Northern Europe | 6 | 0.5% |
| Philippines | 14 | 1.3% |
| Poland | 5 | 0.5% |
| South America | 6 | 0.5% |
| South Eastern Asia | 14 | 1.3% |
| Western Europe | 11 | 1.0% | View All 20 Rows |
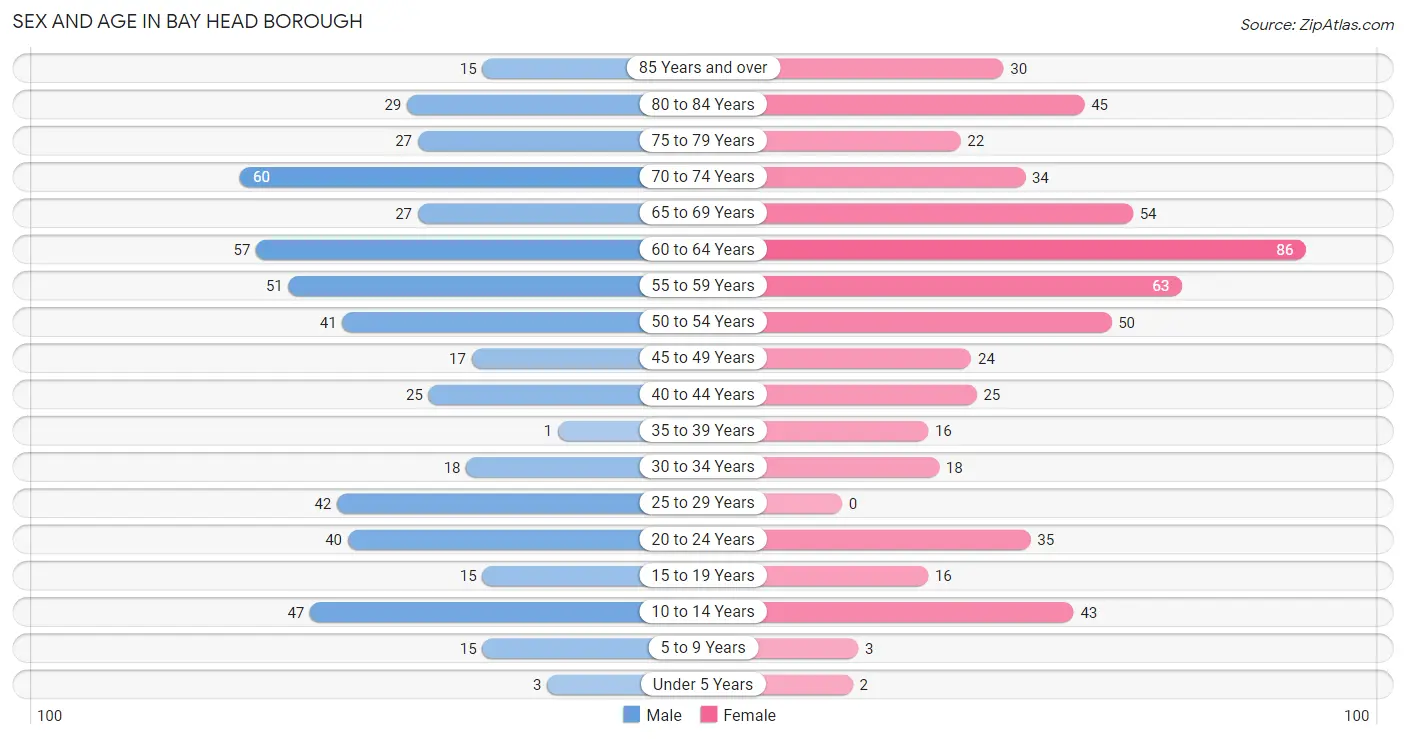
Sex and Age in Bay Head borough
Sex and Age in Bay Head borough
The most populous age groups in Bay Head borough are 70 to 74 Years (60 | 11.3%) for men and 60 to 64 Years (86 | 15.2%) for women.
| Age Bracket | Male | Female |
| Under 5 Years | 3 (0.6%) | 2 (0.4%) |
| 5 to 9 Years | 15 (2.8%) | 3 (0.5%) |
| 10 to 14 Years | 47 (8.9%) | 43 (7.6%) |
| 15 to 19 Years | 15 (2.8%) | 16 (2.8%) |
| 20 to 24 Years | 40 (7.5%) | 35 (6.2%) |
| 25 to 29 Years | 42 (7.9%) | 0 (0.0%) |
| 30 to 34 Years | 18 (3.4%) | 18 (3.2%) |
| 35 to 39 Years | 1 (0.2%) | 16 (2.8%) |
| 40 to 44 Years | 25 (4.7%) | 25 (4.4%) |
| 45 to 49 Years | 17 (3.2%) | 24 (4.2%) |
| 50 to 54 Years | 41 (7.7%) | 50 (8.8%) |
| 55 to 59 Years | 51 (9.6%) | 63 (11.1%) |
| 60 to 64 Years | 57 (10.7%) | 86 (15.2%) |
| 65 to 69 Years | 27 (5.1%) | 54 (9.5%) |
| 70 to 74 Years | 60 (11.3%) | 34 (6.0%) |
| 75 to 79 Years | 27 (5.1%) | 22 (3.9%) |
| 80 to 84 Years | 29 (5.5%) | 45 (8.0%) |
| 85 Years and over | 15 (2.8%) | 30 (5.3%) |
| Total | 530 (100.0%) | 566 (100.0%) |
Families and Households in Bay Head borough
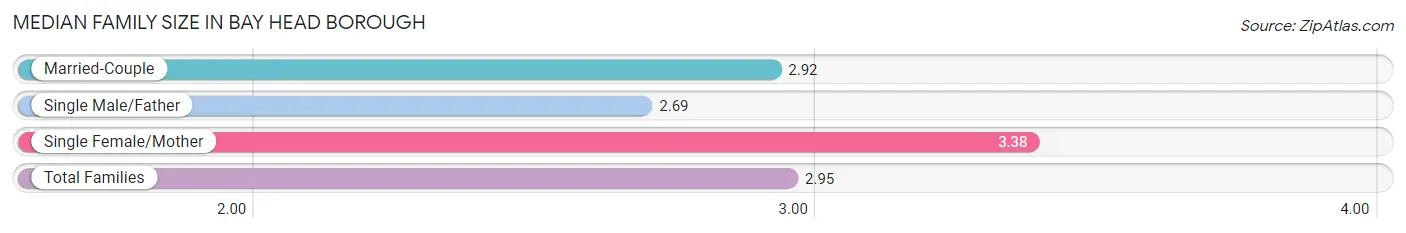
Median Family Size in Bay Head borough
The median family size in Bay Head borough is 2.95 persons per family, with single female/mother families (26 | 8.4%) accounting for the largest median family size of 3.38 persons per family. On the other hand, single male/father families (13 | 4.2%) represent the smallest median family size with 2.69 persons per family.
| Family Type | # Families | Family Size |
| Married-Couple | 269 (87.3%) | 2.92 |
| Single Male/Father | 13 (4.2%) | 2.69 |
| Single Female/Mother | 26 (8.4%) | 3.38 |
| Total Families | 308 (100.0%) | 2.95 |
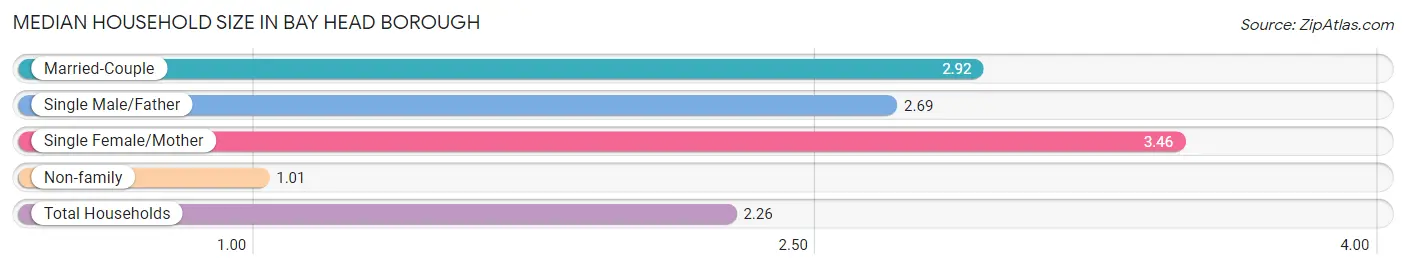
Median Household Size in Bay Head borough
The median household size in Bay Head borough is 2.26 persons per household, with single female/mother households (26 | 5.4%) accounting for the largest median household size of 3.46 persons per household. non-family households (172 | 35.8%) represent the smallest median household size with 1.01 persons per household.
| Household Type | # Households | Household Size |
| Married-Couple | 269 (56.0%) | 2.92 |
| Single Male/Father | 13 (2.7%) | 2.69 |
| Single Female/Mother | 26 (5.4%) | 3.46 |
| Non-family | 172 (35.8%) | 1.01 |
| Total Households | 480 (100.0%) | 2.26 |
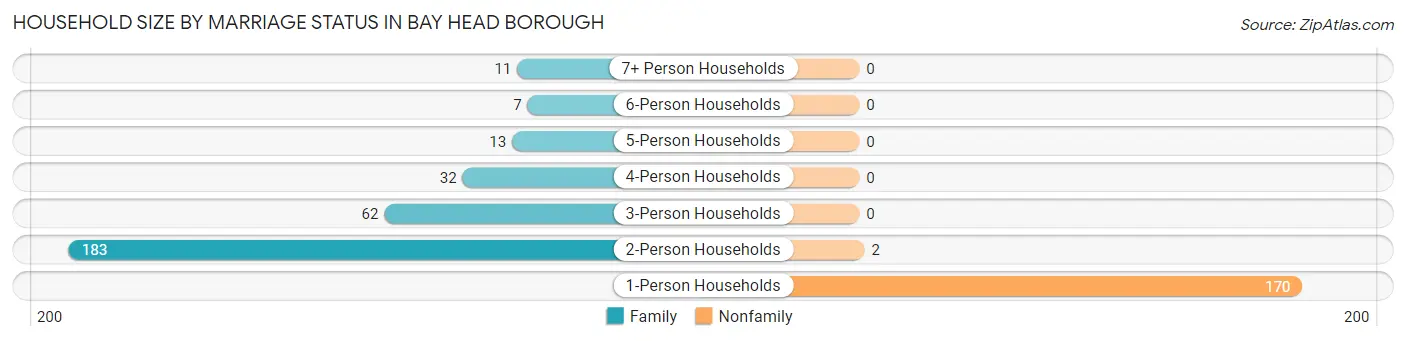
Household Size by Marriage Status in Bay Head borough
Out of a total of 480 households in Bay Head borough, 308 (64.2%) are family households, while 172 (35.8%) are nonfamily households. The most numerous type of family households are 2-person households, comprising 183, and the most common type of nonfamily households are 1-person households, comprising 170.
| Household Size | Family Households | Nonfamily Households |
| 1-Person Households | - | 170 (35.4%) |
| 2-Person Households | 183 (38.1%) | 2 (0.4%) |
| 3-Person Households | 62 (12.9%) | 0 (0.0%) |
| 4-Person Households | 32 (6.7%) | 0 (0.0%) |
| 5-Person Households | 13 (2.7%) | 0 (0.0%) |
| 6-Person Households | 7 (1.5%) | 0 (0.0%) |
| 7+ Person Households | 11 (2.3%) | 0 (0.0%) |
| Total | 308 (64.2%) | 172 (35.8%) |
Female Fertility in Bay Head borough
Fertility by Age in Bay Head borough
Average fertility rate in Bay Head borough is 7.0 births per 1,000 women. Women in the age bracket of 35 to 50 years have the highest fertility rate with 14.0 births per 1,000 women. Women in the age bracket of 35 to 50 years acount for 100.0% of all women with births.
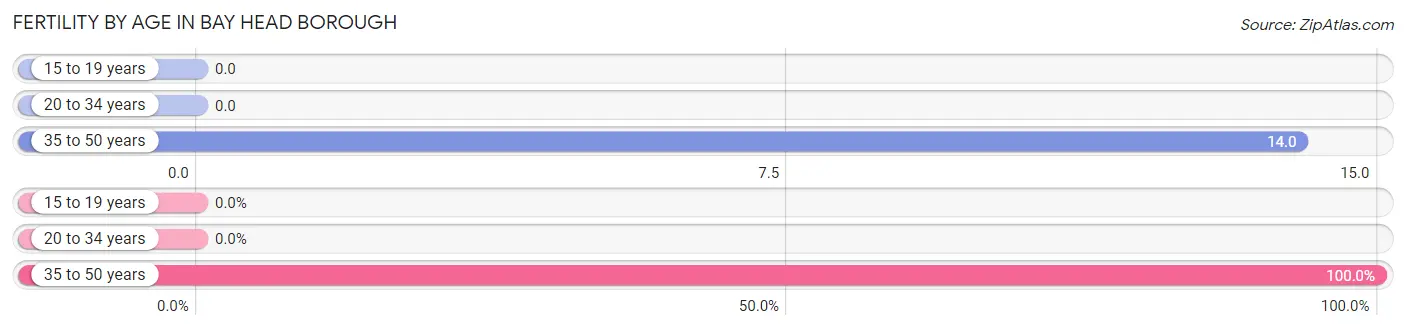
| Age Bracket | Women with Births | Births / 1,000 Women |
| 15 to 19 years | 0 (0.0%) | 0.0 |
| 20 to 34 years | 0 (0.0%) | 0.0 |
| 35 to 50 years | 1 (100.0%) | 14.0 |
| Total | 1 (100.0%) | 7.0 |
Fertility by Age by Marriage Status in Bay Head borough
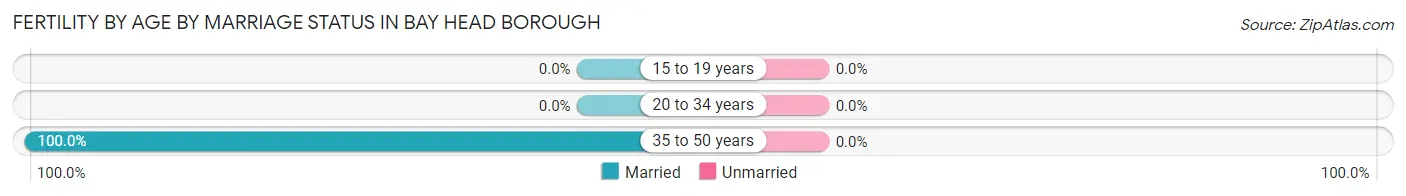
| Age Bracket | Married | Unmarried |
| 15 to 19 years | 0 (0.0%) | 0 (0.0%) |
| 20 to 34 years | 0 (0.0%) | 0 (0.0%) |
| 35 to 50 years | 1 (100.0%) | 0 (0.0%) |
| Total | 1 (100.0%) | 0 (0.0%) |
Fertility by Education in Bay Head borough
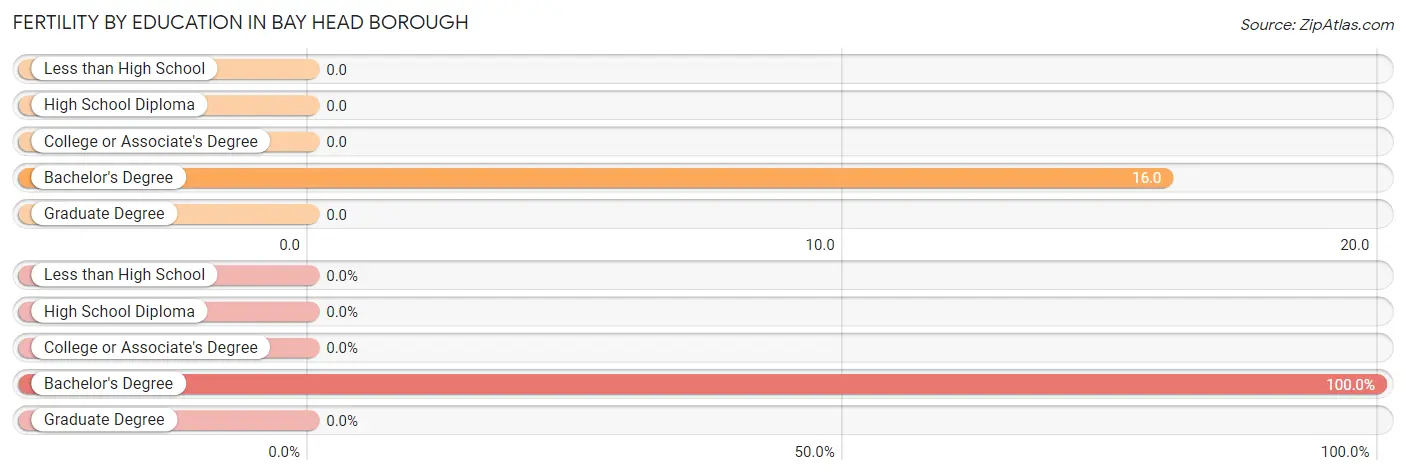
| Educational Attainment | Women with Births | Births / 1,000 Women |
| Less than High School | 0 (0.0%) | 0.0 |
| High School Diploma | 0 (0.0%) | 0.0 |
| College or Associate's Degree | 0 (0.0%) | 0.0 |
| Bachelor's Degree | 1 (100.0%) | 16.0 |
| Graduate Degree | 0 (0.0%) | 0.0 |
| Total | 1 (100.0%) | 7.0 |
Fertility by Education by Marriage Status in Bay Head borough
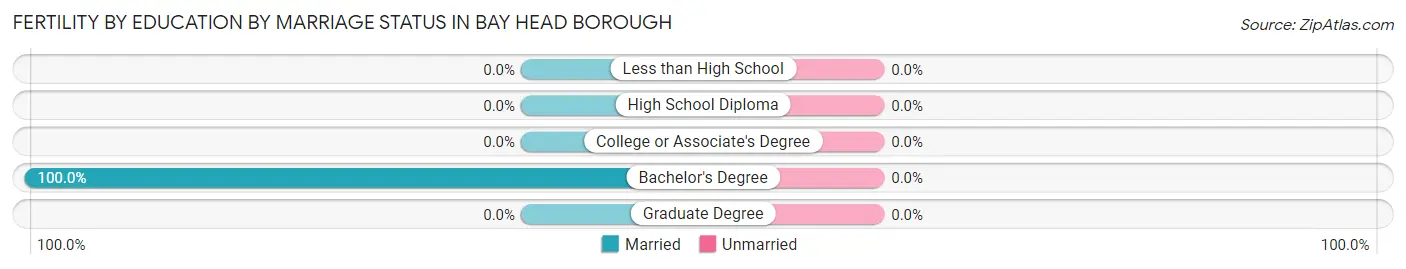
| Educational Attainment | Married | Unmarried |
| Less than High School | 0 (0.0%) | 0 (0.0%) |
| High School Diploma | 0 (0.0%) | 0 (0.0%) |
| College or Associate's Degree | 0 (0.0%) | 0 (0.0%) |
| Bachelor's Degree | 1 (100.0%) | 0 (0.0%) |
| Graduate Degree | 0 (0.0%) | 0 (0.0%) |
| Total | 1 (100.0%) | 0 (0.0%) |
Employment Characteristics in Bay Head borough
Employment by Class of Employer in Bay Head borough
Among the 567 employed individuals in Bay Head borough, private company employees (438 | 77.2%), self-employed (incorporated) (43 | 7.6%), and local government employees (30 | 5.3%) make up the most common classes of employment.
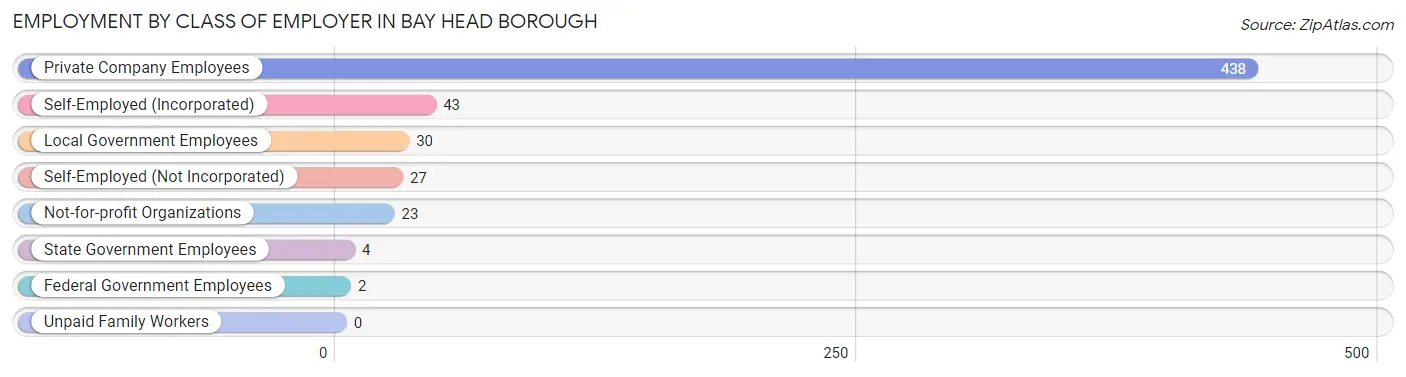
| Employer Class | # Employees | % Employees |
| Private Company Employees | 438 | 77.2% |
| Self-Employed (Incorporated) | 43 | 7.6% |
| Self-Employed (Not Incorporated) | 27 | 4.8% |
| Not-for-profit Organizations | 23 | 4.1% |
| Local Government Employees | 30 | 5.3% |
| State Government Employees | 4 | 0.7% |
| Federal Government Employees | 2 | 0.4% |
| Unpaid Family Workers | 0 | 0.0% |
| Total | 567 | 100.0% |
Employment Status by Age in Bay Head borough
According to the labor force statistics for Bay Head borough, out of the total population over 16 years of age (977), 60.4% or 590 individuals are in the labor force, with 2.7% or 16 of them unemployed. The age group with the highest labor force participation rate is 20 to 24 years, with 98.7% or 74 individuals in the labor force. Within the labor force, the 30 to 34 years age range has the highest percentage of unemployed individuals, with 13.8% or 4 of them being unemployed.
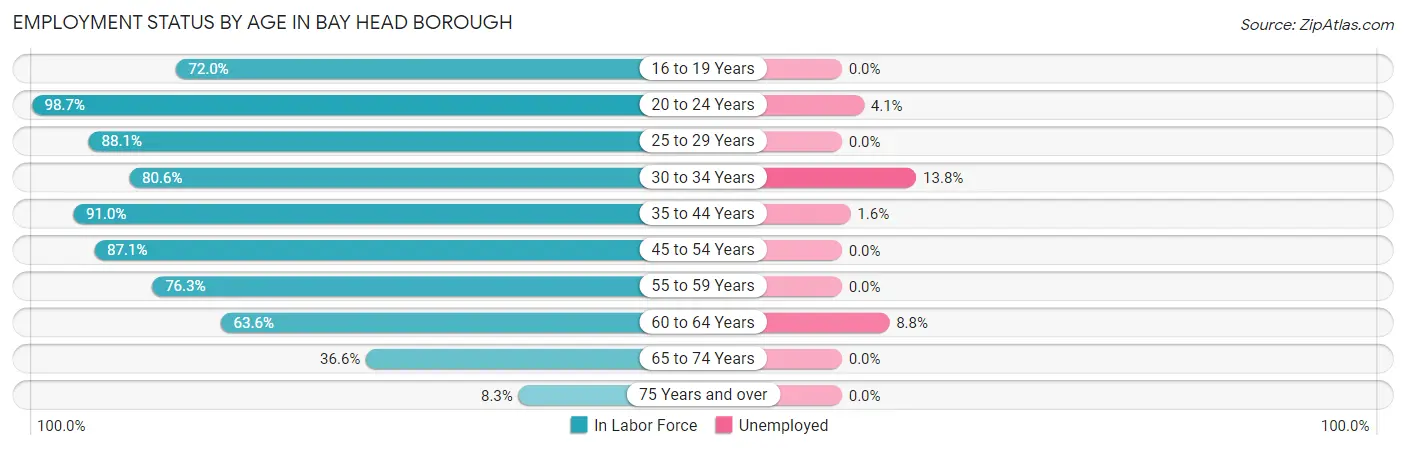
| Age Bracket | In Labor Force | Unemployed |
| 16 to 19 Years | 18 (72.0%) | 0 (0.0%) |
| 20 to 24 Years | 74 (98.7%) | 3 (4.1%) |
| 25 to 29 Years | 37 (88.1%) | 0 (0.0%) |
| 30 to 34 Years | 29 (80.6%) | 4 (13.8%) |
| 35 to 44 Years | 61 (91.0%) | 1 (1.6%) |
| 45 to 54 Years | 115 (87.1%) | 0 (0.0%) |
| 55 to 59 Years | 87 (76.3%) | 0 (0.0%) |
| 60 to 64 Years | 91 (63.6%) | 8 (8.8%) |
| 65 to 74 Years | 64 (36.6%) | 0 (0.0%) |
| 75 Years and over | 14 (8.3%) | 0 (0.0%) |
| Total | 590 (60.4%) | 16 (2.7%) |
Employment Status by Educational Attainment in Bay Head borough
According to labor force statistics for Bay Head borough, 78.7% of individuals (420) out of the total population between 25 and 64 years of age (534) are in the labor force, with 3.1% or 13 of them being unemployed. The group with the highest labor force participation rate are those with the educational attainment of college / associate degree, with 86.9% or 73 individuals in the labor force. Within the labor force, individuals with college / associate degree education have the highest percentage of unemployment, with 5.5% or 4 of them being unemployed.
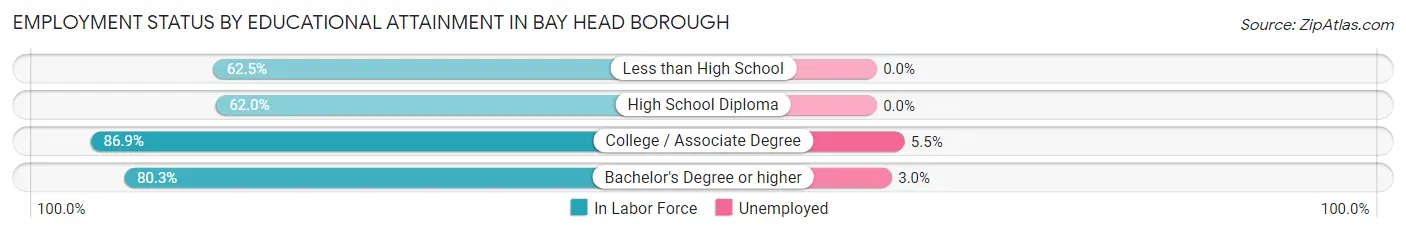
| Educational Attainment | In Labor Force | Unemployed |
| Less than High School | 5 (62.5%) | 0 (0.0%) |
| High School Diploma | 44 (62.0%) | 0 (0.0%) |
| College / Associate Degree | 73 (86.9%) | 5 (5.5%) |
| Bachelor's Degree or higher | 298 (80.3%) | 11 (3.0%) |
| Total | 420 (78.7%) | 17 (3.1%) |
Employment Occupations by Sex in Bay Head borough
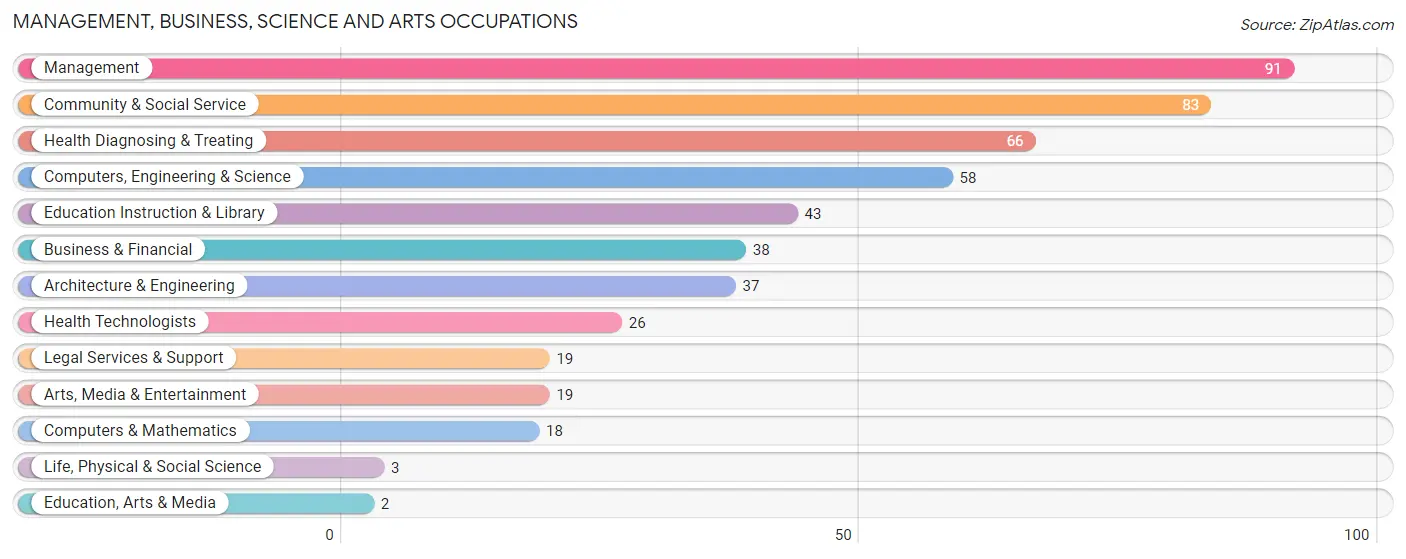
Management, Business, Science and Arts Occupations
The most common Management, Business, Science and Arts occupations in Bay Head borough are Management (91 | 15.9%), Community & Social Service (83 | 14.5%), Health Diagnosing & Treating (66 | 11.5%), Computers, Engineering & Science (58 | 10.1%), and Education Instruction & Library (43 | 7.5%).
Management, Business, Science and Arts Occupations by Sex
Within the Management, Business, Science and Arts occupations in Bay Head borough, the most male-oriented occupations are Computers & Mathematics (100.0%), Management (93.4%), and Legal Services & Support (89.5%), while the most female-oriented occupations are Life, Physical & Social Science (100.0%), Education, Arts & Media (100.0%), and Health Technologists (84.6%).
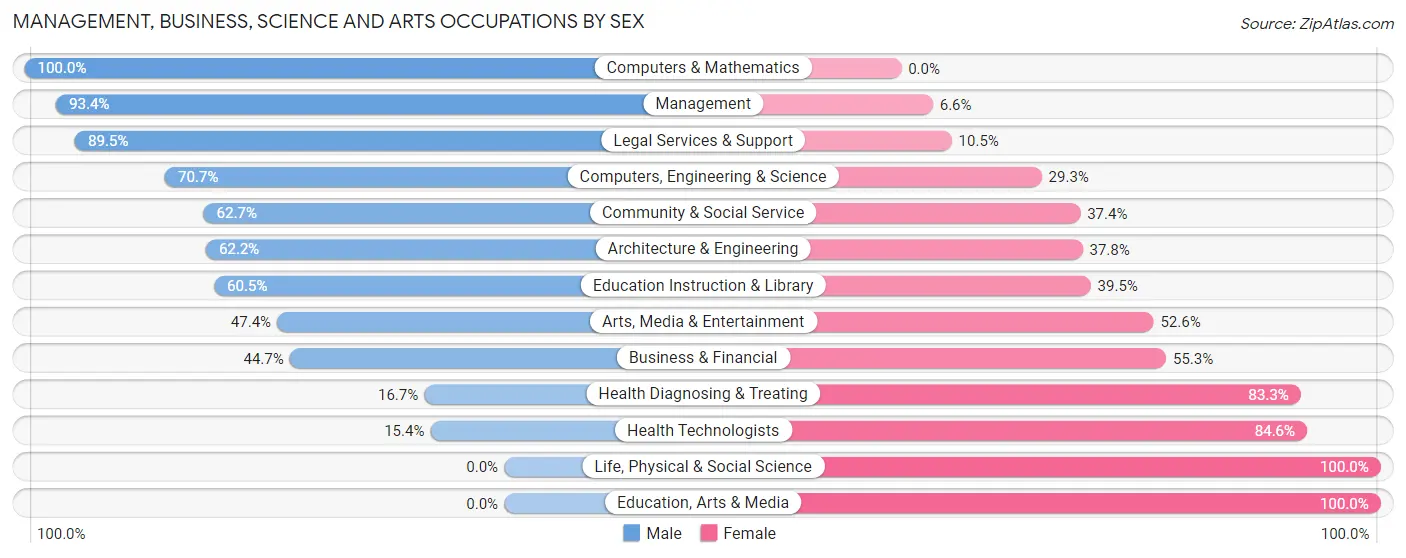
| Occupation | Male | Female |
| Management | 85 (93.4%) | 6 (6.6%) |
| Business & Financial | 17 (44.7%) | 21 (55.3%) |
| Computers, Engineering & Science | 41 (70.7%) | 17 (29.3%) |
| Computers & Mathematics | 18 (100.0%) | 0 (0.0%) |
| Architecture & Engineering | 23 (62.2%) | 14 (37.8%) |
| Life, Physical & Social Science | 0 (0.0%) | 3 (100.0%) |
| Community & Social Service | 52 (62.6%) | 31 (37.3%) |
| Education, Arts & Media | 0 (0.0%) | 2 (100.0%) |
| Legal Services & Support | 17 (89.5%) | 2 (10.5%) |
| Education Instruction & Library | 26 (60.5%) | 17 (39.5%) |
| Arts, Media & Entertainment | 9 (47.4%) | 10 (52.6%) |
| Health Diagnosing & Treating | 11 (16.7%) | 55 (83.3%) |
| Health Technologists | 4 (15.4%) | 22 (84.6%) |
| Total (Category) | 206 (61.3%) | 130 (38.7%) |
| Total (Overall) | 310 (54.0%) | 264 (46.0%) |
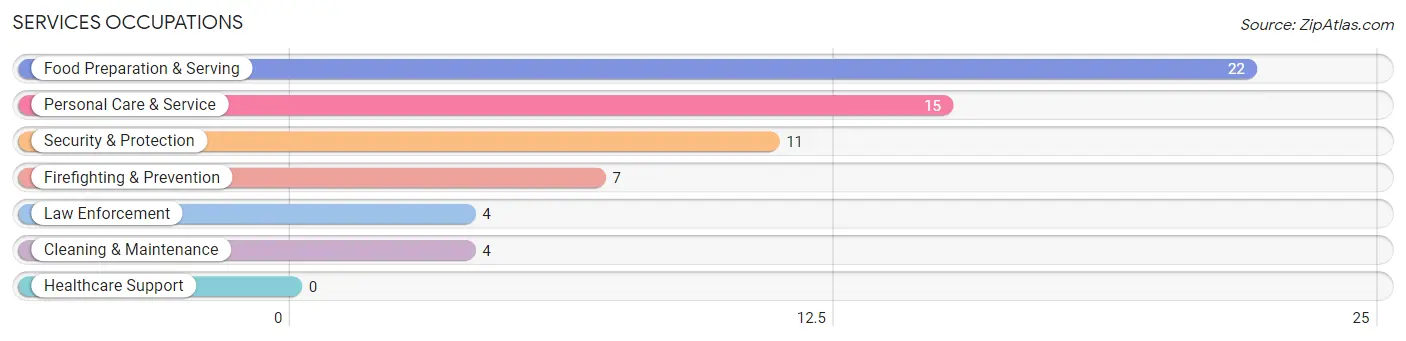
Services Occupations
The most common Services occupations in Bay Head borough are Food Preparation & Serving (22 | 3.8%), Personal Care & Service (15 | 2.6%), Security & Protection (11 | 1.9%), Firefighting & Prevention (7 | 1.2%), and Law Enforcement (4 | 0.7%).
Services Occupations by Sex
Within the Services occupations in Bay Head borough, the most male-oriented occupations are Security & Protection (100.0%), Firefighting & Prevention (100.0%), and Law Enforcement (100.0%), while the most female-oriented occupations are Food Preparation & Serving (81.8%), and Personal Care & Service (80.0%).
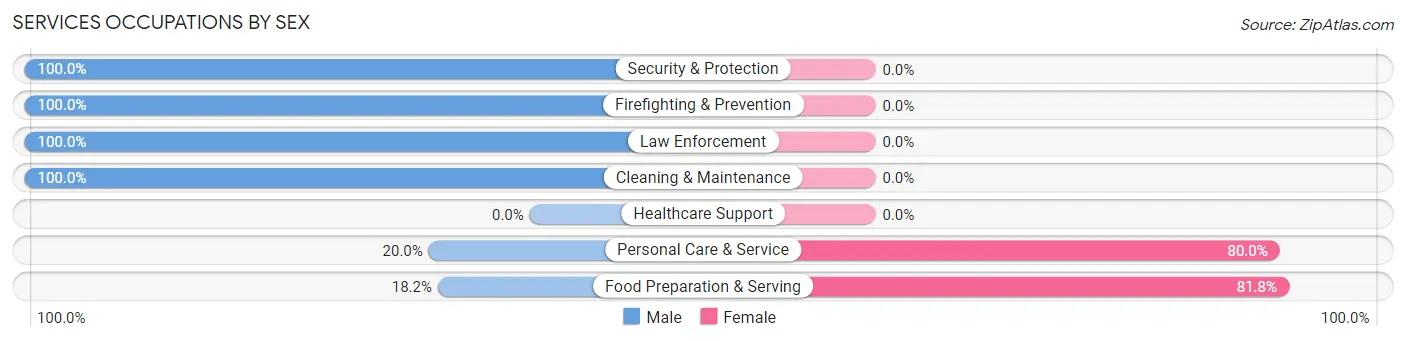
| Occupation | Male | Female |
| Healthcare Support | 0 (0.0%) | 0 (0.0%) |
| Security & Protection | 11 (100.0%) | 0 (0.0%) |
| Firefighting & Prevention | 7 (100.0%) | 0 (0.0%) |
| Law Enforcement | 4 (100.0%) | 0 (0.0%) |
| Food Preparation & Serving | 4 (18.2%) | 18 (81.8%) |
| Cleaning & Maintenance | 4 (100.0%) | 0 (0.0%) |
| Personal Care & Service | 3 (20.0%) | 12 (80.0%) |
| Total (Category) | 22 (42.3%) | 30 (57.7%) |
| Total (Overall) | 310 (54.0%) | 264 (46.0%) |
Sales and Office Occupations
The most common Sales and Office occupations in Bay Head borough are Sales & Related (88 | 15.3%), and Office & Administration (53 | 9.2%).
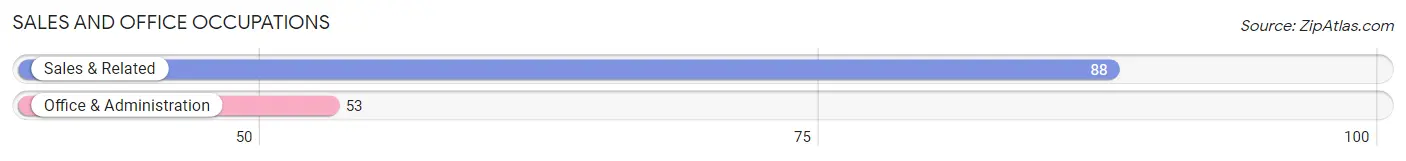
Sales and Office Occupations by Sex
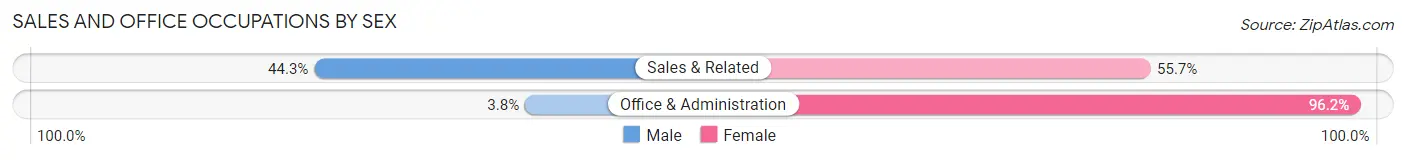
| Occupation | Male | Female |
| Sales & Related | 39 (44.3%) | 49 (55.7%) |
| Office & Administration | 2 (3.8%) | 51 (96.2%) |
| Total (Category) | 41 (29.1%) | 100 (70.9%) |
| Total (Overall) | 310 (54.0%) | 264 (46.0%) |
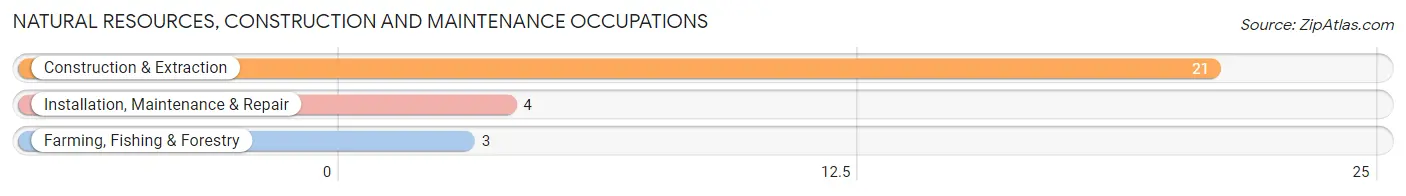
Natural Resources, Construction and Maintenance Occupations
The most common Natural Resources, Construction and Maintenance occupations in Bay Head borough are Construction & Extraction (21 | 3.7%), Installation, Maintenance & Repair (4 | 0.7%), and Farming, Fishing & Forestry (3 | 0.5%).
Natural Resources, Construction and Maintenance Occupations by Sex
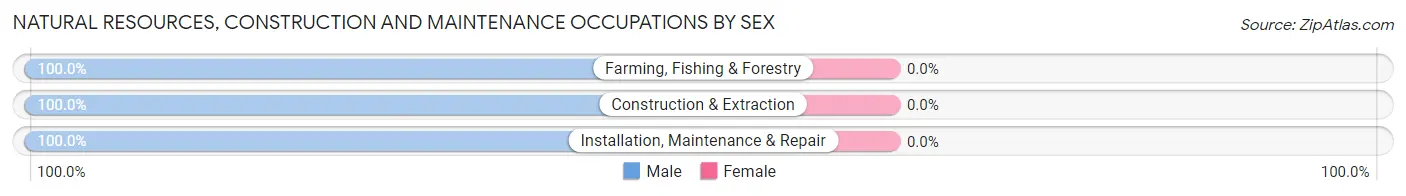
| Occupation | Male | Female |
| Farming, Fishing & Forestry | 3 (100.0%) | 0 (0.0%) |
| Construction & Extraction | 21 (100.0%) | 0 (0.0%) |
| Installation, Maintenance & Repair | 4 (100.0%) | 0 (0.0%) |
| Total (Category) | 28 (100.0%) | 0 (0.0%) |
| Total (Overall) | 310 (54.0%) | 264 (46.0%) |
Production, Transportation and Moving Occupations
The most common Production, Transportation and Moving occupations in Bay Head borough are Transportation (15 | 2.6%), and Production (2 | 0.4%).
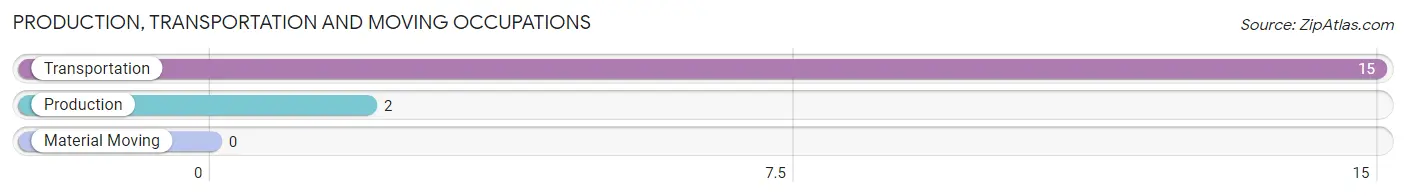
Production, Transportation and Moving Occupations by Sex
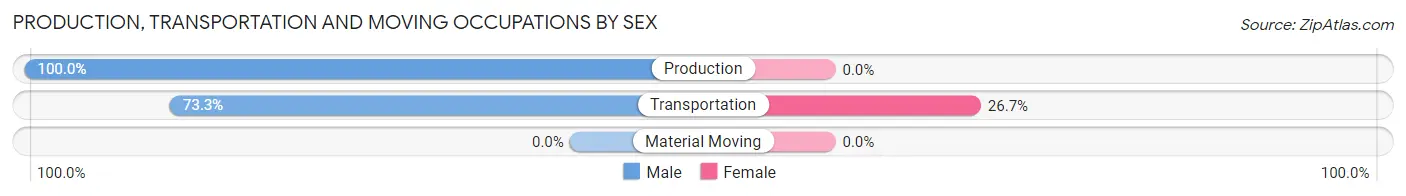
| Occupation | Male | Female |
| Production | 2 (100.0%) | 0 (0.0%) |
| Transportation | 11 (73.3%) | 4 (26.7%) |
| Material Moving | 0 (0.0%) | 0 (0.0%) |
| Total (Category) | 13 (76.5%) | 4 (23.5%) |
| Total (Overall) | 310 (54.0%) | 264 (46.0%) |
Employment Industries by Sex in Bay Head borough
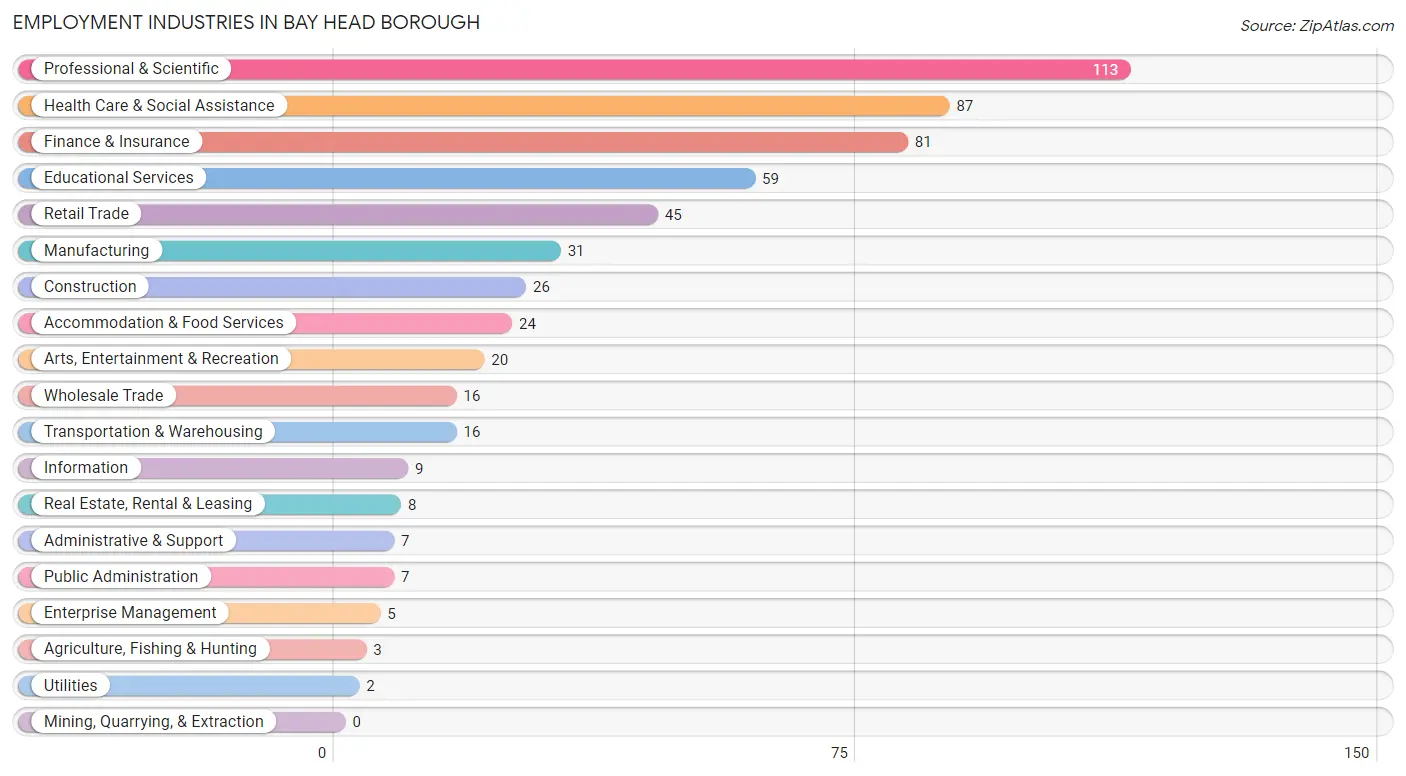
Employment Industries in Bay Head borough
The major employment industries in Bay Head borough include Professional & Scientific (113 | 19.7%), Health Care & Social Assistance (87 | 15.2%), Finance & Insurance (81 | 14.1%), Educational Services (59 | 10.3%), and Retail Trade (45 | 7.8%).
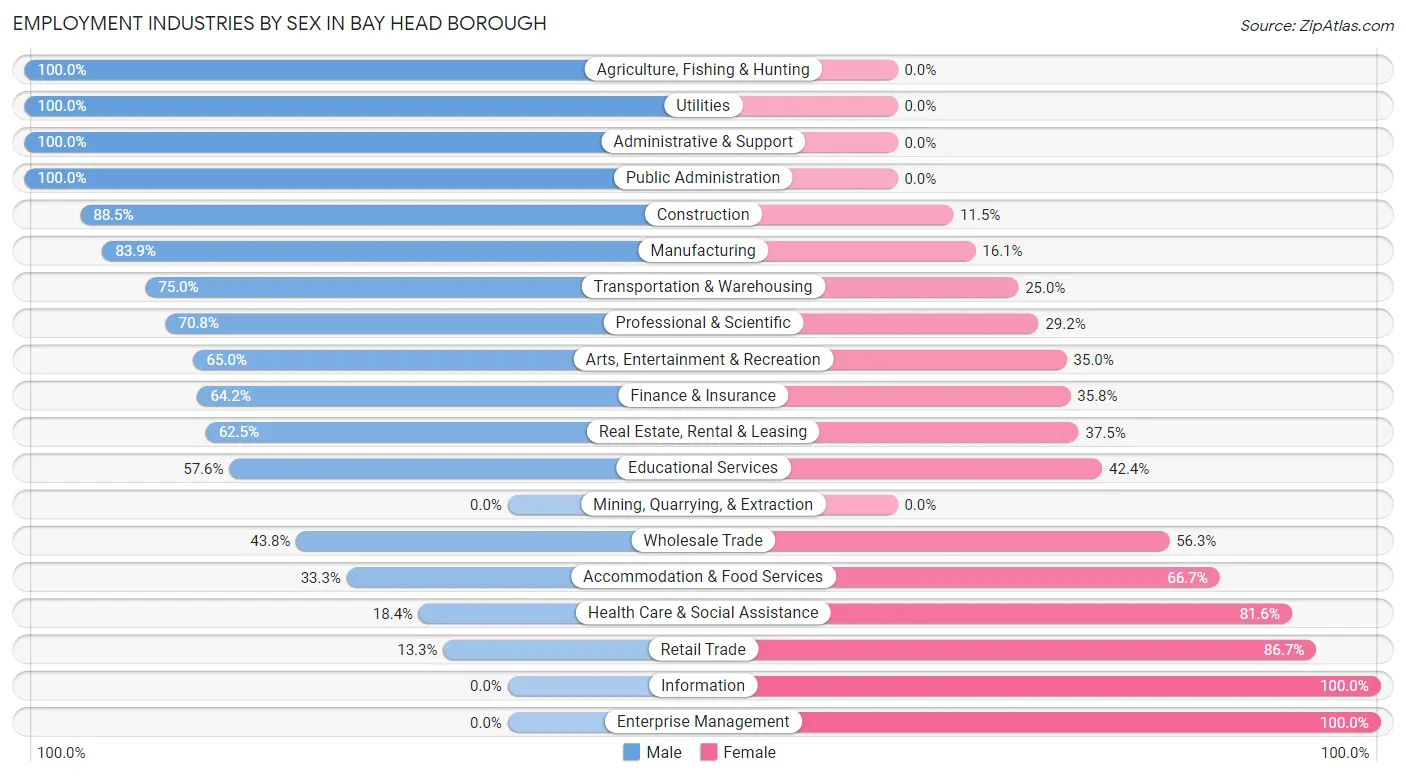
Employment Industries by Sex in Bay Head borough
The Bay Head borough industries that see more men than women are Agriculture, Fishing & Hunting (100.0%), Utilities (100.0%), and Administrative & Support (100.0%), whereas the industries that tend to have a higher number of women are Information (100.0%), Enterprise Management (100.0%), and Retail Trade (86.7%).
| Industry | Male | Female |
| Agriculture, Fishing & Hunting | 3 (100.0%) | 0 (0.0%) |
| Mining, Quarrying, & Extraction | 0 (0.0%) | 0 (0.0%) |
| Construction | 23 (88.5%) | 3 (11.5%) |
| Manufacturing | 26 (83.9%) | 5 (16.1%) |
| Wholesale Trade | 7 (43.8%) | 9 (56.2%) |
| Retail Trade | 6 (13.3%) | 39 (86.7%) |
| Transportation & Warehousing | 12 (75.0%) | 4 (25.0%) |
| Utilities | 2 (100.0%) | 0 (0.0%) |
| Information | 0 (0.0%) | 9 (100.0%) |
| Finance & Insurance | 52 (64.2%) | 29 (35.8%) |
| Real Estate, Rental & Leasing | 5 (62.5%) | 3 (37.5%) |
| Professional & Scientific | 80 (70.8%) | 33 (29.2%) |
| Enterprise Management | 0 (0.0%) | 5 (100.0%) |
| Administrative & Support | 7 (100.0%) | 0 (0.0%) |
| Educational Services | 34 (57.6%) | 25 (42.4%) |
| Health Care & Social Assistance | 16 (18.4%) | 71 (81.6%) |
| Arts, Entertainment & Recreation | 13 (65.0%) | 7 (35.0%) |
| Accommodation & Food Services | 8 (33.3%) | 16 (66.7%) |
| Public Administration | 7 (100.0%) | 0 (0.0%) |
| Total | 310 (54.0%) | 264 (46.0%) |
Education in Bay Head borough
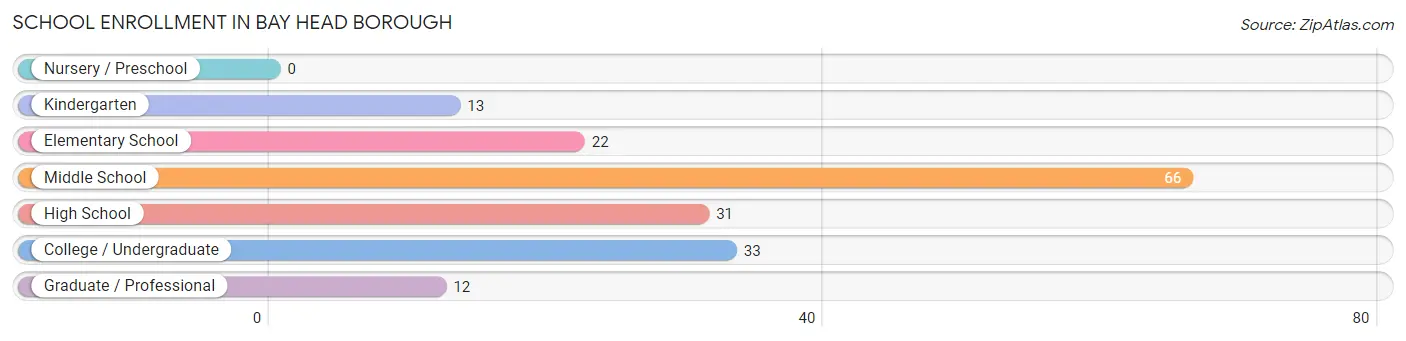
School Enrollment in Bay Head borough
The most common levels of schooling among the 177 students in Bay Head borough are middle school (66 | 37.3%), college / undergraduate (33 | 18.6%), and high school (31 | 17.5%).
| School Level | # Students | % Students |
| Nursery / Preschool | 0 | 0.0% |
| Kindergarten | 13 | 7.3% |
| Elementary School | 22 | 12.4% |
| Middle School | 66 | 37.3% |
| High School | 31 | 17.5% |
| College / Undergraduate | 33 | 18.6% |
| Graduate / Professional | 12 | 6.8% |
| Total | 177 | 100.0% |
School Enrollment by Age by Funding Source in Bay Head borough
Out of a total of 177 students who are enrolled in schools in Bay Head borough, 67 (37.9%) attend a private institution, while the remaining 110 (62.1%) are enrolled in public schools. The age group of 25 to 34 year olds has the highest likelihood of being enrolled in private schools, with 2 (100.0% in the age bracket) enrolled. Conversely, the age group of 18 to 19 year olds has the lowest likelihood of being enrolled in a private school, with 6 (100.0% in the age bracket) attending a public institution.
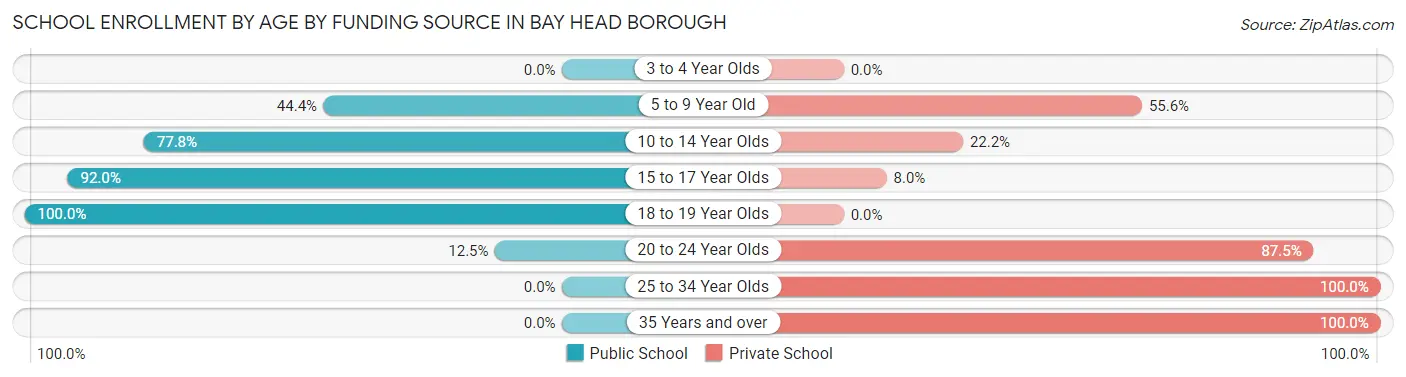
| Age Bracket | Public School | Private School |
| 3 to 4 Year Olds | 0 (0.0%) | 0 (0.0%) |
| 5 to 9 Year Old | 8 (44.4%) | 10 (55.6%) |
| 10 to 14 Year Olds | 70 (77.8%) | 20 (22.2%) |
| 15 to 17 Year Olds | 23 (92.0%) | 2 (8.0%) |
| 18 to 19 Year Olds | 6 (100.0%) | 0 (0.0%) |
| 20 to 24 Year Olds | 3 (12.5%) | 21 (87.5%) |
| 25 to 34 Year Olds | 0 (0.0%) | 2 (100.0%) |
| 35 Years and over | 0 (0.0%) | 12 (100.0%) |
| Total | 110 (62.1%) | 67 (37.9%) |
Educational Attainment by Field of Study in Bay Head borough
Business (120 | 18.7%), education (96 | 14.9%), social sciences (69 | 10.7%), liberal arts & history (61 | 9.5%), and arts & humanities (51 | 7.9%) are the most common fields of study among 642 individuals in Bay Head borough who have obtained a bachelor's degree or higher.
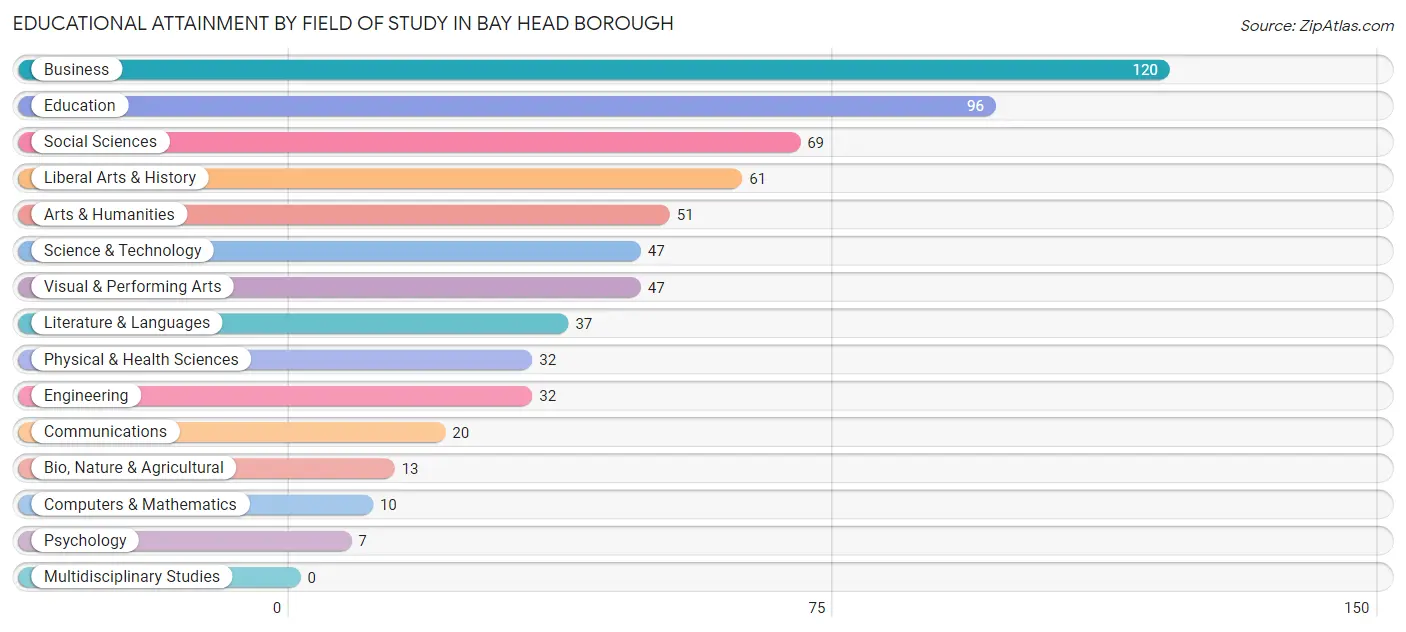
| Field of Study | # Graduates | % Graduates |
| Computers & Mathematics | 10 | 1.6% |
| Bio, Nature & Agricultural | 13 | 2.0% |
| Physical & Health Sciences | 32 | 5.0% |
| Psychology | 7 | 1.1% |
| Social Sciences | 69 | 10.7% |
| Engineering | 32 | 5.0% |
| Multidisciplinary Studies | 0 | 0.0% |
| Science & Technology | 47 | 7.3% |
| Business | 120 | 18.7% |
| Education | 96 | 14.9% |
| Literature & Languages | 37 | 5.8% |
| Liberal Arts & History | 61 | 9.5% |
| Visual & Performing Arts | 47 | 7.3% |
| Communications | 20 | 3.1% |
| Arts & Humanities | 51 | 7.9% |
| Total | 642 | 100.0% |
Transportation & Commute in Bay Head borough
Vehicle Availability by Sex in Bay Head borough
The most prevalent vehicle ownership categories in Bay Head borough are males with 2 vehicles (122, accounting for 39.4%) and females with 2 vehicles (93, making up 47.5%).
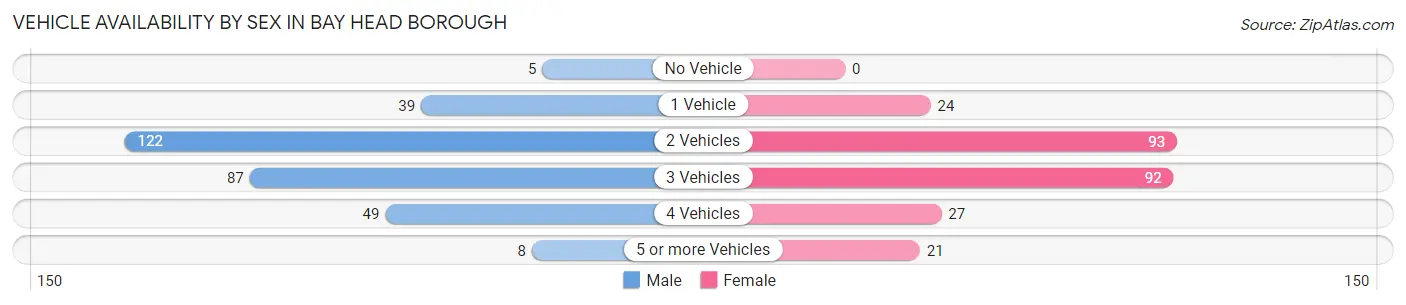
| Vehicles Available | Male | Female |
| No Vehicle | 5 (1.6%) | 0 (0.0%) |
| 1 Vehicle | 39 (12.6%) | 24 (9.3%) |
| 2 Vehicles | 122 (39.4%) | 93 (36.2%) |
| 3 Vehicles | 87 (28.1%) | 92 (35.8%) |
| 4 Vehicles | 49 (15.8%) | 27 (10.5%) |
| 5 or more Vehicles | 8 (2.6%) | 21 (8.2%) |
| Total | 310 (100.0%) | 257 (100.0%) |
Commute Time in Bay Head borough
The most frequently occuring commute durations in Bay Head borough are 10 to 14 minutes (92 commuters, 18.7%), 5 to 9 minutes (69 commuters, 14.0%), and 60 to 89 minutes (66 commuters, 13.4%).
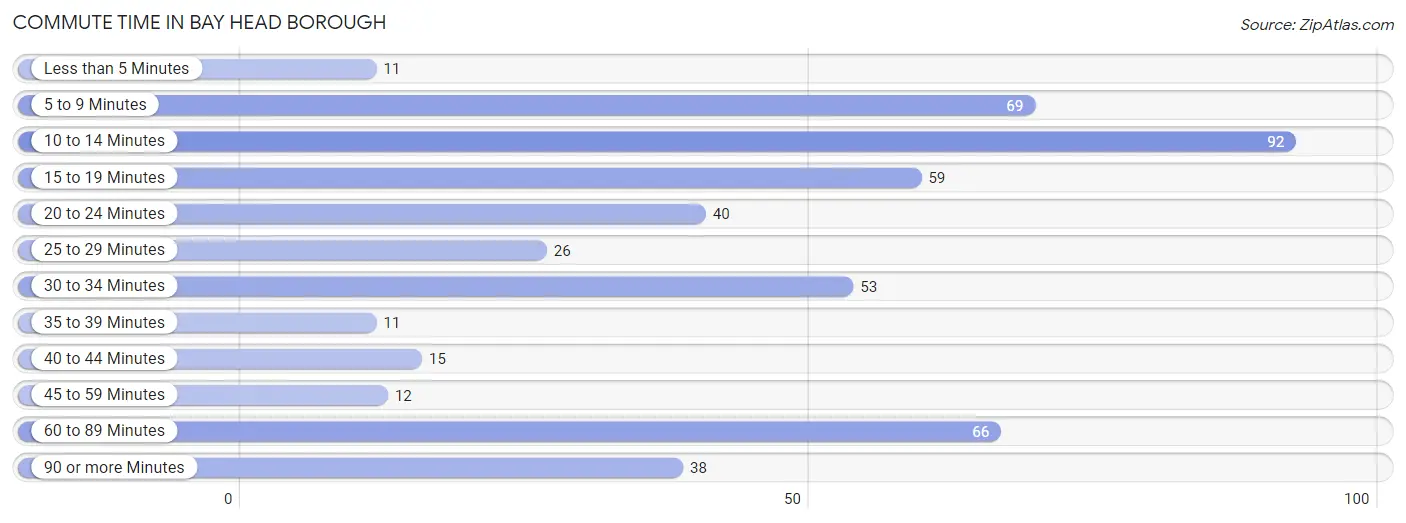
| Commute Time | # Commuters | % Commuters |
| Less than 5 Minutes | 11 | 2.2% |
| 5 to 9 Minutes | 69 | 14.0% |
| 10 to 14 Minutes | 92 | 18.7% |
| 15 to 19 Minutes | 59 | 12.0% |
| 20 to 24 Minutes | 40 | 8.1% |
| 25 to 29 Minutes | 26 | 5.3% |
| 30 to 34 Minutes | 53 | 10.8% |
| 35 to 39 Minutes | 11 | 2.2% |
| 40 to 44 Minutes | 15 | 3.0% |
| 45 to 59 Minutes | 12 | 2.4% |
| 60 to 89 Minutes | 66 | 13.4% |
| 90 or more Minutes | 38 | 7.7% |
Commute Time by Sex in Bay Head borough
The most common commute times in Bay Head borough are 10 to 14 minutes (66 commuters, 24.1%) for males and 5 to 9 minutes (44 commuters, 20.2%) for females.
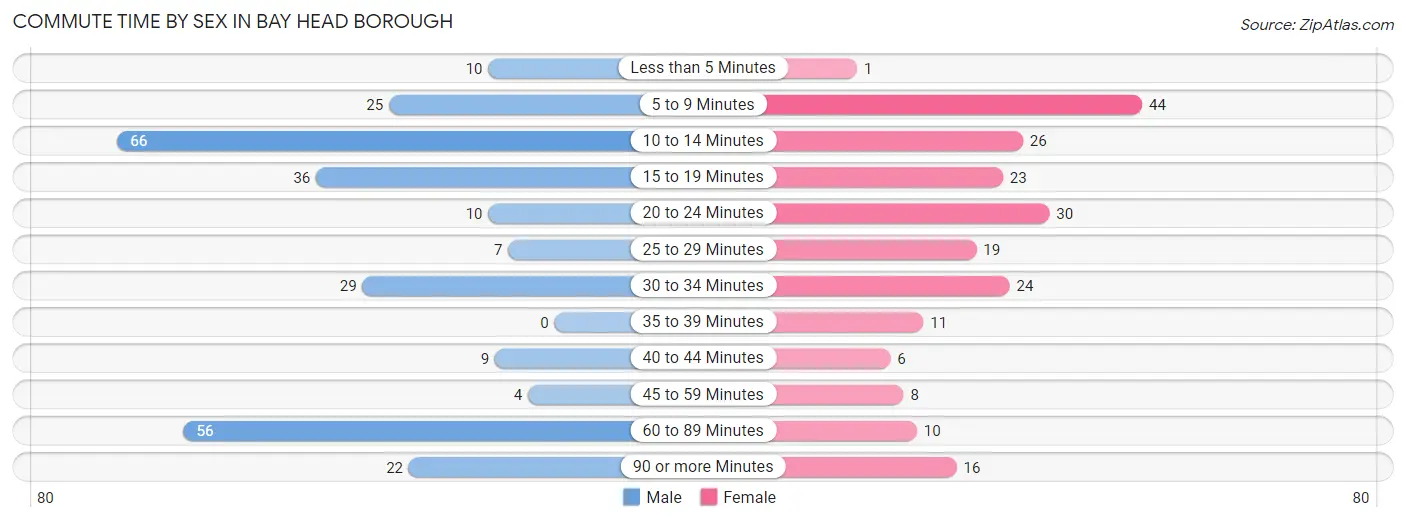
| Commute Time | Male | Female |
| Less than 5 Minutes | 10 (3.6%) | 1 (0.5%) |
| 5 to 9 Minutes | 25 (9.1%) | 44 (20.2%) |
| 10 to 14 Minutes | 66 (24.1%) | 26 (11.9%) |
| 15 to 19 Minutes | 36 (13.1%) | 23 (10.5%) |
| 20 to 24 Minutes | 10 (3.6%) | 30 (13.8%) |
| 25 to 29 Minutes | 7 (2.5%) | 19 (8.7%) |
| 30 to 34 Minutes | 29 (10.6%) | 24 (11.0%) |
| 35 to 39 Minutes | 0 (0.0%) | 11 (5.1%) |
| 40 to 44 Minutes | 9 (3.3%) | 6 (2.8%) |
| 45 to 59 Minutes | 4 (1.5%) | 8 (3.7%) |
| 60 to 89 Minutes | 56 (20.4%) | 10 (4.6%) |
| 90 or more Minutes | 22 (8.0%) | 16 (7.3%) |
Time of Departure to Work by Sex in Bay Head borough
The most frequent times of departure to work in Bay Head borough are 6:30 AM to 6:59 AM (53, 19.3%) for males and 8:30 AM to 8:59 AM (53, 24.3%) for females.
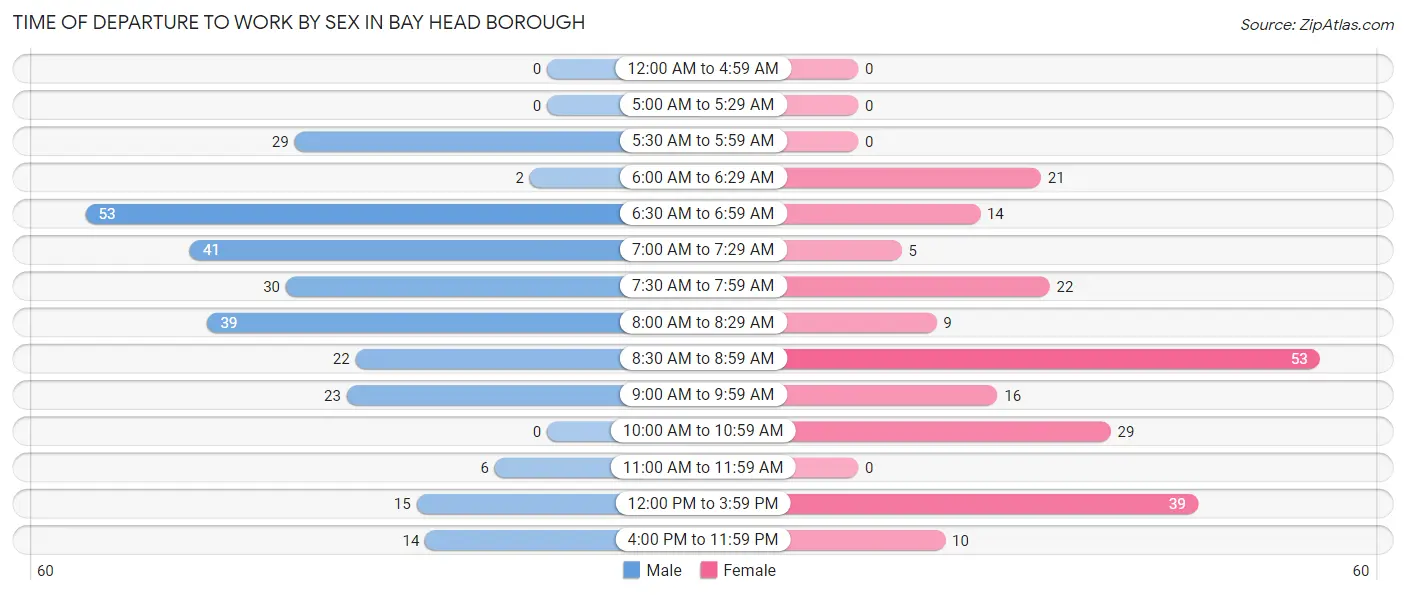
| Time of Departure | Male | Female |
| 12:00 AM to 4:59 AM | 0 (0.0%) | 0 (0.0%) |
| 5:00 AM to 5:29 AM | 0 (0.0%) | 0 (0.0%) |
| 5:30 AM to 5:59 AM | 29 (10.6%) | 0 (0.0%) |
| 6:00 AM to 6:29 AM | 2 (0.7%) | 21 (9.6%) |
| 6:30 AM to 6:59 AM | 53 (19.3%) | 14 (6.4%) |
| 7:00 AM to 7:29 AM | 41 (15.0%) | 5 (2.3%) |
| 7:30 AM to 7:59 AM | 30 (11.0%) | 22 (10.1%) |
| 8:00 AM to 8:29 AM | 39 (14.2%) | 9 (4.1%) |
| 8:30 AM to 8:59 AM | 22 (8.0%) | 53 (24.3%) |
| 9:00 AM to 9:59 AM | 23 (8.4%) | 16 (7.3%) |
| 10:00 AM to 10:59 AM | 0 (0.0%) | 29 (13.3%) |
| 11:00 AM to 11:59 AM | 6 (2.2%) | 0 (0.0%) |
| 12:00 PM to 3:59 PM | 15 (5.5%) | 39 (17.9%) |
| 4:00 PM to 11:59 PM | 14 (5.1%) | 10 (4.6%) |
| Total | 274 (100.0%) | 218 (100.0%) |
Housing Occupancy in Bay Head borough
Occupancy by Ownership in Bay Head borough
Of the total 480 dwellings in Bay Head borough, owner-occupied units account for 427 (89.0%), while renter-occupied units make up 53 (11.0%).
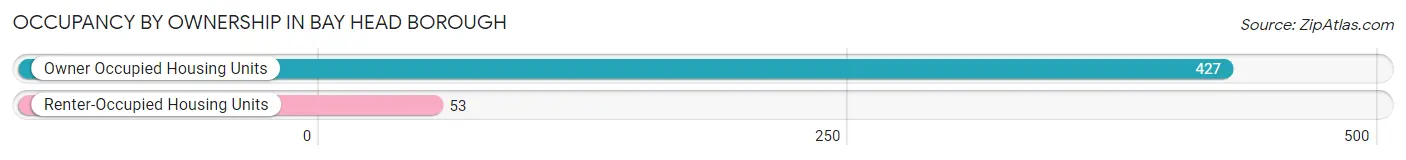
| Occupancy | # Housing Units | % Housing Units |
| Owner Occupied Housing Units | 427 | 89.0% |
| Renter-Occupied Housing Units | 53 | 11.0% |
| Total Occupied Housing Units | 480 | 100.0% |
Occupancy by Household Size in Bay Head borough
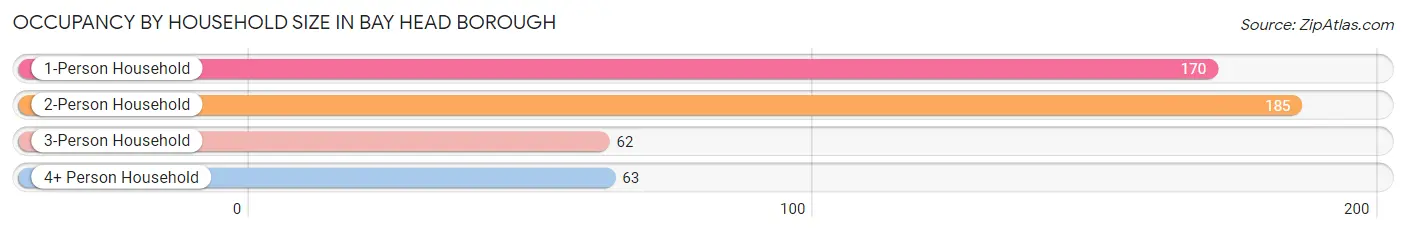
| Household Size | # Housing Units | % Housing Units |
| 1-Person Household | 170 | 35.4% |
| 2-Person Household | 185 | 38.5% |
| 3-Person Household | 62 | 12.9% |
| 4+ Person Household | 63 | 13.1% |
| Total Housing Units | 480 | 100.0% |
Occupancy by Ownership by Household Size in Bay Head borough
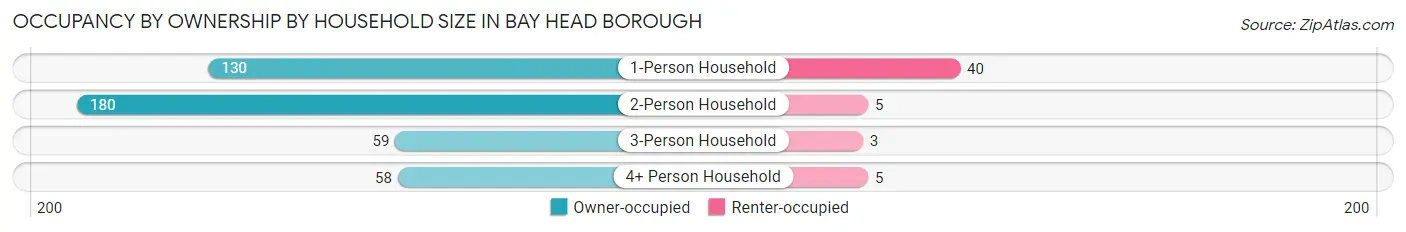
| Household Size | Owner-occupied | Renter-occupied |
| 1-Person Household | 130 (76.5%) | 40 (23.5%) |
| 2-Person Household | 180 (97.3%) | 5 (2.7%) |
| 3-Person Household | 59 (95.2%) | 3 (4.8%) |
| 4+ Person Household | 58 (92.1%) | 5 (7.9%) |
| Total Housing Units | 427 (89.0%) | 53 (11.0%) |
Occupancy by Educational Attainment in Bay Head borough
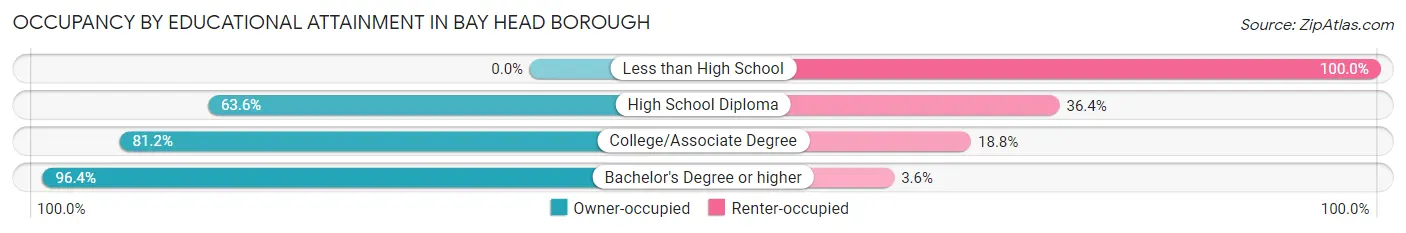
| Household Size | Owner-occupied | Renter-occupied |
| Less than High School | 0 (0.0%) | 5 (100.0%) |
| High School Diploma | 35 (63.6%) | 20 (36.4%) |
| College/Associate Degree | 69 (81.2%) | 16 (18.8%) |
| Bachelor's Degree or higher | 323 (96.4%) | 12 (3.6%) |
Occupancy by Age of Householder in Bay Head borough
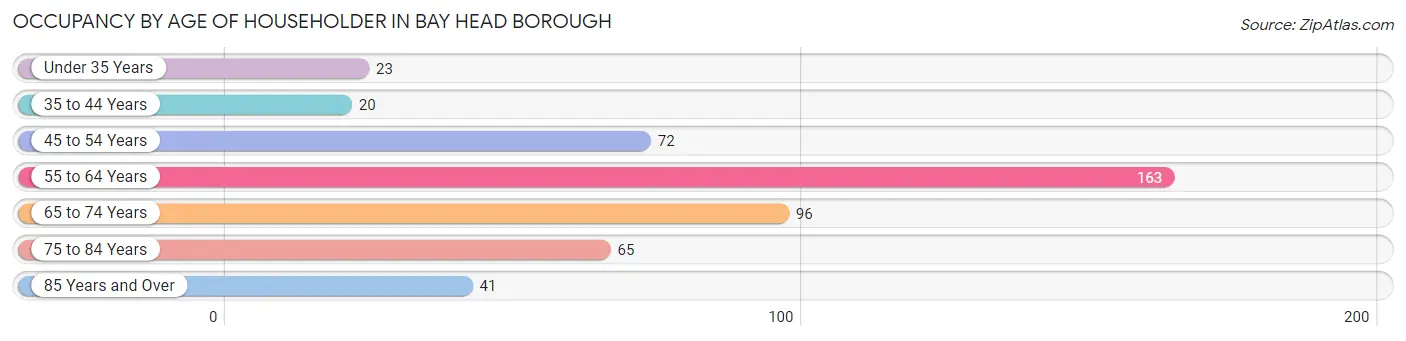
| Age Bracket | # Households | % Households |
| Under 35 Years | 23 | 4.8% |
| 35 to 44 Years | 20 | 4.2% |
| 45 to 54 Years | 72 | 15.0% |
| 55 to 64 Years | 163 | 34.0% |
| 65 to 74 Years | 96 | 20.0% |
| 75 to 84 Years | 65 | 13.5% |
| 85 Years and Over | 41 | 8.5% |
| Total | 480 | 100.0% |
Housing Finances in Bay Head borough
Median Income by Occupancy in Bay Head borough
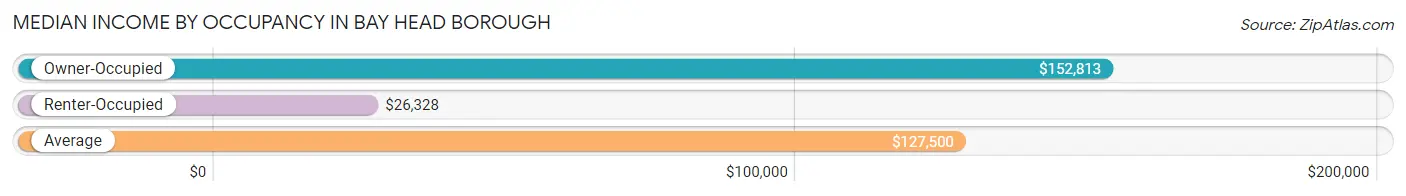
| Occupancy Type | # Households | Median Income |
| Owner-Occupied | 427 (89.0%) | $152,813 |
| Renter-Occupied | 53 (11.0%) | $26,328 |
| Average | 480 (100.0%) | $127,500 |
Occupancy by Householder Income Bracket in Bay Head borough
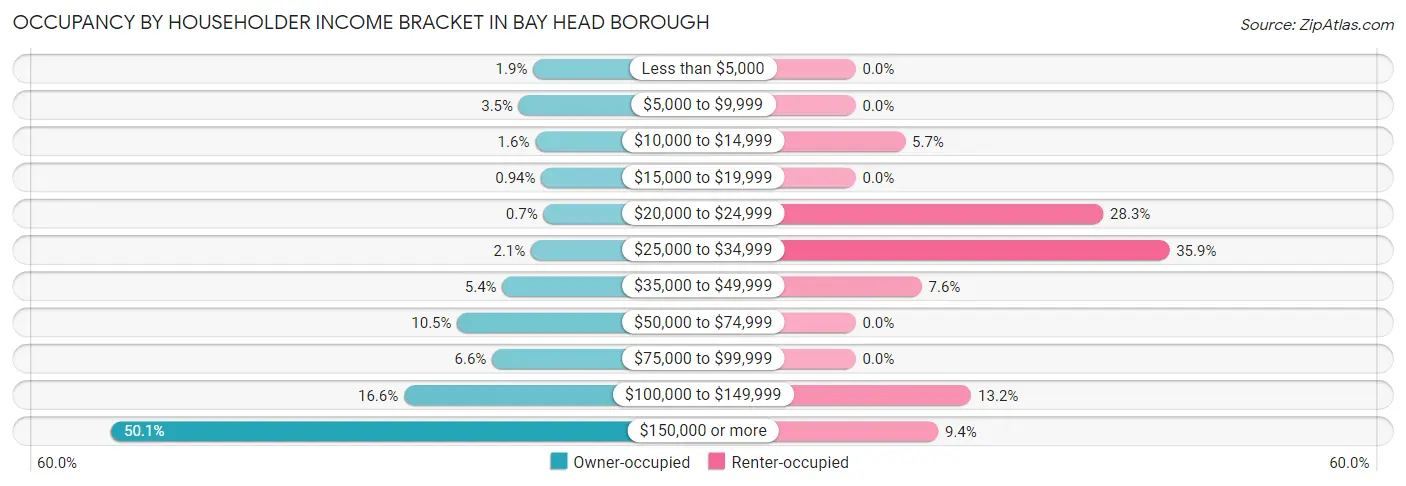
| Income Bracket | Owner-occupied | Renter-occupied |
| Less than $5,000 | 8 (1.9%) | 0 (0.0%) |
| $5,000 to $9,999 | 15 (3.5%) | 0 (0.0%) |
| $10,000 to $14,999 | 7 (1.6%) | 3 (5.7%) |
| $15,000 to $19,999 | 4 (0.9%) | 0 (0.0%) |
| $20,000 to $24,999 | 3 (0.7%) | 15 (28.3%) |
| $25,000 to $34,999 | 9 (2.1%) | 19 (35.8%) |
| $35,000 to $49,999 | 23 (5.4%) | 4 (7.5%) |
| $50,000 to $74,999 | 45 (10.5%) | 0 (0.0%) |
| $75,000 to $99,999 | 28 (6.6%) | 0 (0.0%) |
| $100,000 to $149,999 | 71 (16.6%) | 7 (13.2%) |
| $150,000 or more | 214 (50.1%) | 5 (9.4%) |
| Total | 427 (100.0%) | 53 (100.0%) |
Monthly Housing Cost Tiers in Bay Head borough
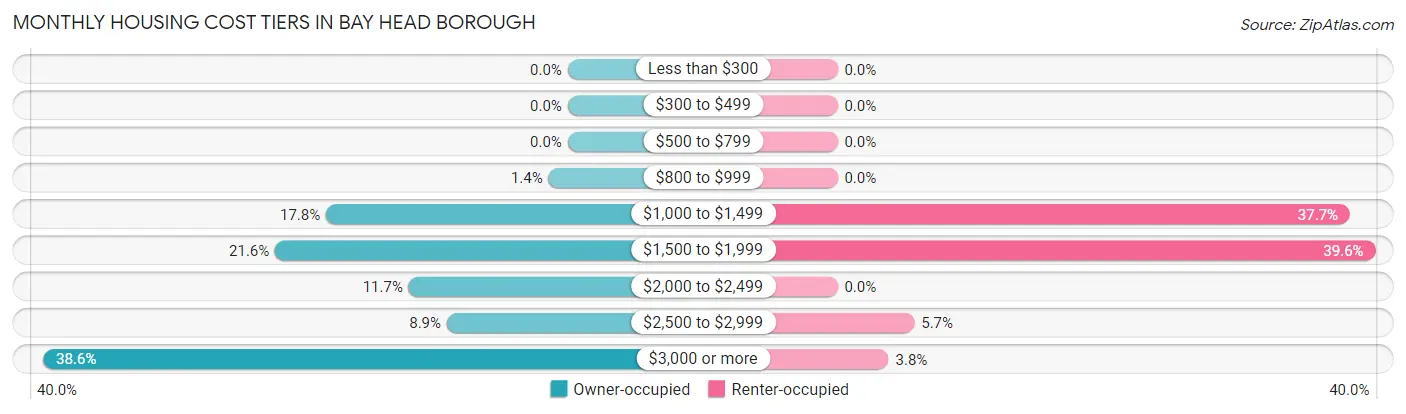
| Monthly Cost | Owner-occupied | Renter-occupied |
| Less than $300 | 0 (0.0%) | 0 (0.0%) |
| $300 to $499 | 0 (0.0%) | 0 (0.0%) |
| $500 to $799 | 0 (0.0%) | 0 (0.0%) |
| $800 to $999 | 6 (1.4%) | 0 (0.0%) |
| $1,000 to $1,499 | 76 (17.8%) | 20 (37.7%) |
| $1,500 to $1,999 | 92 (21.5%) | 21 (39.6%) |
| $2,000 to $2,499 | 50 (11.7%) | 0 (0.0%) |
| $2,500 to $2,999 | 38 (8.9%) | 3 (5.7%) |
| $3,000 or more | 165 (38.6%) | 2 (3.8%) |
| Total | 427 (100.0%) | 53 (100.0%) |
Physical Housing Characteristics in Bay Head borough
Housing Structures in Bay Head borough
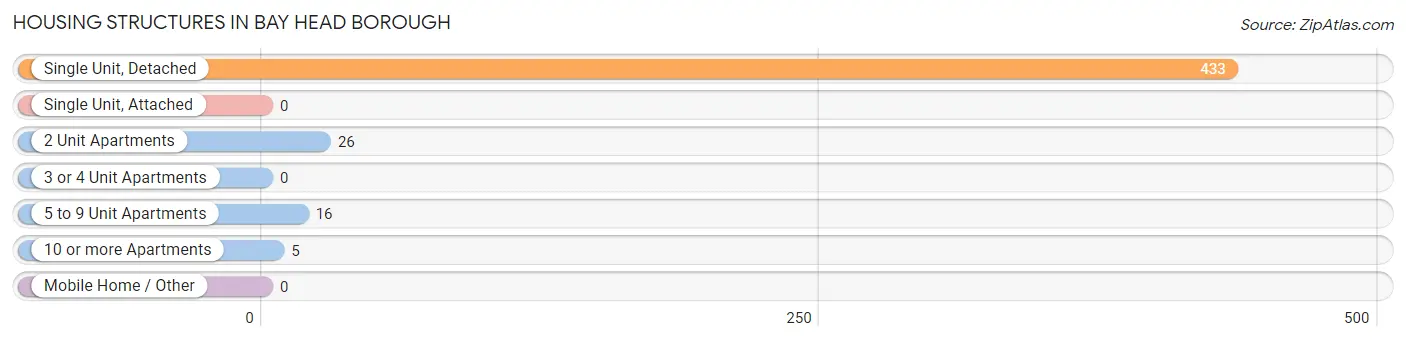
| Structure Type | # Housing Units | % Housing Units |
| Single Unit, Detached | 433 | 90.2% |
| Single Unit, Attached | 0 | 0.0% |
| 2 Unit Apartments | 26 | 5.4% |
| 3 or 4 Unit Apartments | 0 | 0.0% |
| 5 to 9 Unit Apartments | 16 | 3.3% |
| 10 or more Apartments | 5 | 1.0% |
| Mobile Home / Other | 0 | 0.0% |
| Total | 480 | 100.0% |
Housing Structures by Occupancy in Bay Head borough
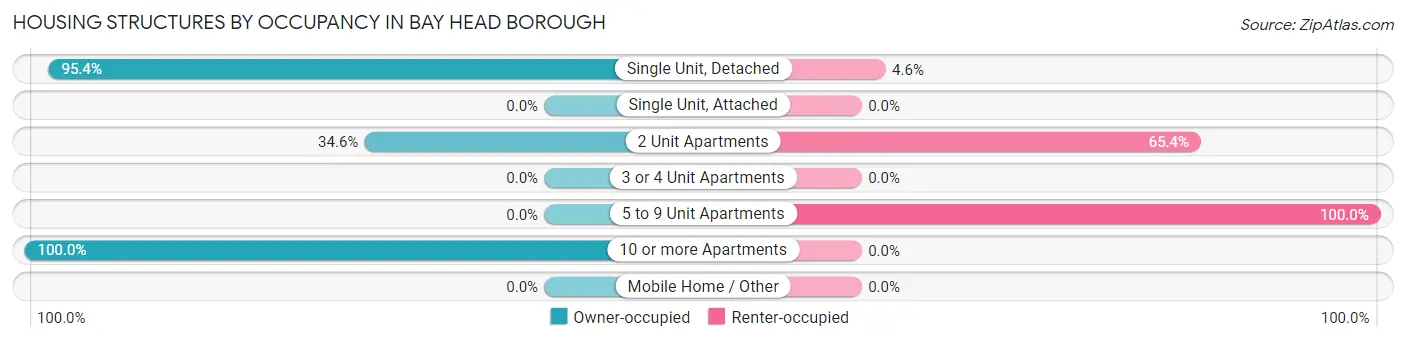
| Structure Type | Owner-occupied | Renter-occupied |
| Single Unit, Detached | 413 (95.4%) | 20 (4.6%) |
| Single Unit, Attached | 0 (0.0%) | 0 (0.0%) |
| 2 Unit Apartments | 9 (34.6%) | 17 (65.4%) |
| 3 or 4 Unit Apartments | 0 (0.0%) | 0 (0.0%) |
| 5 to 9 Unit Apartments | 0 (0.0%) | 16 (100.0%) |
| 10 or more Apartments | 5 (100.0%) | 0 (0.0%) |
| Mobile Home / Other | 0 (0.0%) | 0 (0.0%) |
| Total | 427 (89.0%) | 53 (11.0%) |
Housing Structures by Number of Rooms in Bay Head borough
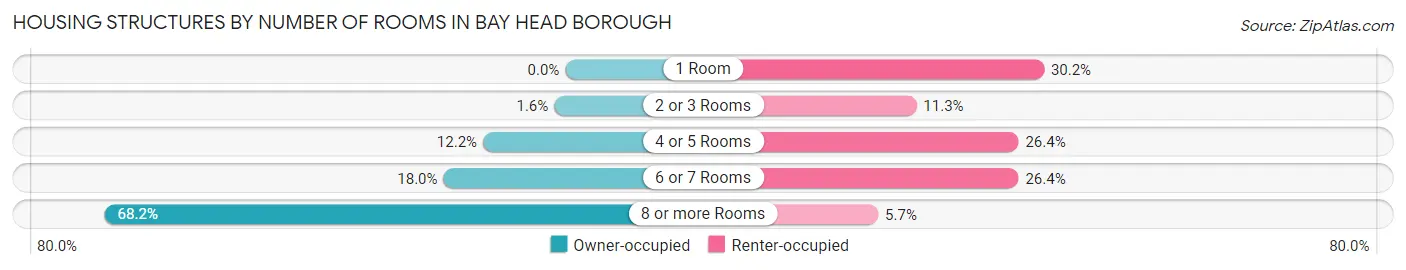
| Number of Rooms | Owner-occupied | Renter-occupied |
| 1 Room | 0 (0.0%) | 16 (30.2%) |
| 2 or 3 Rooms | 7 (1.6%) | 6 (11.3%) |
| 4 or 5 Rooms | 52 (12.2%) | 14 (26.4%) |
| 6 or 7 Rooms | 77 (18.0%) | 14 (26.4%) |
| 8 or more Rooms | 291 (68.1%) | 3 (5.7%) |
| Total | 427 (100.0%) | 53 (100.0%) |
Housing Structure by Heating Type in Bay Head borough
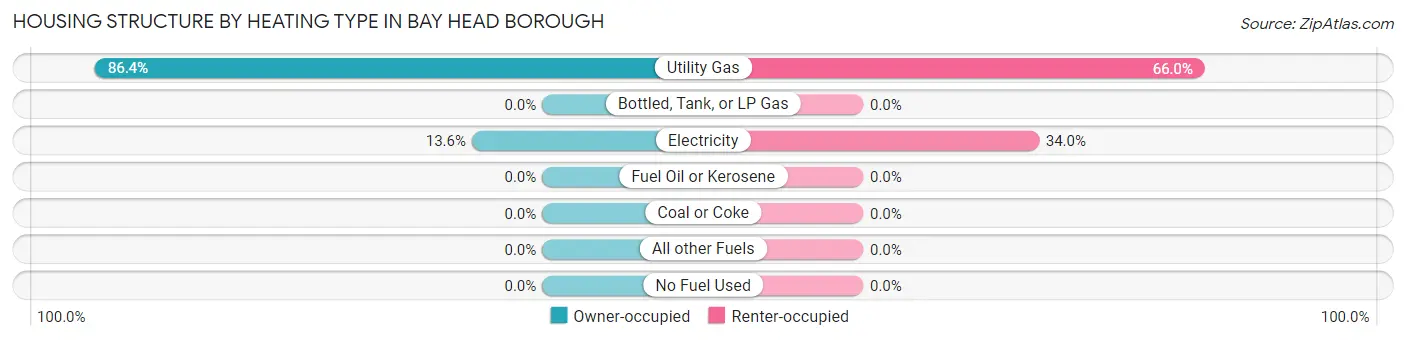
| Heating Type | Owner-occupied | Renter-occupied |
| Utility Gas | 369 (86.4%) | 35 (66.0%) |
| Bottled, Tank, or LP Gas | 0 (0.0%) | 0 (0.0%) |
| Electricity | 58 (13.6%) | 18 (34.0%) |
| Fuel Oil or Kerosene | 0 (0.0%) | 0 (0.0%) |
| Coal or Coke | 0 (0.0%) | 0 (0.0%) |
| All other Fuels | 0 (0.0%) | 0 (0.0%) |
| No Fuel Used | 0 (0.0%) | 0 (0.0%) |
| Total | 427 (100.0%) | 53 (100.0%) |
Household Vehicle Usage in Bay Head borough

| Vehicles per Household | Owner-occupied | Renter-occupied |
| No Vehicle | 27 (6.3%) | 3 (5.7%) |
| 1 Vehicle | 105 (24.6%) | 40 (75.5%) |
| 2 Vehicles | 192 (45.0%) | 10 (18.9%) |
| 3 or more Vehicles | 103 (24.1%) | 0 (0.0%) |
| Total | 427 (100.0%) | 53 (100.0%) |
Real Estate & Mortgages in Bay Head borough
Real Estate and Mortgage Overview in Bay Head borough
| Characteristic | Without Mortgage | With Mortgage |
| Housing Units | 213 | 214 |
| Median Property Value | $1,585,500 | $1,625,000 |
| Median Household Income | $114,583 | $137 |
| Monthly Housing Costs | $1,501 | $147 |
| Real Estate Taxes | $10,001 | $0 |
Property Value by Mortgage Status in Bay Head borough
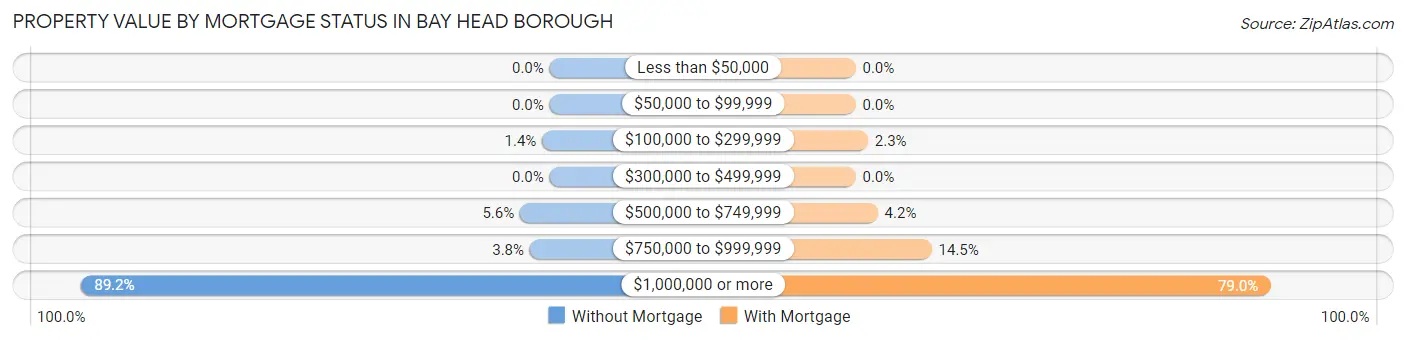
| Property Value | Without Mortgage | With Mortgage |
| Less than $50,000 | 0 (0.0%) | 0 (0.0%) |
| $50,000 to $99,999 | 0 (0.0%) | 0 (0.0%) |
| $100,000 to $299,999 | 3 (1.4%) | 5 (2.3%) |
| $300,000 to $499,999 | 0 (0.0%) | 0 (0.0%) |
| $500,000 to $749,999 | 12 (5.6%) | 9 (4.2%) |
| $750,000 to $999,999 | 8 (3.8%) | 31 (14.5%) |
| $1,000,000 or more | 190 (89.2%) | 169 (79.0%) |
| Total | 213 (100.0%) | 214 (100.0%) |
Household Income by Mortgage Status in Bay Head borough
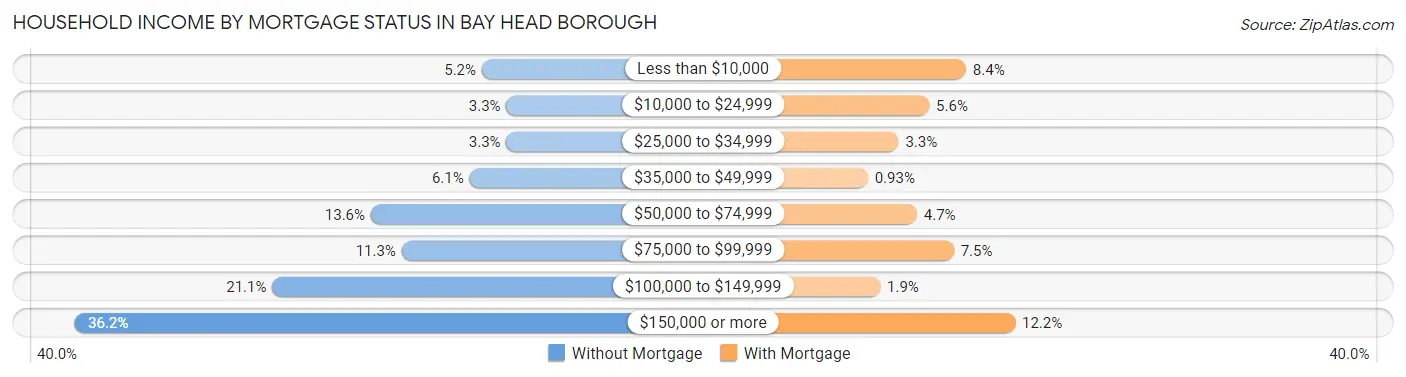
| Household Income | Without Mortgage | With Mortgage |
| Less than $10,000 | 11 (5.2%) | 18 (8.4%) |
| $10,000 to $24,999 | 7 (3.3%) | 12 (5.6%) |
| $25,000 to $34,999 | 7 (3.3%) | 7 (3.3%) |
| $35,000 to $49,999 | 13 (6.1%) | 2 (0.9%) |
| $50,000 to $74,999 | 29 (13.6%) | 10 (4.7%) |
| $75,000 to $99,999 | 24 (11.3%) | 16 (7.5%) |
| $100,000 to $149,999 | 45 (21.1%) | 4 (1.9%) |
| $150,000 or more | 77 (36.1%) | 26 (12.1%) |
| Total | 213 (100.0%) | 214 (100.0%) |
Property Value to Household Income Ratio in Bay Head borough
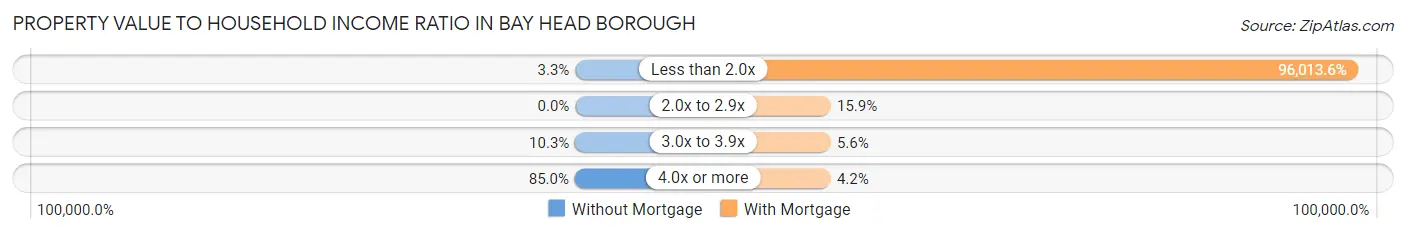
| Value-to-Income Ratio | Without Mortgage | With Mortgage |
| Less than 2.0x | 7 (3.3%) | 205,469 (96,013.5%) |
| 2.0x to 2.9x | 0 (0.0%) | 34 (15.9%) |
| 3.0x to 3.9x | 22 (10.3%) | 12 (5.6%) |
| 4.0x or more | 181 (85.0%) | 9 (4.2%) |
| Total | 213 (100.0%) | 214 (100.0%) |
Real Estate Taxes by Mortgage Status in Bay Head borough
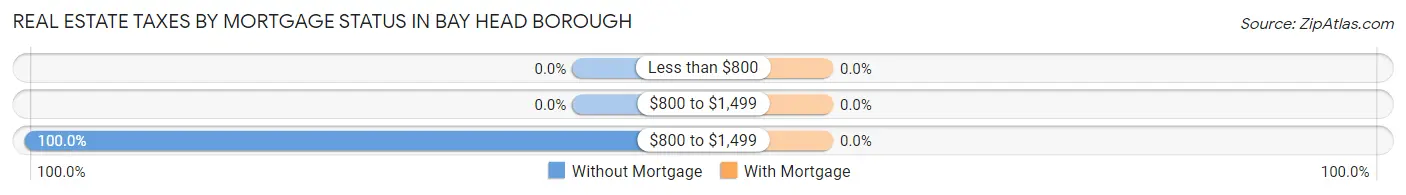
| Property Taxes | Without Mortgage | With Mortgage |
| Less than $800 | 0 (0.0%) | 0 (0.0%) |
| $800 to $1,499 | 0 (0.0%) | 0 (0.0%) |
| $800 to $1,499 | 213 (100.0%) | 0 (0.0%) |
| Total | 213 (100.0%) | 214 (100.0%) |
Health & Disability in Bay Head borough
Health Insurance Coverage by Age in Bay Head borough
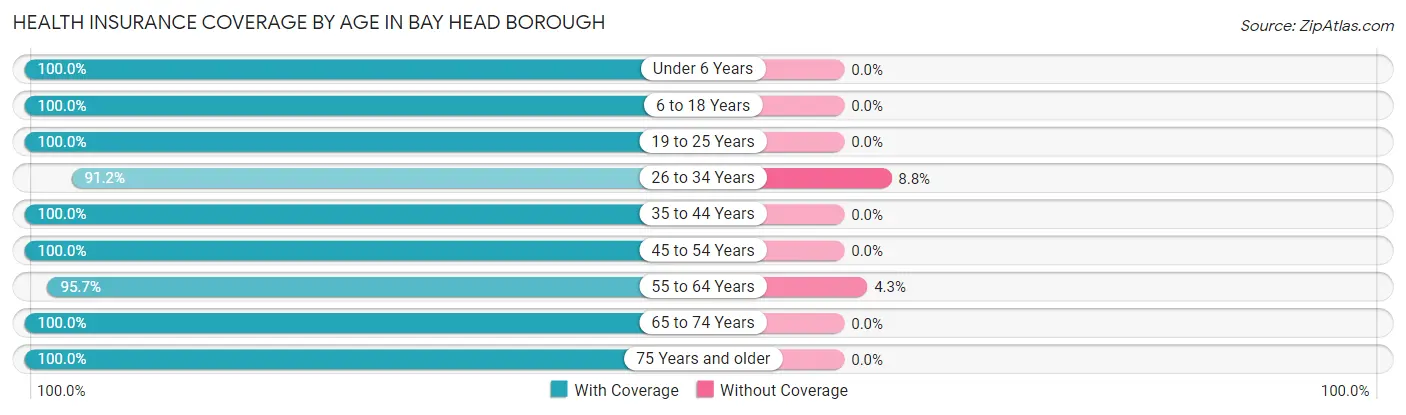
| Age Bracket | With Coverage | Without Coverage |
| Under 6 Years | 8 (100.0%) | 0 (0.0%) |
| 6 to 18 Years | 133 (100.0%) | 0 (0.0%) |
| 19 to 25 Years | 99 (100.0%) | 0 (0.0%) |
| 26 to 34 Years | 52 (91.2%) | 5 (8.8%) |
| 35 to 44 Years | 67 (100.0%) | 0 (0.0%) |
| 45 to 54 Years | 132 (100.0%) | 0 (0.0%) |
| 55 to 64 Years | 246 (95.7%) | 11 (4.3%) |
| 65 to 74 Years | 175 (100.0%) | 0 (0.0%) |
| 75 Years and older | 168 (100.0%) | 0 (0.0%) |
| Total | 1,080 (98.5%) | 16 (1.5%) |
Health Insurance Coverage by Citizenship Status in Bay Head borough
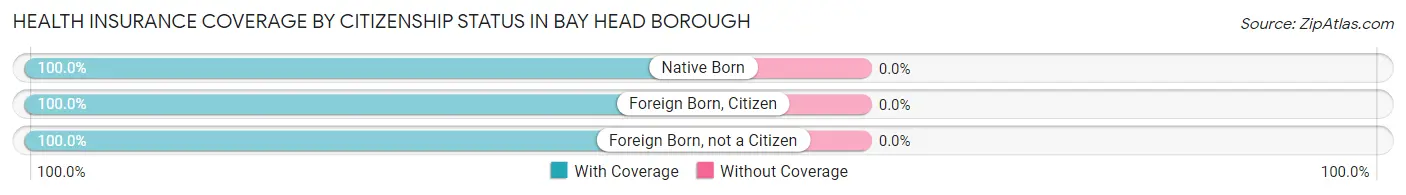
| Citizenship Status | With Coverage | Without Coverage |
| Native Born | 8 (100.0%) | 0 (0.0%) |
| Foreign Born, Citizen | 133 (100.0%) | 0 (0.0%) |
| Foreign Born, not a Citizen | 99 (100.0%) | 0 (0.0%) |
Health Insurance Coverage by Household Income in Bay Head borough
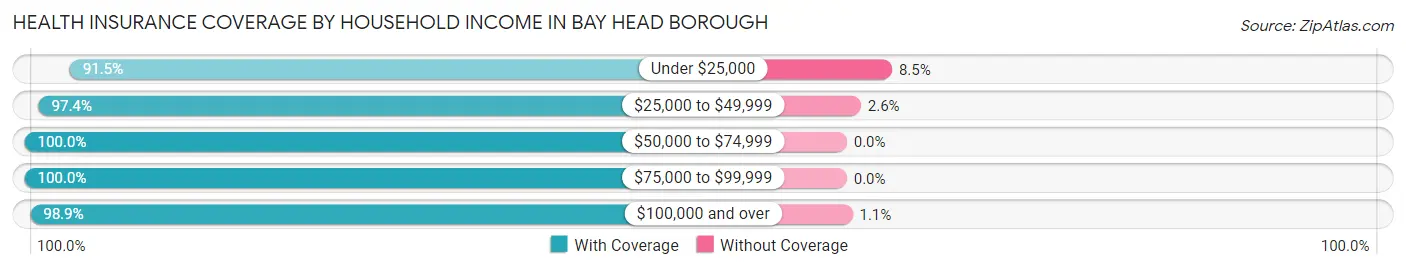
| Household Income | With Coverage | Without Coverage |
| Under $25,000 | 54 (91.5%) | 5 (8.5%) |
| $25,000 to $49,999 | 74 (97.4%) | 2 (2.6%) |
| $50,000 to $74,999 | 65 (100.0%) | 0 (0.0%) |
| $75,000 to $99,999 | 46 (100.0%) | 0 (0.0%) |
| $100,000 and over | 829 (98.9%) | 9 (1.1%) |
Public vs Private Health Insurance Coverage by Age in Bay Head borough
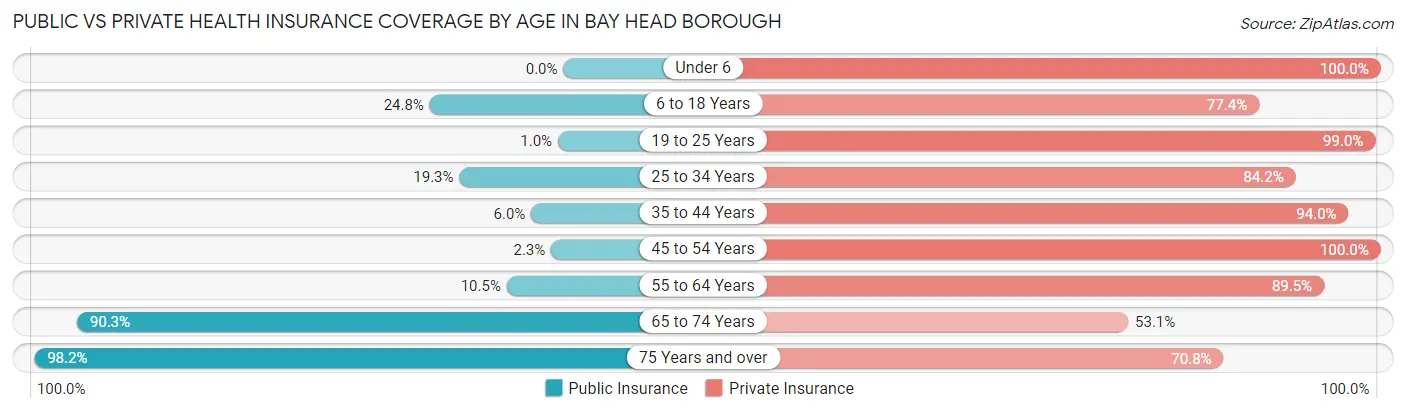
| Age Bracket | Public Insurance | Private Insurance |
| Under 6 | 0 (0.0%) | 8 (100.0%) |
| 6 to 18 Years | 33 (24.8%) | 103 (77.4%) |
| 19 to 25 Years | 1 (1.0%) | 98 (99.0%) |
| 25 to 34 Years | 11 (19.3%) | 48 (84.2%) |
| 35 to 44 Years | 4 (6.0%) | 63 (94.0%) |
| 45 to 54 Years | 3 (2.3%) | 132 (100.0%) |
| 55 to 64 Years | 27 (10.5%) | 230 (89.5%) |
| 65 to 74 Years | 158 (90.3%) | 93 (53.1%) |
| 75 Years and over | 165 (98.2%) | 119 (70.8%) |
| Total | 402 (36.7%) | 894 (81.6%) |
Disability Status by Sex by Age in Bay Head borough
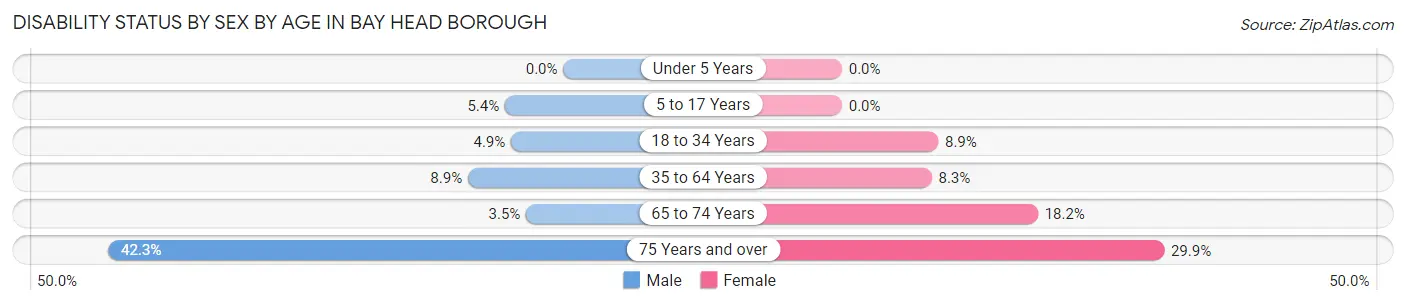
| Age Bracket | Male | Female |
| Under 5 Years | 0 (0.0%) | 0 (0.0%) |
| 5 to 17 Years | 4 (5.4%) | 0 (0.0%) |
| 18 to 34 Years | 5 (4.9%) | 5 (8.9%) |
| 35 to 64 Years | 17 (8.8%) | 22 (8.3%) |
| 65 to 74 Years | 3 (3.5%) | 16 (18.2%) |
| 75 Years and over | 30 (42.2%) | 29 (29.9%) |
Disability Class by Sex by Age in Bay Head borough
Disability Class: Hearing Difficulty
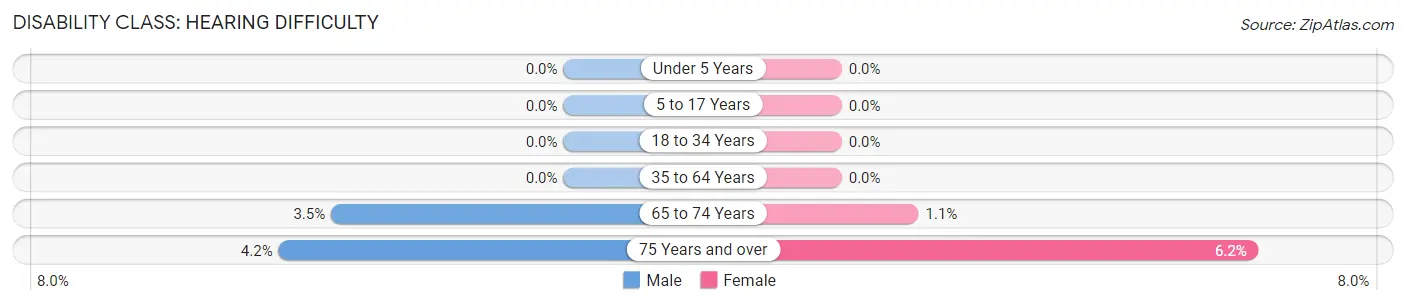
| Age Bracket | Male | Female |
| Under 5 Years | 0 (0.0%) | 0 (0.0%) |
| 5 to 17 Years | 0 (0.0%) | 0 (0.0%) |
| 18 to 34 Years | 0 (0.0%) | 0 (0.0%) |
| 35 to 64 Years | 0 (0.0%) | 0 (0.0%) |
| 65 to 74 Years | 3 (3.5%) | 1 (1.1%) |
| 75 Years and over | 3 (4.2%) | 6 (6.2%) |
Disability Class: Vision Difficulty
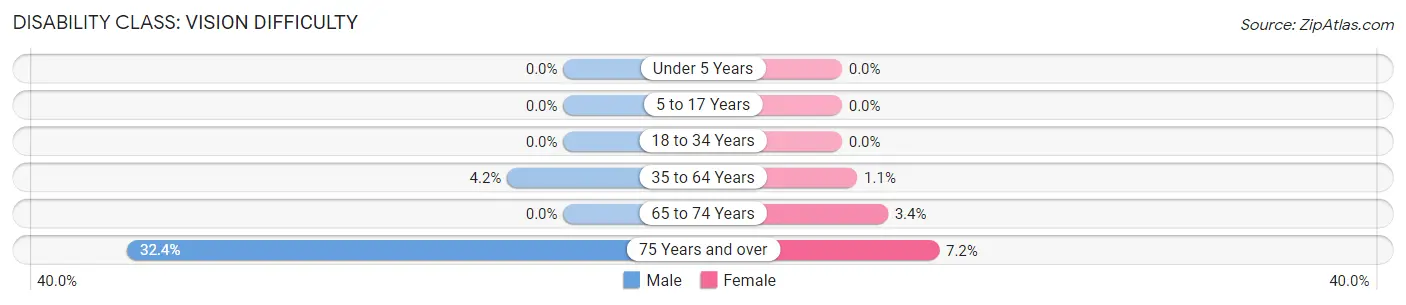
| Age Bracket | Male | Female |
| Under 5 Years | 0 (0.0%) | 0 (0.0%) |
| 5 to 17 Years | 0 (0.0%) | 0 (0.0%) |
| 18 to 34 Years | 0 (0.0%) | 0 (0.0%) |
| 35 to 64 Years | 8 (4.2%) | 3 (1.1%) |
| 65 to 74 Years | 0 (0.0%) | 3 (3.4%) |
| 75 Years and over | 23 (32.4%) | 7 (7.2%) |
Disability Class: Cognitive Difficulty
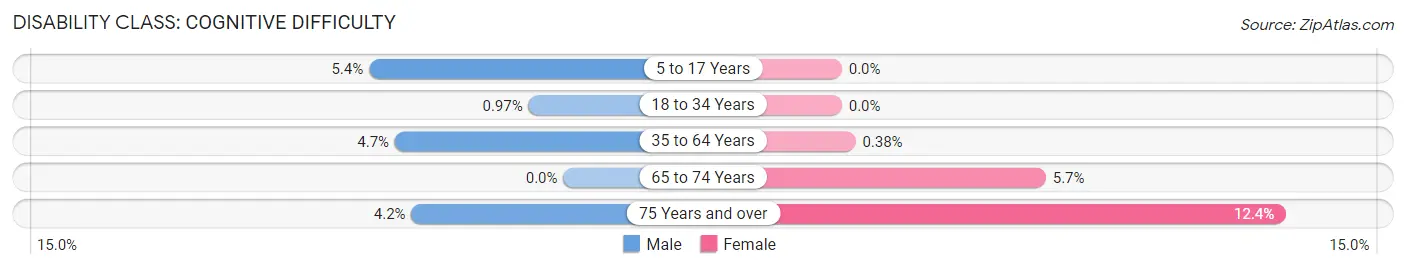
| Age Bracket | Male | Female |
| 5 to 17 Years | 4 (5.4%) | 0 (0.0%) |
| 18 to 34 Years | 1 (1.0%) | 0 (0.0%) |
| 35 to 64 Years | 9 (4.7%) | 1 (0.4%) |
| 65 to 74 Years | 0 (0.0%) | 5 (5.7%) |
| 75 Years and over | 3 (4.2%) | 12 (12.4%) |
Disability Class: Ambulatory Difficulty
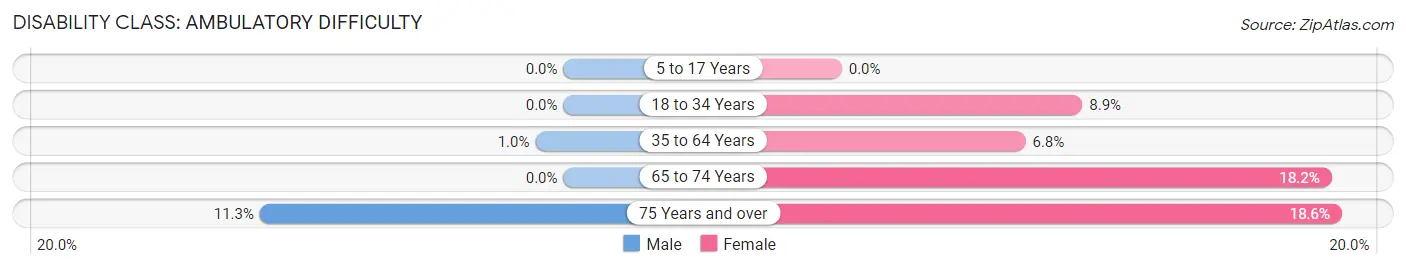
| Age Bracket | Male | Female |
| 5 to 17 Years | 0 (0.0%) | 0 (0.0%) |
| 18 to 34 Years | 0 (0.0%) | 5 (8.9%) |
| 35 to 64 Years | 2 (1.0%) | 18 (6.8%) |
| 65 to 74 Years | 0 (0.0%) | 16 (18.2%) |
| 75 Years and over | 8 (11.3%) | 18 (18.6%) |
Disability Class: Self-Care Difficulty
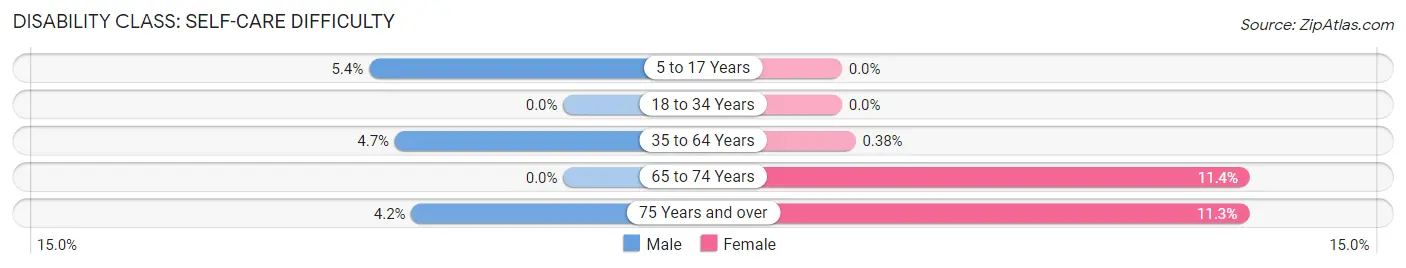
| Age Bracket | Male | Female |
| 5 to 17 Years | 4 (5.4%) | 0 (0.0%) |
| 18 to 34 Years | 0 (0.0%) | 0 (0.0%) |
| 35 to 64 Years | 9 (4.7%) | 1 (0.4%) |
| 65 to 74 Years | 0 (0.0%) | 10 (11.4%) |
| 75 Years and over | 3 (4.2%) | 11 (11.3%) |
Technology Access in Bay Head borough
Computing Device Access in Bay Head borough
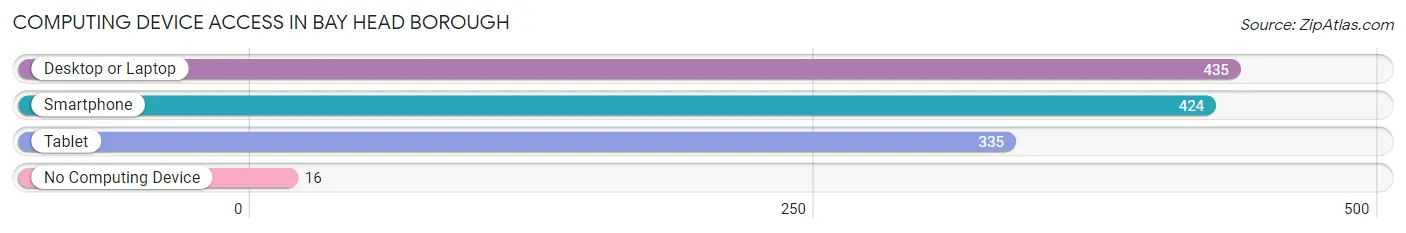
| Device Type | # Households | % Households |
| Desktop or Laptop | 435 | 90.6% |
| Smartphone | 424 | 88.3% |
| Tablet | 335 | 69.8% |
| No Computing Device | 16 | 3.3% |
| Total | 480 | 100.0% |
Internet Access in Bay Head borough
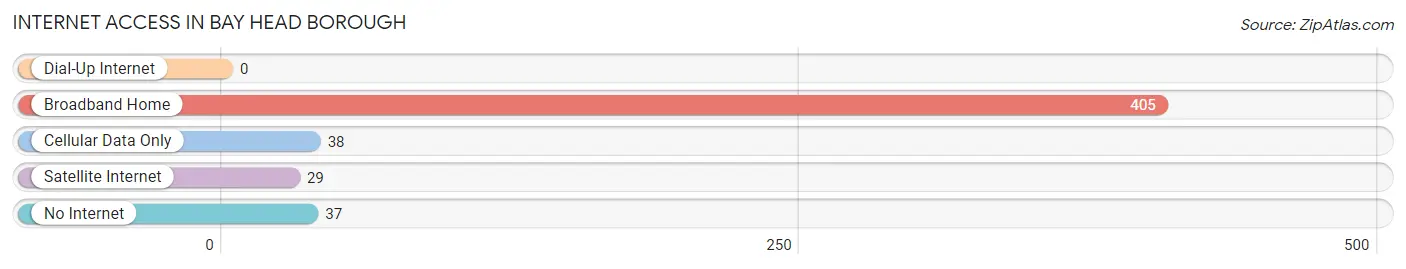
| Internet Type | # Households | % Households |
| Dial-Up Internet | 0 | 0.0% |
| Broadband Home | 405 | 84.4% |
| Cellular Data Only | 38 | 7.9% |
| Satellite Internet | 29 | 6.0% |
| No Internet | 37 | 7.7% |
| Total | 480 | 100.0% |
Bay Head borough Summary
Bay Head Borough is a small borough located in Ocean County, New Jersey. It is situated on the Barnegat Peninsula, a barrier island that separates Barnegat Bay from the Atlantic Ocean. The borough is bordered by Point Pleasant Beach to the north, Mantoloking to the south, and the Atlantic Ocean to the east. As of the 2010 United States Census, the borough had a population of 995, reflecting a decline of 4 (-0.4%) from the 999 counted in the 2000 Census, which had in turn increased by 4 (+0.4%) from the 995 counted in the 1990 Census.
History
The area that is now Bay Head was originally inhabited by the Lenape Native Americans. The first European settlers arrived in the area in the late 17th century. The area was originally known as Bay Head Landing, and was part of Brick Township until it was incorporated as a borough in 1886.
The borough was named for its location at the head of Barnegat Bay. The area was a popular resort destination in the late 19th and early 20th centuries, and many of the borough's Victorian-style homes were built during this period.
Geography
Bay Head is located at 40°04'25" North, 74°02'45" West (40.073611, -74.045833). According to the United States Census Bureau, the borough has a total area of 0.3 square miles (0.8 km2), all of which is land.
Demographics
As of the 2010 United States Census, there were 995 people, 463 households, and 305 families residing in the borough. The population density was 3,541.7 per square mile (1,364.2/km2). There were 602 housing units at an average density of 2,093.3 per square mile (805.2/km2). The racial makeup of the borough was 97.2% White, 0.7% African American, 0.2% Native American, 0.7% Asian, 0.2% from other races, and 1.0% from two or more races. Hispanic or Latino of any race were 1.7% of the population.
There were 463 households, out of which 16.2% had children under the age of 18 living with them, 56.2% were married couples living together, 6.3% had a female householder with no husband present, and 35.3% were non-families. 30.3% of all households were made up of individuals, and 15.2% had someone living alone who was 65 years of age or older. The average household size was 2.14 and the average family size was 2.63.
In the borough, the population was spread out, with 15.2% under the age of 18, 4.2% from 18 to 24, 16.2% from 25 to 44, 36.2% from 45 to 64, and 28.2% who were 65 years of age or older. The median age was 54.2 years. For every 100 females, there were 92.2 males. For every 100 females ages 18 and older there were 91.2 males.
The median income for a household in the borough was $90,000, and the median income for a family was $106,250. Males had a median income of $75,000 versus $50,000 for females. The per capita income for the borough was $63,945. About 1.7% of families and 2.7% of the population were below the poverty line, including 0.0% of those under age 18 and 4.2% of those age 65 or over.
Economy
The economy of Bay Head Borough is largely based on tourism. The borough is home to several popular beaches, including Bay Head Beach, which is a popular destination for swimming, fishing, and other recreational activities. The borough also has several restaurants, shops, and other businesses that cater to tourists. Additionally, the borough is home to several marinas, which provide services to boaters.
Common Questions
What is Per Capita Income in Bay Head borough?
Per Capita income in Bay Head borough is $97,113.
What is the Median Family Income in Bay Head borough?
Median Family Income in Bay Head borough is $205,938.
What is the Median Household income in Bay Head borough?
Median Household Income in Bay Head borough is $127,500.
What is Income or Wage Gap in Bay Head borough?
Income or Wage Gap in Bay Head borough is 7.1%.
Women in Bay Head borough earn 92.9 cents for every dollar earned by a man.
What is Inequality or Gini Index in Bay Head borough?
Inequality or Gini Index in Bay Head borough is 0.54.
What is the Total Population of Bay Head borough?
Total Population of Bay Head borough is 1,096.
What is the Total Male Population of Bay Head borough?
Total Male Population of Bay Head borough is 530.
What is the Total Female Population of Bay Head borough?
Total Female Population of Bay Head borough is 566.
What is the Ratio of Males per 100 Females in Bay Head borough?
There are 93.64 Males per 100 Females in Bay Head borough.
What is the Ratio of Females per 100 Males in Bay Head borough?
There are 106.79 Females per 100 Males in Bay Head borough.
What is the Median Population Age in Bay Head borough?
Median Population Age in Bay Head borough is 57.5 Years.
What is the Average Family Size in Bay Head borough
Average Family Size in Bay Head borough is 3.0 People.
What is the Average Household Size in Bay Head borough
Average Household Size in Bay Head borough is 2.3 People.
How Large is the Labor Force in Bay Head borough?
There are 590 People in the Labor Forcein in Bay Head borough.
What is the Percentage of People in the Labor Force in Bay Head borough?
60.4% of People are in the Labor Force in Bay Head borough.
What is the Unemployment Rate in Bay Head borough?
Unemployment Rate in Bay Head borough is 2.7%.