Delaware Park, NJ Map & Demographics
Delaware Park Map
Delaware Park Overview
$63,453
PER CAPITA INCOME
$118,393
AVG FAMILY INCOME
$112,393
AVG HOUSEHOLD INCOME
12.7%
WAGE / INCOME GAP [ % ]
87.3¢/ $1
WAGE / INCOME GAP [ $ ]
0.16
INEQUALITY / GINI INDEX
344
TOTAL POPULATION
176
MALE POPULATION
168
FEMALE POPULATION
104.76
MALES / 100 FEMALES
95.45
FEMALES / 100 MALES
55.1
MEDIAN AGE
2.3
AVG FAMILY SIZE
2.1
AVG HOUSEHOLD SIZE
242
LABOR FORCE [ PEOPLE ]
70.3%
PERCENT IN LABOR FORCE
Income in Delaware Park
Income Overview in Delaware Park
Per Capita Income in Delaware Park is $63,453, while median incomes of families and households are $118,393 and $112,393 respectively.
| Characteristic | Number | Measure |
| Per Capita Income | 344 | $63,453 |
| Median Family Income | 119 | $118,393 |
| Mean Family Income | 119 | $126,579 |
| Median Household Income | 163 | $112,393 |
| Mean Household Income | 163 | $129,691 |
| Income Deficit | 119 | $0 |
| Wage / Income Gap (%) | 344 | 12.74% |
| Wage / Income Gap ($) | 344 | 87.26¢ per $1 |
| Gini / Inequality Index | 344 | 0.16 |
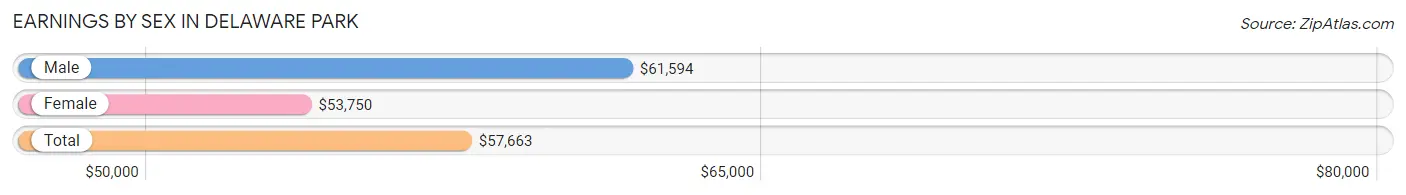
Earnings by Sex in Delaware Park
Average Earnings in Delaware Park are $57,663, $61,594 for men and $53,750 for women, a difference of 12.7%.
| Sex | Number | Average Earnings |
| Male | 155 (51.5%) | $61,594 |
| Female | 146 (48.5%) | $53,750 |
| Total | 301 (100.0%) | $57,663 |
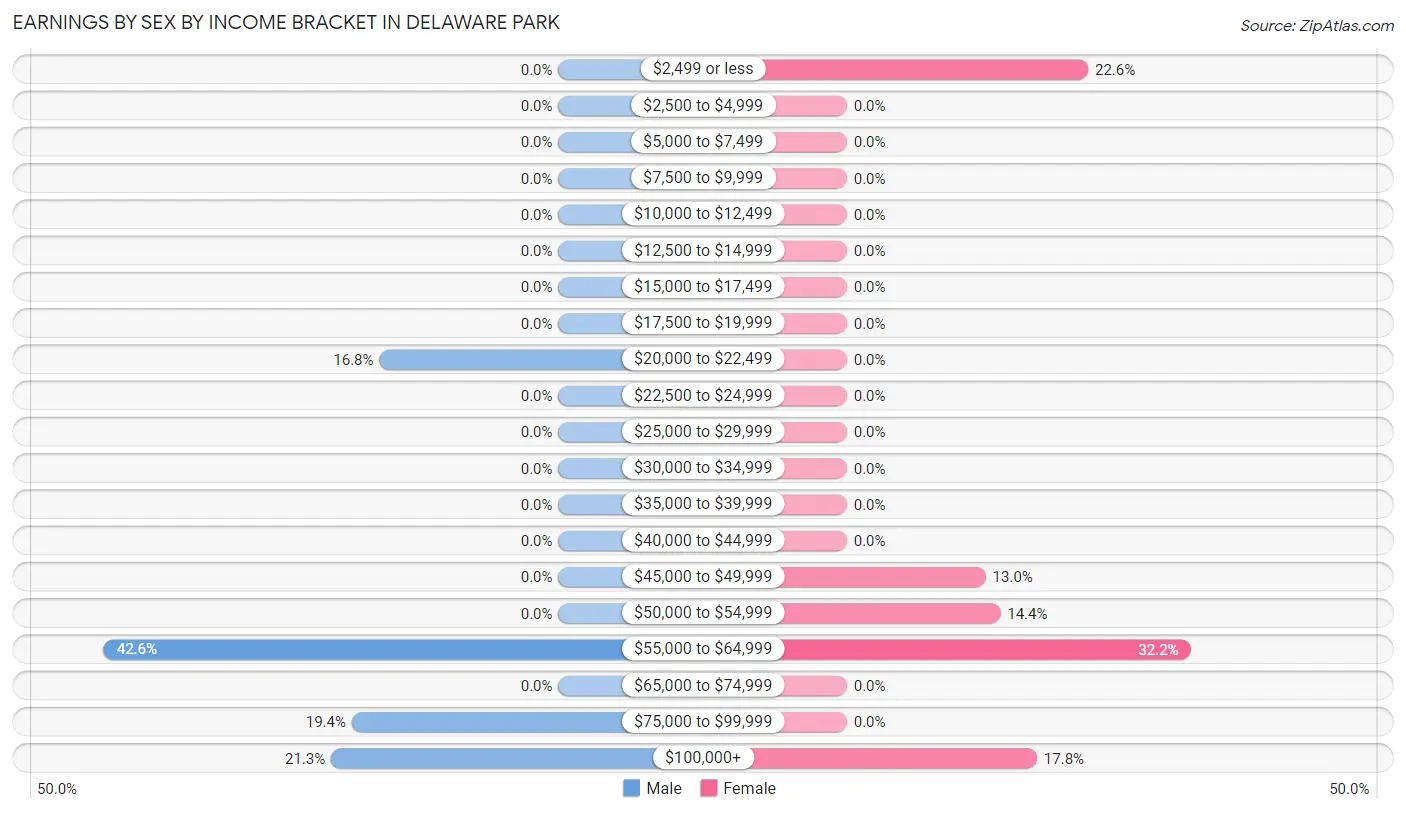
Earnings by Sex by Income Bracket in Delaware Park
The most common earnings brackets in Delaware Park are $55,000 to $64,999 for men (66 | 42.6%) and $55,000 to $64,999 for women (47 | 32.2%).
| Income | Male | Female |
| $2,499 or less | 0 (0.0%) | 33 (22.6%) |
| $2,500 to $4,999 | 0 (0.0%) | 0 (0.0%) |
| $5,000 to $7,499 | 0 (0.0%) | 0 (0.0%) |
| $7,500 to $9,999 | 0 (0.0%) | 0 (0.0%) |
| $10,000 to $12,499 | 0 (0.0%) | 0 (0.0%) |
| $12,500 to $14,999 | 0 (0.0%) | 0 (0.0%) |
| $15,000 to $17,499 | 0 (0.0%) | 0 (0.0%) |
| $17,500 to $19,999 | 0 (0.0%) | 0 (0.0%) |
| $20,000 to $22,499 | 26 (16.8%) | 0 (0.0%) |
| $22,500 to $24,999 | 0 (0.0%) | 0 (0.0%) |
| $25,000 to $29,999 | 0 (0.0%) | 0 (0.0%) |
| $30,000 to $34,999 | 0 (0.0%) | 0 (0.0%) |
| $35,000 to $39,999 | 0 (0.0%) | 0 (0.0%) |
| $40,000 to $44,999 | 0 (0.0%) | 0 (0.0%) |
| $45,000 to $49,999 | 0 (0.0%) | 19 (13.0%) |
| $50,000 to $54,999 | 0 (0.0%) | 21 (14.4%) |
| $55,000 to $64,999 | 66 (42.6%) | 47 (32.2%) |
| $65,000 to $74,999 | 0 (0.0%) | 0 (0.0%) |
| $75,000 to $99,999 | 30 (19.4%) | 0 (0.0%) |
| $100,000+ | 33 (21.3%) | 26 (17.8%) |
| Total | 155 (100.0%) | 146 (100.0%) |
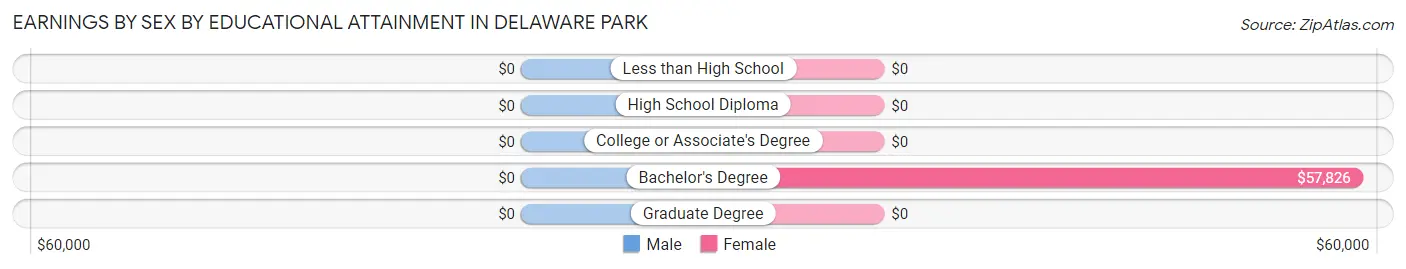
Earnings by Sex by Educational Attainment in Delaware Park
| Educational Attainment | Male Income | Female Income |
| Less than High School | - | - |
| High School Diploma | - | - |
| College or Associate's Degree | - | - |
| Bachelor's Degree | - | - |
| Graduate Degree | - | - |
| Total | $61,594 | $56,719 |
Family Income in Delaware Park
Family Income Brackets in Delaware Park
According to the Delaware Park family income data, there are 47 families falling into the $100,000 to $149,999 income range, which is the most common income bracket and makes up 39.5% of all families.
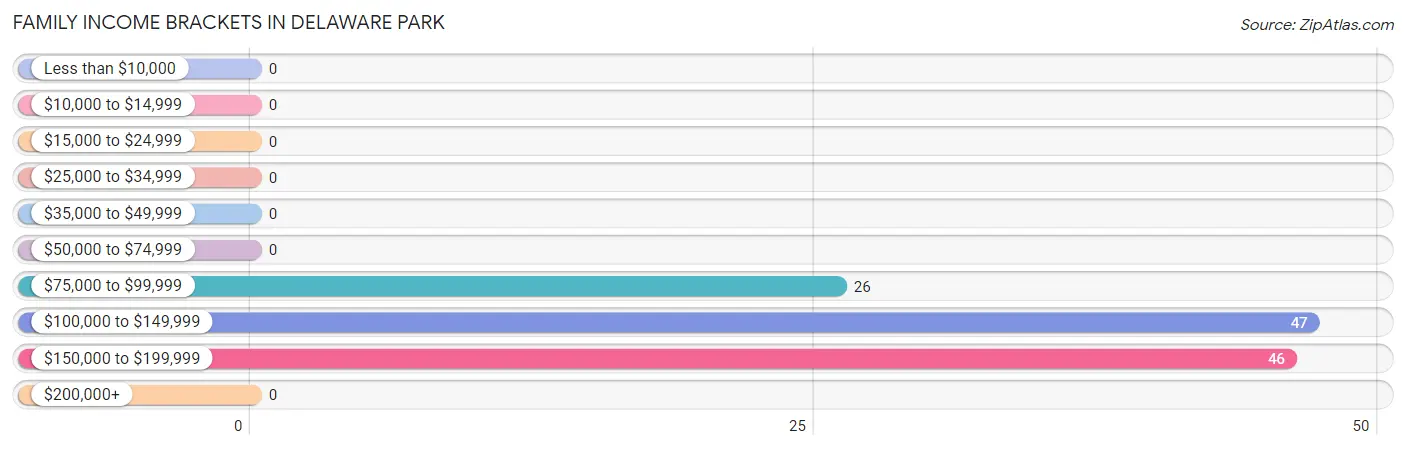
| Income Bracket | # Families | % Families |
| Less than $10,000 | 0 | 0.0% |
| $10,000 to $14,999 | 0 | 0.0% |
| $15,000 to $24,999 | 0 | 0.0% |
| $25,000 to $34,999 | 0 | 0.0% |
| $35,000 to $49,999 | 0 | 0.0% |
| $50,000 to $74,999 | 0 | 0.0% |
| $75,000 to $99,999 | 26 | 21.8% |
| $100,000 to $149,999 | 47 | 39.5% |
| $150,000 to $199,999 | 46 | 38.7% |
| $200,000+ | 0 | 0.0% |
Family Income by Famaliy Size in Delaware Park
2-person families (93 | 78.1%) account for the highest median family income in Delaware Park with $111,971 per family, while 2-person families (93 | 78.1%) have the highest median income of $55,986 per family member.
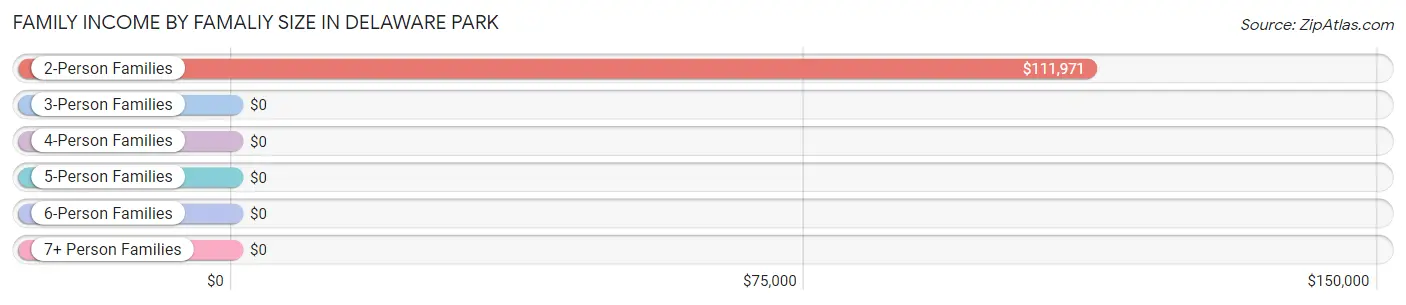
| Income Bracket | # Families | Median Income |
| 2-Person Families | 93 (78.1%) | $111,971 |
| 3-Person Families | 26 (21.8%) | $0 |
| 4-Person Families | 0 (0.0%) | $0 |
| 5-Person Families | 0 (0.0%) | $0 |
| 6-Person Families | 0 (0.0%) | $0 |
| 7+ Person Families | 0 (0.0%) | $0 |
| Total | 119 (100.0%) | $118,393 |
Family Income by Number of Earners in Delaware Park
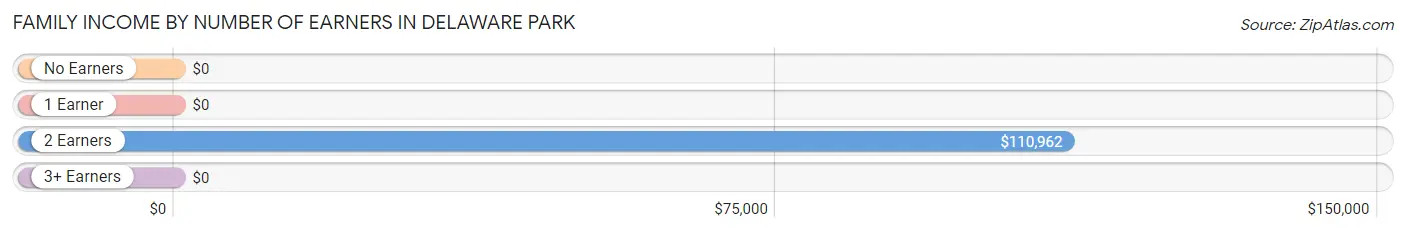
| Number of Earners | # Families | Median Income |
| No Earners | 0 (0.0%) | $0 |
| 1 Earner | 21 (17.6%) | $0 |
| 2 Earners | 72 (60.5%) | $110,962 |
| 3+ Earners | 26 (21.8%) | $0 |
| Total | 119 (100.0%) | $118,393 |
Household Income in Delaware Park
Household Income Brackets in Delaware Park
With 78 households falling in the category, the $100,000 to $149,999 income range is the most frequent in Delaware Park, accounting for 47.8% of all households.
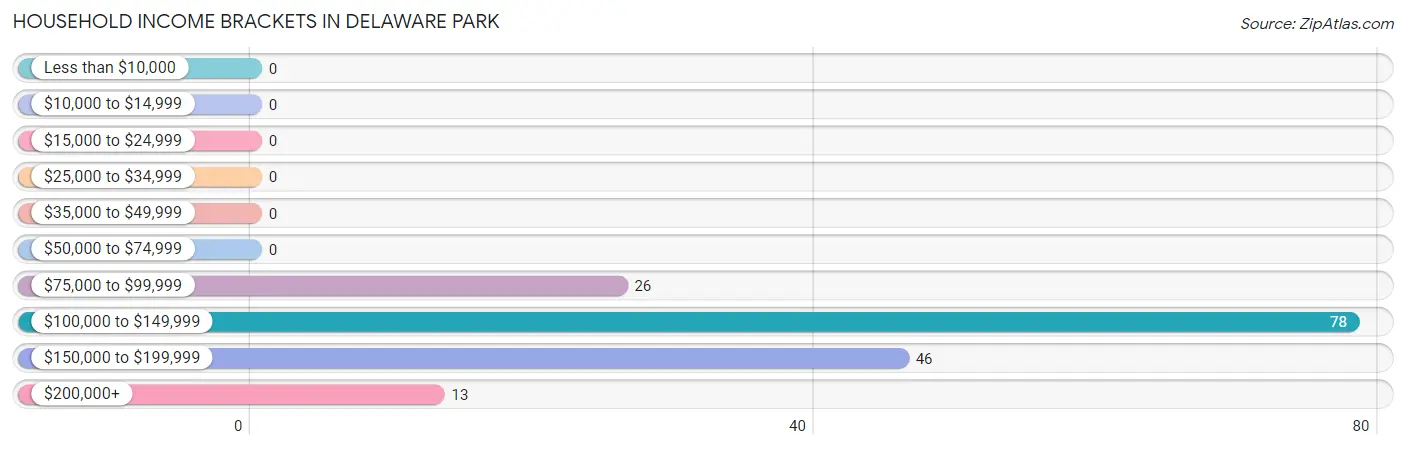
| Income Bracket | # Households | % Households |
| Less than $10,000 | 0 | 0.0% |
| $10,000 to $14,999 | 0 | 0.0% |
| $15,000 to $24,999 | 0 | 0.0% |
| $25,000 to $34,999 | 0 | 0.0% |
| $35,000 to $49,999 | 0 | 0.0% |
| $50,000 to $74,999 | 0 | 0.0% |
| $75,000 to $99,999 | 26 | 16.0% |
| $100,000 to $149,999 | 78 | 47.9% |
| $150,000 to $199,999 | 46 | 28.2% |
| $200,000+ | 13 | 8.0% |
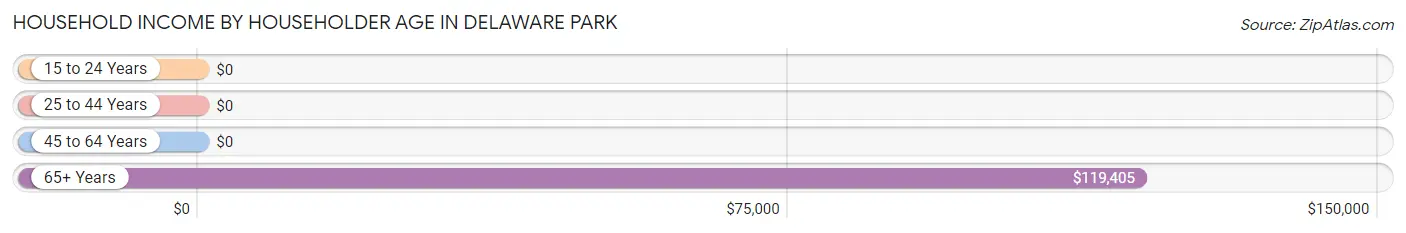
Household Income by Householder Age in Delaware Park
The median household income in Delaware Park is $112,393, with the highest median household income of $119,405 found in the 65+ years age bracket for the primary householder. A total of 50 households (30.7%) fall into this category.
| Income Bracket | # Households | Median Income |
| 15 to 24 Years | 0 (0.0%) | $0 |
| 25 to 44 Years | 26 (16.0%) | $0 |
| 45 to 64 Years | 87 (53.4%) | $0 |
| 65+ Years | 50 (30.7%) | $119,405 |
| Total | 163 (100.0%) | $112,393 |
Poverty in Delaware Park
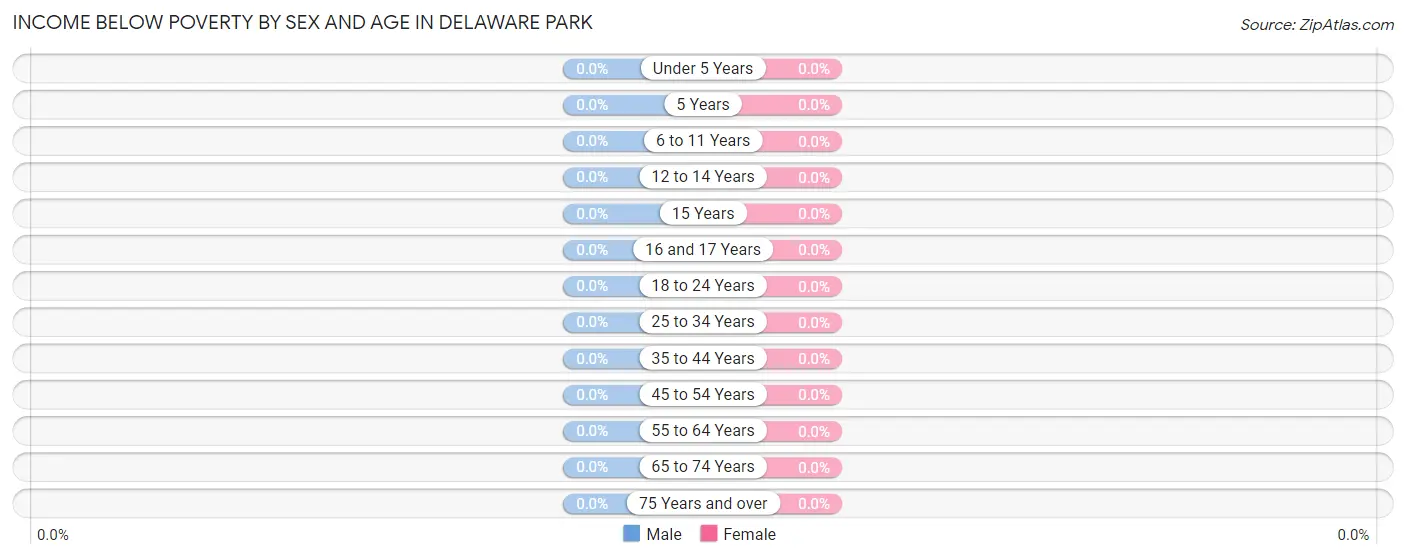
Income Below Poverty by Sex and Age in Delaware Park
| Age Bracket | Male | Female |
| Under 5 Years | 0 (0.0%) | 0 (0.0%) |
| 5 Years | 0 (0.0%) | 0 (0.0%) |
| 6 to 11 Years | 0 (0.0%) | 0 (0.0%) |
| 12 to 14 Years | 0 (0.0%) | 0 (0.0%) |
| 15 Years | 0 (0.0%) | 0 (0.0%) |
| 16 and 17 Years | 0 (0.0%) | 0 (0.0%) |
| 18 to 24 Years | 0 (0.0%) | 0 (0.0%) |
| 25 to 34 Years | 0 (0.0%) | 0 (0.0%) |
| 35 to 44 Years | 0 (0.0%) | 0 (0.0%) |
| 45 to 54 Years | 0 (0.0%) | 0 (0.0%) |
| 55 to 64 Years | 0 (0.0%) | 0 (0.0%) |
| 65 to 74 Years | 0 (0.0%) | 0 (0.0%) |
| 75 Years and over | 0 (0.0%) | 0 (0.0%) |
| Total | 0 (0.0%) | 0 (0.0%) |
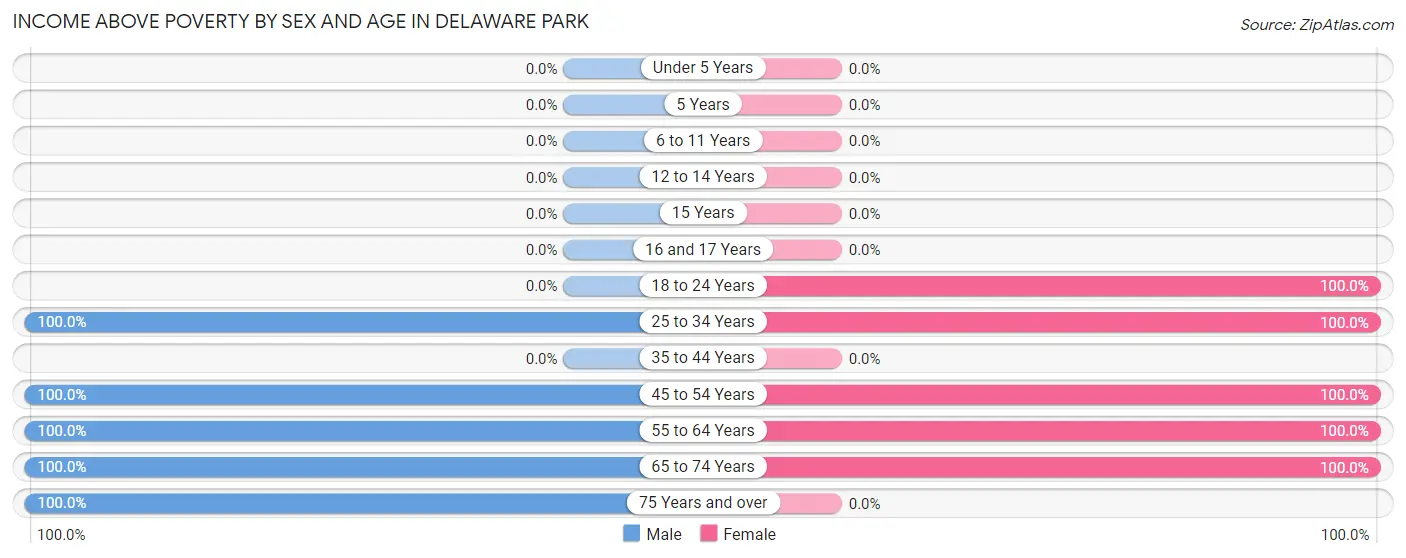
Income Above Poverty by Sex and Age in Delaware Park
According to the poverty statistics in Delaware Park, males aged 25 to 34 years and females aged 18 to 24 years are the age groups that are most secure financially, with 100.0% of males and 100.0% of females in these age groups living above the poverty line.
| Age Bracket | Male | Female |
| Under 5 Years | 0 (0.0%) | 0 (0.0%) |
| 5 Years | 0 (0.0%) | 0 (0.0%) |
| 6 to 11 Years | 0 (0.0%) | 0 (0.0%) |
| 12 to 14 Years | 0 (0.0%) | 0 (0.0%) |
| 15 Years | 0 (0.0%) | 0 (0.0%) |
| 16 and 17 Years | 0 (0.0%) | 0 (0.0%) |
| 18 to 24 Years | 0 (0.0%) | 33 (100.0%) |
| 25 to 34 Years | 26 (100.0%) | 24 (100.0%) |
| 35 to 44 Years | 0 (0.0%) | 0 (0.0%) |
| 45 to 54 Years | 61 (100.0%) | 26 (100.0%) |
| 55 to 64 Years | 39 (100.0%) | 64 (100.0%) |
| 65 to 74 Years | 29 (100.0%) | 21 (100.0%) |
| 75 Years and over | 21 (100.0%) | 0 (0.0%) |
| Total | 176 (100.0%) | 168 (100.0%) |
Income Below Poverty Among Married-Couple Families in Delaware Park
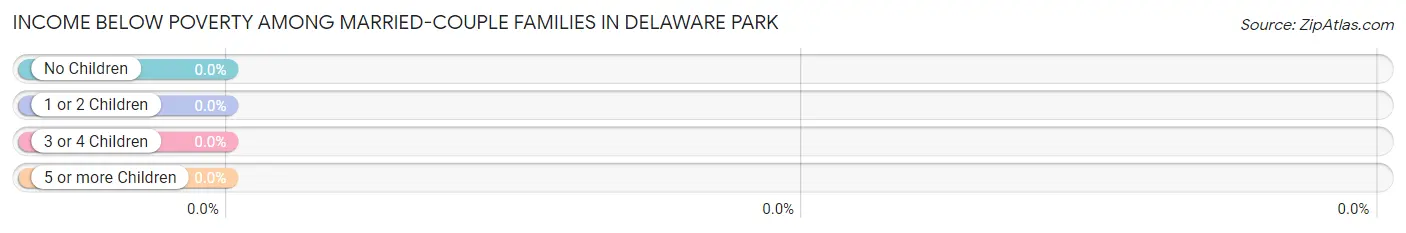
| Children | Above Poverty | Below Poverty |
| No Children | 98 (100.0%) | 0 (0.0%) |
| 1 or 2 Children | 0 (0.0%) | 0 (0.0%) |
| 3 or 4 Children | 0 (0.0%) | 0 (0.0%) |
| 5 or more Children | 0 (0.0%) | 0 (0.0%) |
| Total | 98 (100.0%) | 0 (0.0%) |
Income Below Poverty Among Single-Parent Households in Delaware Park
| Children | Single Father | Single Mother |
| No Children | 0 (0.0%) | 0 (0.0%) |
| 1 or 2 Children | 0 (0.0%) | 0 (0.0%) |
| 3 or 4 Children | 0 (0.0%) | 0 (0.0%) |
| 5 or more Children | 0 (0.0%) | 0 (0.0%) |
| Total | 0 (0.0%) | 0 (0.0%) |
Income Below Poverty Among Married-Couple vs Single-Parent Households in Delaware Park
| Children | Married-Couple Families | Single-Parent Households |
| No Children | 0 (0.0%) | 0 (0.0%) |
| 1 or 2 Children | 0 (0.0%) | 0 (0.0%) |
| 3 or 4 Children | 0 (0.0%) | 0 (0.0%) |
| 5 or more Children | 0 (0.0%) | 0 (0.0%) |
| Total | 0 (0.0%) | 0 (0.0%) |
Race in Delaware Park
The most populous races in Delaware Park are , and White / Caucasian (344 | 100.0%).
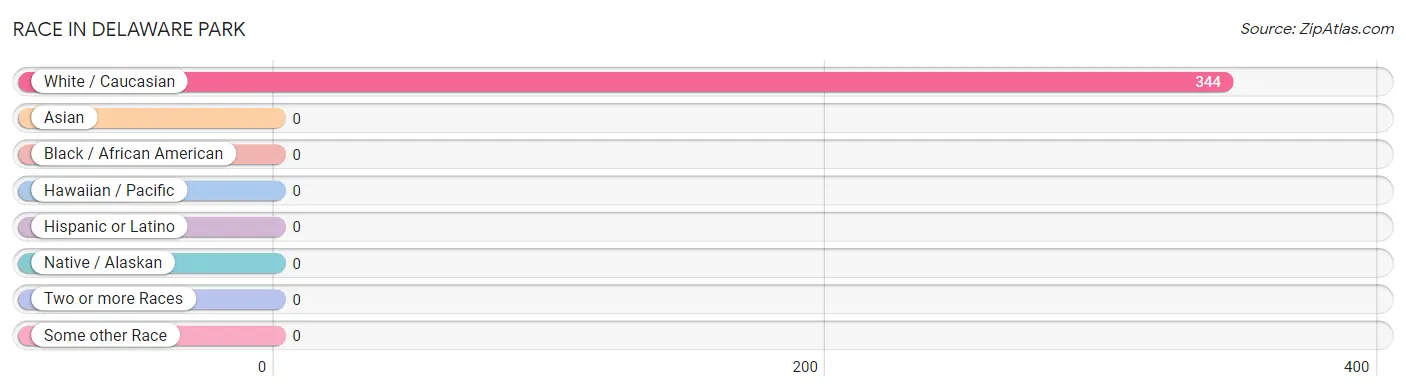
| Race | # Population | % Population |
| Asian | 0 | 0.0% |
| Black / African American | 0 | 0.0% |
| Hawaiian / Pacific | 0 | 0.0% |
| Hispanic or Latino | 0 | 0.0% |
| Native / Alaskan | 0 | 0.0% |
| White / Caucasian | 344 | 100.0% |
| Two or more Races | 0 | 0.0% |
| Some other Race | 0 | 0.0% |
| Total | 344 | 100.0% |
Ancestry in Delaware Park
The most populous ancestries reported in Delaware Park are Italian (146 | 42.4%), Irish (100 | 29.1%), German (65 | 18.9%), Slovak (57 | 16.6%), and French Canadian (31 | 9.0%), together accounting for 116.0% of all Delaware Park residents.
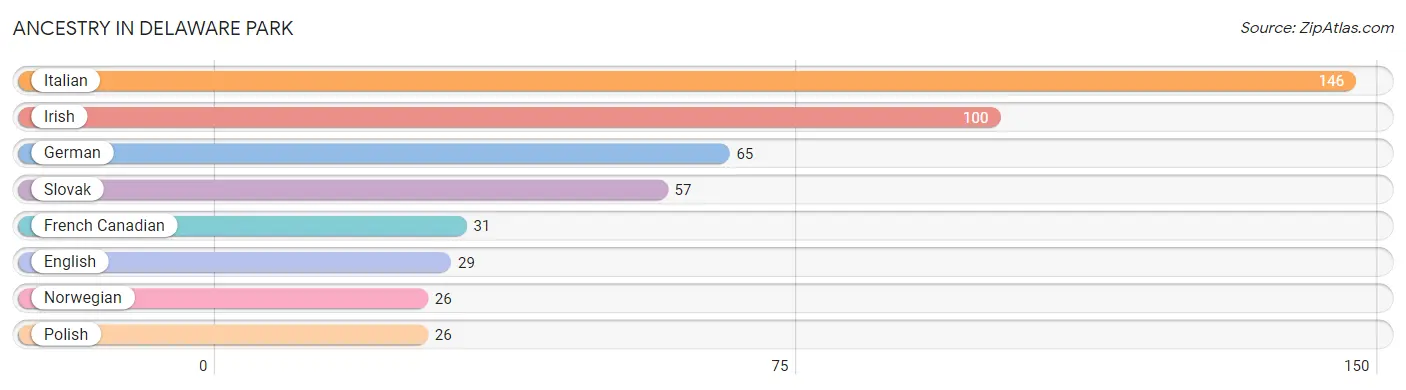
| Ancestry | # Population | % Population |
| English | 29 | 8.4% |
| French Canadian | 31 | 9.0% |
| German | 65 | 18.9% |
| Irish | 100 | 29.1% |
| Italian | 146 | 42.4% |
| Norwegian | 26 | 7.6% |
| Polish | 26 | 7.6% |
| Slovak | 57 | 16.6% | View All 8 Rows |
Immigrants in Delaware Park

| Immigration Origin | # Population | % Population | View All 0 Rows |
Sex and Age in Delaware Park
Sex and Age in Delaware Park
The most populous age groups in Delaware Park are 50 to 54 Years (31 | 17.6%) for men and 55 to 59 Years (41 | 24.4%) for women.
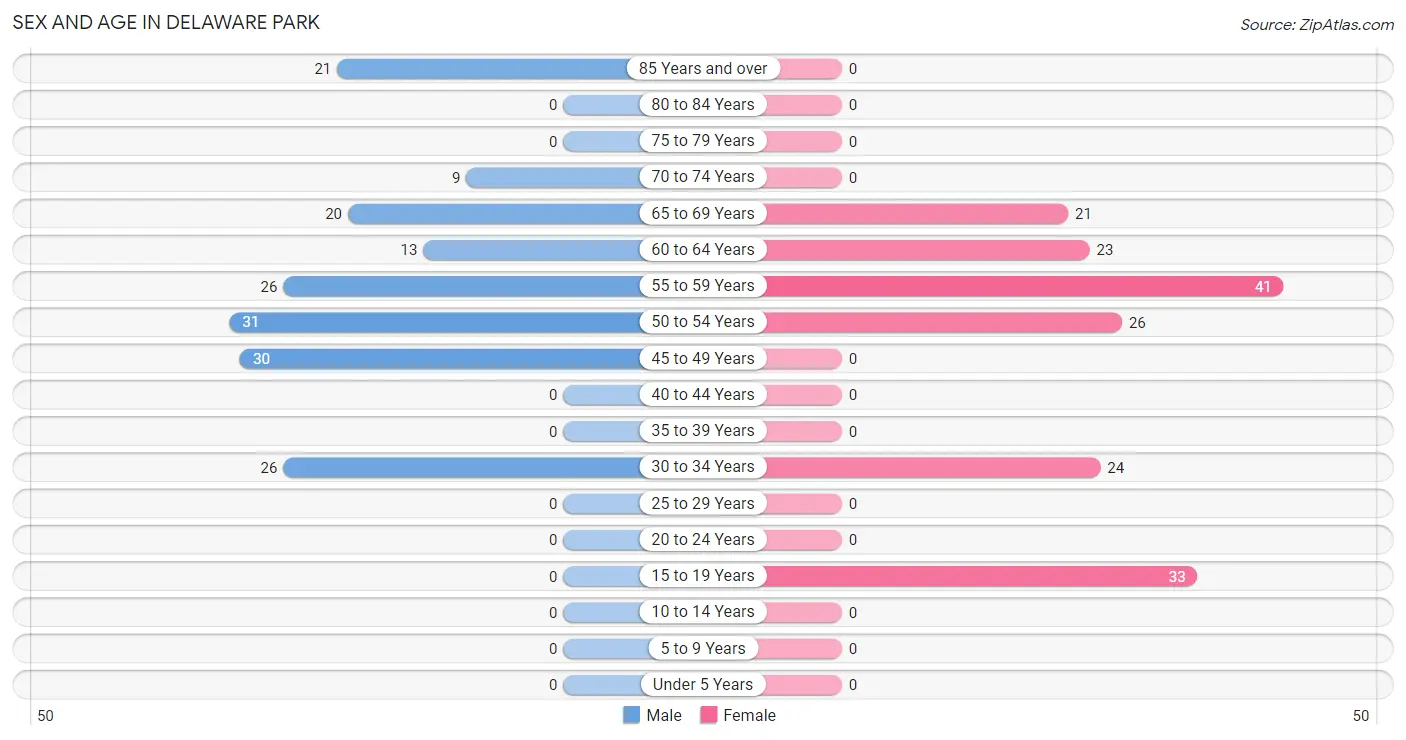
| Age Bracket | Male | Female |
| Under 5 Years | 0 (0.0%) | 0 (0.0%) |
| 5 to 9 Years | 0 (0.0%) | 0 (0.0%) |
| 10 to 14 Years | 0 (0.0%) | 0 (0.0%) |
| 15 to 19 Years | 0 (0.0%) | 33 (19.6%) |
| 20 to 24 Years | 0 (0.0%) | 0 (0.0%) |
| 25 to 29 Years | 0 (0.0%) | 0 (0.0%) |
| 30 to 34 Years | 26 (14.8%) | 24 (14.3%) |
| 35 to 39 Years | 0 (0.0%) | 0 (0.0%) |
| 40 to 44 Years | 0 (0.0%) | 0 (0.0%) |
| 45 to 49 Years | 30 (17.1%) | 0 (0.0%) |
| 50 to 54 Years | 31 (17.6%) | 26 (15.5%) |
| 55 to 59 Years | 26 (14.8%) | 41 (24.4%) |
| 60 to 64 Years | 13 (7.4%) | 23 (13.7%) |
| 65 to 69 Years | 20 (11.4%) | 21 (12.5%) |
| 70 to 74 Years | 9 (5.1%) | 0 (0.0%) |
| 75 to 79 Years | 0 (0.0%) | 0 (0.0%) |
| 80 to 84 Years | 0 (0.0%) | 0 (0.0%) |
| 85 Years and over | 21 (11.9%) | 0 (0.0%) |
| Total | 176 (100.0%) | 168 (100.0%) |
Families and Households in Delaware Park
Median Family Size in Delaware Park
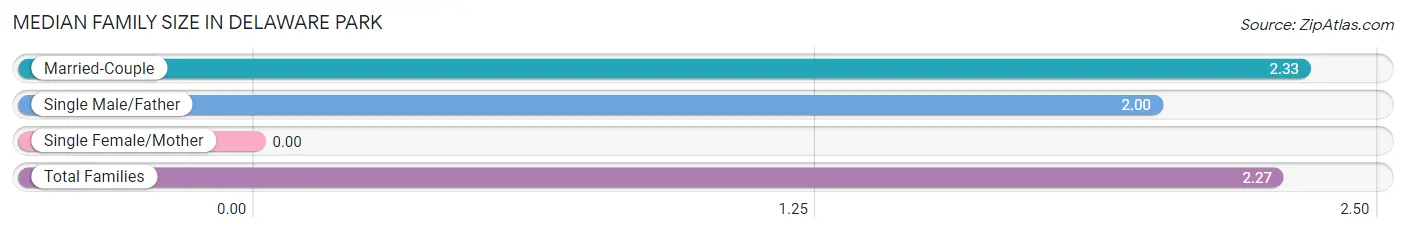
| Family Type | # Families | Family Size |
| Married-Couple | 98 (82.4%) | 2.33 |
| Single Male/Father | 21 (17.6%) | 2.00 |
| Single Female/Mother | 0 (0.0%) | - |
| Total Families | 119 (100.0%) | 2.27 |
Median Household Size in Delaware Park
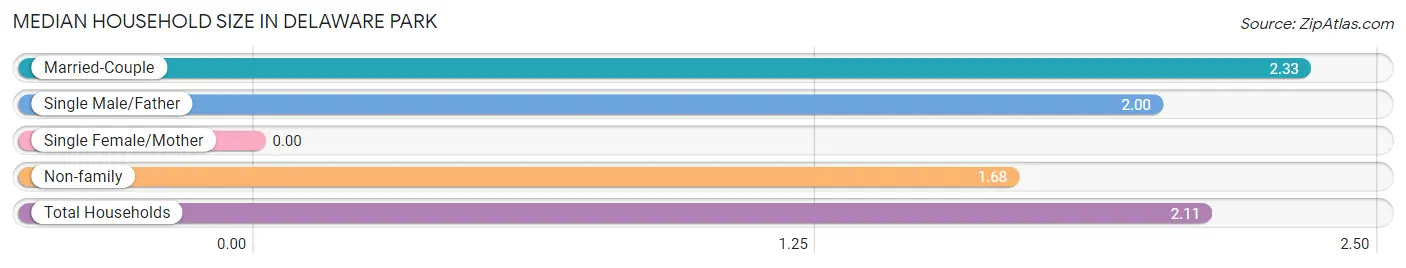
| Household Type | # Households | Household Size |
| Married-Couple | 98 (60.1%) | 2.33 |
| Single Male/Father | 21 (12.9%) | 2.00 |
| Single Female/Mother | 0 (0.0%) | - |
| Non-family | 44 (27.0%) | 1.68 |
| Total Households | 163 (100.0%) | 2.11 |
Household Size by Marriage Status in Delaware Park
Out of a total of 163 households in Delaware Park, 119 (73.0%) are family households, while 44 (27.0%) are nonfamily households. The most numerous type of family households are 2-person households, comprising 93, and the most common type of nonfamily households are 1-person households, comprising 22.
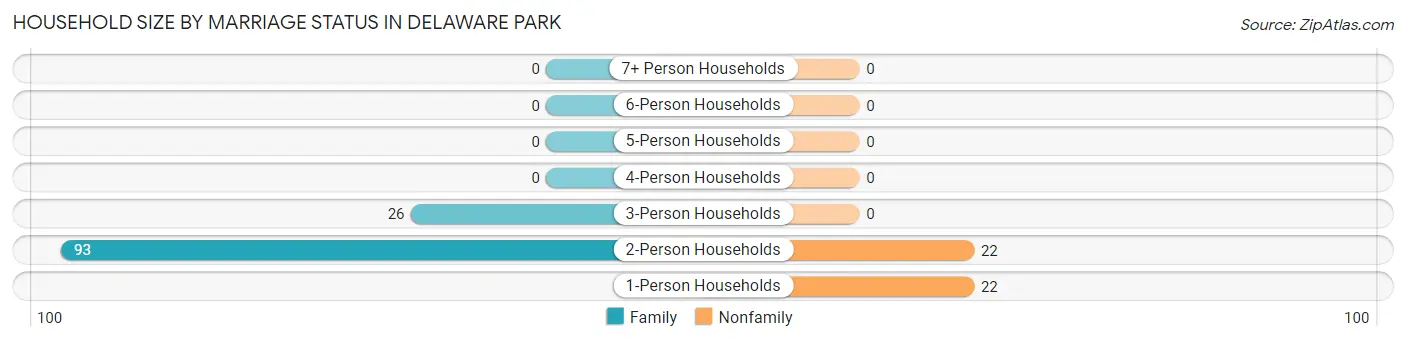
| Household Size | Family Households | Nonfamily Households |
| 1-Person Households | - | 22 (13.5%) |
| 2-Person Households | 93 (57.1%) | 22 (13.5%) |
| 3-Person Households | 26 (16.0%) | 0 (0.0%) |
| 4-Person Households | 0 (0.0%) | 0 (0.0%) |
| 5-Person Households | 0 (0.0%) | 0 (0.0%) |
| 6-Person Households | 0 (0.0%) | 0 (0.0%) |
| 7+ Person Households | 0 (0.0%) | 0 (0.0%) |
| Total | 119 (73.0%) | 44 (27.0%) |
Female Fertility in Delaware Park
Fertility by Age in Delaware Park
| Age Bracket | Women with Births | Births / 1,000 Women |
| 15 to 19 years | 0 (0.0%) | 0.0 |
| 20 to 34 years | 0 (0.0%) | 0.0 |
| 35 to 50 years | 0 (0.0%) | 0.0 |
| Total | 0 (0.0%) | 0.0 |
Fertility by Age by Marriage Status in Delaware Park
| Age Bracket | Married | Unmarried |
| 15 to 19 years | 0 (0.0%) | 0 (0.0%) |
| 20 to 34 years | 0 (0.0%) | 0 (0.0%) |
| 35 to 50 years | 0 (0.0%) | 0 (0.0%) |
| Total | 0 (0.0%) | 0 (0.0%) |
Fertility by Education in Delaware Park
| Educational Attainment | Women with Births | Births / 1,000 Women |
| Less than High School | 0 (0.0%) | 0.0 |
| High School Diploma | 0 (0.0%) | 0.0 |
| College or Associate's Degree | 0 (0.0%) | 0.0 |
| Bachelor's Degree | 0 (0.0%) | 0.0 |
| Graduate Degree | 0 (0.0%) | 0.0 |
| Total | 0 (0.0%) | 0.0 |
Fertility by Education by Marriage Status in Delaware Park
| Educational Attainment | Married | Unmarried |
| Less than High School | 0 (0.0%) | 0 (0.0%) |
| High School Diploma | 0 (0.0%) | 0 (0.0%) |
| College or Associate's Degree | 0 (0.0%) | 0 (0.0%) |
| Bachelor's Degree | 0 (0.0%) | 0 (0.0%) |
| Graduate Degree | 0 (0.0%) | 0 (0.0%) |
| Total | 0 (0.0%) | 0 (0.0%) |
Employment Characteristics in Delaware Park
Employment by Class of Employer in Delaware Park
Among the 242 employed individuals in Delaware Park, private company employees (107 | 44.2%), local government employees (81 | 33.5%), and self-employed (incorporated) (35 | 14.5%) make up the most common classes of employment.
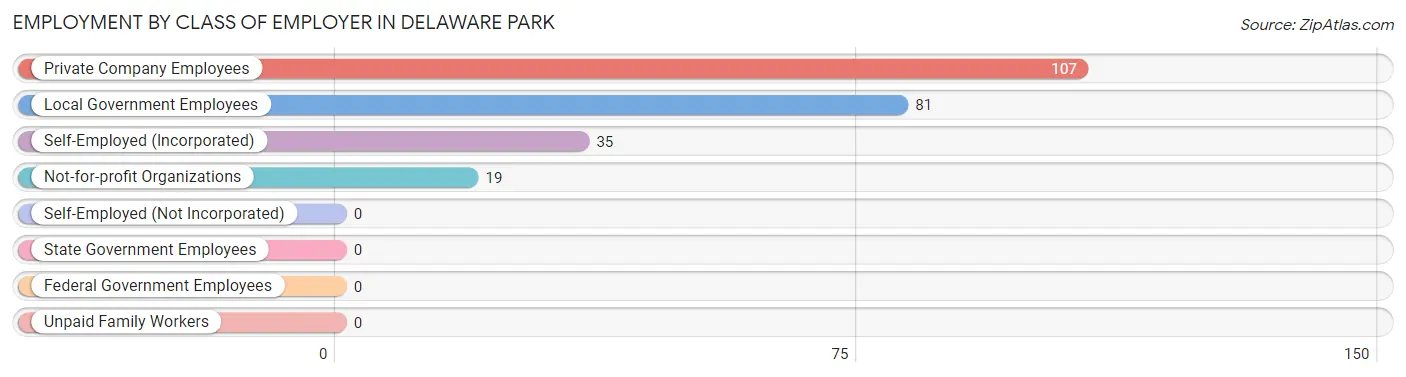
| Employer Class | # Employees | % Employees |
| Private Company Employees | 107 | 44.2% |
| Self-Employed (Incorporated) | 35 | 14.5% |
| Self-Employed (Not Incorporated) | 0 | 0.0% |
| Not-for-profit Organizations | 19 | 7.9% |
| Local Government Employees | 81 | 33.5% |
| State Government Employees | 0 | 0.0% |
| Federal Government Employees | 0 | 0.0% |
| Unpaid Family Workers | 0 | 0.0% |
| Total | 242 | 100.0% |
Employment Status by Age in Delaware Park
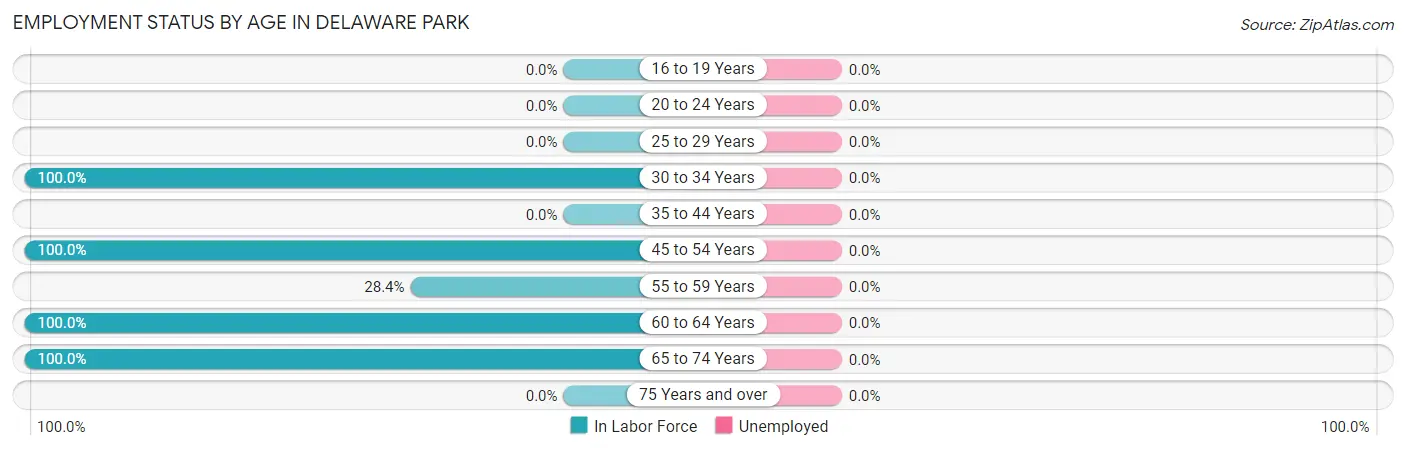
| Age Bracket | In Labor Force | Unemployed |
| 16 to 19 Years | 0 (0.0%) | 0 (0.0%) |
| 20 to 24 Years | 0 (0.0%) | 0 (0.0%) |
| 25 to 29 Years | 0 (0.0%) | 0 (0.0%) |
| 30 to 34 Years | 50 (100.0%) | 0 (0.0%) |
| 35 to 44 Years | 0 (0.0%) | 0 (0.0%) |
| 45 to 54 Years | 87 (100.0%) | 0 (0.0%) |
| 55 to 59 Years | 19 (28.4%) | 0 (0.0%) |
| 60 to 64 Years | 36 (100.0%) | 0 (0.0%) |
| 65 to 74 Years | 50 (100.0%) | 0 (0.0%) |
| 75 Years and over | 0 (0.0%) | 0 (0.0%) |
| Total | 242 (70.3%) | 0 (0.0%) |
Employment Status by Educational Attainment in Delaware Park
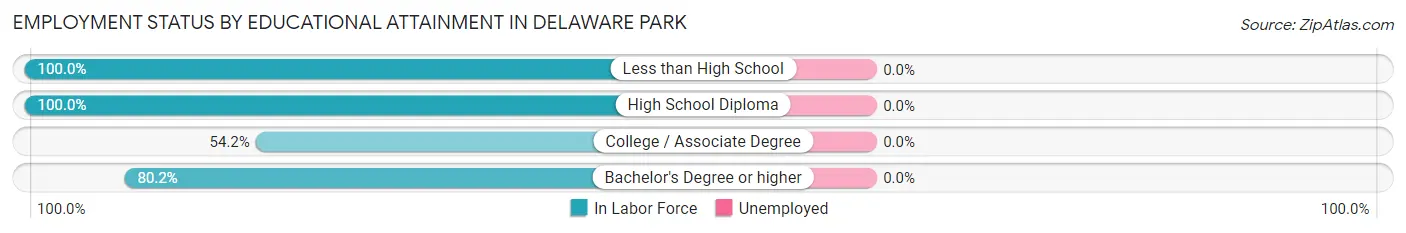
| Educational Attainment | In Labor Force | Unemployed |
| Less than High School | 30 (100.0%) | 0 (0.0%) |
| High School Diploma | 31 (100.0%) | 0 (0.0%) |
| College / Associate Degree | 26 (54.2%) | 0 (0.0%) |
| Bachelor's Degree or higher | 105 (80.2%) | 0 (0.0%) |
| Total | 192 (80.0%) | 0 (0.0%) |
Employment Occupations by Sex in Delaware Park
Management, Business, Science and Arts Occupations
The most common Management, Business, Science and Arts occupations in Delaware Park are Community & Social Service (50 | 20.7%), Education Instruction & Library (50 | 20.7%), Management (35 | 14.5%), Computers, Engineering & Science (33 | 13.6%), and Computers & Mathematics (20 | 8.3%).
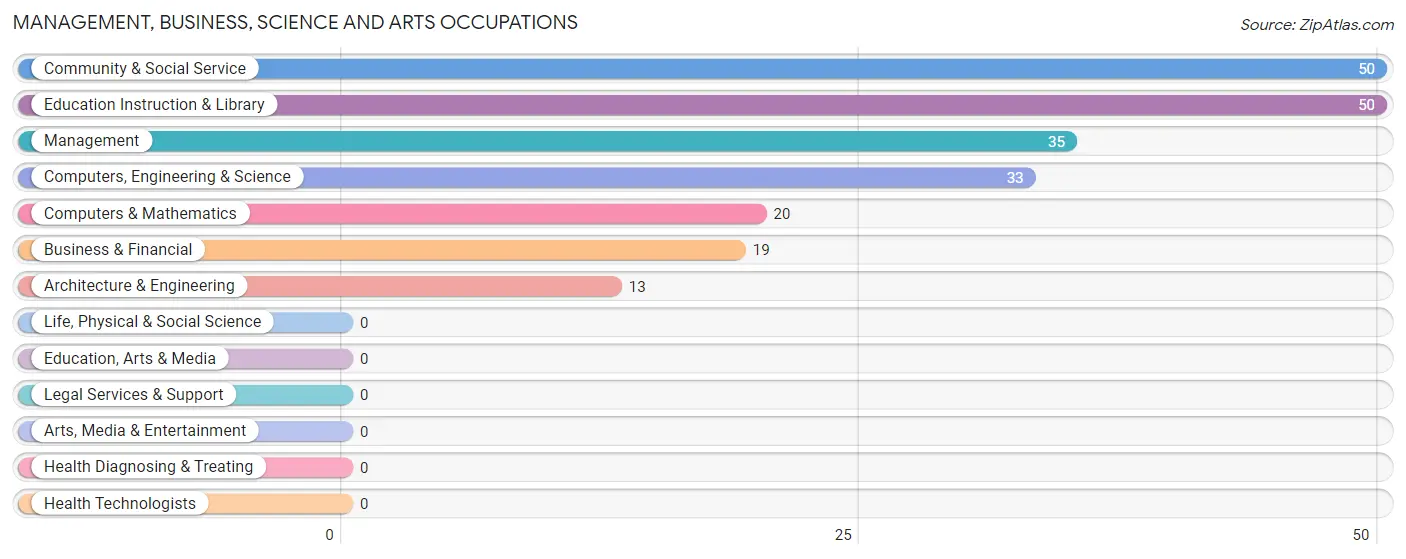
Management, Business, Science and Arts Occupations by Sex
Within the Management, Business, Science and Arts occupations in Delaware Park, the most male-oriented occupations are Management (100.0%), Computers, Engineering & Science (100.0%), and Computers & Mathematics (100.0%), while the most female-oriented occupations are Business & Financial (100.0%), Community & Social Service (100.0%), and Education Instruction & Library (100.0%).
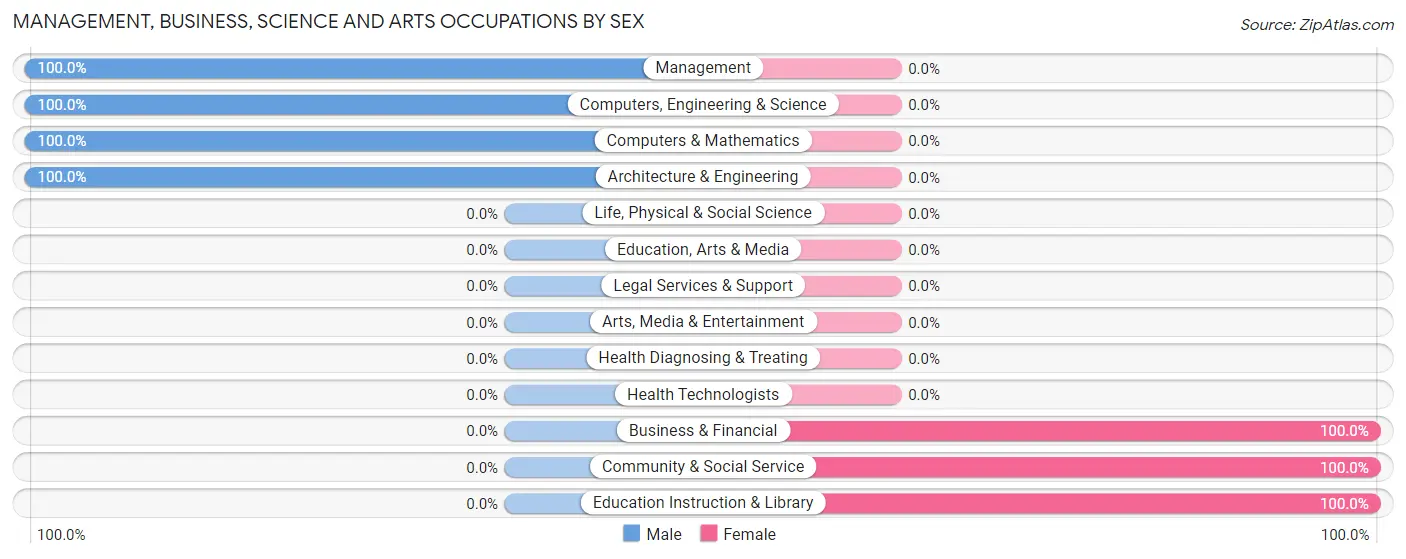
| Occupation | Male | Female |
| Management | 35 (100.0%) | 0 (0.0%) |
| Business & Financial | 0 (0.0%) | 19 (100.0%) |
| Computers, Engineering & Science | 33 (100.0%) | 0 (0.0%) |
| Computers & Mathematics | 20 (100.0%) | 0 (0.0%) |
| Architecture & Engineering | 13 (100.0%) | 0 (0.0%) |
| Life, Physical & Social Science | 0 (0.0%) | 0 (0.0%) |
| Community & Social Service | 0 (0.0%) | 50 (100.0%) |
| Education, Arts & Media | 0 (0.0%) | 0 (0.0%) |
| Legal Services & Support | 0 (0.0%) | 0 (0.0%) |
| Education Instruction & Library | 0 (0.0%) | 50 (100.0%) |
| Arts, Media & Entertainment | 0 (0.0%) | 0 (0.0%) |
| Health Diagnosing & Treating | 0 (0.0%) | 0 (0.0%) |
| Health Technologists | 0 (0.0%) | 0 (0.0%) |
| Total (Category) | 68 (49.6%) | 69 (50.4%) |
| Total (Overall) | 129 (53.3%) | 113 (46.7%) |
Services Occupations
The most common Services occupations in Delaware Park are , and Cleaning & Maintenance (31 | 12.8%).
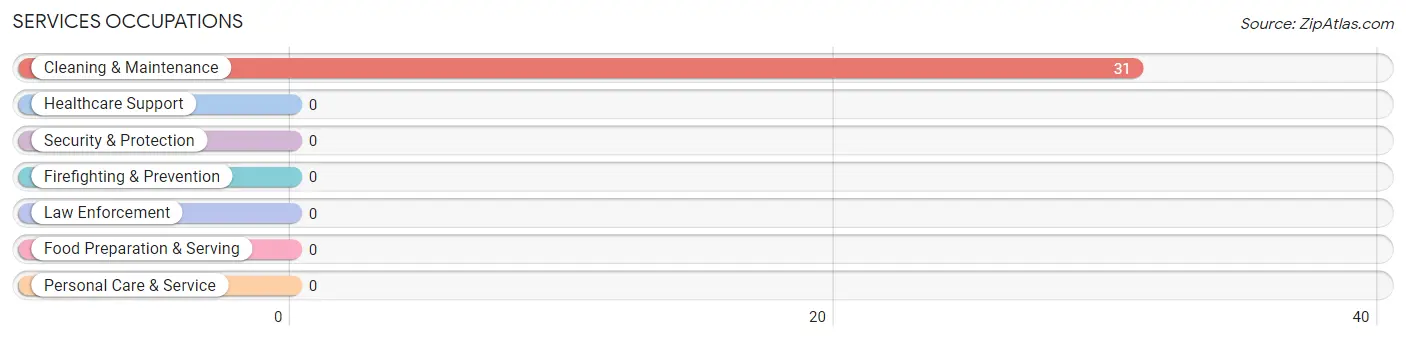
Services Occupations by Sex
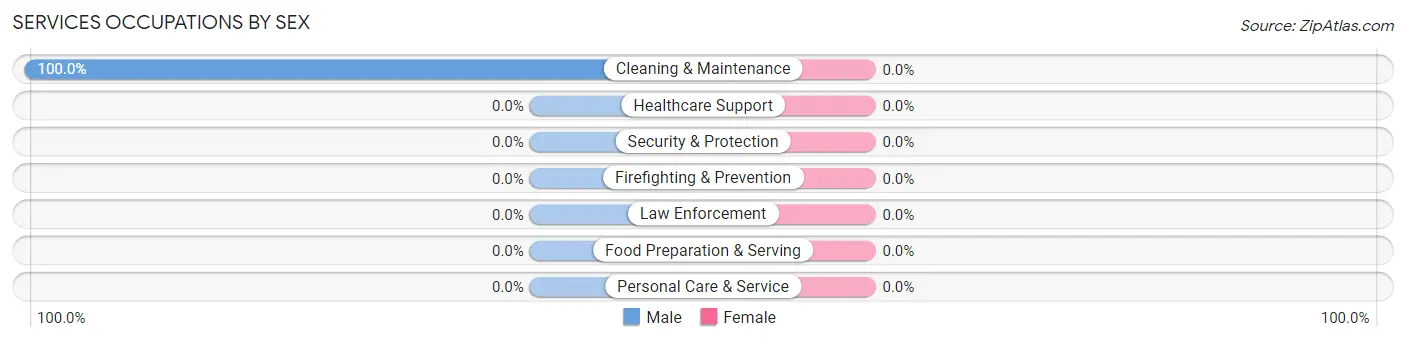
| Occupation | Male | Female |
| Healthcare Support | 0 (0.0%) | 0 (0.0%) |
| Security & Protection | 0 (0.0%) | 0 (0.0%) |
| Firefighting & Prevention | 0 (0.0%) | 0 (0.0%) |
| Law Enforcement | 0 (0.0%) | 0 (0.0%) |
| Food Preparation & Serving | 0 (0.0%) | 0 (0.0%) |
| Cleaning & Maintenance | 31 (100.0%) | 0 (0.0%) |
| Personal Care & Service | 0 (0.0%) | 0 (0.0%) |
| Total (Category) | 31 (100.0%) | 0 (0.0%) |
| Total (Overall) | 129 (53.3%) | 113 (46.7%) |
Sales and Office Occupations
The most common Sales and Office occupations in Delaware Park are , and Office & Administration (44 | 18.2%).

Sales and Office Occupations by Sex

| Occupation | Male | Female |
| Sales & Related | 0 (0.0%) | 0 (0.0%) |
| Office & Administration | 0 (0.0%) | 44 (100.0%) |
| Total (Category) | 0 (0.0%) | 44 (100.0%) |
| Total (Overall) | 129 (53.3%) | 113 (46.7%) |
Natural Resources, Construction and Maintenance Occupations

Natural Resources, Construction and Maintenance Occupations by Sex
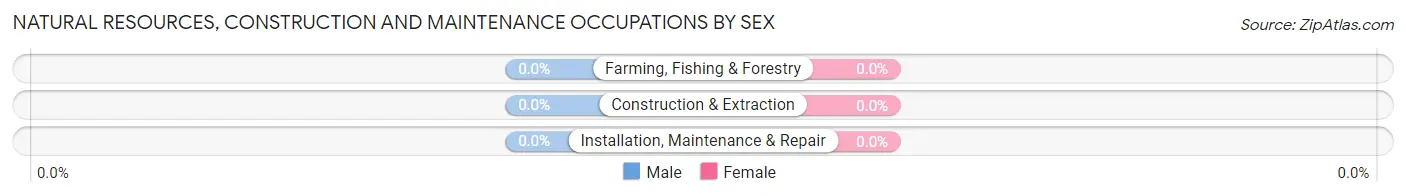
| Occupation | Male | Female |
| Farming, Fishing & Forestry | 0 (0.0%) | 0 (0.0%) |
| Construction & Extraction | 0 (0.0%) | 0 (0.0%) |
| Installation, Maintenance & Repair | 0 (0.0%) | 0 (0.0%) |
| Total (Category) | 0 (0.0%) | 0 (0.0%) |
| Total (Overall) | 129 (53.3%) | 113 (46.7%) |
Production, Transportation and Moving Occupations
The most common Production, Transportation and Moving occupations in Delaware Park are , and Transportation (30 | 12.4%).
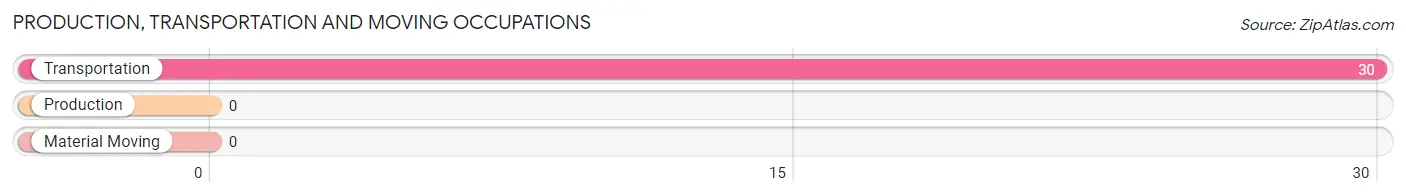
Production, Transportation and Moving Occupations by Sex
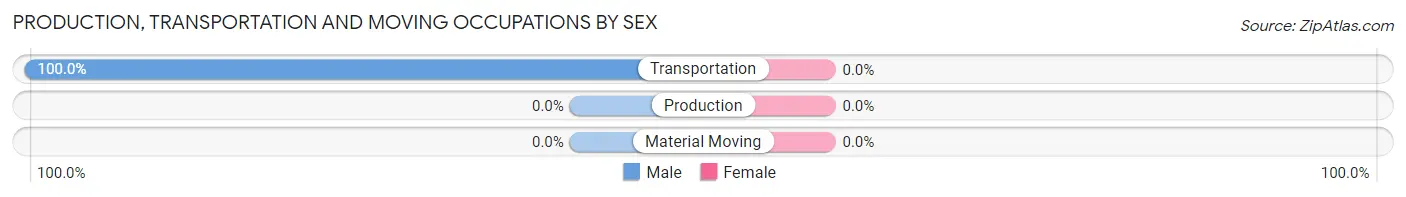
| Occupation | Male | Female |
| Production | 0 (0.0%) | 0 (0.0%) |
| Transportation | 30 (100.0%) | 0 (0.0%) |
| Material Moving | 0 (0.0%) | 0 (0.0%) |
| Total (Category) | 30 (100.0%) | 0 (0.0%) |
| Total (Overall) | 129 (53.3%) | 113 (46.7%) |
Employment Industries by Sex in Delaware Park
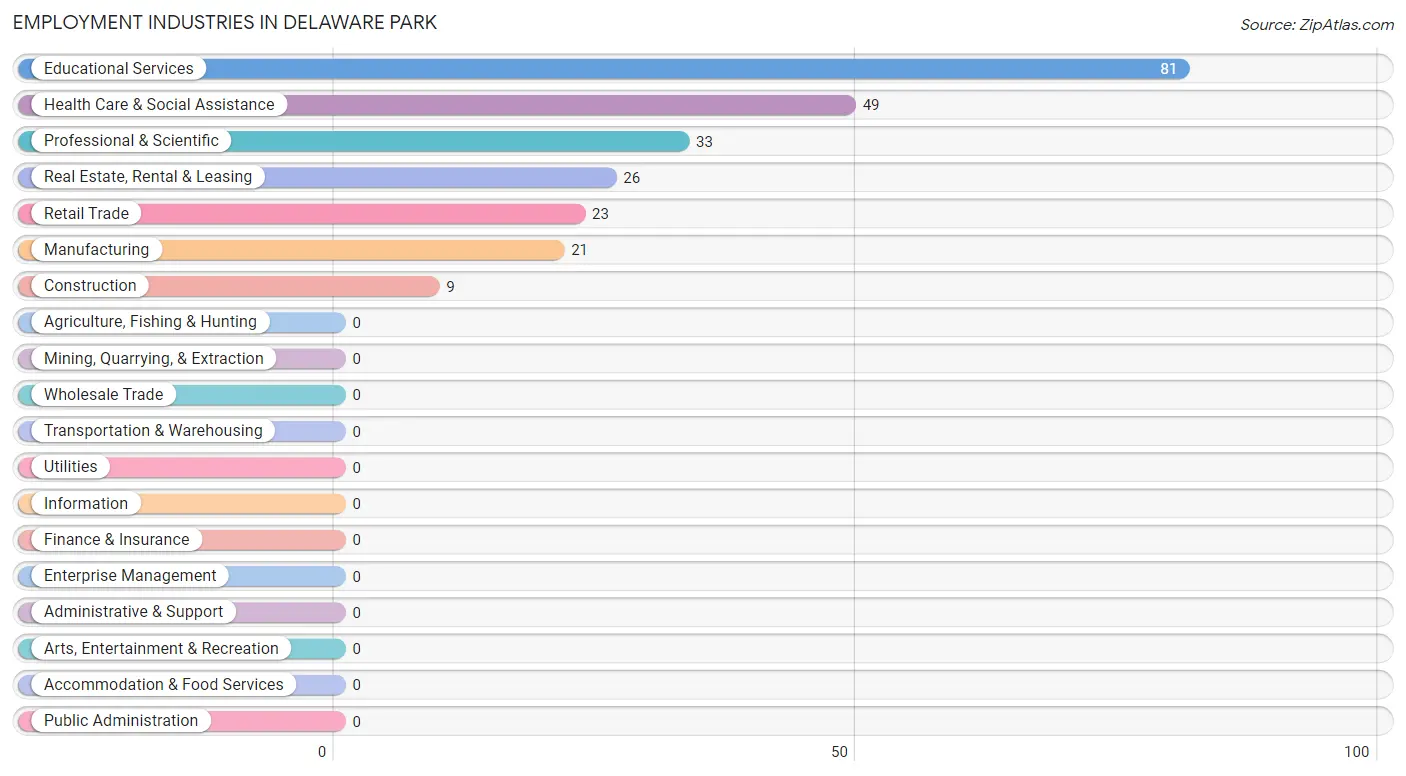
Employment Industries in Delaware Park
The major employment industries in Delaware Park include Educational Services (81 | 33.5%), Health Care & Social Assistance (49 | 20.3%), Professional & Scientific (33 | 13.6%), Real Estate, Rental & Leasing (26 | 10.7%), and Retail Trade (23 | 9.5%).
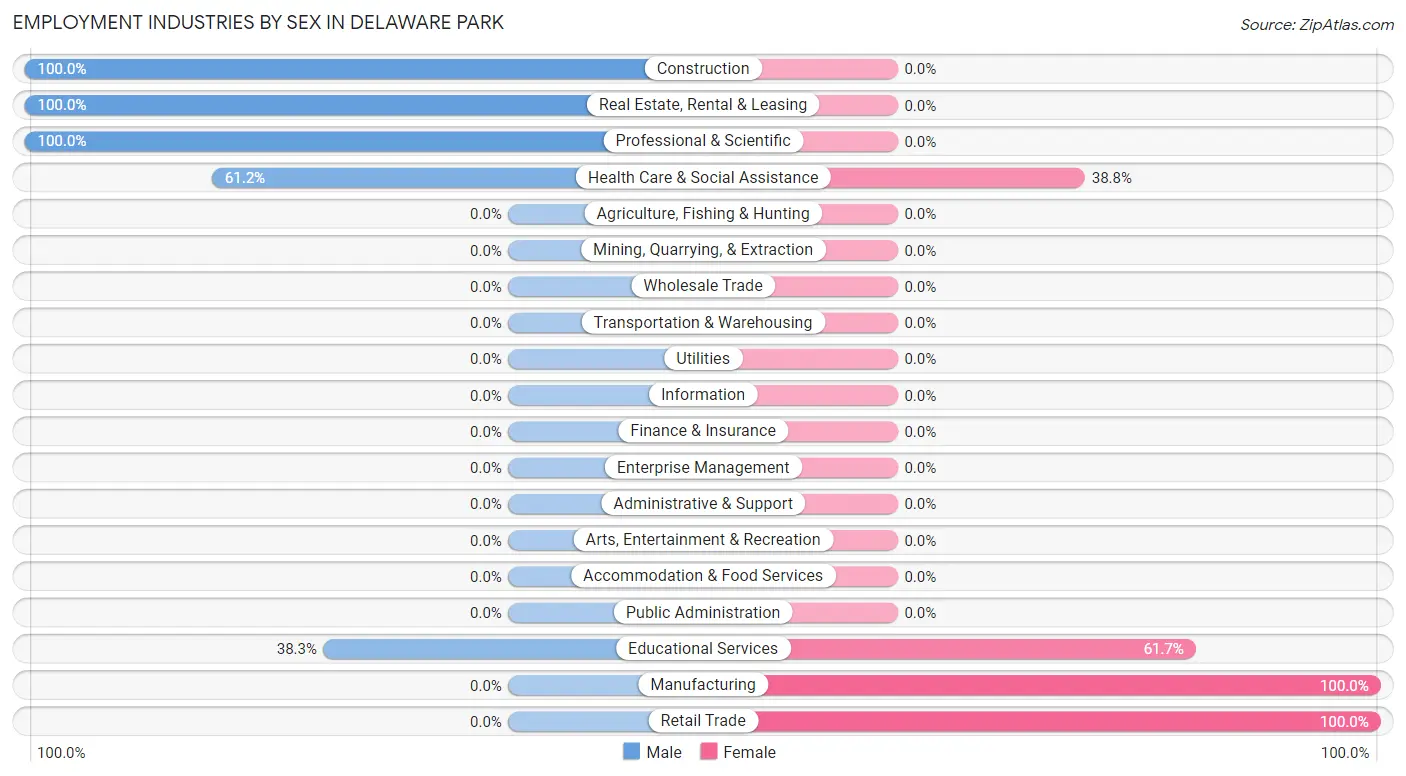
Employment Industries by Sex in Delaware Park
The Delaware Park industries that see more men than women are Construction (100.0%), Real Estate, Rental & Leasing (100.0%), and Professional & Scientific (100.0%), whereas the industries that tend to have a higher number of women are Manufacturing (100.0%), Retail Trade (100.0%), and Educational Services (61.7%).
| Industry | Male | Female |
| Agriculture, Fishing & Hunting | 0 (0.0%) | 0 (0.0%) |
| Mining, Quarrying, & Extraction | 0 (0.0%) | 0 (0.0%) |
| Construction | 9 (100.0%) | 0 (0.0%) |
| Manufacturing | 0 (0.0%) | 21 (100.0%) |
| Wholesale Trade | 0 (0.0%) | 0 (0.0%) |
| Retail Trade | 0 (0.0%) | 23 (100.0%) |
| Transportation & Warehousing | 0 (0.0%) | 0 (0.0%) |
| Utilities | 0 (0.0%) | 0 (0.0%) |
| Information | 0 (0.0%) | 0 (0.0%) |
| Finance & Insurance | 0 (0.0%) | 0 (0.0%) |
| Real Estate, Rental & Leasing | 26 (100.0%) | 0 (0.0%) |
| Professional & Scientific | 33 (100.0%) | 0 (0.0%) |
| Enterprise Management | 0 (0.0%) | 0 (0.0%) |
| Administrative & Support | 0 (0.0%) | 0 (0.0%) |
| Educational Services | 31 (38.3%) | 50 (61.7%) |
| Health Care & Social Assistance | 30 (61.2%) | 19 (38.8%) |
| Arts, Entertainment & Recreation | 0 (0.0%) | 0 (0.0%) |
| Accommodation & Food Services | 0 (0.0%) | 0 (0.0%) |
| Public Administration | 0 (0.0%) | 0 (0.0%) |
| Total | 129 (53.3%) | 113 (46.7%) |
Education in Delaware Park
School Enrollment in Delaware Park
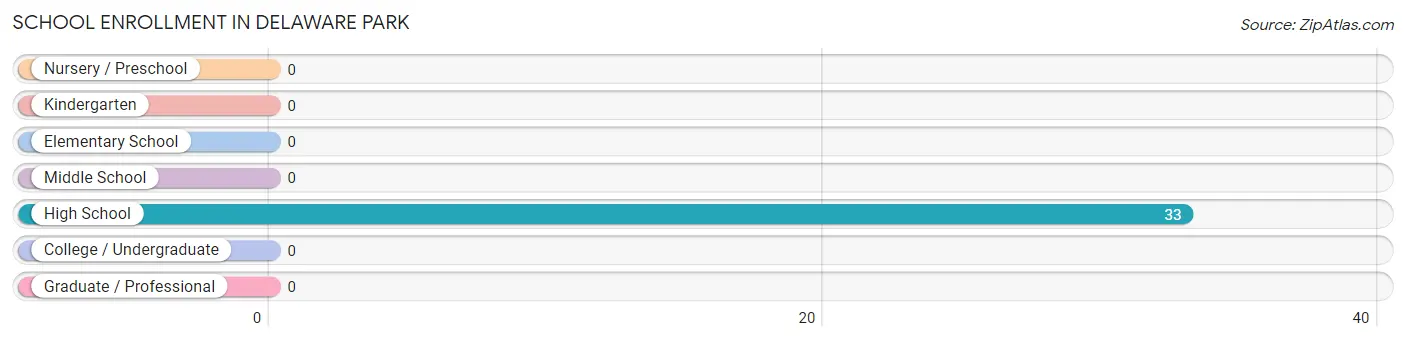
| School Level | # Students | % Students |
| Nursery / Preschool | 0 | 0.0% |
| Kindergarten | 0 | 0.0% |
| Elementary School | 0 | 0.0% |
| Middle School | 0 | 0.0% |
| High School | 33 | 100.0% |
| College / Undergraduate | 0 | 0.0% |
| Graduate / Professional | 0 | 0.0% |
| Total | 33 | 100.0% |
School Enrollment by Age by Funding Source in Delaware Park
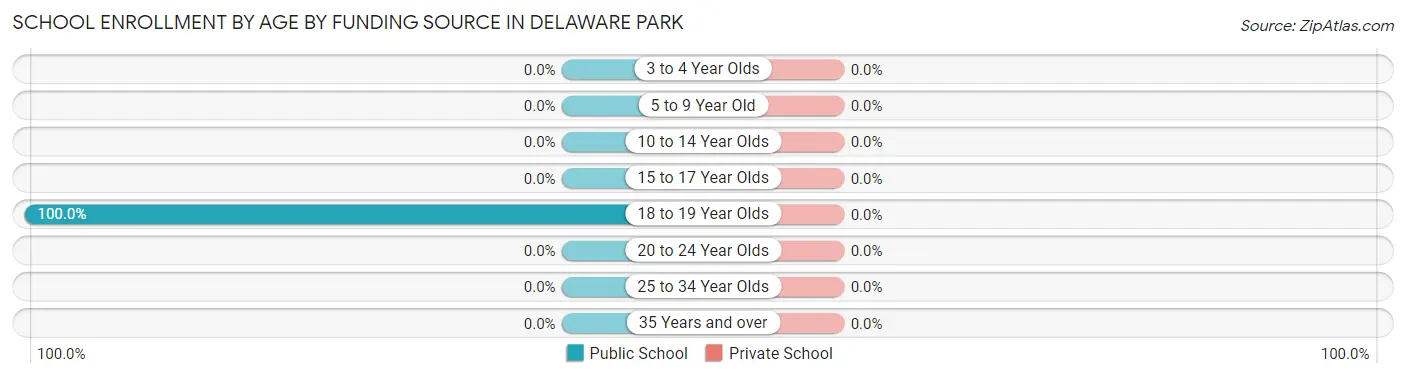
| Age Bracket | Public School | Private School |
| 3 to 4 Year Olds | 0 (0.0%) | 0 (0.0%) |
| 5 to 9 Year Old | 0 (0.0%) | 0 (0.0%) |
| 10 to 14 Year Olds | 0 (0.0%) | 0 (0.0%) |
| 15 to 17 Year Olds | 0 (0.0%) | 0 (0.0%) |
| 18 to 19 Year Olds | 33 (100.0%) | 0 (0.0%) |
| 20 to 24 Year Olds | 0 (0.0%) | 0 (0.0%) |
| 25 to 34 Year Olds | 0 (0.0%) | 0 (0.0%) |
| 35 Years and over | 0 (0.0%) | 0 (0.0%) |
| Total | 33 (100.0%) | 0 (0.0%) |
Educational Attainment by Field of Study in Delaware Park
Education (50 | 33.1%), business (49 | 32.5%), psychology (20 | 13.3%), arts & humanities (19 | 12.6%), and engineering (13 | 8.6%) are the most common fields of study among 151 individuals in Delaware Park who have obtained a bachelor's degree or higher.
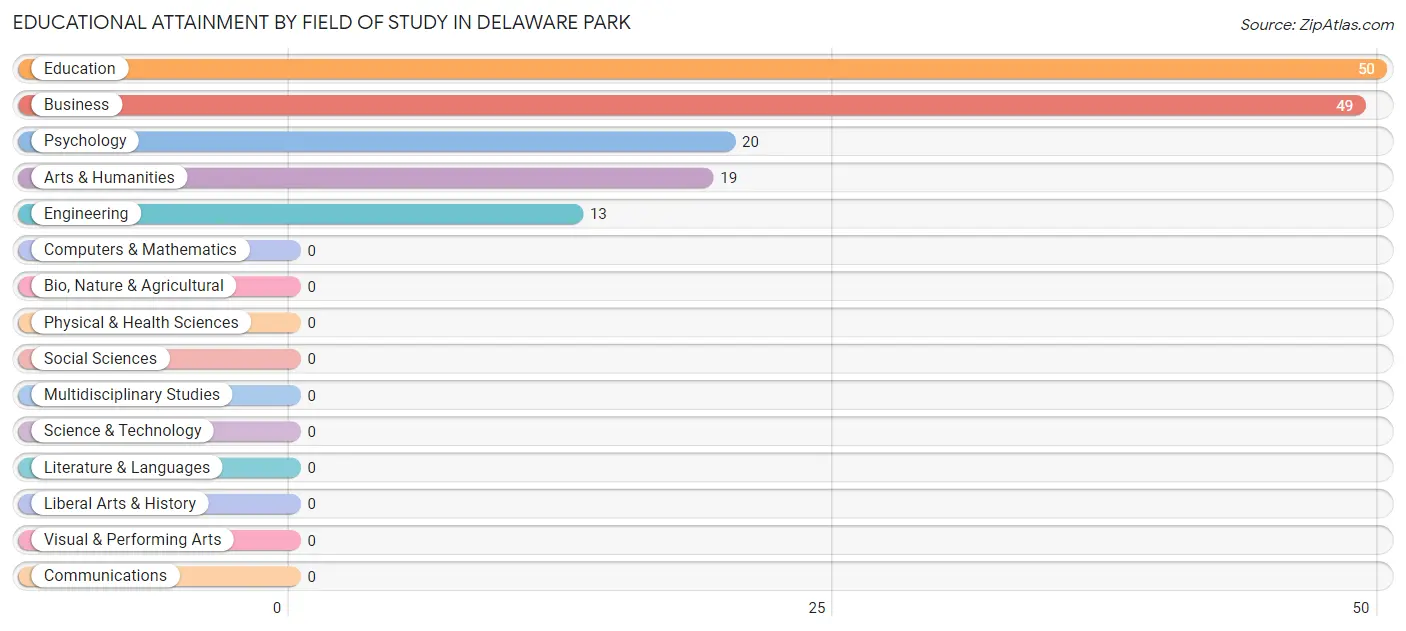
| Field of Study | # Graduates | % Graduates |
| Computers & Mathematics | 0 | 0.0% |
| Bio, Nature & Agricultural | 0 | 0.0% |
| Physical & Health Sciences | 0 | 0.0% |
| Psychology | 20 | 13.3% |
| Social Sciences | 0 | 0.0% |
| Engineering | 13 | 8.6% |
| Multidisciplinary Studies | 0 | 0.0% |
| Science & Technology | 0 | 0.0% |
| Business | 49 | 32.5% |
| Education | 50 | 33.1% |
| Literature & Languages | 0 | 0.0% |
| Liberal Arts & History | 0 | 0.0% |
| Visual & Performing Arts | 0 | 0.0% |
| Communications | 0 | 0.0% |
| Arts & Humanities | 19 | 12.6% |
| Total | 151 | 100.0% |
Transportation & Commute in Delaware Park
Vehicle Availability by Sex in Delaware Park
The most prevalent vehicle ownership categories in Delaware Park are males with 2 vehicles (68, accounting for 52.7%) and females with 2 vehicles (43, making up 60.2%).
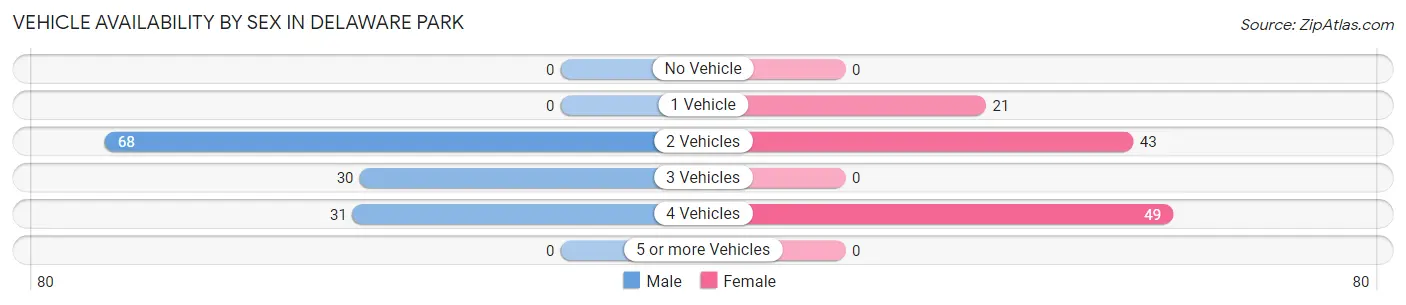
| Vehicles Available | Male | Female |
| No Vehicle | 0 (0.0%) | 0 (0.0%) |
| 1 Vehicle | 0 (0.0%) | 21 (18.6%) |
| 2 Vehicles | 68 (52.7%) | 43 (38.1%) |
| 3 Vehicles | 30 (23.3%) | 0 (0.0%) |
| 4 Vehicles | 31 (24.0%) | 49 (43.4%) |
| 5 or more Vehicles | 0 (0.0%) | 0 (0.0%) |
| Total | 129 (100.0%) | 113 (100.0%) |
Commute Time in Delaware Park
The most frequently occuring commute durations in Delaware Park are 5 to 9 minutes (99 commuters, 49.2%), 45 to 59 minutes (37 commuters, 18.4%), and 20 to 24 minutes (30 commuters, 14.9%).
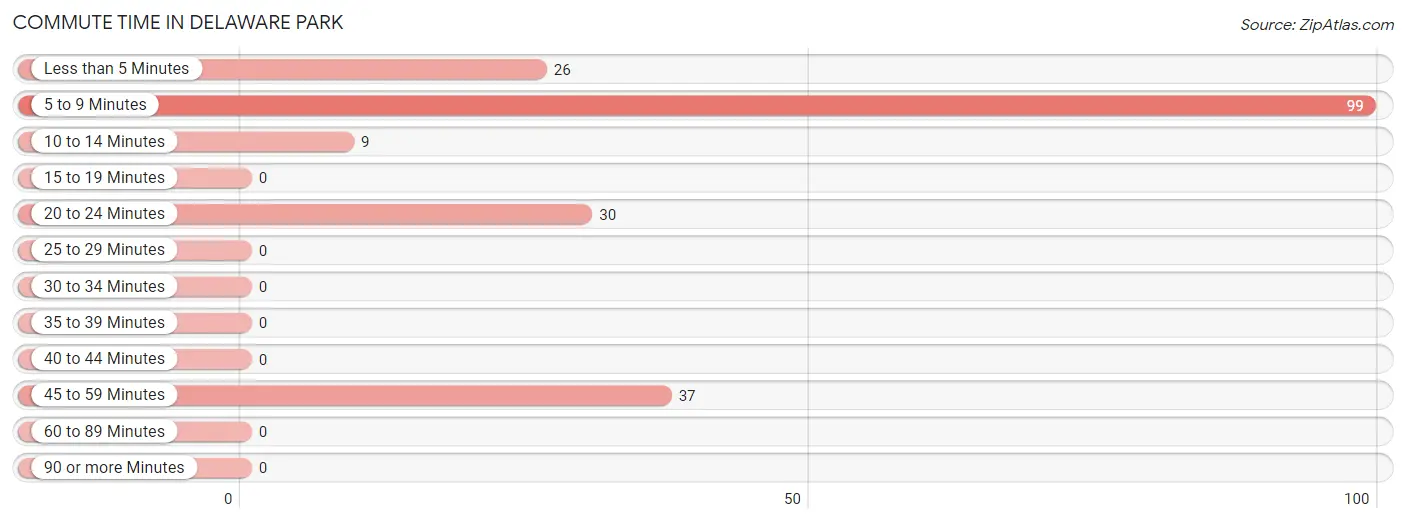
| Commute Time | # Commuters | % Commuters |
| Less than 5 Minutes | 26 | 12.9% |
| 5 to 9 Minutes | 99 | 49.2% |
| 10 to 14 Minutes | 9 | 4.5% |
| 15 to 19 Minutes | 0 | 0.0% |
| 20 to 24 Minutes | 30 | 14.9% |
| 25 to 29 Minutes | 0 | 0.0% |
| 30 to 34 Minutes | 0 | 0.0% |
| 35 to 39 Minutes | 0 | 0.0% |
| 40 to 44 Minutes | 0 | 0.0% |
| 45 to 59 Minutes | 37 | 18.4% |
| 60 to 89 Minutes | 0 | 0.0% |
| 90 or more Minutes | 0 | 0.0% |
Commute Time by Sex in Delaware Park
The most common commute times in Delaware Park are 5 to 9 minutes (57 commuters, 52.3%) for males and 5 to 9 minutes (42 commuters, 45.7%) for females.
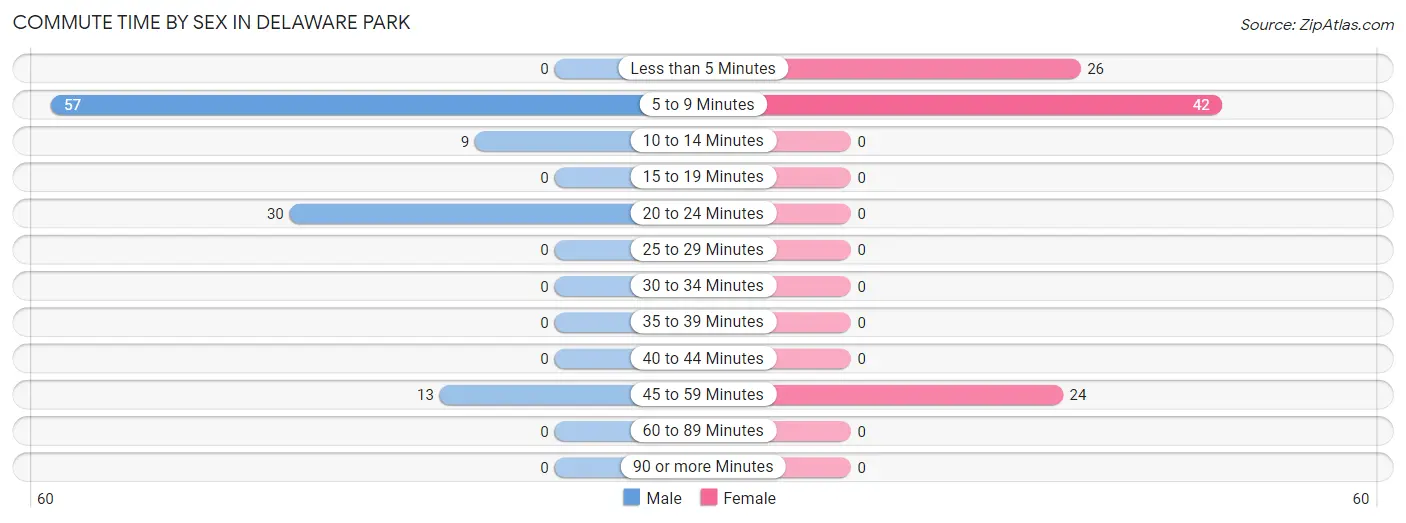
| Commute Time | Male | Female |
| Less than 5 Minutes | 0 (0.0%) | 26 (28.3%) |
| 5 to 9 Minutes | 57 (52.3%) | 42 (45.7%) |
| 10 to 14 Minutes | 9 (8.3%) | 0 (0.0%) |
| 15 to 19 Minutes | 0 (0.0%) | 0 (0.0%) |
| 20 to 24 Minutes | 30 (27.5%) | 0 (0.0%) |
| 25 to 29 Minutes | 0 (0.0%) | 0 (0.0%) |
| 30 to 34 Minutes | 0 (0.0%) | 0 (0.0%) |
| 35 to 39 Minutes | 0 (0.0%) | 0 (0.0%) |
| 40 to 44 Minutes | 0 (0.0%) | 0 (0.0%) |
| 45 to 59 Minutes | 13 (11.9%) | 24 (26.1%) |
| 60 to 89 Minutes | 0 (0.0%) | 0 (0.0%) |
| 90 or more Minutes | 0 (0.0%) | 0 (0.0%) |
Time of Departure to Work by Sex in Delaware Park
The most frequent times of departure to work in Delaware Park are 6:30 AM to 6:59 AM (31, 28.4%) for males and 6:00 AM to 6:29 AM (26, 28.3%) for females.
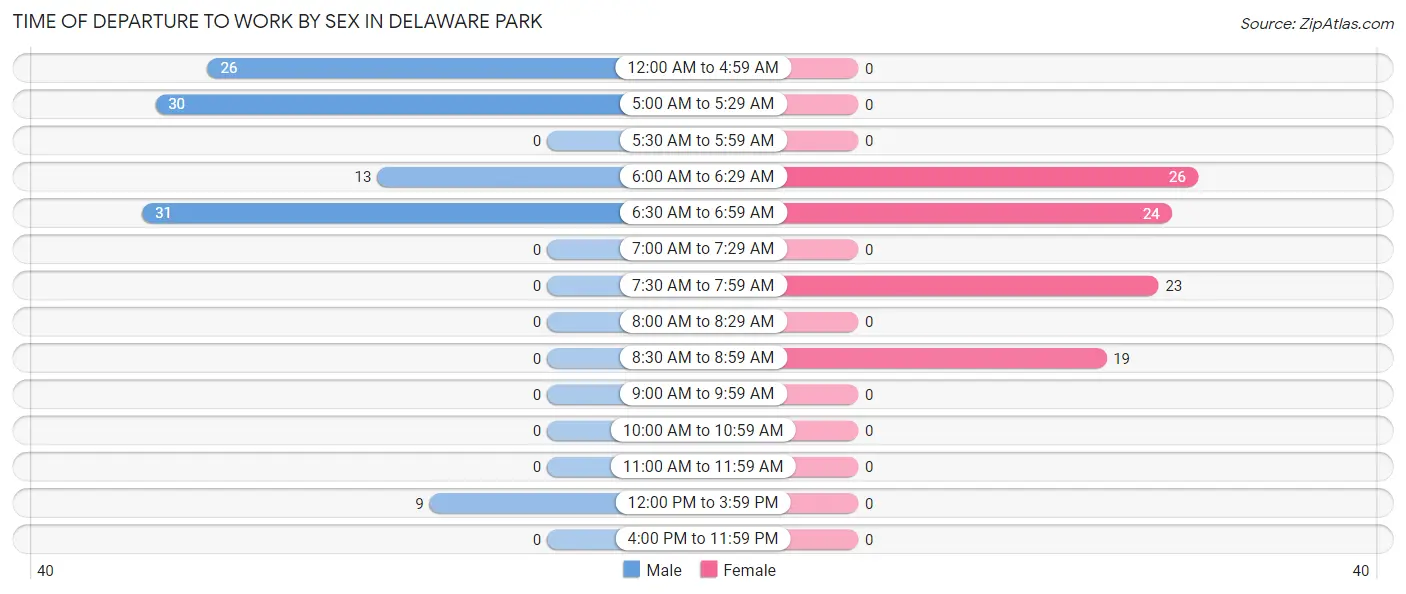
| Time of Departure | Male | Female |
| 12:00 AM to 4:59 AM | 26 (23.8%) | 0 (0.0%) |
| 5:00 AM to 5:29 AM | 30 (27.5%) | 0 (0.0%) |
| 5:30 AM to 5:59 AM | 0 (0.0%) | 0 (0.0%) |
| 6:00 AM to 6:29 AM | 13 (11.9%) | 26 (28.3%) |
| 6:30 AM to 6:59 AM | 31 (28.4%) | 24 (26.1%) |
| 7:00 AM to 7:29 AM | 0 (0.0%) | 0 (0.0%) |
| 7:30 AM to 7:59 AM | 0 (0.0%) | 23 (25.0%) |
| 8:00 AM to 8:29 AM | 0 (0.0%) | 0 (0.0%) |
| 8:30 AM to 8:59 AM | 0 (0.0%) | 19 (20.6%) |
| 9:00 AM to 9:59 AM | 0 (0.0%) | 0 (0.0%) |
| 10:00 AM to 10:59 AM | 0 (0.0%) | 0 (0.0%) |
| 11:00 AM to 11:59 AM | 0 (0.0%) | 0 (0.0%) |
| 12:00 PM to 3:59 PM | 9 (8.3%) | 0 (0.0%) |
| 4:00 PM to 11:59 PM | 0 (0.0%) | 0 (0.0%) |
| Total | 109 (100.0%) | 92 (100.0%) |
Housing Occupancy in Delaware Park
Occupancy by Ownership in Delaware Park
Of the total 163 dwellings in Delaware Park, owner-occupied units account for 163 (100.0%), while renter-occupied units make up 0 (0.0%).
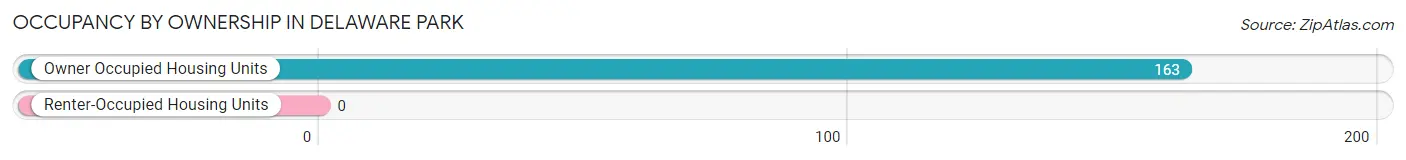
| Occupancy | # Housing Units | % Housing Units |
| Owner Occupied Housing Units | 163 | 100.0% |
| Renter-Occupied Housing Units | 0 | 0.0% |
| Total Occupied Housing Units | 163 | 100.0% |
Occupancy by Household Size in Delaware Park
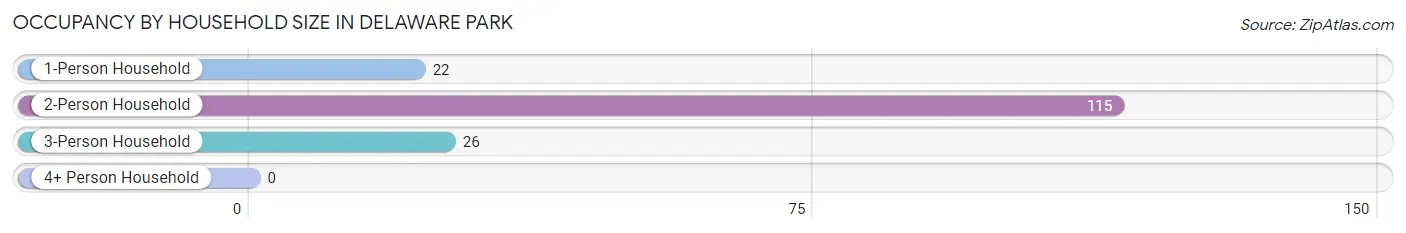
| Household Size | # Housing Units | % Housing Units |
| 1-Person Household | 22 | 13.5% |
| 2-Person Household | 115 | 70.6% |
| 3-Person Household | 26 | 16.0% |
| 4+ Person Household | 0 | 0.0% |
| Total Housing Units | 163 | 100.0% |
Occupancy by Ownership by Household Size in Delaware Park
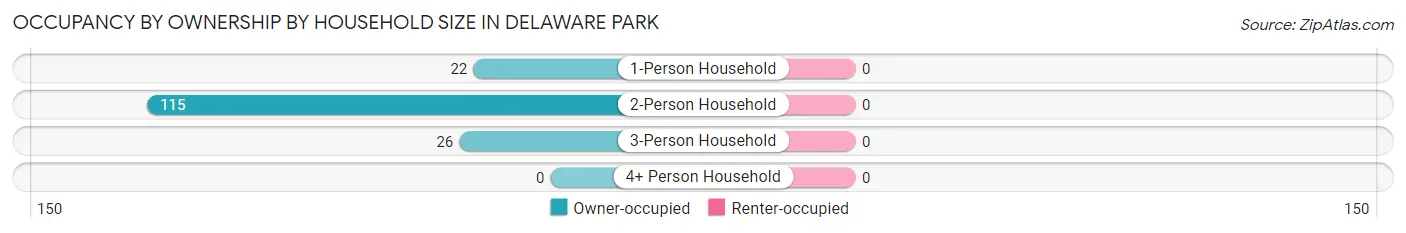
| Household Size | Owner-occupied | Renter-occupied |
| 1-Person Household | 22 (100.0%) | 0 (0.0%) |
| 2-Person Household | 115 (100.0%) | 0 (0.0%) |
| 3-Person Household | 26 (100.0%) | 0 (0.0%) |
| 4+ Person Household | 0 (0.0%) | 0 (0.0%) |
| Total Housing Units | 163 (100.0%) | 0 (0.0%) |
Occupancy by Educational Attainment in Delaware Park
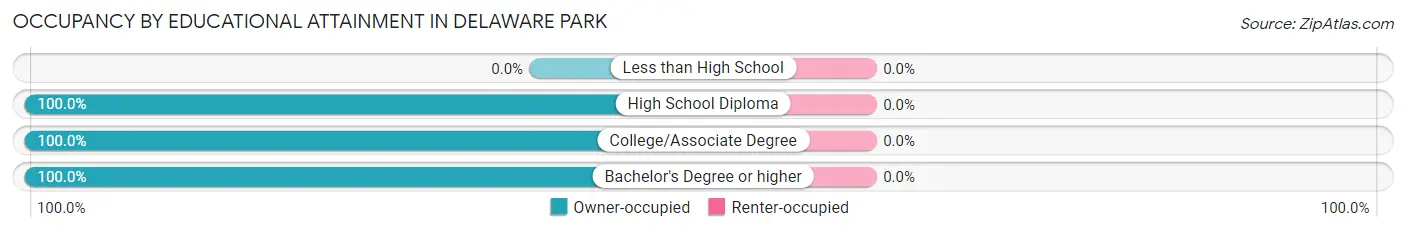
| Household Size | Owner-occupied | Renter-occupied |
| Less than High School | 0 (0.0%) | 0 (0.0%) |
| High School Diploma | 21 (100.0%) | 0 (0.0%) |
| College/Associate Degree | 57 (100.0%) | 0 (0.0%) |
| Bachelor's Degree or higher | 85 (100.0%) | 0 (0.0%) |
Occupancy by Age of Householder in Delaware Park
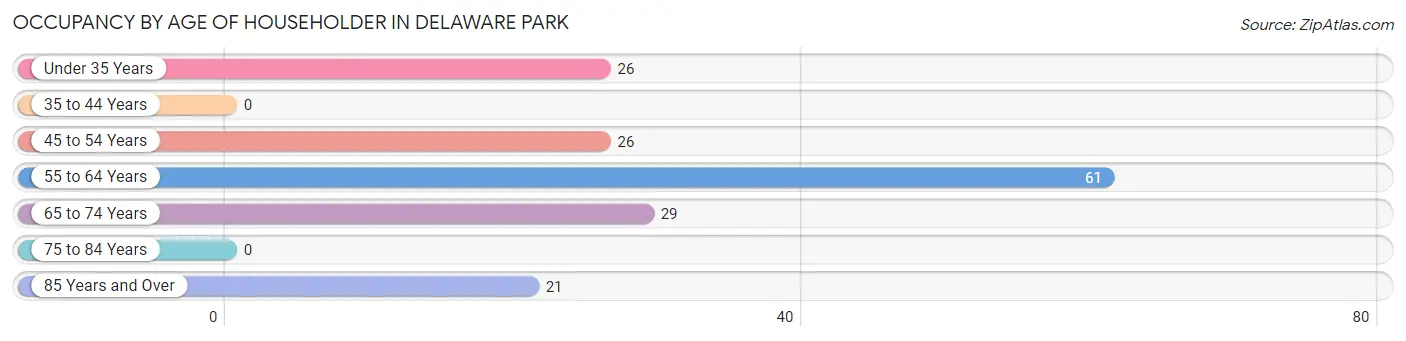
| Age Bracket | # Households | % Households |
| Under 35 Years | 26 | 16.0% |
| 35 to 44 Years | 0 | 0.0% |
| 45 to 54 Years | 26 | 16.0% |
| 55 to 64 Years | 61 | 37.4% |
| 65 to 74 Years | 29 | 17.8% |
| 75 to 84 Years | 0 | 0.0% |
| 85 Years and Over | 21 | 12.9% |
| Total | 163 | 100.0% |
Housing Finances in Delaware Park
Median Income by Occupancy in Delaware Park
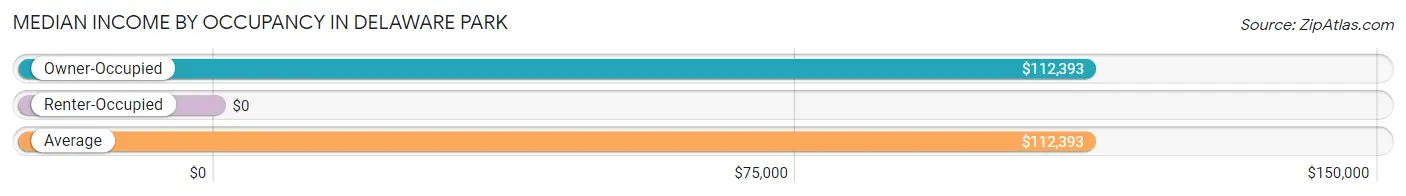
| Occupancy Type | # Households | Median Income |
| Owner-Occupied | 163 (100.0%) | $112,393 |
| Renter-Occupied | 0 (0.0%) | $0 |
| Average | 163 (100.0%) | $112,393 |
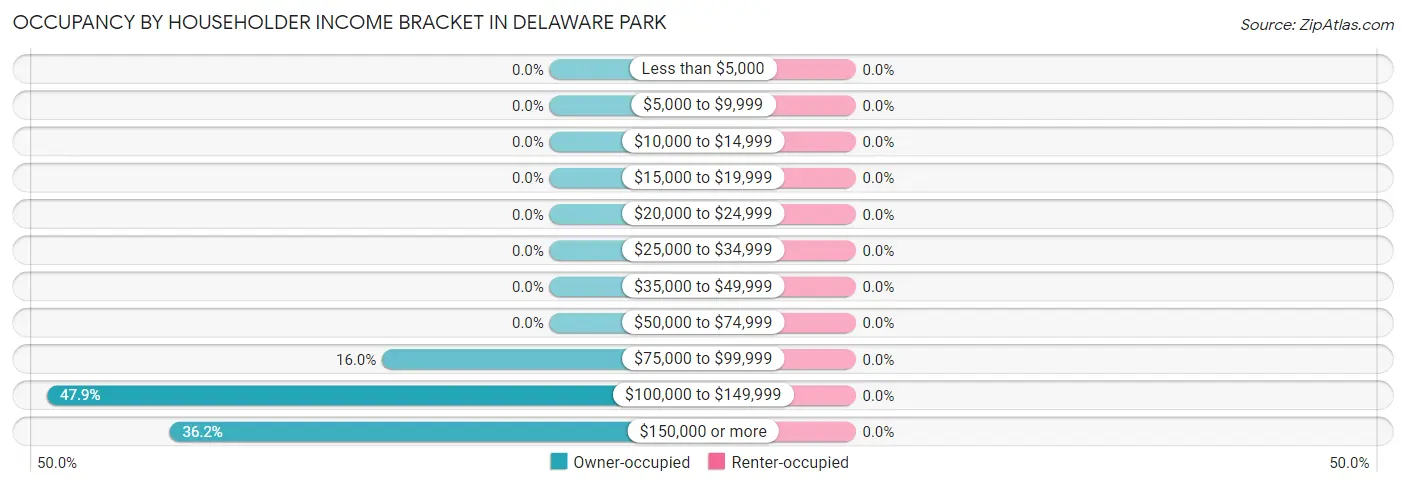
Occupancy by Householder Income Bracket in Delaware Park
| Income Bracket | Owner-occupied | Renter-occupied |
| Less than $5,000 | 0 (0.0%) | 0 (0.0%) |
| $5,000 to $9,999 | 0 (0.0%) | 0 (0.0%) |
| $10,000 to $14,999 | 0 (0.0%) | 0 (0.0%) |
| $15,000 to $19,999 | 0 (0.0%) | 0 (0.0%) |
| $20,000 to $24,999 | 0 (0.0%) | 0 (0.0%) |
| $25,000 to $34,999 | 0 (0.0%) | 0 (0.0%) |
| $35,000 to $49,999 | 0 (0.0%) | 0 (0.0%) |
| $50,000 to $74,999 | 0 (0.0%) | 0 (0.0%) |
| $75,000 to $99,999 | 26 (16.0%) | 0 (0.0%) |
| $100,000 to $149,999 | 78 (47.8%) | 0 (0.0%) |
| $150,000 or more | 59 (36.2%) | 0 (0.0%) |
| Total | 163 (100.0%) | 0 (0.0%) |
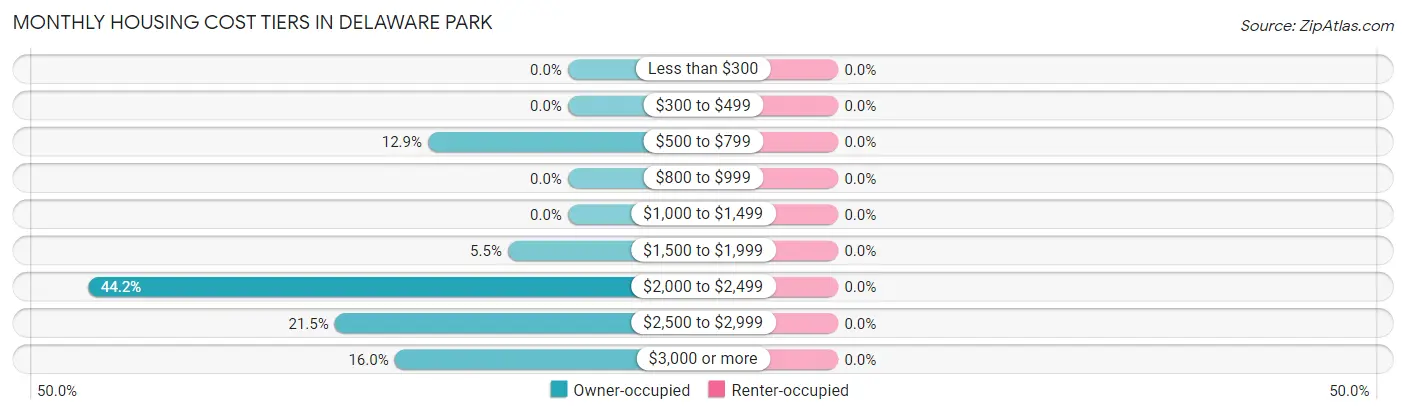
Monthly Housing Cost Tiers in Delaware Park
| Monthly Cost | Owner-occupied | Renter-occupied |
| Less than $300 | 0 (0.0%) | 0 (0.0%) |
| $300 to $499 | 0 (0.0%) | 0 (0.0%) |
| $500 to $799 | 21 (12.9%) | 0 (0.0%) |
| $800 to $999 | 0 (0.0%) | 0 (0.0%) |
| $1,000 to $1,499 | 0 (0.0%) | 0 (0.0%) |
| $1,500 to $1,999 | 9 (5.5%) | 0 (0.0%) |
| $2,000 to $2,499 | 72 (44.2%) | 0 (0.0%) |
| $2,500 to $2,999 | 35 (21.5%) | 0 (0.0%) |
| $3,000 or more | 26 (16.0%) | 0 (0.0%) |
| Total | 163 (100.0%) | 0 (0.0%) |
Physical Housing Characteristics in Delaware Park
Housing Structures in Delaware Park
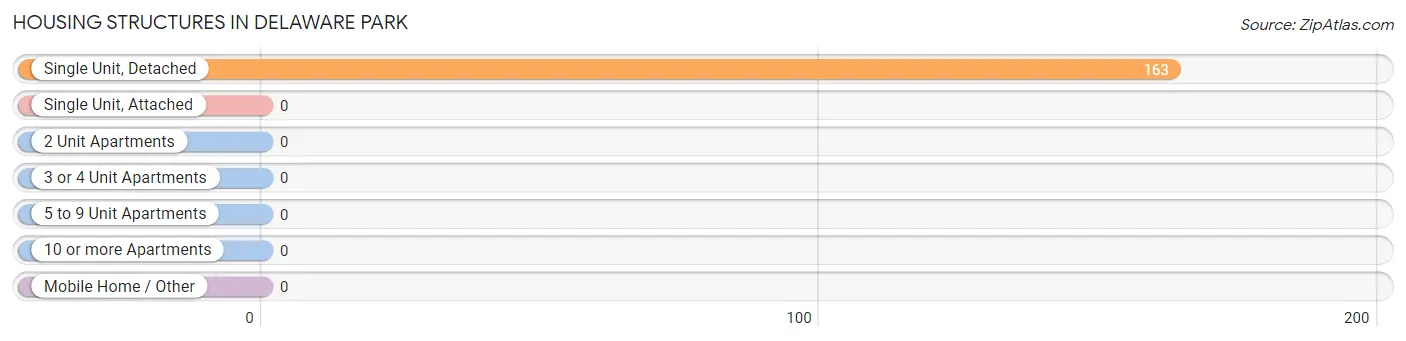
| Structure Type | # Housing Units | % Housing Units |
| Single Unit, Detached | 163 | 100.0% |
| Single Unit, Attached | 0 | 0.0% |
| 2 Unit Apartments | 0 | 0.0% |
| 3 or 4 Unit Apartments | 0 | 0.0% |
| 5 to 9 Unit Apartments | 0 | 0.0% |
| 10 or more Apartments | 0 | 0.0% |
| Mobile Home / Other | 0 | 0.0% |
| Total | 163 | 100.0% |
Housing Structures by Occupancy in Delaware Park
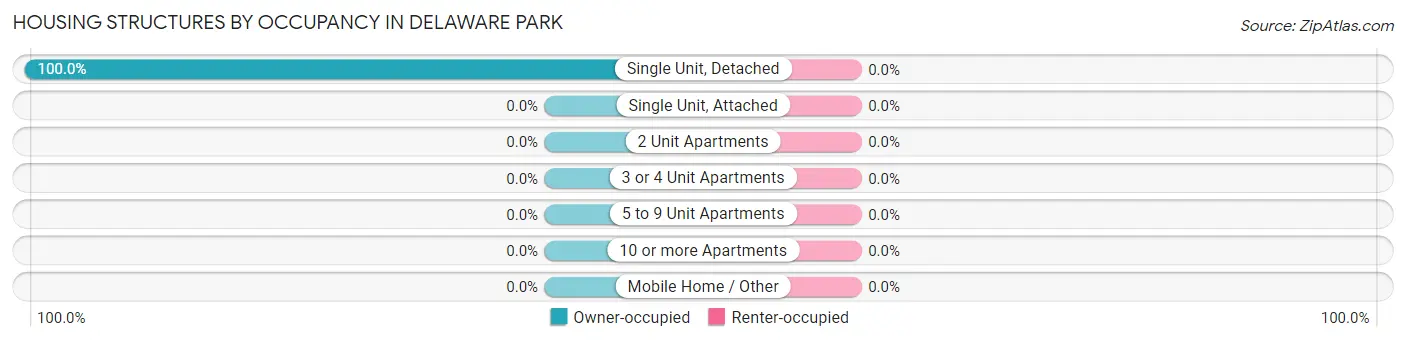
| Structure Type | Owner-occupied | Renter-occupied |
| Single Unit, Detached | 163 (100.0%) | 0 (0.0%) |
| Single Unit, Attached | 0 (0.0%) | 0 (0.0%) |
| 2 Unit Apartments | 0 (0.0%) | 0 (0.0%) |
| 3 or 4 Unit Apartments | 0 (0.0%) | 0 (0.0%) |
| 5 to 9 Unit Apartments | 0 (0.0%) | 0 (0.0%) |
| 10 or more Apartments | 0 (0.0%) | 0 (0.0%) |
| Mobile Home / Other | 0 (0.0%) | 0 (0.0%) |
| Total | 163 (100.0%) | 0 (0.0%) |
Housing Structures by Number of Rooms in Delaware Park
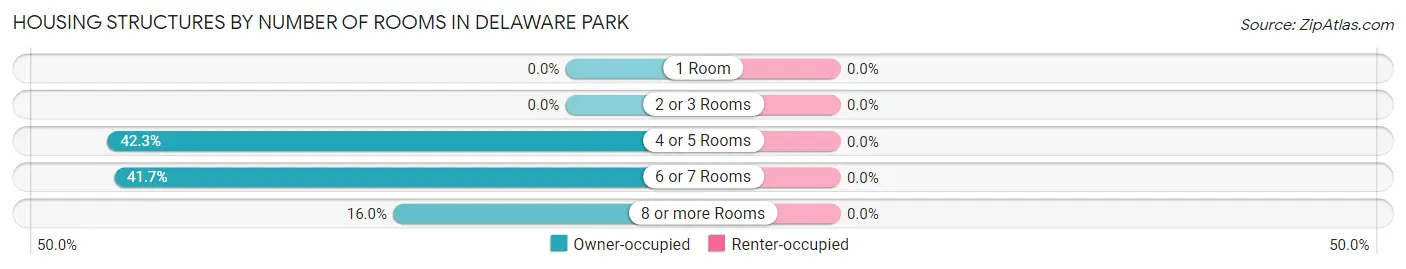
| Number of Rooms | Owner-occupied | Renter-occupied |
| 1 Room | 0 (0.0%) | 0 (0.0%) |
| 2 or 3 Rooms | 0 (0.0%) | 0 (0.0%) |
| 4 or 5 Rooms | 69 (42.3%) | 0 (0.0%) |
| 6 or 7 Rooms | 68 (41.7%) | 0 (0.0%) |
| 8 or more Rooms | 26 (16.0%) | 0 (0.0%) |
| Total | 163 (100.0%) | 0 (0.0%) |
Housing Structure by Heating Type in Delaware Park
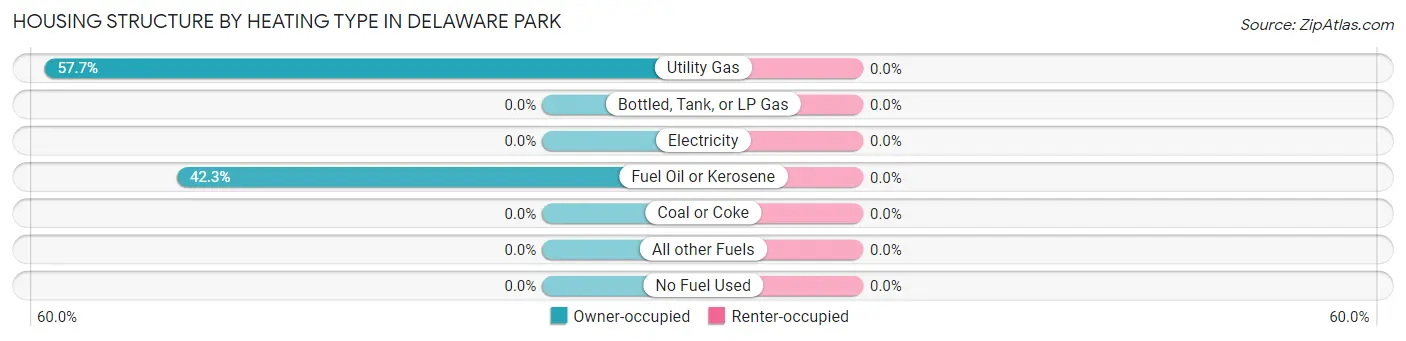
| Heating Type | Owner-occupied | Renter-occupied |
| Utility Gas | 94 (57.7%) | 0 (0.0%) |
| Bottled, Tank, or LP Gas | 0 (0.0%) | 0 (0.0%) |
| Electricity | 0 (0.0%) | 0 (0.0%) |
| Fuel Oil or Kerosene | 69 (42.3%) | 0 (0.0%) |
| Coal or Coke | 0 (0.0%) | 0 (0.0%) |
| All other Fuels | 0 (0.0%) | 0 (0.0%) |
| No Fuel Used | 0 (0.0%) | 0 (0.0%) |
| Total | 163 (100.0%) | 0 (0.0%) |
Household Vehicle Usage in Delaware Park
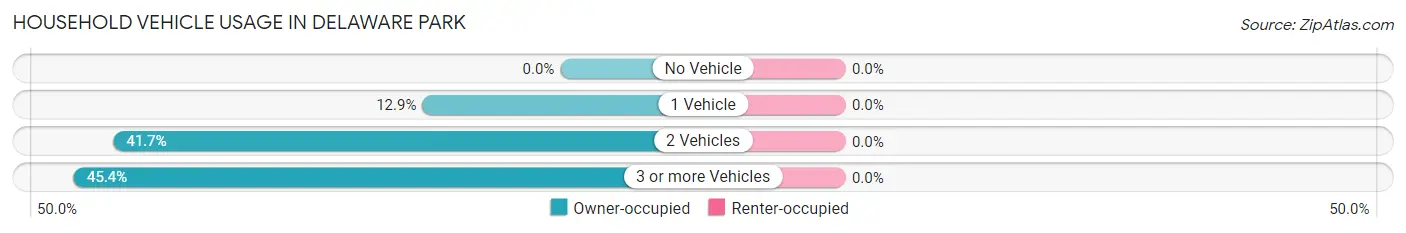
| Vehicles per Household | Owner-occupied | Renter-occupied |
| No Vehicle | 0 (0.0%) | 0 (0.0%) |
| 1 Vehicle | 21 (12.9%) | 0 (0.0%) |
| 2 Vehicles | 68 (41.7%) | 0 (0.0%) |
| 3 or more Vehicles | 74 (45.4%) | 0 (0.0%) |
| Total | 163 (100.0%) | 0 (0.0%) |
Real Estate & Mortgages in Delaware Park
Real Estate and Mortgage Overview in Delaware Park
| Characteristic | Without Mortgage | With Mortgage |
| Housing Units | 21 | 142 |
| Median Property Value | - | - |
| Median Household Income | - | - |
| Monthly Housing Costs | - | - |
| Real Estate Taxes | - | - |
Property Value by Mortgage Status in Delaware Park
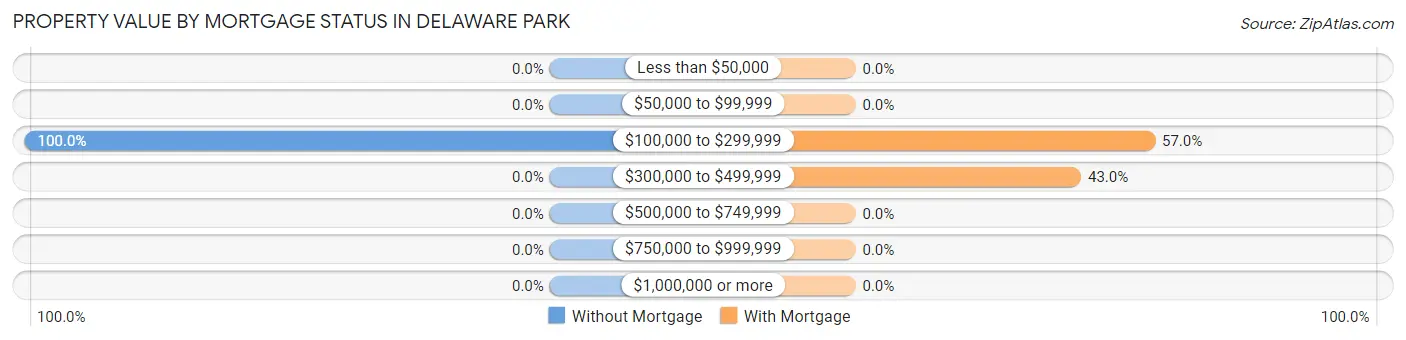
| Property Value | Without Mortgage | With Mortgage |
| Less than $50,000 | 0 (0.0%) | 0 (0.0%) |
| $50,000 to $99,999 | 0 (0.0%) | 0 (0.0%) |
| $100,000 to $299,999 | 21 (100.0%) | 81 (57.0%) |
| $300,000 to $499,999 | 0 (0.0%) | 61 (43.0%) |
| $500,000 to $749,999 | 0 (0.0%) | 0 (0.0%) |
| $750,000 to $999,999 | 0 (0.0%) | 0 (0.0%) |
| $1,000,000 or more | 0 (0.0%) | 0 (0.0%) |
| Total | 21 (100.0%) | 142 (100.0%) |
Household Income by Mortgage Status in Delaware Park
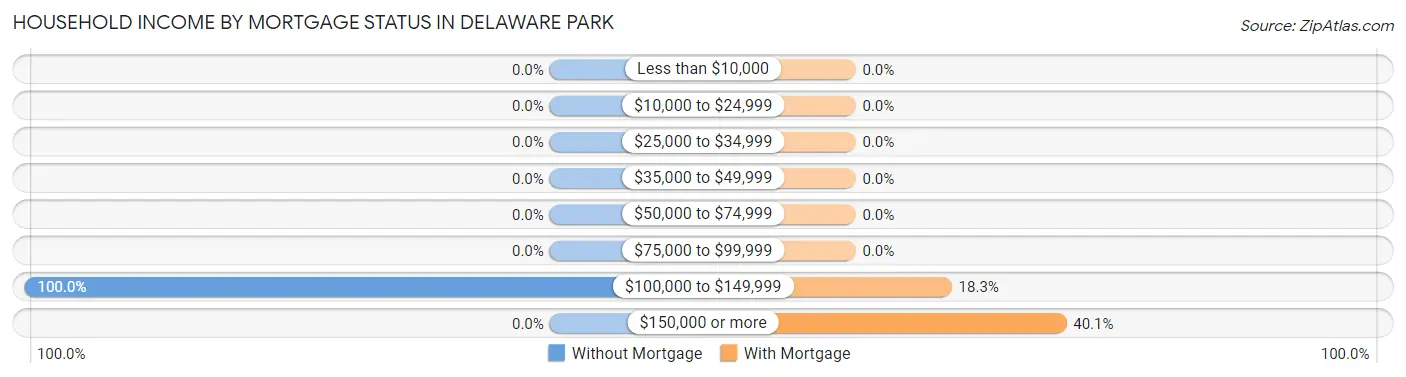
| Household Income | Without Mortgage | With Mortgage |
| Less than $10,000 | 0 (0.0%) | 0 (0.0%) |
| $10,000 to $24,999 | 0 (0.0%) | 0 (0.0%) |
| $25,000 to $34,999 | 0 (0.0%) | 0 (0.0%) |
| $35,000 to $49,999 | 0 (0.0%) | 0 (0.0%) |
| $50,000 to $74,999 | 0 (0.0%) | 0 (0.0%) |
| $75,000 to $99,999 | 0 (0.0%) | 0 (0.0%) |
| $100,000 to $149,999 | 21 (100.0%) | 26 (18.3%) |
| $150,000 or more | 0 (0.0%) | 57 (40.1%) |
| Total | 21 (100.0%) | 142 (100.0%) |
Property Value to Household Income Ratio in Delaware Park
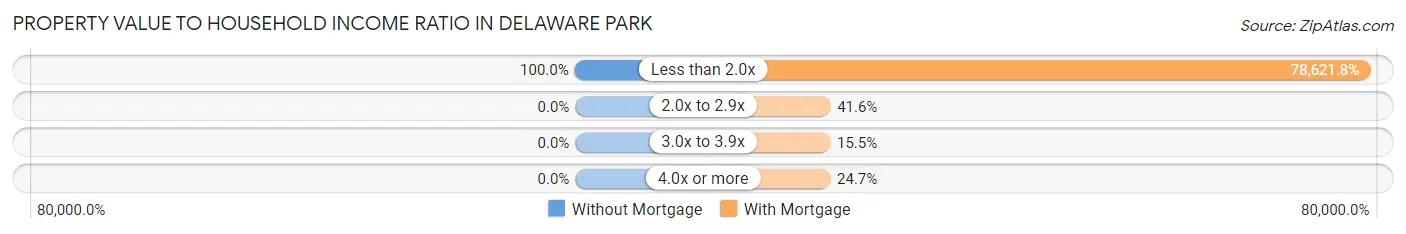
| Value-to-Income Ratio | Without Mortgage | With Mortgage |
| Less than 2.0x | 21 (100.0%) | 111,643 (78,621.8%) |
| 2.0x to 2.9x | 0 (0.0%) | 59 (41.5%) |
| 3.0x to 3.9x | 0 (0.0%) | 22 (15.5%) |
| 4.0x or more | 0 (0.0%) | 35 (24.6%) |
| Total | 21 (100.0%) | 142 (100.0%) |
Real Estate Taxes by Mortgage Status in Delaware Park
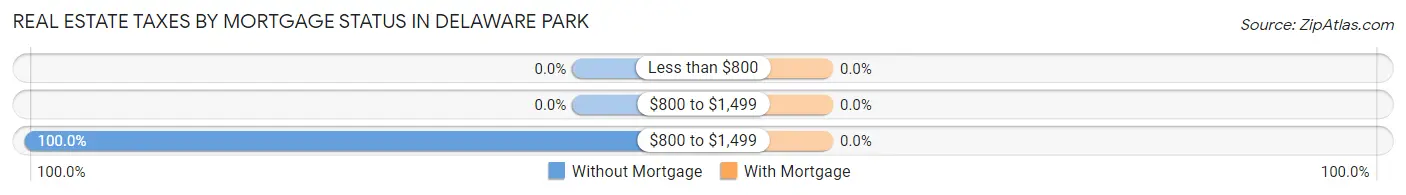
| Property Taxes | Without Mortgage | With Mortgage |
| Less than $800 | 0 (0.0%) | 0 (0.0%) |
| $800 to $1,499 | 0 (0.0%) | 0 (0.0%) |
| $800 to $1,499 | 21 (100.0%) | 0 (0.0%) |
| Total | 21 (100.0%) | 142 (100.0%) |
Health & Disability in Delaware Park
Health Insurance Coverage by Age in Delaware Park
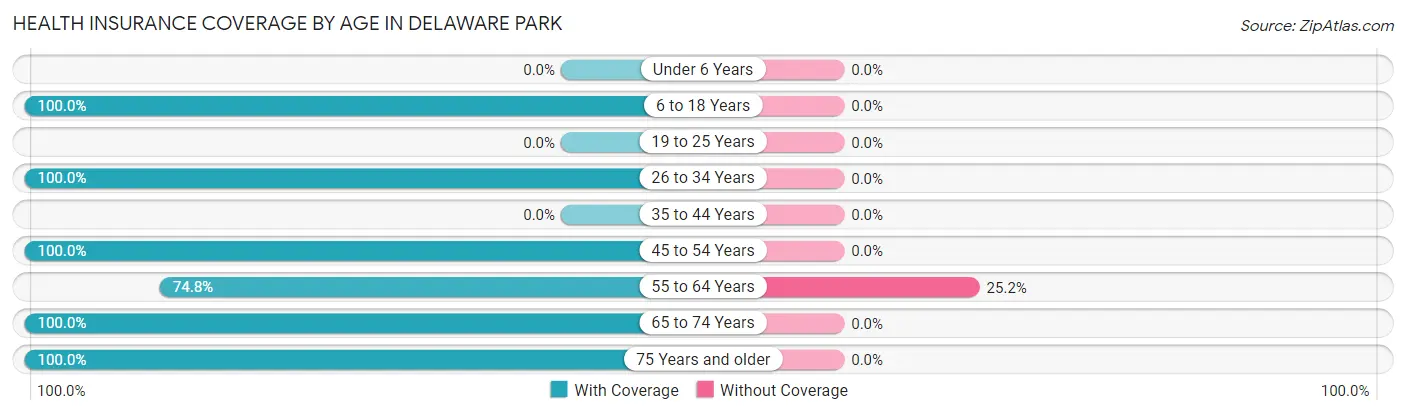
| Age Bracket | With Coverage | Without Coverage |
| Under 6 Years | 0 (0.0%) | 0 (0.0%) |
| 6 to 18 Years | 33 (100.0%) | 0 (0.0%) |
| 19 to 25 Years | 0 (0.0%) | 0 (0.0%) |
| 26 to 34 Years | 50 (100.0%) | 0 (0.0%) |
| 35 to 44 Years | 0 (0.0%) | 0 (0.0%) |
| 45 to 54 Years | 87 (100.0%) | 0 (0.0%) |
| 55 to 64 Years | 77 (74.8%) | 26 (25.2%) |
| 65 to 74 Years | 50 (100.0%) | 0 (0.0%) |
| 75 Years and older | 21 (100.0%) | 0 (0.0%) |
| Total | 318 (92.4%) | 26 (7.6%) |
Health Insurance Coverage by Citizenship Status in Delaware Park
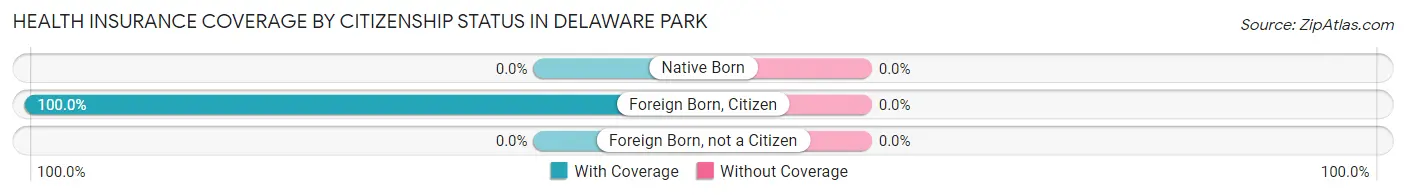
| Citizenship Status | With Coverage | Without Coverage |
| Native Born | 0 (0.0%) | 0 (0.0%) |
| Foreign Born, Citizen | 33 (100.0%) | 0 (0.0%) |
| Foreign Born, not a Citizen | 0 (0.0%) | 0 (0.0%) |
Health Insurance Coverage by Household Income in Delaware Park
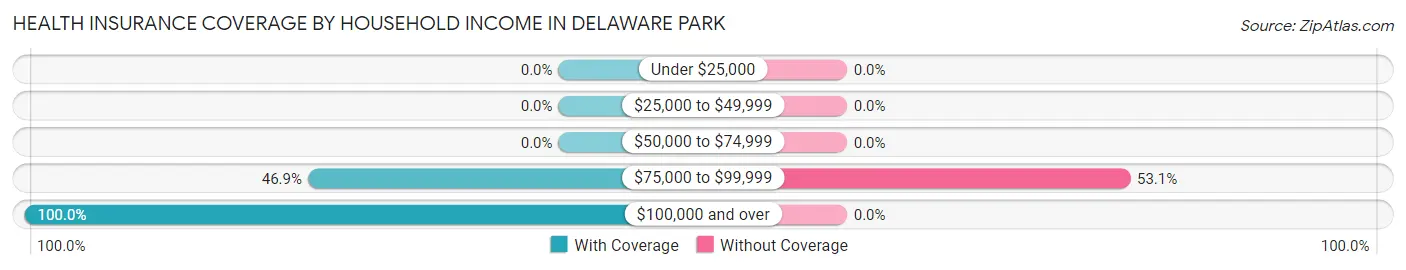
| Household Income | With Coverage | Without Coverage |
| Under $25,000 | 0 (0.0%) | 0 (0.0%) |
| $25,000 to $49,999 | 0 (0.0%) | 0 (0.0%) |
| $50,000 to $74,999 | 0 (0.0%) | 0 (0.0%) |
| $75,000 to $99,999 | 23 (46.9%) | 26 (53.1%) |
| $100,000 and over | 295 (100.0%) | 0 (0.0%) |
Public vs Private Health Insurance Coverage by Age in Delaware Park
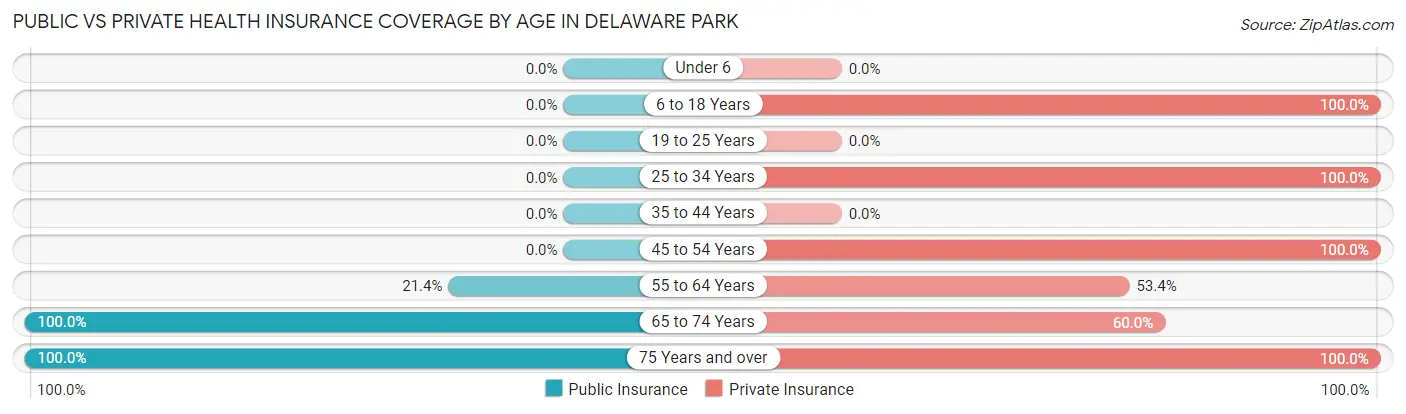
| Age Bracket | Public Insurance | Private Insurance |
| Under 6 | 0 (0.0%) | 0 (0.0%) |
| 6 to 18 Years | 0 (0.0%) | 33 (100.0%) |
| 19 to 25 Years | 0 (0.0%) | 0 (0.0%) |
| 25 to 34 Years | 0 (0.0%) | 50 (100.0%) |
| 35 to 44 Years | 0 (0.0%) | 0 (0.0%) |
| 45 to 54 Years | 0 (0.0%) | 87 (100.0%) |
| 55 to 64 Years | 22 (21.4%) | 55 (53.4%) |
| 65 to 74 Years | 50 (100.0%) | 30 (60.0%) |
| 75 Years and over | 21 (100.0%) | 21 (100.0%) |
| Total | 93 (27.0%) | 276 (80.2%) |
Disability Status by Sex by Age in Delaware Park
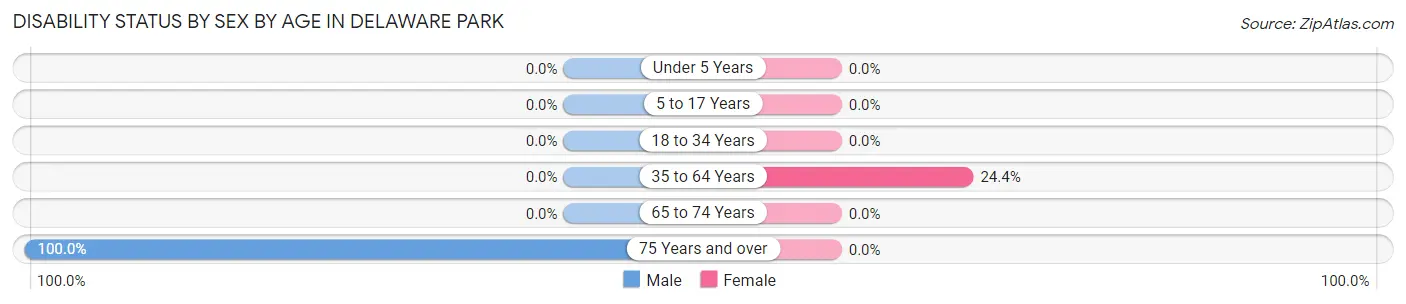
| Age Bracket | Male | Female |
| Under 5 Years | 0 (0.0%) | 0 (0.0%) |
| 5 to 17 Years | 0 (0.0%) | 0 (0.0%) |
| 18 to 34 Years | 0 (0.0%) | 0 (0.0%) |
| 35 to 64 Years | 0 (0.0%) | 22 (24.4%) |
| 65 to 74 Years | 0 (0.0%) | 0 (0.0%) |
| 75 Years and over | 21 (100.0%) | 0 (0.0%) |
Disability Class by Sex by Age in Delaware Park
Disability Class: Hearing Difficulty
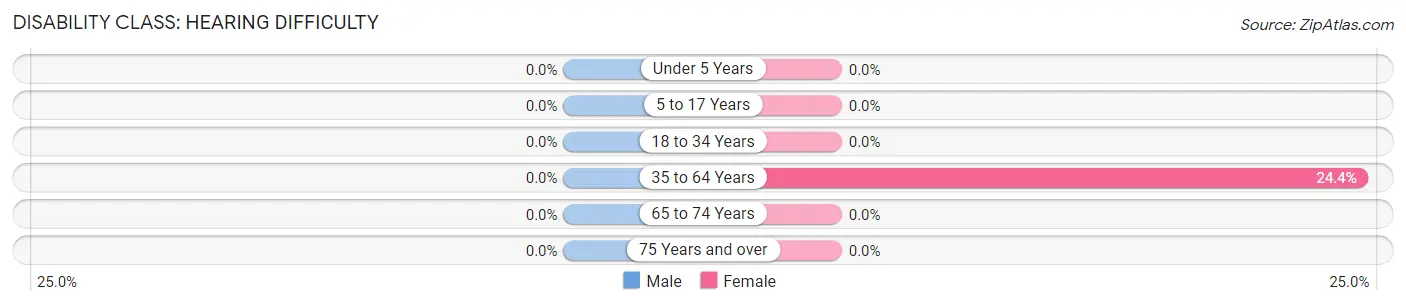
| Age Bracket | Male | Female |
| Under 5 Years | 0 (0.0%) | 0 (0.0%) |
| 5 to 17 Years | 0 (0.0%) | 0 (0.0%) |
| 18 to 34 Years | 0 (0.0%) | 0 (0.0%) |
| 35 to 64 Years | 0 (0.0%) | 22 (24.4%) |
| 65 to 74 Years | 0 (0.0%) | 0 (0.0%) |
| 75 Years and over | 0 (0.0%) | 0 (0.0%) |
Disability Class: Vision Difficulty
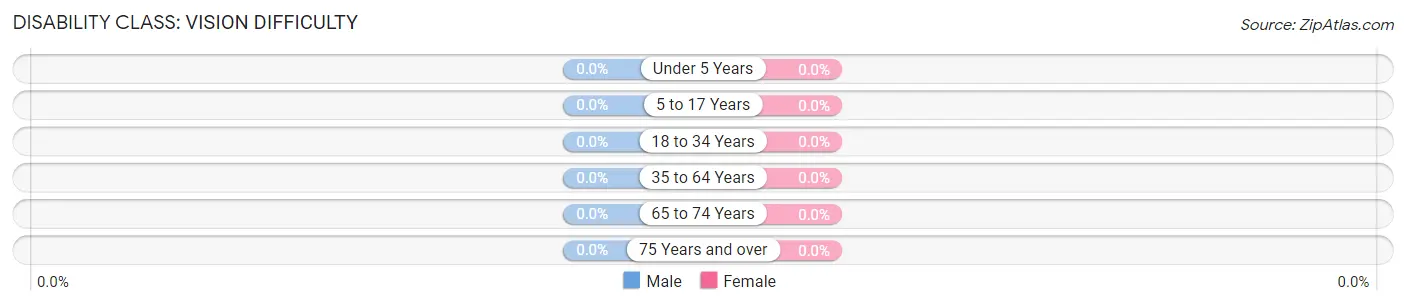
| Age Bracket | Male | Female |
| Under 5 Years | 0 (0.0%) | 0 (0.0%) |
| 5 to 17 Years | 0 (0.0%) | 0 (0.0%) |
| 18 to 34 Years | 0 (0.0%) | 0 (0.0%) |
| 35 to 64 Years | 0 (0.0%) | 0 (0.0%) |
| 65 to 74 Years | 0 (0.0%) | 0 (0.0%) |
| 75 Years and over | 0 (0.0%) | 0 (0.0%) |
Disability Class: Cognitive Difficulty
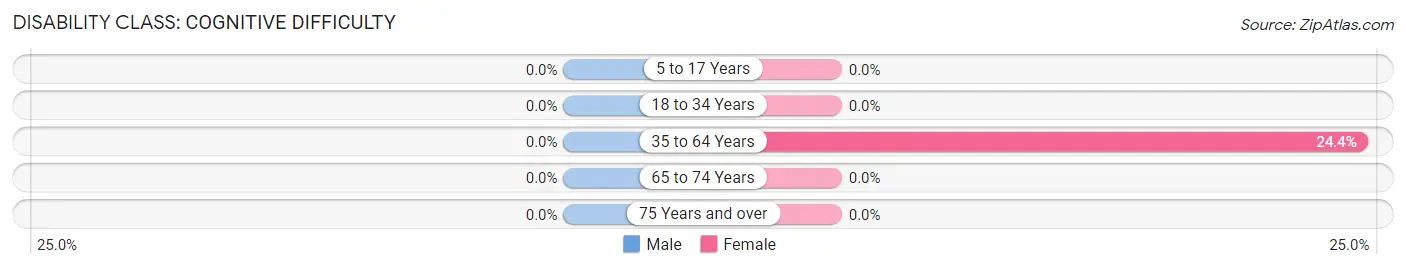
| Age Bracket | Male | Female |
| 5 to 17 Years | 0 (0.0%) | 0 (0.0%) |
| 18 to 34 Years | 0 (0.0%) | 0 (0.0%) |
| 35 to 64 Years | 0 (0.0%) | 22 (24.4%) |
| 65 to 74 Years | 0 (0.0%) | 0 (0.0%) |
| 75 Years and over | 0 (0.0%) | 0 (0.0%) |
Disability Class: Ambulatory Difficulty

| Age Bracket | Male | Female |
| 5 to 17 Years | 0 (0.0%) | 0 (0.0%) |
| 18 to 34 Years | 0 (0.0%) | 0 (0.0%) |
| 35 to 64 Years | 0 (0.0%) | 22 (24.4%) |
| 65 to 74 Years | 0 (0.0%) | 0 (0.0%) |
| 75 Years and over | 0 (0.0%) | 0 (0.0%) |
Disability Class: Self-Care Difficulty
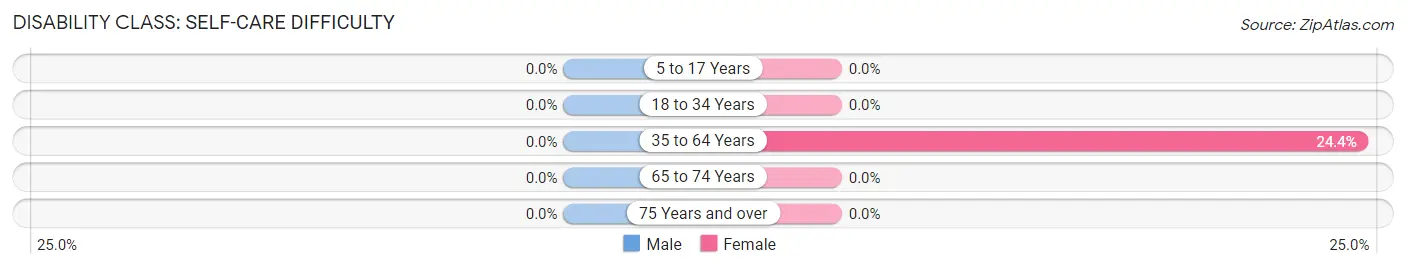
| Age Bracket | Male | Female |
| 5 to 17 Years | 0 (0.0%) | 0 (0.0%) |
| 18 to 34 Years | 0 (0.0%) | 0 (0.0%) |
| 35 to 64 Years | 0 (0.0%) | 22 (24.4%) |
| 65 to 74 Years | 0 (0.0%) | 0 (0.0%) |
| 75 Years and over | 0 (0.0%) | 0 (0.0%) |
Technology Access in Delaware Park
Computing Device Access in Delaware Park
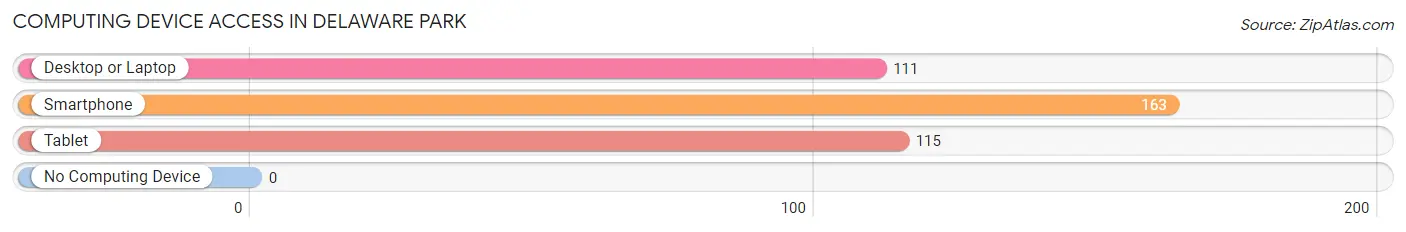
| Device Type | # Households | % Households |
| Desktop or Laptop | 111 | 68.1% |
| Smartphone | 163 | 100.0% |
| Tablet | 115 | 70.6% |
| No Computing Device | 0 | 0.0% |
| Total | 163 | 100.0% |
Internet Access in Delaware Park
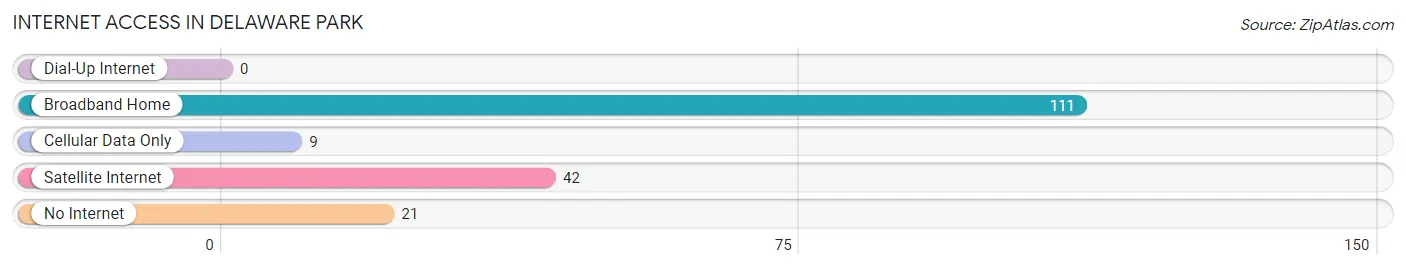
| Internet Type | # Households | % Households |
| Dial-Up Internet | 0 | 0.0% |
| Broadband Home | 111 | 68.1% |
| Cellular Data Only | 9 | 5.5% |
| Satellite Internet | 42 | 25.8% |
| No Internet | 21 | 12.9% |
| Total | 163 | 100.0% |
Delaware Park Summary
Delaware Park, NJ is a small, unincorporated community located in the northern part of Burlington County, New Jersey. It is situated along the Delaware River, just south of the Pennsylvania border. The community is home to a population of approximately 1,000 people, and is part of the larger Burlington County area.
History
Delaware Park, NJ was first settled in the late 1700s by a group of Quakers from Pennsylvania. The area was originally known as “Delaware Park” due to its proximity to the Delaware River. The community was largely agricultural, with many of the settlers growing crops such as corn, wheat, and oats. The area was also home to a number of small businesses, including a grist mill, a saw mill, and a blacksmith shop.
In the early 1800s, the area began to experience a period of growth and development. The Delaware River was used to transport goods and materials to and from Philadelphia, and the community began to attract more settlers. By the mid-1800s, Delaware Park had become a thriving community with a population of over 1,000 people.
Geography
Delaware Park, NJ is located in the northern part of Burlington County, New Jersey. It is situated along the Delaware River, just south of the Pennsylvania border. The community is bordered by the towns of Florence, Burlington, and Mount Holly. The area is mostly flat, with some rolling hills in the northern part of the community. The climate in Delaware Park is humid and temperate, with hot summers and cold winters.
Economy
The economy of Delaware Park, NJ is largely based on agriculture and tourism. The area is home to a number of farms, which produce a variety of crops such as corn, wheat, and oats. The community is also home to a number of small businesses, including restaurants, retail stores, and service providers. In recent years, the area has seen an increase in tourism, as visitors come to explore the area’s natural beauty and historical sites.
Demographics
As of the 2010 census, the population of Delaware Park, NJ was 1,000 people. The racial makeup of the community was 94.2% White, 2.2% African American, 0.7% Asian, and 2.9% from other races. The median household income was $50,000, and the median age was 40 years. The majority of the population (90%) was born in the United States, and the majority of the population (90%) spoke English as their primary language.
Delaware Park, NJ is a small, unincorporated community with a rich history and a vibrant economy. The area is home to a diverse population, and is a popular destination for tourists looking to explore the area’s natural beauty and historical sites. The community is a great place to live, work, and raise a family.
Common Questions
What is Per Capita Income in Delaware Park?
Per Capita income in Delaware Park is $63,453.
What is the Median Family Income in Delaware Park?
Median Family Income in Delaware Park is $118,393.
What is the Median Household income in Delaware Park?
Median Household Income in Delaware Park is $112,393.
What is Income or Wage Gap in Delaware Park?
Income or Wage Gap in Delaware Park is 12.7%.
Women in Delaware Park earn 87.3 cents for every dollar earned by a man.
What is Inequality or Gini Index in Delaware Park?
Inequality or Gini Index in Delaware Park is 0.16.
What is the Total Population of Delaware Park?
Total Population of Delaware Park is 344.
What is the Total Male Population of Delaware Park?
Total Male Population of Delaware Park is 176.
What is the Total Female Population of Delaware Park?
Total Female Population of Delaware Park is 168.
What is the Ratio of Males per 100 Females in Delaware Park?
There are 104.76 Males per 100 Females in Delaware Park.
What is the Ratio of Females per 100 Males in Delaware Park?
There are 95.45 Females per 100 Males in Delaware Park.
What is the Median Population Age in Delaware Park?
Median Population Age in Delaware Park is 55.1 Years.
What is the Average Family Size in Delaware Park
Average Family Size in Delaware Park is 2.3 People.
What is the Average Household Size in Delaware Park
Average Household Size in Delaware Park is 2.1 People.
How Large is the Labor Force in Delaware Park?
There are 242 People in the Labor Forcein in Delaware Park.
What is the Percentage of People in the Labor Force in Delaware Park?
70.3% of People are in the Labor Force in Delaware Park.