Greentree, NJ Map & Demographics
Greentree Map
Greentree Overview
$62,882
PER CAPITA INCOME
$168,347
AVG FAMILY INCOME
$134,626
AVG HOUSEHOLD INCOME
10.2%
WAGE / INCOME GAP [ % ]
89.8¢/ $1
WAGE / INCOME GAP [ $ ]
0.40
INEQUALITY / GINI INDEX
11,016
TOTAL POPULATION
5,219
MALE POPULATION
5,797
FEMALE POPULATION
90.03
MALES / 100 FEMALES
111.07
FEMALES / 100 MALES
44.4
MEDIAN AGE
3.1
AVG FAMILY SIZE
2.6
AVG HOUSEHOLD SIZE
5,631
LABOR FORCE [ PEOPLE ]
62.9%
PERCENT IN LABOR FORCE
6.4%
UNEMPLOYMENT RATE
Income in Greentree
Income Overview in Greentree
Per Capita Income in Greentree is $62,882, while median incomes of families and households are $168,347 and $134,626 respectively.
| Characteristic | Number | Measure |
| Per Capita Income | 11,016 | $62,882 |
| Median Family Income | 3,052 | $168,347 |
| Mean Family Income | 3,052 | $183,197 |
| Median Household Income | 4,207 | $134,626 |
| Mean Household Income | 4,207 | $162,620 |
| Income Deficit | 3,052 | $0 |
| Wage / Income Gap (%) | 11,016 | 10.23% |
| Wage / Income Gap ($) | 11,016 | 89.77¢ per $1 |
| Gini / Inequality Index | 11,016 | 0.40 |
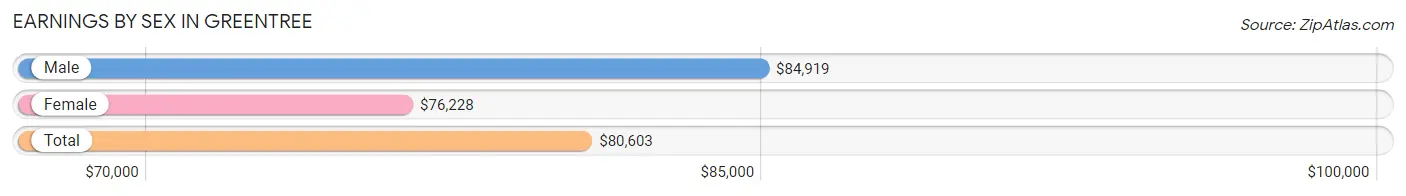
Earnings by Sex in Greentree
Average Earnings in Greentree are $80,603, $84,919 for men and $76,228 for women, a difference of 10.2%.
| Sex | Number | Average Earnings |
| Male | 2,950 (51.2%) | $84,919 |
| Female | 2,806 (48.7%) | $76,228 |
| Total | 5,756 (100.0%) | $80,603 |
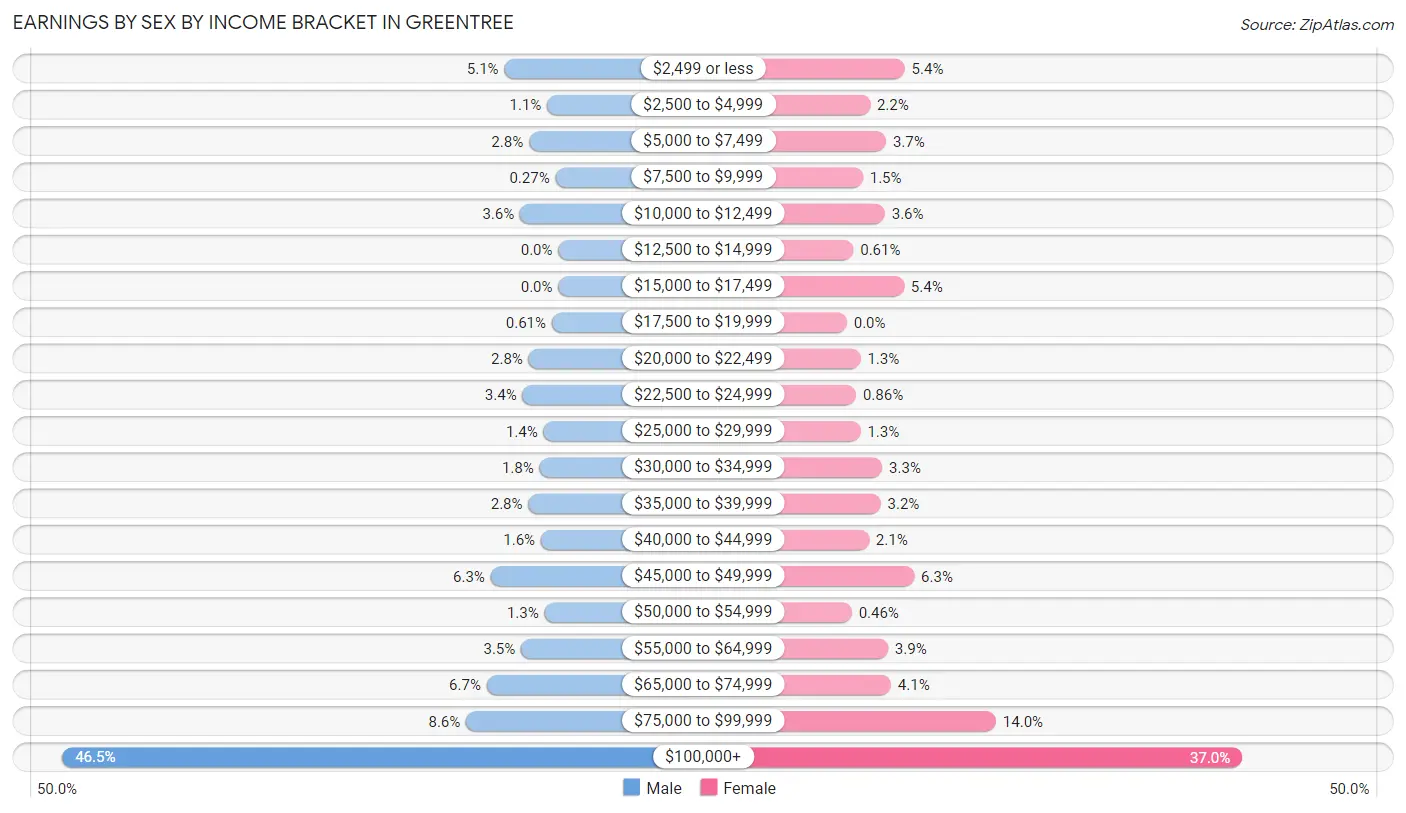
Earnings by Sex by Income Bracket in Greentree
The most common earnings brackets in Greentree are $100,000+ for men (1,371 | 46.5%) and $100,000+ for women (1,039 | 37.0%).
| Income | Male | Female |
| $2,499 or less | 149 (5.1%) | 152 (5.4%) |
| $2,500 to $4,999 | 31 (1.1%) | 61 (2.2%) |
| $5,000 to $7,499 | 81 (2.8%) | 103 (3.7%) |
| $7,500 to $9,999 | 8 (0.3%) | 42 (1.5%) |
| $10,000 to $12,499 | 106 (3.6%) | 100 (3.6%) |
| $12,500 to $14,999 | 0 (0.0%) | 17 (0.6%) |
| $15,000 to $17,499 | 0 (0.0%) | 150 (5.3%) |
| $17,500 to $19,999 | 18 (0.6%) | 0 (0.0%) |
| $20,000 to $22,499 | 82 (2.8%) | 36 (1.3%) |
| $22,500 to $24,999 | 99 (3.4%) | 24 (0.9%) |
| $25,000 to $29,999 | 41 (1.4%) | 36 (1.3%) |
| $30,000 to $34,999 | 52 (1.8%) | 93 (3.3%) |
| $35,000 to $39,999 | 83 (2.8%) | 89 (3.2%) |
| $40,000 to $44,999 | 48 (1.6%) | 58 (2.1%) |
| $45,000 to $49,999 | 187 (6.3%) | 177 (6.3%) |
| $50,000 to $54,999 | 38 (1.3%) | 13 (0.5%) |
| $55,000 to $64,999 | 103 (3.5%) | 108 (3.8%) |
| $65,000 to $74,999 | 198 (6.7%) | 116 (4.1%) |
| $75,000 to $99,999 | 255 (8.6%) | 392 (14.0%) |
| $100,000+ | 1,371 (46.5%) | 1,039 (37.0%) |
| Total | 2,950 (100.0%) | 2,806 (100.0%) |
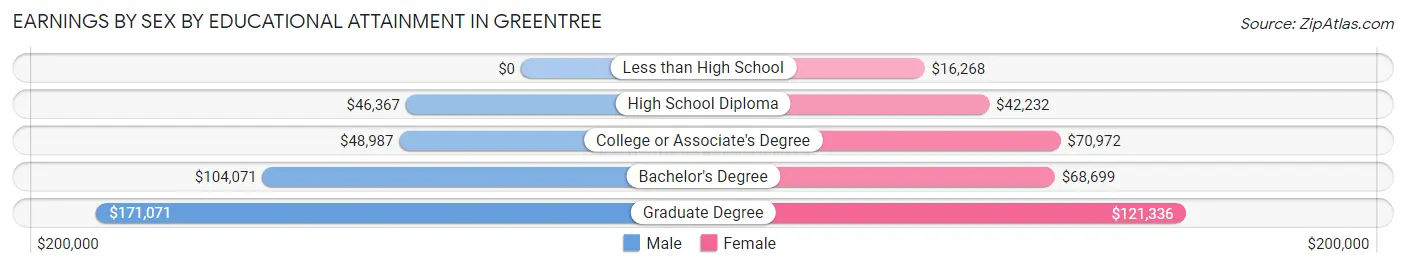
Earnings by Sex by Educational Attainment in Greentree
Average earnings in Greentree are $104,093 for men and $88,167 for women, a difference of 15.3%. Men with an educational attainment of graduate degree enjoy the highest average annual earnings of $171,071, while those with high school diploma education earn the least with $46,367. Women with an educational attainment of graduate degree earn the most with the average annual earnings of $121,336, while those with less than high school education have the smallest earnings of $16,268.
| Educational Attainment | Male Income | Female Income |
| Less than High School | - | - |
| High School Diploma | $46,367 | $42,232 |
| College or Associate's Degree | $48,987 | $70,972 |
| Bachelor's Degree | $104,071 | $68,699 |
| Graduate Degree | $171,071 | $121,336 |
| Total | $104,093 | $88,167 |
Family Income in Greentree
Family Income Brackets in Greentree
According to the Greentree family income data, there are 1,056 families falling into the $200,000+ income range, which is the most common income bracket and makes up 34.6% of all families.
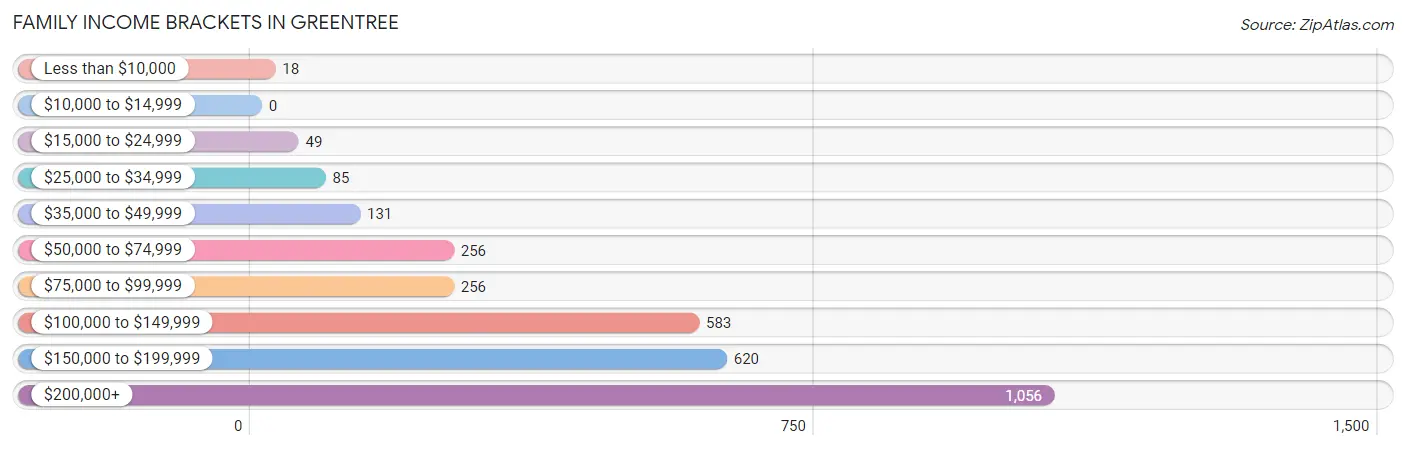
| Income Bracket | # Families | % Families |
| Less than $10,000 | 18 | 0.6% |
| $10,000 to $14,999 | 0 | 0.0% |
| $15,000 to $24,999 | 49 | 1.6% |
| $25,000 to $34,999 | 85 | 2.8% |
| $35,000 to $49,999 | 131 | 4.3% |
| $50,000 to $74,999 | 256 | 8.4% |
| $75,000 to $99,999 | 256 | 8.4% |
| $100,000 to $149,999 | 583 | 19.1% |
| $150,000 to $199,999 | 620 | 20.3% |
| $200,000+ | 1,056 | 34.6% |
Family Income by Famaliy Size in Greentree
5-person families (251 | 8.2%) account for the highest median family income in Greentree with $245,662 per family, while 2-person families (1,096 | 35.9%) have the highest median income of $61,078 per family member.
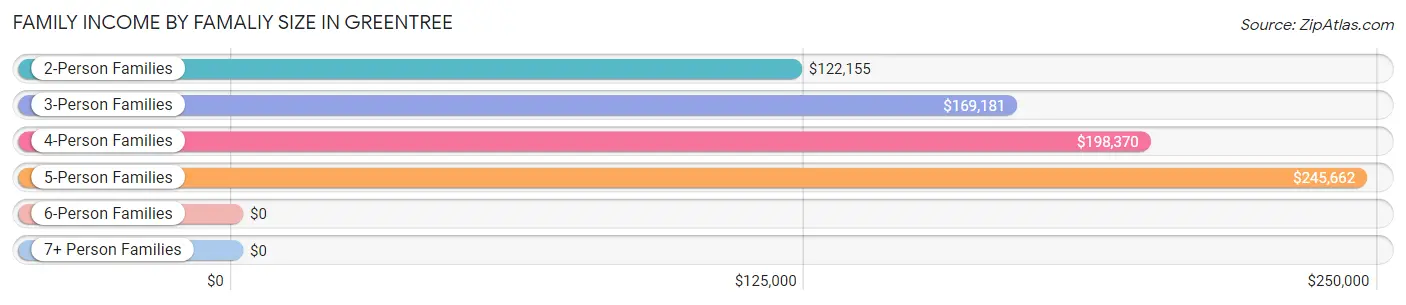
| Income Bracket | # Families | Median Income |
| 2-Person Families | 1,096 (35.9%) | $122,155 |
| 3-Person Families | 987 (32.3%) | $169,181 |
| 4-Person Families | 654 (21.4%) | $198,370 |
| 5-Person Families | 251 (8.2%) | $245,662 |
| 6-Person Families | 51 (1.7%) | $0 |
| 7+ Person Families | 13 (0.4%) | $0 |
| Total | 3,052 (100.0%) | $168,347 |
Family Income by Number of Earners in Greentree
The median family income in Greentree is $168,347, with families comprising 3+ earners (373) having the highest median family income of $218,897, while families with no earners (460) have the lowest median family income of $76,602, accounting for 12.2% and 15.1% of families, respectively.
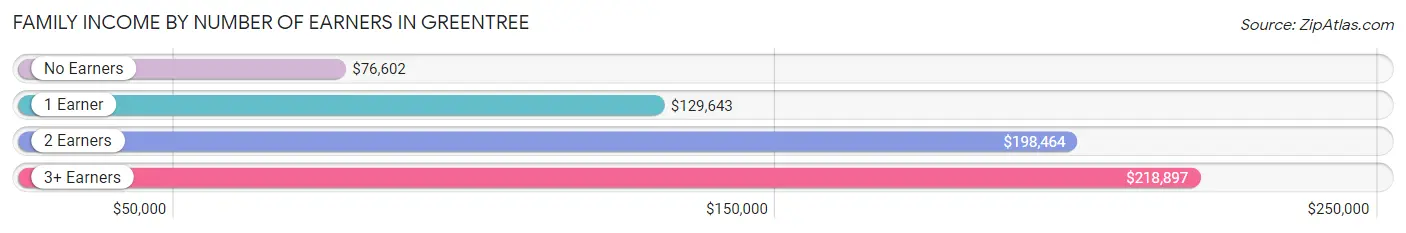
| Number of Earners | # Families | Median Income |
| No Earners | 460 (15.1%) | $76,602 |
| 1 Earner | 922 (30.2%) | $129,643 |
| 2 Earners | 1,297 (42.5%) | $198,464 |
| 3+ Earners | 373 (12.2%) | $218,897 |
| Total | 3,052 (100.0%) | $168,347 |
Household Income in Greentree
Household Income Brackets in Greentree
With 1,216 households falling in the category, the $200,000+ income range is the most frequent in Greentree, accounting for 28.9% of all households. In contrast, only 17 households (0.4%) fall into the $10,000 to $14,999 income bracket, making it the least populous group.
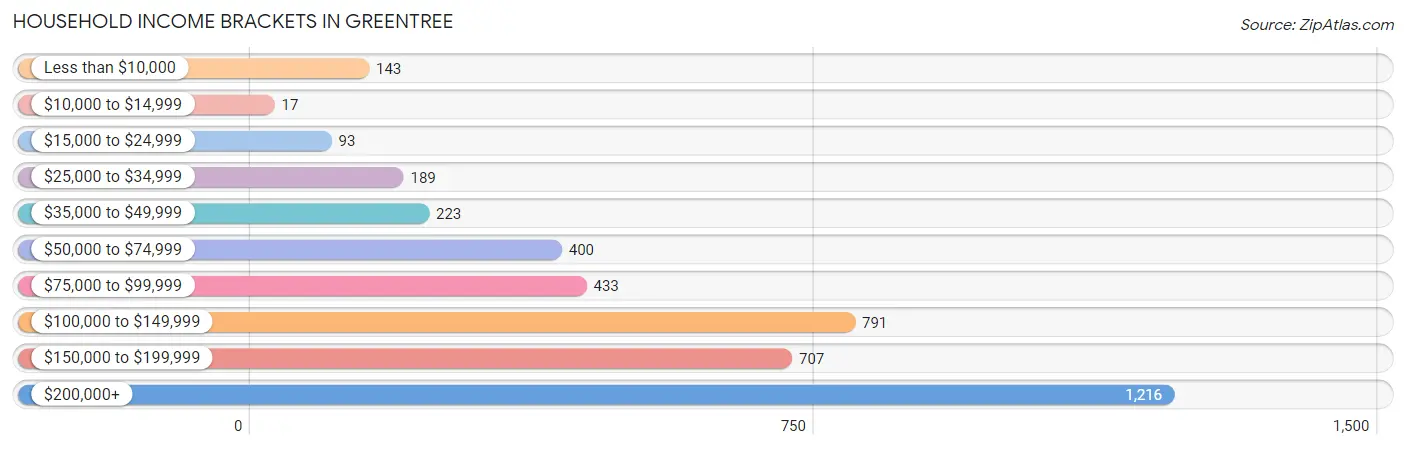
| Income Bracket | # Households | % Households |
| Less than $10,000 | 143 | 3.4% |
| $10,000 to $14,999 | 17 | 0.4% |
| $15,000 to $24,999 | 93 | 2.2% |
| $25,000 to $34,999 | 189 | 4.5% |
| $35,000 to $49,999 | 223 | 5.3% |
| $50,000 to $74,999 | 400 | 9.5% |
| $75,000 to $99,999 | 433 | 10.3% |
| $100,000 to $149,999 | 791 | 18.8% |
| $150,000 to $199,999 | 707 | 16.8% |
| $200,000+ | 1,216 | 28.9% |
Household Income by Householder Age in Greentree
The median household income in Greentree is $134,626, with the highest median household income of $175,394 found in the 45 to 64 years age bracket for the primary householder. A total of 1,859 households (44.2%) fall into this category. Meanwhile, the 15 to 24 years age bracket for the primary householder has the lowest median household income of $0, with 14 households (0.3%) in this group.
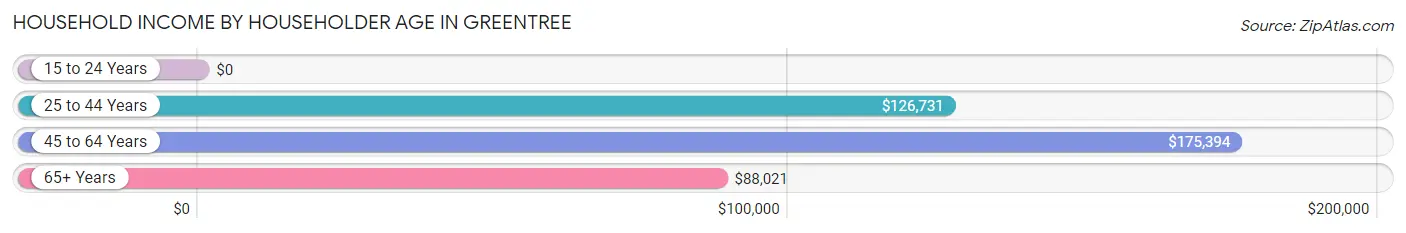
| Income Bracket | # Households | Median Income |
| 15 to 24 Years | 14 (0.3%) | $0 |
| 25 to 44 Years | 1,200 (28.5%) | $126,731 |
| 45 to 64 Years | 1,859 (44.2%) | $175,394 |
| 65+ Years | 1,134 (27.0%) | $88,021 |
| Total | 4,207 (100.0%) | $134,626 |
Poverty in Greentree
Income Below Poverty by Sex and Age in Greentree
With 4.1% poverty level for males and 3.9% for females among the residents of Greentree, 15 year old males and 16 and 17 year old females are the most vulnerable to poverty, with 33 males (25.6%) and 25 females (13.6%) in their respective age groups living below the poverty level.
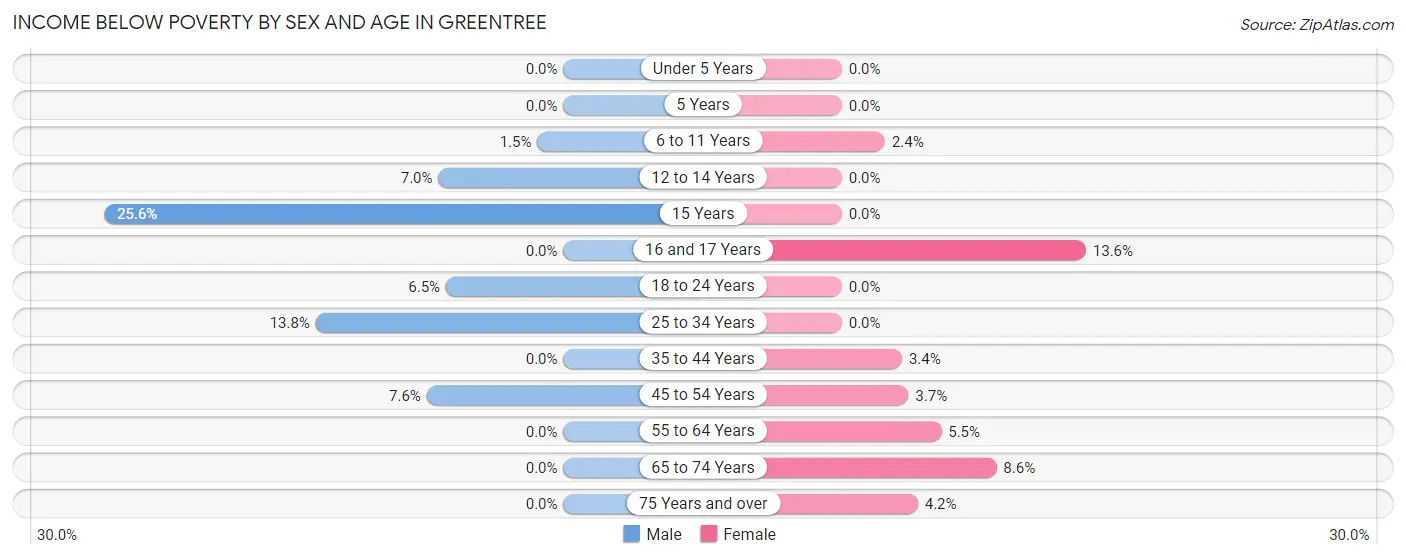
| Age Bracket | Male | Female |
| Under 5 Years | 0 (0.0%) | 0 (0.0%) |
| 5 Years | 0 (0.0%) | 0 (0.0%) |
| 6 to 11 Years | 6 (1.5%) | 8 (2.4%) |
| 12 to 14 Years | 11 (7.0%) | 0 (0.0%) |
| 15 Years | 33 (25.6%) | 0 (0.0%) |
| 16 and 17 Years | 0 (0.0%) | 25 (13.6%) |
| 18 to 24 Years | 28 (6.5%) | 0 (0.0%) |
| 25 to 34 Years | 72 (13.8%) | 0 (0.0%) |
| 35 to 44 Years | 0 (0.0%) | 37 (3.4%) |
| 45 to 54 Years | 63 (7.6%) | 29 (3.7%) |
| 55 to 64 Years | 0 (0.0%) | 46 (5.5%) |
| 65 to 74 Years | 0 (0.0%) | 49 (8.6%) |
| 75 Years and over | 0 (0.0%) | 30 (4.2%) |
| Total | 213 (4.1%) | 224 (3.9%) |
Income Above Poverty by Sex and Age in Greentree
According to the poverty statistics in Greentree, males aged under 5 years and females aged under 5 years are the age groups that are most secure financially, with 100.0% of males and 100.0% of females in these age groups living above the poverty line.
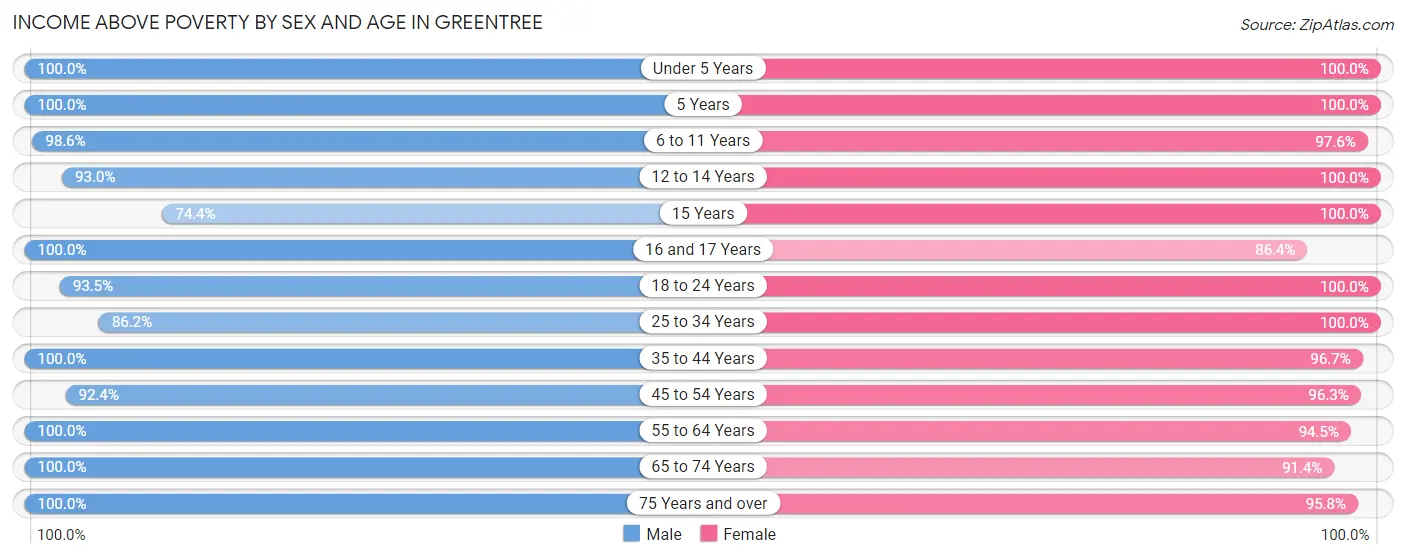
| Age Bracket | Male | Female |
| Under 5 Years | 186 (100.0%) | 291 (100.0%) |
| 5 Years | 153 (100.0%) | 118 (100.0%) |
| 6 to 11 Years | 409 (98.6%) | 326 (97.6%) |
| 12 to 14 Years | 147 (93.0%) | 180 (100.0%) |
| 15 Years | 96 (74.4%) | 99 (100.0%) |
| 16 and 17 Years | 94 (100.0%) | 159 (86.4%) |
| 18 to 24 Years | 400 (93.5%) | 286 (100.0%) |
| 25 to 34 Years | 450 (86.2%) | 311 (100.0%) |
| 35 to 44 Years | 586 (100.0%) | 1,067 (96.7%) |
| 45 to 54 Years | 765 (92.4%) | 752 (96.3%) |
| 55 to 64 Years | 766 (100.0%) | 784 (94.5%) |
| 65 to 74 Years | 553 (100.0%) | 520 (91.4%) |
| 75 Years and over | 392 (100.0%) | 680 (95.8%) |
| Total | 4,997 (95.9%) | 5,573 (96.1%) |
Income Below Poverty Among Married-Couple Families in Greentree
The poverty statistics for married-couple families in Greentree show that 0.9% or 21 of the total 2,478 families live below the poverty line. Families with 3 or 4 children have the highest poverty rate of 8.7%, comprising of 21 families. On the other hand, families with no children have the lowest poverty rate of 0.0%, which includes 0 families.
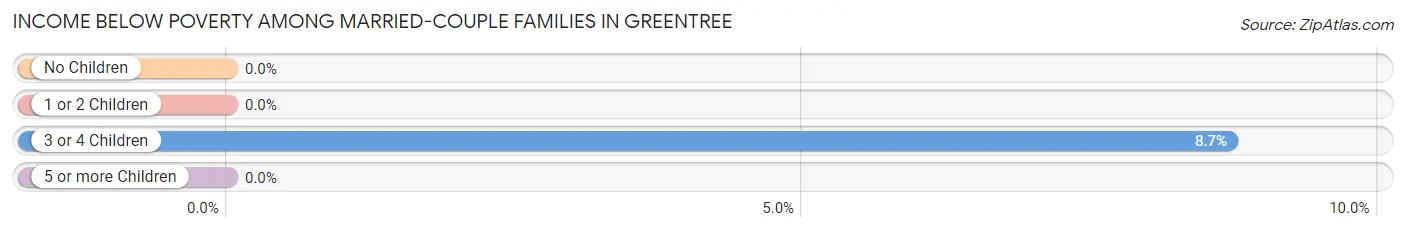
| Children | Above Poverty | Below Poverty |
| No Children | 1,377 (100.0%) | 0 (0.0%) |
| 1 or 2 Children | 860 (100.0%) | 0 (0.0%) |
| 3 or 4 Children | 220 (91.3%) | 21 (8.7%) |
| 5 or more Children | 0 (0.0%) | 0 (0.0%) |
| Total | 2,457 (99.2%) | 21 (0.9%) |
Income Below Poverty Among Single-Parent Households in Greentree
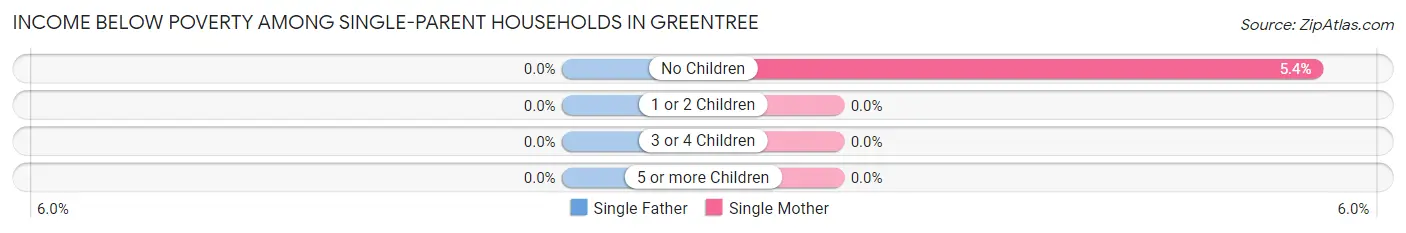
| Children | Single Father | Single Mother |
| No Children | 0 (0.0%) | 17 (5.4%) |
| 1 or 2 Children | 0 (0.0%) | 0 (0.0%) |
| 3 or 4 Children | 0 (0.0%) | 0 (0.0%) |
| 5 or more Children | 0 (0.0%) | 0 (0.0%) |
| Total | 0 (0.0%) | 17 (3.6%) |
Income Below Poverty Among Married-Couple vs Single-Parent Households in Greentree
The poverty data for Greentree shows that 21 of the married-couple family households (0.9%) and 17 of the single-parent households (3.0%) are living below the poverty level. Within the married-couple family households, those with 3 or 4 children have the highest poverty rate, with 21 households (8.7%) falling below the poverty line. Among the single-parent households, those with no children have the highest poverty rate, with 17 household (4.6%) living below poverty.
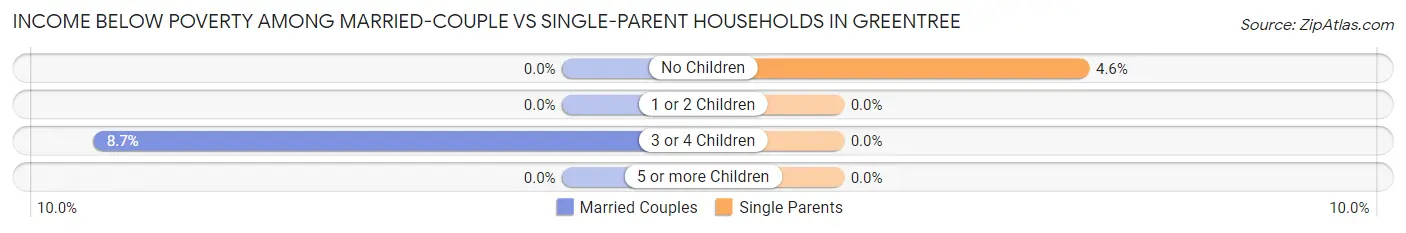
| Children | Married-Couple Families | Single-Parent Households |
| No Children | 0 (0.0%) | 17 (4.6%) |
| 1 or 2 Children | 0 (0.0%) | 0 (0.0%) |
| 3 or 4 Children | 21 (8.7%) | 0 (0.0%) |
| 5 or more Children | 0 (0.0%) | 0 (0.0%) |
| Total | 21 (0.9%) | 17 (3.0%) |
Race in Greentree
The most populous races in Greentree are White / Caucasian (7,257 | 65.9%), Asian (2,703 | 24.5%), and Hispanic or Latino (664 | 6.0%).
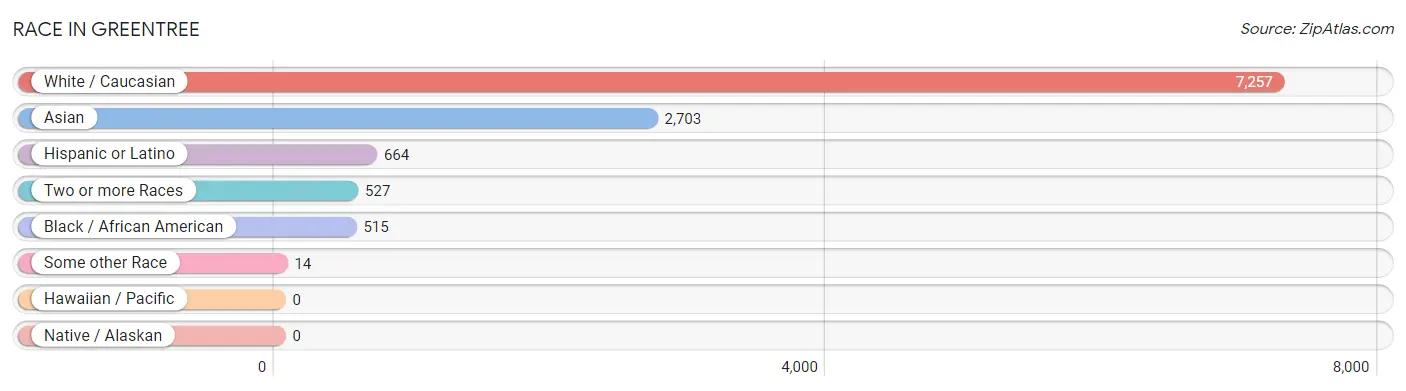
| Race | # Population | % Population |
| Asian | 2,703 | 24.5% |
| Black / African American | 515 | 4.7% |
| Hawaiian / Pacific | 0 | 0.0% |
| Hispanic or Latino | 664 | 6.0% |
| Native / Alaskan | 0 | 0.0% |
| White / Caucasian | 7,257 | 65.9% |
| Two or more Races | 527 | 4.8% |
| Some other Race | 14 | 0.1% |
| Total | 11,016 | 100.0% |
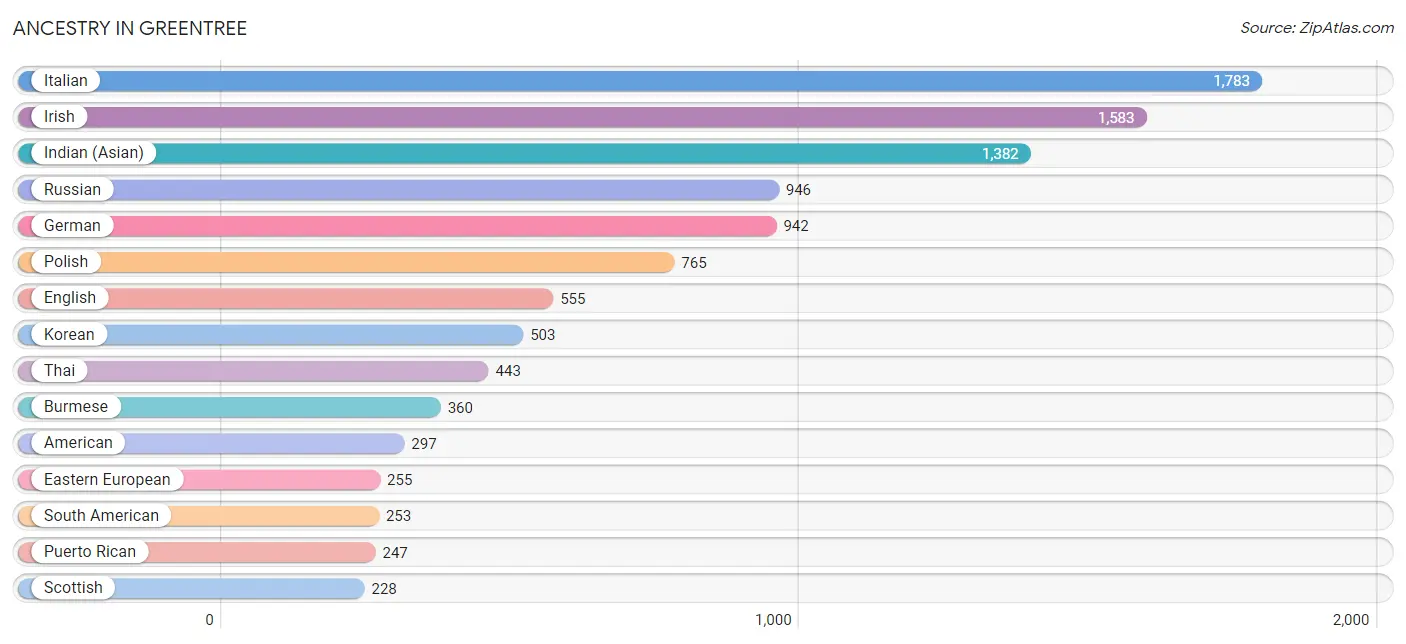
Ancestry in Greentree
The most populous ancestries reported in Greentree are Italian (1,783 | 16.2%), Irish (1,583 | 14.4%), Indian (Asian) (1,382 | 12.6%), Russian (946 | 8.6%), and German (942 | 8.6%), together accounting for 60.3% of all Greentree residents.
| Ancestry | # Population | % Population |
| Albanian | 20 | 0.2% |
| American | 297 | 2.7% |
| Arab | 17 | 0.2% |
| Armenian | 11 | 0.1% |
| Australian | 41 | 0.4% |
| Austrian | 29 | 0.3% |
| Burmese | 360 | 3.3% |
| Central American | 55 | 0.5% |
| Central American Indian | 11 | 0.1% |
| Colombian | 42 | 0.4% |
| Cuban | 71 | 0.6% |
| Czech | 173 | 1.6% |
| Danish | 31 | 0.3% |
| Dominican | 38 | 0.3% |
| Dutch | 15 | 0.1% |
| Eastern European | 255 | 2.3% |
| Ecuadorian | 60 | 0.5% |
| English | 555 | 5.0% |
| European | 25 | 0.2% |
| Filipino | 115 | 1.0% |
| French | 58 | 0.5% |
| German | 942 | 8.6% |
| Greek | 87 | 0.8% |
| Guatemalan | 21 | 0.2% |
| Hungarian | 72 | 0.6% |
| Indian (Asian) | 1,382 | 12.6% |
| Irish | 1,583 | 14.4% |
| Israeli | 33 | 0.3% |
| Italian | 1,783 | 16.2% |
| Jamaican | 66 | 0.6% |
| Korean | 503 | 4.6% |
| Lithuanian | 29 | 0.3% |
| Norwegian | 187 | 1.7% |
| Panamanian | 34 | 0.3% |
| Pennsylvania German | 14 | 0.1% |
| Polish | 765 | 6.9% |
| Portuguese | 31 | 0.3% |
| Puerto Rican | 247 | 2.2% |
| Romanian | 80 | 0.7% |
| Russian | 946 | 8.6% |
| Scandinavian | 15 | 0.1% |
| Scotch-Irish | 19 | 0.2% |
| Scottish | 228 | 2.1% |
| Serbian | 62 | 0.6% |
| Slovak | 28 | 0.3% |
| South American | 253 | 2.3% |
| Sri Lankan | 116 | 1.1% |
| Subsaharan African | 30 | 0.3% |
| Swedish | 102 | 0.9% |
| Swiss | 38 | 0.3% |
| Syrian | 17 | 0.2% |
| Thai | 443 | 4.0% |
| Ukrainian | 101 | 0.9% |
| Uruguayan | 151 | 1.4% |
| Welsh | 43 | 0.4% |
| Yugoslavian | 16 | 0.2% | View All 56 Rows |
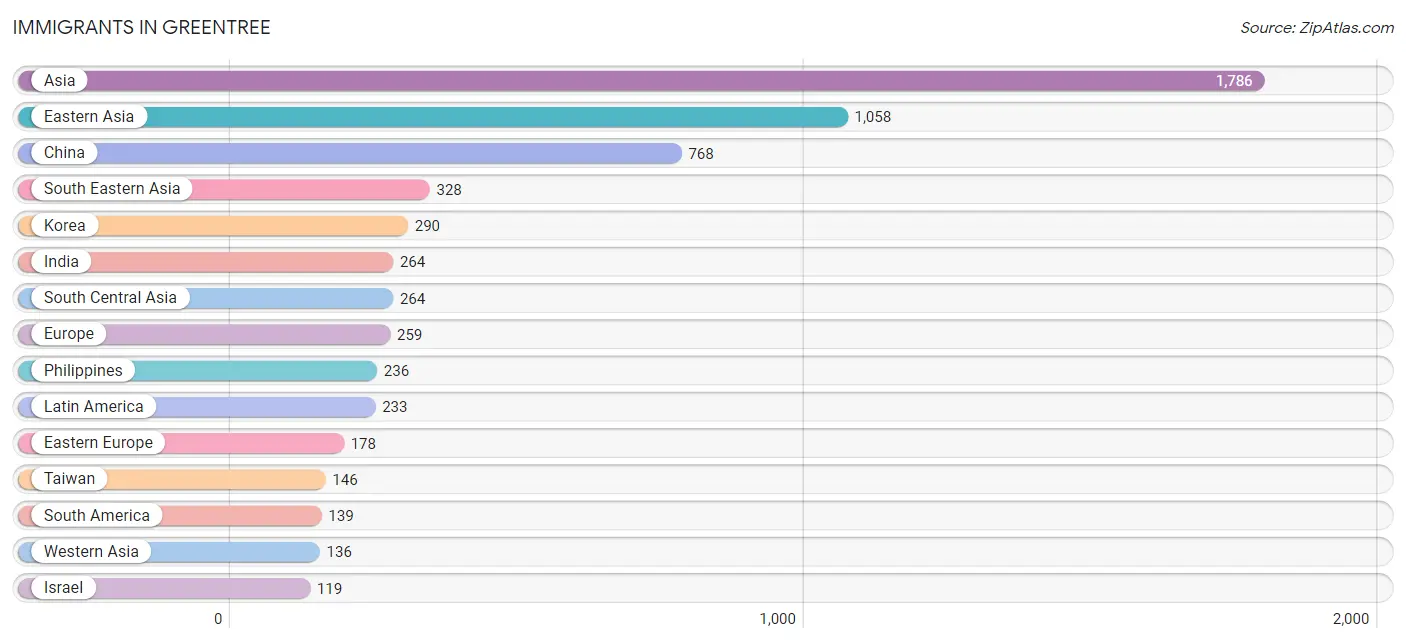
Immigrants in Greentree
The most numerous immigrant groups reported in Greentree came from Asia (1,786 | 16.2%), Eastern Asia (1,058 | 9.6%), China (768 | 7.0%), South Eastern Asia (328 | 3.0%), and Korea (290 | 2.6%), together accounting for 38.4% of all Greentree residents.
| Immigration Origin | # Population | % Population |
| Africa | 45 | 0.4% |
| Asia | 1,786 | 16.2% |
| Australia | 41 | 0.4% |
| Austria | 14 | 0.1% |
| Belarus | 12 | 0.1% |
| Canada | 21 | 0.2% |
| Caribbean | 73 | 0.7% |
| Central America | 21 | 0.2% |
| China | 768 | 7.0% |
| Colombia | 42 | 0.4% |
| Eastern Africa | 15 | 0.1% |
| Eastern Asia | 1,058 | 9.6% |
| Eastern Europe | 178 | 1.6% |
| Ecuador | 21 | 0.2% |
| England | 22 | 0.2% |
| Europe | 259 | 2.4% |
| Germany | 25 | 0.2% |
| Guatemala | 21 | 0.2% |
| Haiti | 37 | 0.3% |
| Hong Kong | 116 | 1.1% |
| India | 264 | 2.4% |
| Israel | 119 | 1.1% |
| Jamaica | 36 | 0.3% |
| Korea | 290 | 2.6% |
| Latin America | 233 | 2.1% |
| Malaysia | 17 | 0.2% |
| Middle Africa | 30 | 0.3% |
| Northern Europe | 42 | 0.4% |
| Oceania | 41 | 0.4% |
| Philippines | 236 | 2.1% |
| Poland | 42 | 0.4% |
| Russia | 83 | 0.7% |
| Serbia | 25 | 0.2% |
| South America | 139 | 1.3% |
| South Central Asia | 264 | 2.4% |
| South Eastern Asia | 328 | 3.0% |
| Syria | 17 | 0.2% |
| Taiwan | 146 | 1.3% |
| Uruguay | 76 | 0.7% |
| Vietnam | 75 | 0.7% |
| Western Asia | 136 | 1.2% |
| Western Europe | 39 | 0.4% |
| Zaire | 30 | 0.3% | View All 43 Rows |
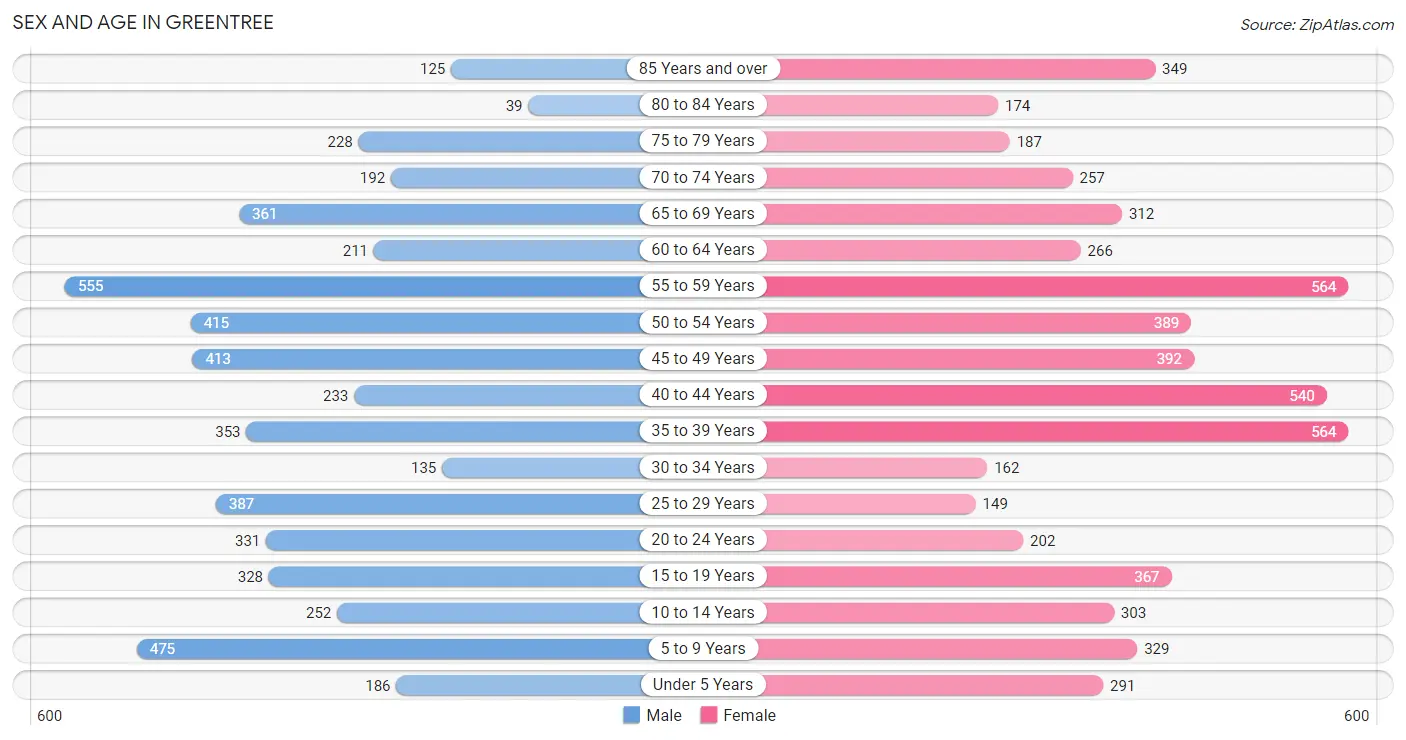
Sex and Age in Greentree
Sex and Age in Greentree
The most populous age groups in Greentree are 55 to 59 Years (555 | 10.6%) for men and 35 to 39 Years (564 | 9.7%) for women.
| Age Bracket | Male | Female |
| Under 5 Years | 186 (3.6%) | 291 (5.0%) |
| 5 to 9 Years | 475 (9.1%) | 329 (5.7%) |
| 10 to 14 Years | 252 (4.8%) | 303 (5.2%) |
| 15 to 19 Years | 328 (6.3%) | 367 (6.3%) |
| 20 to 24 Years | 331 (6.3%) | 202 (3.5%) |
| 25 to 29 Years | 387 (7.4%) | 149 (2.6%) |
| 30 to 34 Years | 135 (2.6%) | 162 (2.8%) |
| 35 to 39 Years | 353 (6.8%) | 564 (9.7%) |
| 40 to 44 Years | 233 (4.5%) | 540 (9.3%) |
| 45 to 49 Years | 413 (7.9%) | 392 (6.8%) |
| 50 to 54 Years | 415 (8.0%) | 389 (6.7%) |
| 55 to 59 Years | 555 (10.6%) | 564 (9.7%) |
| 60 to 64 Years | 211 (4.0%) | 266 (4.6%) |
| 65 to 69 Years | 361 (6.9%) | 312 (5.4%) |
| 70 to 74 Years | 192 (3.7%) | 257 (4.4%) |
| 75 to 79 Years | 228 (4.4%) | 187 (3.2%) |
| 80 to 84 Years | 39 (0.7%) | 174 (3.0%) |
| 85 Years and over | 125 (2.4%) | 349 (6.0%) |
| Total | 5,219 (100.0%) | 5,797 (100.0%) |
Families and Households in Greentree
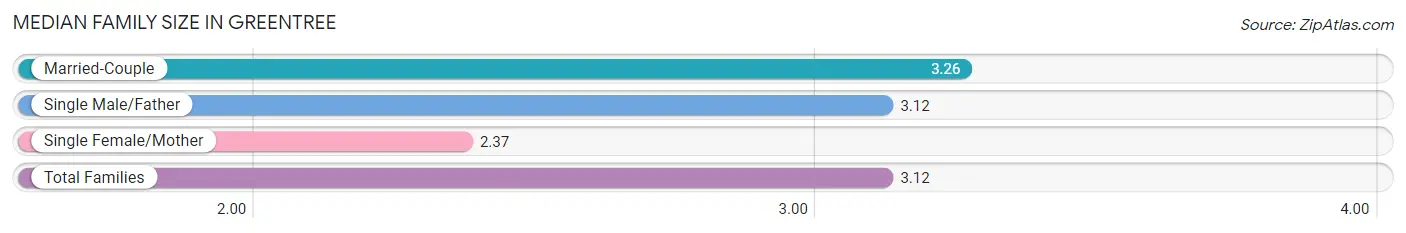
Median Family Size in Greentree
The median family size in Greentree is 3.12 persons per family, with married-couple families (2,478 | 81.2%) accounting for the largest median family size of 3.26 persons per family. On the other hand, single female/mother families (474 | 15.5%) represent the smallest median family size with 2.37 persons per family.
| Family Type | # Families | Family Size |
| Married-Couple | 2,478 (81.2%) | 3.26 |
| Single Male/Father | 100 (3.3%) | 3.12 |
| Single Female/Mother | 474 (15.5%) | 2.37 |
| Total Families | 3,052 (100.0%) | 3.12 |
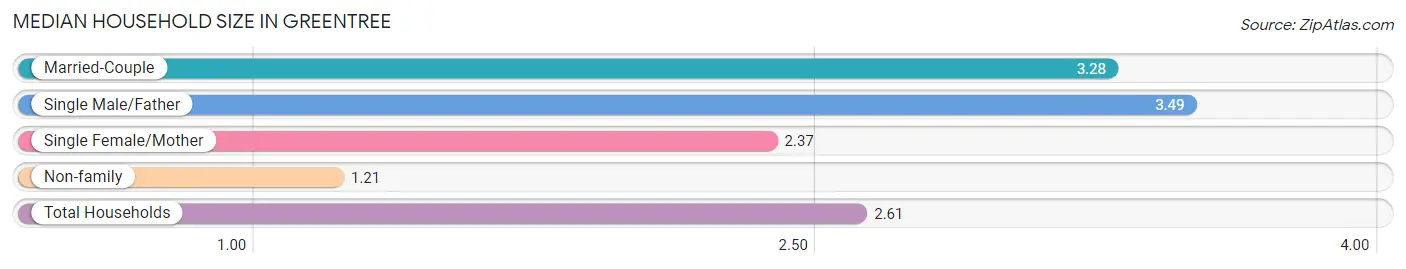
Median Household Size in Greentree
The median household size in Greentree is 2.61 persons per household, with single male/father households (100 | 2.4%) accounting for the largest median household size of 3.49 persons per household. non-family households (1,155 | 27.5%) represent the smallest median household size with 1.21 persons per household.
| Household Type | # Households | Household Size |
| Married-Couple | 2,478 (58.9%) | 3.28 |
| Single Male/Father | 100 (2.4%) | 3.49 |
| Single Female/Mother | 474 (11.3%) | 2.37 |
| Non-family | 1,155 (27.5%) | 1.21 |
| Total Households | 4,207 (100.0%) | 2.61 |
Household Size by Marriage Status in Greentree
Out of a total of 4,207 households in Greentree, 3,052 (72.6%) are family households, while 1,155 (27.5%) are nonfamily households. The most numerous type of family households are 2-person households, comprising 1,038, and the most common type of nonfamily households are 1-person households, comprising 946.
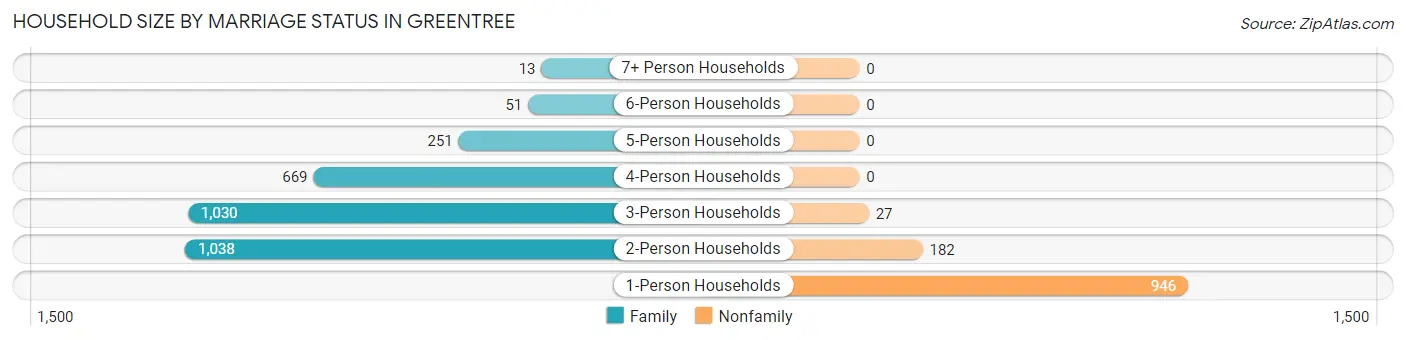
| Household Size | Family Households | Nonfamily Households |
| 1-Person Households | - | 946 (22.5%) |
| 2-Person Households | 1,038 (24.7%) | 182 (4.3%) |
| 3-Person Households | 1,030 (24.5%) | 27 (0.6%) |
| 4-Person Households | 669 (15.9%) | 0 (0.0%) |
| 5-Person Households | 251 (6.0%) | 0 (0.0%) |
| 6-Person Households | 51 (1.2%) | 0 (0.0%) |
| 7+ Person Households | 13 (0.3%) | 0 (0.0%) |
| Total | 3,052 (72.6%) | 1,155 (27.5%) |
Female Fertility in Greentree
Fertility by Age in Greentree
Average fertility rate in Greentree is 28.0 births per 1,000 women. Women in the age bracket of 20 to 34 years have the highest fertility rate with 39.0 births per 1,000 women. Women in the age bracket of 35 to 50 years acount for 70.2% of all women with births.
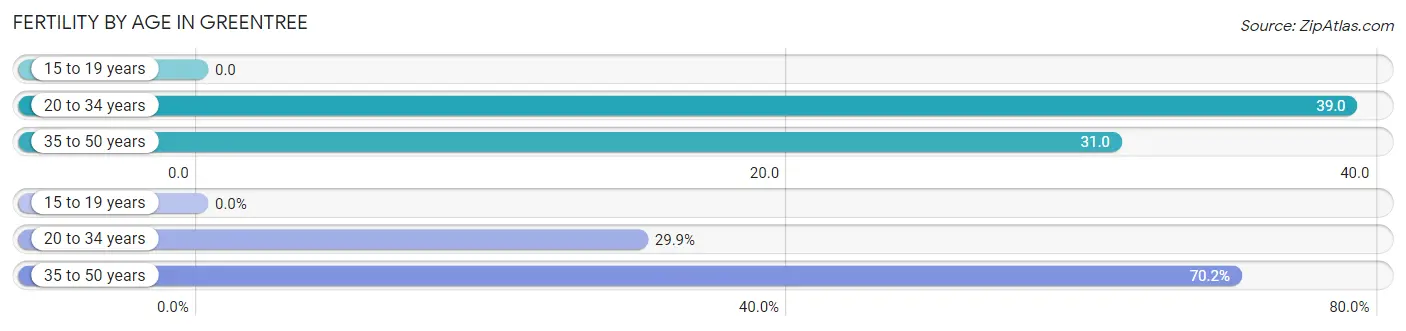
| Age Bracket | Women with Births | Births / 1,000 Women |
| 15 to 19 years | 0 (0.0%) | 0.0 |
| 20 to 34 years | 20 (29.8%) | 39.0 |
| 35 to 50 years | 47 (70.2%) | 31.0 |
| Total | 67 (100.0%) | 28.0 |
Fertility by Age by Marriage Status in Greentree
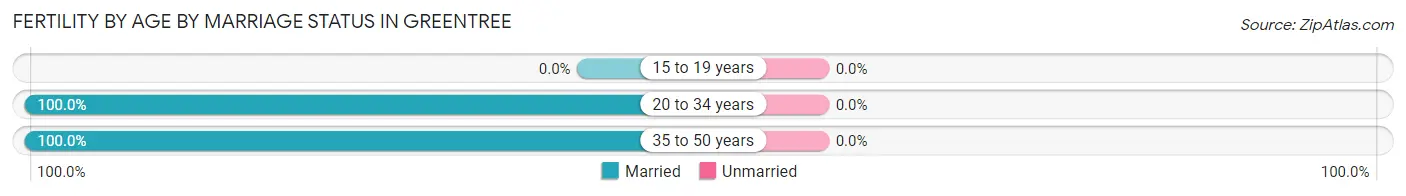
| Age Bracket | Married | Unmarried |
| 15 to 19 years | 0 (0.0%) | 0 (0.0%) |
| 20 to 34 years | 20 (100.0%) | 0 (0.0%) |
| 35 to 50 years | 47 (100.0%) | 0 (0.0%) |
| Total | 67 (100.0%) | 0 (0.0%) |
Fertility by Education in Greentree
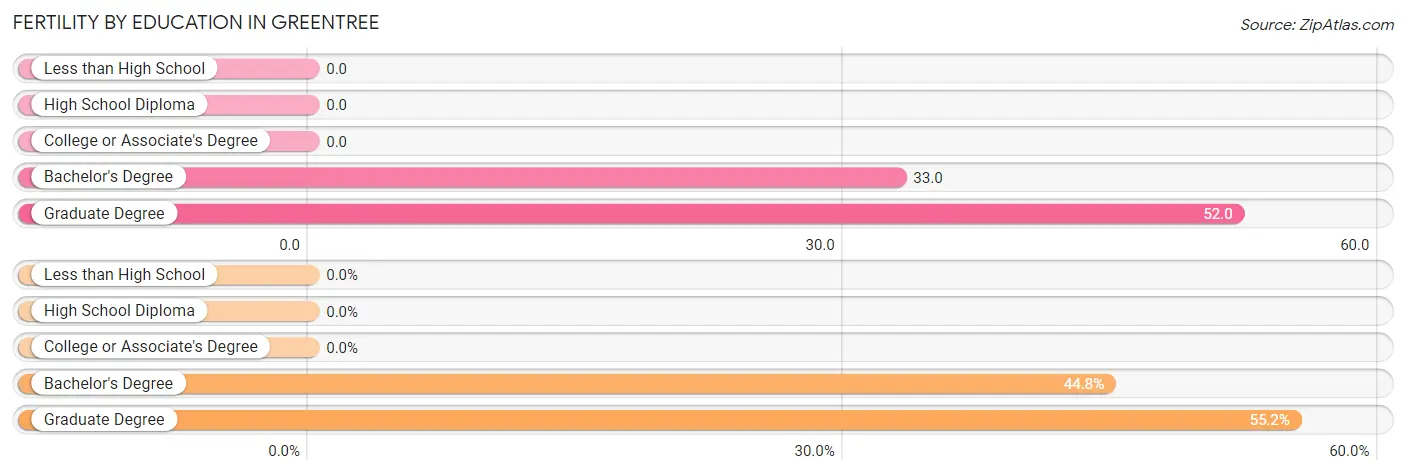
| Educational Attainment | Women with Births | Births / 1,000 Women |
| Less than High School | 0 (0.0%) | 0.0 |
| High School Diploma | 0 (0.0%) | 0.0 |
| College or Associate's Degree | 0 (0.0%) | 0.0 |
| Bachelor's Degree | 30 (44.8%) | 33.0 |
| Graduate Degree | 37 (55.2%) | 52.0 |
| Total | 67 (100.0%) | 28.0 |
Fertility by Education by Marriage Status in Greentree
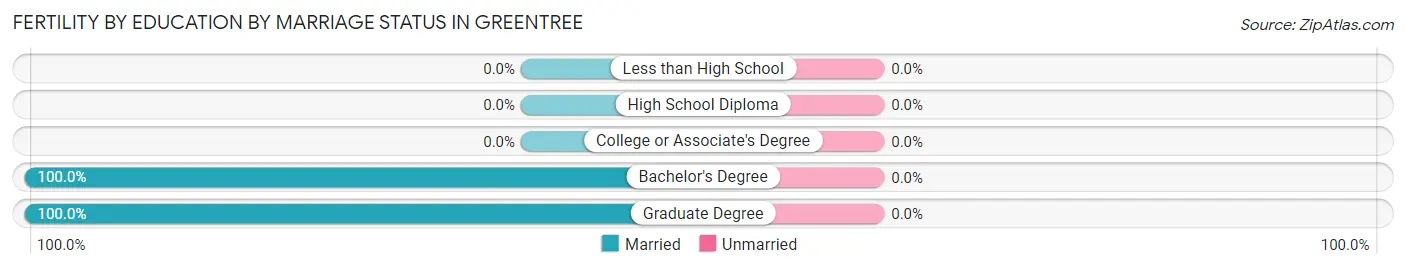
| Educational Attainment | Married | Unmarried |
| Less than High School | 0 (0.0%) | 0 (0.0%) |
| High School Diploma | 0 (0.0%) | 0 (0.0%) |
| College or Associate's Degree | 0 (0.0%) | 0 (0.0%) |
| Bachelor's Degree | 30 (100.0%) | 0 (0.0%) |
| Graduate Degree | 37 (100.0%) | 0 (0.0%) |
| Total | 67 (100.0%) | 0 (0.0%) |
Employment Characteristics in Greentree
Employment by Class of Employer in Greentree
Among the 5,232 employed individuals in Greentree, private company employees (3,243 | 62.0%), not-for-profit organizations (603 | 11.5%), and local government employees (337 | 6.4%) make up the most common classes of employment.
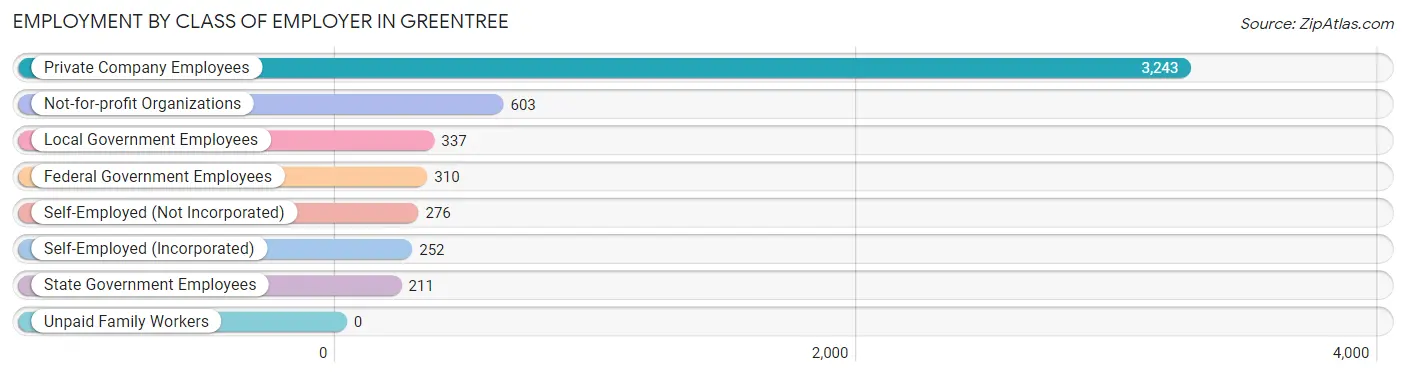
| Employer Class | # Employees | % Employees |
| Private Company Employees | 3,243 | 62.0% |
| Self-Employed (Incorporated) | 252 | 4.8% |
| Self-Employed (Not Incorporated) | 276 | 5.3% |
| Not-for-profit Organizations | 603 | 11.5% |
| Local Government Employees | 337 | 6.4% |
| State Government Employees | 211 | 4.0% |
| Federal Government Employees | 310 | 5.9% |
| Unpaid Family Workers | 0 | 0.0% |
| Total | 5,232 | 100.0% |
Employment Status by Age in Greentree
According to the labor force statistics for Greentree, out of the total population over 16 years of age (8,952), 62.9% or 5,631 individuals are in the labor force, with 6.4% or 360 of them unemployed. The age group with the highest labor force participation rate is 55 to 59 years, with 90.0% or 1,007 individuals in the labor force. Within the labor force, the 20 to 24 years age range has the highest percentage of unemployed individuals, with 39.8% or 140 of them being unemployed.

| Age Bracket | In Labor Force | Unemployed |
| 16 to 19 Years | 179 (38.3%) | 0 (0.0%) |
| 20 to 24 Years | 352 (66.0%) | 140 (39.8%) |
| 25 to 29 Years | 434 (81.0%) | 32 (7.4%) |
| 30 to 34 Years | 233 (78.5%) | 21 (9.0%) |
| 35 to 44 Years | 1,469 (86.9%) | 76 (5.2%) |
| 45 to 54 Years | 1,261 (78.4%) | 43 (3.4%) |
| 55 to 59 Years | 1,007 (90.0%) | 0 (0.0%) |
| 60 to 64 Years | 321 (67.3%) | 0 (0.0%) |
| 65 to 74 Years | 293 (26.1%) | 30 (10.2%) |
| 75 Years and over | 77 (7.0%) | 15 (19.5%) |
| Total | 5,631 (62.9%) | 360 (6.4%) |
Employment Status by Educational Attainment in Greentree
According to labor force statistics for Greentree, 82.5% of individuals (4,726) out of the total population between 25 and 64 years of age (5,728) are in the labor force, with 3.7% or 175 of them being unemployed. The group with the highest labor force participation rate are those with the educational attainment of bachelor's degree or higher, with 85.6% or 3,608 individuals in the labor force. Within the labor force, individuals with less than high school education have the highest percentage of unemployment, with 7.2% or 8 of them being unemployed.
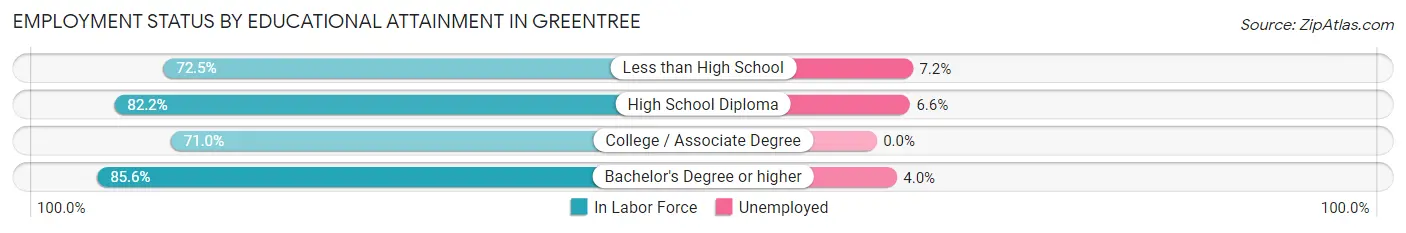
| Educational Attainment | In Labor Force | Unemployed |
| Less than High School | 111 (72.5%) | 11 (7.2%) |
| High School Diploma | 319 (82.2%) | 26 (6.6%) |
| College / Associate Degree | 690 (71.0%) | 0 (0.0%) |
| Bachelor's Degree or higher | 3,608 (85.6%) | 169 (4.0%) |
| Total | 4,726 (82.5%) | 212 (3.7%) |
Employment Occupations by Sex in Greentree
Management, Business, Science and Arts Occupations
The most common Management, Business, Science and Arts occupations in Greentree are Management (1,118 | 21.2%), Community & Social Service (816 | 15.5%), Health Diagnosing & Treating (755 | 14.3%), Health Technologists (576 | 10.9%), and Computers, Engineering & Science (550 | 10.4%).
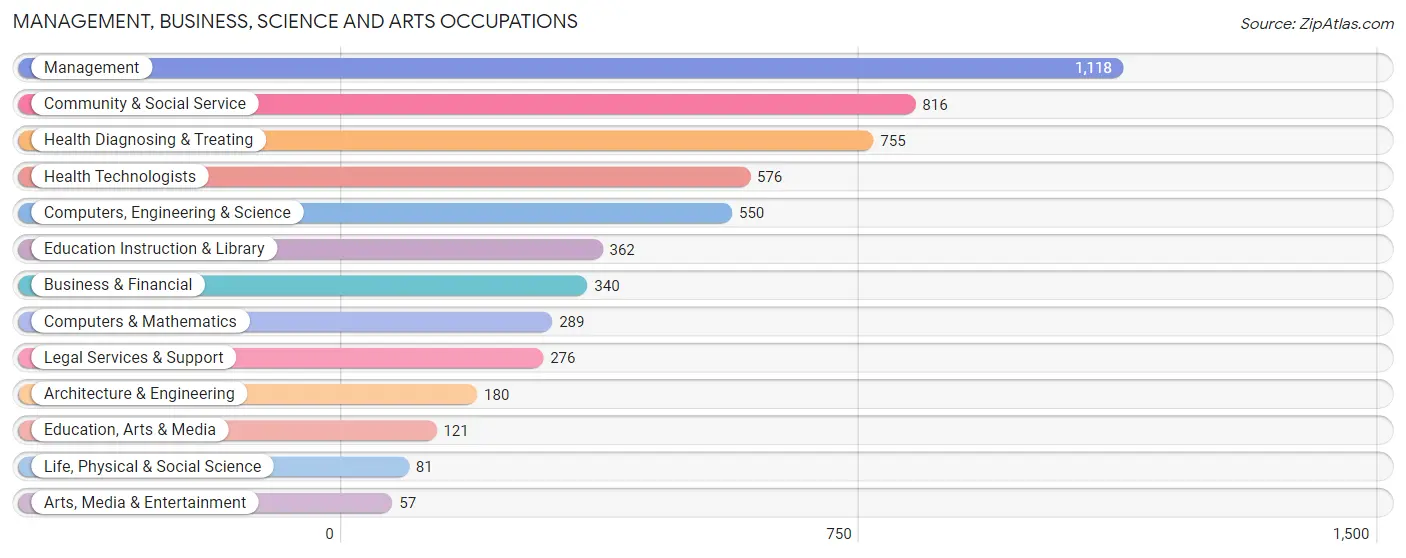
Management, Business, Science and Arts Occupations by Sex
Within the Management, Business, Science and Arts occupations in Greentree, the most male-oriented occupations are Architecture & Engineering (100.0%), Business & Financial (80.3%), and Computers, Engineering & Science (73.3%), while the most female-oriented occupations are Education Instruction & Library (86.5%), Life, Physical & Social Science (85.2%), and Community & Social Service (67.3%).
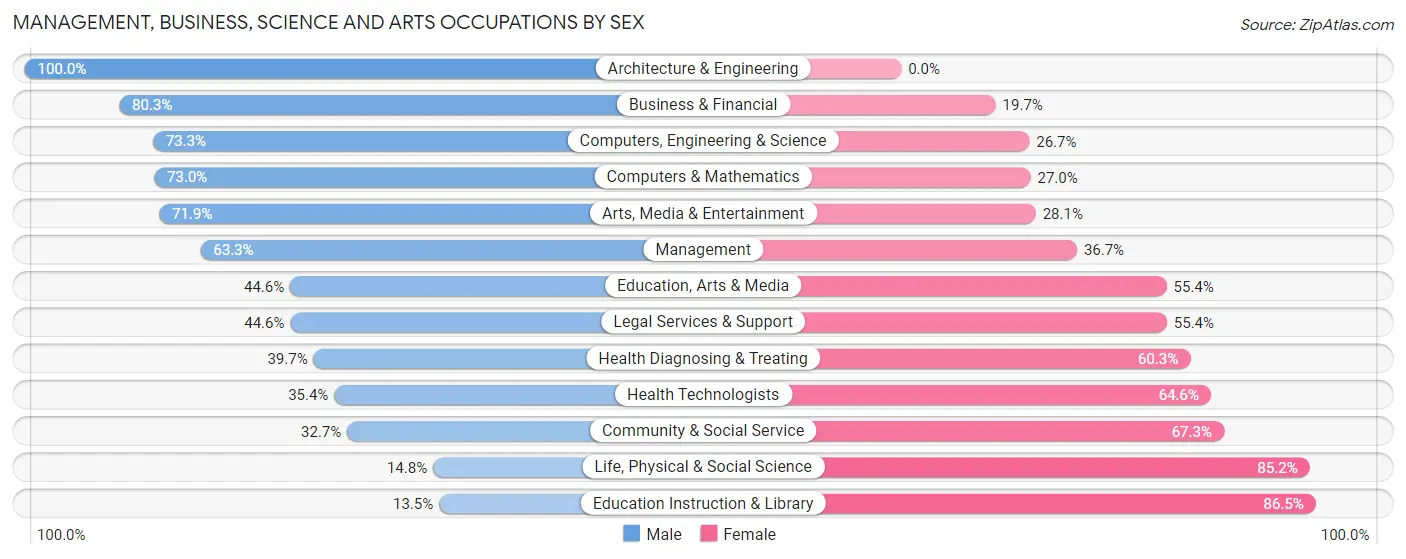
| Occupation | Male | Female |
| Management | 708 (63.3%) | 410 (36.7%) |
| Business & Financial | 273 (80.3%) | 67 (19.7%) |
| Computers, Engineering & Science | 403 (73.3%) | 147 (26.7%) |
| Computers & Mathematics | 211 (73.0%) | 78 (27.0%) |
| Architecture & Engineering | 180 (100.0%) | 0 (0.0%) |
| Life, Physical & Social Science | 12 (14.8%) | 69 (85.2%) |
| Community & Social Service | 267 (32.7%) | 549 (67.3%) |
| Education, Arts & Media | 54 (44.6%) | 67 (55.4%) |
| Legal Services & Support | 123 (44.6%) | 153 (55.4%) |
| Education Instruction & Library | 49 (13.5%) | 313 (86.5%) |
| Arts, Media & Entertainment | 41 (71.9%) | 16 (28.1%) |
| Health Diagnosing & Treating | 300 (39.7%) | 455 (60.3%) |
| Health Technologists | 204 (35.4%) | 372 (64.6%) |
| Total (Category) | 1,951 (54.5%) | 1,628 (45.5%) |
| Total (Overall) | 2,767 (52.5%) | 2,502 (47.5%) |
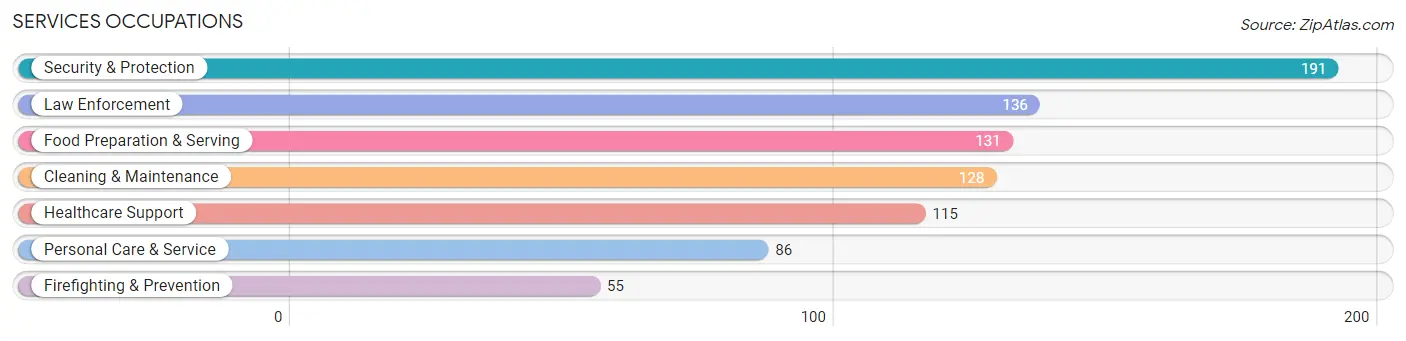
Services Occupations
The most common Services occupations in Greentree are Security & Protection (191 | 3.6%), Law Enforcement (136 | 2.6%), Food Preparation & Serving (131 | 2.5%), Cleaning & Maintenance (128 | 2.4%), and Healthcare Support (115 | 2.2%).
Services Occupations by Sex
Within the Services occupations in Greentree, the most male-oriented occupations are Firefighting & Prevention (100.0%), Security & Protection (84.8%), and Law Enforcement (78.7%), while the most female-oriented occupations are Healthcare Support (100.0%), Personal Care & Service (100.0%), and Food Preparation & Serving (77.9%).
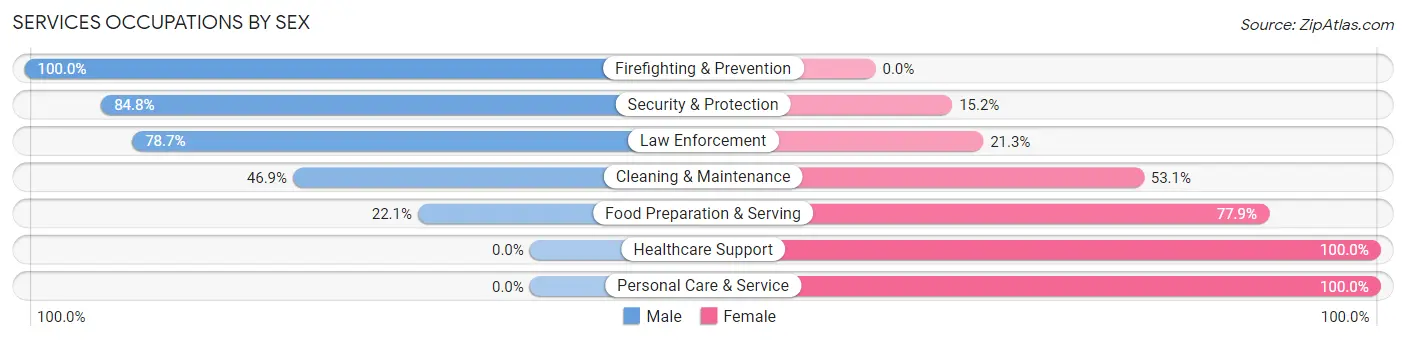
| Occupation | Male | Female |
| Healthcare Support | 0 (0.0%) | 115 (100.0%) |
| Security & Protection | 162 (84.8%) | 29 (15.2%) |
| Firefighting & Prevention | 55 (100.0%) | 0 (0.0%) |
| Law Enforcement | 107 (78.7%) | 29 (21.3%) |
| Food Preparation & Serving | 29 (22.1%) | 102 (77.9%) |
| Cleaning & Maintenance | 60 (46.9%) | 68 (53.1%) |
| Personal Care & Service | 0 (0.0%) | 86 (100.0%) |
| Total (Category) | 251 (38.6%) | 400 (61.4%) |
| Total (Overall) | 2,767 (52.5%) | 2,502 (47.5%) |
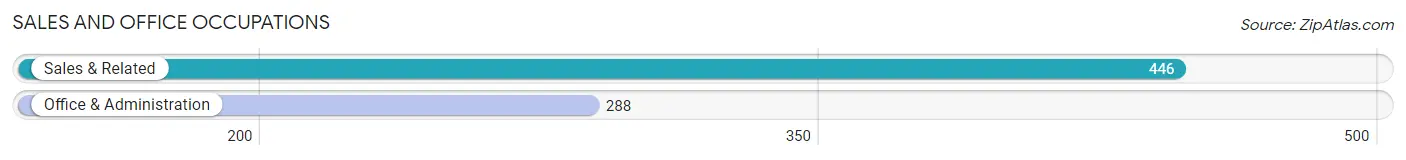
Sales and Office Occupations
The most common Sales and Office occupations in Greentree are Sales & Related (446 | 8.5%), and Office & Administration (288 | 5.5%).
Sales and Office Occupations by Sex
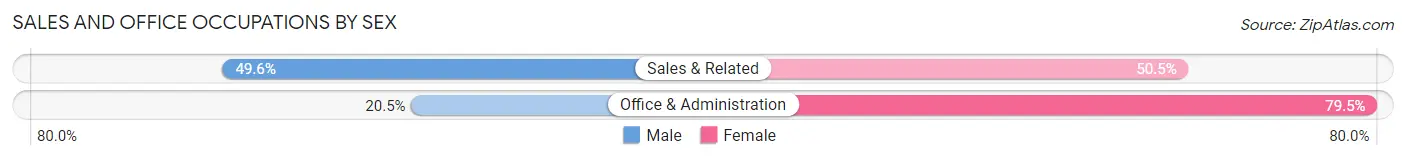
| Occupation | Male | Female |
| Sales & Related | 221 (49.5%) | 225 (50.4%) |
| Office & Administration | 59 (20.5%) | 229 (79.5%) |
| Total (Category) | 280 (38.2%) | 454 (61.9%) |
| Total (Overall) | 2,767 (52.5%) | 2,502 (47.5%) |
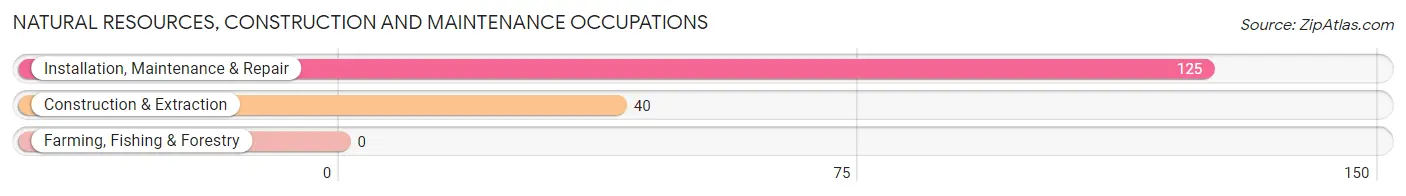
Natural Resources, Construction and Maintenance Occupations
The most common Natural Resources, Construction and Maintenance occupations in Greentree are Installation, Maintenance & Repair (125 | 2.4%), and Construction & Extraction (40 | 0.8%).
Natural Resources, Construction and Maintenance Occupations by Sex
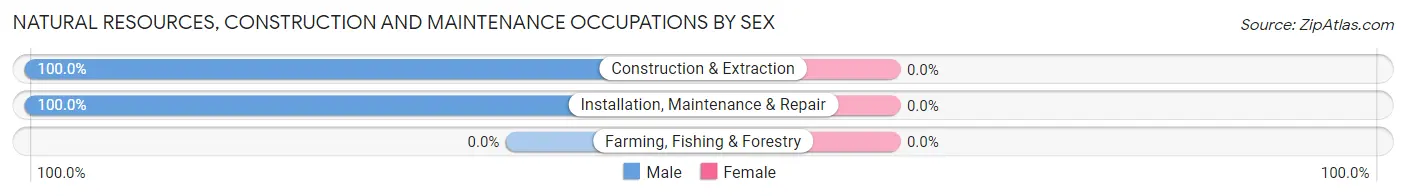
| Occupation | Male | Female |
| Farming, Fishing & Forestry | 0 (0.0%) | 0 (0.0%) |
| Construction & Extraction | 40 (100.0%) | 0 (0.0%) |
| Installation, Maintenance & Repair | 125 (100.0%) | 0 (0.0%) |
| Total (Category) | 165 (100.0%) | 0 (0.0%) |
| Total (Overall) | 2,767 (52.5%) | 2,502 (47.5%) |
Production, Transportation and Moving Occupations
The most common Production, Transportation and Moving occupations in Greentree are Transportation (79 | 1.5%), Production (44 | 0.8%), and Material Moving (17 | 0.3%).
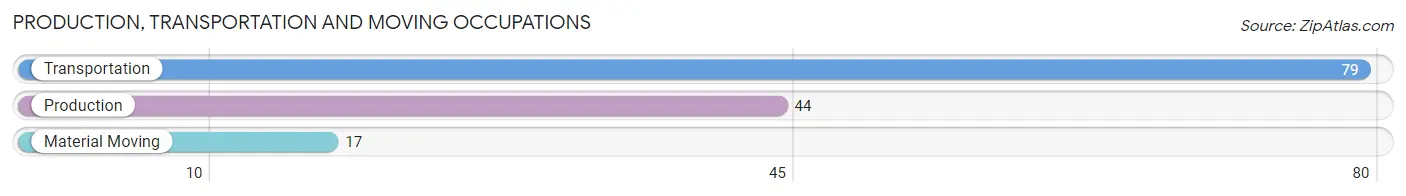
Production, Transportation and Moving Occupations by Sex
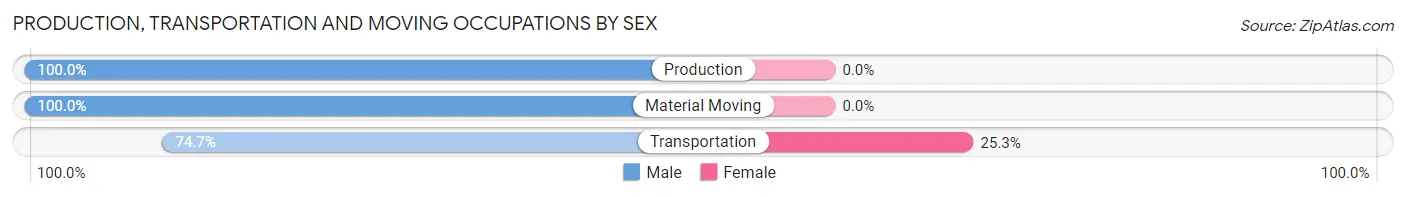
| Occupation | Male | Female |
| Production | 44 (100.0%) | 0 (0.0%) |
| Transportation | 59 (74.7%) | 20 (25.3%) |
| Material Moving | 17 (100.0%) | 0 (0.0%) |
| Total (Category) | 120 (85.7%) | 20 (14.3%) |
| Total (Overall) | 2,767 (52.5%) | 2,502 (47.5%) |
Employment Industries by Sex in Greentree
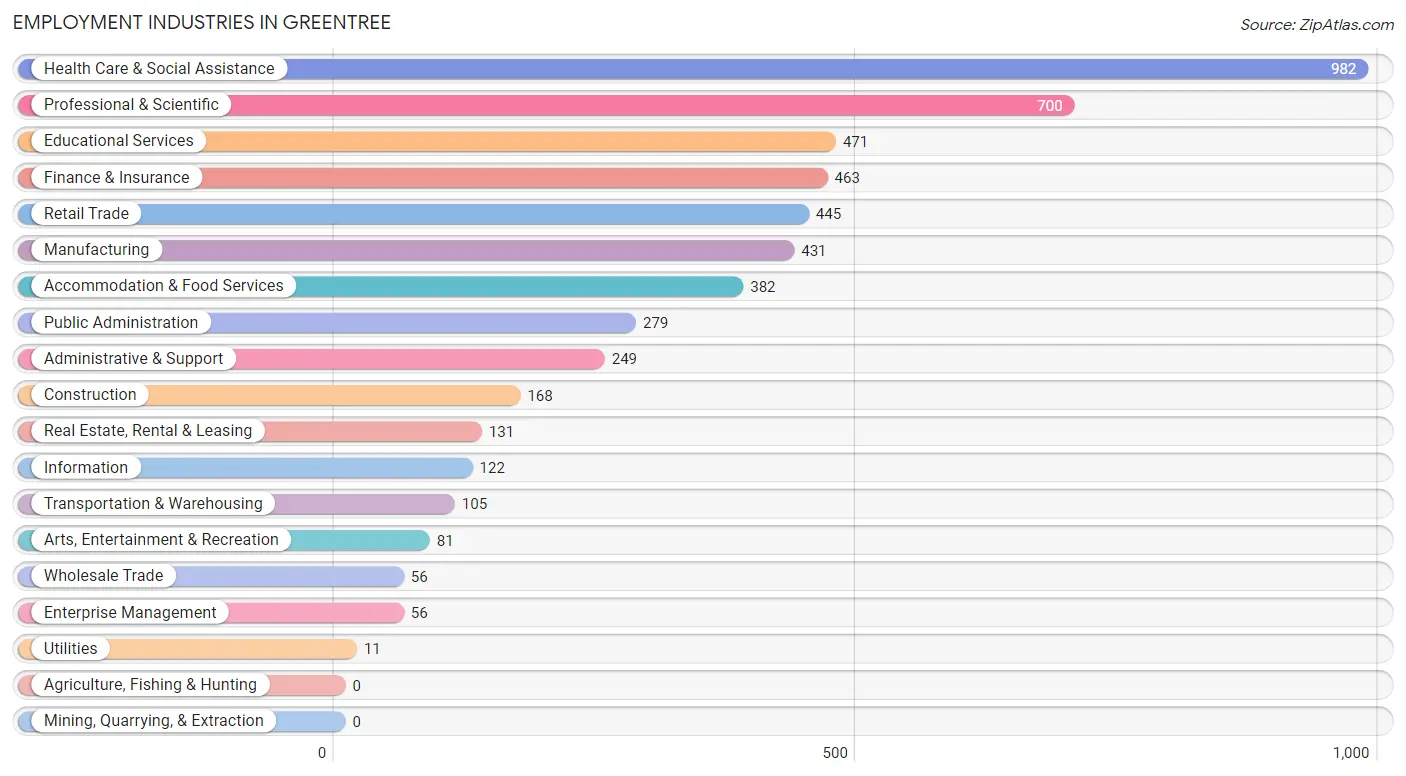
Employment Industries in Greentree
The major employment industries in Greentree include Health Care & Social Assistance (982 | 18.6%), Professional & Scientific (700 | 13.3%), Educational Services (471 | 8.9%), Finance & Insurance (463 | 8.8%), and Retail Trade (445 | 8.5%).
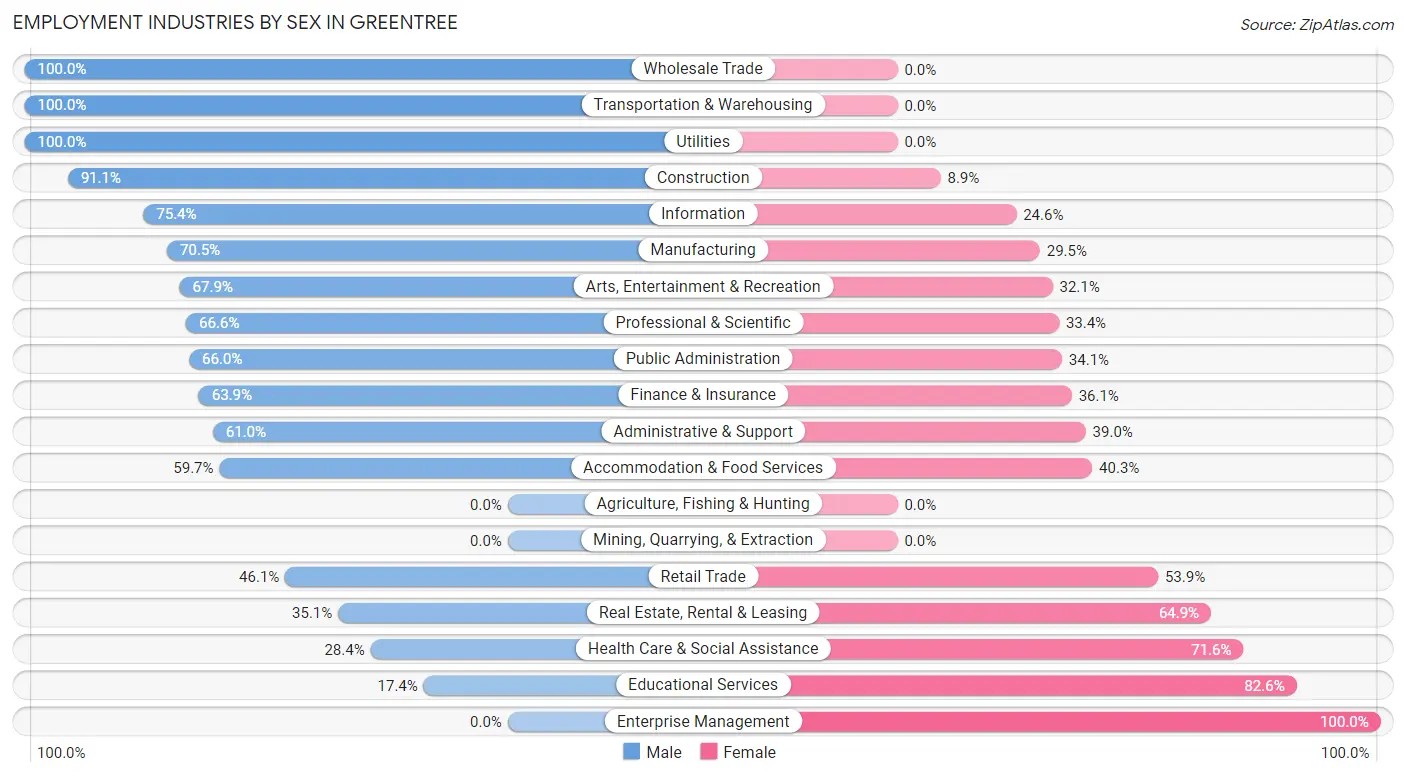
Employment Industries by Sex in Greentree
The Greentree industries that see more men than women are Wholesale Trade (100.0%), Transportation & Warehousing (100.0%), and Utilities (100.0%), whereas the industries that tend to have a higher number of women are Enterprise Management (100.0%), Educational Services (82.6%), and Health Care & Social Assistance (71.6%).
| Industry | Male | Female |
| Agriculture, Fishing & Hunting | 0 (0.0%) | 0 (0.0%) |
| Mining, Quarrying, & Extraction | 0 (0.0%) | 0 (0.0%) |
| Construction | 153 (91.1%) | 15 (8.9%) |
| Manufacturing | 304 (70.5%) | 127 (29.5%) |
| Wholesale Trade | 56 (100.0%) | 0 (0.0%) |
| Retail Trade | 205 (46.1%) | 240 (53.9%) |
| Transportation & Warehousing | 105 (100.0%) | 0 (0.0%) |
| Utilities | 11 (100.0%) | 0 (0.0%) |
| Information | 92 (75.4%) | 30 (24.6%) |
| Finance & Insurance | 296 (63.9%) | 167 (36.1%) |
| Real Estate, Rental & Leasing | 46 (35.1%) | 85 (64.9%) |
| Professional & Scientific | 466 (66.6%) | 234 (33.4%) |
| Enterprise Management | 0 (0.0%) | 56 (100.0%) |
| Administrative & Support | 152 (61.0%) | 97 (39.0%) |
| Educational Services | 82 (17.4%) | 389 (82.6%) |
| Health Care & Social Assistance | 279 (28.4%) | 703 (71.6%) |
| Arts, Entertainment & Recreation | 55 (67.9%) | 26 (32.1%) |
| Accommodation & Food Services | 228 (59.7%) | 154 (40.3%) |
| Public Administration | 184 (65.9%) | 95 (34.1%) |
| Total | 2,767 (52.5%) | 2,502 (47.5%) |
Education in Greentree
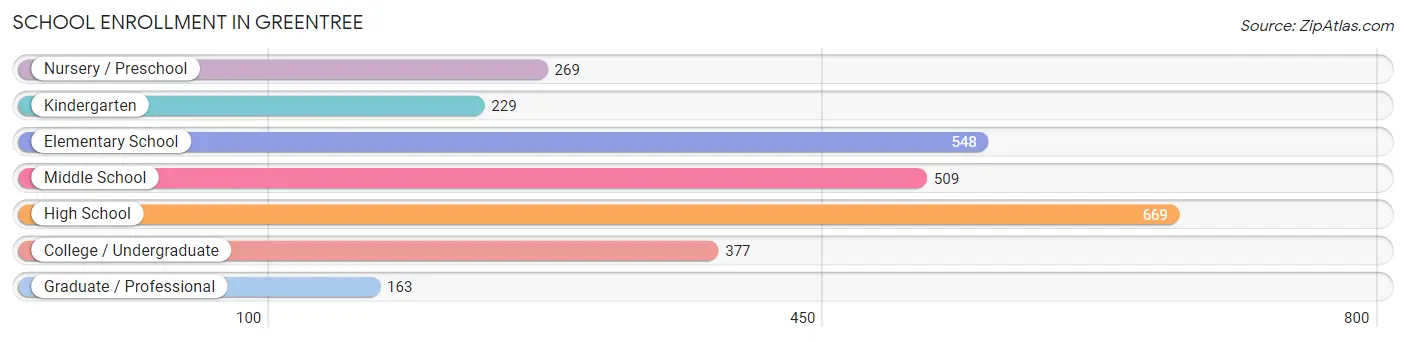
School Enrollment in Greentree
The most common levels of schooling among the 2,764 students in Greentree are high school (669 | 24.2%), elementary school (548 | 19.8%), and middle school (509 | 18.4%).
| School Level | # Students | % Students |
| Nursery / Preschool | 269 | 9.7% |
| Kindergarten | 229 | 8.3% |
| Elementary School | 548 | 19.8% |
| Middle School | 509 | 18.4% |
| High School | 669 | 24.2% |
| College / Undergraduate | 377 | 13.6% |
| Graduate / Professional | 163 | 5.9% |
| Total | 2,764 | 100.0% |
School Enrollment by Age by Funding Source in Greentree
Out of a total of 2,764 students who are enrolled in schools in Greentree, 575 (20.8%) attend a private institution, while the remaining 2,189 (79.2%) are enrolled in public schools. The age group of 25 to 34 year olds has the highest likelihood of being enrolled in private schools, with 86 (100.0% in the age bracket) enrolled. Conversely, the age group of 10 to 14 year olds has the lowest likelihood of being enrolled in a private school, with 524 (94.4% in the age bracket) attending a public institution.
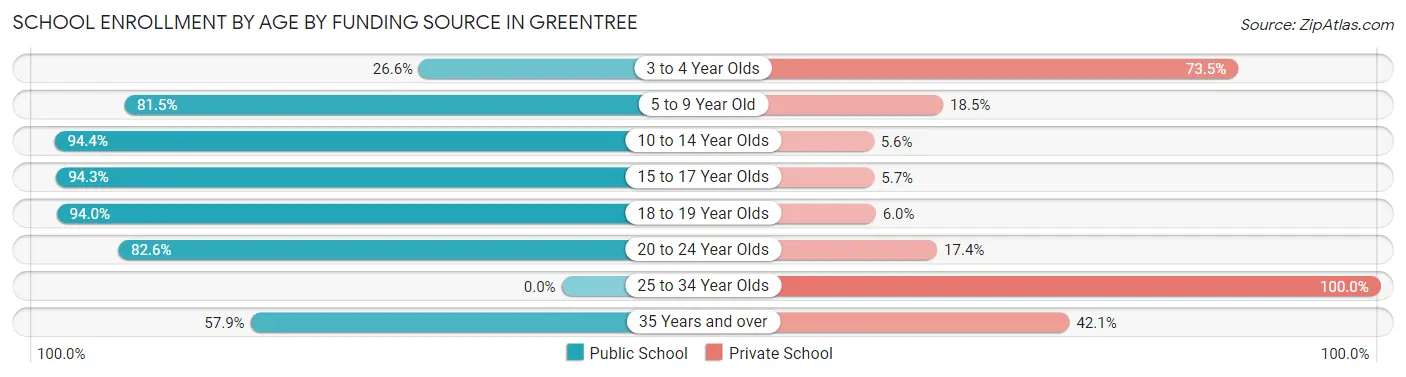
| Age Bracket | Public School | Private School |
| 3 to 4 Year Olds | 60 (26.6%) | 166 (73.5%) |
| 5 to 9 Year Old | 655 (81.5%) | 149 (18.5%) |
| 10 to 14 Year Olds | 524 (94.4%) | 31 (5.6%) |
| 15 to 17 Year Olds | 462 (94.3%) | 28 (5.7%) |
| 18 to 19 Year Olds | 173 (94.0%) | 11 (6.0%) |
| 20 to 24 Year Olds | 242 (82.6%) | 51 (17.4%) |
| 25 to 34 Year Olds | 0 (0.0%) | 86 (100.0%) |
| 35 Years and over | 73 (57.9%) | 53 (42.1%) |
| Total | 2,189 (79.2%) | 575 (20.8%) |
Educational Attainment by Field of Study in Greentree
Business (1,104 | 19.1%), engineering (722 | 12.5%), science & technology (671 | 11.6%), social sciences (472 | 8.2%), and education (443 | 7.7%) are the most common fields of study among 5,787 individuals in Greentree who have obtained a bachelor's degree or higher.
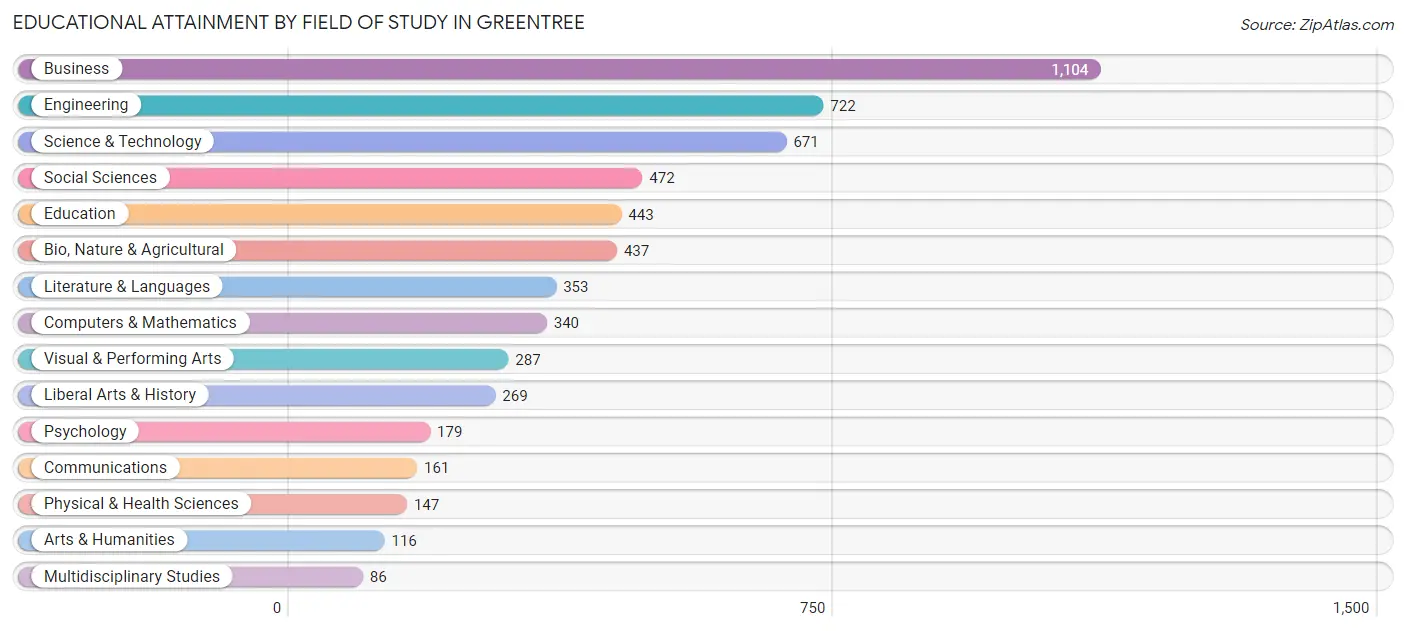
| Field of Study | # Graduates | % Graduates |
| Computers & Mathematics | 340 | 5.9% |
| Bio, Nature & Agricultural | 437 | 7.5% |
| Physical & Health Sciences | 147 | 2.5% |
| Psychology | 179 | 3.1% |
| Social Sciences | 472 | 8.2% |
| Engineering | 722 | 12.5% |
| Multidisciplinary Studies | 86 | 1.5% |
| Science & Technology | 671 | 11.6% |
| Business | 1,104 | 19.1% |
| Education | 443 | 7.7% |
| Literature & Languages | 353 | 6.1% |
| Liberal Arts & History | 269 | 4.6% |
| Visual & Performing Arts | 287 | 5.0% |
| Communications | 161 | 2.8% |
| Arts & Humanities | 116 | 2.0% |
| Total | 5,787 | 100.0% |
Transportation & Commute in Greentree
Vehicle Availability by Sex in Greentree
The most prevalent vehicle ownership categories in Greentree are males with 2 vehicles (1,361, accounting for 49.2%) and females with 2 vehicles (1,180, making up 55.2%).
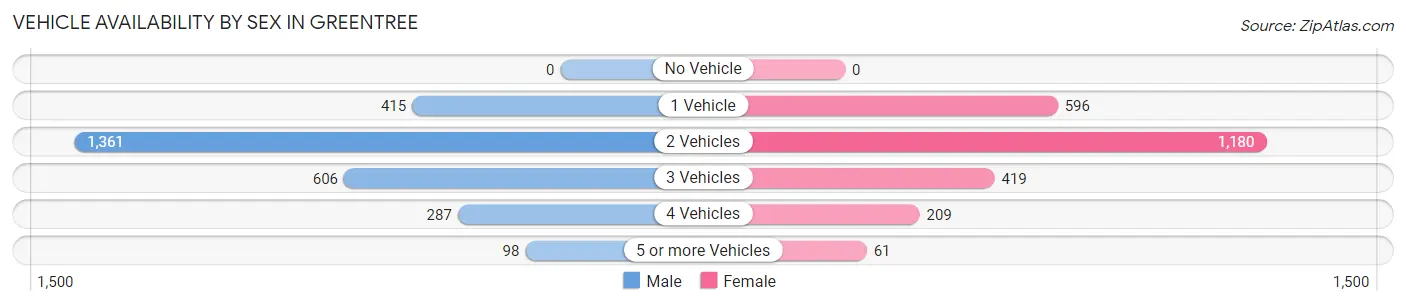
| Vehicles Available | Male | Female |
| No Vehicle | 0 (0.0%) | 0 (0.0%) |
| 1 Vehicle | 415 (15.0%) | 596 (24.2%) |
| 2 Vehicles | 1,361 (49.2%) | 1,180 (47.9%) |
| 3 Vehicles | 606 (21.9%) | 419 (17.0%) |
| 4 Vehicles | 287 (10.4%) | 209 (8.5%) |
| 5 or more Vehicles | 98 (3.5%) | 61 (2.5%) |
| Total | 2,767 (100.0%) | 2,465 (100.0%) |
Commute Time in Greentree
The most frequently occuring commute durations in Greentree are 15 to 19 minutes (759 commuters, 17.9%), 20 to 24 minutes (579 commuters, 13.7%), and 45 to 59 minutes (564 commuters, 13.3%).
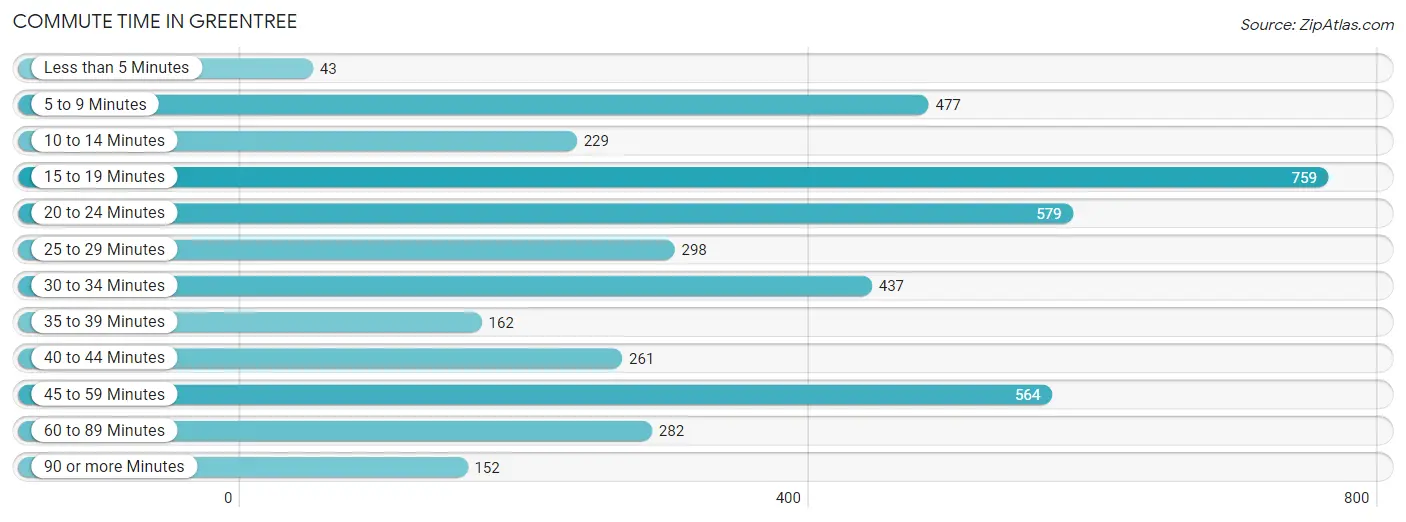
| Commute Time | # Commuters | % Commuters |
| Less than 5 Minutes | 43 | 1.0% |
| 5 to 9 Minutes | 477 | 11.2% |
| 10 to 14 Minutes | 229 | 5.4% |
| 15 to 19 Minutes | 759 | 17.9% |
| 20 to 24 Minutes | 579 | 13.7% |
| 25 to 29 Minutes | 298 | 7.0% |
| 30 to 34 Minutes | 437 | 10.3% |
| 35 to 39 Minutes | 162 | 3.8% |
| 40 to 44 Minutes | 261 | 6.1% |
| 45 to 59 Minutes | 564 | 13.3% |
| 60 to 89 Minutes | 282 | 6.7% |
| 90 or more Minutes | 152 | 3.6% |
Commute Time by Sex in Greentree
The most common commute times in Greentree are 45 to 59 minutes (404 commuters, 18.9%) for males and 15 to 19 minutes (455 commuters, 21.7%) for females.
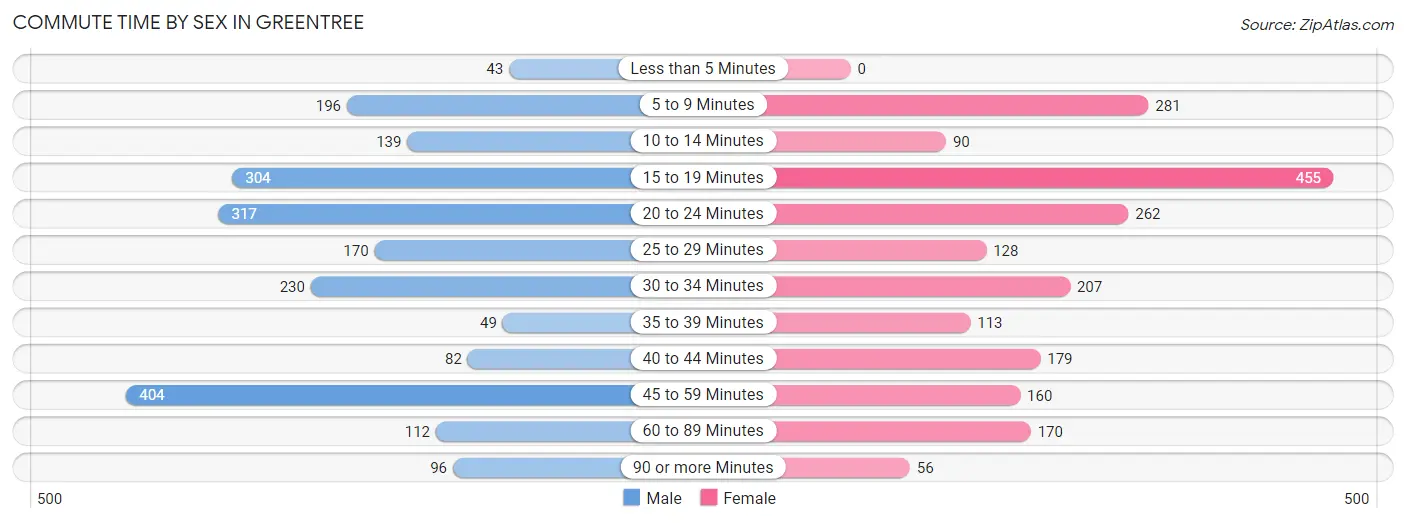
| Commute Time | Male | Female |
| Less than 5 Minutes | 43 (2.0%) | 0 (0.0%) |
| 5 to 9 Minutes | 196 (9.1%) | 281 (13.4%) |
| 10 to 14 Minutes | 139 (6.5%) | 90 (4.3%) |
| 15 to 19 Minutes | 304 (14.2%) | 455 (21.7%) |
| 20 to 24 Minutes | 317 (14.8%) | 262 (12.5%) |
| 25 to 29 Minutes | 170 (7.9%) | 128 (6.1%) |
| 30 to 34 Minutes | 230 (10.7%) | 207 (9.9%) |
| 35 to 39 Minutes | 49 (2.3%) | 113 (5.4%) |
| 40 to 44 Minutes | 82 (3.8%) | 179 (8.5%) |
| 45 to 59 Minutes | 404 (18.9%) | 160 (7.6%) |
| 60 to 89 Minutes | 112 (5.2%) | 170 (8.1%) |
| 90 or more Minutes | 96 (4.5%) | 56 (2.7%) |
Time of Departure to Work by Sex in Greentree
The most frequent times of departure to work in Greentree are 7:00 AM to 7:29 AM (349, 16.3%) for males and 8:00 AM to 8:29 AM (519, 24.7%) for females.
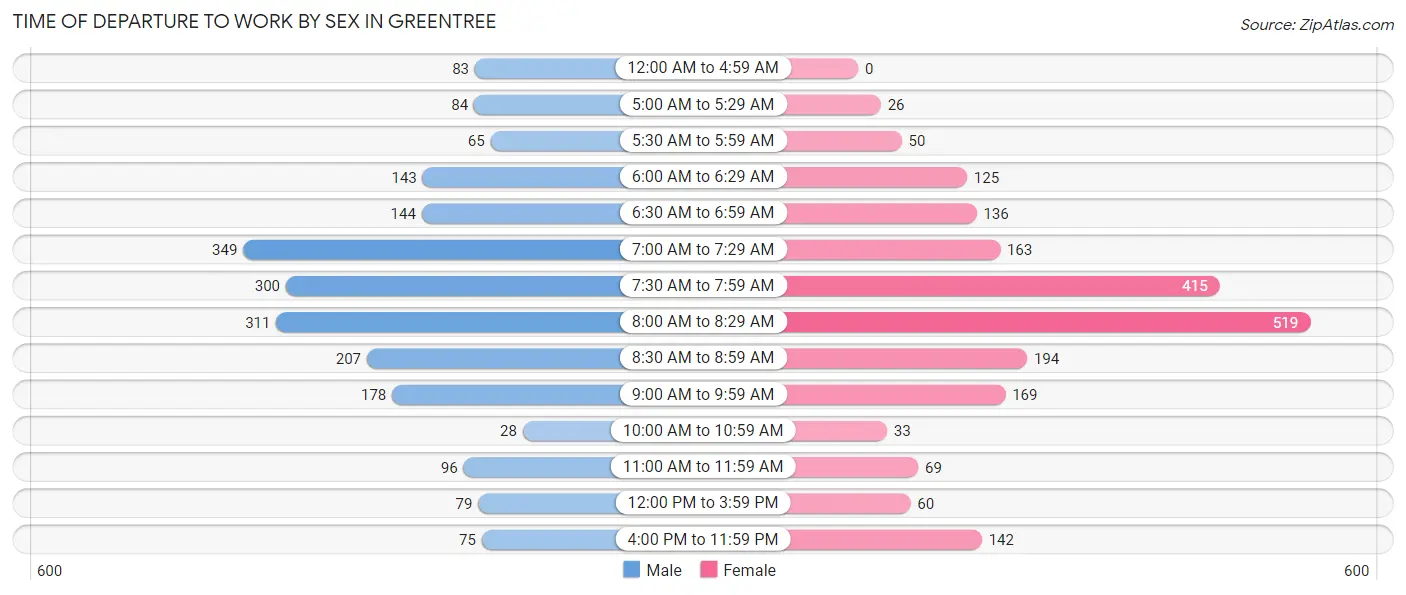
| Time of Departure | Male | Female |
| 12:00 AM to 4:59 AM | 83 (3.9%) | 0 (0.0%) |
| 5:00 AM to 5:29 AM | 84 (3.9%) | 26 (1.2%) |
| 5:30 AM to 5:59 AM | 65 (3.0%) | 50 (2.4%) |
| 6:00 AM to 6:29 AM | 143 (6.7%) | 125 (5.9%) |
| 6:30 AM to 6:59 AM | 144 (6.7%) | 136 (6.5%) |
| 7:00 AM to 7:29 AM | 349 (16.3%) | 163 (7.8%) |
| 7:30 AM to 7:59 AM | 300 (14.0%) | 415 (19.8%) |
| 8:00 AM to 8:29 AM | 311 (14.5%) | 519 (24.7%) |
| 8:30 AM to 8:59 AM | 207 (9.7%) | 194 (9.2%) |
| 9:00 AM to 9:59 AM | 178 (8.3%) | 169 (8.0%) |
| 10:00 AM to 10:59 AM | 28 (1.3%) | 33 (1.6%) |
| 11:00 AM to 11:59 AM | 96 (4.5%) | 69 (3.3%) |
| 12:00 PM to 3:59 PM | 79 (3.7%) | 60 (2.9%) |
| 4:00 PM to 11:59 PM | 75 (3.5%) | 142 (6.8%) |
| Total | 2,142 (100.0%) | 2,101 (100.0%) |
Housing Occupancy in Greentree
Occupancy by Ownership in Greentree
Of the total 4,207 dwellings in Greentree, owner-occupied units account for 3,484 (82.8%), while renter-occupied units make up 723 (17.2%).
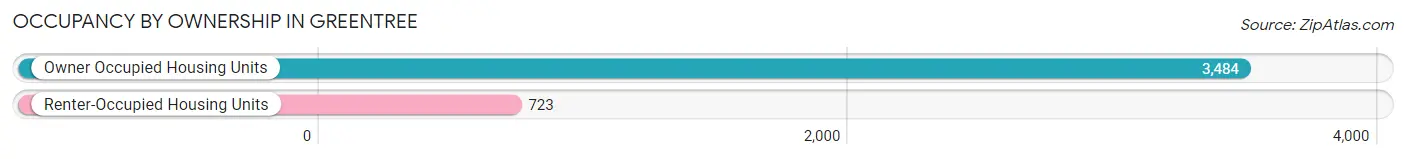
| Occupancy | # Housing Units | % Housing Units |
| Owner Occupied Housing Units | 3,484 | 82.8% |
| Renter-Occupied Housing Units | 723 | 17.2% |
| Total Occupied Housing Units | 4,207 | 100.0% |
Occupancy by Household Size in Greentree
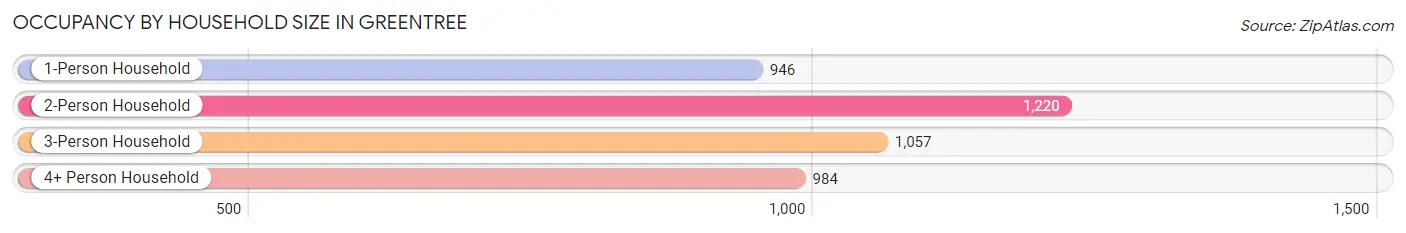
| Household Size | # Housing Units | % Housing Units |
| 1-Person Household | 946 | 22.5% |
| 2-Person Household | 1,220 | 29.0% |
| 3-Person Household | 1,057 | 25.1% |
| 4+ Person Household | 984 | 23.4% |
| Total Housing Units | 4,207 | 100.0% |
Occupancy by Ownership by Household Size in Greentree
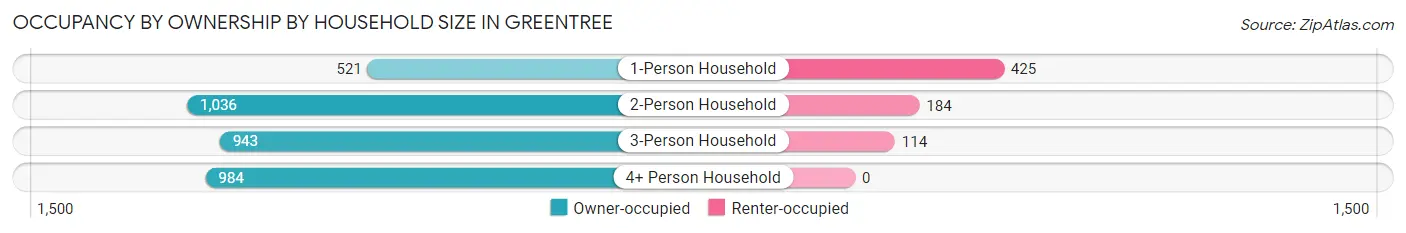
| Household Size | Owner-occupied | Renter-occupied |
| 1-Person Household | 521 (55.1%) | 425 (44.9%) |
| 2-Person Household | 1,036 (84.9%) | 184 (15.1%) |
| 3-Person Household | 943 (89.2%) | 114 (10.8%) |
| 4+ Person Household | 984 (100.0%) | 0 (0.0%) |
| Total Housing Units | 3,484 (82.8%) | 723 (17.2%) |
Occupancy by Educational Attainment in Greentree
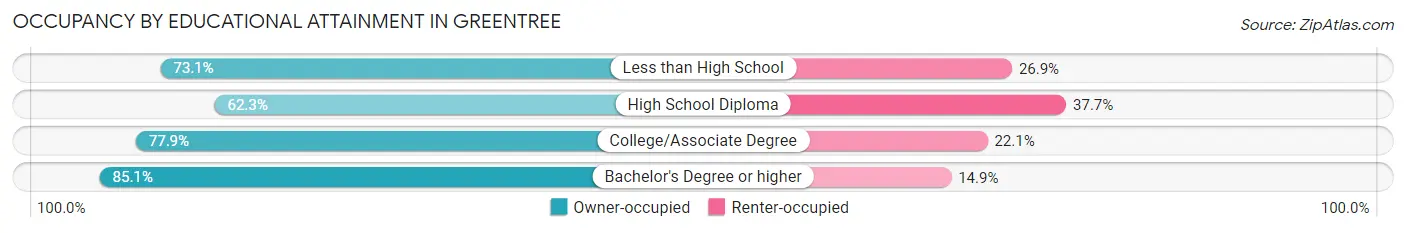
| Household Size | Owner-occupied | Renter-occupied |
| Less than High School | 38 (73.1%) | 14 (26.9%) |
| High School Diploma | 149 (62.3%) | 90 (37.7%) |
| College/Associate Degree | 392 (77.9%) | 111 (22.1%) |
| Bachelor's Degree or higher | 2,905 (85.1%) | 508 (14.9%) |
Occupancy by Age of Householder in Greentree
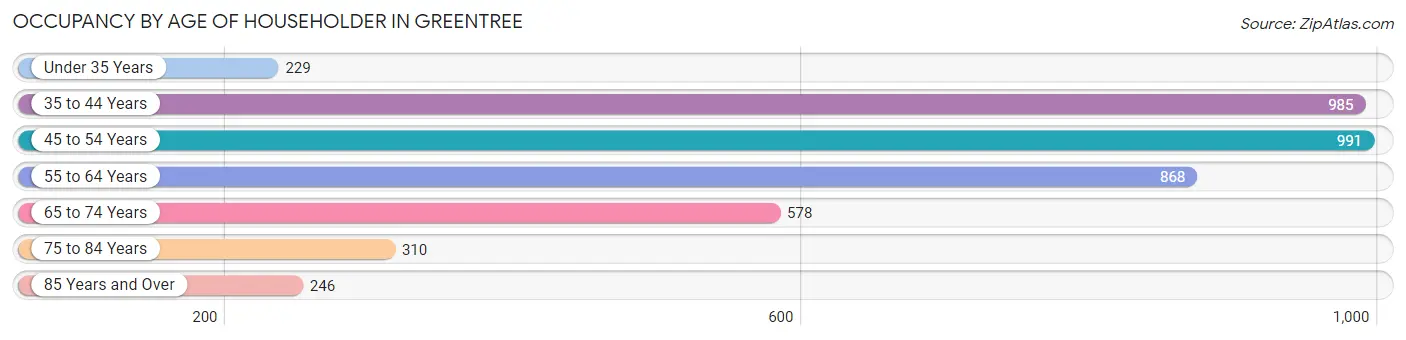
| Age Bracket | # Households | % Households |
| Under 35 Years | 229 | 5.4% |
| 35 to 44 Years | 985 | 23.4% |
| 45 to 54 Years | 991 | 23.6% |
| 55 to 64 Years | 868 | 20.6% |
| 65 to 74 Years | 578 | 13.7% |
| 75 to 84 Years | 310 | 7.4% |
| 85 Years and Over | 246 | 5.9% |
| Total | 4,207 | 100.0% |
Housing Finances in Greentree
Median Income by Occupancy in Greentree
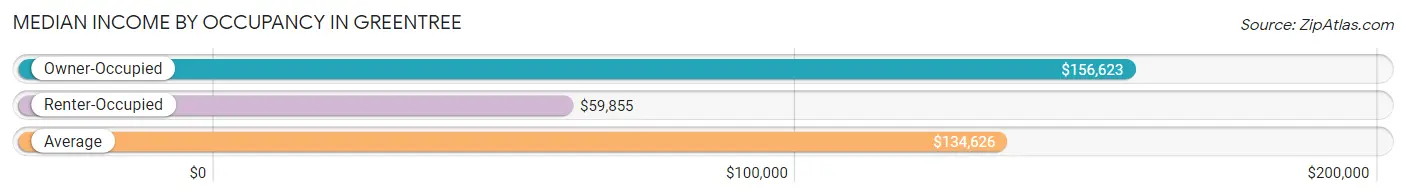
| Occupancy Type | # Households | Median Income |
| Owner-Occupied | 3,484 (82.8%) | $156,623 |
| Renter-Occupied | 723 (17.2%) | $59,855 |
| Average | 4,207 (100.0%) | $134,626 |
Occupancy by Householder Income Bracket in Greentree
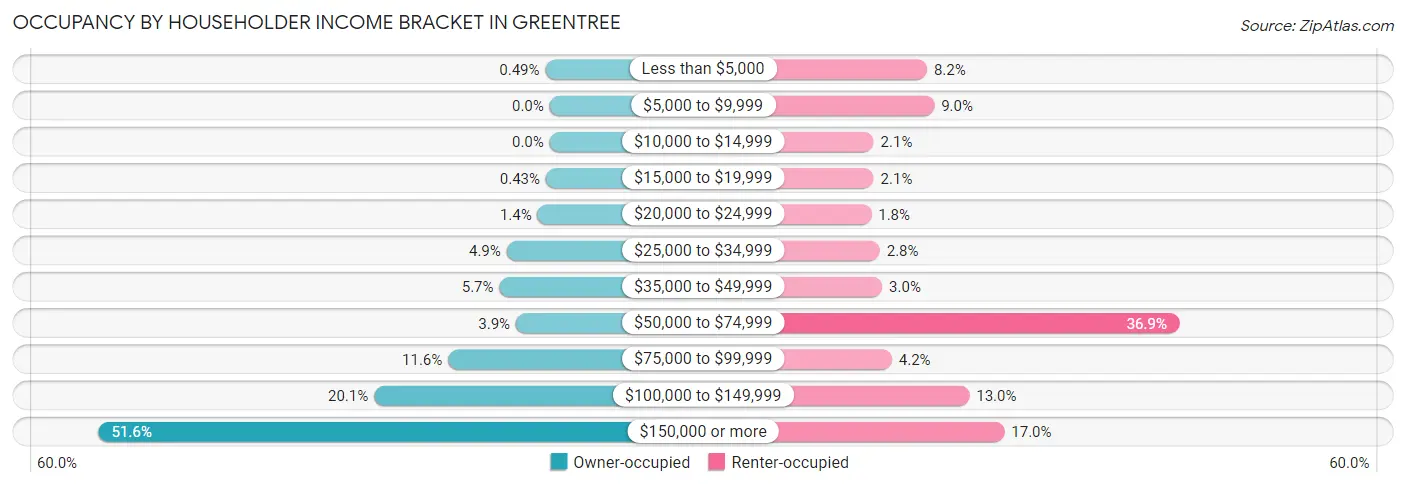
| Income Bracket | Owner-occupied | Renter-occupied |
| Less than $5,000 | 17 (0.5%) | 59 (8.2%) |
| $5,000 to $9,999 | 0 (0.0%) | 65 (9.0%) |
| $10,000 to $14,999 | 0 (0.0%) | 15 (2.1%) |
| $15,000 to $19,999 | 15 (0.4%) | 15 (2.1%) |
| $20,000 to $24,999 | 48 (1.4%) | 13 (1.8%) |
| $25,000 to $34,999 | 171 (4.9%) | 20 (2.8%) |
| $35,000 to $49,999 | 200 (5.7%) | 22 (3.0%) |
| $50,000 to $74,999 | 134 (3.8%) | 267 (36.9%) |
| $75,000 to $99,999 | 404 (11.6%) | 30 (4.2%) |
| $100,000 to $149,999 | 699 (20.1%) | 94 (13.0%) |
| $150,000 or more | 1,796 (51.5%) | 123 (17.0%) |
| Total | 3,484 (100.0%) | 723 (100.0%) |
Monthly Housing Cost Tiers in Greentree
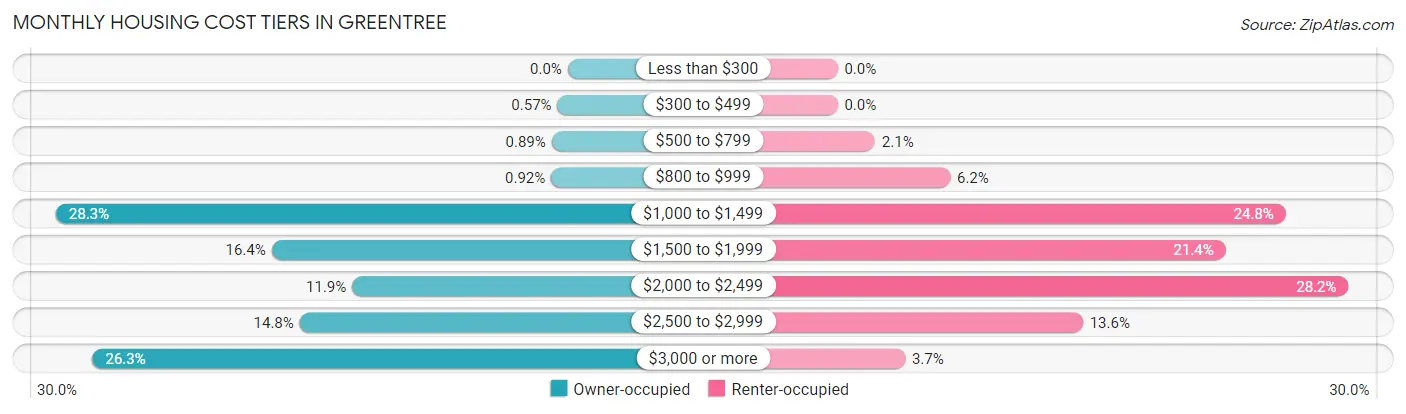
| Monthly Cost | Owner-occupied | Renter-occupied |
| Less than $300 | 0 (0.0%) | 0 (0.0%) |
| $300 to $499 | 20 (0.6%) | 0 (0.0%) |
| $500 to $799 | 31 (0.9%) | 15 (2.1%) |
| $800 to $999 | 32 (0.9%) | 45 (6.2%) |
| $1,000 to $1,499 | 985 (28.3%) | 179 (24.8%) |
| $1,500 to $1,999 | 570 (16.4%) | 155 (21.4%) |
| $2,000 to $2,499 | 415 (11.9%) | 204 (28.2%) |
| $2,500 to $2,999 | 516 (14.8%) | 98 (13.6%) |
| $3,000 or more | 915 (26.3%) | 27 (3.7%) |
| Total | 3,484 (100.0%) | 723 (100.0%) |
Physical Housing Characteristics in Greentree
Housing Structures in Greentree
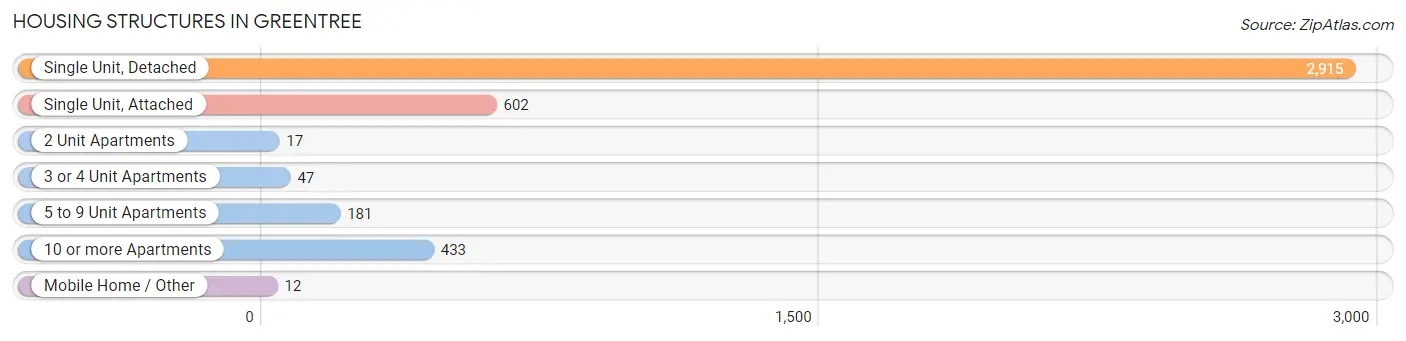
| Structure Type | # Housing Units | % Housing Units |
| Single Unit, Detached | 2,915 | 69.3% |
| Single Unit, Attached | 602 | 14.3% |
| 2 Unit Apartments | 17 | 0.4% |
| 3 or 4 Unit Apartments | 47 | 1.1% |
| 5 to 9 Unit Apartments | 181 | 4.3% |
| 10 or more Apartments | 433 | 10.3% |
| Mobile Home / Other | 12 | 0.3% |
| Total | 4,207 | 100.0% |
Housing Structures by Occupancy in Greentree
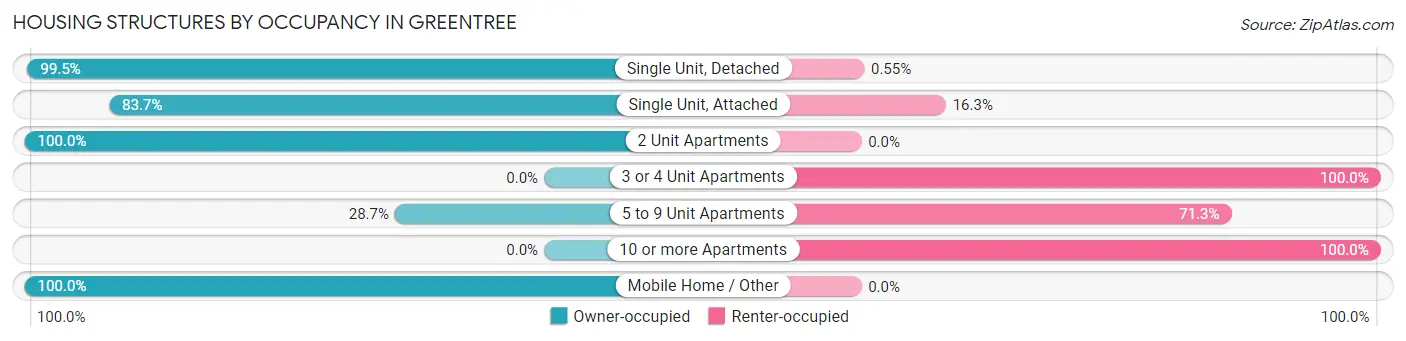
| Structure Type | Owner-occupied | Renter-occupied |
| Single Unit, Detached | 2,899 (99.5%) | 16 (0.5%) |
| Single Unit, Attached | 504 (83.7%) | 98 (16.3%) |
| 2 Unit Apartments | 17 (100.0%) | 0 (0.0%) |
| 3 or 4 Unit Apartments | 0 (0.0%) | 47 (100.0%) |
| 5 to 9 Unit Apartments | 52 (28.7%) | 129 (71.3%) |
| 10 or more Apartments | 0 (0.0%) | 433 (100.0%) |
| Mobile Home / Other | 12 (100.0%) | 0 (0.0%) |
| Total | 3,484 (82.8%) | 723 (17.2%) |
Housing Structures by Number of Rooms in Greentree
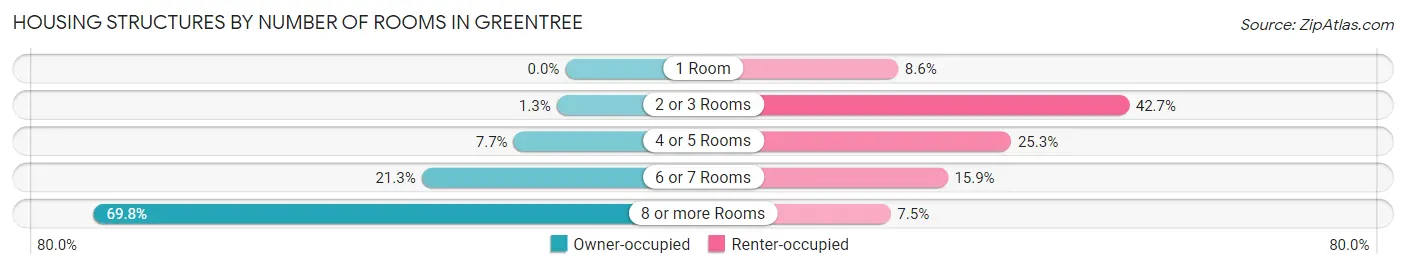
| Number of Rooms | Owner-occupied | Renter-occupied |
| 1 Room | 0 (0.0%) | 62 (8.6%) |
| 2 or 3 Rooms | 45 (1.3%) | 309 (42.7%) |
| 4 or 5 Rooms | 267 (7.7%) | 183 (25.3%) |
| 6 or 7 Rooms | 741 (21.3%) | 115 (15.9%) |
| 8 or more Rooms | 2,431 (69.8%) | 54 (7.5%) |
| Total | 3,484 (100.0%) | 723 (100.0%) |
Housing Structure by Heating Type in Greentree
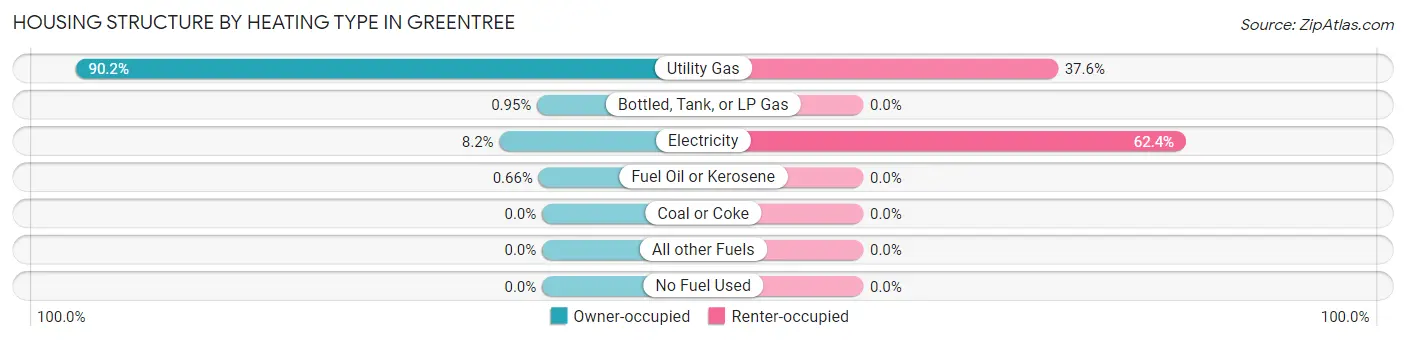
| Heating Type | Owner-occupied | Renter-occupied |
| Utility Gas | 3,141 (90.1%) | 272 (37.6%) |
| Bottled, Tank, or LP Gas | 33 (0.9%) | 0 (0.0%) |
| Electricity | 287 (8.2%) | 451 (62.4%) |
| Fuel Oil or Kerosene | 23 (0.7%) | 0 (0.0%) |
| Coal or Coke | 0 (0.0%) | 0 (0.0%) |
| All other Fuels | 0 (0.0%) | 0 (0.0%) |
| No Fuel Used | 0 (0.0%) | 0 (0.0%) |
| Total | 3,484 (100.0%) | 723 (100.0%) |
Household Vehicle Usage in Greentree
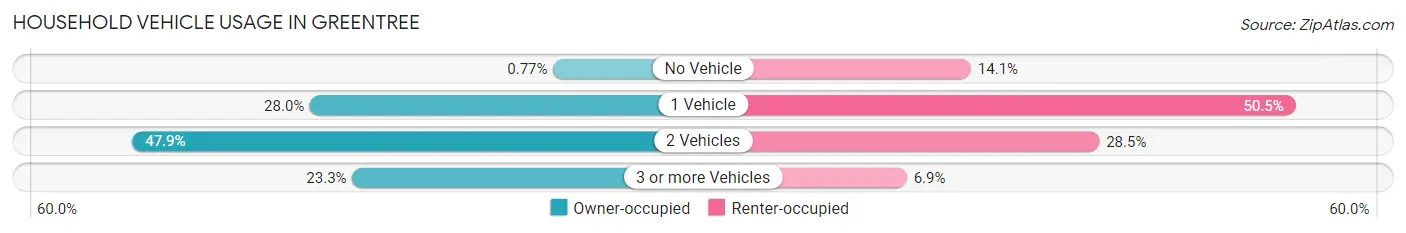
| Vehicles per Household | Owner-occupied | Renter-occupied |
| No Vehicle | 27 (0.8%) | 102 (14.1%) |
| 1 Vehicle | 976 (28.0%) | 365 (50.5%) |
| 2 Vehicles | 1,670 (47.9%) | 206 (28.5%) |
| 3 or more Vehicles | 811 (23.3%) | 50 (6.9%) |
| Total | 3,484 (100.0%) | 723 (100.0%) |
Real Estate & Mortgages in Greentree
Real Estate and Mortgage Overview in Greentree
| Characteristic | Without Mortgage | With Mortgage |
| Housing Units | 1,411 | 2,073 |
| Median Property Value | $359,800 | $386,600 |
| Median Household Income | $121,440 | $1,332 |
| Monthly Housing Costs | $1,361 | $913 |
| Real Estate Taxes | $10,001 | $14 |
Property Value by Mortgage Status in Greentree
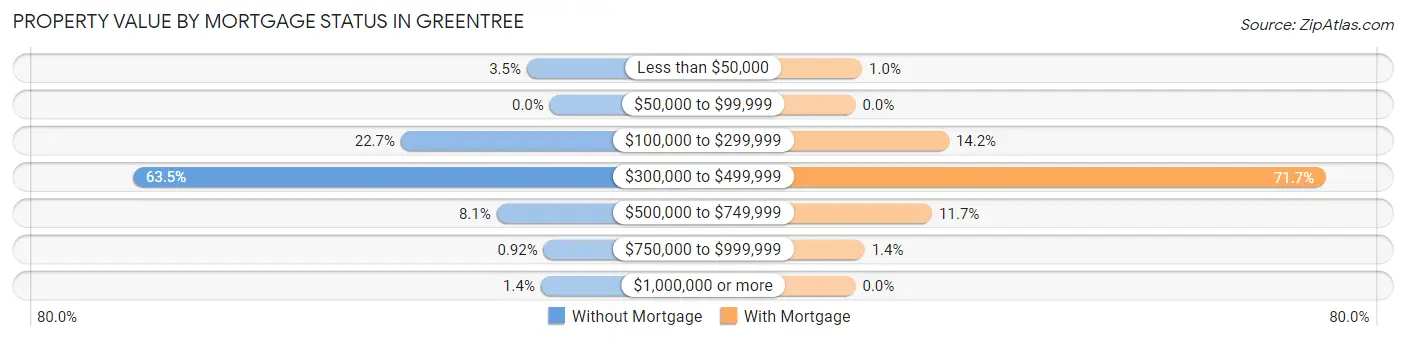
| Property Value | Without Mortgage | With Mortgage |
| Less than $50,000 | 49 (3.5%) | 21 (1.0%) |
| $50,000 to $99,999 | 0 (0.0%) | 0 (0.0%) |
| $100,000 to $299,999 | 320 (22.7%) | 295 (14.2%) |
| $300,000 to $499,999 | 896 (63.5%) | 1,486 (71.7%) |
| $500,000 to $749,999 | 114 (8.1%) | 242 (11.7%) |
| $750,000 to $999,999 | 13 (0.9%) | 29 (1.4%) |
| $1,000,000 or more | 19 (1.3%) | 0 (0.0%) |
| Total | 1,411 (100.0%) | 2,073 (100.0%) |
Household Income by Mortgage Status in Greentree
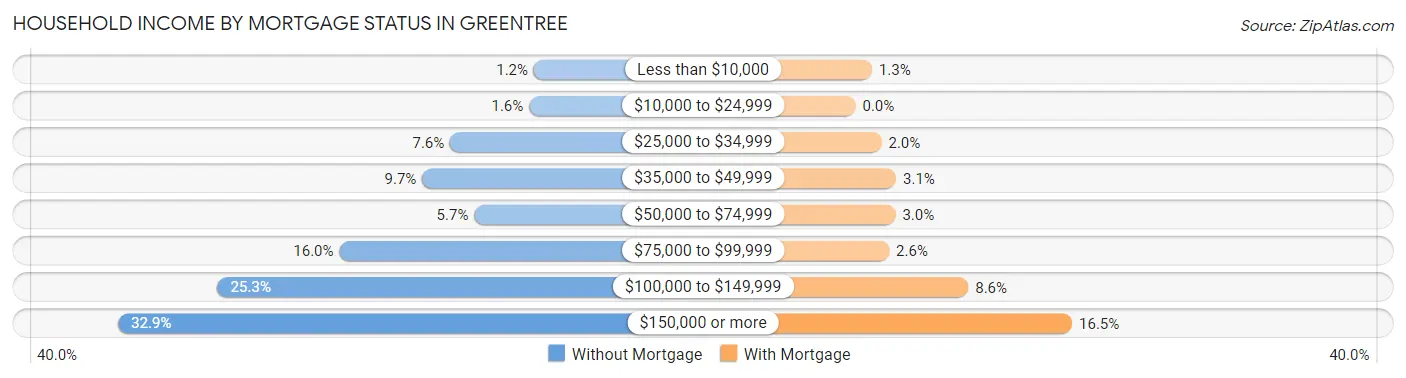
| Household Income | Without Mortgage | With Mortgage |
| Less than $10,000 | 17 (1.2%) | 26 (1.3%) |
| $10,000 to $24,999 | 22 (1.6%) | 0 (0.0%) |
| $25,000 to $34,999 | 107 (7.6%) | 41 (2.0%) |
| $35,000 to $49,999 | 137 (9.7%) | 64 (3.1%) |
| $50,000 to $74,999 | 81 (5.7%) | 63 (3.0%) |
| $75,000 to $99,999 | 226 (16.0%) | 53 (2.6%) |
| $100,000 to $149,999 | 357 (25.3%) | 178 (8.6%) |
| $150,000 or more | 464 (32.9%) | 342 (16.5%) |
| Total | 1,411 (100.0%) | 2,073 (100.0%) |
Property Value to Household Income Ratio in Greentree
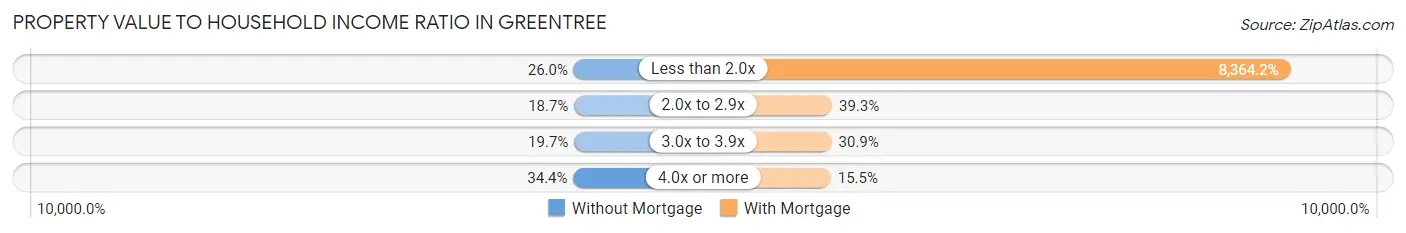
| Value-to-Income Ratio | Without Mortgage | With Mortgage |
| Less than 2.0x | 367 (26.0%) | 173,389 (8,364.2%) |
| 2.0x to 2.9x | 264 (18.7%) | 815 (39.3%) |
| 3.0x to 3.9x | 278 (19.7%) | 641 (30.9%) |
| 4.0x or more | 485 (34.4%) | 321 (15.5%) |
| Total | 1,411 (100.0%) | 2,073 (100.0%) |
Real Estate Taxes by Mortgage Status in Greentree
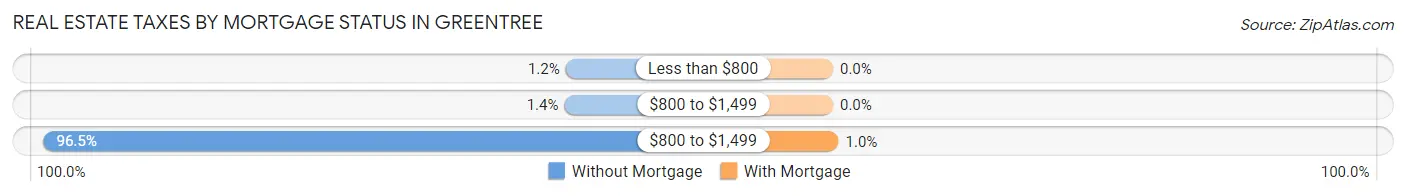
| Property Taxes | Without Mortgage | With Mortgage |
| Less than $800 | 17 (1.2%) | 0 (0.0%) |
| $800 to $1,499 | 20 (1.4%) | 0 (0.0%) |
| $800 to $1,499 | 1,362 (96.5%) | 21 (1.0%) |
| Total | 1,411 (100.0%) | 2,073 (100.0%) |
Health & Disability in Greentree
Health Insurance Coverage by Age in Greentree
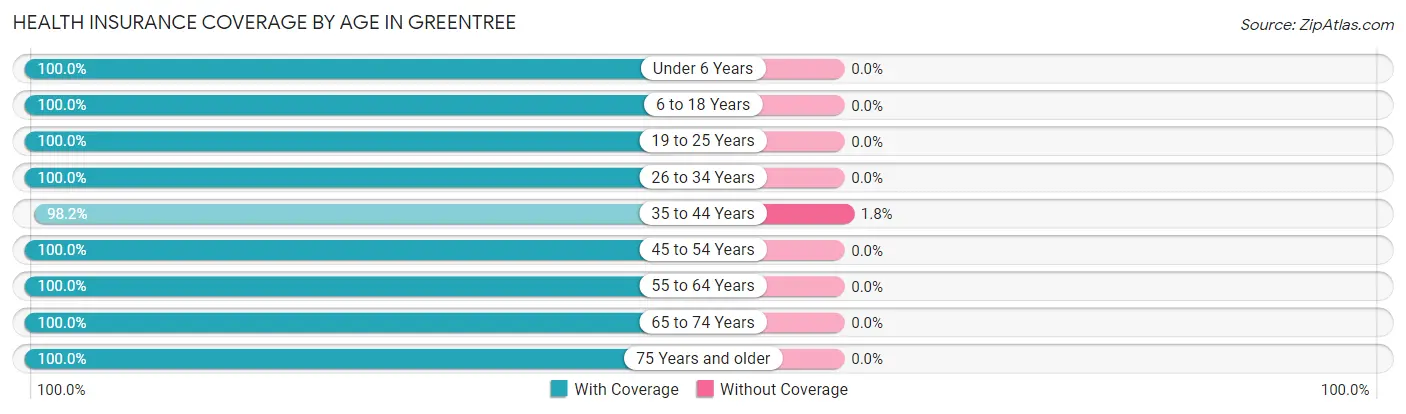
| Age Bracket | With Coverage | Without Coverage |
| Under 6 Years | 748 (100.0%) | 0 (0.0%) |
| 6 to 18 Years | 1,751 (100.0%) | 0 (0.0%) |
| 19 to 25 Years | 741 (100.0%) | 0 (0.0%) |
| 26 to 34 Years | 648 (100.0%) | 0 (0.0%) |
| 35 to 44 Years | 1,660 (98.2%) | 30 (1.8%) |
| 45 to 54 Years | 1,609 (100.0%) | 0 (0.0%) |
| 55 to 64 Years | 1,596 (100.0%) | 0 (0.0%) |
| 65 to 74 Years | 1,122 (100.0%) | 0 (0.0%) |
| 75 Years and older | 1,102 (100.0%) | 0 (0.0%) |
| Total | 10,977 (99.7%) | 30 (0.3%) |
Health Insurance Coverage by Citizenship Status in Greentree
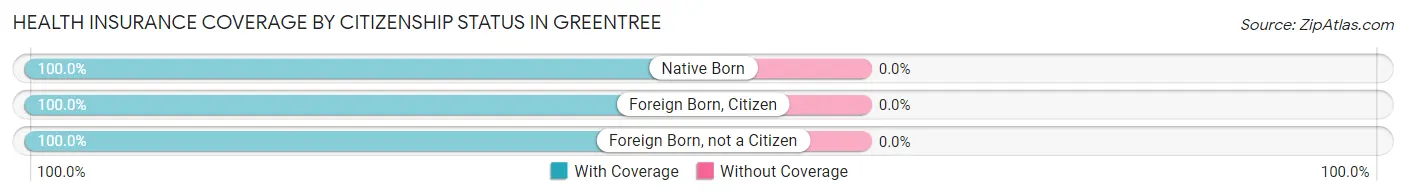
| Citizenship Status | With Coverage | Without Coverage |
| Native Born | 748 (100.0%) | 0 (0.0%) |
| Foreign Born, Citizen | 1,751 (100.0%) | 0 (0.0%) |
| Foreign Born, not a Citizen | 741 (100.0%) | 0 (0.0%) |
Health Insurance Coverage by Household Income in Greentree
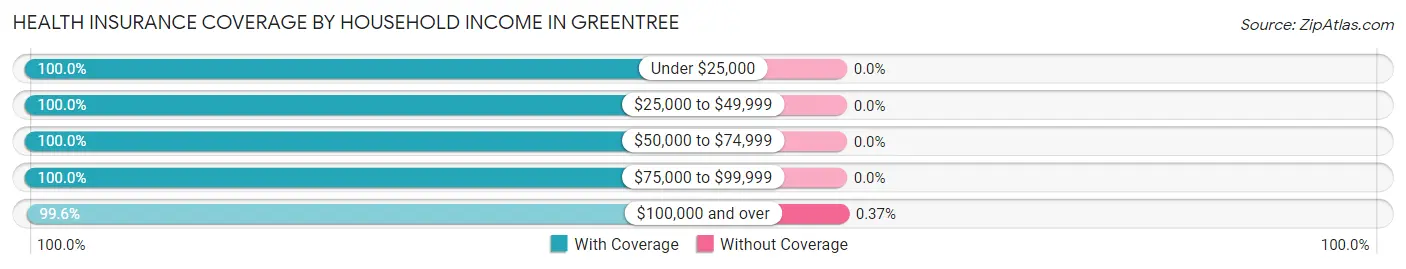
| Household Income | With Coverage | Without Coverage |
| Under $25,000 | 285 (100.0%) | 0 (0.0%) |
| $25,000 to $49,999 | 978 (100.0%) | 0 (0.0%) |
| $50,000 to $74,999 | 807 (100.0%) | 0 (0.0%) |
| $75,000 to $99,999 | 826 (100.0%) | 0 (0.0%) |
| $100,000 and over | 8,069 (99.6%) | 30 (0.4%) |
Public vs Private Health Insurance Coverage by Age in Greentree
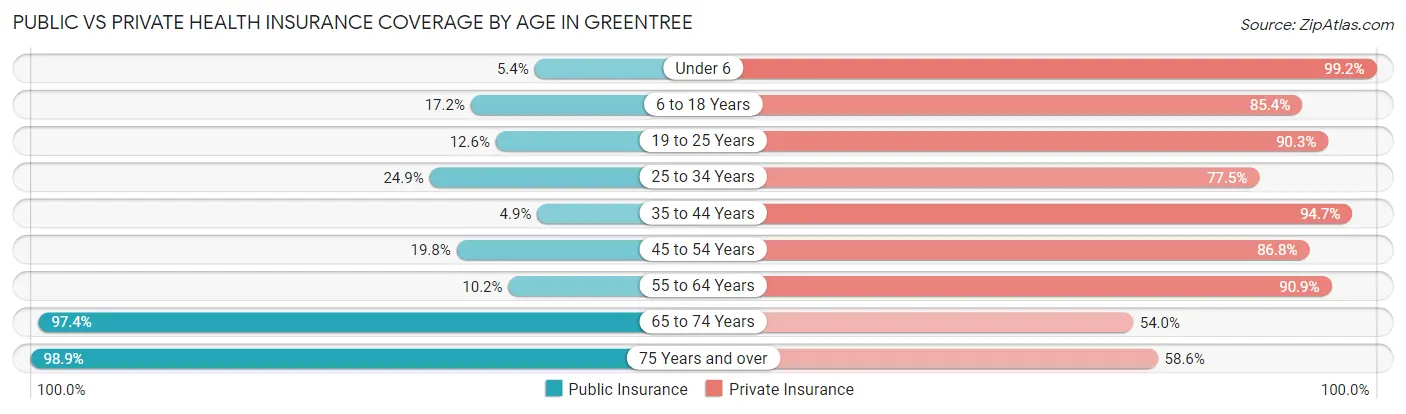
| Age Bracket | Public Insurance | Private Insurance |
| Under 6 | 40 (5.3%) | 742 (99.2%) |
| 6 to 18 Years | 301 (17.2%) | 1,496 (85.4%) |
| 19 to 25 Years | 93 (12.6%) | 669 (90.3%) |
| 25 to 34 Years | 161 (24.8%) | 502 (77.5%) |
| 35 to 44 Years | 82 (4.9%) | 1,601 (94.7%) |
| 45 to 54 Years | 319 (19.8%) | 1,396 (86.8%) |
| 55 to 64 Years | 163 (10.2%) | 1,450 (90.8%) |
| 65 to 74 Years | 1,093 (97.4%) | 606 (54.0%) |
| 75 Years and over | 1,090 (98.9%) | 646 (58.6%) |
| Total | 3,342 (30.4%) | 9,108 (82.8%) |
Disability Status by Sex by Age in Greentree
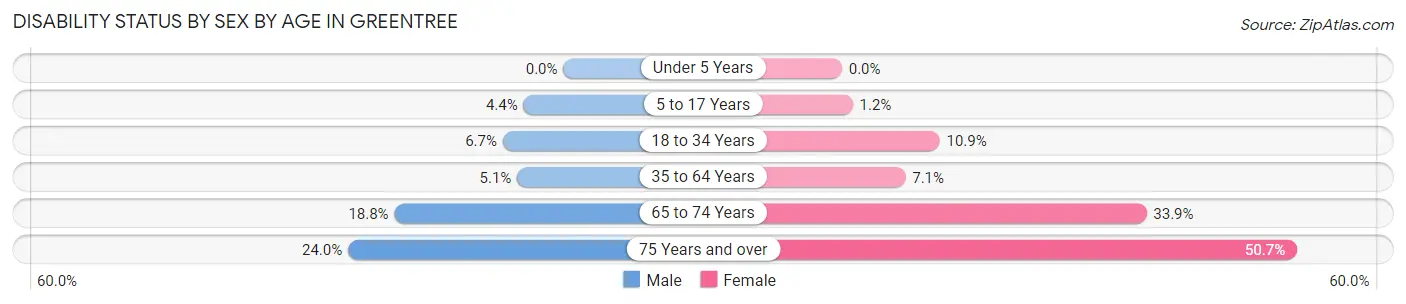
| Age Bracket | Male | Female |
| Under 5 Years | 0 (0.0%) | 0 (0.0%) |
| 5 to 17 Years | 42 (4.4%) | 11 (1.2%) |
| 18 to 34 Years | 64 (6.7%) | 65 (10.9%) |
| 35 to 64 Years | 112 (5.1%) | 192 (7.1%) |
| 65 to 74 Years | 104 (18.8%) | 193 (33.9%) |
| 75 Years and over | 94 (24.0%) | 360 (50.7%) |
Disability Class by Sex by Age in Greentree
Disability Class: Hearing Difficulty
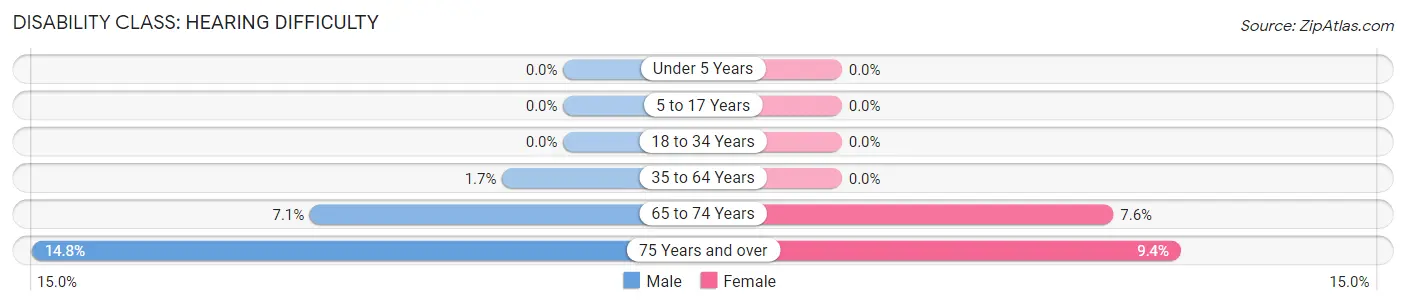
| Age Bracket | Male | Female |
| Under 5 Years | 0 (0.0%) | 0 (0.0%) |
| 5 to 17 Years | 0 (0.0%) | 0 (0.0%) |
| 18 to 34 Years | 0 (0.0%) | 0 (0.0%) |
| 35 to 64 Years | 37 (1.7%) | 0 (0.0%) |
| 65 to 74 Years | 39 (7.0%) | 43 (7.6%) |
| 75 Years and over | 58 (14.8%) | 67 (9.4%) |
Disability Class: Vision Difficulty
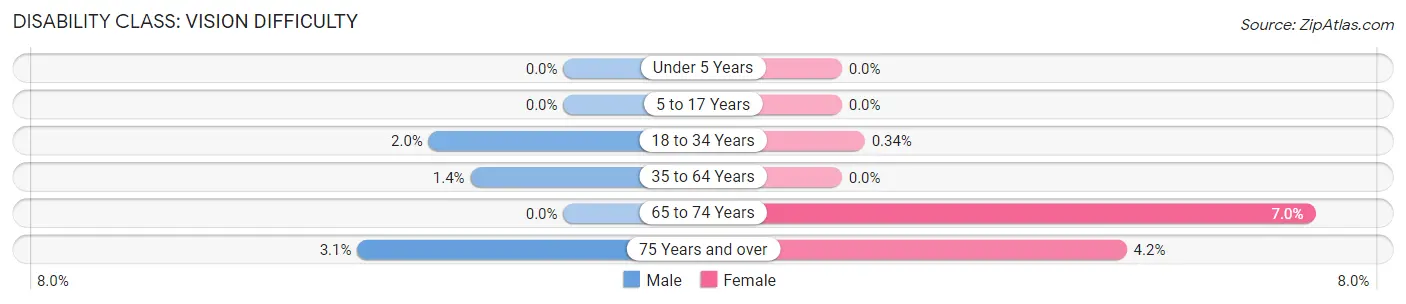
| Age Bracket | Male | Female |
| Under 5 Years | 0 (0.0%) | 0 (0.0%) |
| 5 to 17 Years | 0 (0.0%) | 0 (0.0%) |
| 18 to 34 Years | 19 (2.0%) | 2 (0.3%) |
| 35 to 64 Years | 30 (1.4%) | 0 (0.0%) |
| 65 to 74 Years | 0 (0.0%) | 40 (7.0%) |
| 75 Years and over | 12 (3.1%) | 30 (4.2%) |
Disability Class: Cognitive Difficulty
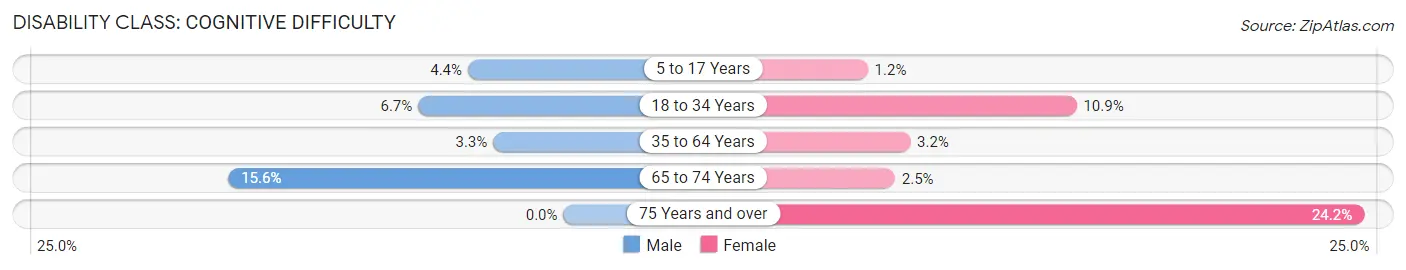
| Age Bracket | Male | Female |
| 5 to 17 Years | 42 (4.4%) | 11 (1.2%) |
| 18 to 34 Years | 64 (6.7%) | 65 (10.9%) |
| 35 to 64 Years | 71 (3.3%) | 86 (3.2%) |
| 65 to 74 Years | 86 (15.5%) | 14 (2.5%) |
| 75 Years and over | 0 (0.0%) | 172 (24.2%) |
Disability Class: Ambulatory Difficulty
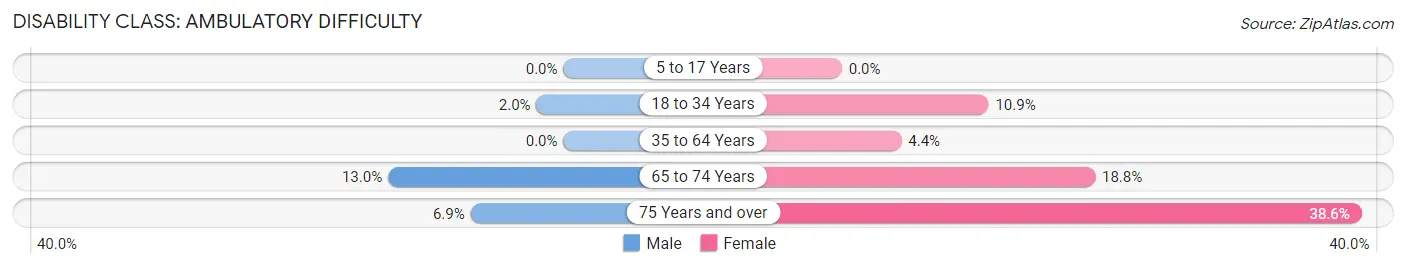
| Age Bracket | Male | Female |
| 5 to 17 Years | 0 (0.0%) | 0 (0.0%) |
| 18 to 34 Years | 19 (2.0%) | 65 (10.9%) |
| 35 to 64 Years | 0 (0.0%) | 120 (4.4%) |
| 65 to 74 Years | 72 (13.0%) | 107 (18.8%) |
| 75 Years and over | 27 (6.9%) | 274 (38.6%) |
Disability Class: Self-Care Difficulty
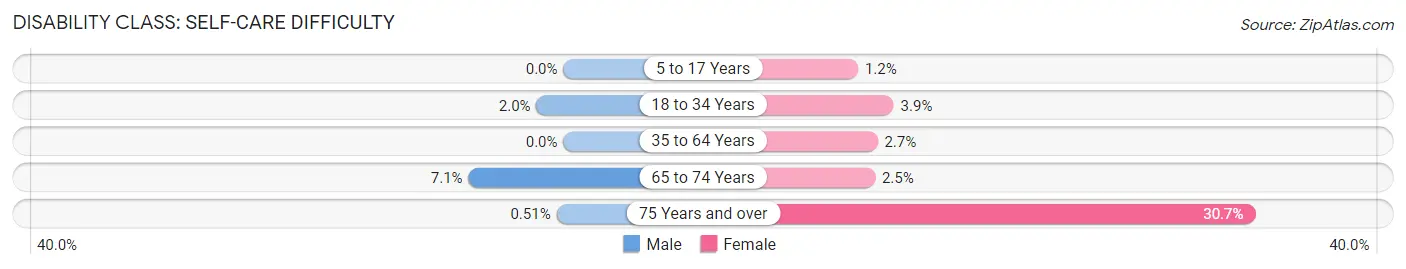
| Age Bracket | Male | Female |
| 5 to 17 Years | 0 (0.0%) | 11 (1.2%) |
| 18 to 34 Years | 19 (2.0%) | 23 (3.8%) |
| 35 to 64 Years | 0 (0.0%) | 72 (2.6%) |
| 65 to 74 Years | 39 (7.0%) | 14 (2.5%) |
| 75 Years and over | 2 (0.5%) | 218 (30.7%) |
Technology Access in Greentree
Computing Device Access in Greentree
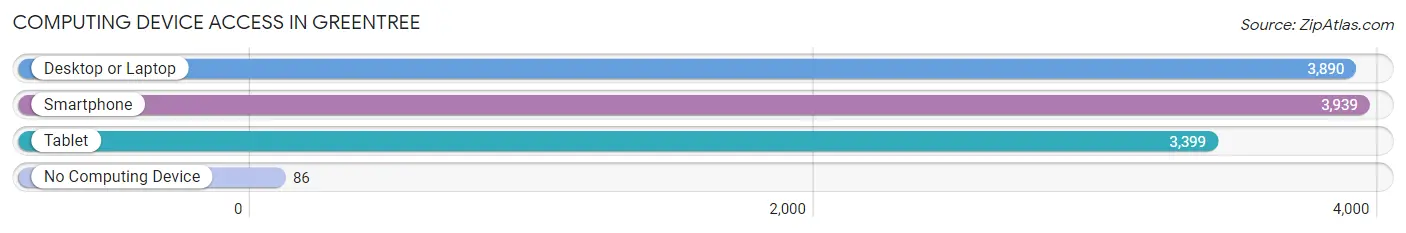
| Device Type | # Households | % Households |
| Desktop or Laptop | 3,890 | 92.5% |
| Smartphone | 3,939 | 93.6% |
| Tablet | 3,399 | 80.8% |
| No Computing Device | 86 | 2.0% |
| Total | 4,207 | 100.0% |
Internet Access in Greentree
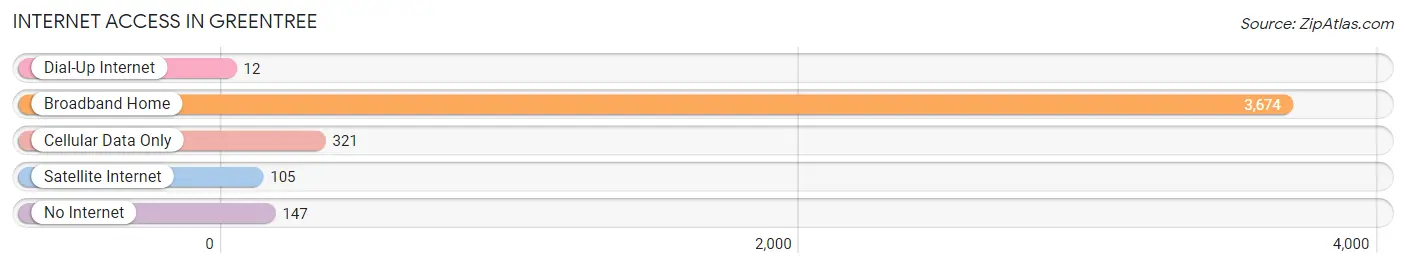
| Internet Type | # Households | % Households |
| Dial-Up Internet | 12 | 0.3% |
| Broadband Home | 3,674 | 87.3% |
| Cellular Data Only | 321 | 7.6% |
| Satellite Internet | 105 | 2.5% |
| No Internet | 147 | 3.5% |
| Total | 4,207 | 100.0% |
Greentree Summary
Green Tree, NJ is a small borough located in Bergen County, New Jersey. It is situated on the Hackensack River, just north of the George Washington Bridge. The borough was incorporated in 1894 and is home to a population of just over 5,000 people.
Geography
Green Tree is located in the Hackensack River Valley, which is part of the larger New York-New Jersey metropolitan area. The borough is bordered by the Hackensack River to the east, the borough of Teaneck to the south, the borough of Ridgefield Park to the west, and the borough of Bogota to the north. The borough is approximately 2.5 square miles in size and is located at an elevation of approximately 20 feet above sea level.
The borough is home to several parks, including the Green Tree Park, which is located on the banks of the Hackensack River. The park features a playground, picnic area, and a boat launch. The borough also has a number of recreational facilities, including a public pool, tennis courts, and a basketball court.
Economy
Green Tree is primarily a residential community, with most of its residents employed in the nearby cities of New York and Newark. The borough does not have any major employers, but there are a number of small businesses located in the area. These include restaurants, retail stores, and professional services.
Demographics
As of the 2010 census, the population of Green Tree was 5,093. The racial makeup of the borough was 79.3% White, 8.2% African American, 0.3% Native American, 5.2% Asian, and 6.9% from other races. Hispanic or Latino of any race were 15.2% of the population.
The median household income in Green Tree was $68,958, and the median family income was $76,958. The per capita income was $30,958. About 5.2% of families and 6.9% of the population were below the poverty line, including 8.2% of those under age 18 and 6.9% of those age 65 or over.
Conclusion
Green Tree, NJ is a small borough located in Bergen County, New Jersey. It is situated on the Hackensack River, just north of the George Washington Bridge. The borough was incorporated in 1894 and is home to a population of just over 5,000 people. The borough is primarily a residential community, with most of its residents employed in the nearby cities of New York and Newark. The borough does not have any major employers, but there are a number of small businesses located in the area. The racial makeup of the borough is 79.3% White, 8.2% African American, 0.3% Native American, 5.2% Asian, and 6.9% from other races. The median household income in Green Tree was $68,958, and the median family income was $76,958. The per capita income was $30,958. Green Tree is home to several parks and recreational facilities, making it an attractive place to live for those looking for a small-town atmosphere.
Common Questions
What is Per Capita Income in Greentree?
Per Capita income in Greentree is $62,882.
What is the Median Family Income in Greentree?
Median Family Income in Greentree is $168,347.
What is the Median Household income in Greentree?
Median Household Income in Greentree is $134,626.
What is Income or Wage Gap in Greentree?
Income or Wage Gap in Greentree is 10.2%.
Women in Greentree earn 89.8 cents for every dollar earned by a man.
What is Inequality or Gini Index in Greentree?
Inequality or Gini Index in Greentree is 0.40.
What is the Total Population of Greentree?
Total Population of Greentree is 11,016.
What is the Total Male Population of Greentree?
Total Male Population of Greentree is 5,219.
What is the Total Female Population of Greentree?
Total Female Population of Greentree is 5,797.
What is the Ratio of Males per 100 Females in Greentree?
There are 90.03 Males per 100 Females in Greentree.
What is the Ratio of Females per 100 Males in Greentree?
There are 111.07 Females per 100 Males in Greentree.
What is the Median Population Age in Greentree?
Median Population Age in Greentree is 44.4 Years.
What is the Average Family Size in Greentree
Average Family Size in Greentree is 3.1 People.
What is the Average Household Size in Greentree
Average Household Size in Greentree is 2.6 People.
How Large is the Labor Force in Greentree?
There are 5,631 People in the Labor Forcein in Greentree.
What is the Percentage of People in the Labor Force in Greentree?
62.9% of People are in the Labor Force in Greentree.
What is the Unemployment Rate in Greentree?
Unemployment Rate in Greentree is 6.4%.