Six Mile Run, NJ Map & Demographics
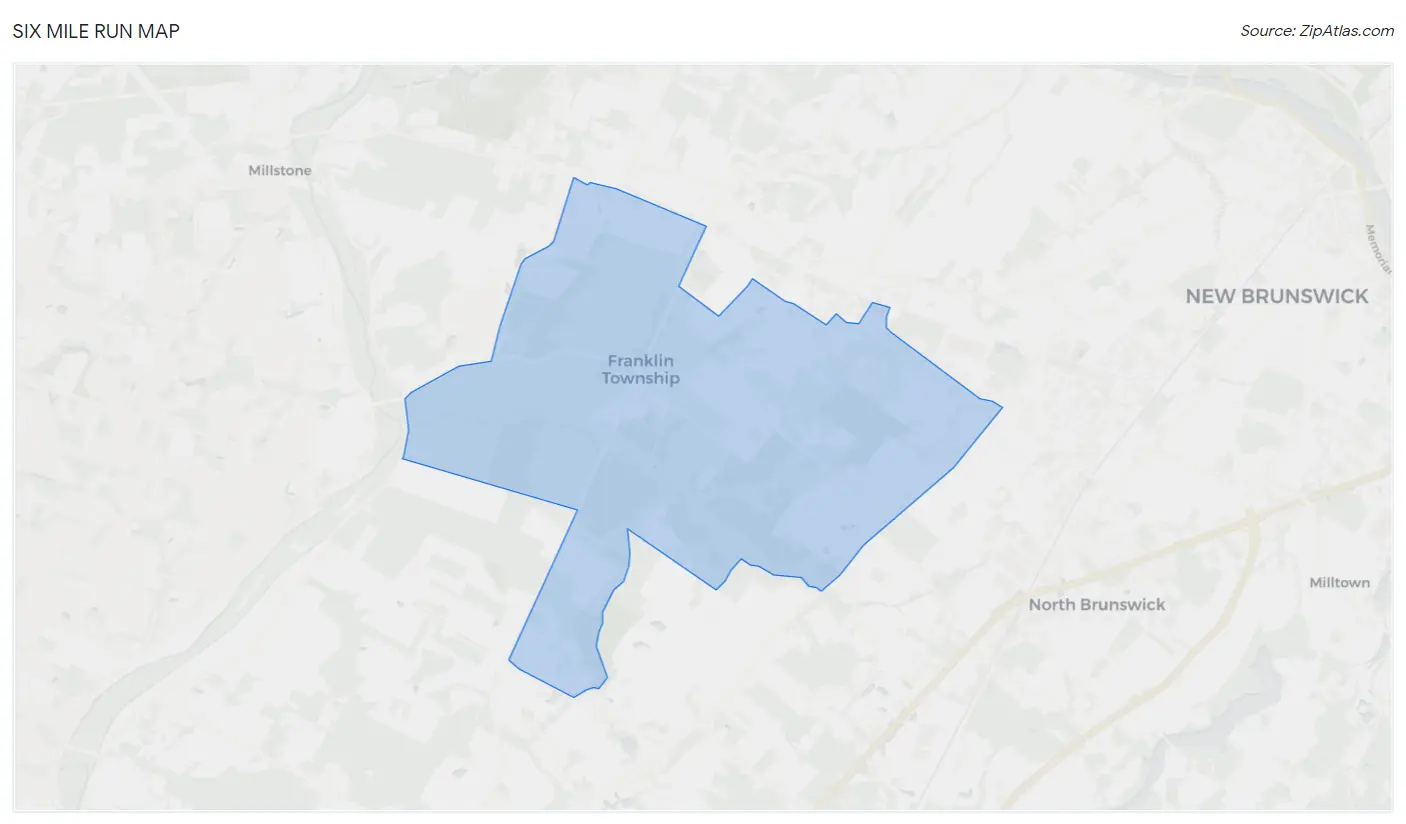
Six Mile Run Map
Six Mile Run Overview
$63,347
PER CAPITA INCOME
$116,228
AVG FAMILY INCOME
$115,526
AVG HOUSEHOLD INCOME
15.6%
WAGE / INCOME GAP [ % ]
84.4¢/ $1
WAGE / INCOME GAP [ $ ]
0.42
INEQUALITY / GINI INDEX
3,535
TOTAL POPULATION
1,763
MALE POPULATION
1,772
FEMALE POPULATION
99.49
MALES / 100 FEMALES
100.51
FEMALES / 100 MALES
38.1
MEDIAN AGE
3.1
AVG FAMILY SIZE
2.6
AVG HOUSEHOLD SIZE
2,043
LABOR FORCE [ PEOPLE ]
71.4%
PERCENT IN LABOR FORCE
2.3%
UNEMPLOYMENT RATE
Income in Six Mile Run
Income Overview in Six Mile Run
Per Capita Income in Six Mile Run is $63,347, while median incomes of families and households are $116,228 and $115,526 respectively.
| Characteristic | Number | Measure |
| Per Capita Income | 3,535 | $63,347 |
| Median Family Income | 890 | $116,228 |
| Mean Family Income | 890 | $175,942 |
| Median Household Income | 1,374 | $115,526 |
| Mean Household Income | 1,374 | $161,380 |
| Income Deficit | 890 | $0 |
| Wage / Income Gap (%) | 3,535 | 15.59% |
| Wage / Income Gap ($) | 3,535 | 84.41¢ per $1 |
| Gini / Inequality Index | 3,535 | 0.42 |
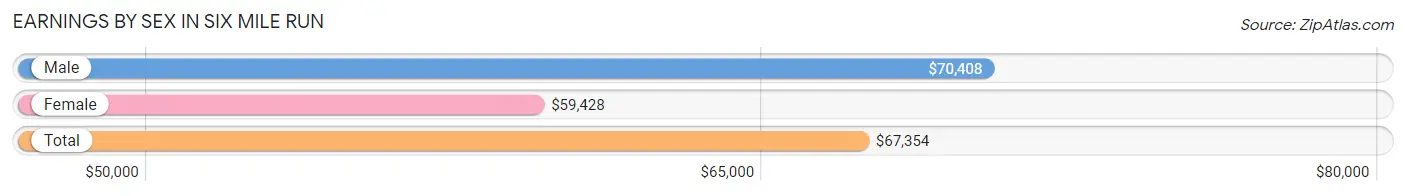
Earnings by Sex in Six Mile Run
Average Earnings in Six Mile Run are $67,354, $70,408 for men and $59,428 for women, a difference of 15.6%.
| Sex | Number | Average Earnings |
| Male | 1,173 (56.2%) | $70,408 |
| Female | 915 (43.8%) | $59,428 |
| Total | 2,088 (100.0%) | $67,354 |
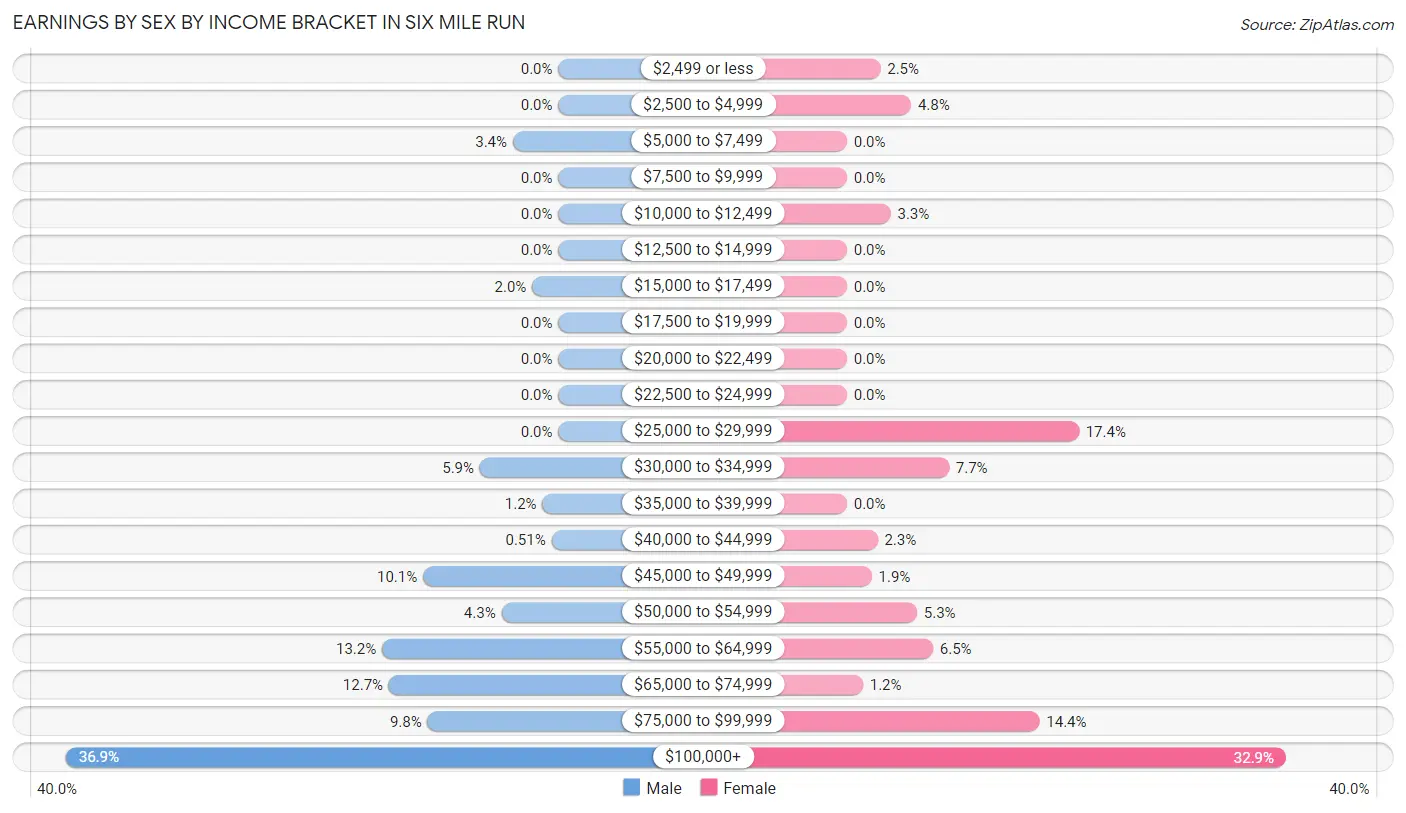
Earnings by Sex by Income Bracket in Six Mile Run
The most common earnings brackets in Six Mile Run are $100,000+ for men (433 | 36.9%) and $100,000+ for women (301 | 32.9%).
| Income | Male | Female |
| $2,499 or less | 0 (0.0%) | 23 (2.5%) |
| $2,500 to $4,999 | 0 (0.0%) | 44 (4.8%) |
| $5,000 to $7,499 | 40 (3.4%) | 0 (0.0%) |
| $7,500 to $9,999 | 0 (0.0%) | 0 (0.0%) |
| $10,000 to $12,499 | 0 (0.0%) | 30 (3.3%) |
| $12,500 to $14,999 | 0 (0.0%) | 0 (0.0%) |
| $15,000 to $17,499 | 23 (2.0%) | 0 (0.0%) |
| $17,500 to $19,999 | 0 (0.0%) | 0 (0.0%) |
| $20,000 to $22,499 | 0 (0.0%) | 0 (0.0%) |
| $22,500 to $24,999 | 0 (0.0%) | 0 (0.0%) |
| $25,000 to $29,999 | 0 (0.0%) | 159 (17.4%) |
| $30,000 to $34,999 | 69 (5.9%) | 70 (7.6%) |
| $35,000 to $39,999 | 14 (1.2%) | 0 (0.0%) |
| $40,000 to $44,999 | 6 (0.5%) | 21 (2.3%) |
| $45,000 to $49,999 | 119 (10.1%) | 17 (1.9%) |
| $50,000 to $54,999 | 50 (4.3%) | 48 (5.2%) |
| $55,000 to $64,999 | 155 (13.2%) | 59 (6.5%) |
| $65,000 to $74,999 | 149 (12.7%) | 11 (1.2%) |
| $75,000 to $99,999 | 115 (9.8%) | 132 (14.4%) |
| $100,000+ | 433 (36.9%) | 301 (32.9%) |
| Total | 1,173 (100.0%) | 915 (100.0%) |
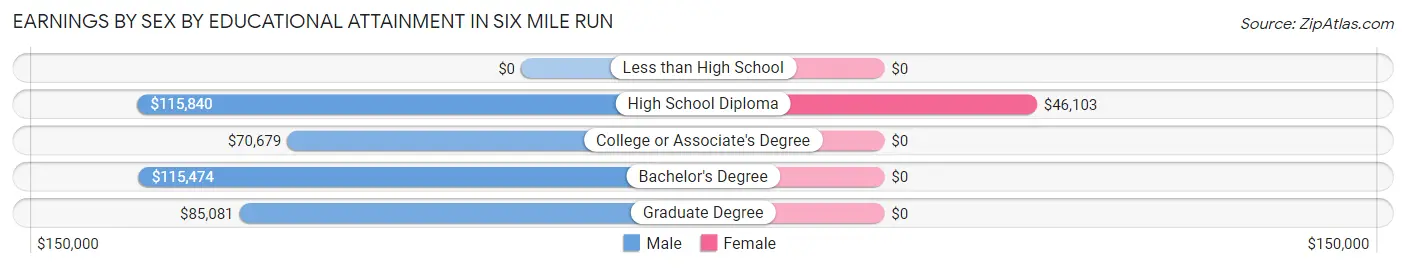
Earnings by Sex by Educational Attainment in Six Mile Run
Average earnings in Six Mile Run are $79,554 for men and $59,428 for women, a difference of 25.3%. Men with an educational attainment of high school diploma enjoy the highest average annual earnings of $115,840, while those with college or associate's degree education earn the least with $70,679. Women with an educational attainment of high school diploma earn the most with the average annual earnings of $46,103, while those with high school diploma education have the smallest earnings of $46,103.
| Educational Attainment | Male Income | Female Income |
| Less than High School | - | - |
| High School Diploma | $115,840 | $46,103 |
| College or Associate's Degree | $70,679 | $0 |
| Bachelor's Degree | $115,474 | $0 |
| Graduate Degree | $85,081 | $0 |
| Total | $79,554 | $59,428 |
Family Income in Six Mile Run
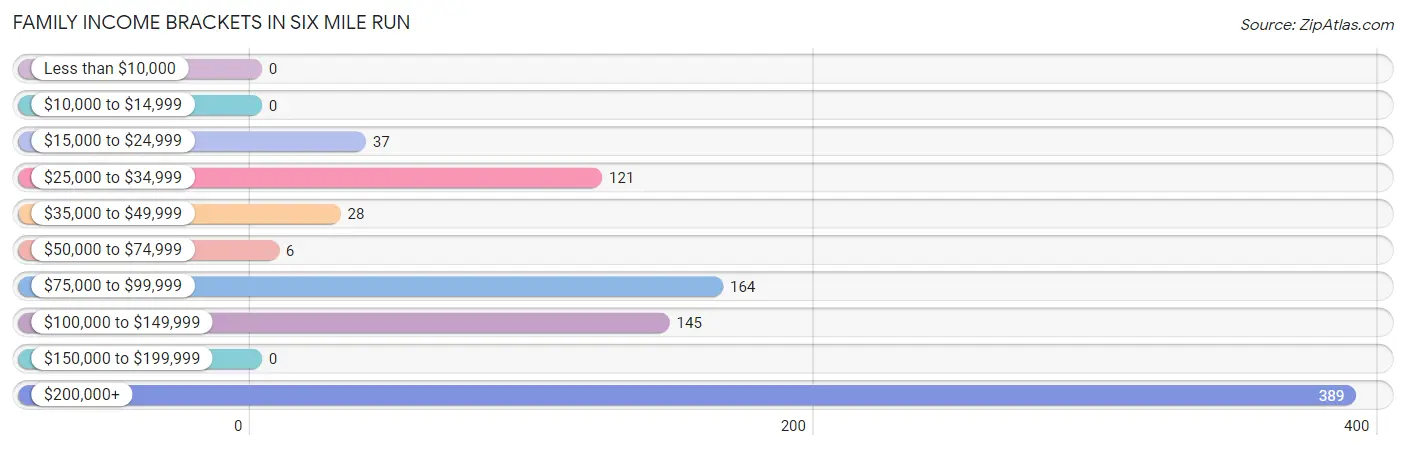
Family Income Brackets in Six Mile Run
According to the Six Mile Run family income data, there are 389 families falling into the $200,000+ income range, which is the most common income bracket and makes up 43.7% of all families.
| Income Bracket | # Families | % Families |
| Less than $10,000 | 0 | 0.0% |
| $10,000 to $14,999 | 0 | 0.0% |
| $15,000 to $24,999 | 37 | 4.2% |
| $25,000 to $34,999 | 121 | 13.6% |
| $35,000 to $49,999 | 28 | 3.1% |
| $50,000 to $74,999 | 6 | 0.7% |
| $75,000 to $99,999 | 164 | 18.4% |
| $100,000 to $149,999 | 145 | 16.3% |
| $150,000 to $199,999 | 0 | 0.0% |
| $200,000+ | 389 | 43.7% |
Family Income by Famaliy Size in Six Mile Run
| Income Bracket | # Families | Median Income |
| 2-Person Families | 415 (46.6%) | $0 |
| 3-Person Families | 330 (37.1%) | $0 |
| 4-Person Families | 0 (0.0%) | $0 |
| 5-Person Families | 87 (9.8%) | $0 |
| 6-Person Families | 58 (6.5%) | $0 |
| 7+ Person Families | 0 (0.0%) | $0 |
| Total | 890 (100.0%) | $116,228 |
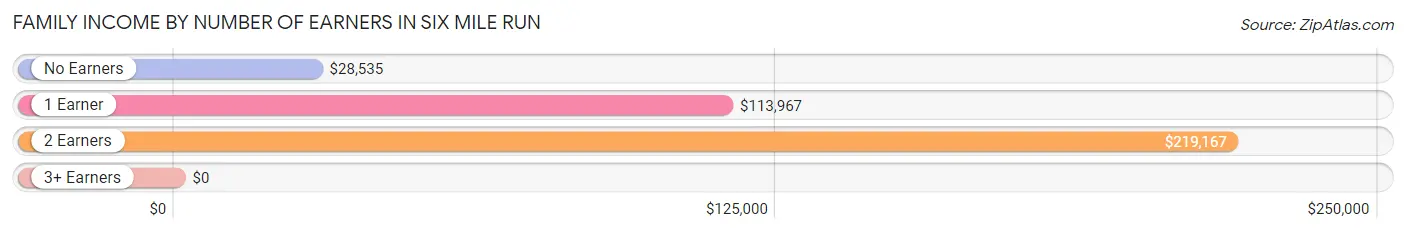
Family Income by Number of Earners in Six Mile Run
| Number of Earners | # Families | Median Income |
| No Earners | 127 (14.3%) | $28,535 |
| 1 Earner | 199 (22.4%) | $113,967 |
| 2 Earners | 468 (52.6%) | $219,167 |
| 3+ Earners | 96 (10.8%) | $0 |
| Total | 890 (100.0%) | $116,228 |
Household Income in Six Mile Run
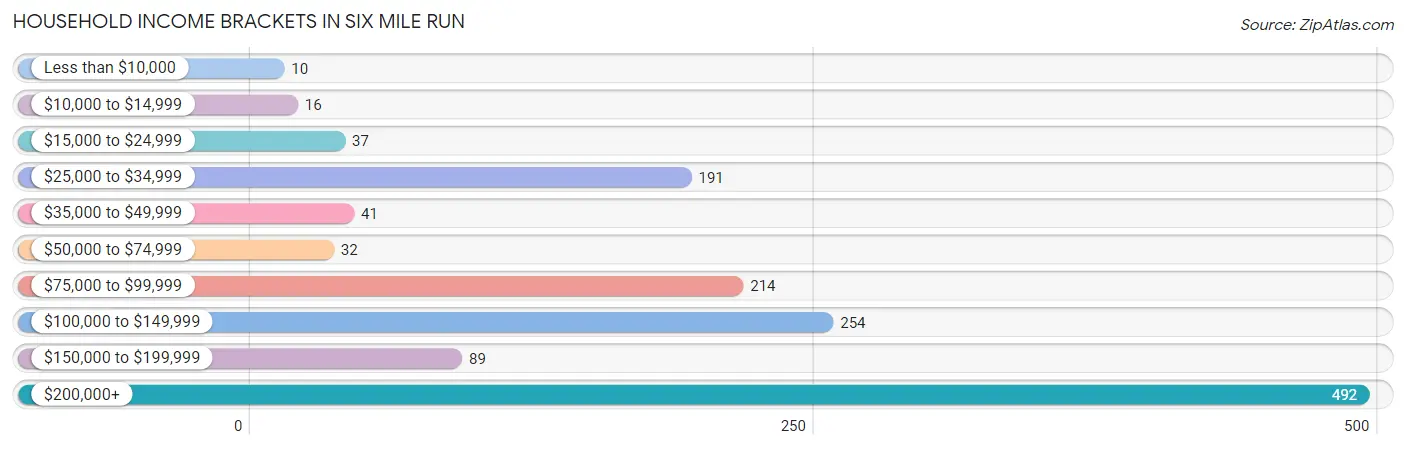
Household Income Brackets in Six Mile Run
With 492 households falling in the category, the $200,000+ income range is the most frequent in Six Mile Run, accounting for 35.8% of all households. In contrast, only 10 households (0.7%) fall into the less than $10,000 income bracket, making it the least populous group.
| Income Bracket | # Households | % Households |
| Less than $10,000 | 10 | 0.7% |
| $10,000 to $14,999 | 16 | 1.2% |
| $15,000 to $24,999 | 37 | 2.7% |
| $25,000 to $34,999 | 191 | 13.9% |
| $35,000 to $49,999 | 41 | 3.0% |
| $50,000 to $74,999 | 32 | 2.3% |
| $75,000 to $99,999 | 214 | 15.6% |
| $100,000 to $149,999 | 254 | 18.5% |
| $150,000 to $199,999 | 89 | 6.5% |
| $200,000+ | 492 | 35.8% |
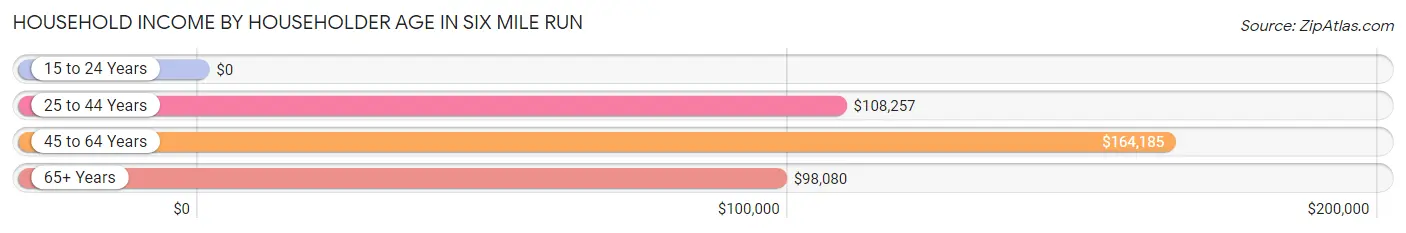
Household Income by Householder Age in Six Mile Run
The median household income in Six Mile Run is $115,526, with the highest median household income of $164,185 found in the 45 to 64 years age bracket for the primary householder. A total of 494 households (35.9%) fall into this category.
| Income Bracket | # Households | Median Income |
| 15 to 24 Years | 0 (0.0%) | $0 |
| 25 to 44 Years | 541 (39.4%) | $108,257 |
| 45 to 64 Years | 494 (35.9%) | $164,185 |
| 65+ Years | 339 (24.7%) | $98,080 |
| Total | 1,374 (100.0%) | $115,526 |
Poverty in Six Mile Run
Income Below Poverty by Sex and Age in Six Mile Run
With 0.5% poverty level for males and 0.9% for females among the residents of Six Mile Run, 55 to 64 year old males and 55 to 64 year old females are the most vulnerable to poverty, with 9 males (3.5%) and 16 females (5.0%) in their respective age groups living below the poverty level.
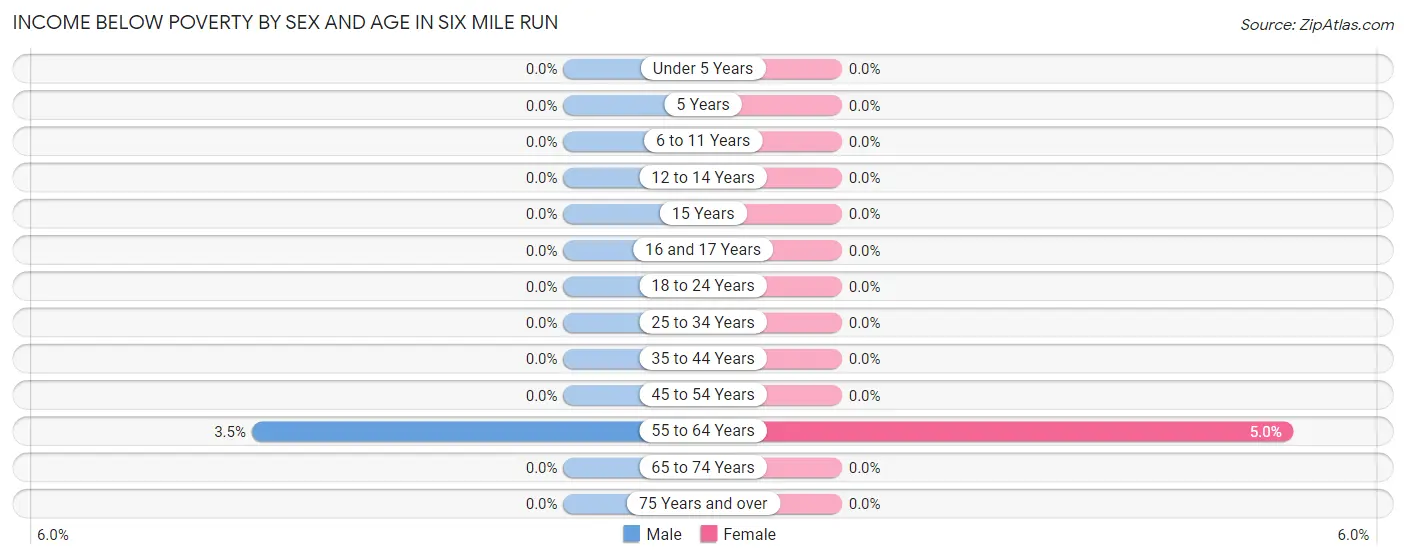
| Age Bracket | Male | Female |
| Under 5 Years | 0 (0.0%) | 0 (0.0%) |
| 5 Years | 0 (0.0%) | 0 (0.0%) |
| 6 to 11 Years | 0 (0.0%) | 0 (0.0%) |
| 12 to 14 Years | 0 (0.0%) | 0 (0.0%) |
| 15 Years | 0 (0.0%) | 0 (0.0%) |
| 16 and 17 Years | 0 (0.0%) | 0 (0.0%) |
| 18 to 24 Years | 0 (0.0%) | 0 (0.0%) |
| 25 to 34 Years | 0 (0.0%) | 0 (0.0%) |
| 35 to 44 Years | 0 (0.0%) | 0 (0.0%) |
| 45 to 54 Years | 0 (0.0%) | 0 (0.0%) |
| 55 to 64 Years | 9 (3.5%) | 16 (5.0%) |
| 65 to 74 Years | 0 (0.0%) | 0 (0.0%) |
| 75 Years and over | 0 (0.0%) | 0 (0.0%) |
| Total | 9 (0.5%) | 16 (0.9%) |
Income Above Poverty by Sex and Age in Six Mile Run
According to the poverty statistics in Six Mile Run, males aged under 5 years and females aged under 5 years are the age groups that are most secure financially, with 100.0% of males and 100.0% of females in these age groups living above the poverty line.
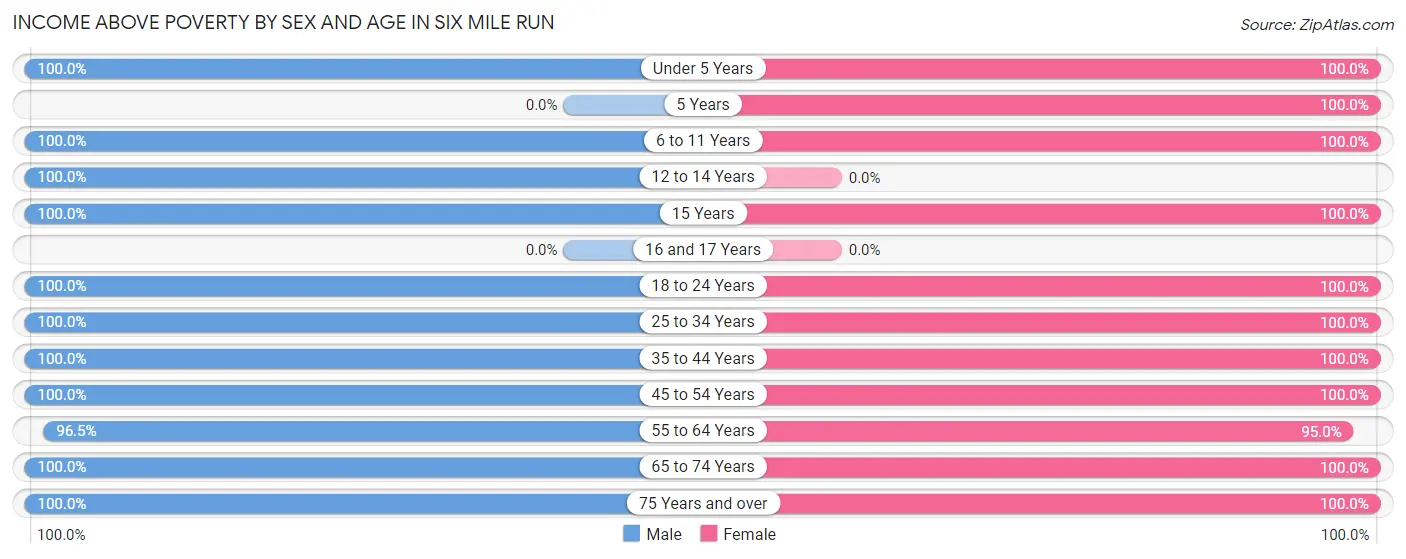
| Age Bracket | Male | Female |
| Under 5 Years | 105 (100.0%) | 76 (100.0%) |
| 5 Years | 0 (0.0%) | 110 (100.0%) |
| 6 to 11 Years | 86 (100.0%) | 172 (100.0%) |
| 12 to 14 Years | 89 (100.0%) | 0 (0.0%) |
| 15 Years | 29 (100.0%) | 6 (100.0%) |
| 16 and 17 Years | 0 (0.0%) | 0 (0.0%) |
| 18 to 24 Years | 187 (100.0%) | 88 (100.0%) |
| 25 to 34 Years | 502 (100.0%) | 298 (100.0%) |
| 35 to 44 Years | 158 (100.0%) | 292 (100.0%) |
| 45 to 54 Years | 70 (100.0%) | 205 (100.0%) |
| 55 to 64 Years | 250 (96.5%) | 302 (95.0%) |
| 65 to 74 Years | 236 (100.0%) | 163 (100.0%) |
| 75 Years and over | 42 (100.0%) | 44 (100.0%) |
| Total | 1,754 (99.5%) | 1,756 (99.1%) |
Income Below Poverty Among Married-Couple Families in Six Mile Run
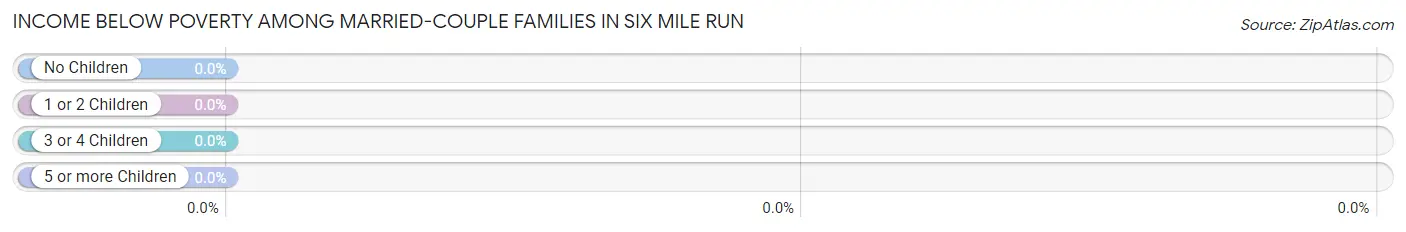
| Children | Above Poverty | Below Poverty |
| No Children | 459 (100.0%) | 0 (0.0%) |
| 1 or 2 Children | 187 (100.0%) | 0 (0.0%) |
| 3 or 4 Children | 0 (0.0%) | 0 (0.0%) |
| 5 or more Children | 0 (0.0%) | 0 (0.0%) |
| Total | 646 (100.0%) | 0 (0.0%) |
Income Below Poverty Among Single-Parent Households in Six Mile Run
| Children | Single Father | Single Mother |
| No Children | 0 (0.0%) | 0 (0.0%) |
| 1 or 2 Children | 0 (0.0%) | 0 (0.0%) |
| 3 or 4 Children | 0 (0.0%) | 0 (0.0%) |
| 5 or more Children | 0 (0.0%) | 0 (0.0%) |
| Total | 0 (0.0%) | 0 (0.0%) |
Income Below Poverty Among Married-Couple vs Single-Parent Households in Six Mile Run
| Children | Married-Couple Families | Single-Parent Households |
| No Children | 0 (0.0%) | 0 (0.0%) |
| 1 or 2 Children | 0 (0.0%) | 0 (0.0%) |
| 3 or 4 Children | 0 (0.0%) | 0 (0.0%) |
| 5 or more Children | 0 (0.0%) | 0 (0.0%) |
| Total | 0 (0.0%) | 0 (0.0%) |
Race in Six Mile Run
The most populous races in Six Mile Run are Black / African American (1,199 | 33.9%), White / Caucasian (1,134 | 32.1%), and Asian (939 | 26.6%).
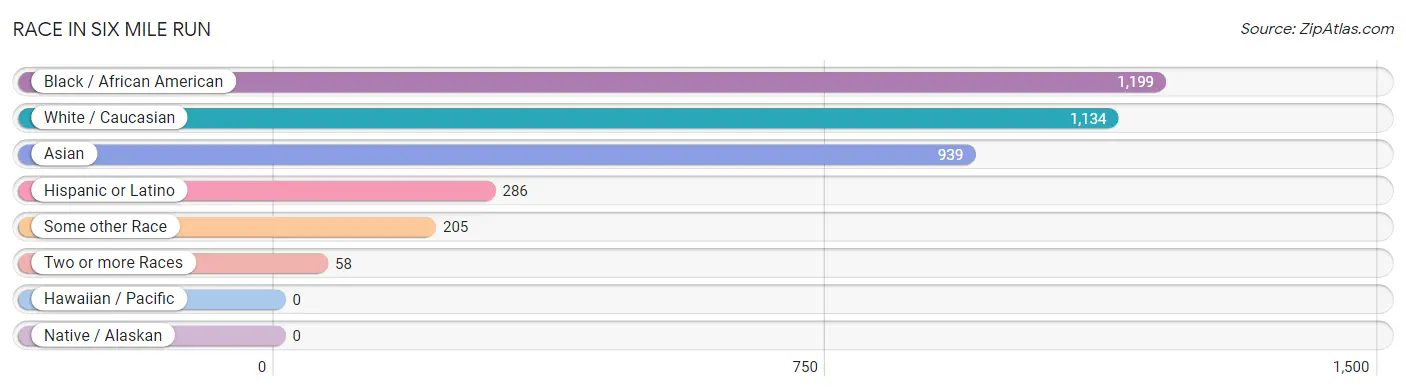
| Race | # Population | % Population |
| Asian | 939 | 26.6% |
| Black / African American | 1,199 | 33.9% |
| Hawaiian / Pacific | 0 | 0.0% |
| Hispanic or Latino | 286 | 8.1% |
| Native / Alaskan | 0 | 0.0% |
| White / Caucasian | 1,134 | 32.1% |
| Two or more Races | 58 | 1.6% |
| Some other Race | 205 | 5.8% |
| Total | 3,535 | 100.0% |
Ancestry in Six Mile Run
The most populous ancestries reported in Six Mile Run are Thai (581 | 16.4%), Korean (340 | 9.6%), Haitian (253 | 7.2%), Arab (170 | 4.8%), and Egyptian (148 | 4.2%), together accounting for 42.2% of all Six Mile Run residents.
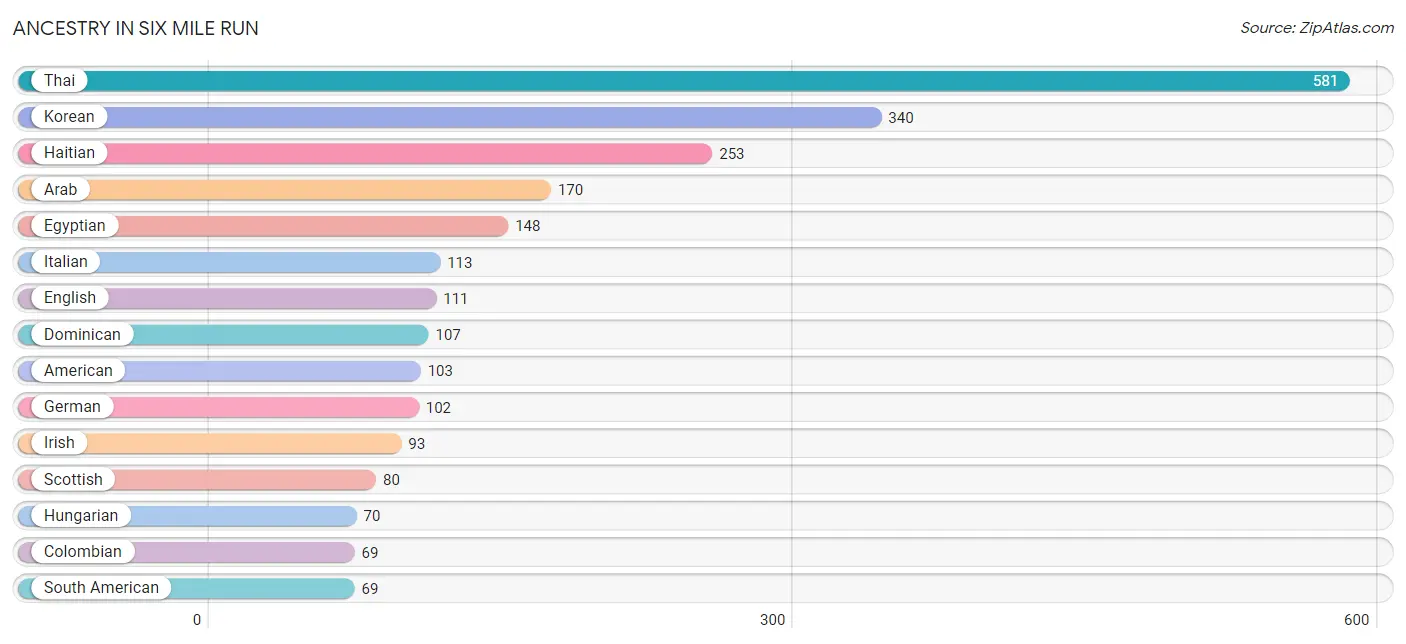
| Ancestry | # Population | % Population |
| American | 103 | 2.9% |
| Arab | 170 | 4.8% |
| Central American | 46 | 1.3% |
| Colombian | 69 | 1.9% |
| Dominican | 107 | 3.0% |
| Egyptian | 148 | 4.2% |
| English | 111 | 3.1% |
| European | 16 | 0.4% |
| French | 44 | 1.2% |
| German | 102 | 2.9% |
| Guyanese | 37 | 1.1% |
| Haitian | 253 | 7.2% |
| Hungarian | 70 | 2.0% |
| Indian (Asian) | 60 | 1.7% |
| Iranian | 38 | 1.1% |
| Irish | 93 | 2.6% |
| Italian | 113 | 3.2% |
| Jamaican | 21 | 0.6% |
| Korean | 340 | 9.6% |
| Lebanese | 22 | 0.6% |
| Polish | 9 | 0.3% |
| Portuguese | 50 | 1.4% |
| Puerto Rican | 64 | 1.8% |
| Romanian | 9 | 0.3% |
| Salvadoran | 46 | 1.3% |
| Scotch-Irish | 16 | 0.4% |
| Scottish | 80 | 2.3% |
| South American | 69 | 1.9% |
| Subsaharan African | 10 | 0.3% |
| Swedish | 50 | 1.4% |
| Thai | 581 | 16.4% | View All 31 Rows |
Immigrants in Six Mile Run
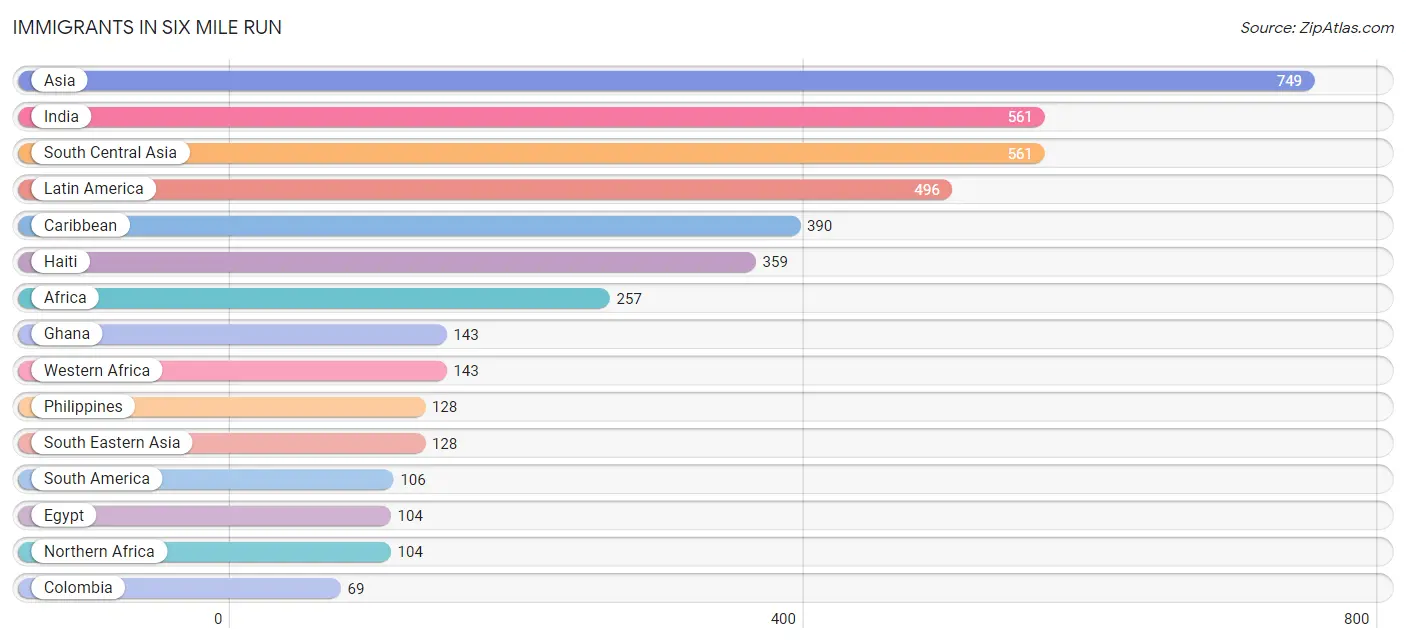
The most numerous immigrant groups reported in Six Mile Run came from Asia (749 | 21.2%), India (561 | 15.9%), South Central Asia (561 | 15.9%), Latin America (496 | 14.0%), and Caribbean (390 | 11.0%), together accounting for 78.0% of all Six Mile Run residents.
| Immigration Origin | # Population | % Population |
| Africa | 257 | 7.3% |
| Asia | 749 | 21.2% |
| Australia | 19 | 0.5% |
| Cameroon | 10 | 0.3% |
| Canada | 44 | 1.2% |
| Caribbean | 390 | 11.0% |
| China | 60 | 1.7% |
| Colombia | 69 | 1.9% |
| Dominican Republic | 31 | 0.9% |
| Eastern Asia | 60 | 1.7% |
| Egypt | 104 | 2.9% |
| Europe | 17 | 0.5% |
| Ghana | 143 | 4.1% |
| Guyana | 37 | 1.1% |
| Haiti | 359 | 10.2% |
| Hong Kong | 11 | 0.3% |
| India | 561 | 15.9% |
| Latin America | 496 | 14.0% |
| Middle Africa | 10 | 0.3% |
| Northern Africa | 104 | 2.9% |
| Northern Europe | 17 | 0.5% |
| Oceania | 19 | 0.5% |
| Philippines | 128 | 3.6% |
| South America | 106 | 3.0% |
| South Central Asia | 561 | 15.9% |
| South Eastern Asia | 128 | 3.6% |
| Western Africa | 143 | 4.1% | View All 27 Rows |
Sex and Age in Six Mile Run
Sex and Age in Six Mile Run
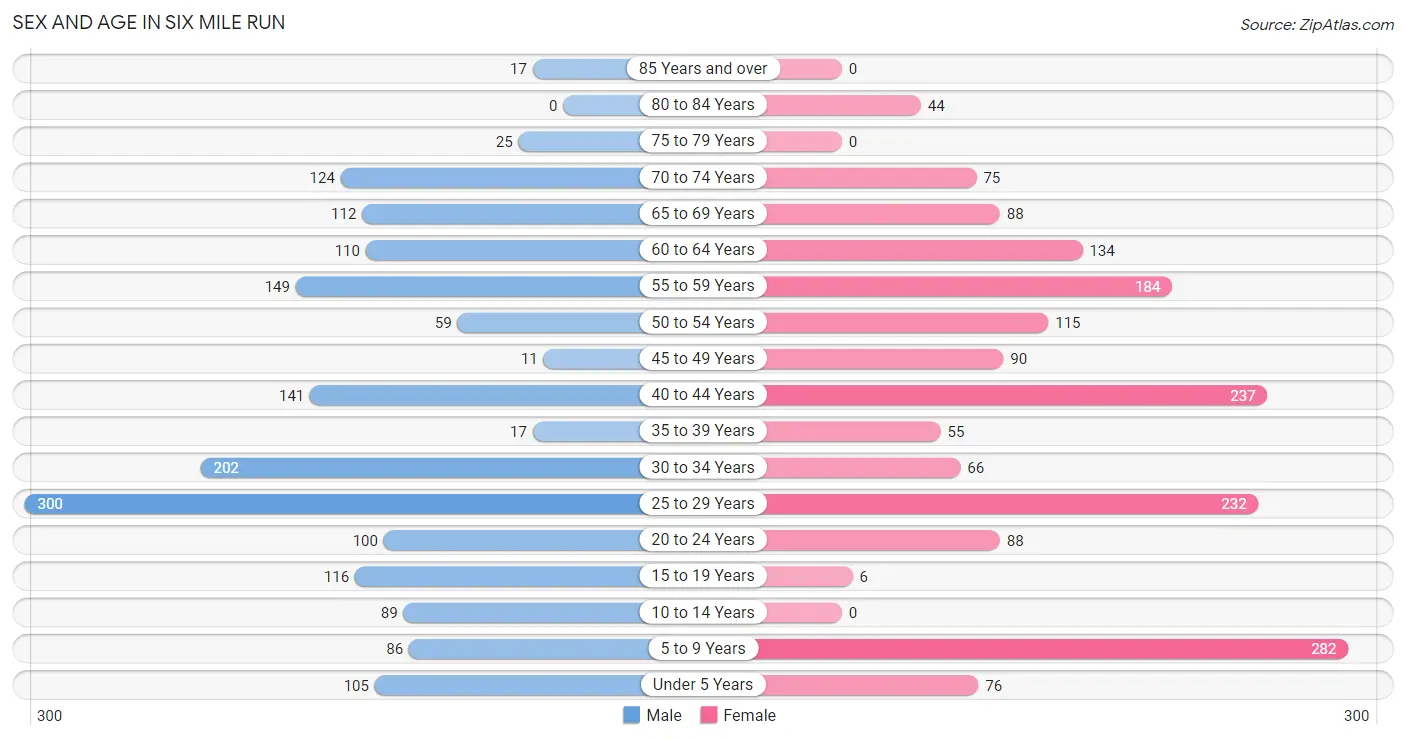
The most populous age groups in Six Mile Run are 25 to 29 Years (300 | 17.0%) for men and 5 to 9 Years (282 | 15.9%) for women.
| Age Bracket | Male | Female |
| Under 5 Years | 105 (6.0%) | 76 (4.3%) |
| 5 to 9 Years | 86 (4.9%) | 282 (15.9%) |
| 10 to 14 Years | 89 (5.1%) | 0 (0.0%) |
| 15 to 19 Years | 116 (6.6%) | 6 (0.3%) |
| 20 to 24 Years | 100 (5.7%) | 88 (5.0%) |
| 25 to 29 Years | 300 (17.0%) | 232 (13.1%) |
| 30 to 34 Years | 202 (11.5%) | 66 (3.7%) |
| 35 to 39 Years | 17 (1.0%) | 55 (3.1%) |
| 40 to 44 Years | 141 (8.0%) | 237 (13.4%) |
| 45 to 49 Years | 11 (0.6%) | 90 (5.1%) |
| 50 to 54 Years | 59 (3.4%) | 115 (6.5%) |
| 55 to 59 Years | 149 (8.5%) | 184 (10.4%) |
| 60 to 64 Years | 110 (6.2%) | 134 (7.6%) |
| 65 to 69 Years | 112 (6.4%) | 88 (5.0%) |
| 70 to 74 Years | 124 (7.0%) | 75 (4.2%) |
| 75 to 79 Years | 25 (1.4%) | 0 (0.0%) |
| 80 to 84 Years | 0 (0.0%) | 44 (2.5%) |
| 85 Years and over | 17 (1.0%) | 0 (0.0%) |
| Total | 1,763 (100.0%) | 1,772 (100.0%) |
Families and Households in Six Mile Run
Median Family Size in Six Mile Run
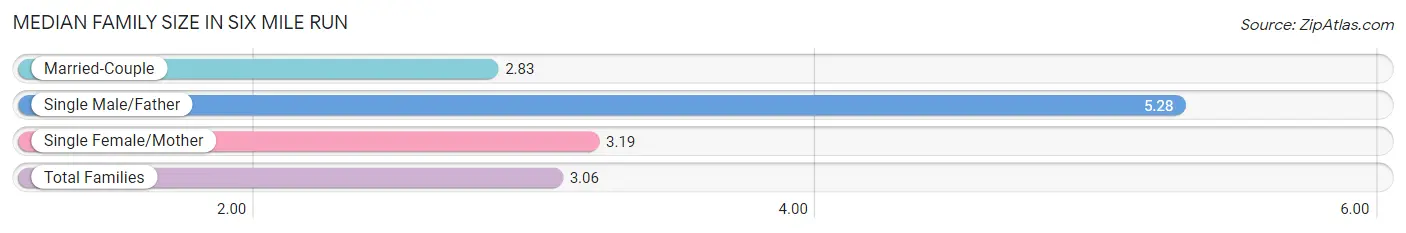
The median family size in Six Mile Run is 3.06 persons per family, with single male/father families (58 | 6.5%) accounting for the largest median family size of 5.28 persons per family. On the other hand, married-couple families (646 | 72.6%) represent the smallest median family size with 2.83 persons per family.
| Family Type | # Families | Family Size |
| Married-Couple | 646 (72.6%) | 2.83 |
| Single Male/Father | 58 (6.5%) | 5.28 |
| Single Female/Mother | 186 (20.9%) | 3.19 |
| Total Families | 890 (100.0%) | 3.06 |
Median Household Size in Six Mile Run
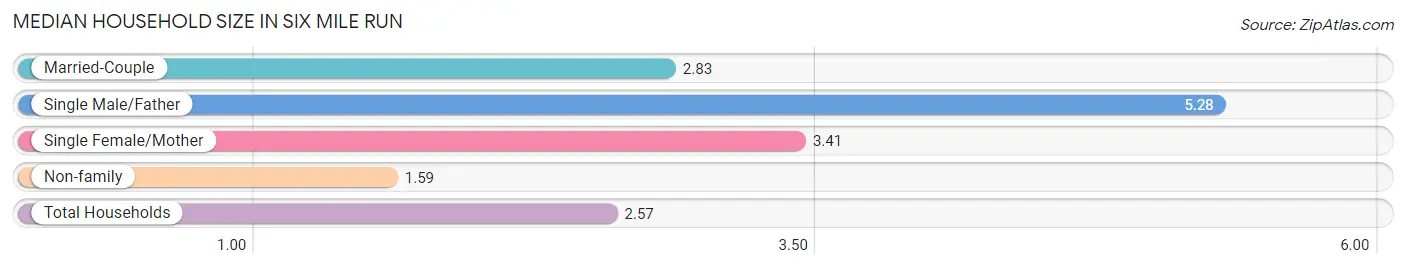
The median household size in Six Mile Run is 2.57 persons per household, with single male/father households (58 | 4.2%) accounting for the largest median household size of 5.28 persons per household. non-family households (484 | 35.2%) represent the smallest median household size with 1.59 persons per household.
| Household Type | # Households | Household Size |
| Married-Couple | 646 (47.0%) | 2.83 |
| Single Male/Father | 58 (4.2%) | 5.28 |
| Single Female/Mother | 186 (13.5%) | 3.41 |
| Non-family | 484 (35.2%) | 1.59 |
| Total Households | 1,374 (100.0%) | 2.57 |
Household Size by Marriage Status in Six Mile Run
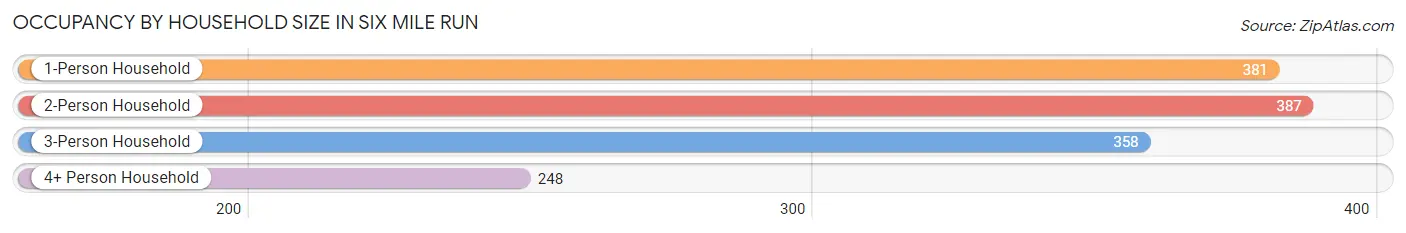
Out of a total of 1,374 households in Six Mile Run, 890 (64.8%) are family households, while 484 (35.2%) are nonfamily households. The most numerous type of family households are 2-person households, comprising 387, and the most common type of nonfamily households are 1-person households, comprising 381.
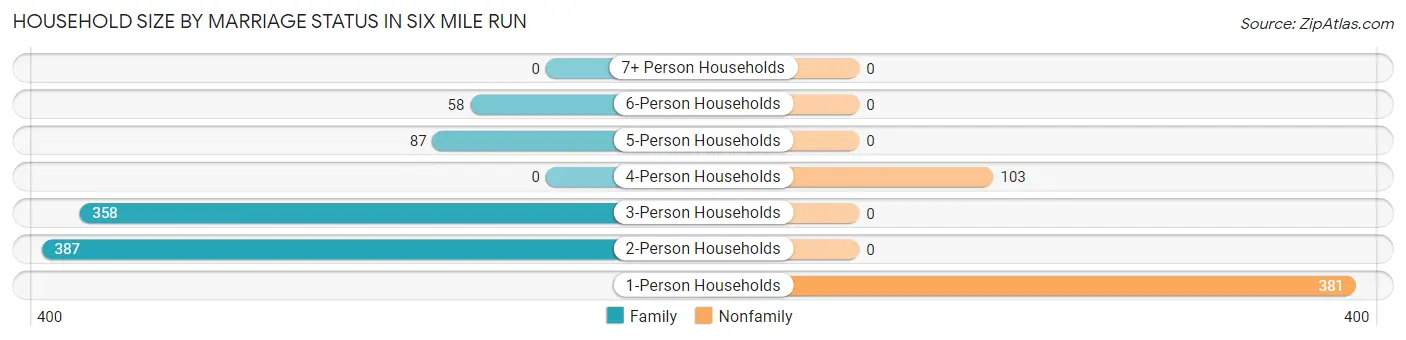
| Household Size | Family Households | Nonfamily Households |
| 1-Person Households | - | 381 (27.7%) |
| 2-Person Households | 387 (28.2%) | 0 (0.0%) |
| 3-Person Households | 358 (26.1%) | 0 (0.0%) |
| 4-Person Households | 0 (0.0%) | 103 (7.5%) |
| 5-Person Households | 87 (6.3%) | 0 (0.0%) |
| 6-Person Households | 58 (4.2%) | 0 (0.0%) |
| 7+ Person Households | 0 (0.0%) | 0 (0.0%) |
| Total | 890 (64.8%) | 484 (35.2%) |
Female Fertility in Six Mile Run
Fertility by Age in Six Mile Run
Average fertility rate in Six Mile Run is 24.0 births per 1,000 women. Women in the age bracket of 35 to 50 years have the highest fertility rate with 47.0 births per 1,000 women. Women in the age bracket of 35 to 50 years acount for 100.0% of all women with births.
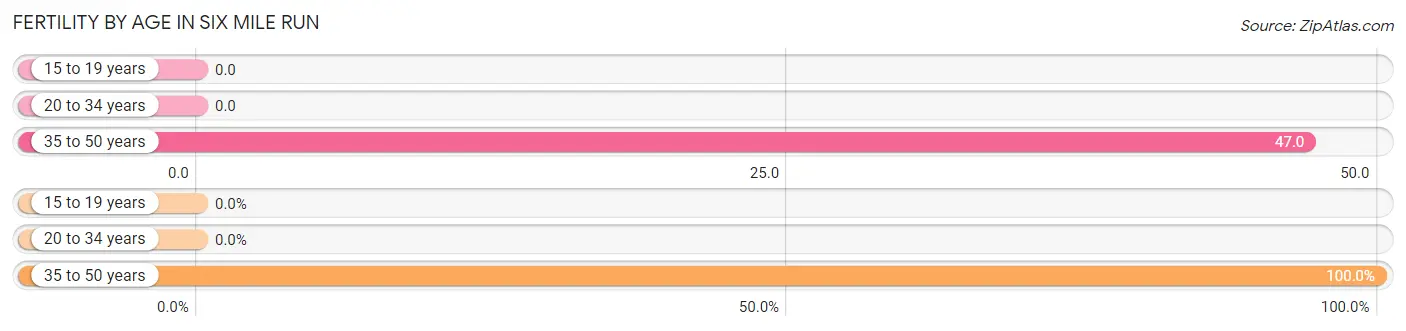
| Age Bracket | Women with Births | Births / 1,000 Women |
| 15 to 19 years | 0 (0.0%) | 0.0 |
| 20 to 34 years | 0 (0.0%) | 0.0 |
| 35 to 50 years | 19 (100.0%) | 47.0 |
| Total | 19 (100.0%) | 24.0 |
Fertility by Age by Marriage Status in Six Mile Run
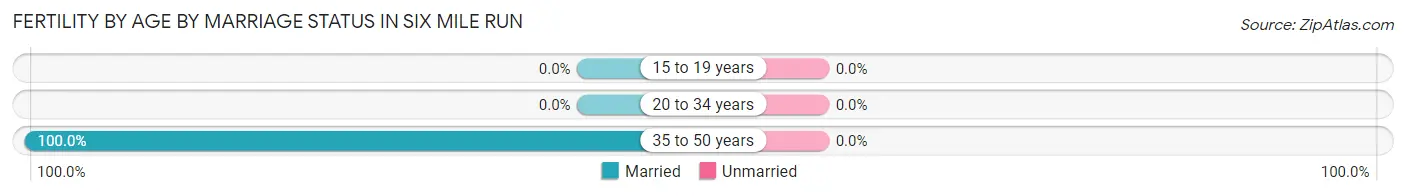
| Age Bracket | Married | Unmarried |
| 15 to 19 years | 0 (0.0%) | 0 (0.0%) |
| 20 to 34 years | 0 (0.0%) | 0 (0.0%) |
| 35 to 50 years | 19 (100.0%) | 0 (0.0%) |
| Total | 19 (100.0%) | 0 (0.0%) |
Fertility by Education in Six Mile Run
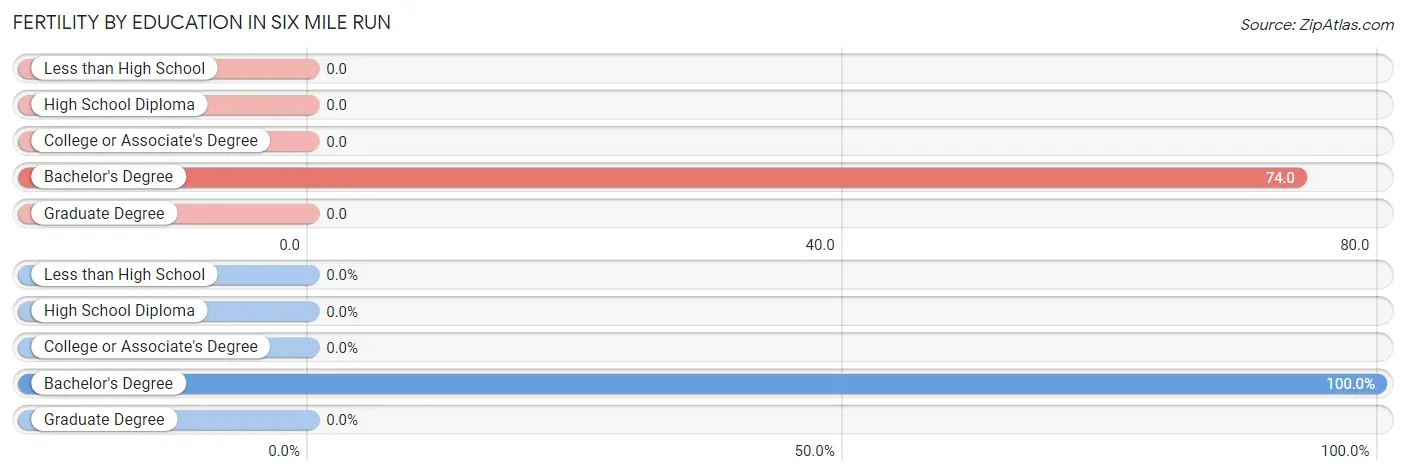
| Educational Attainment | Women with Births | Births / 1,000 Women |
| Less than High School | 0 (0.0%) | 0.0 |
| High School Diploma | 0 (0.0%) | 0.0 |
| College or Associate's Degree | 0 (0.0%) | 0.0 |
| Bachelor's Degree | 19 (100.0%) | 74.0 |
| Graduate Degree | 0 (0.0%) | 0.0 |
| Total | 19 (100.0%) | 24.0 |
Fertility by Education by Marriage Status in Six Mile Run
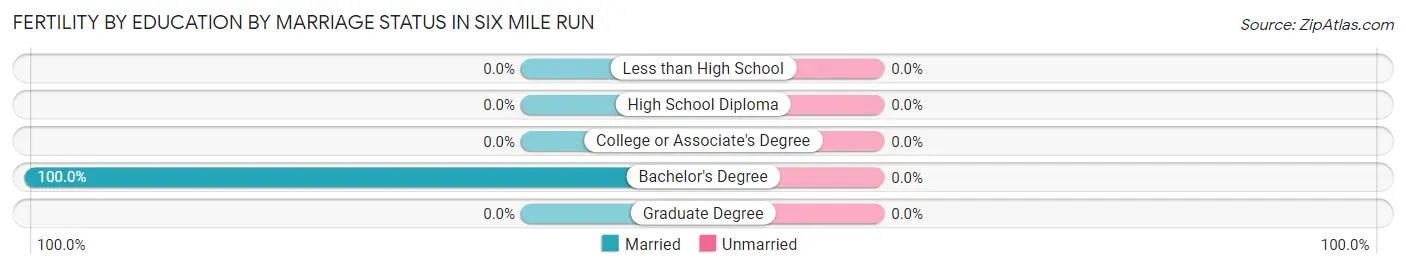
| Educational Attainment | Married | Unmarried |
| Less than High School | 0 (0.0%) | 0 (0.0%) |
| High School Diploma | 0 (0.0%) | 0 (0.0%) |
| College or Associate's Degree | 0 (0.0%) | 0 (0.0%) |
| Bachelor's Degree | 19 (100.0%) | 0 (0.0%) |
| Graduate Degree | 0 (0.0%) | 0 (0.0%) |
| Total | 19 (100.0%) | 0 (0.0%) |
Employment Characteristics in Six Mile Run
Employment by Class of Employer in Six Mile Run
Among the 1,996 employed individuals in Six Mile Run, private company employees (1,586 | 79.5%), local government employees (103 | 5.2%), and state government employees (91 | 4.6%) make up the most common classes of employment.
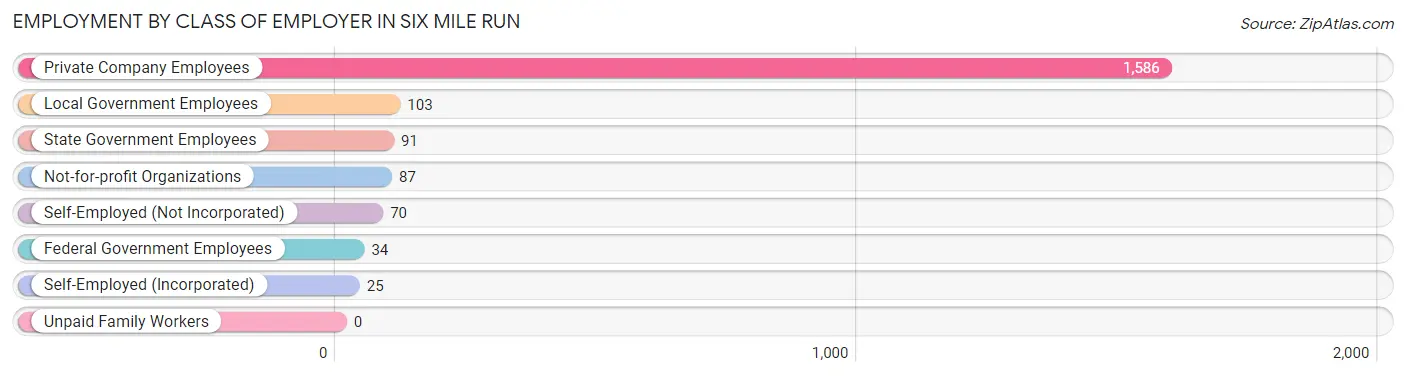
| Employer Class | # Employees | % Employees |
| Private Company Employees | 1,586 | 79.5% |
| Self-Employed (Incorporated) | 25 | 1.3% |
| Self-Employed (Not Incorporated) | 70 | 3.5% |
| Not-for-profit Organizations | 87 | 4.4% |
| Local Government Employees | 103 | 5.2% |
| State Government Employees | 91 | 4.6% |
| Federal Government Employees | 34 | 1.7% |
| Unpaid Family Workers | 0 | 0.0% |
| Total | 1,996 | 100.0% |
Employment Status by Age in Six Mile Run
According to the labor force statistics for Six Mile Run, out of the total population over 16 years of age (2,862), 71.4% or 2,043 individuals are in the labor force, with 2.3% or 47 of them unemployed. The age group with the highest labor force participation rate is 30 to 34 years, with 100.0% or 268 individuals in the labor force. Within the labor force, the 45 to 54 years age range has the highest percentage of unemployed individuals, with 10.7% or 26 of them being unemployed.
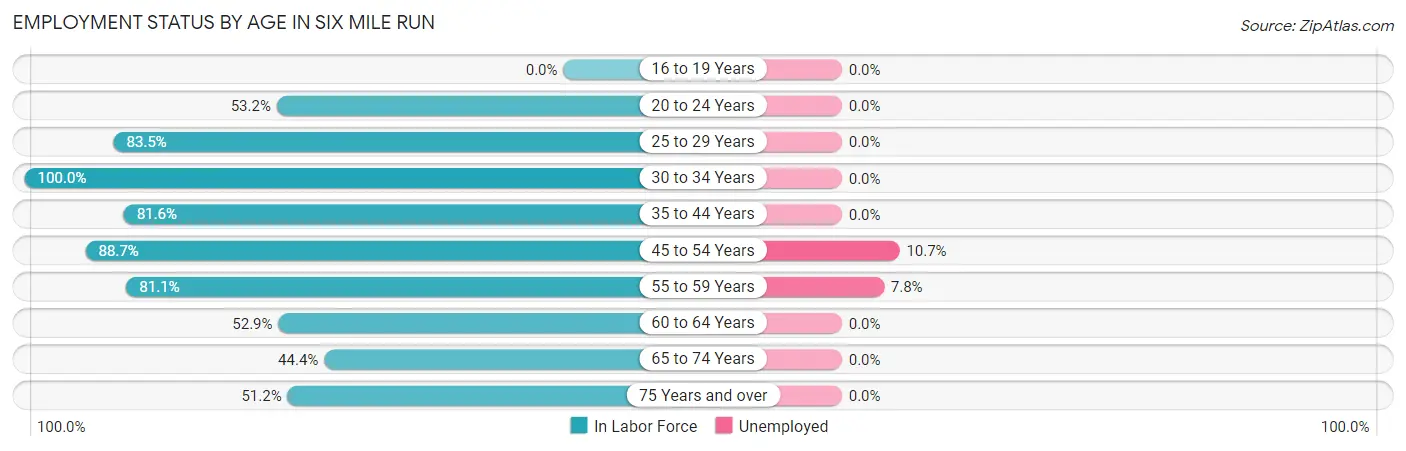
| Age Bracket | In Labor Force | Unemployed |
| 16 to 19 Years | 0 (0.0%) | 0 (0.0%) |
| 20 to 24 Years | 100 (53.2%) | 0 (0.0%) |
| 25 to 29 Years | 444 (83.5%) | 0 (0.0%) |
| 30 to 34 Years | 268 (100.0%) | 0 (0.0%) |
| 35 to 44 Years | 367 (81.6%) | 0 (0.0%) |
| 45 to 54 Years | 244 (88.7%) | 26 (10.7%) |
| 55 to 59 Years | 270 (81.1%) | 21 (7.8%) |
| 60 to 64 Years | 129 (52.9%) | 0 (0.0%) |
| 65 to 74 Years | 177 (44.4%) | 0 (0.0%) |
| 75 Years and over | 44 (51.2%) | 0 (0.0%) |
| Total | 2,043 (71.4%) | 47 (2.3%) |
Employment Status by Educational Attainment in Six Mile Run
According to labor force statistics for Six Mile Run, 81.9% of individuals (1,722) out of the total population between 25 and 64 years of age (2,102) are in the labor force, with 2.7% or 46 of them being unemployed. The group with the highest labor force participation rate are those with the educational attainment of bachelor's degree or higher, with 89.0% or 1,371 individuals in the labor force. Within the labor force, individuals with college / associate degree education have the highest percentage of unemployment, with 19.4% or 26 of them being unemployed.
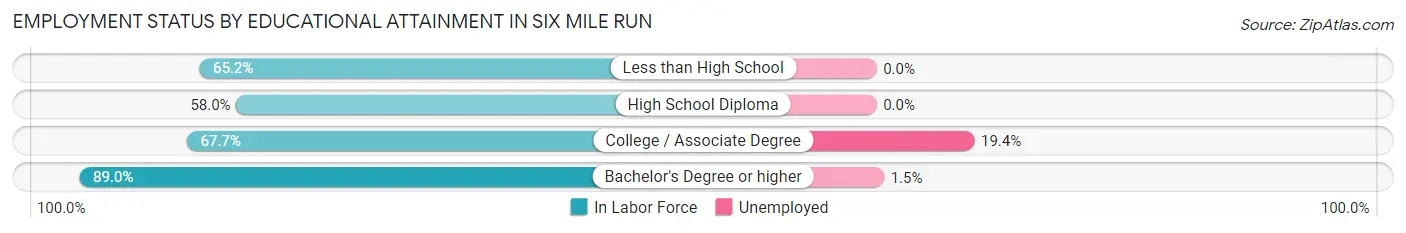
| Educational Attainment | In Labor Force | Unemployed |
| Less than High School | 58 (65.2%) | 0 (0.0%) |
| High School Diploma | 159 (58.0%) | 0 (0.0%) |
| College / Associate Degree | 134 (67.7%) | 38 (19.4%) |
| Bachelor's Degree or higher | 1,371 (89.0%) | 23 (1.5%) |
| Total | 1,722 (81.9%) | 57 (2.7%) |
Employment Occupations by Sex in Six Mile Run
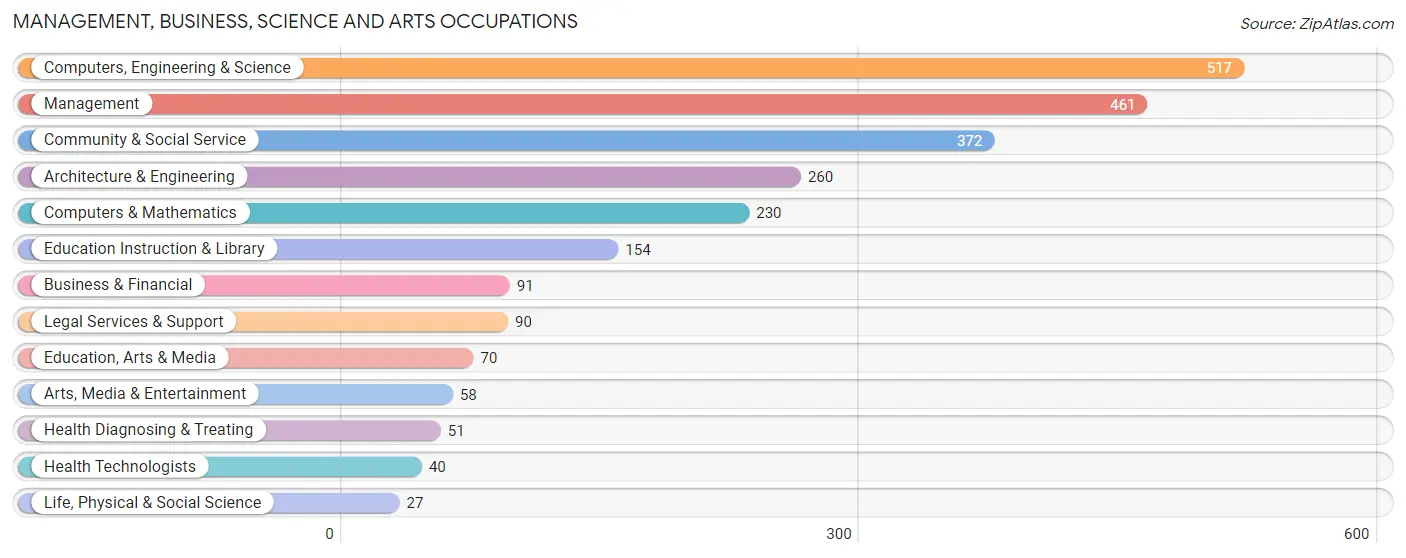
Management, Business, Science and Arts Occupations
The most common Management, Business, Science and Arts occupations in Six Mile Run are Computers, Engineering & Science (517 | 25.9%), Management (461 | 23.1%), Community & Social Service (372 | 18.6%), Architecture & Engineering (260 | 13.0%), and Computers & Mathematics (230 | 11.5%).
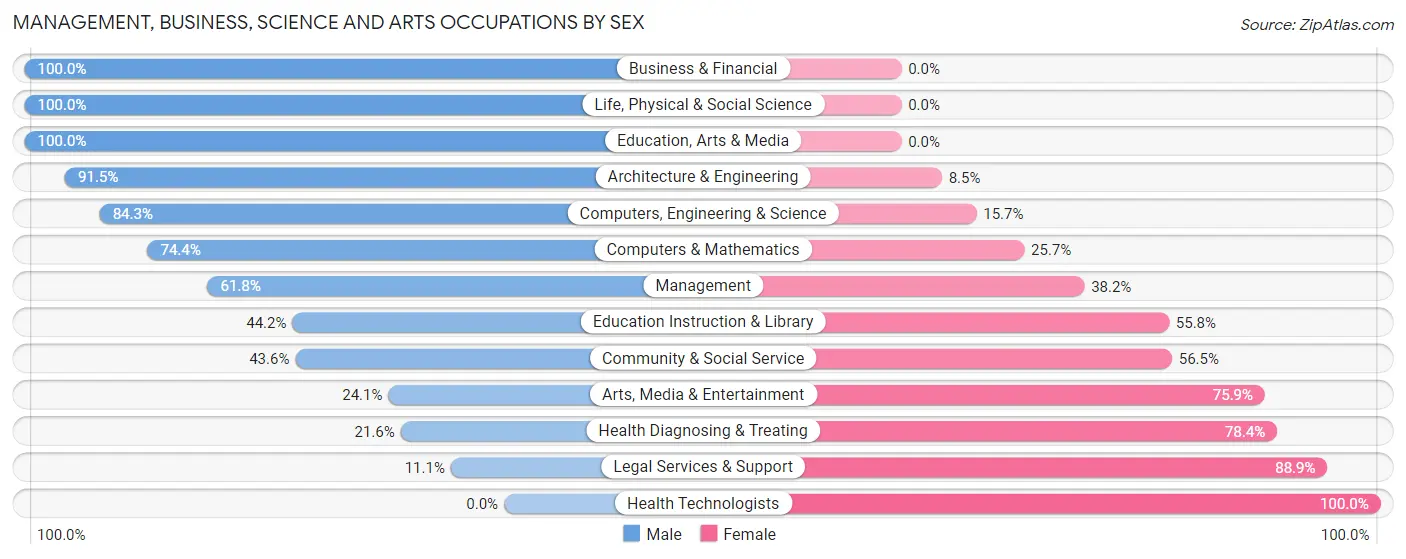
Management, Business, Science and Arts Occupations by Sex
Within the Management, Business, Science and Arts occupations in Six Mile Run, the most male-oriented occupations are Business & Financial (100.0%), Life, Physical & Social Science (100.0%), and Education, Arts & Media (100.0%), while the most female-oriented occupations are Health Technologists (100.0%), Legal Services & Support (88.9%), and Health Diagnosing & Treating (78.4%).
| Occupation | Male | Female |
| Management | 285 (61.8%) | 176 (38.2%) |
| Business & Financial | 91 (100.0%) | 0 (0.0%) |
| Computers, Engineering & Science | 436 (84.3%) | 81 (15.7%) |
| Computers & Mathematics | 171 (74.4%) | 59 (25.7%) |
| Architecture & Engineering | 238 (91.5%) | 22 (8.5%) |
| Life, Physical & Social Science | 27 (100.0%) | 0 (0.0%) |
| Community & Social Service | 162 (43.5%) | 210 (56.5%) |
| Education, Arts & Media | 70 (100.0%) | 0 (0.0%) |
| Legal Services & Support | 10 (11.1%) | 80 (88.9%) |
| Education Instruction & Library | 68 (44.2%) | 86 (55.8%) |
| Arts, Media & Entertainment | 14 (24.1%) | 44 (75.9%) |
| Health Diagnosing & Treating | 11 (21.6%) | 40 (78.4%) |
| Health Technologists | 0 (0.0%) | 40 (100.0%) |
| Total (Category) | 985 (66.0%) | 507 (34.0%) |
| Total (Overall) | 1,173 (58.8%) | 823 (41.2%) |
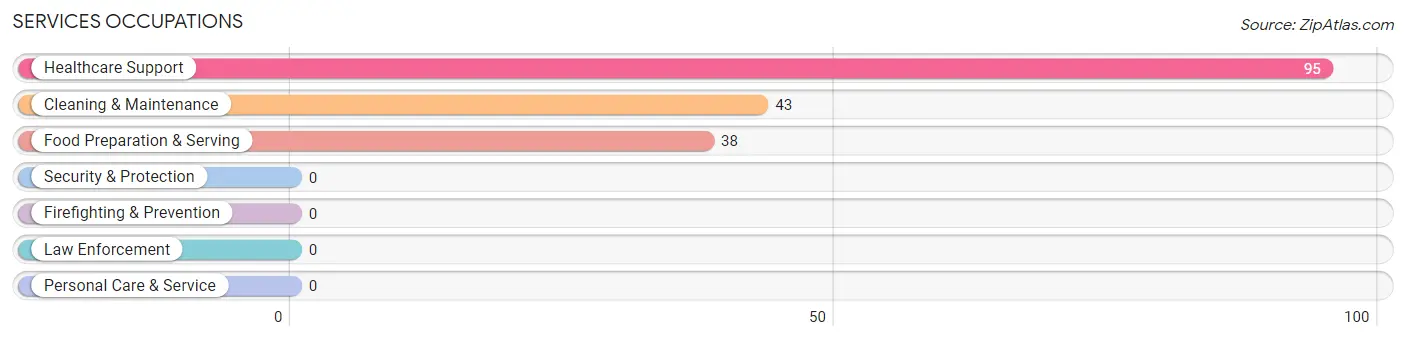
Services Occupations
The most common Services occupations in Six Mile Run are Healthcare Support (95 | 4.8%), Cleaning & Maintenance (43 | 2.1%), and Food Preparation & Serving (38 | 1.9%).
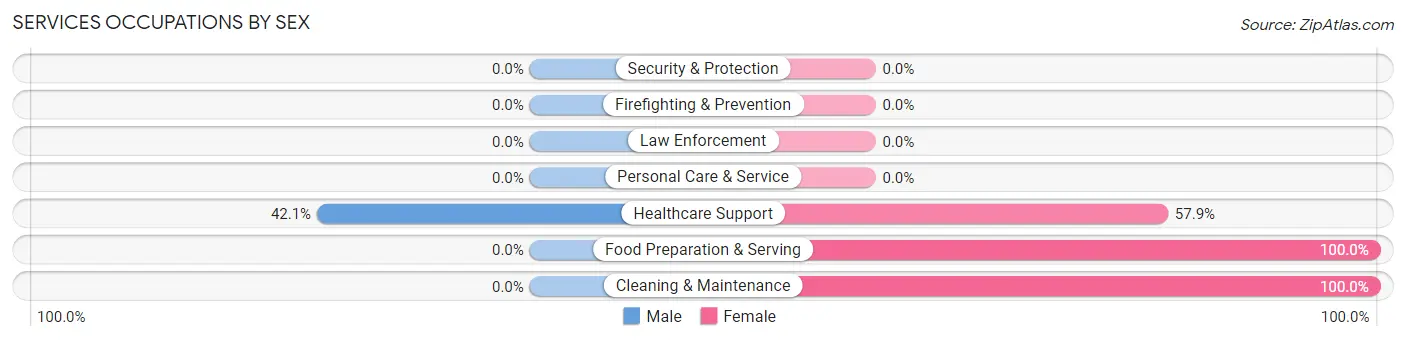
Services Occupations by Sex
| Occupation | Male | Female |
| Healthcare Support | 40 (42.1%) | 55 (57.9%) |
| Security & Protection | 0 (0.0%) | 0 (0.0%) |
| Firefighting & Prevention | 0 (0.0%) | 0 (0.0%) |
| Law Enforcement | 0 (0.0%) | 0 (0.0%) |
| Food Preparation & Serving | 0 (0.0%) | 38 (100.0%) |
| Cleaning & Maintenance | 0 (0.0%) | 43 (100.0%) |
| Personal Care & Service | 0 (0.0%) | 0 (0.0%) |
| Total (Category) | 40 (22.7%) | 136 (77.3%) |
| Total (Overall) | 1,173 (58.8%) | 823 (41.2%) |
Sales and Office Occupations
The most common Sales and Office occupations in Six Mile Run are Sales & Related (147 | 7.4%), and Office & Administration (45 | 2.2%).
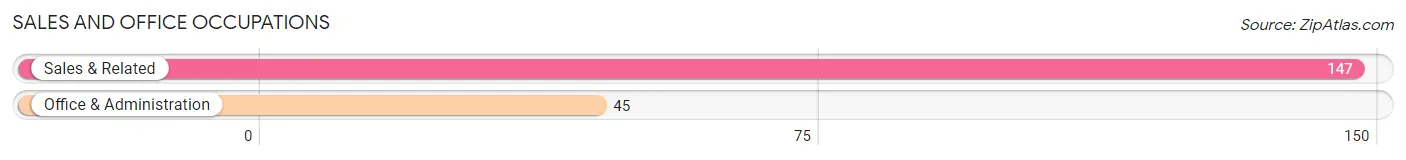
Sales and Office Occupations by Sex
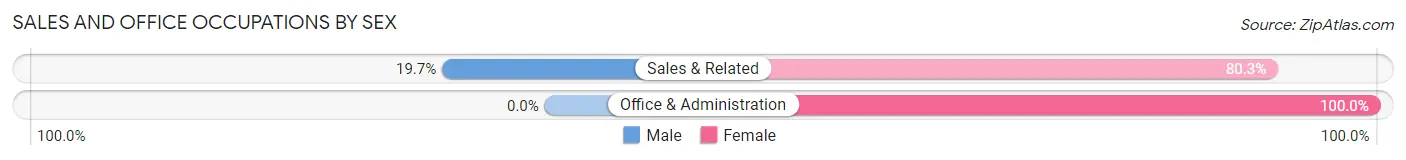
| Occupation | Male | Female |
| Sales & Related | 29 (19.7%) | 118 (80.3%) |
| Office & Administration | 0 (0.0%) | 45 (100.0%) |
| Total (Category) | 29 (15.1%) | 163 (84.9%) |
| Total (Overall) | 1,173 (58.8%) | 823 (41.2%) |
Natural Resources, Construction and Maintenance Occupations
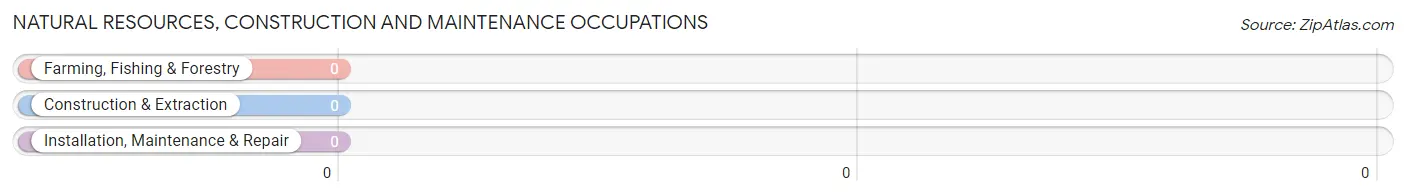
Natural Resources, Construction and Maintenance Occupations by Sex
| Occupation | Male | Female |
| Farming, Fishing & Forestry | 0 (0.0%) | 0 (0.0%) |
| Construction & Extraction | 0 (0.0%) | 0 (0.0%) |
| Installation, Maintenance & Repair | 0 (0.0%) | 0 (0.0%) |
| Total (Category) | 0 (0.0%) | 0 (0.0%) |
| Total (Overall) | 1,173 (58.8%) | 823 (41.2%) |
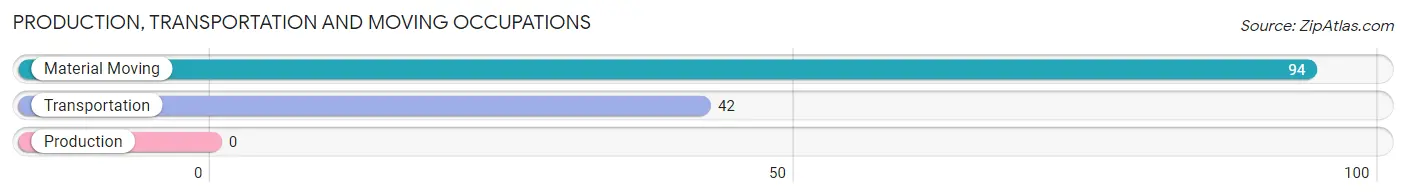
Production, Transportation and Moving Occupations
The most common Production, Transportation and Moving occupations in Six Mile Run are Material Moving (94 | 4.7%), and Transportation (42 | 2.1%).
Production, Transportation and Moving Occupations by Sex
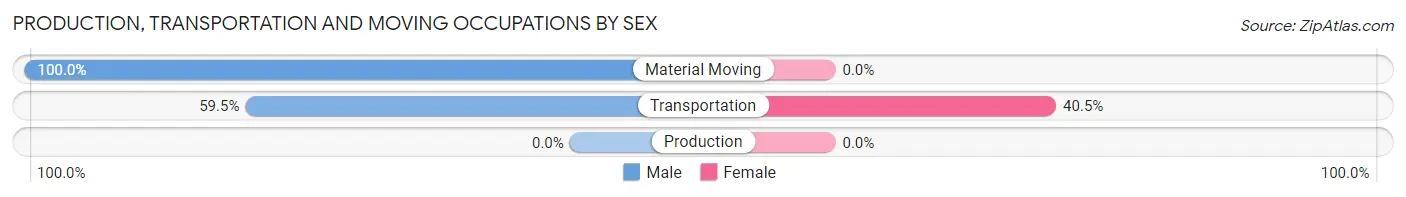
| Occupation | Male | Female |
| Production | 0 (0.0%) | 0 (0.0%) |
| Transportation | 25 (59.5%) | 17 (40.5%) |
| Material Moving | 94 (100.0%) | 0 (0.0%) |
| Total (Category) | 119 (87.5%) | 17 (12.5%) |
| Total (Overall) | 1,173 (58.8%) | 823 (41.2%) |
Employment Industries by Sex in Six Mile Run
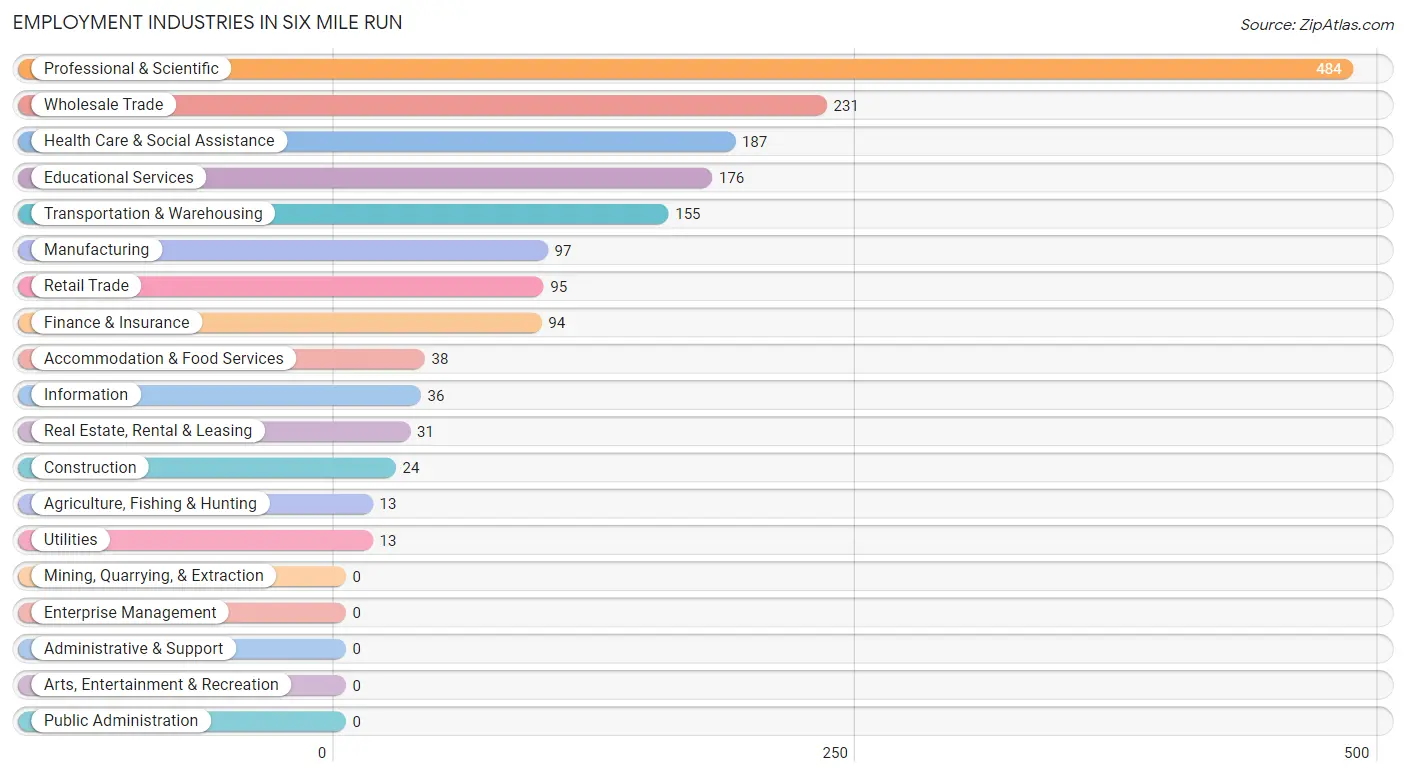
Employment Industries in Six Mile Run
The major employment industries in Six Mile Run include Professional & Scientific (484 | 24.2%), Wholesale Trade (231 | 11.6%), Health Care & Social Assistance (187 | 9.4%), Educational Services (176 | 8.8%), and Transportation & Warehousing (155 | 7.8%).
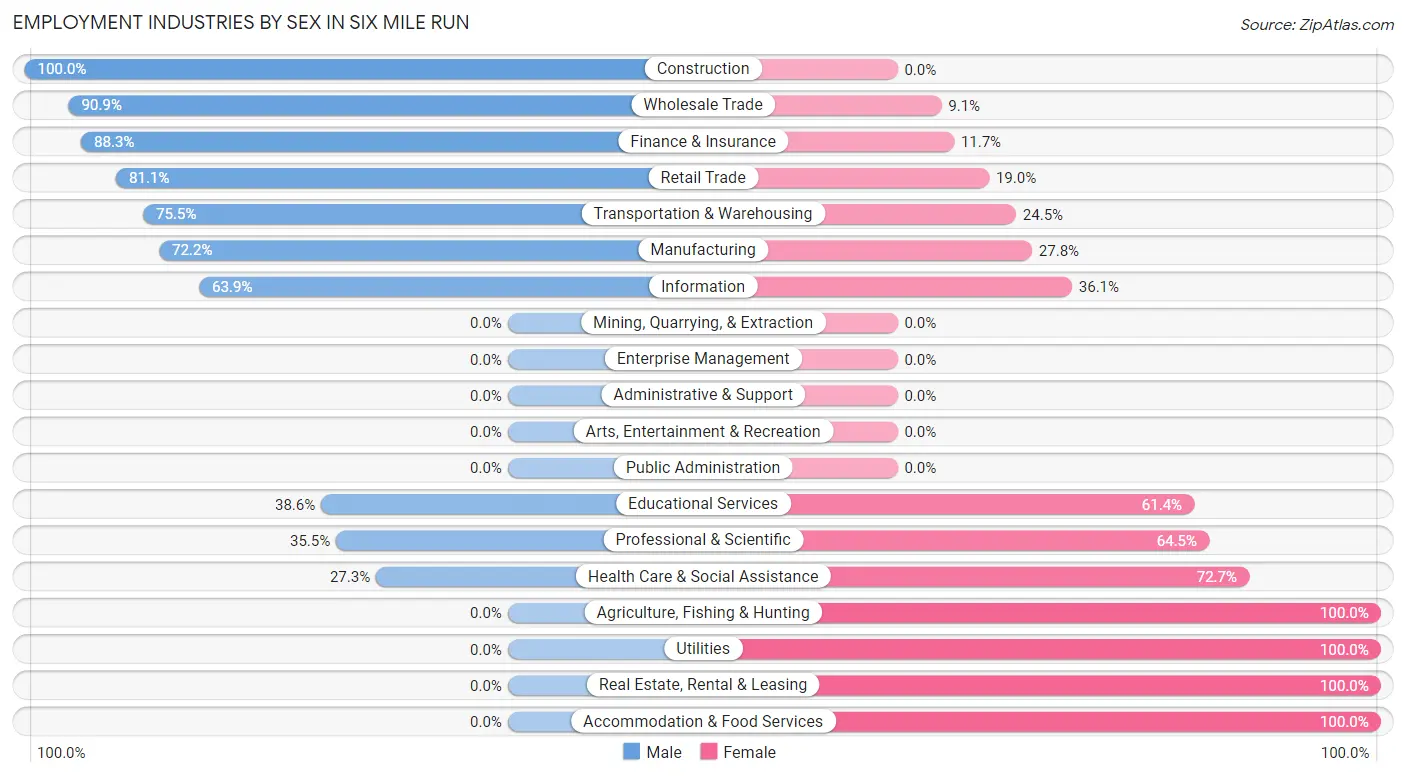
Employment Industries by Sex in Six Mile Run
The Six Mile Run industries that see more men than women are Construction (100.0%), Wholesale Trade (90.9%), and Finance & Insurance (88.3%), whereas the industries that tend to have a higher number of women are Agriculture, Fishing & Hunting (100.0%), Utilities (100.0%), and Real Estate, Rental & Leasing (100.0%).
| Industry | Male | Female |
| Agriculture, Fishing & Hunting | 0 (0.0%) | 13 (100.0%) |
| Mining, Quarrying, & Extraction | 0 (0.0%) | 0 (0.0%) |
| Construction | 24 (100.0%) | 0 (0.0%) |
| Manufacturing | 70 (72.2%) | 27 (27.8%) |
| Wholesale Trade | 210 (90.9%) | 21 (9.1%) |
| Retail Trade | 77 (81.0%) | 18 (19.0%) |
| Transportation & Warehousing | 117 (75.5%) | 38 (24.5%) |
| Utilities | 0 (0.0%) | 13 (100.0%) |
| Information | 23 (63.9%) | 13 (36.1%) |
| Finance & Insurance | 83 (88.3%) | 11 (11.7%) |
| Real Estate, Rental & Leasing | 0 (0.0%) | 31 (100.0%) |
| Professional & Scientific | 172 (35.5%) | 312 (64.5%) |
| Enterprise Management | 0 (0.0%) | 0 (0.0%) |
| Administrative & Support | 0 (0.0%) | 0 (0.0%) |
| Educational Services | 68 (38.6%) | 108 (61.4%) |
| Health Care & Social Assistance | 51 (27.3%) | 136 (72.7%) |
| Arts, Entertainment & Recreation | 0 (0.0%) | 0 (0.0%) |
| Accommodation & Food Services | 0 (0.0%) | 38 (100.0%) |
| Public Administration | 0 (0.0%) | 0 (0.0%) |
| Total | 1,173 (58.8%) | 823 (41.2%) |
Education in Six Mile Run
School Enrollment in Six Mile Run
The most common levels of schooling among the 902 students in Six Mile Run are graduate / professional (275 | 30.5%), elementary school (258 | 28.6%), and college / undergraduate (191 | 21.2%).
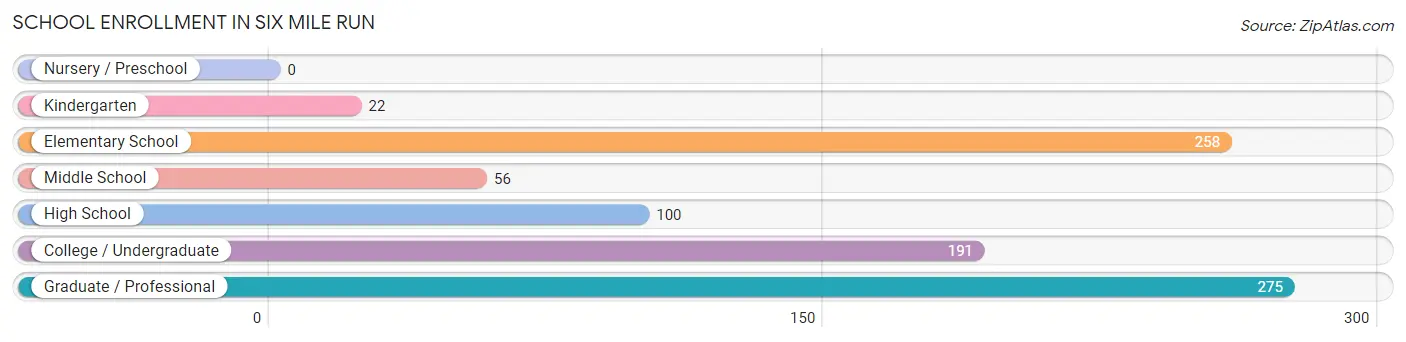
| School Level | # Students | % Students |
| Nursery / Preschool | 0 | 0.0% |
| Kindergarten | 22 | 2.4% |
| Elementary School | 258 | 28.6% |
| Middle School | 56 | 6.2% |
| High School | 100 | 11.1% |
| College / Undergraduate | 191 | 21.2% |
| Graduate / Professional | 275 | 30.5% |
| Total | 902 | 100.0% |
School Enrollment by Age by Funding Source in Six Mile Run
Out of a total of 902 students who are enrolled in schools in Six Mile Run, 156 (17.3%) attend a private institution, while the remaining 746 (82.7%) are enrolled in public schools. The age group of 18 to 19 year olds has the highest likelihood of being enrolled in private schools, with 87 (100.0% in the age bracket) enrolled. Conversely, the age group of 5 to 9 year old has the lowest likelihood of being enrolled in a private school, with 280 (100.0% in the age bracket) attending a public institution.
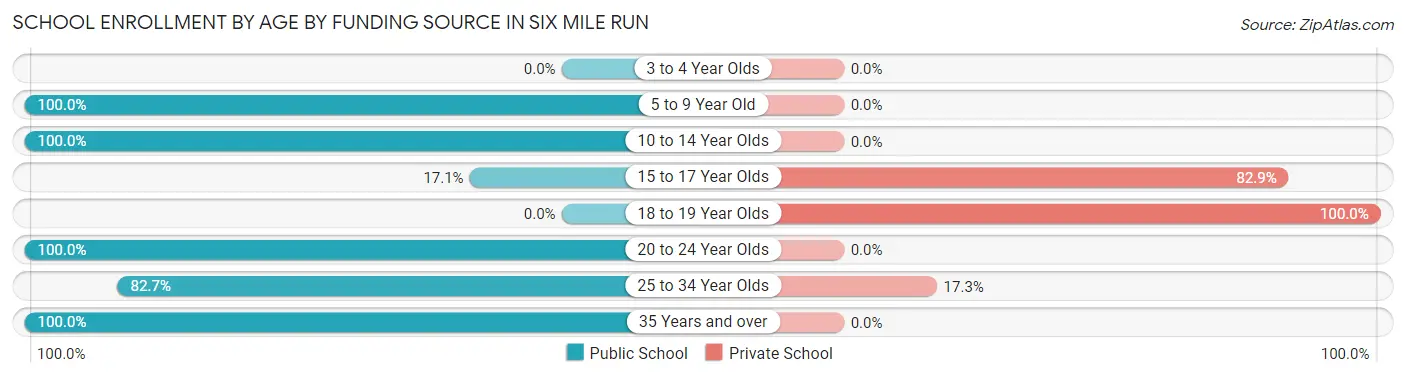
| Age Bracket | Public School | Private School |
| 3 to 4 Year Olds | 0 (0.0%) | 0 (0.0%) |
| 5 to 9 Year Old | 280 (100.0%) | 0 (0.0%) |
| 10 to 14 Year Olds | 89 (100.0%) | 0 (0.0%) |
| 15 to 17 Year Olds | 6 (17.1%) | 29 (82.9%) |
| 18 to 19 Year Olds | 0 (0.0%) | 87 (100.0%) |
| 20 to 24 Year Olds | 111 (100.0%) | 0 (0.0%) |
| 25 to 34 Year Olds | 191 (82.7%) | 40 (17.3%) |
| 35 Years and over | 69 (100.0%) | 0 (0.0%) |
| Total | 746 (82.7%) | 156 (17.3%) |
Educational Attainment by Field of Study in Six Mile Run
Engineering (412 | 22.3%), business (382 | 20.7%), social sciences (168 | 9.1%), liberal arts & history (163 | 8.8%), and science & technology (142 | 7.7%) are the most common fields of study among 1,847 individuals in Six Mile Run who have obtained a bachelor's degree or higher.
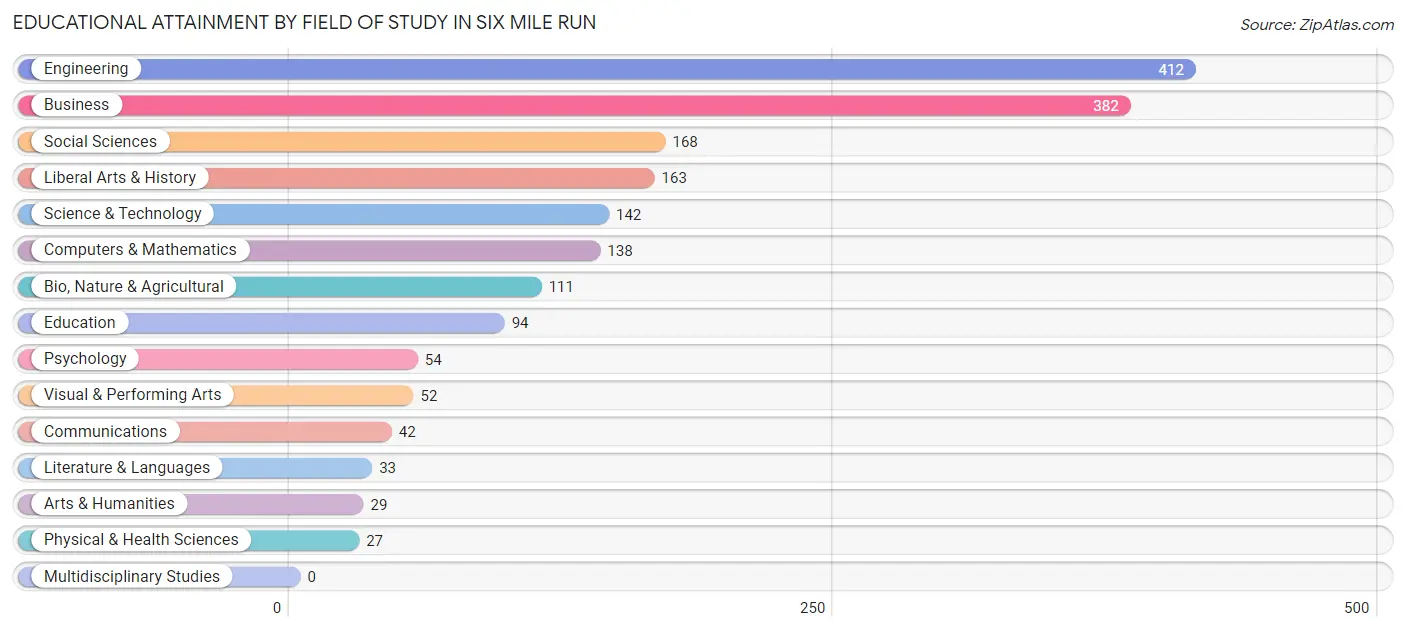
| Field of Study | # Graduates | % Graduates |
| Computers & Mathematics | 138 | 7.5% |
| Bio, Nature & Agricultural | 111 | 6.0% |
| Physical & Health Sciences | 27 | 1.5% |
| Psychology | 54 | 2.9% |
| Social Sciences | 168 | 9.1% |
| Engineering | 412 | 22.3% |
| Multidisciplinary Studies | 0 | 0.0% |
| Science & Technology | 142 | 7.7% |
| Business | 382 | 20.7% |
| Education | 94 | 5.1% |
| Literature & Languages | 33 | 1.8% |
| Liberal Arts & History | 163 | 8.8% |
| Visual & Performing Arts | 52 | 2.8% |
| Communications | 42 | 2.3% |
| Arts & Humanities | 29 | 1.6% |
| Total | 1,847 | 100.0% |
Transportation & Commute in Six Mile Run
Vehicle Availability by Sex in Six Mile Run
The most prevalent vehicle ownership categories in Six Mile Run are males with 2 vehicles (415, accounting for 35.4%) and females with 2 vehicles (436, making up 50.4%).
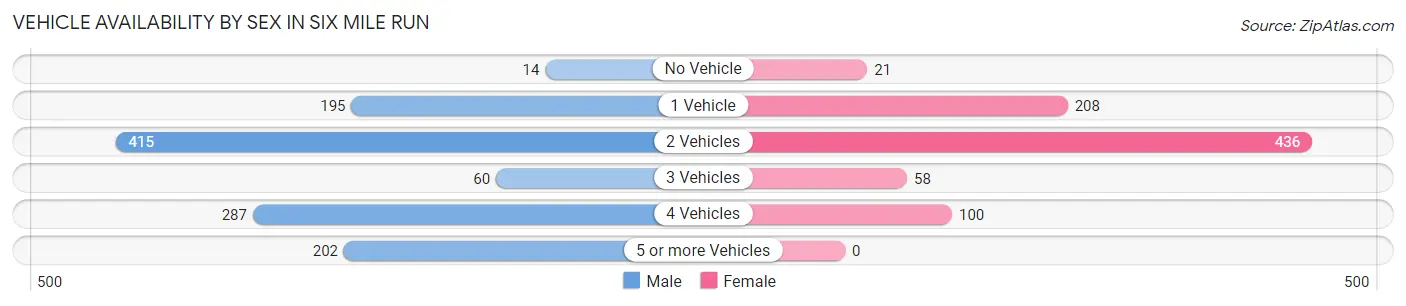
| Vehicles Available | Male | Female |
| No Vehicle | 14 (1.2%) | 21 (2.5%) |
| 1 Vehicle | 195 (16.6%) | 208 (25.3%) |
| 2 Vehicles | 415 (35.4%) | 436 (53.0%) |
| 3 Vehicles | 60 (5.1%) | 58 (7.0%) |
| 4 Vehicles | 287 (24.5%) | 100 (12.1%) |
| 5 or more Vehicles | 202 (17.2%) | 0 (0.0%) |
| Total | 1,173 (100.0%) | 823 (100.0%) |
Commute Time in Six Mile Run
The most frequently occuring commute durations in Six Mile Run are 30 to 34 minutes (330 commuters, 21.3%), 20 to 24 minutes (257 commuters, 16.6%), and 60 to 89 minutes (241 commuters, 15.6%).
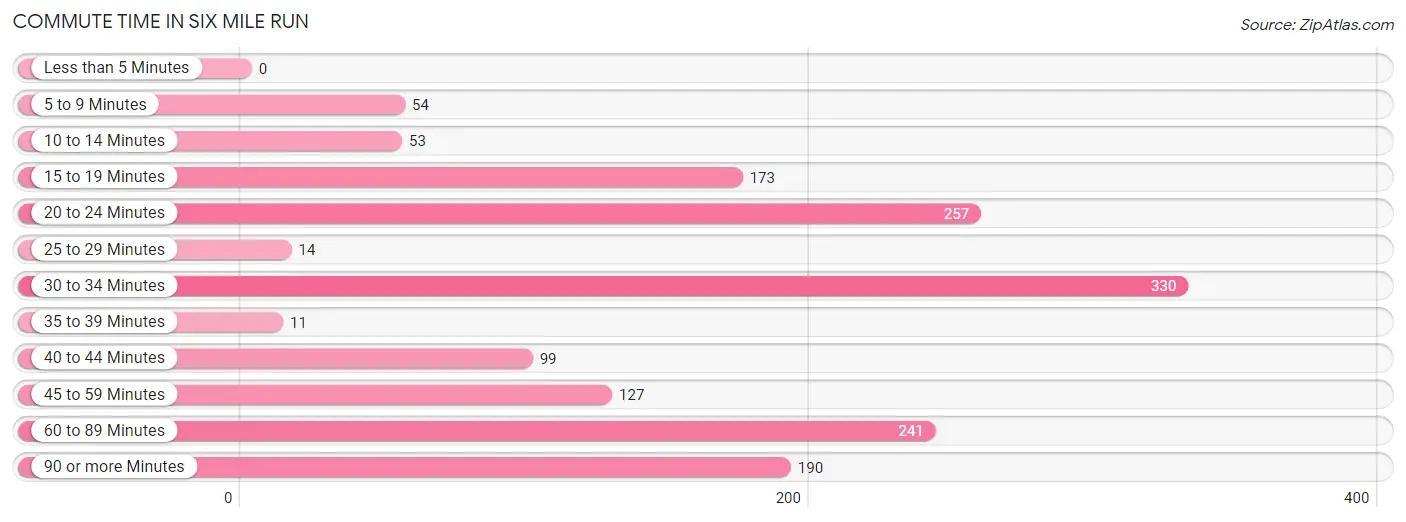
| Commute Time | # Commuters | % Commuters |
| Less than 5 Minutes | 0 | 0.0% |
| 5 to 9 Minutes | 54 | 3.5% |
| 10 to 14 Minutes | 53 | 3.4% |
| 15 to 19 Minutes | 173 | 11.2% |
| 20 to 24 Minutes | 257 | 16.6% |
| 25 to 29 Minutes | 14 | 0.9% |
| 30 to 34 Minutes | 330 | 21.3% |
| 35 to 39 Minutes | 11 | 0.7% |
| 40 to 44 Minutes | 99 | 6.4% |
| 45 to 59 Minutes | 127 | 8.2% |
| 60 to 89 Minutes | 241 | 15.6% |
| 90 or more Minutes | 190 | 12.3% |
Commute Time by Sex in Six Mile Run
The most common commute times in Six Mile Run are 30 to 34 minutes (262 commuters, 25.7%) for males and 60 to 89 minutes (158 commuters, 29.9%) for females.
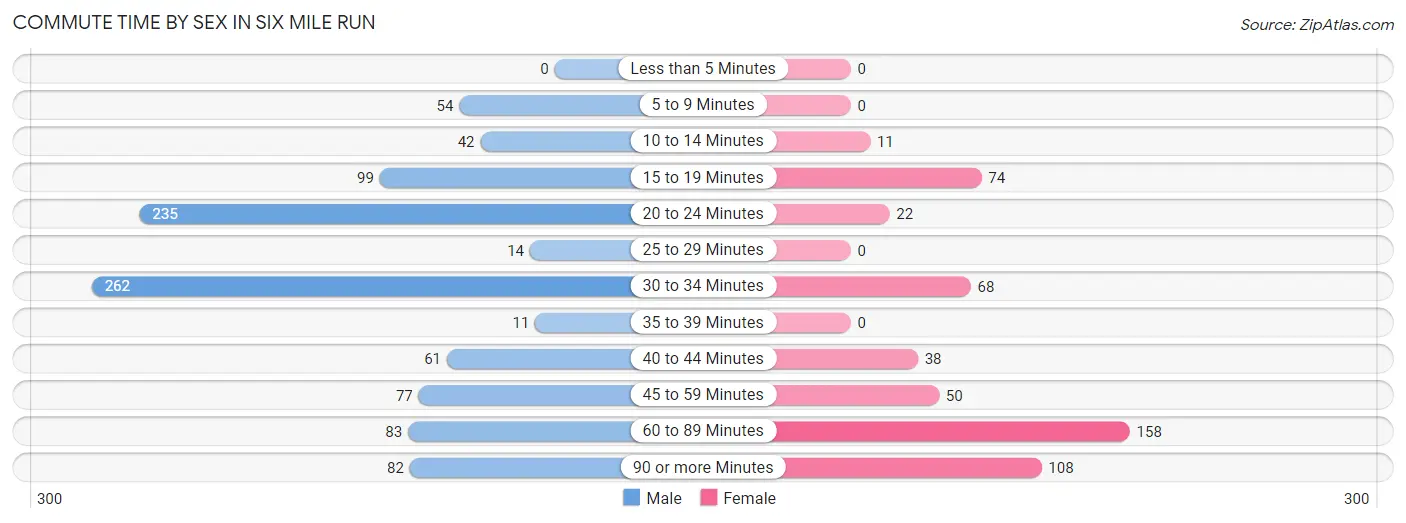
| Commute Time | Male | Female |
| Less than 5 Minutes | 0 (0.0%) | 0 (0.0%) |
| 5 to 9 Minutes | 54 (5.3%) | 0 (0.0%) |
| 10 to 14 Minutes | 42 (4.1%) | 11 (2.1%) |
| 15 to 19 Minutes | 99 (9.7%) | 74 (14.0%) |
| 20 to 24 Minutes | 235 (23.0%) | 22 (4.2%) |
| 25 to 29 Minutes | 14 (1.4%) | 0 (0.0%) |
| 30 to 34 Minutes | 262 (25.7%) | 68 (12.9%) |
| 35 to 39 Minutes | 11 (1.1%) | 0 (0.0%) |
| 40 to 44 Minutes | 61 (6.0%) | 38 (7.2%) |
| 45 to 59 Minutes | 77 (7.5%) | 50 (9.5%) |
| 60 to 89 Minutes | 83 (8.1%) | 158 (29.9%) |
| 90 or more Minutes | 82 (8.0%) | 108 (20.4%) |
Time of Departure to Work by Sex in Six Mile Run
The most frequent times of departure to work in Six Mile Run are 7:00 AM to 7:29 AM (299, 29.3%) for males and 8:00 AM to 8:29 AM (163, 30.8%) for females.
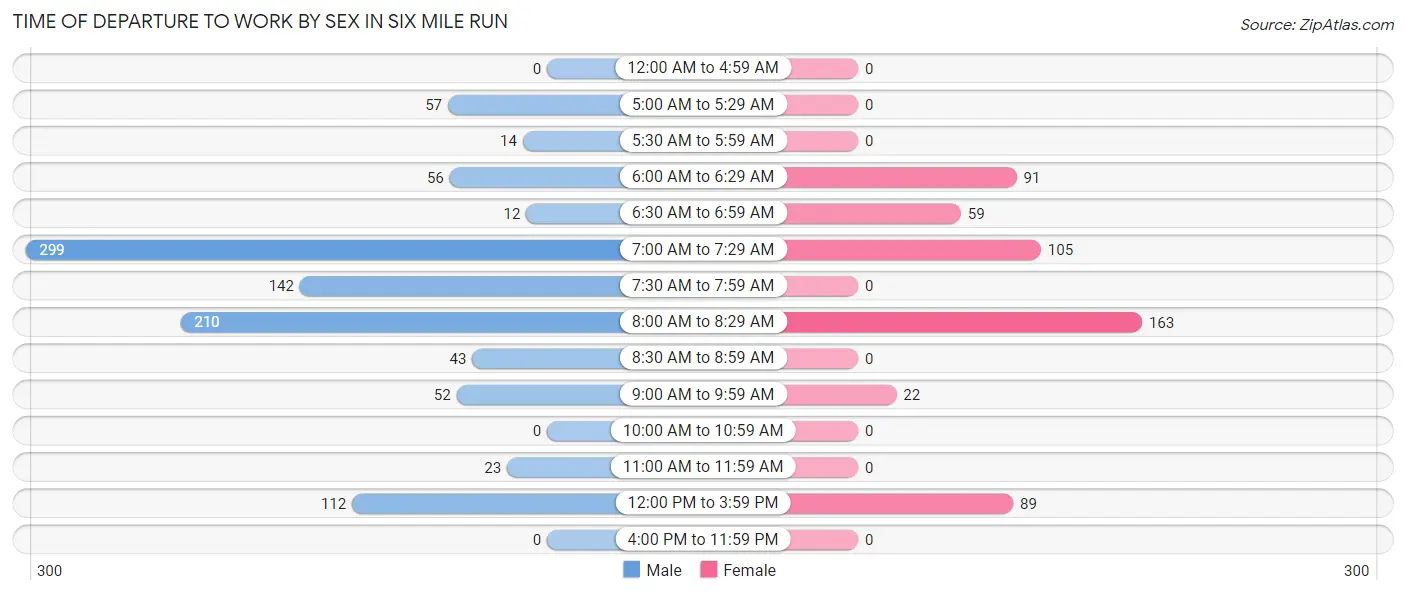
| Time of Departure | Male | Female |
| 12:00 AM to 4:59 AM | 0 (0.0%) | 0 (0.0%) |
| 5:00 AM to 5:29 AM | 57 (5.6%) | 0 (0.0%) |
| 5:30 AM to 5:59 AM | 14 (1.4%) | 0 (0.0%) |
| 6:00 AM to 6:29 AM | 56 (5.5%) | 91 (17.2%) |
| 6:30 AM to 6:59 AM | 12 (1.2%) | 59 (11.2%) |
| 7:00 AM to 7:29 AM | 299 (29.3%) | 105 (19.9%) |
| 7:30 AM to 7:59 AM | 142 (13.9%) | 0 (0.0%) |
| 8:00 AM to 8:29 AM | 210 (20.6%) | 163 (30.8%) |
| 8:30 AM to 8:59 AM | 43 (4.2%) | 0 (0.0%) |
| 9:00 AM to 9:59 AM | 52 (5.1%) | 22 (4.2%) |
| 10:00 AM to 10:59 AM | 0 (0.0%) | 0 (0.0%) |
| 11:00 AM to 11:59 AM | 23 (2.2%) | 0 (0.0%) |
| 12:00 PM to 3:59 PM | 112 (11.0%) | 89 (16.8%) |
| 4:00 PM to 11:59 PM | 0 (0.0%) | 0 (0.0%) |
| Total | 1,020 (100.0%) | 529 (100.0%) |
Housing Occupancy in Six Mile Run
Occupancy by Ownership in Six Mile Run
Of the total 1,374 dwellings in Six Mile Run, owner-occupied units account for 830 (60.4%), while renter-occupied units make up 544 (39.6%).
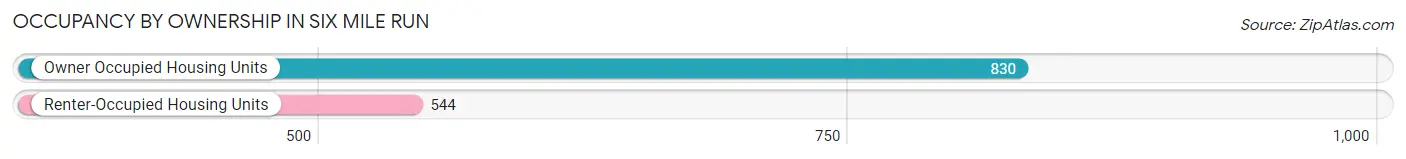
| Occupancy | # Housing Units | % Housing Units |
| Owner Occupied Housing Units | 830 | 60.4% |
| Renter-Occupied Housing Units | 544 | 39.6% |
| Total Occupied Housing Units | 1,374 | 100.0% |
Occupancy by Household Size in Six Mile Run
| Household Size | # Housing Units | % Housing Units |
| 1-Person Household | 381 | 27.7% |
| 2-Person Household | 387 | 28.2% |
| 3-Person Household | 358 | 26.1% |
| 4+ Person Household | 248 | 18.0% |
| Total Housing Units | 1,374 | 100.0% |
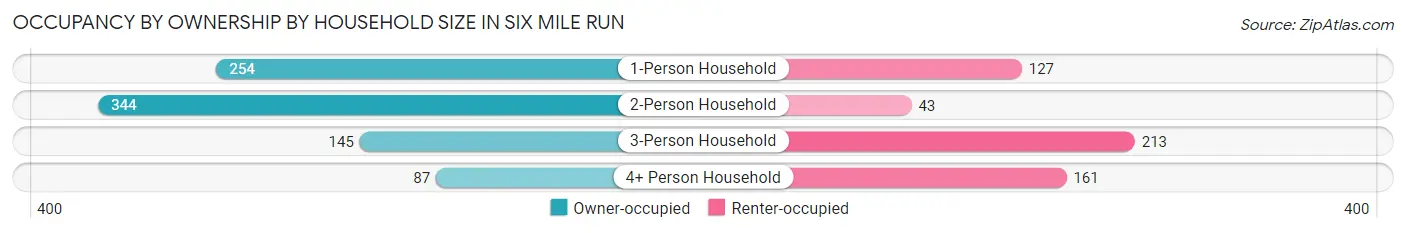
Occupancy by Ownership by Household Size in Six Mile Run
| Household Size | Owner-occupied | Renter-occupied |
| 1-Person Household | 254 (66.7%) | 127 (33.3%) |
| 2-Person Household | 344 (88.9%) | 43 (11.1%) |
| 3-Person Household | 145 (40.5%) | 213 (59.5%) |
| 4+ Person Household | 87 (35.1%) | 161 (64.9%) |
| Total Housing Units | 830 (60.4%) | 544 (39.6%) |
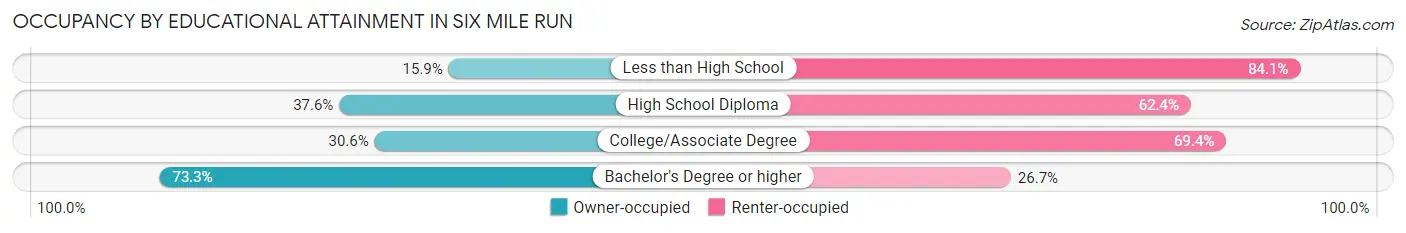
Occupancy by Educational Attainment in Six Mile Run
| Household Size | Owner-occupied | Renter-occupied |
| Less than High School | 11 (15.9%) | 58 (84.1%) |
| High School Diploma | 73 (37.6%) | 121 (62.4%) |
| College/Associate Degree | 49 (30.6%) | 111 (69.4%) |
| Bachelor's Degree or higher | 697 (73.3%) | 254 (26.7%) |
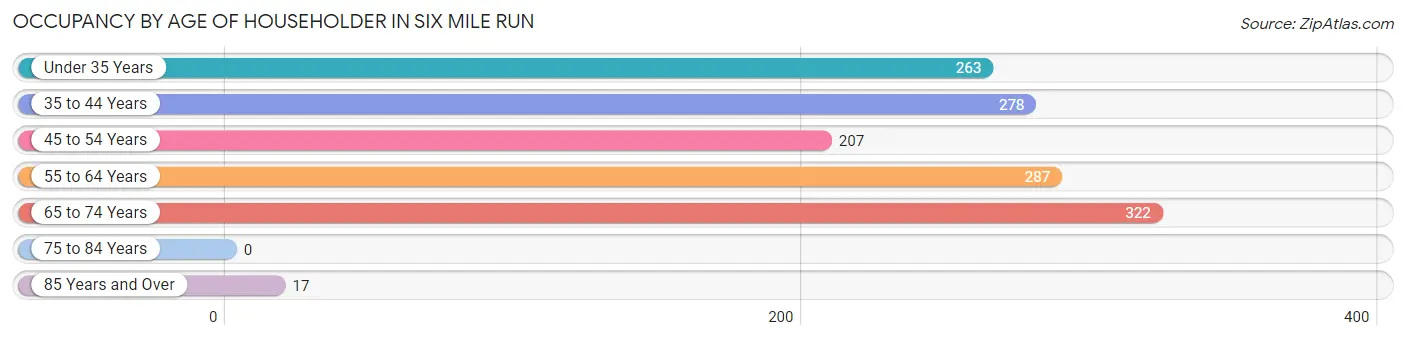
Occupancy by Age of Householder in Six Mile Run
| Age Bracket | # Households | % Households |
| Under 35 Years | 263 | 19.1% |
| 35 to 44 Years | 278 | 20.2% |
| 45 to 54 Years | 207 | 15.1% |
| 55 to 64 Years | 287 | 20.9% |
| 65 to 74 Years | 322 | 23.4% |
| 75 to 84 Years | 0 | 0.0% |
| 85 Years and Over | 17 | 1.2% |
| Total | 1,374 | 100.0% |
Housing Finances in Six Mile Run
Median Income by Occupancy in Six Mile Run
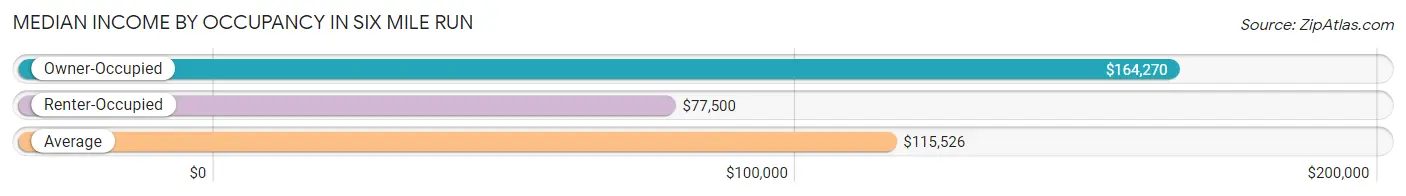
| Occupancy Type | # Households | Median Income |
| Owner-Occupied | 830 (60.4%) | $164,270 |
| Renter-Occupied | 544 (39.6%) | $77,500 |
| Average | 1,374 (100.0%) | $115,526 |
Occupancy by Householder Income Bracket in Six Mile Run
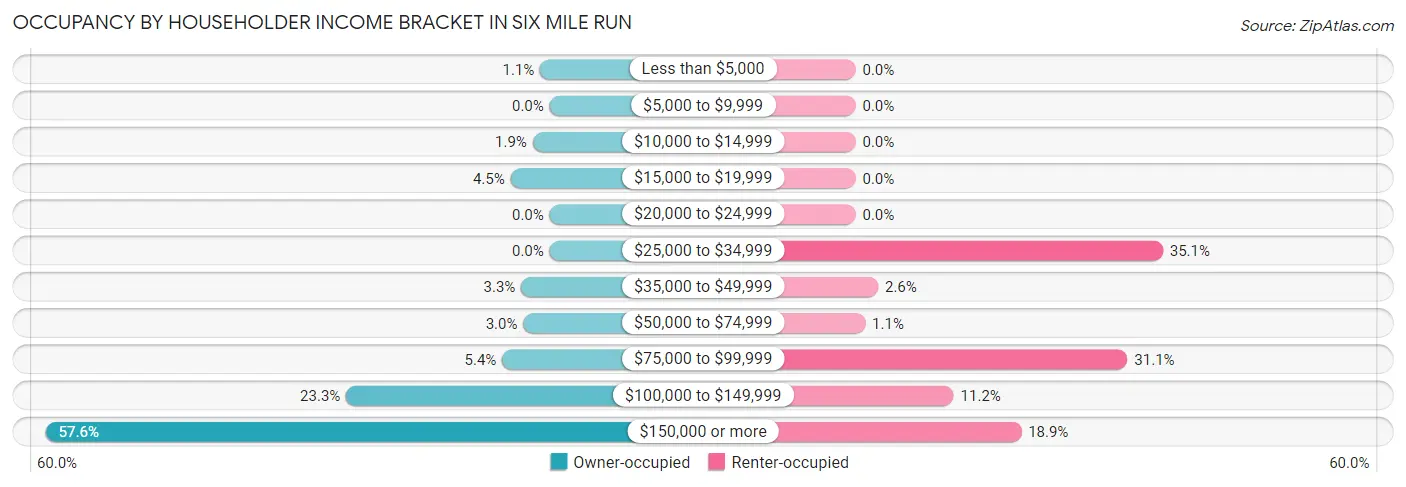
| Income Bracket | Owner-occupied | Renter-occupied |
| Less than $5,000 | 9 (1.1%) | 0 (0.0%) |
| $5,000 to $9,999 | 0 (0.0%) | 0 (0.0%) |
| $10,000 to $14,999 | 16 (1.9%) | 0 (0.0%) |
| $15,000 to $19,999 | 37 (4.5%) | 0 (0.0%) |
| $20,000 to $24,999 | 0 (0.0%) | 0 (0.0%) |
| $25,000 to $34,999 | 0 (0.0%) | 191 (35.1%) |
| $35,000 to $49,999 | 27 (3.3%) | 14 (2.6%) |
| $50,000 to $74,999 | 25 (3.0%) | 6 (1.1%) |
| $75,000 to $99,999 | 45 (5.4%) | 169 (31.1%) |
| $100,000 to $149,999 | 193 (23.3%) | 61 (11.2%) |
| $150,000 or more | 478 (57.6%) | 103 (18.9%) |
| Total | 830 (100.0%) | 544 (100.0%) |
Monthly Housing Cost Tiers in Six Mile Run
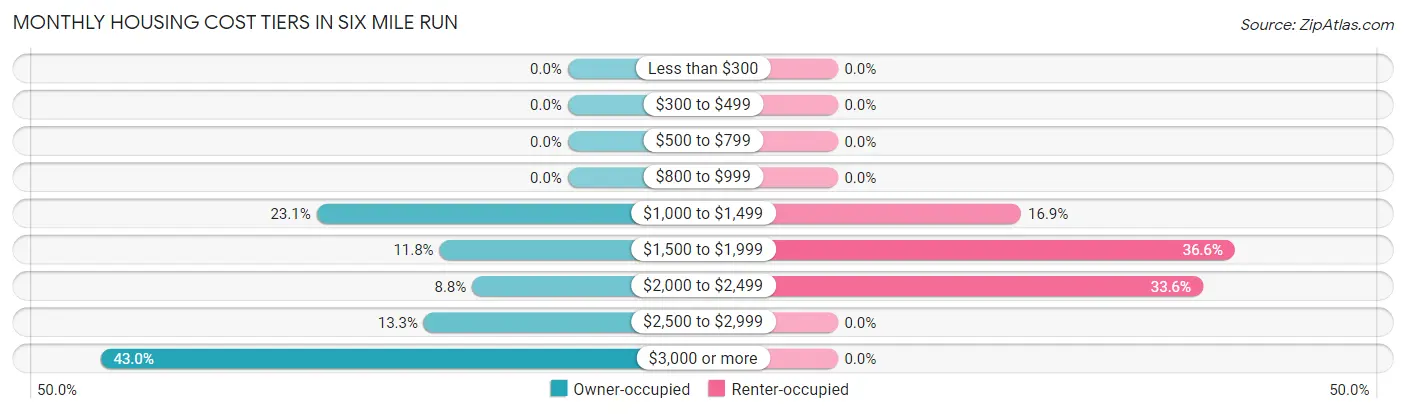
| Monthly Cost | Owner-occupied | Renter-occupied |
| Less than $300 | 0 (0.0%) | 0 (0.0%) |
| $300 to $499 | 0 (0.0%) | 0 (0.0%) |
| $500 to $799 | 0 (0.0%) | 0 (0.0%) |
| $800 to $999 | 0 (0.0%) | 0 (0.0%) |
| $1,000 to $1,499 | 192 (23.1%) | 92 (16.9%) |
| $1,500 to $1,999 | 98 (11.8%) | 199 (36.6%) |
| $2,000 to $2,499 | 73 (8.8%) | 183 (33.6%) |
| $2,500 to $2,999 | 110 (13.3%) | 0 (0.0%) |
| $3,000 or more | 357 (43.0%) | 0 (0.0%) |
| Total | 830 (100.0%) | 544 (100.0%) |
Physical Housing Characteristics in Six Mile Run
Housing Structures in Six Mile Run
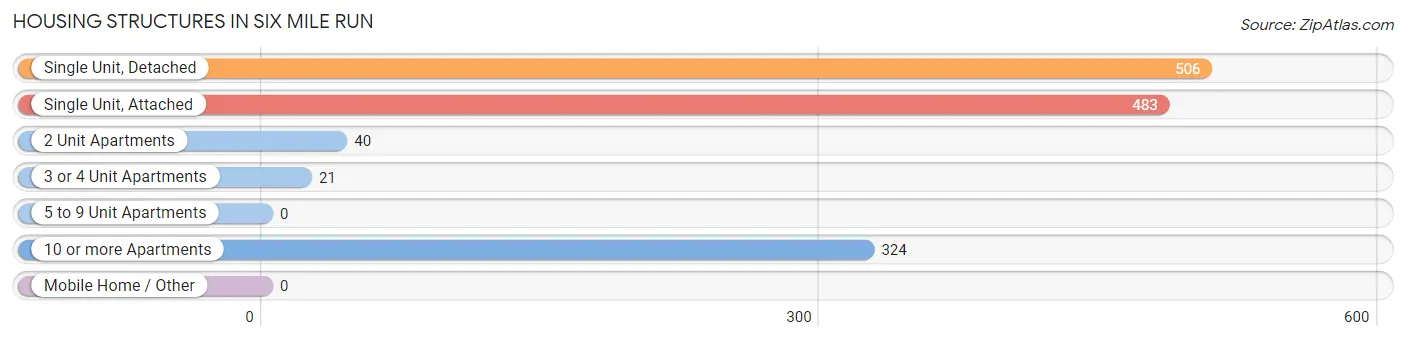
| Structure Type | # Housing Units | % Housing Units |
| Single Unit, Detached | 506 | 36.8% |
| Single Unit, Attached | 483 | 35.1% |
| 2 Unit Apartments | 40 | 2.9% |
| 3 or 4 Unit Apartments | 21 | 1.5% |
| 5 to 9 Unit Apartments | 0 | 0.0% |
| 10 or more Apartments | 324 | 23.6% |
| Mobile Home / Other | 0 | 0.0% |
| Total | 1,374 | 100.0% |
Housing Structures by Occupancy in Six Mile Run
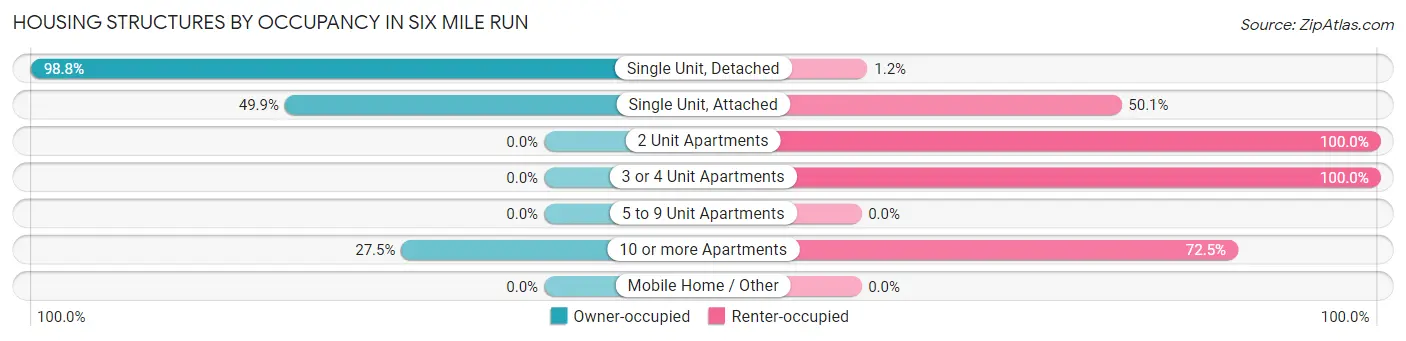
| Structure Type | Owner-occupied | Renter-occupied |
| Single Unit, Detached | 500 (98.8%) | 6 (1.2%) |
| Single Unit, Attached | 241 (49.9%) | 242 (50.1%) |
| 2 Unit Apartments | 0 (0.0%) | 40 (100.0%) |
| 3 or 4 Unit Apartments | 0 (0.0%) | 21 (100.0%) |
| 5 to 9 Unit Apartments | 0 (0.0%) | 0 (0.0%) |
| 10 or more Apartments | 89 (27.5%) | 235 (72.5%) |
| Mobile Home / Other | 0 (0.0%) | 0 (0.0%) |
| Total | 830 (60.4%) | 544 (39.6%) |
Housing Structures by Number of Rooms in Six Mile Run
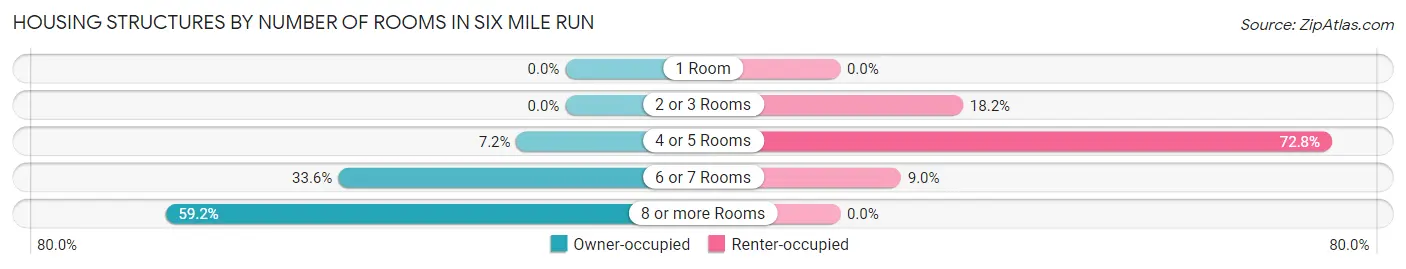
| Number of Rooms | Owner-occupied | Renter-occupied |
| 1 Room | 0 (0.0%) | 0 (0.0%) |
| 2 or 3 Rooms | 0 (0.0%) | 99 (18.2%) |
| 4 or 5 Rooms | 60 (7.2%) | 396 (72.8%) |
| 6 or 7 Rooms | 279 (33.6%) | 49 (9.0%) |
| 8 or more Rooms | 491 (59.2%) | 0 (0.0%) |
| Total | 830 (100.0%) | 544 (100.0%) |
Housing Structure by Heating Type in Six Mile Run
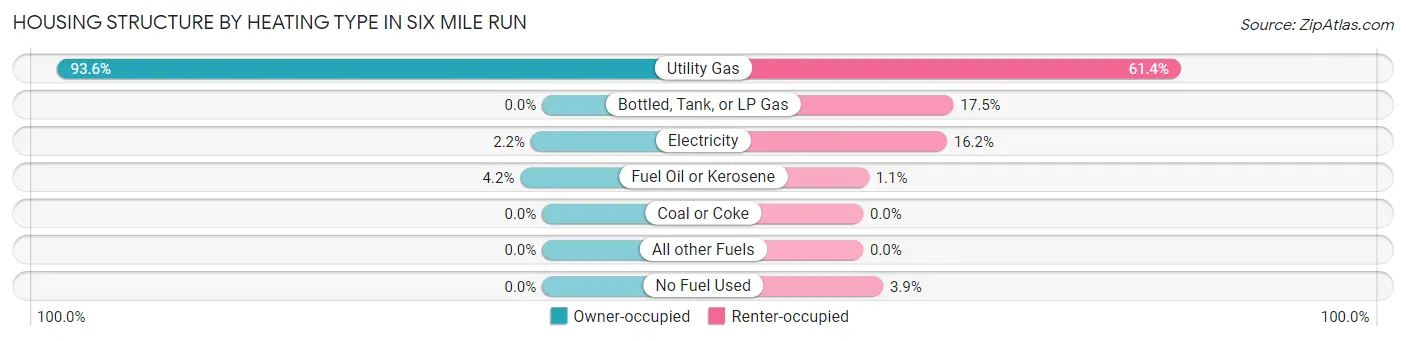
| Heating Type | Owner-occupied | Renter-occupied |
| Utility Gas | 777 (93.6%) | 334 (61.4%) |
| Bottled, Tank, or LP Gas | 0 (0.0%) | 95 (17.5%) |
| Electricity | 18 (2.2%) | 88 (16.2%) |
| Fuel Oil or Kerosene | 35 (4.2%) | 6 (1.1%) |
| Coal or Coke | 0 (0.0%) | 0 (0.0%) |
| All other Fuels | 0 (0.0%) | 0 (0.0%) |
| No Fuel Used | 0 (0.0%) | 21 (3.9%) |
| Total | 830 (100.0%) | 544 (100.0%) |
Household Vehicle Usage in Six Mile Run
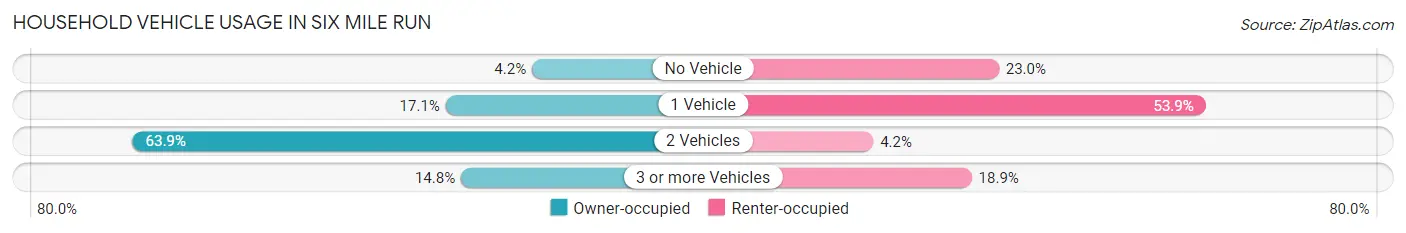
| Vehicles per Household | Owner-occupied | Renter-occupied |
| No Vehicle | 35 (4.2%) | 125 (23.0%) |
| 1 Vehicle | 142 (17.1%) | 293 (53.9%) |
| 2 Vehicles | 530 (63.9%) | 23 (4.2%) |
| 3 or more Vehicles | 123 (14.8%) | 103 (18.9%) |
| Total | 830 (100.0%) | 544 (100.0%) |
Real Estate & Mortgages in Six Mile Run
Real Estate and Mortgage Overview in Six Mile Run
| Characteristic | Without Mortgage | With Mortgage |
| Housing Units | 206 | 624 |
| Median Property Value | $550,400 | $501,900 |
| Median Household Income | $233,000 | $361 |
| Monthly Housing Costs | $1,341 | $357 |
| Real Estate Taxes | $10,001 | $0 |
Property Value by Mortgage Status in Six Mile Run
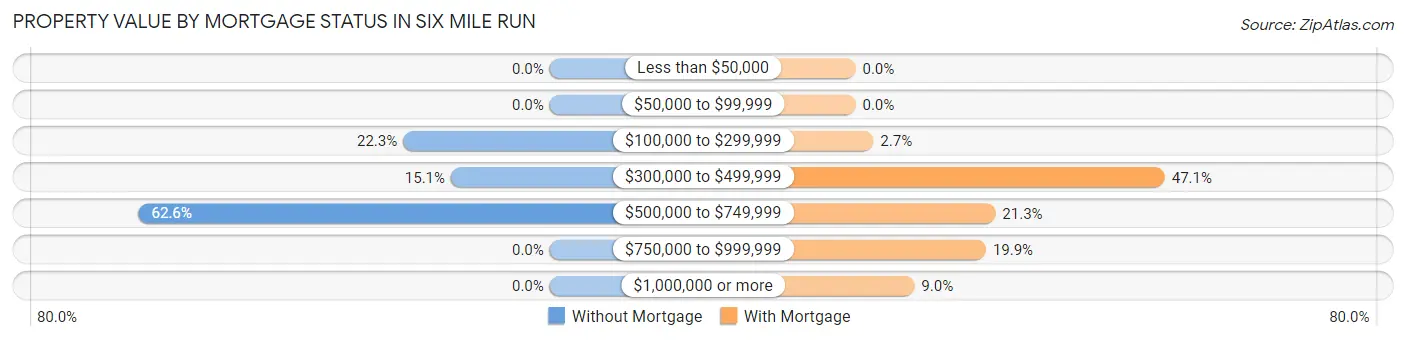
| Property Value | Without Mortgage | With Mortgage |
| Less than $50,000 | 0 (0.0%) | 0 (0.0%) |
| $50,000 to $99,999 | 0 (0.0%) | 0 (0.0%) |
| $100,000 to $299,999 | 46 (22.3%) | 17 (2.7%) |
| $300,000 to $499,999 | 31 (15.0%) | 294 (47.1%) |
| $500,000 to $749,999 | 129 (62.6%) | 133 (21.3%) |
| $750,000 to $999,999 | 0 (0.0%) | 124 (19.9%) |
| $1,000,000 or more | 0 (0.0%) | 56 (9.0%) |
| Total | 206 (100.0%) | 624 (100.0%) |
Household Income by Mortgage Status in Six Mile Run
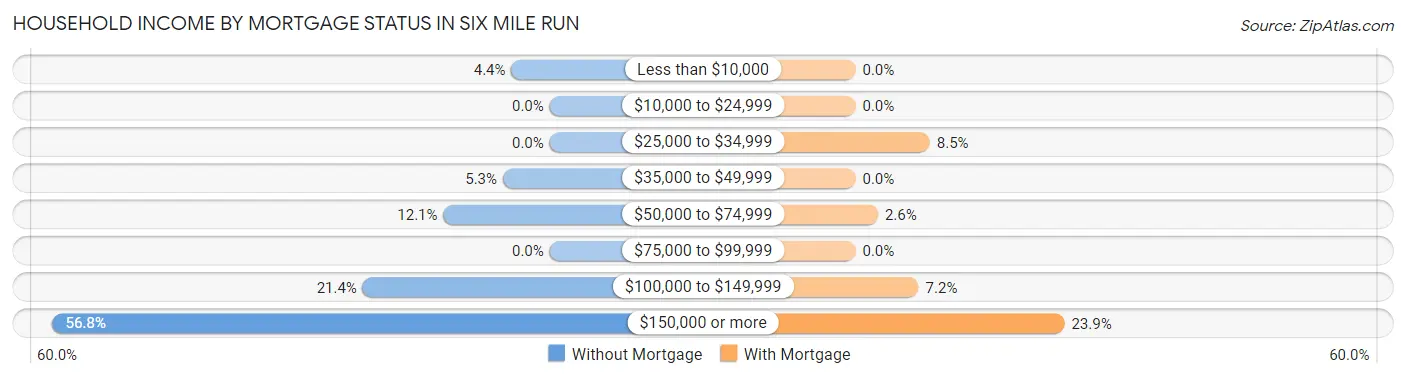
| Household Income | Without Mortgage | With Mortgage |
| Less than $10,000 | 9 (4.4%) | 0 (0.0%) |
| $10,000 to $24,999 | 0 (0.0%) | 0 (0.0%) |
| $25,000 to $34,999 | 0 (0.0%) | 53 (8.5%) |
| $35,000 to $49,999 | 11 (5.3%) | 0 (0.0%) |
| $50,000 to $74,999 | 25 (12.1%) | 16 (2.6%) |
| $75,000 to $99,999 | 0 (0.0%) | 0 (0.0%) |
| $100,000 to $149,999 | 44 (21.4%) | 45 (7.2%) |
| $150,000 or more | 117 (56.8%) | 149 (23.9%) |
| Total | 206 (100.0%) | 624 (100.0%) |
Property Value to Household Income Ratio in Six Mile Run
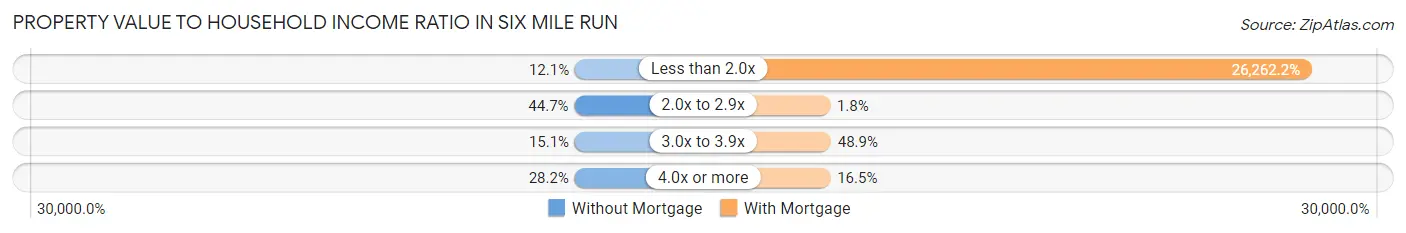
| Value-to-Income Ratio | Without Mortgage | With Mortgage |
| Less than 2.0x | 25 (12.1%) | 163,876 (26,262.2%) |
| 2.0x to 2.9x | 92 (44.7%) | 11 (1.8%) |
| 3.0x to 3.9x | 31 (15.0%) | 305 (48.9%) |
| 4.0x or more | 58 (28.2%) | 103 (16.5%) |
| Total | 206 (100.0%) | 624 (100.0%) |
Real Estate Taxes by Mortgage Status in Six Mile Run
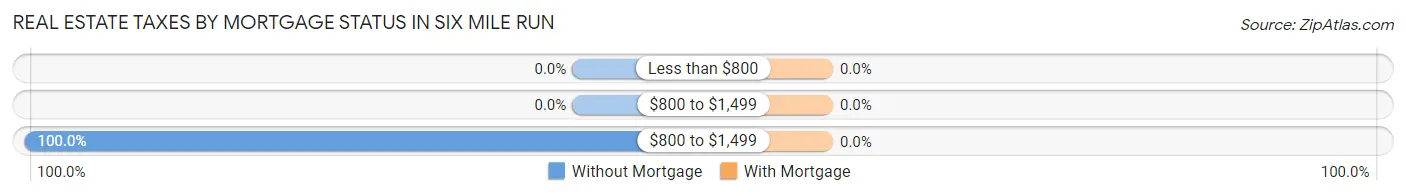
| Property Taxes | Without Mortgage | With Mortgage |
| Less than $800 | 0 (0.0%) | 0 (0.0%) |
| $800 to $1,499 | 0 (0.0%) | 0 (0.0%) |
| $800 to $1,499 | 206 (100.0%) | 0 (0.0%) |
| Total | 206 (100.0%) | 624 (100.0%) |
Health & Disability in Six Mile Run
Health Insurance Coverage by Age in Six Mile Run
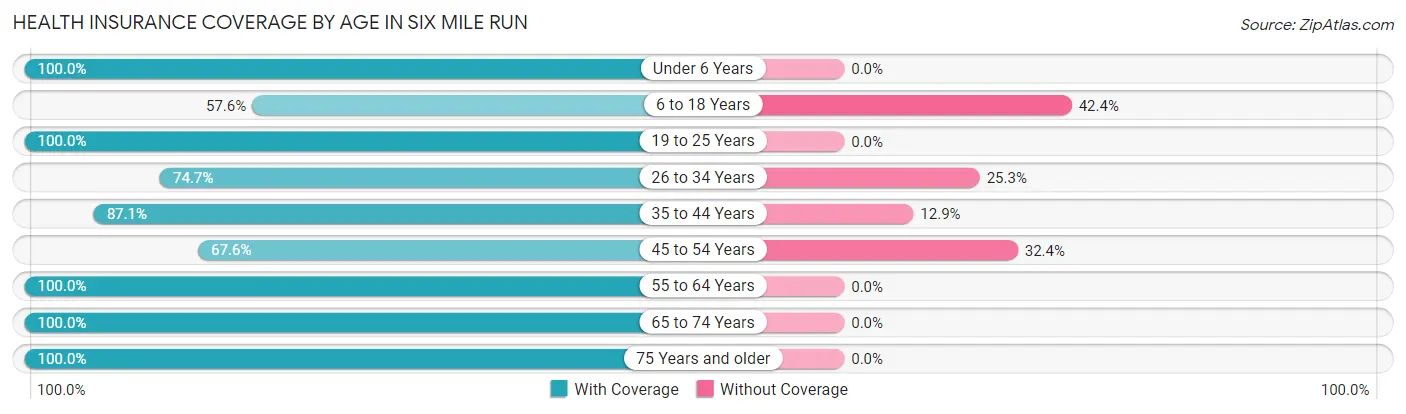
| Age Bracket | With Coverage | Without Coverage |
| Under 6 Years | 291 (100.0%) | 0 (0.0%) |
| 6 to 18 Years | 220 (57.6%) | 162 (42.4%) |
| 19 to 25 Years | 319 (100.0%) | 0 (0.0%) |
| 26 to 34 Years | 565 (74.7%) | 191 (25.3%) |
| 35 to 44 Years | 392 (87.1%) | 58 (12.9%) |
| 45 to 54 Years | 186 (67.6%) | 89 (32.4%) |
| 55 to 64 Years | 577 (100.0%) | 0 (0.0%) |
| 65 to 74 Years | 399 (100.0%) | 0 (0.0%) |
| 75 Years and older | 86 (100.0%) | 0 (0.0%) |
| Total | 3,035 (85.9%) | 500 (14.1%) |
Health Insurance Coverage by Citizenship Status in Six Mile Run
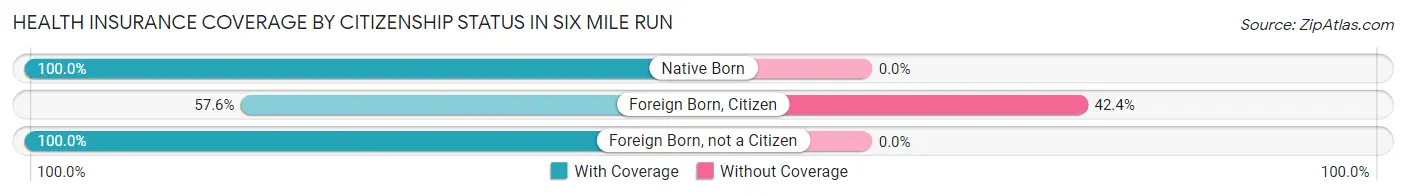
| Citizenship Status | With Coverage | Without Coverage |
| Native Born | 291 (100.0%) | 0 (0.0%) |
| Foreign Born, Citizen | 220 (57.6%) | 162 (42.4%) |
| Foreign Born, not a Citizen | 319 (100.0%) | 0 (0.0%) |
Health Insurance Coverage by Household Income in Six Mile Run
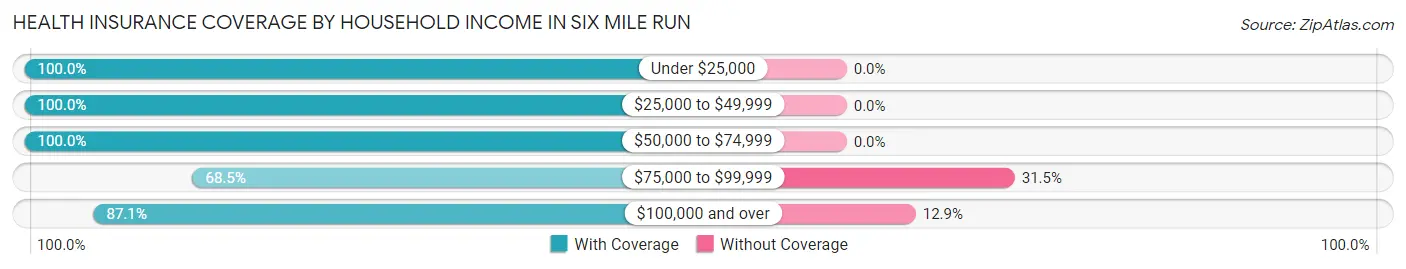
| Household Income | With Coverage | Without Coverage |
| Under $25,000 | 94 (100.0%) | 0 (0.0%) |
| $25,000 to $49,999 | 534 (100.0%) | 0 (0.0%) |
| $50,000 to $74,999 | 43 (100.0%) | 0 (0.0%) |
| $75,000 to $99,999 | 479 (68.5%) | 220 (31.5%) |
| $100,000 and over | 1,885 (87.1%) | 280 (12.9%) |
Public vs Private Health Insurance Coverage by Age in Six Mile Run
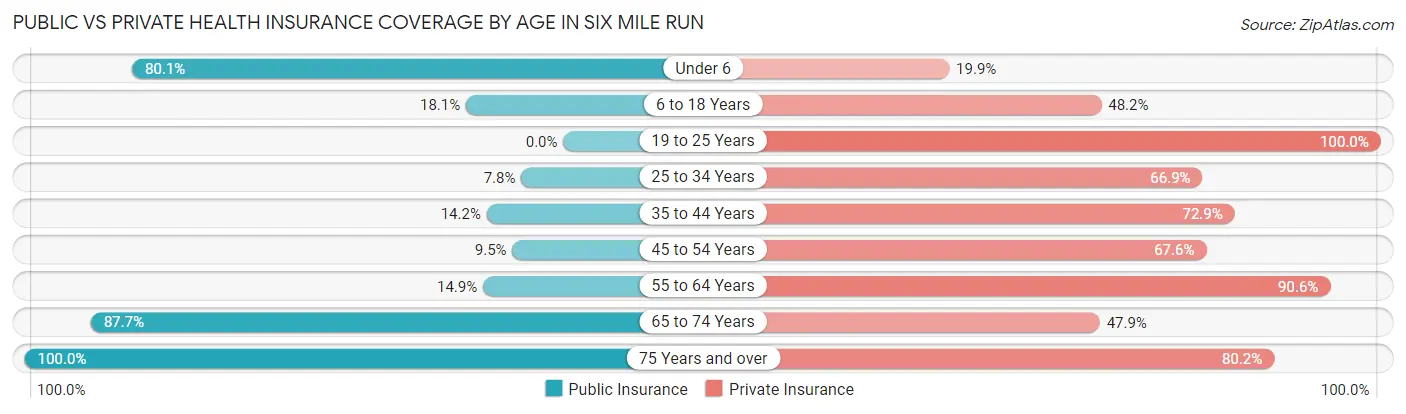
| Age Bracket | Public Insurance | Private Insurance |
| Under 6 | 233 (80.1%) | 58 (19.9%) |
| 6 to 18 Years | 69 (18.1%) | 184 (48.2%) |
| 19 to 25 Years | 0 (0.0%) | 319 (100.0%) |
| 25 to 34 Years | 59 (7.8%) | 506 (66.9%) |
| 35 to 44 Years | 64 (14.2%) | 328 (72.9%) |
| 45 to 54 Years | 26 (9.5%) | 186 (67.6%) |
| 55 to 64 Years | 86 (14.9%) | 523 (90.6%) |
| 65 to 74 Years | 350 (87.7%) | 191 (47.9%) |
| 75 Years and over | 86 (100.0%) | 69 (80.2%) |
| Total | 973 (27.5%) | 2,364 (66.9%) |
Disability Status by Sex by Age in Six Mile Run
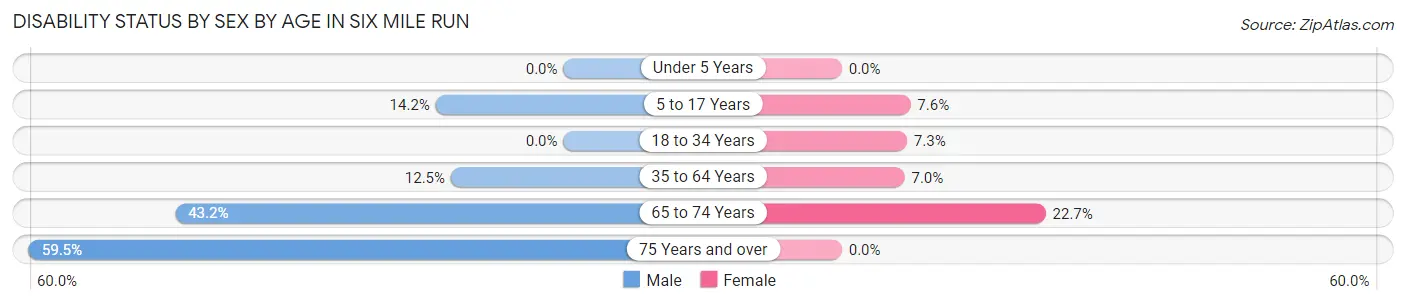
| Age Bracket | Male | Female |
| Under 5 Years | 0 (0.0%) | 0 (0.0%) |
| 5 to 17 Years | 29 (14.2%) | 22 (7.6%) |
| 18 to 34 Years | 0 (0.0%) | 28 (7.2%) |
| 35 to 64 Years | 61 (12.5%) | 57 (7.0%) |
| 65 to 74 Years | 102 (43.2%) | 37 (22.7%) |
| 75 Years and over | 25 (59.5%) | 0 (0.0%) |
Disability Class by Sex by Age in Six Mile Run
Disability Class: Hearing Difficulty
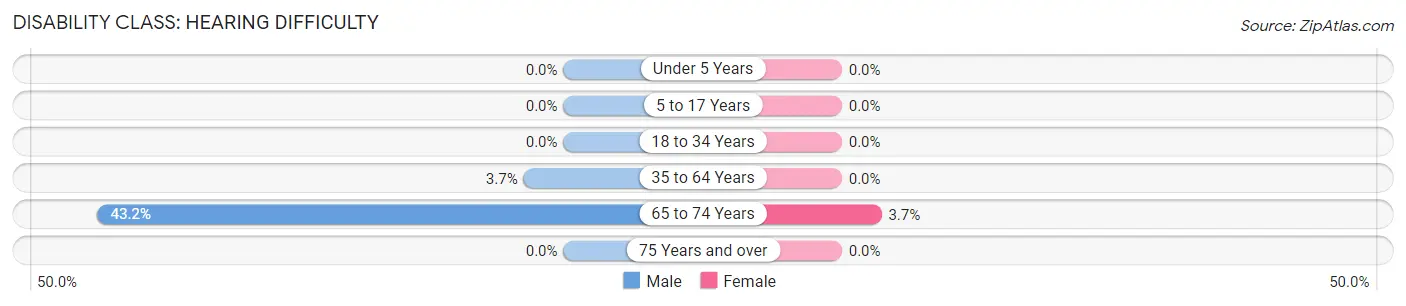
| Age Bracket | Male | Female |
| Under 5 Years | 0 (0.0%) | 0 (0.0%) |
| 5 to 17 Years | 0 (0.0%) | 0 (0.0%) |
| 18 to 34 Years | 0 (0.0%) | 0 (0.0%) |
| 35 to 64 Years | 18 (3.7%) | 0 (0.0%) |
| 65 to 74 Years | 102 (43.2%) | 6 (3.7%) |
| 75 Years and over | 0 (0.0%) | 0 (0.0%) |
Disability Class: Vision Difficulty
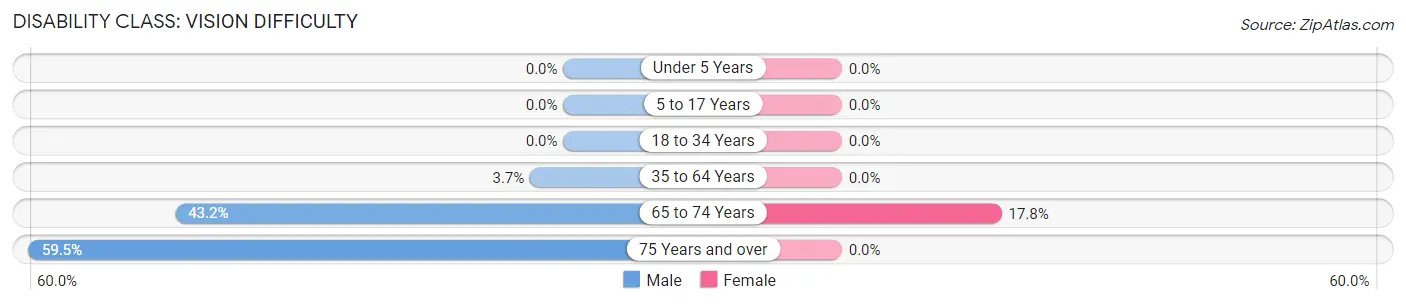
| Age Bracket | Male | Female |
| Under 5 Years | 0 (0.0%) | 0 (0.0%) |
| 5 to 17 Years | 0 (0.0%) | 0 (0.0%) |
| 18 to 34 Years | 0 (0.0%) | 0 (0.0%) |
| 35 to 64 Years | 18 (3.7%) | 0 (0.0%) |
| 65 to 74 Years | 102 (43.2%) | 29 (17.8%) |
| 75 Years and over | 25 (59.5%) | 0 (0.0%) |
Disability Class: Cognitive Difficulty
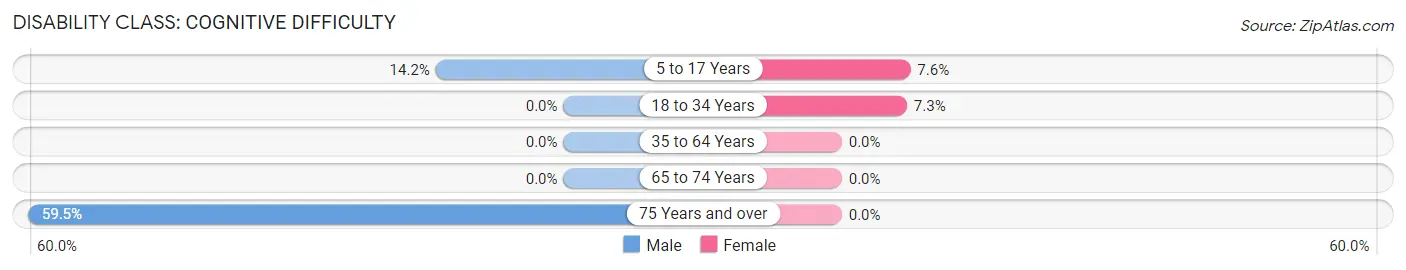
| Age Bracket | Male | Female |
| 5 to 17 Years | 29 (14.2%) | 22 (7.6%) |
| 18 to 34 Years | 0 (0.0%) | 28 (7.2%) |
| 35 to 64 Years | 0 (0.0%) | 0 (0.0%) |
| 65 to 74 Years | 0 (0.0%) | 0 (0.0%) |
| 75 Years and over | 25 (59.5%) | 0 (0.0%) |
Disability Class: Ambulatory Difficulty
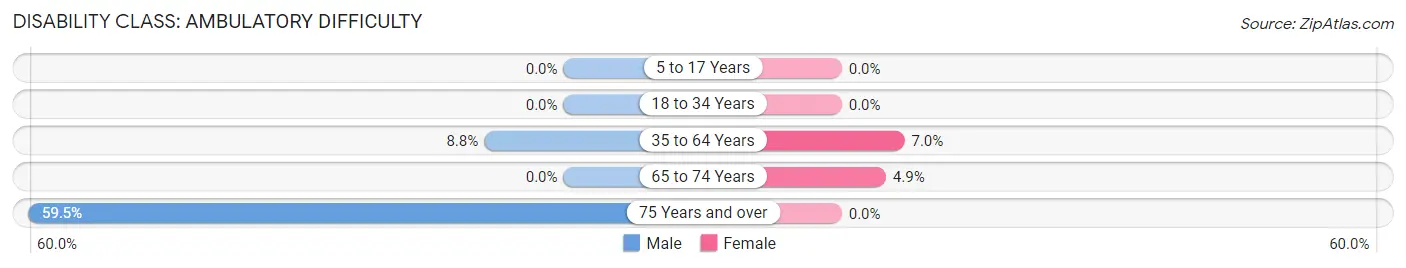
| Age Bracket | Male | Female |
| 5 to 17 Years | 0 (0.0%) | 0 (0.0%) |
| 18 to 34 Years | 0 (0.0%) | 0 (0.0%) |
| 35 to 64 Years | 43 (8.8%) | 57 (7.0%) |
| 65 to 74 Years | 0 (0.0%) | 8 (4.9%) |
| 75 Years and over | 25 (59.5%) | 0 (0.0%) |
Disability Class: Self-Care Difficulty
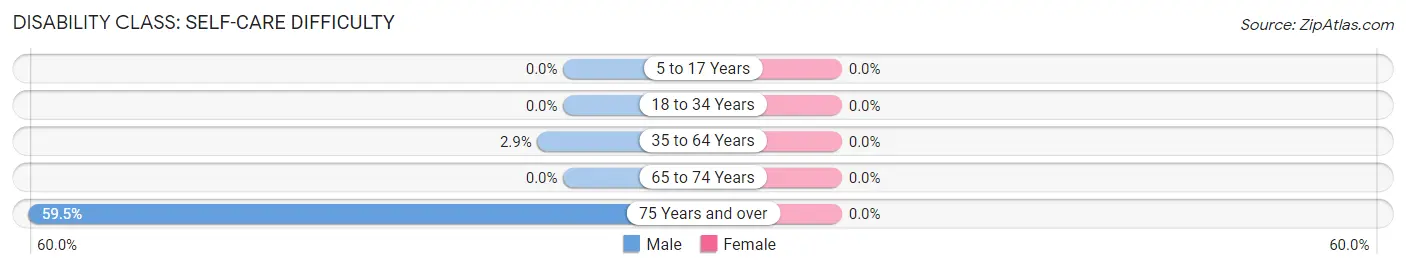
| Age Bracket | Male | Female |
| 5 to 17 Years | 0 (0.0%) | 0 (0.0%) |
| 18 to 34 Years | 0 (0.0%) | 0 (0.0%) |
| 35 to 64 Years | 14 (2.9%) | 0 (0.0%) |
| 65 to 74 Years | 0 (0.0%) | 0 (0.0%) |
| 75 Years and over | 25 (59.5%) | 0 (0.0%) |
Technology Access in Six Mile Run
Computing Device Access in Six Mile Run
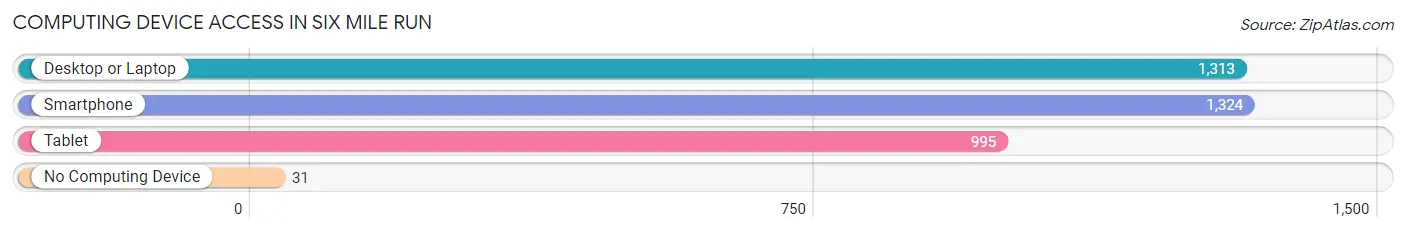
| Device Type | # Households | % Households |
| Desktop or Laptop | 1,313 | 95.6% |
| Smartphone | 1,324 | 96.4% |
| Tablet | 995 | 72.4% |
| No Computing Device | 31 | 2.3% |
| Total | 1,374 | 100.0% |
Internet Access in Six Mile Run
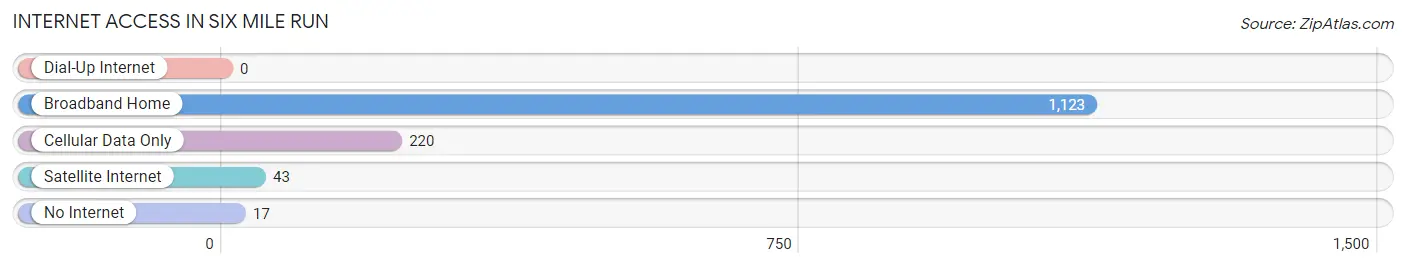
| Internet Type | # Households | % Households |
| Dial-Up Internet | 0 | 0.0% |
| Broadband Home | 1,123 | 81.7% |
| Cellular Data Only | 220 | 16.0% |
| Satellite Internet | 43 | 3.1% |
| No Internet | 17 | 1.2% |
| Total | 1,374 | 100.0% |
Six Mile Run Summary
Six Mile Run is a small unincorporated community located in Franklin Township, Somerset County, New Jersey. It is situated along the Millstone River, which is a tributary of the Raritan River. The area is known for its rich history, diverse geography, and vibrant economy.
History
Six Mile Run was first settled in the late 17th century by Dutch and English settlers. The area was originally known as Six Mile Creek, and was named for its location six miles from New Brunswick. The area was primarily used for farming and milling, and the Millstone River was used to power the mills. In the late 19th century, the area began to develop as a residential community, and the Six Mile Run Reformed Church was established in 1867.
Geography
Six Mile Run is located in the central part of Franklin Township, Somerset County, New Jersey. It is situated along the Millstone River, which is a tributary of the Raritan River. The area is characterized by rolling hills, wooded areas, and open fields. The climate is humid continental, with hot summers and cold winters.
Economy
Six Mile Run is primarily a residential community, but it also has a vibrant economy. The area is home to several small businesses, including a grocery store, a hardware store, and a gas station. There are also several restaurants and bars in the area. The area is also home to a number of farms, which produce a variety of fruits and vegetables.
Demographics
As of the 2010 census, the population of Six Mile Run was 1,845. The population is primarily white (90.2%), with a small percentage of African Americans (3.2%) and Hispanics (2.7%). The median household income is $76,250, and the median home value is $346,000.
Six Mile Run is a small but vibrant community with a rich history, diverse geography, and vibrant economy. The area is home to a variety of businesses, farms, and restaurants, and is a popular destination for outdoor recreation. The area is also home to a diverse population, with a mix of races and ethnicities.
Common Questions
What is Per Capita Income in Six Mile Run?
Per Capita income in Six Mile Run is $63,347.
What is the Median Family Income in Six Mile Run?
Median Family Income in Six Mile Run is $116,228.
What is the Median Household income in Six Mile Run?
Median Household Income in Six Mile Run is $115,526.
What is Income or Wage Gap in Six Mile Run?
Income or Wage Gap in Six Mile Run is 15.6%.
Women in Six Mile Run earn 84.4 cents for every dollar earned by a man.
What is Inequality or Gini Index in Six Mile Run?
Inequality or Gini Index in Six Mile Run is 0.42.
What is the Total Population of Six Mile Run?
Total Population of Six Mile Run is 3,535.
What is the Total Male Population of Six Mile Run?
Total Male Population of Six Mile Run is 1,763.
What is the Total Female Population of Six Mile Run?
Total Female Population of Six Mile Run is 1,772.
What is the Ratio of Males per 100 Females in Six Mile Run?
There are 99.49 Males per 100 Females in Six Mile Run.
What is the Ratio of Females per 100 Males in Six Mile Run?
There are 100.51 Females per 100 Males in Six Mile Run.
What is the Median Population Age in Six Mile Run?
Median Population Age in Six Mile Run is 38.1 Years.
What is the Average Family Size in Six Mile Run
Average Family Size in Six Mile Run is 3.1 People.
What is the Average Household Size in Six Mile Run
Average Household Size in Six Mile Run is 2.6 People.
How Large is the Labor Force in Six Mile Run?
There are 2,043 People in the Labor Forcein in Six Mile Run.
What is the Percentage of People in the Labor Force in Six Mile Run?
71.4% of People are in the Labor Force in Six Mile Run.
What is the Unemployment Rate in Six Mile Run?
Unemployment Rate in Six Mile Run is 2.3%.