Zip Codes with the Highest Percentage of Population Employed in Architecture & Engineering in Paterson, NJ
RELATED REPORTS & OPTIONS
Architecture & Engineering
Paterson
Compare Zip Codes
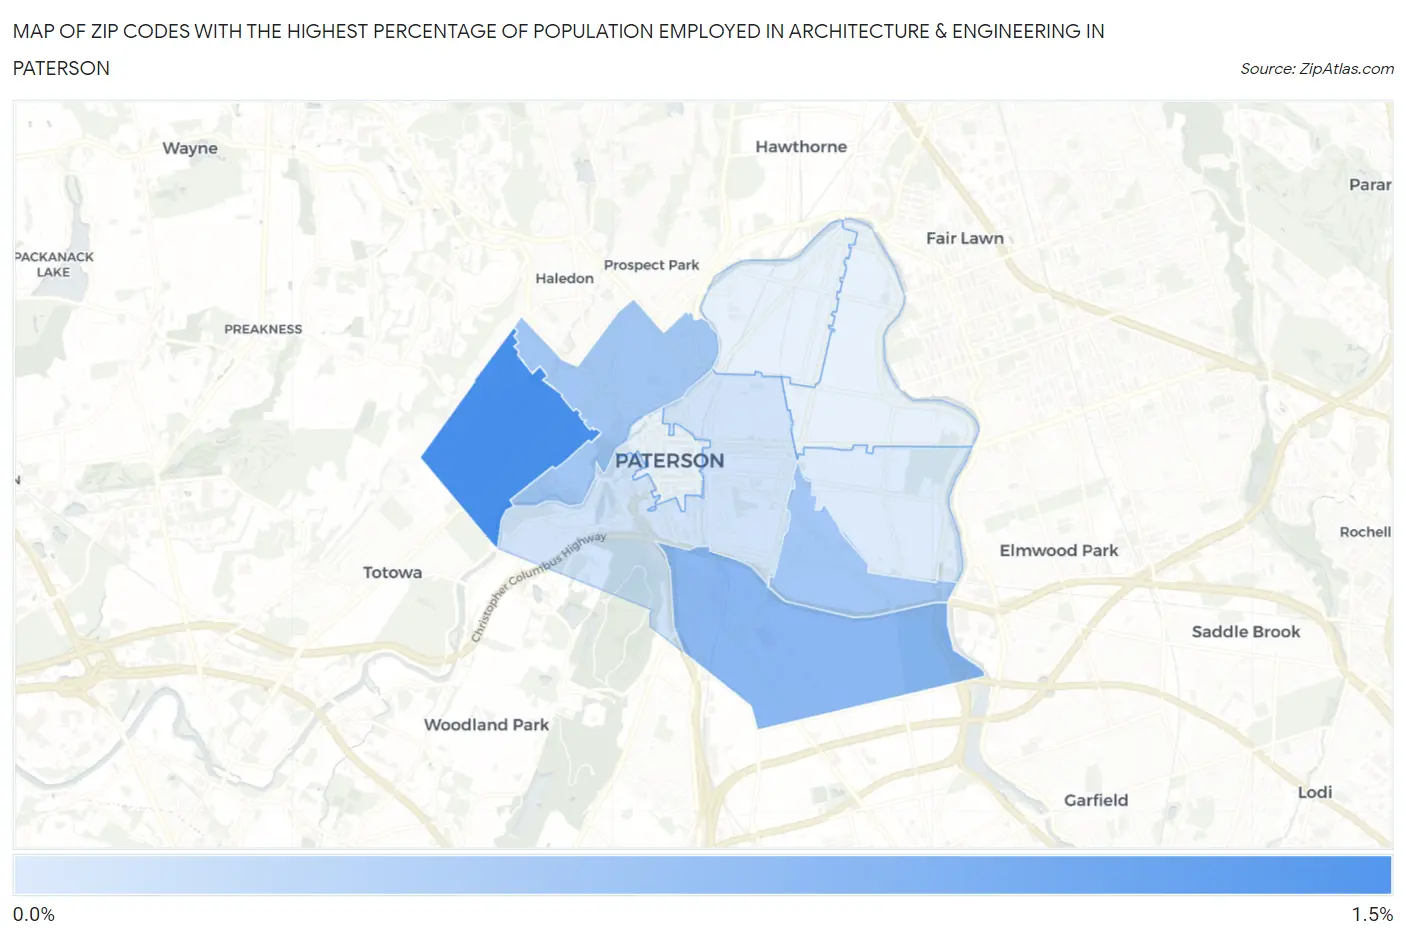
Map of Zip Codes with the Highest Percentage of Population Employed in Architecture & Engineering in Paterson
0.40%
1.3%
Zip Codes with the Highest Percentage of Population Employed in Architecture & Engineering in Paterson, NJ
| Zip Code | % Employed | vs State | vs National | |
| 1. | 07502 | 1.3% | 1.9%(-0.555)#366 | 2.1%(-0.812)#14,044 |
| 2. | 07503 | 0.91% | 1.9%(-0.980)#436 | 2.1%(-1.24)#17,268 |
| 3. | 07513 | 0.76% | 1.9%(-1.13)#459 | 2.1%(-1.39)#18,449 |
| 4. | 07522 | 0.75% | 1.9%(-1.14)#461 | 2.1%(-1.40)#18,521 |
| 5. | 07501 | 0.48% | 1.9%(-1.42)#493 | 2.1%(-1.67)#20,437 |
| 6. | 07504 | 0.40% | 1.9%(-1.49)#501 | 2.1%(-1.75)#20,968 |
1
Common Questions
What are the Top 5 Zip Codes with the Highest Percentage of Population Employed in Architecture & Engineering in Paterson, NJ?
Top 5 Zip Codes with the Highest Percentage of Population Employed in Architecture & Engineering in Paterson, NJ are:
What zip code has the Highest Percentage of Population Employed in Architecture & Engineering in Paterson, NJ?
07502 has the Highest Percentage of Population Employed in Architecture & Engineering in Paterson, NJ with 1.3%.
What is the Percentage of Population Employed in Architecture & Engineering in Paterson, NJ?
Percentage of Population Employed in Architecture & Engineering in Paterson is 0.57%.
What is the Percentage of Population Employed in Architecture & Engineering in New Jersey?
Percentage of Population Employed in Architecture & Engineering in New Jersey is 1.9%.
What is the Percentage of Population Employed in Architecture & Engineering in the United States?
Percentage of Population Employed in Architecture & Engineering in the United States is 2.1%.